Article

An Integrated Method for Road Crack Segmentation and Surface Feature Quantification under Complex Backgrounds

1
College of Civil Engineering, Hunan University, Changsha 410082, China
2
Key Laboratory for Damage Diagnosis of Engineering Structures of Hunan Province, Hunan University, Changsha 410082, China
*
Author to whom correspondence should be addressed.
Remote Sens. 2023, 15(6), 1530; https://doi.org/10.3390/rs15061530
Submission received: 7 February 2023 / Revised: 5 March 2023 / Accepted: 6 March 2023 / Published: 10 March 2023
(This article belongs to the Special Issue Road Detection, Monitoring and Maintenance Using Remotely Sensed Data)

Abstract

:
In the present study, an integrated framework for automatic detection, segmentation, and measurement of road surface cracks is proposed. First, road images are captured, and crack regions are detected based on the fifth version of the You Only Look Once (YOLOv5) algorithm; then, a modified Residual Unity Networking (Res-UNet) algorithm is proposed for accurate segmentation at the pixel level within the crack regions; finally, a novel crack surface feature quantification algorithm is developed to determine the pixels of crack in width and length, respectively. In addition, a road crack dataset containing complex environmental noise is produced. Different shooting distances, angles, and lighting conditions are considered. Validated through the same dataset and compared with You Only Look at CoefficienTs ++ (YOLACT++) and DeepLabv3+, the proposed method shows higher accuracy for crack segmentation under complex backgrounds. Specifically, the crack damage detection based on the YOLOv5 method achieves a mean average precision of 91%; the modified Res-UNet achieves 87% intersection over union (IoU) when segmenting crack pixels, 6.7% higher than the original Res-UNet; and the developed crack surface feature algorithm has an accuracy of 95% in identifying the crack length and a root mean square error of 2.1 pixels in identifying the crack width, with the accuracy being 3% higher in length measurement than that of the traditional method.

1. Introduction

Structural damage to roads may induce serious traffic accidents and substantial economic losses. In China in 2021, the number of traffic accidents was up to 273,098, and the total direct property damage was CNY 145,036,000 [1]; in 2022, the Chinese transportation department invested a total of CNY 1.29 trillion in road maintenance [2]. Therefore, it is important to monitor the typical signs of road damage, i.e., surface cracks in pavements, in a timely and accurate manner. Thus, it is necessary to detect and evaluate cracks in time at the early stage of their appearance, which enables road structures to become more durable and have a longer service life [3]. In the past decades, several contact sensor-based approaches for road crack detection have been proposed in the field of structural health monitoring [4,5]. However, the contact sensor-based detection techniques have some restrictions, such as low operational efficiency, unstable measurement accuracy, and vulnerability to temperature and humidity variations [6,7]. Therefore, it is of great significance to develop a new contact-free road crack detection and quantification method with better efficiency and accuracy.
To break the restrictions of the contact sensor-based methods, some vision-based damage detection methods have been developed in several studies [8,9,10]. A four-camera vision system and a novel global calibration method were proposed by Chen et al. [11], and the performance of the multi-vision system was improved by minimizing the global calibration error. Benefiting from the vision-based techniques, structural defects such as spalling, cracks, and holes can be automatically detected from images. With the rapid development of artificial intelligence, many deep learning algorithms based on deep convolutional neural networks (CNNs) have been developed to explore the automatic detection of road cracks and other various damage [12,13,14]. For instance, the faster region proposal convolutional neural network (Faster R-CNN) was utilized by Hacıefendioğlu et al. [15] for automatic crack identification. Moreover, a generative adversarial networks (GANs)-based method and an improved VGG16-based algorithm were proposed by Que et al. [16] for crack data augmentation and crack classification, respectively, which effectively solved the training problem caused by insufficient datasets. With the You Only Look Once (YOLO) algorithm, Du et al. [17] established a method for quickly identifying and classifying defects in the road surface. It is worth noting that there are different versions of YOLO, and YOLOv6 [18], YOLOv7 [19], and YOLOv8 [20] are currently updated. Considering the stability and applicability of the algorithm, the most widely used YOLOv5 algorithm is employed in the present study [21]. A common feature of these deep learning algorithms is the use of bounding boxes. The bounding box, which is essentially a rectangle around an object, specifies the object’s predicted location, category, and confidence. In addition to using bounding boxes for localization, crack detection at the pixel level has also been implemented in some deep learning algorithms [22,23,24]. For instance, Yong et al. [25] constructed an end-to-end real-time network for crack segmentation at the pixel level. To better extract crack features, an asymmetric convolution enhancement (ACE) module and the residual expanded involution module (REI) were embedded. In the studies of Sun et al. [26], Shen and Yu [27], and Ji et al. [28], DeepLabv3+ was employed to automatically detect pixel-level cracks. Zhang et al. [29] suggested Res-UNet as a method for the automatic detection of cracks at the pixel level. Zhu et al. [30] and Kang et al. [31] quantified the detected cracks at the pixel level and extracted the crack skeleton with the distance transform method (DTM). Tang et al. [32] proposed a new crack backbone refinement algorithm, and the average simplification rate of the crack backbone and the average error rate of direction determination were both improved. Due to the modification being based on the rough skeleton obtained after performing the traditional thinning algorithm [33], there is room for improvement in measurement efficiency. Recently, domain adaptation has been widely used to generate large amounts of perfectly supervised labelled synthetic data for hard-to-label tasks such as semantic segmentation [34,35]. Stan et al. [36] developed an algorithm adapted to the training of semantic segmentation models, which showed good generalization in the unlabeled target domain; Marsden et al. [37] proposed a simple framework using lightweight style transformation that allows pre-trained source models to effectively prevent forgetting when adapting to a sequence of unlabeled target domains.
However, there are several restrictions on these studies: (1) All of these studies detect cracks under ideal backgrounds, such as surfaces made entirely of concrete or asphalt. However, such backgrounds are not in line with the most common engineering practices, because actual crack detection tasks are always conducted on more complex backgrounds mixed with surrounding objects such as trees and vehicles [38]. Thus, it is challenging to distinguish cracks from complex backgrounds. (2) Due to the lack of sensitivity to image details, previous deep learning methods are prone to giving false positives for crack-like objects and expanding the detection range of crack edges. (3) In addition, the post-quantitative processing, such as DTM, following the detection of cracks remains an obstacle for pixel segmentation, because it always exhibits local branching and end discontinuities when applied to irregular cracks. The research question of this study is how to accurately segment and quantify road cracks under complex backgrounds and, furthermore, how to achieve more accurate crack shape extraction and more accurate calculation of crack length and width under various common realistic interferences, such as vehicles, plants, buildings, shadows, and dark light conditions.
In the present study, an integrated framework for road crack segmentation and surface feature quantification under complex backgrounds is proposed. Compared with the current state-of-the-art research in the same field, the main contributions of the present study are as follows:
  • An integrated framework for road crack detection and quantification at the pixel level is proposed. Compared with previous crack detection and segmentation algorithms, the framework enables more accurate detection, segmentation, and quantification of road cracks in complex backgrounds, where various common realistic interferences, such as vehicles, plants, buildings, shadows, or dark light conditions, can be found;
  • An attention gate module is embedded in the original Res-UNet to effectively improve the accuracy of road crack segmentation. Compared with YOLACT++ and DeepLabv3+ algorithms, the modified Res-UNet shows higher segmentation accuracy;
  • A new surface feature quantification algorithm is developed to accurately detect the length and width of segmented road cracks. Compared with the conventional DTM method, the developed algorithm can effectively prevent problems such as local branching and end discontinuity.
In summary, the purpose of the present study is to accurately detect cracks in roads under more realistic conditions and to accurately quantify the detected cracks.
In the proposed framework, three separate computer vision algorithms are innovatively combined: (1) firstly, the real-time object detection algorithm YOLOv5 [39] is utilized for object-level crack detection; (2) secondly, a modified Res-UNet is constructed by embedding an attention gate module to more accurately segment the cracks at the pixel level; (3) finally, a new surface feature quantification algorithm is developed to more accurately calculate the length and width of segmental road cracks by removing local branching and crack end loss. The proposed framework is compared with several existing methods to verify its accuracy. The comparison results show that the modified Res-UNet has higher crack segmentation accuracy, and the developed crack quantification algorithm is more effective than the conventional algorithm in preventing local branching and end discontinuities.
This study is organized as follows: Section 2 provides the proposed architecture; Section 3 introduces the details of the implementation; experiment results and discussion are presented in Section 4; concluding remarks are provided in Section 5.

2. Methodology

To detect, segment, and quantify road cracks from complex backgrounds, this study proposes a fully automated architecture, which is shown in Figure 1. YOLOv5, as a single-stage object detection algorithm, has the advantages of fast detection speed, easy deployment, and good small target detection. It has been applied in many engineering practices [40] and is very suitable for road detection tasks with tight time constraints and high safety risks. Therefore, the YOLOv5-based approach [41] is first employed to locate road crack areas with bounding boxes, as shown in Stage 1 of Figure 1. Then, the area of the bounding box is extracted and sent into the modified Res-UNet algorithm in Stage 2. For more accurate crack segmentation at the pixel level from the bounding boxes, the original Res-UNet model is modified by embedding an attention gate and proposing a new combined loss function in this study. Finally, in Stage 3, a novel surface feature quantification algorithm is proposed to determine the length and width of the segmented cracks. Note that all image binarization is carried out with Gaussian and Weiner filters to reduce noise and uninteresting areas. The primary benefit of the proposed approach over traditional methods is the significant improvement in accuracy and efficiency of road crack segmentation in complex backgrounds. Meanwhile, a novel quantification algorithm is developed to finely analyze the surface feature information with a focus on the crack morphology. The details of each step of the proposed architecture are introduced in the following subsections.

2.1. YOLOv5 for Road Crack Detection

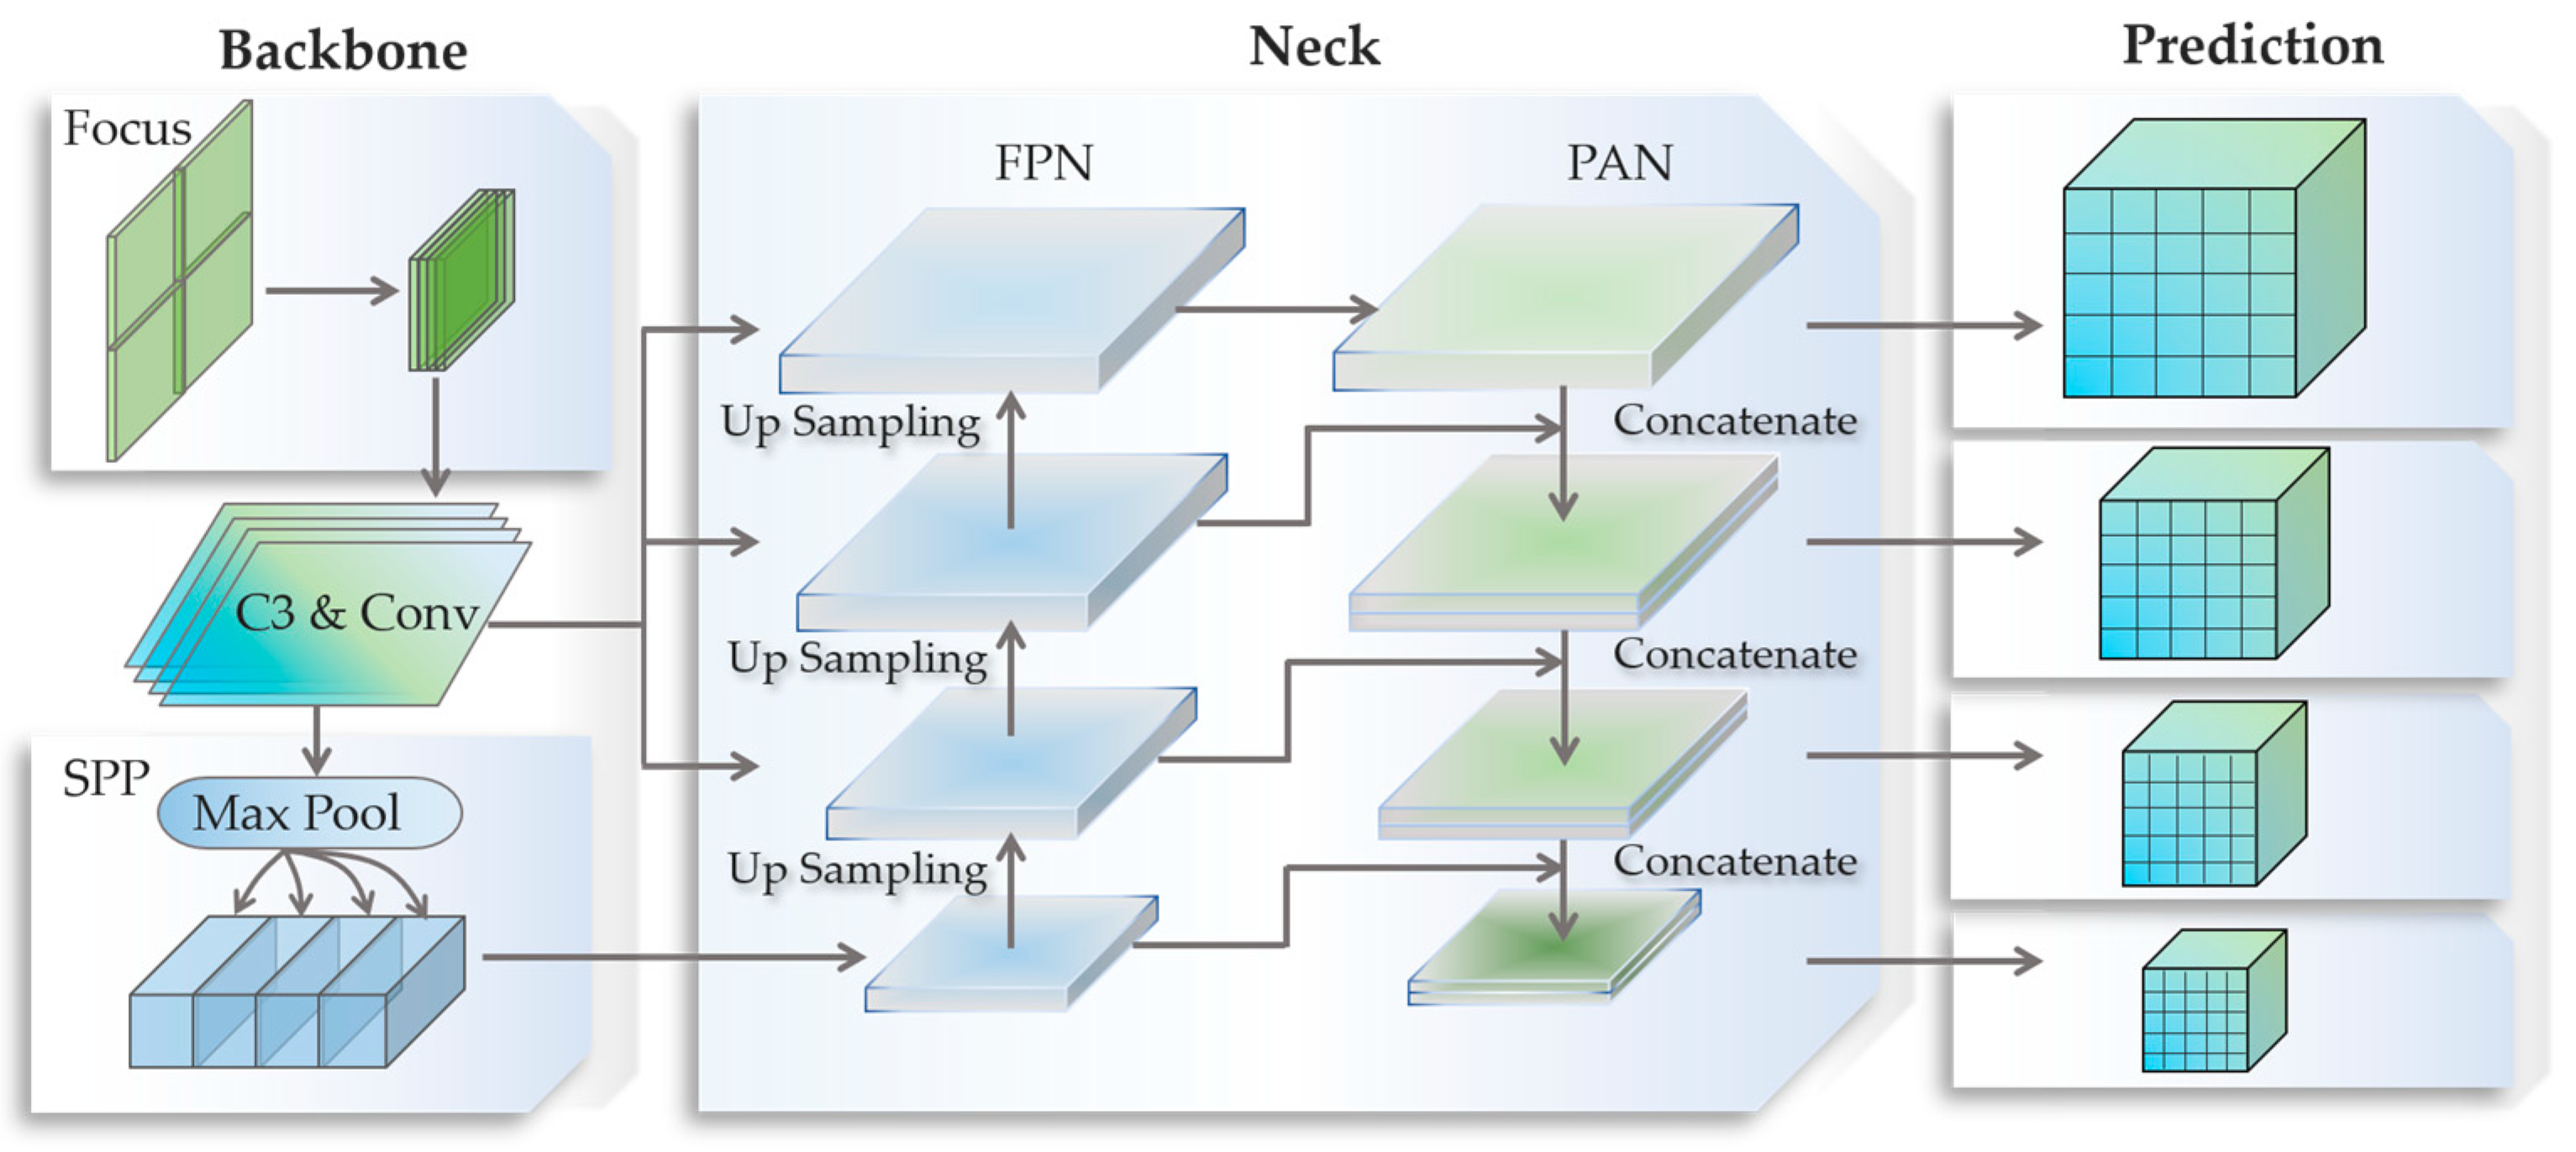
In the first stage of the proposed approach, YOLOv5 is utilized to detect road cracks in images with complex and various backgrounds. Specifically, the road crack images are first input to backbone to extract crack features; then, feature fusion is performed in neck using Feature Pyramid Network (FPN) [42] and Pyramid Attention Network (PAN) [43]; finally, the predicted values of class probability, item level, and bounding box location of road cracks are output. The architecture of the YOLOv5 is demonstrated in Figure 2, including three parts: backbone, neck, and prediction.
As illustrated in Figure 2, the first part of the architecture is backbone, whose main function is to extract features from the input image or video frames. Backbone consists of three main modules, namely Focus, Convolution 3 (C3), and Spatial Pyramid Pooling (SPP) [41]. The raw data are first divided by the Focus module into four parts, with each part representing two downsamplings. A lossless binary downsampled feature map is then generated by convolutionally merging these components along the channel dimension. The C3 module consists of several structural modules referred to as bottleneck residuals. Note that to transfer the residual features while keeping the output depth constant, two convolution layers and an addition with the initial amount constitute the input to the remaining structural module. Finally, the SPP performs maximized collaboration with four core dimensions and combines the properties to obtain multi-scale feature information.
In order to fully extract the fusion features, the neck consisting of FPN and PAN feature pyramid structures is introduced between the backbone and prediction layers. By using an FPN architecture, robust semantic characteristics can be transmitted from the highest to the lowest feature maps. This architecture ensures not only that the details of small objects are correct, but also that large objects can be represented in an abstract way. In addition, the PAN architecture relays accurate localization information across feature maps with varying granularity. Through the integral operation of the FPN and PAN, the neck achieves a satisfactory feature fusion capability.
In the prediction, a vector containing the target object’s category probability, item grade, and bounding box location is returned. There are four detection levels in the network, each of which has a size-specific feature map for detecting targets of varying sizes. After that, appropriate vectors are obtained from each detection layer, and finally the anticipated bounding box and item categorization are generated and labelled.

2.2. Modified Res-UNet for Crack Region Segmentation

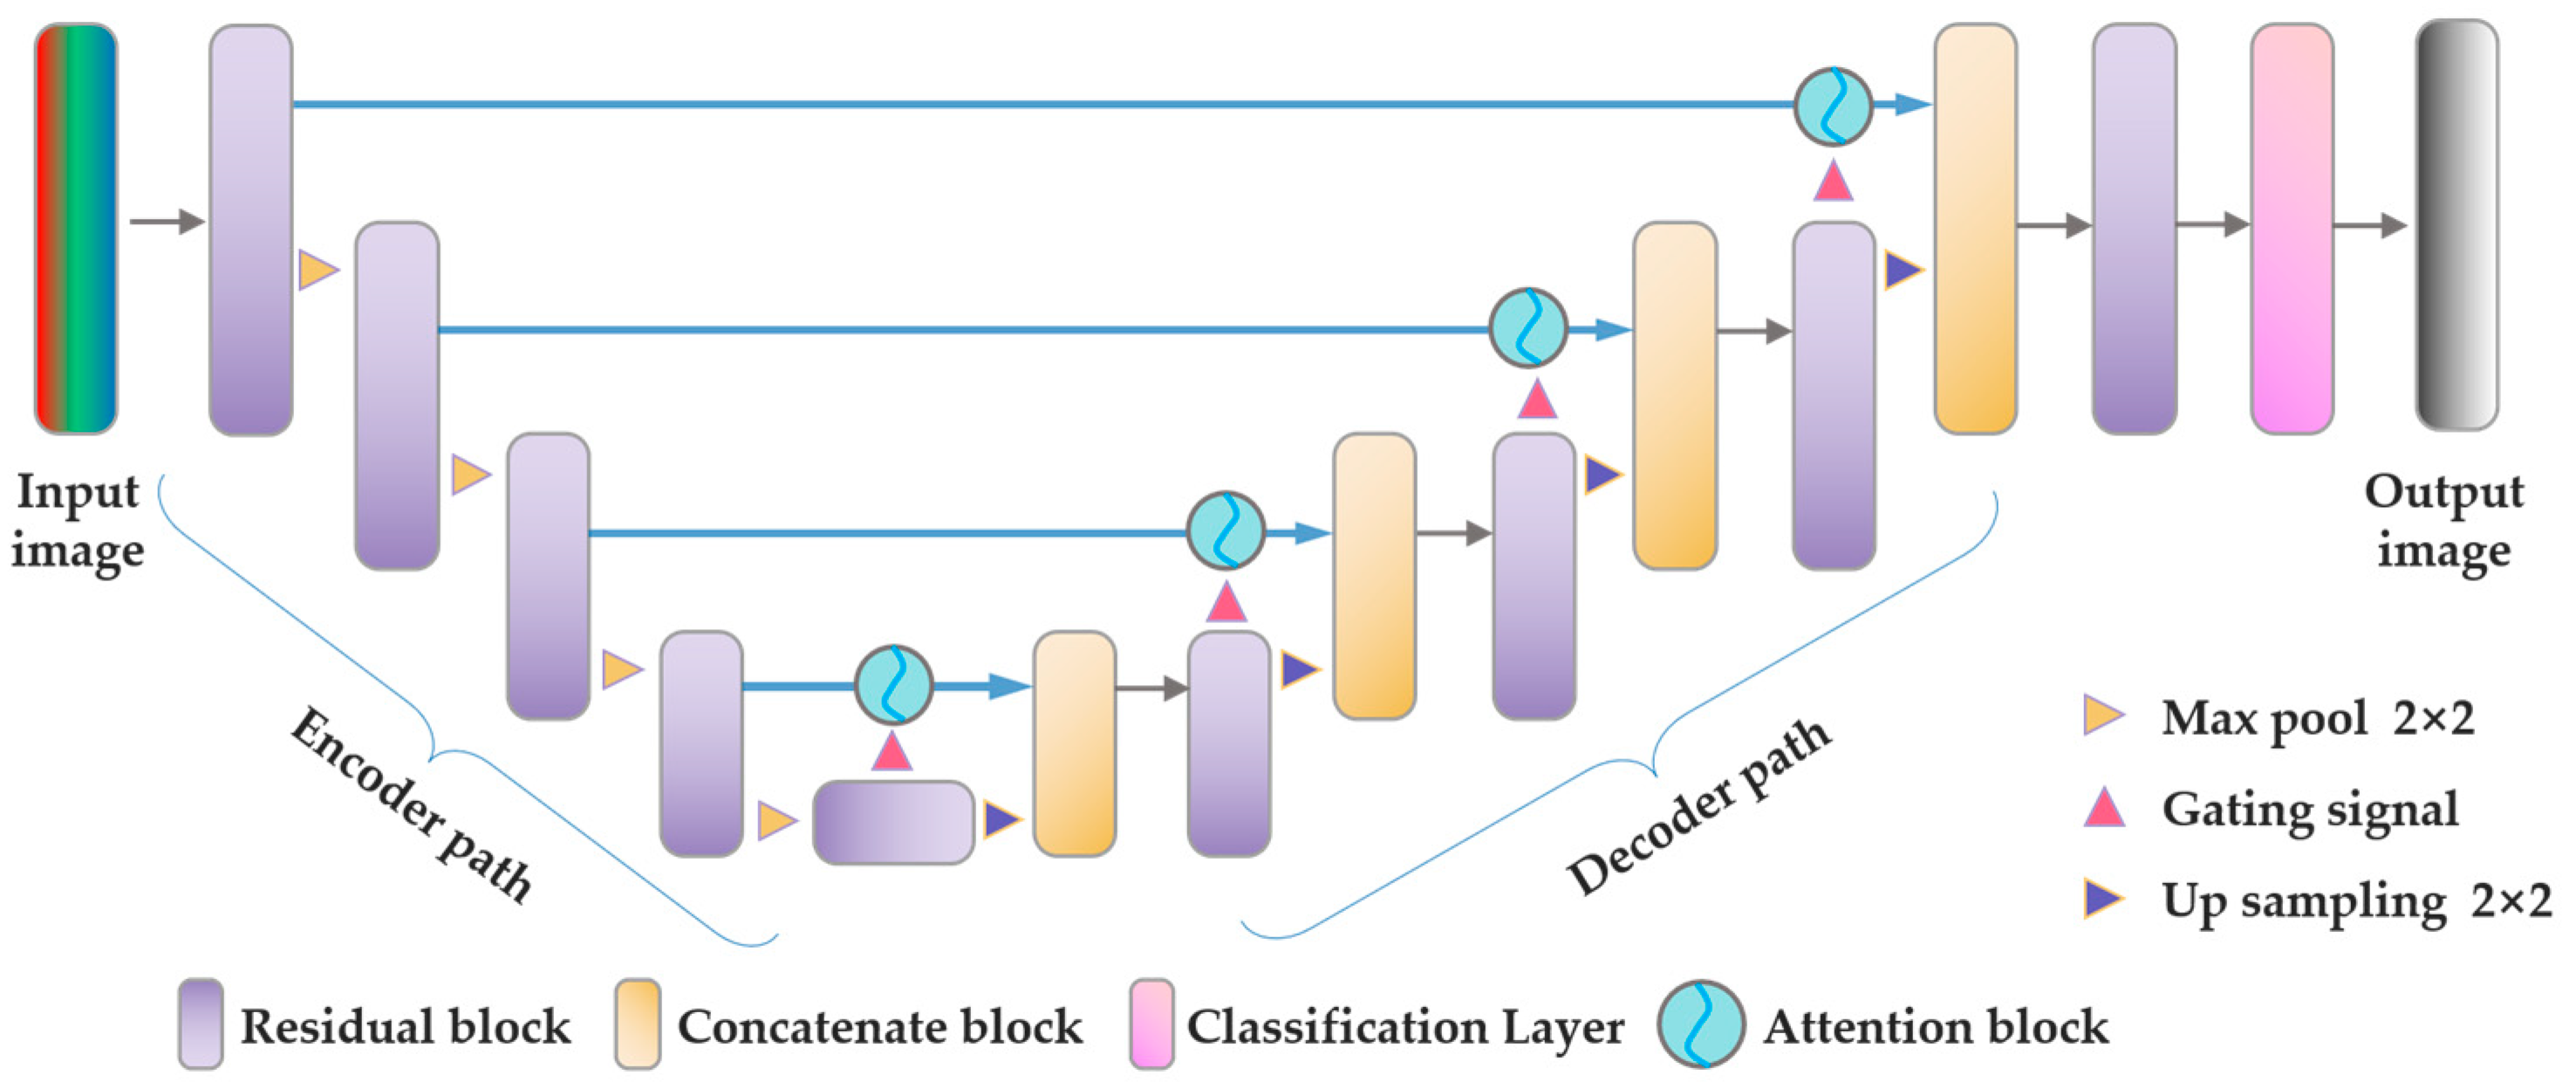
In the second stage, the crack pixels are segmented from the bounding box with Res-UNet, which employs skip connections to transmit contextual and spatial data between the encoder and decoder [29]. This connection helps to retrieve vital spatial data lost during downsampling. However, considering the similarity between crack-like objects and crack edges and their near background, passing all the information in the image through the skip connections can result in poor crack segmentation, especially for some blurred cracks. Therefore, the architecture of Res-UNet is modified in the present study, as shown in Figure 3. Specifically, the network was improved in two main aspects: first, the extracted crack detail features were enhanced by embedding an attention gate [44]; second, a new combined loss function was proposed to improve the accuracy of segmentation. A detailed description of these two improvements is described as follows.

2.2.1. Attention Gate

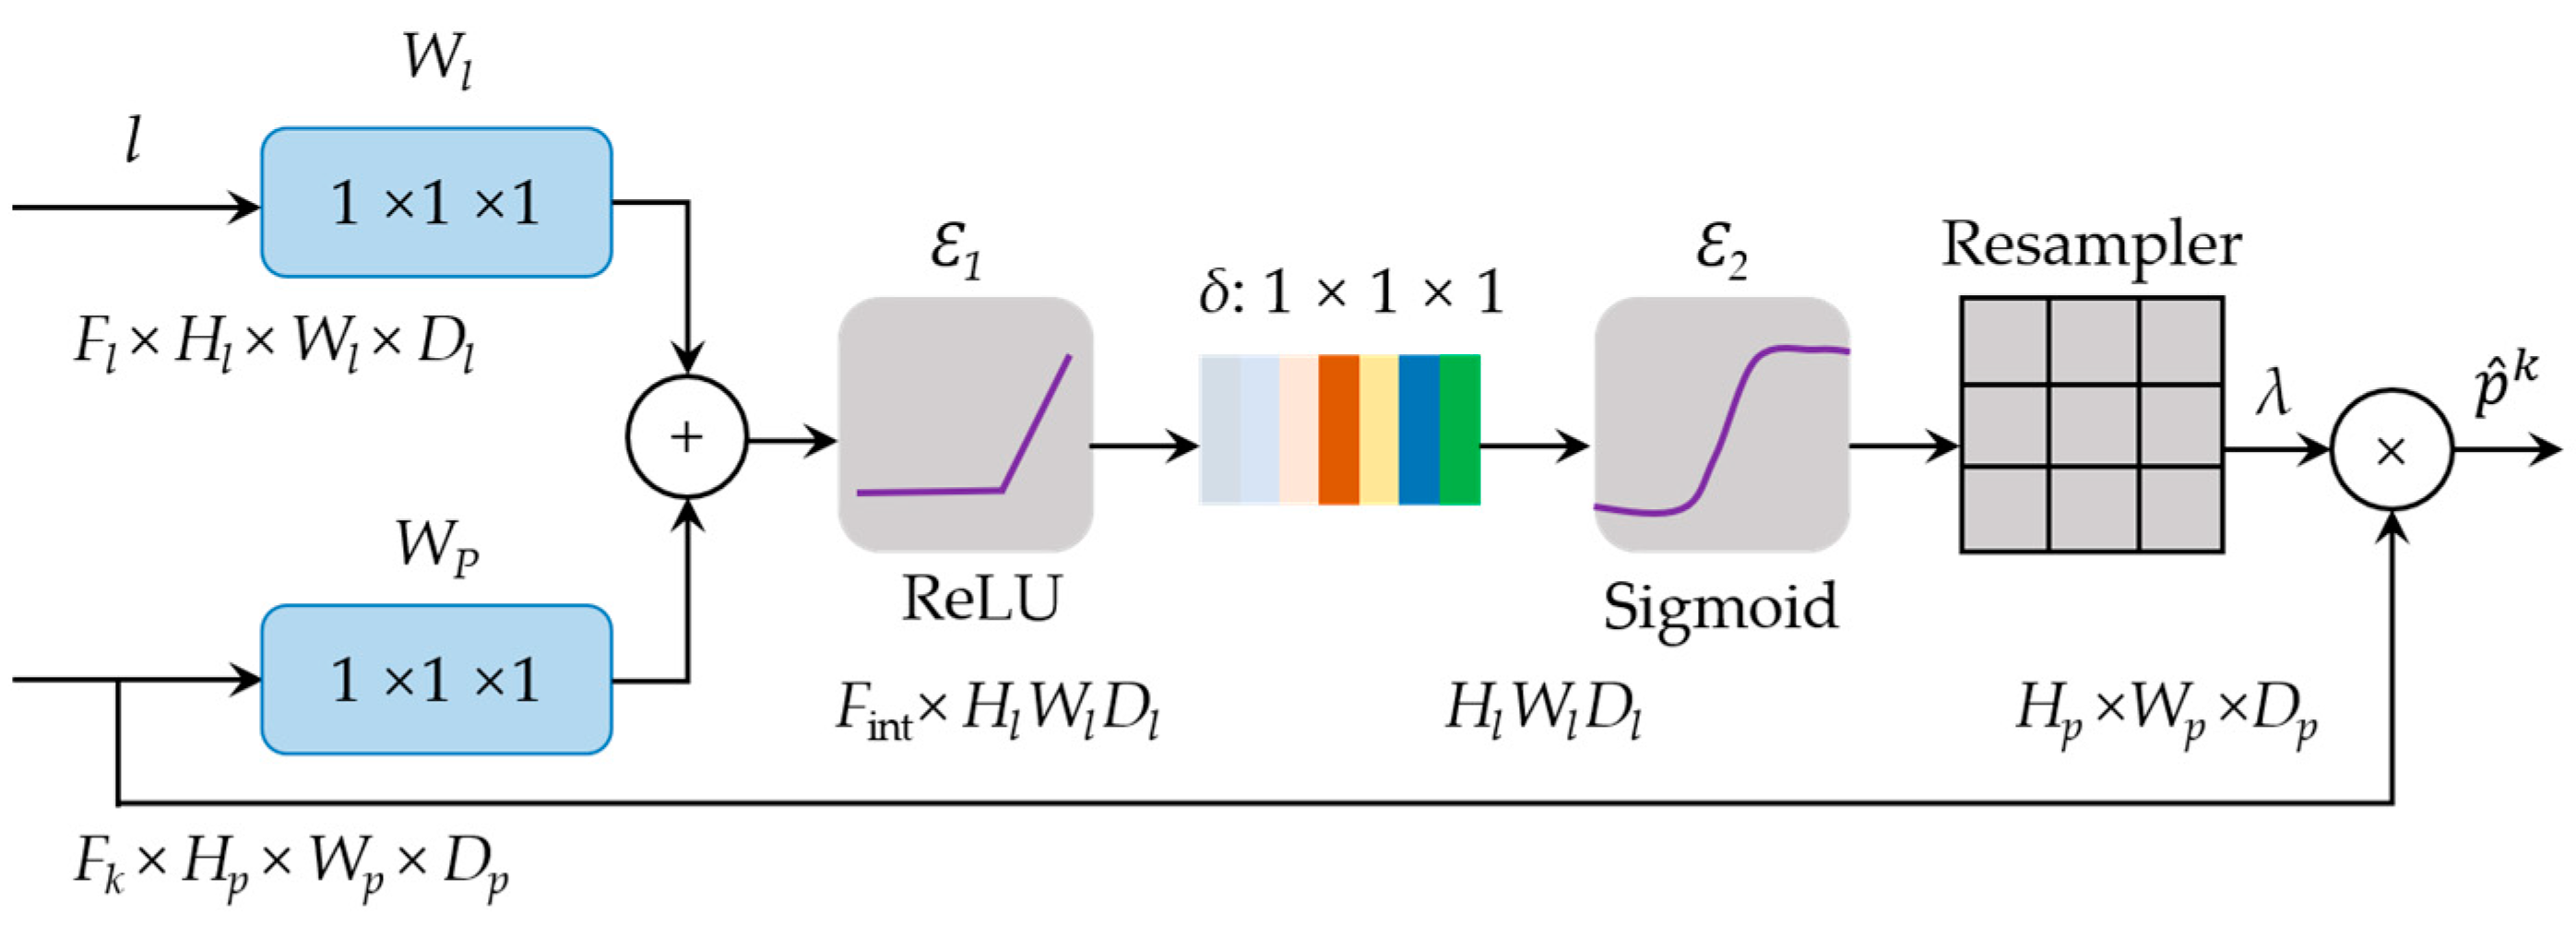
The attention mechanism of image segmentation is derived from the way human visual attention works, i.e., focusing on one region of an image and ignoring other regions [45]. In this study, attention gates are embedded to update model parameters in spatial regions relevant to crack segmentation, and its structure is shown in Figure 4. Two inputs are fed into the attention gate, namely the tensor of feature pE from the low-level encoder component, and the tensor of feature pD from the prior layer of the decoder component. Since pD comes from a more fundamental layer of the network, it has less dimensionality and reflects the features more accurately than pE. Therefore, before adding the two features element by element, an upsampling operation on pD is required to ensure that the dimensions are equivalent to l = Up (pD). Subsequently, to reduce the computational cost, the channels are compressed by feeding data from multiple sources into a linear conversion layer utilizing a channel-wise 1 × 1 × 1 convolutional layer, and then each piece is inserted individually. Note that throughout the summation process, the weight of alignment is greater, and the weight of misalignment is less. By using a Rectified Linear Unit (ReLU) activation function and a convolution for the expected features, the channel specification can be reduced to Fint. Afterwards, a sigmoid layer projects the attention coefficients (weights) onto the range [0, 1], with larger coefficients indicating greater significance. Eventually, the attentional parameter is multiplied by a factor with primary source p vector to scale it according to significance. The entire attention-gating procedure is described as
p ^ k = δ T ( ε 1 ( W p T p i k + W l T l i + b l ) ) + b δ
λ i k = ε 2 ( p ^ k , l i ; Θ a t t )
where Ɛ1 and Ɛ2 represent the ReLU and sigmoid activation functions, respectively. Θatt represents the attention gate’s parameters, which include: linear transformations Wl ∈ ℝFl×Fint, Wp ∈ ℝFk×Fint, δ ∈ ℝFl×1, and corresponding bias terms bδ ∈ ℝ, bl ∈ ℝFint.

2.2.2. Combined Loss

The difference between network predictions and ground truth is usually described by a loss function. In order to minimize the loss function, a stochastic gradient descent (SGD) optimizer can be used to optimize the network weights. In addition, segmenting cracks from the images is a binary classification problem. Therefore, in this study, the binary cross entropy (BCE) loss function is employed:
B C E ( h , v ) = i h i log v i
where i represents the category, in this study, i ∈ {0, 1}; vi presents the prediction; and hi represents the actual category assigned to each identified pixel. The cracks and backgrounds are considered at the same level by BCE, which effectively solves the problem caused by the different sizes of these two categories.
In this study, the image segmentation results can be evaluated by the Dice coefficient, which can be described as:
D ( h , v ) = 2 | H V | | H | + | V | = 2 i v i h i i v i + i h i
where H and V represent the actual and anticipated item volumes, respectively.
To resolve the imbalance between the crack zone and the background, the Dice loss and BCE loss are merged as:
L ( h , v ) = ( 1 β ) B C E ( h , v ) + β D ( h , v ) = ( 1 β ) ( i h i log v i ) + β ( 2 i v i h i + ղ i v i + i h i + ղ )
where ղ is a negligible quantity, typically 1 × 10⁻¹⁰, which is primarily utilized to avoid division by zero. β is set to 0.5 by experimental test.

2.3. Novel Algorithm for Crack Quantification

In this section, the segmented cracks are quantified at the pixel level with the proposed algorithm. As a comparison, the traditional DTM procedure is first introduced, as shown in Figure 5. Firstly, the binary image is converted into a binary matrix, i.e., with “1” or “0” representing whether it is a crack pixel or not, respectively. Next, a labelling operator examines all clusters of pixels with the same value (i.e., 1 or 0), starting from the top left corner, and assigns a unique value to each cluster. In this way, all pixels are categorized into different clusters and assigned with numbers (1–5), as the first operation is depicted in Figure 5. Apparently, some crack pixels are connected but have different cluster numbers. Therefore, the same operator needs to be applied again to combine these pixels. After the above steps, the final image matrix can be obtained. To calculate the length and width of a crack, it is necessary to determine the center pixel of each cluster formed by the preceding labelling operator with the parallel thinning algorithm. Details can be found in the work of Lee et al. [46].
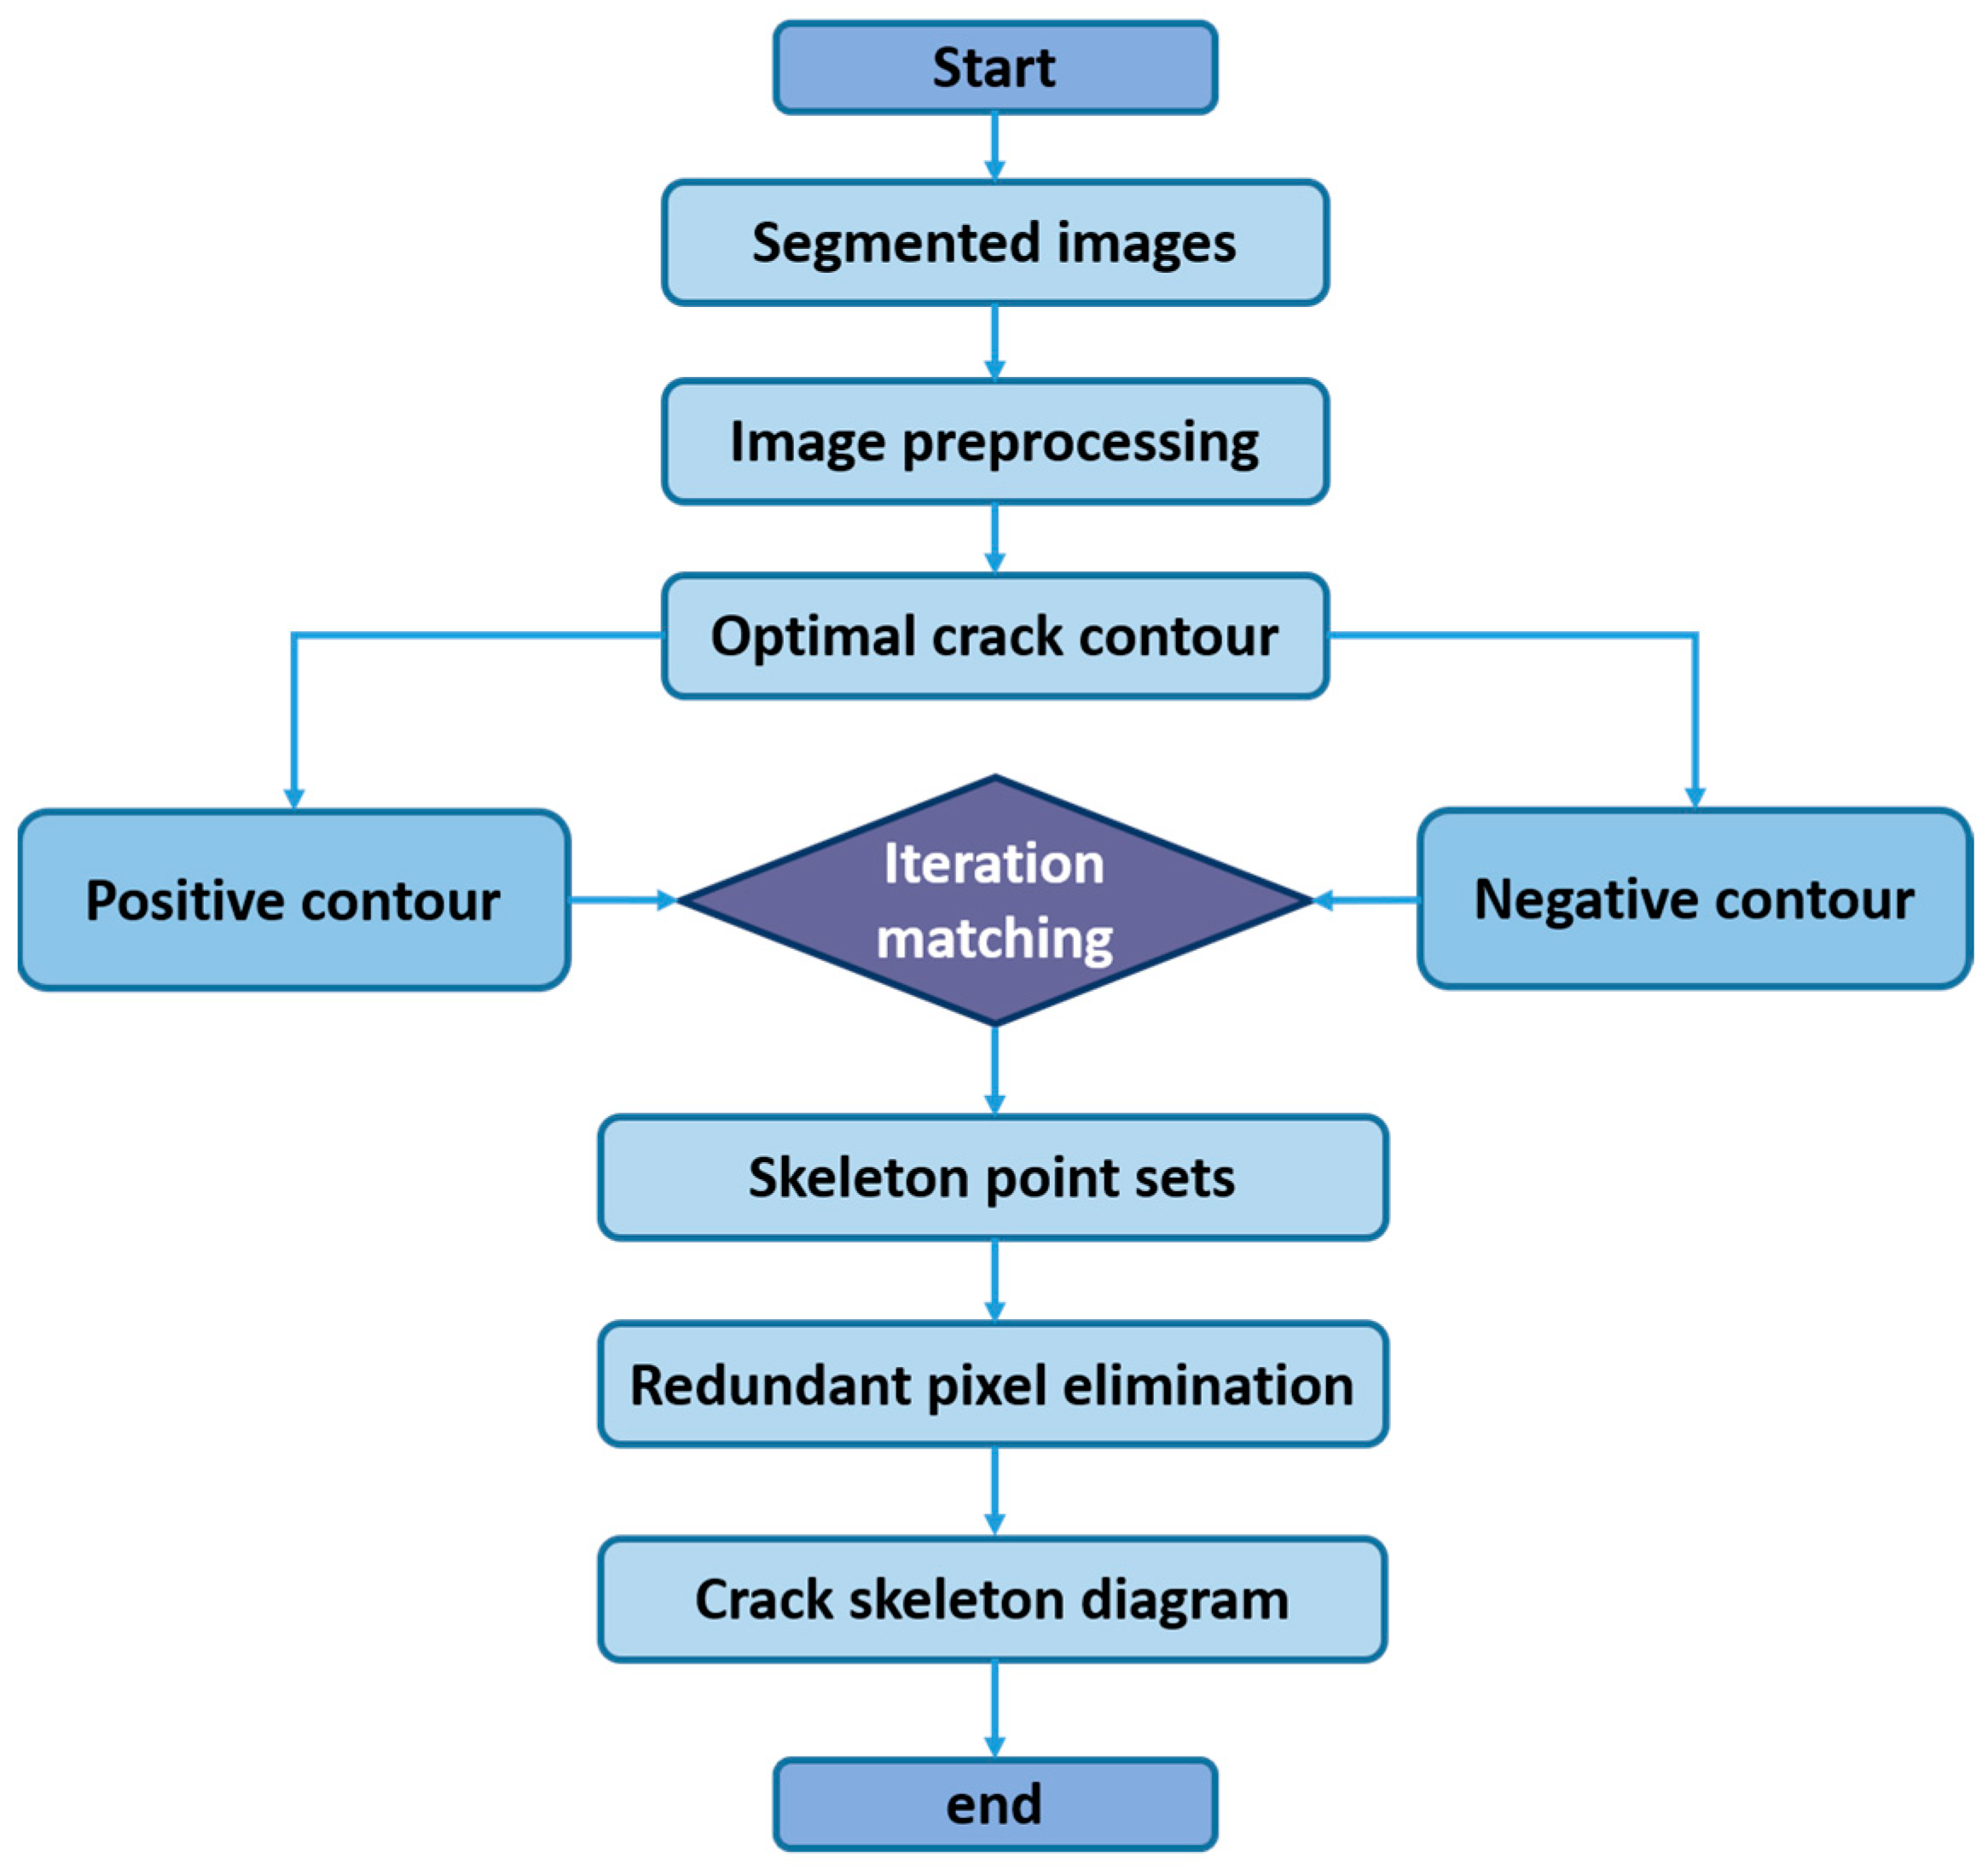
Through the calculation, it is found that when extracting the crack center pixel with the traditional parallel thinning algorithm, there are issues of local branches and loss at the crack ends, as illustrated in Figure 6a, which obviously leads to an inaccurate calculation of the crack length. Therefore, the morphological features of cracks are fully considered, and a new crack quantification algorithm is developed in this study, as shown in Figure 6b. By extracting the coordinates of the crack edge and performing an average calculation, the aforementioned limitations can be well-addressed, and the final result is depicted in Figure 6c. The complete flowchart of the proposed surface feature quantification algorithm is shown in Figure 7, and the specific implementation process is as follows:
(1) Image preprocessing: The image matrix shown in Figure 5 based on the traditional crack skeleton detection method is obtained, and the object contour set is found by applying the “findContours” [47] function in OpenCV. The optimal contour, including the maximum number of internal closed pixels, is determined for each region:
T = x = 1 y = 1 Γ ( x , y )
where T represents the number of pixels in the target area; Γ (x, y) represents the grayscale value of the target; “0” and “1” for the background and target, respectively. Based on the extracted contour pixel coordinates (x, y), the crack contour point set Đ is generated. Note that the top left corner of the image is chosen as the coordinate origin.
(2) Positive contour: The pixels in Đ are sorted in counterclockwise to obtain the full contour point set Ē. The first half of Ē is specified as the positive contour point set Ēpos, as shown in Figure 8. For longitudinal cracks, the starting point is the upper left corner of the contour, and for transverse cracks, its lower left corner is the starting point (transverse and longitudinal cracks are distinguished based on the rotation angle R of the crack, R ≥ 45° for longitudinal and R < 45° for transverse).
(3) Negative contour: Similar to the previous step, the pixels in Đ are sorted in clockwise to obtain the full contour point set Ĝ. The first half of Ĝ is specified as the positive contour point set Ĝneg.
(4) Center pixels. For each longitudinal crack contour, all points in positive contour Ēpos and negative contour Ĝneg are traversed to find a pairs of points with equivalent y-values (x-values for transverse cracks), and the centroid coordinates of each pair of points are determined as:
X c = x p + | x n x p | 2 Y c = y p   (   i f   y p = y n )
where Xc and Yc represent coordinates of the pixels in Ĉ; xp, yp and xn, yn are coordinates of the pixels in Ēpos and Ĝneg, respectively.
(5) Post-processing: Due to the irregularity of the crack contour, multiple centroids may be obtained at sharply varying edges, such as the 7th, 8th, and 9th edge points of the positive contour in Figure 8. The point with the smallest average Euclidean distance from its neighboring points is retained, while the rest are removed. In this way, the final set of centroids λ is obtained.
Eventually, the crack length L can be obtained by calculating and accumulating the distance between each pair of neighboring pixels in the center point set λ:
L = i = 1 ( X i + 1 c X i c ) 2 + ( Y i + 1 c Y i + 1 c ) 2
where X i + 1 c , Y i + 1 c and X i c , Y i c are coordinates of the pixels in the center point set λ. Moreover, the crack width W can be determined as:
W = M i n ( τ ) × 2 + 1
where τ represents the distance between the crack’s edge and the corresponding center pixel.

3. Implementation Details

In this section, the proposed method is compared with the state-of-the-art crack identification, extraction, and quantification methods, respectively. It is worth noting that, to increase the confidence of the evaluation, the PyTorch framework, which is consistent with the original network [48], is used in this study, and both training and testing are based on the widely used publicly available datasets.

3.1. Datasets

To obtain the stable weights, the YOLOv5 and modified Res-UNet models are required to be pre-trained first, and the information of the dataset used for training is listed in Table 1. Specifically, the training and validation images are from the Road Damage Detection (RDD) dataset [49], while the test images are from Hunan University [50]. In this study, two types of cracks are considered, namely transverse cracks and longitudinal cracks. It is worth noting that the cracks used for training and validation in this study are mostly wide cracks. This is due to the fact that the wide cracks (i.e., width > 2 mm) [31] are more harmful to road structure and are more visible for collection. In preprocessing of training YOLOv5, the resolution of all images is resized to 1280 × 1280 pixels. In the 120 images used for testing, the wide (width > 2 mm), medium (1 mm < width < 2 mm), and thin (width < 1 mm) cracks are 70%, 20%, and 10%, respectively.
The training images for the modified Res-UNet model are taken from the publicly available road crack dataset [51,52,53], which was gathered under various illumination circumstances (including shadow, occlusion, low contrast, and noise). In preprocessing, the images used for both training and validation are resized to 448 × 448 pixels. Testing images are those cropped by bounding boxes generated by YOLOv5. All images in the dataset for training and validation are chosen at random, and part of the image samples are shown in Figure 9.
The images used to test the YOLOv5, modified Res-UNet, and the developed crack quantification algorithm are collected with an iPhone 12 equipped with Feiyu Vimble 3 Handheld Gimbal [54], as shown in Figure 10a.

3.2. Training Configuration

YOLOv5 and the modified Res-UNet are trained on a deep learning server (Super Cloud R8428 G11) with six Nvidia GeForce RTX 3060 (12 GB of memory), as shown in Figure 10b. The operating system is Ubuntu 20.04 with Pytorch 1.9.1, CUDA 11.0, and CUDNN 8.04.
The hyperparameters for YOLOv5 are as follows: batch size (32), learning rate (0.001), momentum (0.9), weight decay (0.0005), and training epoch (1000). The adaptive moment estimation optimizer is employed in the training process. As for the modified Res-UNet, the tuned hyperparameters are as follows: batch size (64), weight decay (0.0001), and the stochastic gradient descent (SGD) optimizer.

3.3. Evaluation Metrics

To evaluate the experimental results of YOLOv5, the modified Res-UNet, and the developed quantification algorithm, five performance metrics are considered: mean average precision (mAP), mean intersection of the union (IoU), pixel accuracy (PA), Dice coefficient (DICE), and root mean square (RMS) error. In particular, the average precision (AP) represents the area under the precision–recall curve (P-R curve), while mAP represents the average value of different categories of AP:
m AP = AP N = 1 N 0 1 P ( R ) d R N
where P is the proportion of all predicted positive samples that are correctly detected, and R is the proportion of all actual positive samples that are successfully detected; N refers to the number of crack categories, in this study mainly transverse cracks and longitudinal cracks are considered, thus the value is taken as 2. IoU is the ratio between the intersection and union of the candidate boxes generated and the original marked boxes, which can be expressed as:
IoU = area ( T a T b ) area ( T a T b )
where Ta represents the ground-truth crack pixels, and Tb denotes the predicted crack pixels. PA is the number of correctly predicted pixels out of the total pixels, which can be expressed as:
PA = i = 0 k p i i i = 0 k j = 0 k p i j
Dice coefficient is adopted to evaluate the ensemble similarity, as shown below:
DICE = 2 T P F P + 2 T P + F N
where TP represents the number of true pixels predicted as positive, FP is the number of false pixels predicted as positive, and FN is the number of false pixels predicted as negative. The value of Dice ranges from 0 to 1, with the number indicating better model performance.
RMS error can be determined as:
RMS   error = i = 1 k ( P T ) 2 k
where k is the total number of test images (120 in this study), P represents the quantification result, and T represents the ground truth.

4. Experiment Results and Discussion

To validate the performance of the proposed approach, real road cracks with various backgrounds are collected and tested in this section. Furthermore, the results are compared with two state-of-the-art deep learning algorithms, YOLACT++ [55] and DeepLabv3+ [56].

4.1. Road Crack Detection

The test images are collected in different real scenes with clear backgrounds, shadows, dark light, and lane lines, respectively. The results of the crack detection using the YOLOv5 model are shown in Figure 11, which shows that all transverse cracks (labelled as “CrackT”) and longitudinal cracks (labelled as “CrackL”) are all accurately detected with an mAP of 91%.

4.2. Region Crack Segmentation

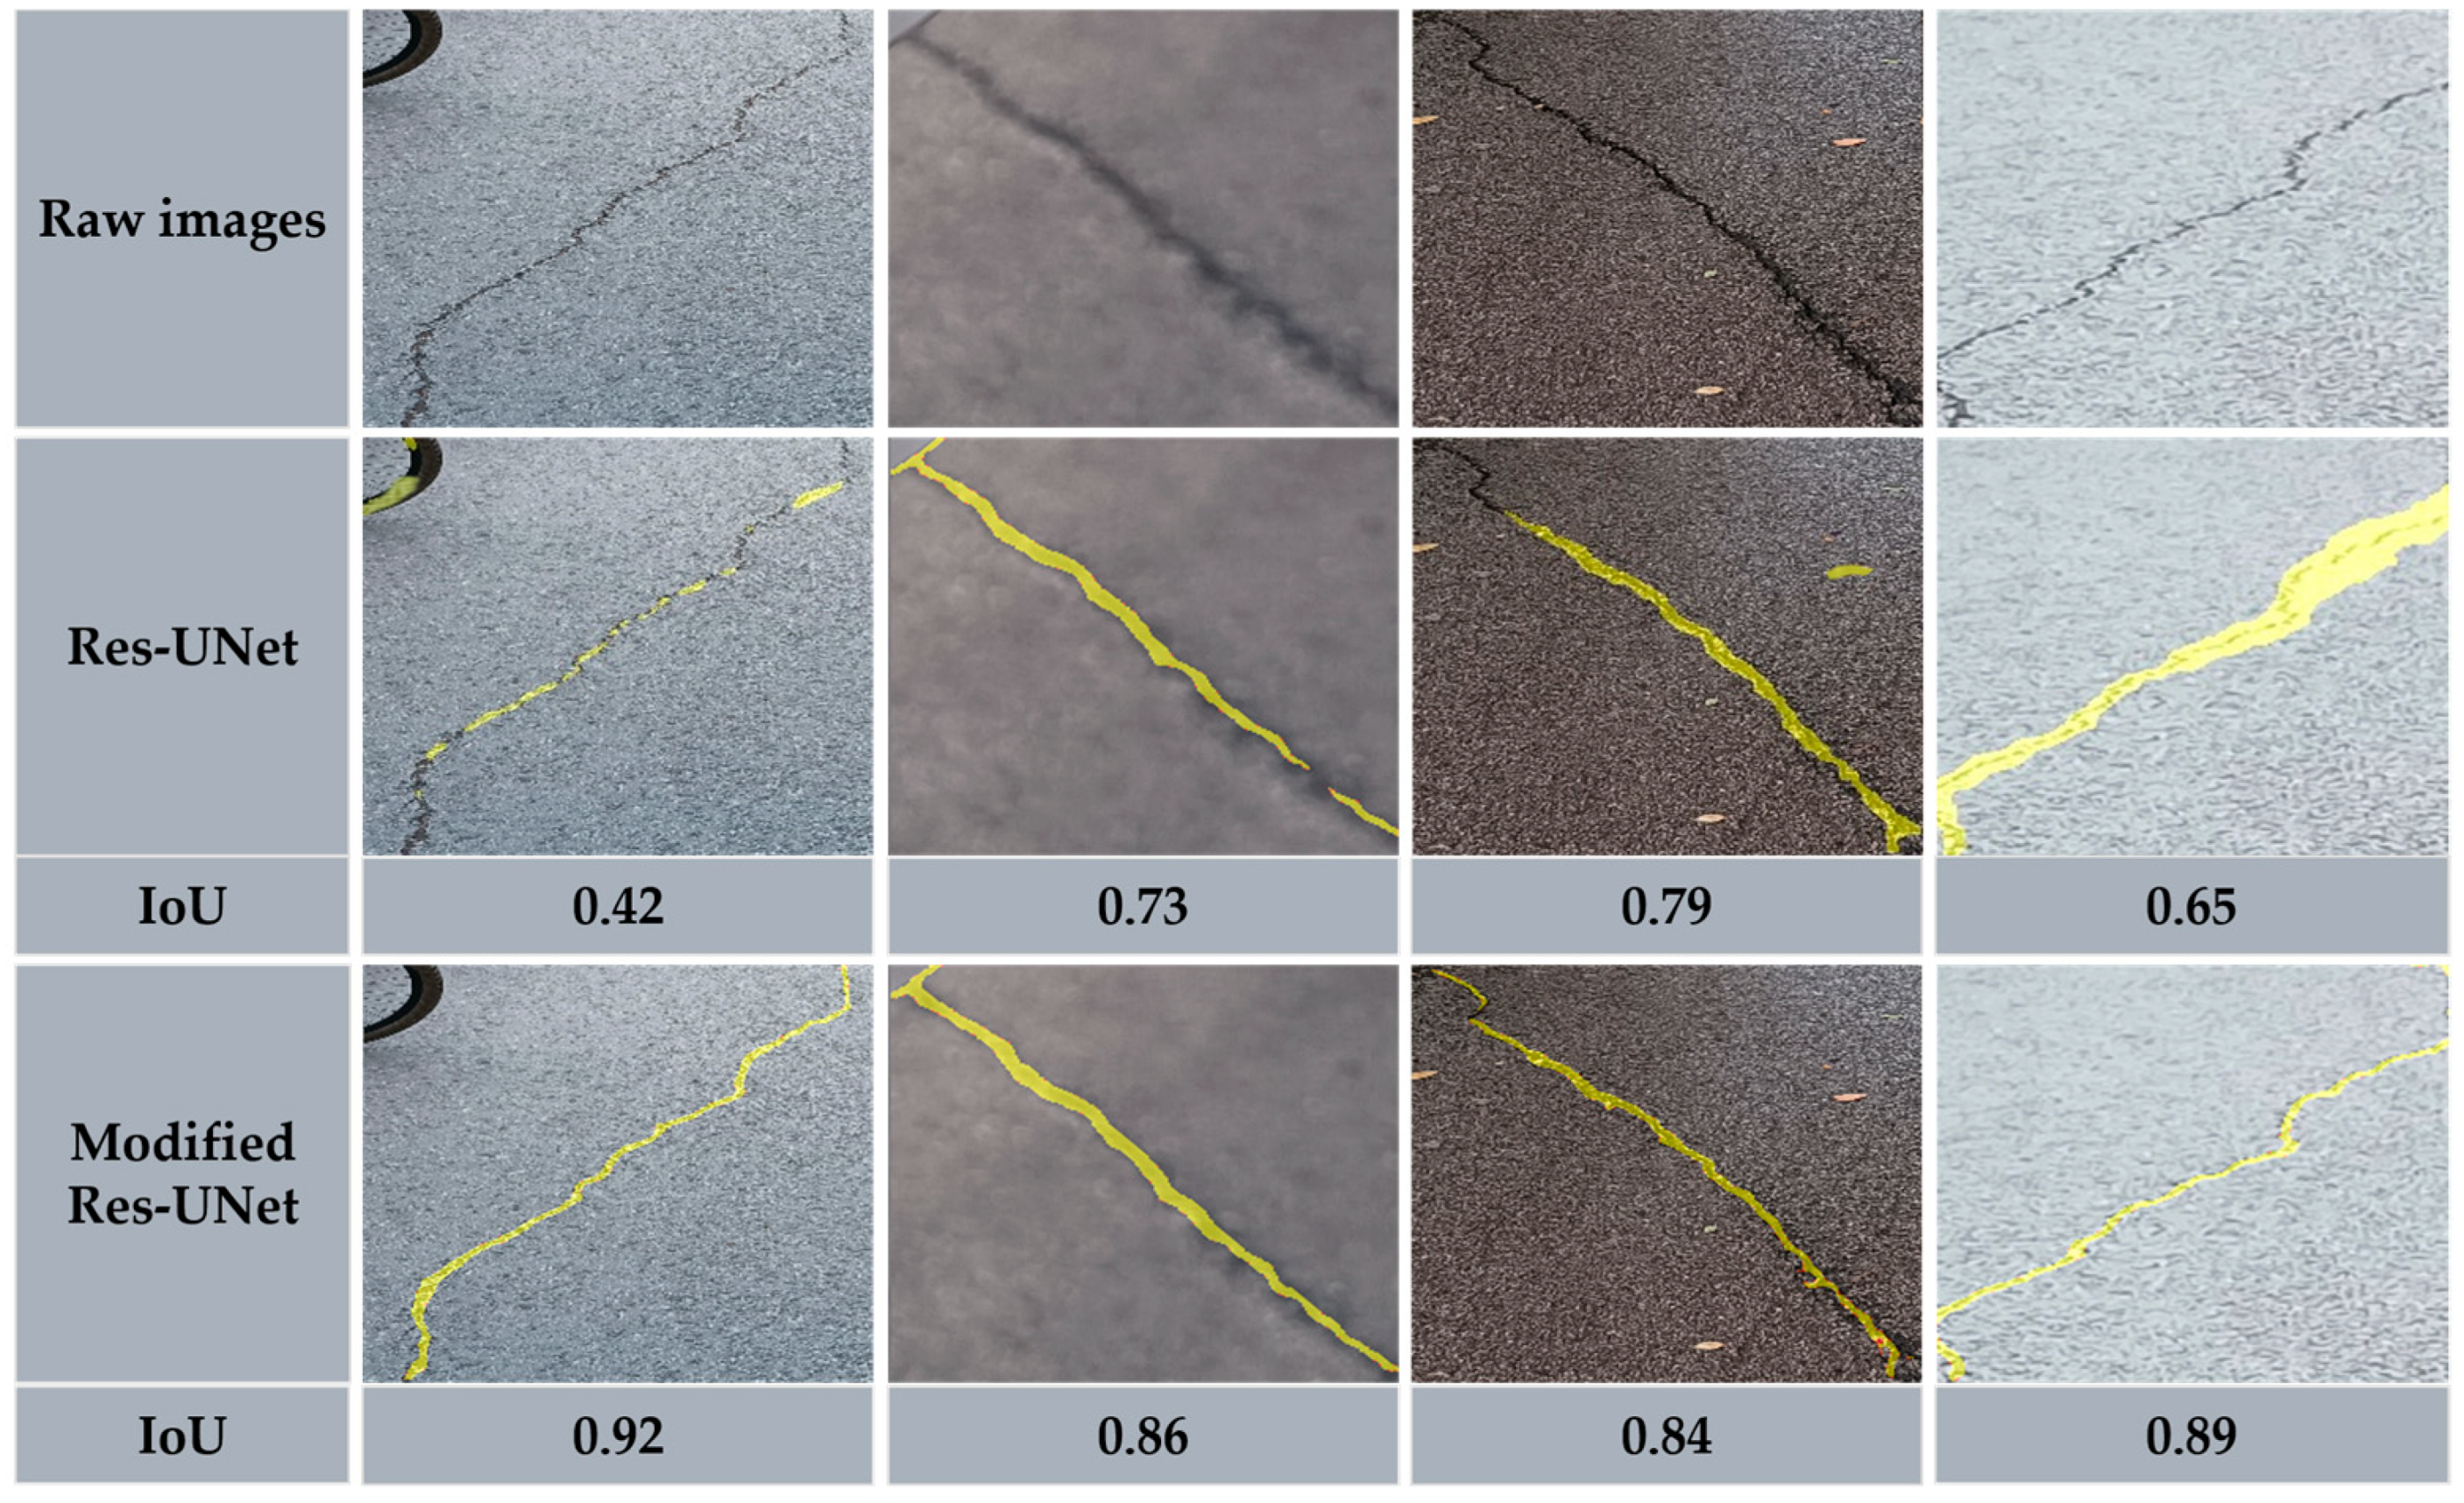
To segment and evaluate cracks from images, image boxes containing cracks detected by YOLOv5 are fed into modified Res-UNet. For the purpose of illustrating the efficiency of the modified Res-UNet, seven different UNet-based models for segmenting cracks, namely U-Net [57], Res-UNet [29], CrackUNet15 [58], CrackUNet19 [58], UNet-VGG19 [59], UNet-InceptionResNetv2 [59], and UNet-EfficientNetb3 [59], are selected for comparison based on the testing datasets. The comparison results are listed in Table 2, and the outcomes of the original Res-UNet and the modified Res-UNet are provided in Figure 12. It can be seen from Table 2 that the modified Res-UNet achieves the highest IoU, PA, and DICE. Specifically, the values of average IoU obtained by UNet, Res-UNet, CrackUNet15, CrackUNet19, UNet-VGG19, UNet-InceptionResNetv2, and UNet-EfficientNetb3 are 78.63%, 80.30%, 83.89%, 84.78%, 84.53%, 83.98%, 84.36%, and 87.00%, respectively; and the DICE obtained by the modified Res-UNet was improved by 7.86%, 6.06%, 3.93%, 2.65%, 2.88%, 3.60%, and 3.13%, respectively. It can be seen from Figure 12 that the random interference noise is effectively reduced by the embedded attention gates, and there is a significant improvement in the crack-like feature detection using the different weight distribution methods. Specifically, the IoU of the cracks segmented by the Res-UNet with embedded attention gates is improved by 6.7% compared with the original model.
In addition, the proposed approach is compared with two existing crack segmentation neural networks (YOLACT++ and DeepLabv3+). The YOLACT++ and DeepLabv3+ networks are trained with publicly available crack segmentation datasets [51,52,53], which contain noise such as moss on crack, title lines, etc. These two networks were tested with the same 120 images as the proposed method, and several typical examples are shown in Figure 13. These images are taken from different environments with a variety of backgrounds, including lawns, vehicles, buildings, and at night. As can be seen in the last column of Figure 13, the cracks can be accurately detected and segmented even under weak illumination conditions. Meanwhile, the details of the three methods are listed in Table 3. As shown in the table, the proposed approach achieved an average IoU of 87.00%, while YOLACT++ and DeepLabv3+ achieved an average IoU of only 48.02% and 57.14%, respectively. This indicates that the proposed method significantly outperforms DeepLabv3+ and YOLACT++ networks for crack identification and segmentation in complex environments.

4.3. Quantification of Crack Surface Feature

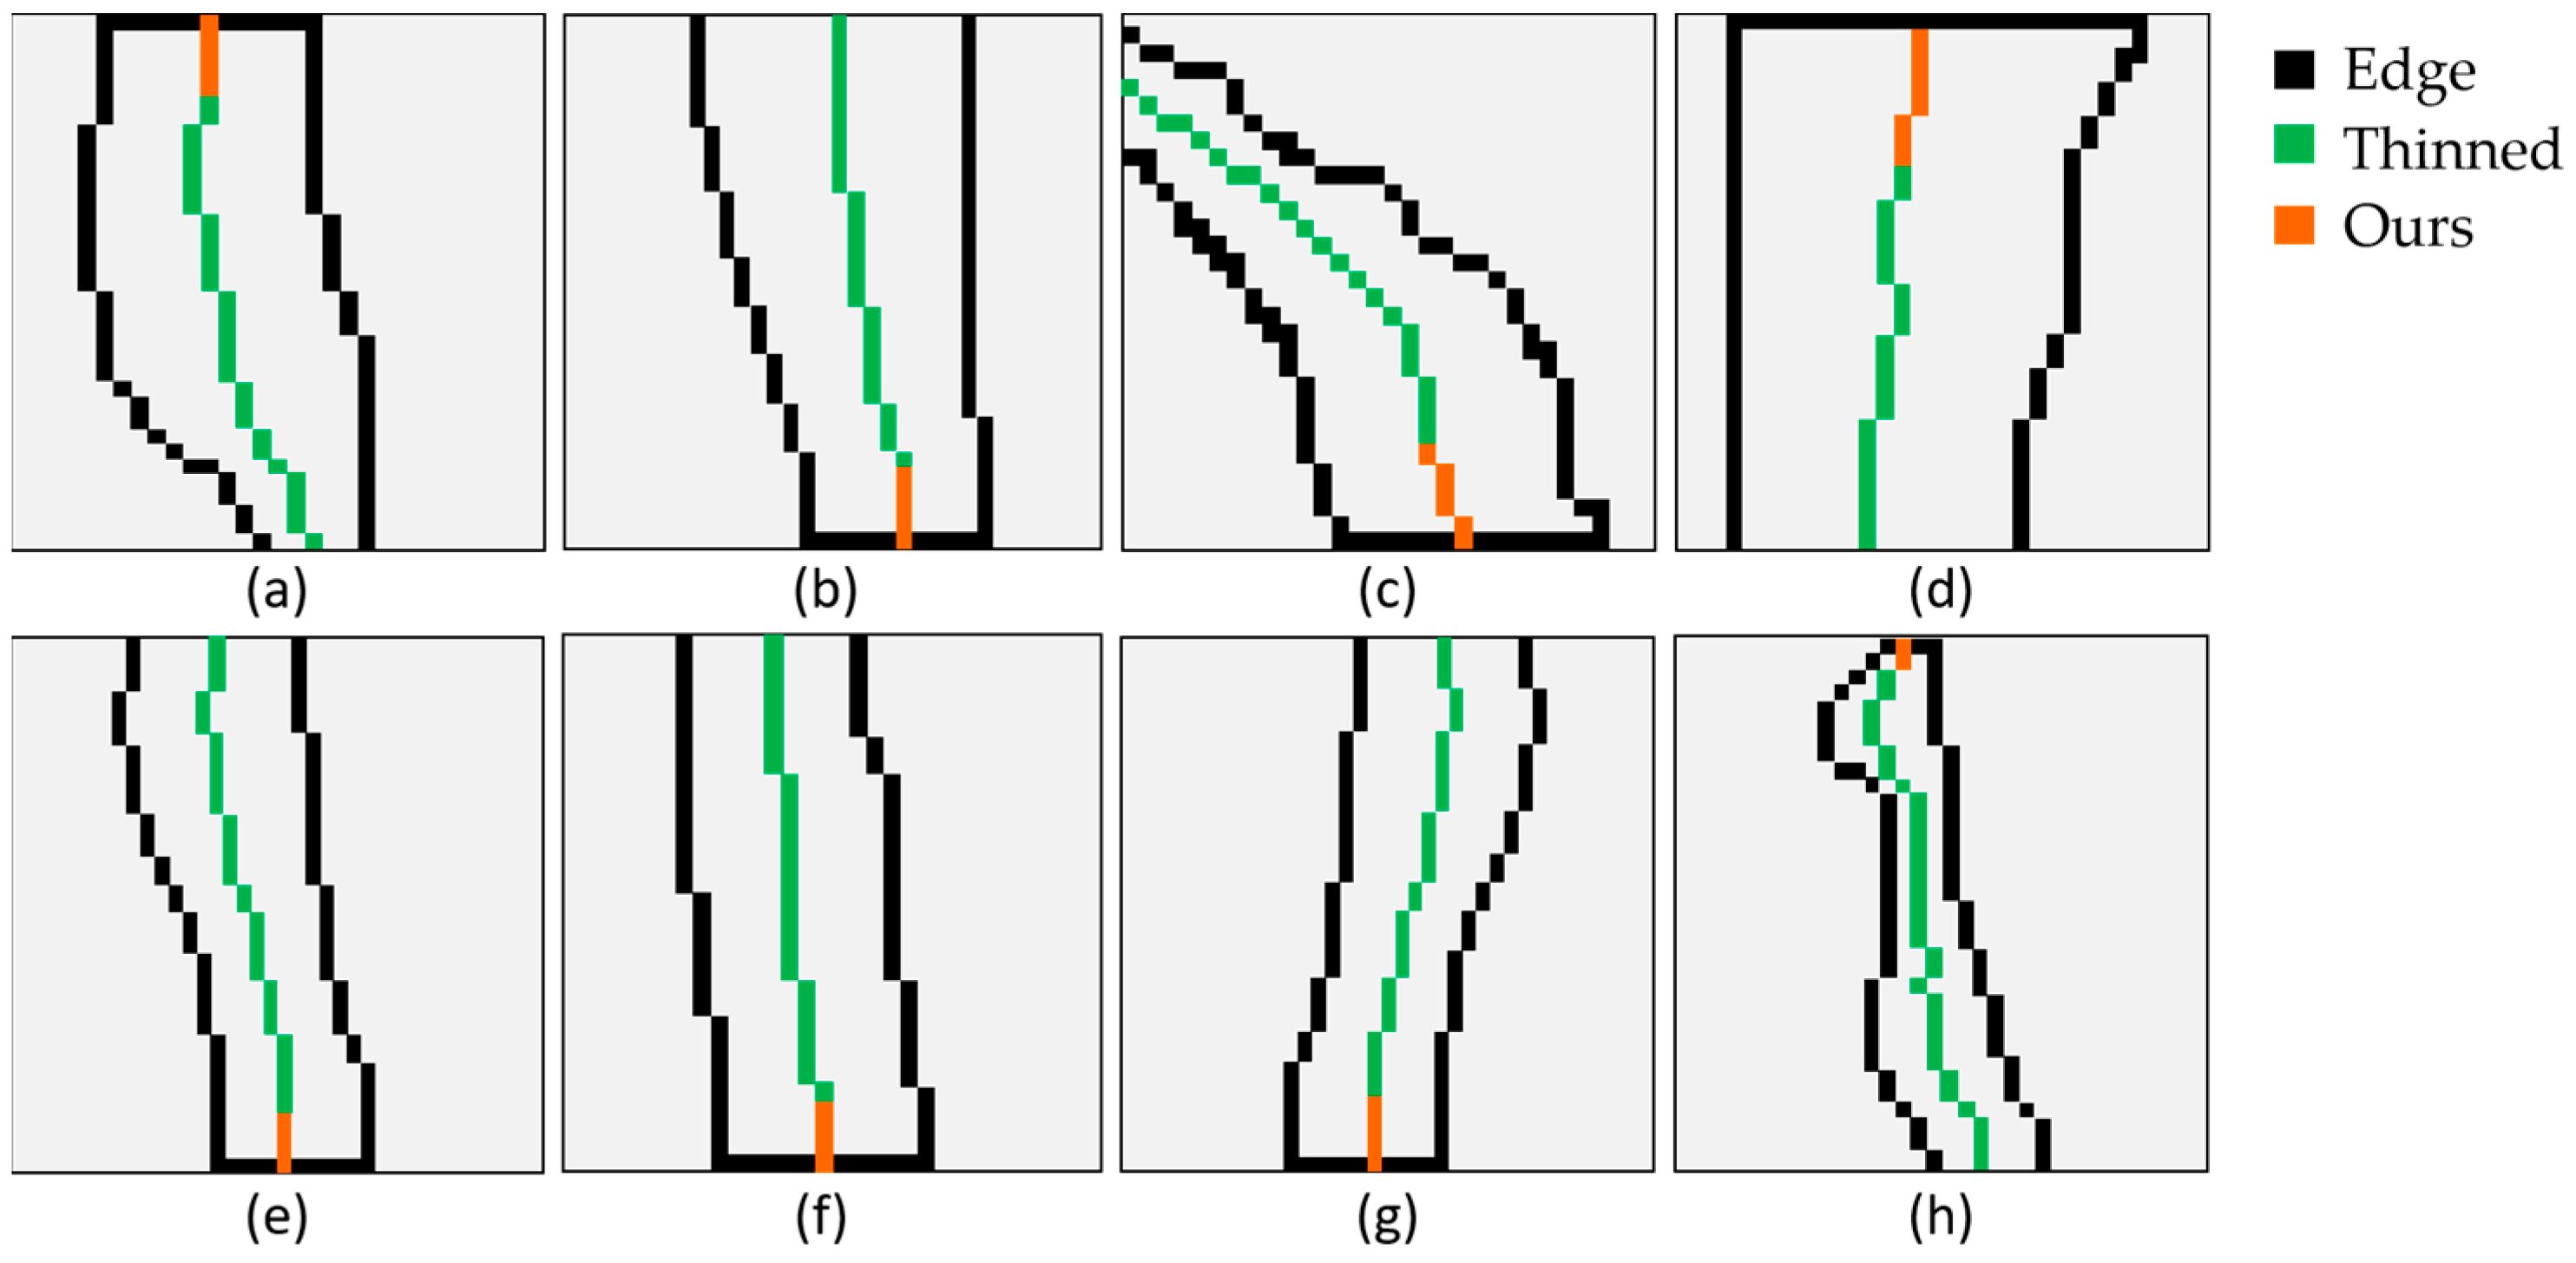
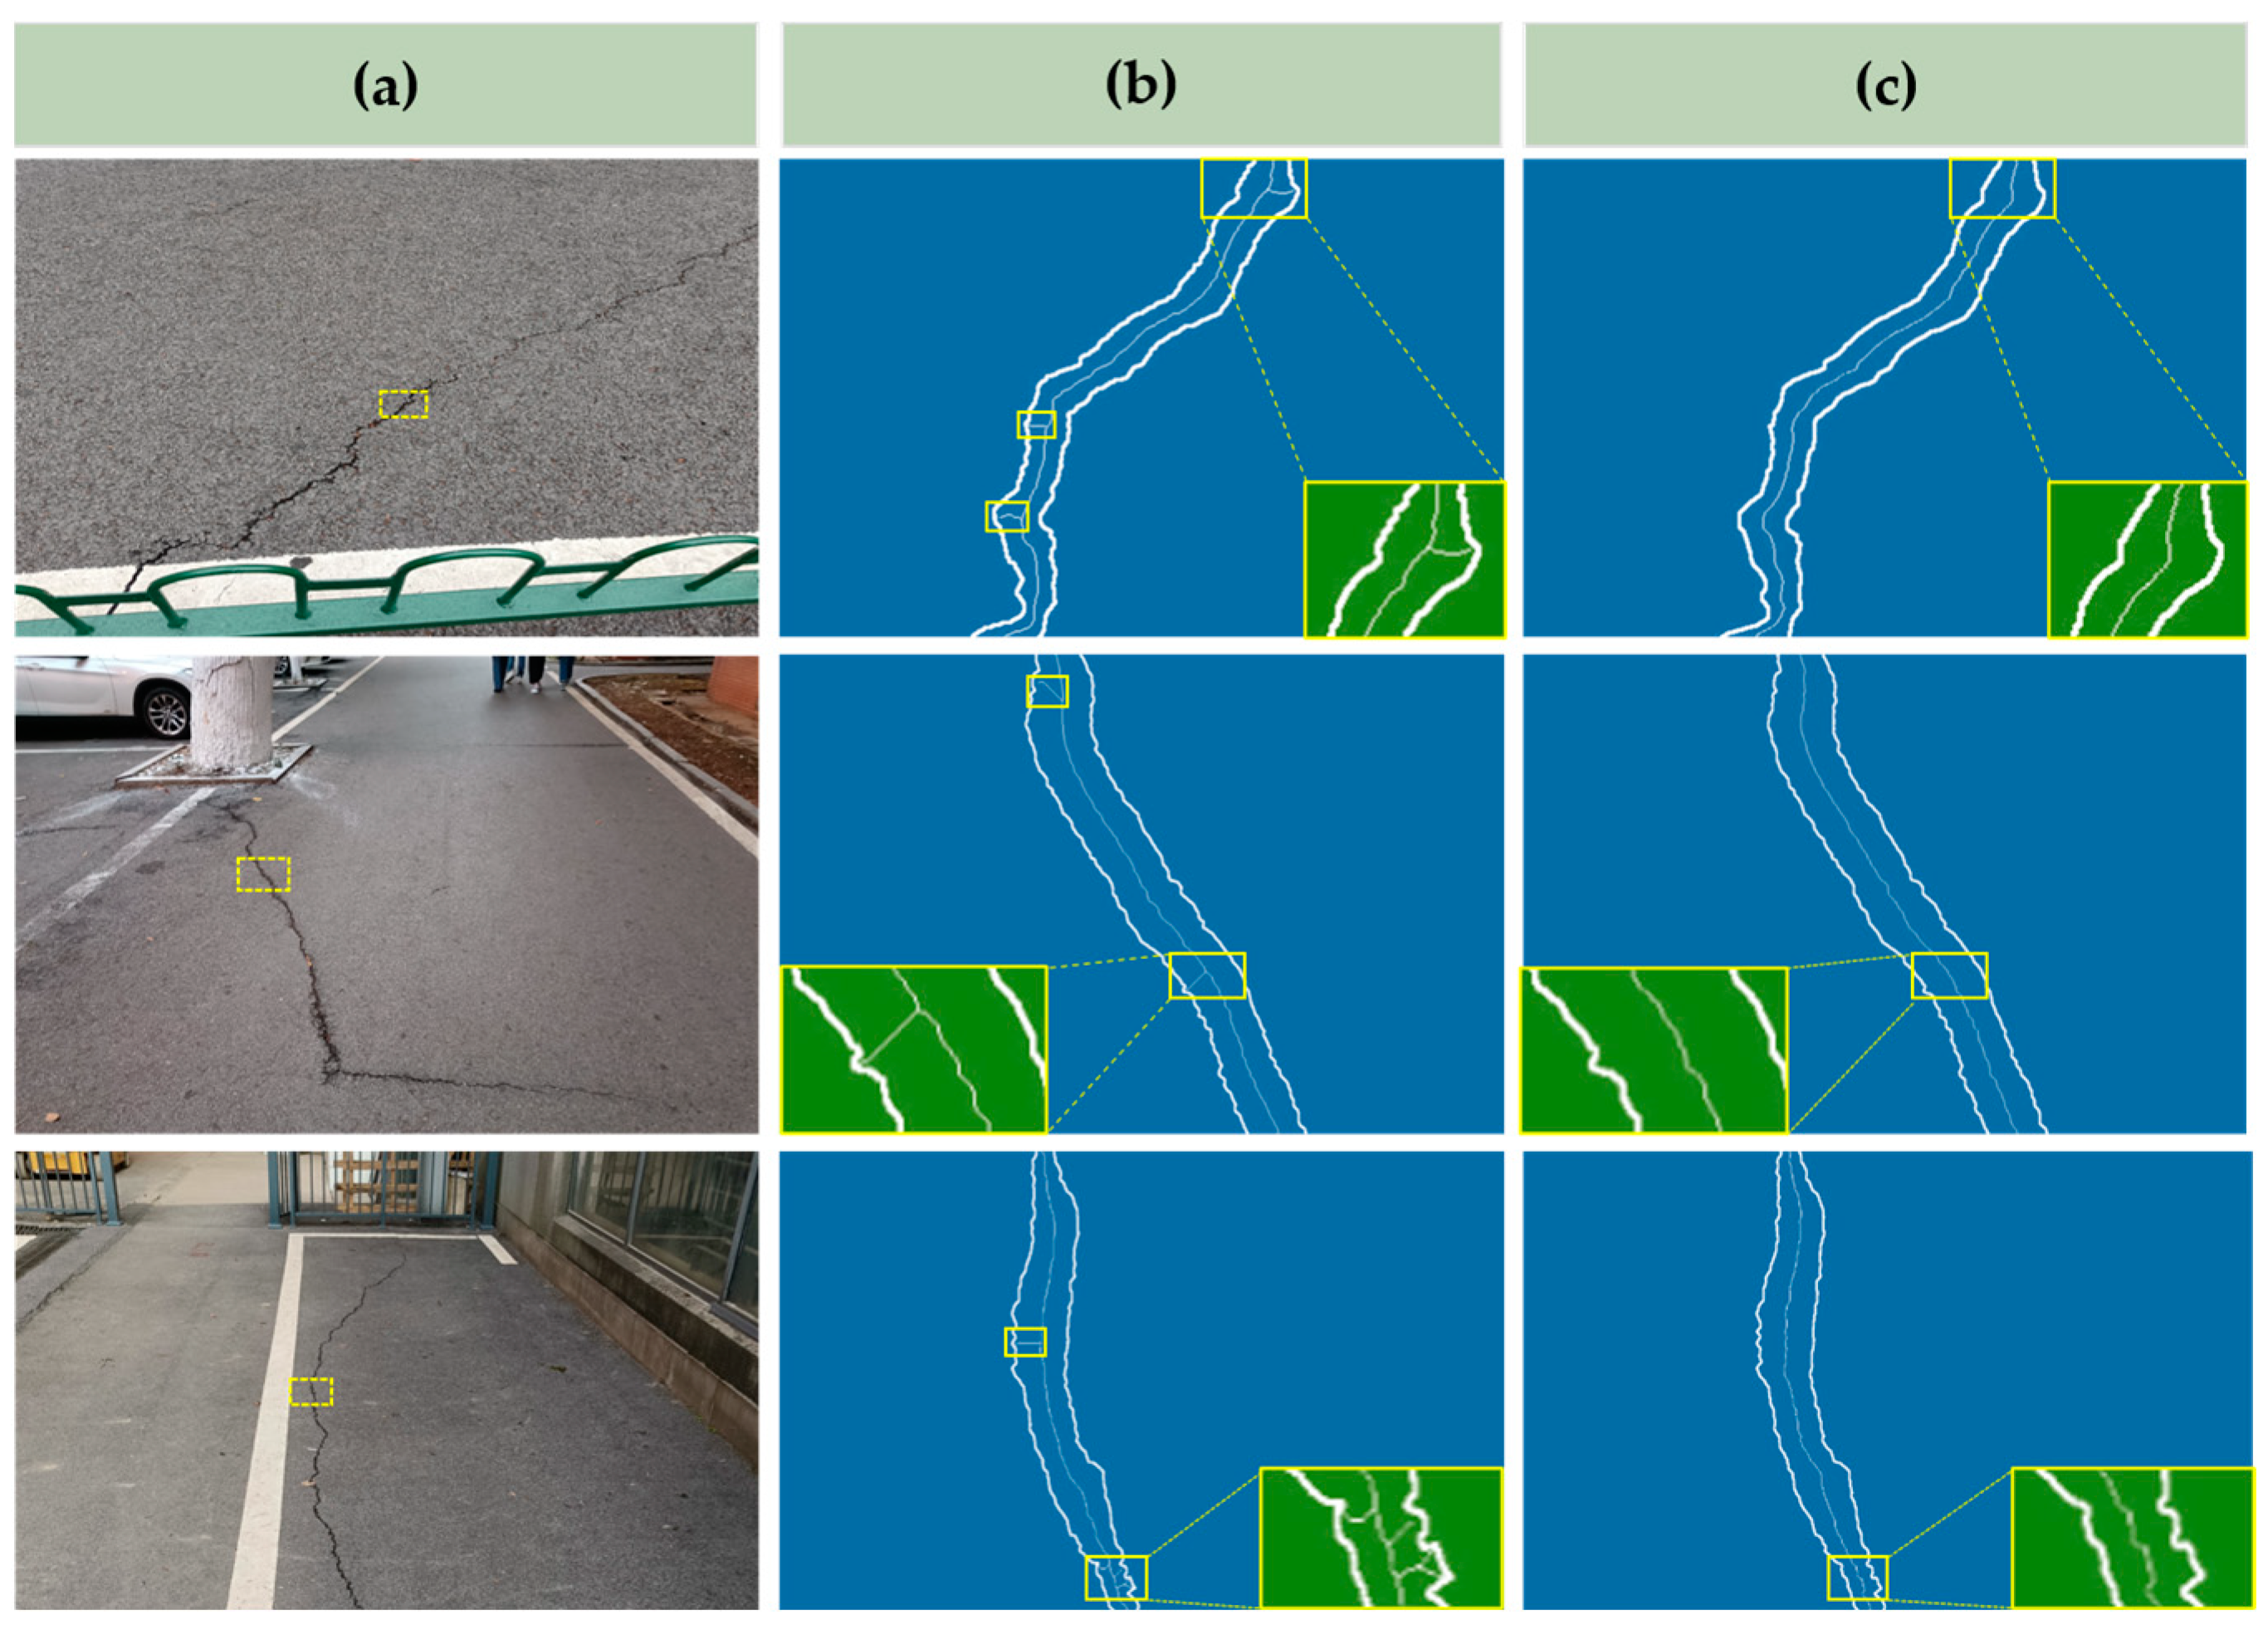
In this section, the segmented cracks are analyzed by the proposed quantification algorithm to determine their width and length in terms of pixels. To evaluate the effectiveness of the proposed algorithm in crack quantification, a self-made dataset containing the ground truth is constructed. This dataset contains 100 binary images, each of which has 130 × 130 pixels. In order to better fit the actual scene, different distances and angles between the camera head and the objects are also considered. The results of the proposed algorithm are demonstrated as binary graphs in Figure 14, where the black pixels represent the extracted crack edges, the green pixels represent the results of the thinning algorithm [46], and the orange pixels represent the results of this study. In addition, all the identification results of the proposed algorithm are compared with the ground truth, as shown in Table 4. The values in the table represent the minimum crack width, the maximum crack width, and the crack length. It is shown in Table 4 that the proposed algorithm has a very low error in terms of both width and length identification. Compared with the ground truth, the overall accuracy and total RMS error of the developed algorithm are 95% and 2.1 pixels for length and width, respectively, while the conventional thinning algorithm is only 92% accurate. This is due to the large error in the calculation of crack length by the conventional thinning method, as shown in Figure 15. It can be seen from Figure 15 that the method proposed in this study effectively avoids local branching and end loss when extracting the crack skeleton.

4.4. Limitations and Future Discussion

The proposed framework performs well in the identification, segmentation. and measurement of road cracks in complex environments. Depending on various requirements in practice, the proposed method can either perform the crack detection task alone, or directly detect cracks and segment them. It takes about 42 ms per 640 × 640 sized image for YOLOv5, while it takes only 0.64 s per 100 × 100 sized bounding box for the modified Res-UNet. However, the proposed framework indeed has some limitations as follows: (1) Although the cropped images provided by YOLOv5 have 91% accuracy, the remaining 9% may produce poor results in the modified Res-UNet; therefore, hyperparameter tuning of the network is required. (2) In terms of accuracy, a minimum width of cracks in the images should be guaranteed to be greater than two pixels when using the proposed framework; therefore pre-processing of the collected images is required. (3) Our current research is at the pixel level, and the distance mapping relationship between the real world and digital images is our next research focus.

5. Conclusions

To achieve an accurate assessment of road cracks under complex backgrounds, an integrated framework that combines crack detection, segmentation and quantification is proposed in the present study. Crack regions were first detected with YOLOv5, then fed into the modified Res-UNet model for crack segmentation, and finally the width and length of the cracks were extracted based on the proposed crack quantification algorithm. Based on the identification results, the following conclusions are obtained:
The proposed method can accurately detect cracks at pixel level and shows good robustness under the interference of darkness, shadows, and various noises;
The accuracy of Res-UNet for segmenting cracks is effectively improved by embedding an attention gate and proposing a new combined loss function, and the IoU of the segmented cracks is improved by 6.7%;
Compared with YOLACT++ and DeepLabv3+, the proposed method shows higher accuracy for crack segmentation under complex backgrounds with an mAP of 91% and an average IoU of 87%;
The developed crack quantification algorithm can effectively reduce local branching and crack end loss, and improve the accuracy of measuring the length of cracks by 3% compared with the traditional method.
In summary, the proposed integrated method makes contributions by boosting the efficiency of segmentation and quantification of road cracks when the background is full of other objects (e.g., vehicles, buildings, and plants). Compared with the cost of an inspection vehicle [60], the cost of the proposed method is much lower, about 4% of that of an inspection vehicle. However, there are some limitations to this study. First, there is a lot of room for accuracy improvement to achieve reliable crack inspection in real applications. Second, the tests were mainly conducted with cracks that were obvious and large-scale. In addition to complex backgrounds, future studies can explore cracks with more complex features.

Author Contributions

Conceptualization, L.D. and Y.L.; methodology, L.D. and Y.L.; validation, L.D. and A.Z.; formal analysis, L.D. and J.G.; investigation, Y.L. and A.Z.; writing—original draft preparation, A.Z. and J.G.; writing—review and editing, L.D. and Y.L.; visualization, A.Z.; supervision, Y.L. All authors have read and agreed to the published version of the manuscript.

Funding

This work is supported by the National Natural Science Foundation of China (No.52278177) and the Science and Technology Innovation Leader Project of Hunan Province, China (No. 2021RC4025).

Data Availability Statement

The data presented in this study are available from the corresponding author.

Acknowledgments

We would like to express our gratitude to the editor and reviewers for their valuable comments.

Conflicts of Interest

The authors declare no conflict of interest.

References

  1. National Bureau of Statistics. National Data. Available online: https://data.stats.gov.cn/ (accessed on 1 January 2022).
  2. The State Council. Policy Analyzing. Available online: http://www.gov.cn/zhengce/2022-05/11/content_5689580.htm (accessed on 11 May 2022).
  3. Ministry of Transport and Logistic Services. Road Maintenance. Available online: https://mot.gov.sa/en/Roads/Pages/RoadsMaintenance.aspx (accessed on 15 September 2022).
  4. Kee, S.-H.; Zhu, J. Using Piezoelectric Sensors for Ultrasonic Pulse Velocity Measurements in Concrete. Smart Mater. Struct. 2013, 22, 115016. [Google Scholar] [CrossRef]
  5. Zoidis, N.; Tatsis, E.; Vlachopoulos, C.; Gotzamanis, A.; Clausen, J.S.; Aggelis, D.G.; Matikas, T.E. Inspection, Evaluation and Repair Monitoring of Cracked Concrete Floor Using NDT Methods. Constr. Build. Mater. 2013, 48, 1302–1308. [Google Scholar] [CrossRef]
  6. Li, J.; Deng, J.; Xie, W. Damage Detection with Streamlined Structural Health Monitoring Data. Sensors 2015, 15, 8832–8851. [Google Scholar] [CrossRef] [PubMed] [Green Version]
  7. Dery, L.; Jelnov, A. Privacy–Accuracy Consideration in Devices that Collect Sensor-Based Information. Sensors 2021, 21, 4684. [Google Scholar] [CrossRef] [PubMed]
  8. Jiang, S.; Zhang, J.; Wang, W.; Wang, Y. Automatic Inspection of Bridge Bolts Using Unmanned Aerial Vision and Adaptive Scale Unification-Based Deep Learning. Remote Sens. 2023, 15, 328. [Google Scholar] [CrossRef]
  9. Fiorentini, N.; Maboudi, M.; Leandri, P.; Losa, M.; Gerke, M. Surface Motion Prediction and Mapping for Road Infrastructures Management by PS-Insar Measurements and Machine Learning Algorithms. Remote Sens. 2020, 12, 3976. [Google Scholar] [CrossRef]
  10. Zhu, Y.; Tang, H. Automatic Damage Detection and Diagnosis for Hydraulic Structures Using Drones and Artificial Intelligence Techniques. Remote Sens. 2023, 15, 615. [Google Scholar] [CrossRef]
  11. Chen, M.; Tang, Y.; Zou, X.; Huang, K.; Li, L.; He, Y. High-Accuracy Multi-Camera Reconstruction Enhanced by Adaptive Point Cloud Correction Algorithm. Opt. Lasers Eng. 2019, 122, 170–183. [Google Scholar] [CrossRef]
  12. Al Duhayyim, M.; Malibari, A.A.; Alharbi, A.; Afef, K.; Yafoz, A.; Alsini, R.; Alghushairy, O.; Mohsen, H. Road Damage Detection Using the Hunger Games Search with Elman Neural Network on High-Resolution Remote Sensing Images. Remote Sens. 2022, 14, 6222. [Google Scholar] [CrossRef]
  13. Lee, T.; Yoon, Y.; Chun, C.; Ryu, S. CNN-Based Road-Surface Crack Detection Model that Responds to Brightness Changes. Electronics 2021, 10, 1402. [Google Scholar] [CrossRef]
  14. Zhong, J.; Zhu, J.; Huyan, J.; Ma, T.; Zhang, W. Multi-Scale Feature Fusion Network for Pixel-Level Pavement Distress Detection. Autom. Constr. 2022, 141, 104436. [Google Scholar] [CrossRef]
  15. Hacıefendioğlu, K.; Başağa, H.B. Concrete Road Crack Detection Using Deep Learning-Based Faster R-Cnn Method. Iran. J. Sci. Technol. Trans. Civ. Eng. 2022, 46, 1621–1633. [Google Scholar] [CrossRef]
  16. Que, Y.; Dai, Y.; Ji, X.; Leung, A.K.; Chen, Z.; Tang, Y.; Jiang, Z. Automatic Classification of Asphalt Pavement Cracks Using A Novel Integrated Generative Adversarial Networks and Improved Vgg Model. Eng. Struct. 2023, 277, 115406. [Google Scholar] [CrossRef]
  17. Du, Y.; Pan, N.; Xu, Z.; Deng, F.; Shen, Y.; Kang, H. Pavement Distress Detection and Classification Based on YOLO Network. Int. J. Pavement Eng. 2021, 22, 1659–1672. [Google Scholar] [CrossRef]
  18. Li, C.; Li, L.; Jiang, H.; Weng, K.; Geng, Y.; Li, L.; Ke, Z.; Li, Q.; Cheng, M.; Nie, W.; et al. Yolov6: A Single-Stage Object Detection Framework for Industrial Applications. arXiv 2022, arXiv:2209.02976. [Google Scholar]
  19. Wang, C.Y.; Bochkovskiy, A.; Liao, H.Y.M. YOLOv7: Trainable Bag-of-Freebies Sets New State-of-the-Art for Real-Time Object Detectors. arXiv 2022, arXiv:2207.02696. [Google Scholar]
  20. Ultralytics. Yolov8. Available online: https://github.com/ultralytics/ultralytics (accessed on 12 January 2023).
  21. Liu, C.; Sui, H.; Wang, J.; Ni, Z.; Ge, L. Real-Time Ground-Level Building Damage Detection Based on Lightweight and Accurate Yolov5 Using Terrestrial Images. Remote Sens. 2022, 14, 2763. [Google Scholar] [CrossRef]
  22. Shokri, P.; Shahbazi, M.; Nielsen, J. Semantic Segmentation and 3d Reconstruction of Concrete Cracks. Remote Sens. 2022, 14, 5793. [Google Scholar] [CrossRef]
  23. An, Q.; Chen, X.; Wang, H.; Yang, H.; Yang, Y.; Huang, W.; Wang, L. Segmentation of Concrete Cracks by Using Fractal Dimension and Uhk-Net. Fractal Fract. 2022, 6, 95. [Google Scholar] [CrossRef]
  24. Zhang, Y.; Fan, J.; Zhang, M.; Shi, Z.; Liu, R.; Guo, B. A Recurrent Adaptive Network: Balanced Learning for Road Crack Segmentation with High-Resolution Images. Remote Sens. 2022, 14, 3275. [Google Scholar] [CrossRef]
  25. Yong, P.; Wang, N. RIIAnet: A Real-Time Segmentation Network Integrated with Multi-Type Features of Different Depths for Pavement Cracks. Appl. Sci. 2022, 12, 7066. [Google Scholar] [CrossRef]
  26. Sun, X.; Xie, Y.; Jiang, L.; Cao, Y.; Liu, B. DMA-Net: Deeplab with Multi-Scale Attention for Pavement Crack Segmentation. IEEE Trans. Intell. Transp. Syst. 2022, 23, 18392–18403. [Google Scholar] [CrossRef]
  27. Shen, Y.; Yu, Z.; Li, C.; Zhao, C.; Sun, Z. Automated Detection for Concrete Surface Cracks Based on Deeplabv3+ BDF. Buildings 2023, 13, 118. [Google Scholar] [CrossRef]
  28. Ji, A.; Xue, X.; Wang, Y.; Luo, X.; Xue, W. An Integrated Approach to Automatic Pixel-Level Crack Detection and Quantification of Asphalt Pavement. Autom. Constr. 2020, 114, 103176. [Google Scholar] [CrossRef]
  29. Zhang, Z.; Liu, Q.; Wang, Y. Road Extraction by Deep Residual U-Net. IEEE Geosci. Sens. Lett. 2018, 15, 749–753. [Google Scholar] [CrossRef] [Green Version]
  30. Zhu, Z.; German, S.; Brilakis, I. Visual Retrieval of Concrete Crack Properties for Automated Post-Earthquake Structural Safety Evaluation. Autom. Constr. 2011, 20, 874–883. [Google Scholar] [CrossRef]
  31. Kang, D.; Benipal, S.S.; Gopal, D.L.; Cha, Y.-J. Hybrid Pixel-Level Concrete Crack Segmentation and Quantification Across Complex Backgrounds Using Deep Learning. Autom. Constr. 2020, 118, 103291. [Google Scholar] [CrossRef]
  32. Tang, Y.; Huang, Z.; Chen, Z.; Chen, M.; Zhou, H.; Zhang, H.; Sun, J. Novel Visual Crack Width Measurement Based on Backbone Double-Scale Features for Improved Detection Automation. Eng. Struct. 2023, 274, 115158. [Google Scholar] [CrossRef]
  33. Zhang, T.Y.; Suen, C.Y. A Fast Parallel Algorithm for Thinning Digital Patterns. Commun. ACM 1984, 27, 236–239. [Google Scholar] [CrossRef]
  34. Guizilini, V.; Li, J.; Ambruș, R.; Gaidon, A. Geometric Unsupervised Domain Adaptation for Semantic Segmentation. In Proceedings of the IEEE/CVF International Conference on Computer Vision, Montreal, BC, Canada, 11–17 October 2021; pp. 8537–8547. [Google Scholar]
  35. Toldo, M.; Michieli, U.; Zanuttigh, P. Unsupervised Domain Adaptation in Semantic Segmentation via Orthogonal and Clustered Embeddings. In Proceedings of the IEEE/CVF Winter Conference on Applications of Computer Vision, Waikola, HI, USA, 3–7 January 2021; pp. 1358–1368. [Google Scholar]
  36. Stan, S.; Rostami, M. Unsupervised Model Adaptation for Continual Semantic Segmentation. In Proceedings of the AAAI Conference on Artificial Intelligence, online, 2–9 February 2021; pp. 2593–2601. [Google Scholar]
  37. Marsden, R.A.; Wiewel, F.; Döbler, M.; Yang, Y.; Yang, B. Continual Unsupervised Domain Adaptation for Semantic Segmentation Using A Class-Specific Transfer. In Proceedings of the 2022 International Joint Conference on Neural Networks (IJCNN), Padua, Italy, 18–23 July 2022; pp. 1–8. [Google Scholar]
  38. Zhu, J.; Zhong, J.; Ma, T.; Huang, X.; Zhang, W.; Zhou, Y. Pavement Distress Detection Using Convolutional Neural Networks with Images Captured via UAV. Autom. Constr. 2022, 133, 103991. [Google Scholar] [CrossRef]
  39. Ruiqiang, X. YOLOv5s-GTB: Light-Weighted and Improved Yolov5s for Bridge Crack Detection. arXiv 2022, arXiv:2206.01498. [Google Scholar]
  40. Jing, Y.; Ren, Y.; Liu, Y.; Wang, D.; Yu, L. Automatic Extraction of Damaged Houses by Earthquake Based on Improved YOLOv5: A case study in Yangbi. Remote Sens. 2022, 14, 382. [Google Scholar] [CrossRef]
  41. Ultralytics. Yolov5. Available online: https://github.com/ultralytics/yolov5 (accessed on 17 January 2022).
  42. Lin, T.Y.; Dollár, P.; Girshick, R.; He, K.; Hariharan, B.; Belongie, S. Feature Pyramid Networks for Object Detection. In Proceedings of the IEEE Conference on Computer Vision and Pattern Recognition, Honolulu, HI, USA, 21–26 July 2017; Volume 1, pp. 2117–2125. [Google Scholar]
  43. Li, H.; Xiong, P.; An, J.; Wang, L. Pyramid Attention Network for Semantic Segmentation. arXiv 2018, arXiv:1805.10180. [Google Scholar]
  44. Oktay, O.; Schlemper, J.; Folgoc, L.L.; Lee, M.; Heinrich, M.; Misawa, K.; Mori, K.; McDonagh, S.; Hammerla, N.Y.; Kainz, B. Attention U-Net: Learning Where to Look for the Pancreas. arXiv 2018, arXiv:1804.03999 2018. [Google Scholar]
  45. Hou, H.; Lan, C.; Xu, Q.; Lv, L.; Xiong, X.; Yao, F.; Wang, L. Attention-Based Matching Approach for Heterogeneous Remote Sensing Images. Remote Sens. 2023, 15, 163. [Google Scholar] [CrossRef]
  46. Lee, T.C.; Kashyap, R.L.; Chu, C.N. Building Skeleton Models via 3-D Medial Surface Axis Thinning Algorithms. Graph. Models Image Process. 1994, 56, 462–478. [Google Scholar] [CrossRef]
  47. Home—OpenCV. Available online: https://opencv.org (accessed on 1 November 2021).
  48. Pytorch. Available online: https://pytorch.org/ (accessed on 15 June 2021).
  49. Arya, D.; Maeda, H.; Ghosh, S.K.; Toshniwal, D.; Sekimoto, Y. RDD2020: An Annotated Image Dataset for Automatic Road Damage Detection Using Deep Learning. Data Brief 2021, 36, 107133. [Google Scholar] [CrossRef] [PubMed]
  50. Road-Crack-Images-Test. Available online: https://www.kaggle.com/datasets/andada/road-crack-imagestest (accessed on 25 January 2023).
  51. Eisenbach, M.; Stricker, R.; Seichter, D.; Amende, K.; Debes, K.; Sesselmann, M.; Ebersbach, D.; Stoeckert, U.; Gross, H.-M. How to Get Pavement Distress Detection Ready for Deep Learning? A Systematic Approach. In Proceedings of the 2017 International Joint Conference on Neural Networks (IJCNN), Anchorage, AK, USA, 14–19 May 2017; pp. 2039–2047. [Google Scholar] [CrossRef]
  52. Shi, Y.; Cui, L.; Qi, Z.; Meng, F.; Chen, Z. Automatic Road Crack Detection Using Random Structured Forests. IEEE Trans. Intell. Transp. Syst. 2016, 17, 3434–3445. [Google Scholar] [CrossRef]
  53. Zou, Q.; Cao, Y.; Li, Q.; Mao, Q.; Wang, S. Cracktree: Automatic Crack Detection from Pavement Images. Pattern Recognit. Lett. 2012, 33, 227–238. [Google Scholar] [CrossRef]
  54. Feiyu. Vimble 3. Available online: https://www.feiyu-tech.cn/vimble-3/ (accessed on 23 March 2022).
  55. Bolya, D.; Zhou, C.; Xiao, F.; Lee, Y.J. YOLACT++: Better Real-Time Instance Segmentation. IEEE Trans. Pattern Anal. Mach. Intell. 2022, 44, 1108–1121. [Google Scholar] [CrossRef] [PubMed]
  56. Chen, L.C.; Zhu, Y.; Papandreou, G. Encoder-Decoder with Atrous Separable Convolution for Semantic Image Segmentation. In Proceedings of the European Conference on Computer Vision, Munich, Germany, 8–14 September 2018; pp. 801–818. [Google Scholar]
  57. Ronneberger, O.; Fischer, P.; Brox, T. U-Net: Convolutional Networks for Biomedical Image Segmentation. In Medical Image Computing and Computer-Assisted Intervention—MICCAI 2015; Springer: Cham, Switzerland, 2015; pp. 234–241. [Google Scholar]
  58. Zhang, L.; Shen, J.; Zhu, B. A Research on An Improved Unet-Based Concrete Crack Detection Algorithm. Struct. Health Monit. 2021, 20, 1864–1879. [Google Scholar] [CrossRef]
  59. Liu, F.; Wang, L. Unet-Based Model for Crack Detection Integrating Visual Explanations. Constr. Build. Mater. 2022, 322, 126265. [Google Scholar] [CrossRef]
  60. Radopoulou, S.C.; Brilakis, I. Automated Detection of Multiple Pavement Defects. J. Comput. Civ. Eng. 2017, 31, 04016057. [Google Scholar] [CrossRef] [Green Version]
Figure 1. Flowchart of the proposed architecture for detecting and quantifying road cracks.
Remotesensing 15 01530 g001
Figure 2. Schematic representation of YOLOv5 architecture.
Remotesensing 15 01530 g002
Figure 3. Architecture of the modified Res-UNet.
Remotesensing 15 01530 g003
Figure 4. Illustration of the attention gate.
Remotesensing 15 01530 g004
Figure 5. Traditional DTM approach.
Remotesensing 15 01530 g005
Figure 6. Schematic diagram of crack skeleton extraction: (a) traditional approach has local branches and crack end loss in thinning; (b) schematic diagram of the proposed method; (c) thinning results of the proposed method.
Remotesensing 15 01530 g006
Figure 7. Flowchart of the proposed crack skeleton extraction algorithm.
Remotesensing 15 01530 g007
Figure 8. Steps of the proposed crack skeleton extraction, quantification algorithm: (a) obtain positive and negative contours; (b) extract center point; (c) skeleton extraction results.
Remotesensing 15 01530 g008
Figure 9. Results of identifying and segmenting cracks based on the publicly available dataset images: (a) identifying cracks; and (b) segmenting cracks.
Remotesensing 15 01530 g009
Figure 10. Devices for image collection and network training: (a) Handheld Gimbal: Feiyu Vimble 3; and (b) Deep learning server: Super Cloud R8428 G11.
Remotesensing 15 01530 g010
Figure 11. Outcomes of YOLOv5-based road crack detection: (a) Road crack I; (b) Road crack II: shadow; (c) Road crack III: dark light; and (d) Road crack IV: lane line.
Remotesensing 15 01530 g011
Figure 12. Comparisons of the original and modified Res-UNet to segment cracks from the original images.
Remotesensing 15 01530 g012
Figure 13. Comparisons of the proposed approach, YOLACT++, and DeepLabv3+ for segmenting cracks from images with complex backgrounds.
Remotesensing 15 01530 g013
Figure 14. Crack quantification results of the proposed algorithm: (ah) represents different crack instances.
Remotesensing 15 01530 g014
Figure 15. Comparison between the traditional thinning method and the proposed algorithm in this study when extracting the crack skeleton: (a) Road images; (b) Traditional thinning results; and (c) Our thinning results.
Remotesensing 15 01530 g015
Table 1. Image dataset for crack detection and segmentation.
TrainingValidationTest
(a) YOLOv5
Number of images2200240120
Resolution1280 × 12801280 × 12801920 × 1080, 4032 × 3024
(b) Modified Res-UNet
Number of images3800360120
Resolution448 × 448448 × 448307 × 706, 908 × 129 et al.
Table 2. The results of different UNet-base models on the test dataset.
ModelThresholdIoU (%)PA (%)DICE (%)
UNet0.578.6390.4185.28
Res-UNet80.3092.0687.08
CrackUNet1583.8994.6389.21
CrackUNet1984.7895.8690.49
UNet-VGG1984.5395.4190.26
UNet-InceptionResNetv283.9894.7289.54
UNet-EfficientNetb384.3695.1690.01
Modified Res-UNet87.0098.4793.14
Table 3. The information of the three methods and the comparison of the evaluation metrics.
YOLACT++DeepLabv3+Proposed Approach
Training dataPublicPublicPublic
Label typePixel maskPixel maskBounding box + Pixel mask
Testing dataself-collectedself-collectedself-collected
Test data120120120
PA (%)63.2472.3298.47
DICE (%)57.2164.4993.14
Average IoU (%)48.0257.1487.00
Table 4. Comparison of ground truth and the results of the proposed algorithm.
InstanceGround TruthPredicted ResultError
Crack-1(3, 7, 152) *(2, 7, 150)(1, 0, 2)
Crack-2(4, 11, 224)(4, 11, 223)(0, 0, 1)
Crack-3(3, 17, 267)(2, 18, 264)(1, 1, 3)
Crack-4(4, 26, 110)(4, 24, 105)(0, 2, 5)
Crack-5(2, 20, 145)(2, 19, 143)(0, 1, 2)
Crack-6(2, 11, 201)(2, 10, 197)(0, 1, 4)
Crack-7(3, 134)(3, 131)(0, 3)
Crack-8(8, 17, 297)(7, 19, 296)(1, 2, 1)
Crack-9(14, 21, 129)(16, 19, 126)(2, 2, 3)
Crack-10(9, 33, 276)(9, 31, 274)(0, 2, 2)
Crack-11(7, 8, 277)(5, 8, 275)(2, 0, 2)
Crack-12(4, 13, 56)(3, 12, 57)(1, 1, 1)
Crack-13(3, 9, 298)(3, 8, 297)(0, 1, 1)
Crack-14(9, 17, 335)(7, 15, 332)(2, 2, 3)
Crack-15(4, 7, 227)(4, 8, 223)(0, 1, 4)
Crack-16(8, 3, 124)(8, 3, 122)(0, 0, 2)
Crack-17(4, 7, 378)(4, 8, 374)(0, 1, 4)
Crack-18(12, 9, 194)(13, 9, 195)(1, 0, 1)
Crack-19(5, 6, 325)(5, 7, 321)(0, 1, 4)
Crack-20(3, 4, 102)(3, 5, 100)(0, 1, 2)
* The values in the table represent the minimum crack width, the maximum crack width, and the crack length.
Disclaimer/Publisher’s Note: The statements, opinions and data contained in all publications are solely those of the individual author(s) and contributor(s) and not of MDPI and/or the editor(s). MDPI and/or the editor(s) disclaim responsibility for any injury to people or property resulting from any ideas, methods, instructions or products referred to in the content.