Abstract
The combination of the current sea level rise (SLR) and an increase in the frequency and severity of sea storm events and surges, will have important environmental impacts on coastal tourist areas located in oceanic islands that are often heavily dependent economically on tourism. Importantly, coastal tourist resorts and their associated beaches are commonly located in the S-SW of these islands where they are protected from the effects of the NE trade winds but exposed to these storms. This study analyses the current and future conditions of SW sea storm events. Then, through mapping using orthophotos, LiDAR data, and bathymetry with high spatial resolution, it studies the environmental effects that these events are having now and will have in the future on tourist zones of oceanic islands. This is of particular importance, as in the case of the Macaronesia islands, SW sea storm events are occurring with ever greater frequency. The case study considers the SW sector of the island of Gran Canaria (Canary Islands, Spain). Regarding the analysis of SW storms, the results obtained show an increase in the frequency of events, especially since the 1990s, with 104 events detected (67.5% between 1958 and 2018). The most affected areas during these storms are usually beaches (severe erosive processes). Breakwaters and seafronts usually resist the impact of waves well, however, as is discussed that in the future scenario, their implementation will mean a high economic cost for local administrations.
1. Introduction
Tsunamis and sea storm events around the world have highlighted the vulnerability of many coastal populations, including those serving tourists (e.g., the 26 December 2004 tsunami around the Indian Ocean). In Kellman et al. (2008), four main themes were considered with relevance to disaster risk reduction: information and awareness, warning systems, personal preparation, and local livelihoods [1]. The authors suggested three important areas for further investigation: the connections between sustainable tourism and disaster vulnerability, the role of tourists in disasters, and disaster risk reduction education.
As well as the potential impact of sea storm events, the vulnerability of coastal areas increases when other stress-inducing factors come into play, including, for example, the rise in human population, urbanisation processes, the sea level rise (SLR), and what has been termed ‘coastal rigidity’ [2,3]. These stress-inducing factors produce the phenomenon known as coastal squeeze [4], defined as “one form of coastal habitat loss, where intertidal habitat is lost due to the highwater mark being fixed by a defence or structure (i.e., the high water mark residing against a hard structure such as a sea wall) and the low water mark migrating landwards in response to SLR” [5]. This process is aggravated “in areas where land claim or coastal defence has created a static, artificial margin between land and sea, or where the land rises relative to the coastal plain, and habitats become squeezed into a narrowing zone” between the ocean (with a rising level) and an inland obstruction [4].
Coastal scientists are currently predicting a higher incidence of storm surges and a general SLR [6,7,8] based on the available climate data record. These data also reveal an effect known as coastal narrowing, which has been defined as “decreases in coastal zone width”, with one example being “saltmarsh erosion caused by increases in the wind/wave climate or the migration of intertidal channels” [5]. Coastal narrowing, however, is not related to SLR.
The importance of coastal areas for the tourism industry (the largest industry in the world according to the World Tourism Organisation (2001) [9] is clear, as indeed is the importance of the industry for coastal areas. The need to protect coastal resources in view of the anticipated SLR is fundamental for the economy of many countries whose main source of income is tourism [10]. This can present certain dilemmas at various spatial scales for the coastal areas themselves [11,12,13], and especially island coastal areas [14,15,16]. Coastal managers need to adopt tactics that function in a complementary way to natural processes rather than simply implementing hard engineering solutions [11].
About three-quarters of small countries are islands of fewer than one million inhabitants, and small island regions tend to suffer from economic limitations. At the same time, these regions commonly specialise in tourism due to the availability of accessible natural resources such as beaches, landscapes, and sunny weather. In many cases, this type of region presents a comparative advantage for tourism, and therefore its economy is often strongly dependent on this industry [15].
An evaluation of risks due to sea storm events on the coast requires knowledge about and an understanding of their behaviour, evolution, and consequences (topics that will be considered in this work). In this way, it is also possible to analyse the specific risk for the population and their reaction capacity to adapt and, at the very least, reduce their effects, especially when it comes to small, highly exposed spaces with tourism-based economies [16,17]. For this, the most commonly applied method in the study of risk at a local scale, which aims to explore both the risk and its relationship with exposure and vulnerability, and on this basis estimate the possible economic and other costs [18].
A rise in the mean sea level is considered one of the main effects of climate change. Its impact on coastal areas includes the danger of coastal floods, alterations to erosion rates, and changes and/or losses of coastal ecosystems, among many others. Impacts are also expected on, for example, land use, coastal population settlements, and ecosystem services [19]. The consequences of an SLR in a specific coastal territory can be evaluated by determining the flooding sea level in wave- and swell-exposed areas, and the mapping of these floods is essential for land use planning, supporting engineering decisions regarding flood control measures and the coordination of emergency responses [20]. The anticipated SLR used for the purposes of the present work is taken from the Fifth Assessment Report of the Intergovernmental Panel on Climate Change (IPCC) which, on the basis of the Representative Concentration Pathway 8.5 (RCP 8.5), estimated a mean SLR of 0.74 m (within a possible range of 0.53 to 0.98 m) for the time horizon of 2100 [21].
According to different groups of experts, in Spain, the coasts of the Canary Islands and Galicia will be the most affected by processes linked to climate change [22]. Ocean-related climate changes are especially worrying for the Canary coasts in general, and the Canary beach-dune systems in particular. On the basis of a sea level rise of 0.35 m in the area surrounding the islands, a coastline retreat of between 15 m and 35 m has been predicted, although, due to changes in wave direction, this value could be as high as 70 m in southern coastal stretches [22,23].
The analysis carried out by Yánes-Luque (2021) [24] highlights the high degree of exposure of the coastal tourist areas of the SW Canary Islands, especially Tenerife and S-SW Gran Canaria, to the impacts of waves, due to their coastline having experienced incessant urban growth, which favours the disturbance of these enclaves by destructive physical processes (e.g., marine storms). The marine storms recorded in the study area occur with defined atmospheric patterns, with up to 298 sea storms detected. These storms are the result of fluctuations in the pressure gradient between the Icelandic depression cores and the Azores anticyclone, especially during the winter. According to our research, which assessed the effects of these storm events based on reports in the local press, sea storms ultimately result in drownings, damage to street furniture and harbour infrastructure, and loss of sand on beaches.
Gran Canaria is the second-largest island in the Canary archipelago (1560 km2). As a result of its location in the Atlantic Ocean and an urbanisation process that has been ongoing over the last few decades (since the 1960s), the coastal tourist resorts of the S-SW of the island have a high degree of exposure to the impacts of waves [24]. Tourism is the mainstay of the Canarian economy, responsible for more than 40% of employment in the archipelago and over 35% of GDP [25,26]. In this area of the island, the density of buildings parallel to the shore is high, further facilitating potential damage through destructive processes such as sea storm events [24].
The study presented in this work is structured following the approach of Pontee (2013) [5], considering and analysing coastal narrowing and coastal squeeze as separate concepts and processes. In this context, the study also has the following specific aims: (i) to analyse sea storm events in the S-SW of Gran Canaria (normally from a SW direction) since 1958 to 2018; (ii) to spatially quantify through mapping the impact of sea storm events under present climate conditions on the coastal narrowing zone and to predict, on the basis of the RCP 8.5 climate change scenario, their impact on the coastal squeeze zone, in both cases on the basis of maps using flooding sea levels obtained from bidimensional numerical models; and (iii) to spatially analyse an approximation of the effects on the study area, both at the present time and in the context of the mean SLR according to RCP 8.5. Furthermore, this work fulfils one of the main tasks to be carried out by the Member States of the European Union in Directive (2007/60/EC) [25], adopted at the end of 2007, where it is proposed that in order to comply with this Directive, the flood hazards and risks in the territory of member states must be mapped.
2. Study Area
The Canary Islands are a typical example of a “sun, sand and sea” tourism destination. The large number of visitors to the islands has resulted in the tourist industry playing a vital role in the economic development of the archipelago. Tourism accounts for between 50% and 80% of its GDP (according to various authors) [26] and it was the second most-visited Spanish regional tourist destination between 2016 and 2019, representing 17.6% of all tourism in Spain [27]. Around 28% of the visitors to the archipelago come to Gran Canaria (the island where the object of the case study presented in this paper is situated), a percentage only surpassed by the island of Tenerife. More specifically, the municipality of Mogán, the focus of this research), represents more than 6% of the tourism in the archipelago, and more than 23% of the tourist visitors to Gran Canaria. It is surpassed only by the municipality of San Bartolomé de Tirajana (south of Gran Canaria), where the tourist activity that began in the 1960s is mainly associated with the natural resources of the beaches and dunes of Maspalomas [28] (Figure 1).
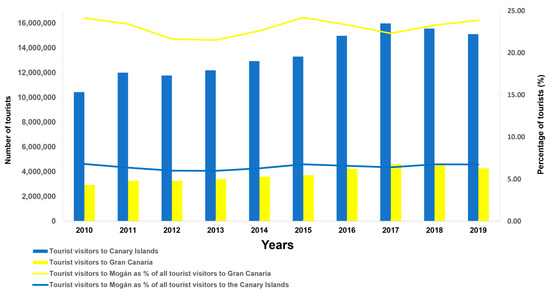
Figure 1.
Tourist visits to the Canary Islands, Gran Canaria, and Mogán over a 10-year period (2010–2019).
As a result of the emergence and rapid rise of the tourist industry, urban expansion in Gran Canaria has taken place at a fast pace [24], with a more or less constant rate of construction since the 1960s–1970s [29]. The urbanisation process progressed spatially from the southeast and south (the case of San Bartolomé de Tirajana as explained above) to the northwest and inland from the coast [24]. The area considered in the present study is situated in the southwest of the island and is relatively sheltered from the most important winds that affect the island, the so-called trade winds (known locally as Alisios) which reach the islands through the Azores anticyclone with a predominantly N-NE direction. This protection from these winds is due to mountainous regions of the island blocking their path. The area is additionally protected against the effects of polar front disturbances [30]. These conditions of climatic comfort are an important tourist attraction [31] and have led to considerable urban-tourist development in this area. This pattern is commonly observed on islands in the Atlantic Ocean where the main tourist resorts are located in the shadow that the island itself produces towards the south, southwest, and west in other Macaronesia Islands, including São Miguel, Terceira, São Jorge, Faial and Flores in the Azores archipelago, Madeira, Porto Santo, the islands of Maio, Santiago, Fogo, Boa Vista and Sal (Cape Verde), and other Canary Islands such as Tenerife, La Gomera, Lanzarote, and Fuerteventura.
In Gran Canaria, the area between the beaches of La Carrera and Amadores (13.63 km of coastline) (Figure 2) is characterised by small embedded beaches with short coastal drift and located around the mouths of dry ravines, therefore, with scarce or practically nonexistent sediment supplies. This coastal stretch with seven beaches and five ports is highly vulnerable when storms from the southwest occur, which are especially frequent in winter [24]. The sea storm events recorded in the study area originate in an area with clearly defined atmospheric patterns which are the result of fluctuations in the pressure gradient between the Icelandic depressive nuclei and the Azores anticyclone, particularly during winter. The greater or lesser intensification of this gradient in the North Atlantic translates into a variable coastal impact as the result of increases in swell energy. This does so to the point that the maximum significant wave height (Hs) can be 4 or 5 times higher than its usual value [24]. The same behaviour has also been observed in the different Macaronesian archipelagos, including the Azores [32] and Cape Verde [33], as well as in Madeira [34].
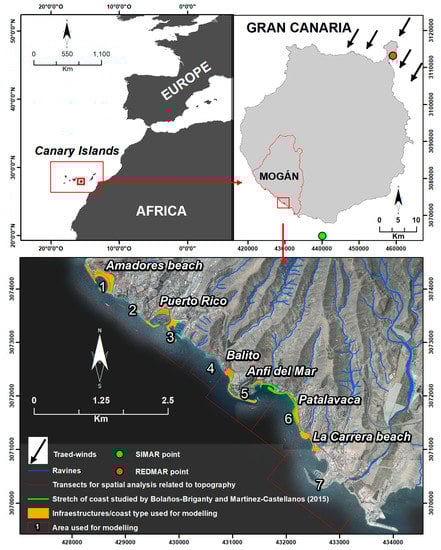
Figure 2.
Study area and infrastructure/coastal type used for modelling in the present research study (see legend in the figure; left, down).
3. Materials and Methods
3.1. SW Storms in the Study Area. Estimation of Storm Frequency
A number of sources were used to obtain the data for the analysis of sea storm events in the study area: (i) wind and wave data from the SIMAR-44 wave generation and propagation mathematical models (Spanish State Ports Oceanographic Database). Of these, the “4035005” for the S-SW of Gran Canaria (27.67°N; 15.58°W) was selected (Figure 2). The data provided include 24 daily registers of Hs (m), peak period (Tp, s), wind direction (degrees), and wind direction and speed (degrees; m/s). On the basis of the first two parameters, the maximum wave height (Hmax, m) and wave length (L, m) can be calculated. Using these data, it is possible to define the usual wave regime and extreme events. The criterion for the extreme events identification is based on the application of the cutoff threshold corresponding to the P99 of the mean daily height of the Hs (1.7 m calculated for Mogán). Therefore, a marine storm event is considered to have occurred when the established cutoff wave height threshold is equalled or exceeded for twelve consecutive hours. In addition, the Peak Over Threshold method (Puertos del Estado, Spain) of extreme values is applied, whereby storms are considered to be independent if five days elapse between them; (ii) atmospheric conditions data on the basis of Wetterzentrale and AeMET (the Spanish State Meteorological Agency) weather reports. These were used to determine the synoptic situation that concurs in the origin and evolution of the storms; (iii) newspaper articles which, given their role as a mass media communicator, tend to rapidly report on natural disasters [35,36,37]. Information on the evolution of the sea storm events, the areas affected by them, and the extent of any damage caused were obtained from the following regional newspapers: Diario de Avisos, El Día, Diario de Las Palmas, La Provincia, and Canarias 7. References to damage reported in previous studies were also included [38].
3.2. Flood Level Modelling Data
To determine the coastal flood sea level, the swell from deep waters was simulated with the aid of bidimensional numerical models. The flood sea level is the sum of the tidal level (meteorological and astronomical) and the runup, whose value—in the case of projection for beaches—depends on the significant wave height at the shoreline, the incident wave peak period, and the slope of the beach [39]. To determine the breakwater overflow level, the wave height at the foot of the structure has to be determined. The criterion used to extract the wave height at the foot of the structure is its depth calculated using the equation Hs12×1.57 [40]. For the purposes of the present study, the Coastal Modelling System was used together with the MOPLA tool, which is a Spanish-developed beach wave propagation, current, and morphodynamic evolution model [41]. The spectral wave propagation was performed in this tool using the OLUCA-SP module [42,43].
Propagation from deep waters requires a statistical characterisation of the swell in order to select the sea state, defined by a wave height and peak period, with respect to which it is intended to establish the flood sea level. The selected sea state for the study area in question is that with a SW component, an Hs99% of 3.84 m, and Tp99% of 8.80 s. The Hs12 value for this directional component is 4.22 m. The study area is sheltered from the N and NNE winds and swells, which are the most common type on the island, and is primarily affected, in terms of storm floods and damage, by SW or WSW swells. On the basis of the wave characterisation described above, wave propagation was studied in various sea conditions: for the present-day scenario, half-tide and high tide values of 0 and 1.53 m, respectively, were used and, in order to evaluate the effects under an RCP 8.5 scenario change, a half-tide value of 0.74 m and a high tide value of 2.27 m were used. These ranges were taken on the basis of the Las Palmas 2 tide gauge data series (the closest tide gauge to the study area) and with a data series dating back to 1992. The Las Palmas 2 tide gauge is located in Las Palmas Port (28.14°N; 15.40°W, Figure 2) and forms part of the Spanish State Ports Tide Gauge Network [44].
The Coastal Modelling System employed requires the bathymetric and topographic data of the terrain over which the swell is propagated. A continuous digital land-sea model (topography and bathymetry) (Table 1, D L-S M) designed by SDI Canarias-Grafcan S.A (Canary Islands Government) was used. This model has joined a corrected digital terrain model (DTM) from a LiDAR flight (2015; RMSE ≤ 0.50 m) and the corrected bathymetry from the eco-cartography of the Canary Islands carried out with an echo sounder (year 2000; RMSE ≤ 1 m), making a special analysis of the difference between the geographical zero and the hydrological zero to fit both models (difference calculated for Gran Canaria: 1560 m) and the differences in the coastline between both dates so that both models also coincide. The propagation is performed using a grid mesh, with wave heights obtained for each node and with the specific coordinates of the coastal area of interest. To obtain more precise results, the area was divided into seven zones (Figure 1) to enable modelling with a higher mesh resolution. The resulting point clouds were processed in a GIS for rasterisation (Figure 3(1)) (the Kriging interpolation method was employed) and the wave height at the foot of the beach was subsequently determined. In the case of the Puerto Rico coastal strip, this is at elevation −6.62 m. For evaluation of the breakwater overflow level, the wave height at the base of the structure was used according to the bathymetric data of the study area. After obtaining the wave height at the foot of the beach, it is possible to determine the runup which, in the case of beaches, as explained above, also depends on the slope and incident wave peak period [41]. For the breakwaters, the formula proposed by McCartney and Ahrens (1975) [45] was used. The slope was determined using the digital elevation model (DEM) of the Spanish National Geographic Institute. For the coastal strip of 1700 m in the study area, the flood sea level was determined for a total of seven beaches and the breakwater overflow level for five ports, as well as some built-up areas along the coast protected by rockfill.

Table 1.
Digital surface models (DSMs) used in this research.
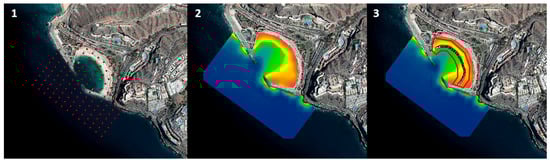
Figure 3.
Example of the steps employed to calculate the flood sea level by SW sea storm events. (1) Mesh to interpolate Hs. (2) Raster obtained through Hs interpolation. (3) (red polygon), extraction of Hs values at elevation −2 (considered as beach foot).
3.3. Topographic Variables, Coastal Narrowing and Coastal Squeeze Zones Calculation, and Mapping
LiDAR data from flights in 2009 and 2015 were used for the spatial analyses of topographic variables such as erosion range (data from 2009 and 2015) and mean slope (data from 2015). Digital Surface models (DSMs) were obtained (ground + buildings) that allowed us to include built-up and non-built-up surfaces with flood risk (Table 1). By means of a digital elevation model of difference (DoD), it was possible to gain an approximate knowledge of the changes in coastal erosion. These two LiDAR flight datasets were the only ones freely available from Spain’s National Geographic Institute through the National Aerial Orthophotography Plan. Extraction of the erosion range and mean slope data, together with the mean width of coastal narrowing and coastal squeeze (explained below), was done using perpendicular transects to the coast (every 20 m) in all the modelled areas (Figure 2).
Coastal narrowing and coastal squeeze zones were calculated from the 2015 DSM. For this, the raster reclassification tool, which can be found in any GIS software, was used with the flood sea levels. Each zone was then reclassified before the GIS mask extraction tool was used. Finally, GIS was used to vectorise the results of the reclassification and the resulting polygon vectors were merged. In accordance with the distinction made by Pontee (2013) [5], the coastal narrowing zone was determined as the difference between the flood sea levels at half-tide and high-tide shown in Table 2 (current climate). Additionally, in accordance with the distinction made by Pontee (2013), the coastal squeeze zone, which is related to SLR predictions, was determined as the difference between the result of the flood sea level at half-tide in Table 2 (current climate) and half-tide in Table 3 (RCP 8.5).
Table 2.
Data used to calculate the current flood sea level (last column) in the different zones studied (beaches, grey), and with two situations (half-tide and high tide), when SW marine storms occur (1958–2018).
Table 3.
Data used to calculate the flood sea levels projected in the RCP 8.5 scenario (last column) in the different zones studied (beaches, grey), and with two situations (half-tide and high tide), when SW sea storm events occur.
3.4. Physical and Economic Impacts of the SW Sea Storm Events and Estimated Impacts in View of SLR
3.4.1. Fieldwork
A six-field campaign was conducted during April and May of 2021, right after winter when more frequent storms are observed [24], to identify the environmental impacts of SW storms in the study area. The work consisted of tracing the entire coastline observed in the study area (Figure 2) in order to detect in particular three types of damage that may show signs of wave effect: (i) damage to infrastructure; (ii) cliff slides; (iii) outcrops of volcanic lava flows and pebbles on sandy beaches indicating the absence of sand. Using GPS to situate all the affected sites, the dimensions of the affected areas were also characterised and measured (major axis × minor axis = m2). The field campaign was conducted alternating between weeks of low tide and weeks of high tide. In the former, it was possible to identify all the impacts that high tide could cover, and in the latter to verify that the impact was caused by wave intensity.
3.4.2. Economic Cost Calculation
A report (in Spanish with English title: Design of the seafront from Anfi del Mar to Arguineguín) drawn up by Bolaños-Briganty and Martinez-Castellanos (2015) [46] was used as a reference document for the calculation of the economic cost of SW storms in the study area. This document was written with the construction in mind of a 1587 m long seafront promenade over an already existing pathway that was unmaintained and lacked any type of amenity due to strong surf. The report included specifications in accordance with the maritime climate of the area in relation to protection against sea damage. The document in question follows the same reasoning as is being applied throughout the study area of the present research where proposals have been made for the reconstruction of beaches and infrastructures such as seafront promenades and piers protected by breakwater walls. According to the reference document, the estimated construction, infrastructure, health and safety, and waste management costs for the proposed work amount to 19,274,540.91€. This figure was extrapolated to the rest of the coast, taking into consideration the stretch of seafront (in m) protected against storms in each of the areas used to generate the aforementioned bidimensional models (Figure 3) (Equation (1)).
where Ce is the cost incurred as the result of current SW sea storm effects, SLm is the length of the seafront in the model zone, SLp is the length of the seafront in the reference project (1587 m), and Cp is the total cost of the reference project (19,274,540.91 €).
Ce = (SLm × SLp)/Cp
With respect to the estimation of the SLR-related economic cost, the same extrapolation was performed but with the addition of an adjustment factor (Equation (2)) due to the anticipated flood area increase, which relates the mean width of the coastal squeeze zone in each modelled area with the mean width of the proposals included in the reference project (13.25 m). This adjustment factor was calculated through a GIS using the mean length of the transects perpendicular to the coast (understood as the mean width of the coastal squeeze zone by its orientation) traversed by the coastal squeeze zone (Table 4).
where a is the adjustment factor (Equation (3)).
where Wm is the mean width in each zone for modelling and Wp is the mean width of the reference project, which behaves as a constant of 13.25 m.
Ce = (SLm × SLp)/Cp × a
a = Wm/Wp
Table 4.
Adjustment factor used to calculate the prediction of the SLR-related economic cost.
4. Results and Discussion
Coastal planning and management require the use of risk assessment frameworks that consider the combined effect of a variety of both climatic and non-climatic factors, as well as associated uncertainties such as SLR, changes in the probability of occurrence of extreme events, and socioeconomic trends that are difficult to predict [47]. The presentation below of this variety of factors has the aim of helping in the management-related decision-making process in tourist areas of oceanic islands that suffer the effects of sea storm events given the anticipated SLR.
4.1. Current Sea Storm Conditions
4.1.1. Evolution of Sea Storm Events and Their Characteristics
An important issue in coastal studies is the frequency and magnitude of storm events and their impacts [32]. In this regard, Yanes-Luque et al. (2021) [24] studied records of sea storm events between 1958 and 2018 based on newspaper archives, verifying the occurrence of 217 documented events and the resulting damage to coastal areas of Gran Canaria and Tenerife. As can be seen in Figure 4, a total of 154 sea storm events were detected in the study area of the present research over the last 60 years of the study period and, of these, 67.53% (104 events) took place in the last 30 years (Figure 4, left). That is, a polynomial trend (R2: 0.5876) is observed in relation to the increase in storm events from 1958 to 2018. A similar trend has been observed throughout the North Atlantic zone [47,48], where modelling also revealed an increase in the height of the most-damaging waves [47]. It is also important to observe how, although the linear trend is low (R2: 0.1577) with a p-value of 3.4155E-07, the duration of the wave tends to increase with wave height (Figure 4, right). In view of all the above, it is concluded that, as well as a greater frequency of sea storm events, the storms are becoming more severe as the highest waves are present over longer periods of time.
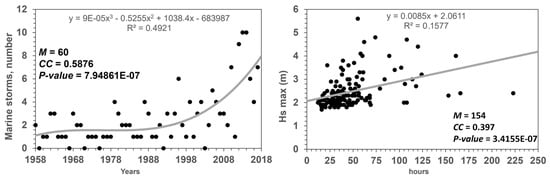
Figure 4.
Evolution of the number of sea storm events between 1958 and 2018 (sixty years) (polynomial trend) (left) and correlation between maximum wave height (Hs max) and storm duration (linear trend) (right). M is the sample size and CC is the correlation coefficient.
4.1.2. Current Effects of SW Sea Storm Events
Table 2 shows the variables used to calculate the flood sea level (last column) on the basis of bidimensional numerical models. The data are ordered by the modelled study zones (1, 3, 5, 6, and 7), coastal type (beach or infrastructure), and half-tide or high tide conditions when the SW storm events occur. It can be seen that, generally, beaches (shaded areas in the table) have a lower flood sea level than infrastructures in both half-tide (range 0.62–1.94 m) and high tide (range 2.39–3.74 m) conditions. However, as can be seen in Figure 5, which shows the calculated coastal narrowing zone, the beaches, normally the main attraction of coastal tourist destinations [49], are subject to greater flooding.
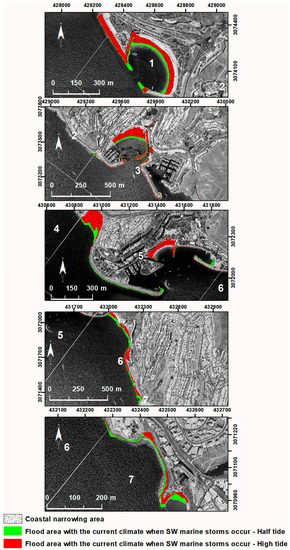
Figure 5.
Study area zones affected by SW marine storms. Differences between half-tide and high tide.
In this sense, in the North Atlantic, there are indications that there is an increase in the frequency of very powerful storms, especially at higher latitudes, at the same time that coastal ecosystems (e.g., beaches) have decreased. The North Atlantic Oscillation (NAO) phenomenon is associated with the frequency and monitoring of these ecosystems or the loss of these ecosystems and their services. In addition, recent roughness in the sea seems to be related to high values of the NAO index, which are also expected to increase with global warming. Therefore, when coupled with the projected sea level rise, which is addressed in this research, this trend is likely to lead to increased sediment loss resulting in widespread coastal erosion [50,51,52,53].
4.1.3. Coastal Narrowing Calculation
Coastal narrowing is defined by Pontee (2013) [5] as “a general description for decreases in coastal zone width” and has no relationship to SLR. In this sense, in order to analyse the current conditions of sea storm events (especially SW events) that take place close to tourist areas and their socio-environmental impact, it is necessary to determine the affected physical area. The coastal narrowing concept helps to achieve this goal. In the study area, it has been estimated that SW sea storm events currently affect 38,460.04 m2 (half-tide) and 93,072.26 m2 (high tide). However, in the RCP 8.5 scenario, the affected area rises to 68,035.66 m2 (half-tide) and 159,116.11 m2 (high tide), the equivalent of a 176.9% increase under half-tide conditions and a 170.9% increase under high tide conditions. As mentioned above, beaches are the coastal areas most affected by surface flooding. Rock outcrops have been detected as the result of beach erosion, even in breakwater-protected artificial beaches like Amadores beach [54], which has only been open to the public since 1998. Old beach rocks, which were covered by imported sand 22 years ago, are currently resurfacing all year round, as determined by fieldwork and as can be seen in the dates of the orthophotos shown in Figure 6A,B (top)). Seasonal effects can thus be discarded.

Figure 6.
Environmental effects by sea storm events. (A,B): Rock outcrops as the result of beach erosion in Amadores between 1998 (flight carried out between October and December 1998) and 2020 (flight carried out between May 2020 and February 2021) (located in Figure 7; legend 4. Beach erosion). Fieldwork photograph (top right) taken on 19 April 2021. Orthophoto source: SDI Canarias (Canary Islands, GRAFCAN, S.A.). (C): seafront damage (located in Figure 7; legend 1. Seafront damage only). (D): breakwater damage (located in Figure 7; legend 2. Breakwater damage only). (E): affected seafront and breakwater located within 4 m of a tourist building (located in Figure 7; legend 3. Seafront and breakwater damage).


Figure 7.
Distribution of the environmental effects identified through fieldwork.
Figure 7.
Distribution of the environmental effects identified through fieldwork.

In this sense, it is important to calculate not only the flood sea levels under the present climate scenario when SW sea storm events take place but also the areas that are affected (Figure 5). This type of map can be used in the management decision-making process and the establishment of new regulations on the part of the authorities with respect to coastal use and planning in island regions [55]. It additionally allows prioritisation in coastal classification by considering variables such as floodable surface area. In Zone 1 (Figure 5—Amadores beach), the half-tide flooded area when SW sea storm events occur is 9607.38 m2 and the high tide value is 29,980.12 m2, resulting in a coastal narrowing zone of 21,022.52 m2 (2.12 times larger than the area flooded under half-tide conditions). In Zone 3 (Figure 5—Puerto Rico), half-tide and high-tide floods affect 6029.19 m2 and 26,109.50 m2, respectively, and the coastal narrowing zone is 20,080.31 m2 (3.33 times larger than the area flooded under half-tide conditions). In Zone 5, half-tide and high-tide floods affect 10,283.07 m2 and 18,412.13 m2, respectively, and coastal narrowing is 8129.06 m2 (79.05% of the area flooded under half-tide conditions). In Zone 6, half-tide and high-tide floods affect 9794.20 m2 and 15,190.17 m2, respectively, and coastal narrowing is 5395.97 m2 (55.09% of the area flooded under half-tide conditions). Finally, in Zone 7, half-tide and high-tide floods affect 10,746.20 m2 and 14,380.34 m2, respectively, and coastal narrowing is 3634.14 m2 (33.82% of the area flooded under half-tide conditions). The three most affected zones in terms of surface area by SW sea storm events (Zones 1, 3, and 5) are principally comprised of beaches and breakwaters (both for vessels and beach protection), whereas the least affected (Zones 6 and 7) have no form of beach protection. It can thus be affirmed that the breakwaters are no guarantee of beach stability (Figure 6). Similar results have been reported by [56,57,58], among others. Two possible reasons for the erosion despite the presence of breakwaters are that: (i) the breakwater itself is modifying the sand dynamics and contributions to the beach, as reported in islands like Oahu (Hawaiian Islands) [59]; (ii) these are enclosed beaches with no longshore drift sediment contribution, a condition very common in islands with limited sediment supplies [60].
4.2. Current Environmental Problems through the Coastal Narrowing Zone
It was found (Figure 4) that the frequency of SW sea storm events is increasing in the study area and, through the bi-dimensional models to calculate the flood sea level and map the floodable surfaces, that the coastal spaces are more easily flooded as the coastal slope decreases (R2 = 0.5885) (Figure 8, right). This pattern has been widely reported in the scientific literature, showing that zones of lower height and slope are the most affected [61,62,63,64,65]. It was also found through the DoDs obtained from the LiDAR data (2009 and 2015) that the erosion range increases with flooded area measured through the length of the transects explained in the methodology section (R2 = 0.6872) (Figure 8, left). The combination of these two topography-related variables allows the identification of coastal zones at greater risk of flooding [63].
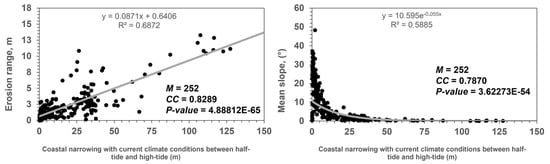
Figure 8.
Correlation between coastal narrowing and erosion range (left, linear trend), and mean slope (right, exponential trend). M = sample; CC = correlation coefficient.
Coastal Impacts by Marine Storms Identified through Fieldwork
Four main problems caused by coastal erosion in the study area were identified (and measured) in situ during the field campaign (Figure 6 and Figure 7): (i) seafront damage only; (ii) breakwater damage only; (iii) seafront and breakwater damage; and (iv) beach erosion. With respect to seafront damage only, it was calculated that 6,100.72 m2 of the study area is affected. The highest and most significant impact was calculated with respect to breakwater damage only, affecting 20,048.11 m2. Damage to both seafront and breakwater in the same place affected a total of 391.61 m2, and the corresponding calculation for beach erosion was 604.43 m2. Practically all of the designated zones of the study area were found to be affected. Beach erosion, however, was mostly in Zone 1 (Amadores), and damage to both seafront and breakwater in Zone 5 (especially Balito beach) (Figure 7, third row). In addition, a total of 49 registered plots situated in the coastal narrowing zone (Figure 7, blue) were found to be affected as they overlie the coastal narrowing zone. These plots are mostly exploited to offer tourist services (42.65%), including restaurants, marinas, and rental services. Tourist hotels and apartments are constructed on a further 34.48% of the plots and residential homes on 20.87%. The remaining 2% is presently unoccupied, but construction projects are being proposed, for example in the case of Balito beach. Plans have been drawn up to build on a surface area of 430,000 m2, and the necessary modifications to subsidiary regulations of Mogán Council have been underway since 2019. It is expected that the forthcoming General Urban Development Plan of the Council will include this project. The results obtained in the present research strongly suggest that this type of project, whose main use will be for touristic and residential purposes, is unadvisable, especially in view of the fact that Balito beach is one of the zones most affected by SW sea storm events.
4.3. Effects of Sea Level Rise under the Current Scenario
4.3.1. Effects of Projected RCP 8.5 SW Sea Storm Events on Flood Sea Level
Table 3 shows the RCP 8.5 projected flood sea levels. Although the trend is linear in relation to the results shown in Table 2 (R2 = 0.9648), this is not necessarily the case in the breakwater zones (especially Zones 1 and 5). The results are difficult to interpret as they will depend on the morphology of the structure, their state of conservation, and the management practices carried out, as well as the success or otherwise in meeting the challenges of ecological conservation [66,67,68].
4.3.2. Coastal Squeeze Calculation
The coastal squeeze phenomenon (see Section 1) is one of the main problems faced in coastal management, as it affects practically all coastal strips around the world where diverse socio-ecological systems coexist [69]. Such systems include beaches, the areas most affected according to the results of the present study. In Zone 1 (Figure 9), Amadores beach, the estimated flooded surface areas in an RCP 8.5 scenario when SW sea storm events occur during half-tide is 14,448.76 m2, and during high tide 44,428.90 m2. The corresponding values in Zone 3 (Figure 9), Puerto Rico, are 14,718.42 m2 and 50,779.86 m2; in Zone 5 (Figure 9), they are 19,943.32 m2 and 35,079.31 m2; in Zone 6, 15,013.77 and 20,681.99 m2; and, finally, in Zone 7 (Figure 9) the corresponding values are 3911.39 m2 and 8682.63 m2. The coastal squeeze flooded surface areas in these five Zones are therefore (ordered by Zone number) 50.39%, 144.11%, 93.94%, 53.29%, and 42.42% (with half-tide conditions) and 48.19%, 94.48%, 90.52%, 36.15%, and 156.85% (with high-tide conditions) higher than the corresponding coastal narrowing calculations given in Section 4.1.3.
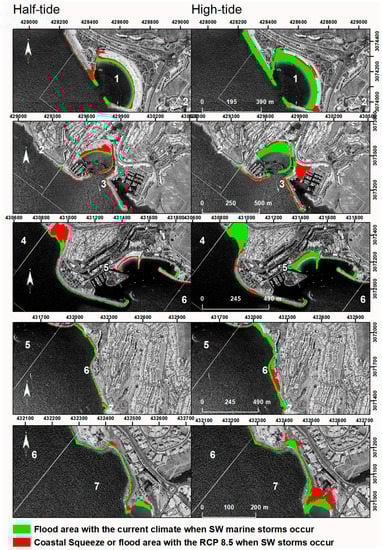
Figure 9.
Coastal squeeze area. (Left): Coastal narrowing area (green) adding the flooded surface in an RCP 8.5 scenario (red) under half-tide conditions and when SW sea storms occur. (Right): Coastal narrowing area (green) adding the flooded surface in an RCP 8.5 scenario (red) under high-tide conditions and when SW sea storms occur.
There is some debate around the retreat capacity of some coastal ecosystems in the face of SLR and the need for more precise remodelling than solely the use of the flood sea level. With beach-dune systems, for example, certain limitations need to be taken into consideration in the case of application of the Bruun rule (1962) [70], as this should strictly be done in areas with environmental conditions similar to those of the original hypothesis [71]. It has been reported that erosion of these sedimentary systems can be overestimated by 10–60% [72]. Modifications to the Bruun rule to avoid such overestimations include adding overwash and wind-driven onshore transport [73]. In the case of the present research, the results obtained to date show that sections of the study area that could have retreat capacity, like the beaches (rigid structures like the breakwaters have no such capacity), are totally flooded. In addition, the studied beaches are sheltered inland by rigid structures (buildings, etc.), which impede beach recovery [74].
4.3.3. Calculation of the Cost of the Effects of Sea Storm Events
The first studies that evaluated the potential cost of SLR using a cost-benefit model weighed the cost of protecting a property with the value of the property at the time of flooding [75,76,77]. This approach assumes or understands that property will be protected if its value exceeds the cost of protection at the time of flooding. Certain limitations of this approach have been pointed out. Firstly, modelling is done only of the damage that is caused by the SLR, ignoring possible extreme storm events and the erosion exacerbated by the SLR [78], as is the case in the present study; secondly, it is assumed that the owners and those responsible for decision-making have undertaken perfect planning, whereas, in reality, the envisaged protection structures may be for an SLR that may not occur [78]; and, thirdly, this approach only examines the net social cost of property and ignores other economic impacts (e.g., interruptions to commerce) of SLR [79,80]. More recent studies have taken into account the economic impact of sea storm events in the context of SLR [81,82]. For beaches, the most important direct economic use tends to be related to recreational and leisure activities and there is general agreement among economists (within a reasonable range) that the most appropriate unit to use in calculations in this respect is the so-called beach day [83,84,85]. In this regard, Pendleton et al. (2011) [85] found that an increased beach width had important benefits, increasing the value of coastal properties. Another way to assess the value of beaches and their disappearance is through the use of hedonic models [86]. The method employed in the present study quantifies the cost on the basis of a coastal seafront renovation project that is required due to the effects of sea storm events (see Section 3.4.2). The quantification considers breakwater zones, sand replacement in affected areas, and sea surge protection. Figure 10 and Table 5 show the cost to maintain the affected areas used for the modelling.
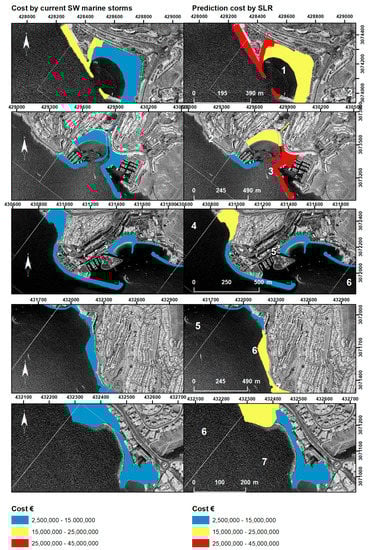
Figure 10.
Economic cost of infrastructures and beaches affected by SW sea storm events, with current climate (left) and RCP 8.5 scenario (right) in the study area for the studied period.
Table 5.
Estimated costs in the current and future scenario (RCP 8.5).
Beaches are one of the principal assets of coastal tourist destinations [49], and their disappearance will entail significant economic losses. The authors of [86] observed that while coastal areas adapt to climate change, the long-term net value of coastal residential properties can fall by as much as 52% when the beach erosion rate triples and the cost of replacement sand quadruples. The present research has focused on an initial approach for the calculation of the repair costs of infrastructures and the recovery of mostly artificial beaches. In future works, calculation of the hedonic price will be key to understanding the real cost that beach loss will entail, including the resulting loss of tourist visitors and hence a vital source of revenue. In all the beach cases, the cost in the RCP 8.5 scenario would be viable if in the future it was decided to eliminate the buildings and construction inland and allow the beach to retreat; otherwise, the beach would completely disappear.
5. General Discussion
In view of the results of the present research, the importance of analysing the effects of SLR through the approach proposed by Pontee (2013) [5] is highlighted, given the conceptual differences between coastal narrowing (effects under current climate conditions) and coastal squeeze (prediction of effects in view of climate change and especially SLR). These conceptual differences also entail physical and environmental differences that allow the corresponding authorities to take effective measures now, in the current scenario, that take into consideration modelling for an RCP 8.5 scenario. Consideration of both scenarios can facilitate territorial planning and recommendations that resolve current environmental problems affecting coastal tourist zones (as considered in the present research) while anticipating the long-term effects of SLR.
This research also highlights the importance of the effects of the SW sea storm events that affect not only the case study area [24], but indeed practically all the archipelagos of the Atlantic Ocean [32,33,34]. The fact that the frequency and severity of these SW sea storm events have been increasing since the 1990s, affecting tourist areas situated in the S-SW of Atlantic islands, is also highlighted [24]. In Gran Canaria, for example, these S-SW areas are essentially unaffected by the trade winds whose access to the area is blocked by mountainous regions inland, but they are exposed to the impact of SW sea storm events [30].
With respect to the results obtained through the spatialisation of the flood sea levels, it was found that the zones occupied by both infrastructures and protected by breakwaters will be the least affected, although there are exceptions such as Zone 3 (Puerto Rico) and its second breakwater, where the inland entrance of seawater will be easier in some parts of the structure. In general, the current engineering models being implemented in the study area are taking into account the effects of climate change through repair and breakwater reinforcement projects (2018). In this regard, the present research questions the economic viability, especially for the relevant competent bodies, of this type of project as they are likely to become more and more common in view of a phenomenon like climate change that is so difficult to manage. The zones that will practically disappear, however, are the beaches. They are already showing signs of vulnerability to erosive processes (Figure 6). In addition, as explained previously, the beaches in this area have practically zero longshore drift and instead behave like capsules situated in ravine mouths whose sediment/sand supply through erosion processes is terrigenous through a non-river hydrographic basin to which they are associated. Thus, the sediment supply of these beaches is limited and only associated with occasional ravine run-off episodes that do not take place all year round as is the case with river-associated longshore drift. Finally, the combination of beach sediment loss, the SLR, and the complete urbanisation taking place around these systems means that beach retreat inland is impossible and their disappearance is likely [74].
Finally, climate change, as well as causing the anticipated SLR that will affect coastal areas, is causing temperate rises. A mean increase of 1 °C has been predicted by 2025 and of 3 °C by the end of the century [87]. Climate change will result in changes in rain patterns, with an increase in annual precipitation levels (especially in countries north of 50°N) [87] or a drastic reduction in arid and semiarid countries [88], but the most important impact is probably the anticipated increase in rainfall intensity [89]. In this regard, future works will tackle the overall aim of this work with the inclusion of a combination of the effects of SLR and the risk of flooding due to higher flow rates in the water network, in this case of coastal tourist zones situated in the mouths of ravines [54]. This double effect will increase the vulnerability of these coastal spaces.
6. Conclusions
The study presented in this paper analyses the environmental impact of SW sea storm events in coastal tourist areas, including both the effects taking place at the present time and those that are anticipated in view of climate change. For this purpose, a conceptual approach was applied that incorporated the separation of coastal narrowing (current climate) and coastal squeeze (projection of sea level rise) and modelling on the basis of two tidal conditions (half-tide and high tide). The first results obtained offer a justification for this type of research, especially as it was found that sea storm events, especially from the SW, have been increasing in frequency. Such storms can have important impacts on the tourist areas of oceanic islands which are commonly strategically situated in the SW of Atlantic islands because of the optimal levels of comfort and environmental stability that they offer. The calculation and mapping of the flood sea levels of the case study area allowed us to determine the most affected zones at the present time and to predict what would happen in an RCP 8.5 scenario. On the basis of this mapping, it was also possible to determine seafront damage, breakwater damage, seafront and breakwater damage together, and beach erosion. Although the infrastructures generally show a good level of preparation for sea storm events, the beaches have a high level of risk because of the erosion levels detected, including a strong possibility of their future disappearance as the tourist buildings and general urbanisation of the surrounding area is blocking their retreat. As far as infrastructure maintenance is concerned (with the need for constant and expensive repair projects on the part of the local authorities and the need to replace sand to avoid beach erosion), it has been calculated that just maintaining the current situation of the study area would cost 128,359,106.10€ under present conditions and 139,535,896.20€ under an RCP 8.5 scenario. Such amounts would be needed repeatedly and over a long period of time.
Author Contributions
L.G.-R. and P.M.-S., Conceptualization and investigation; L.G.-R., T.C.-G. and J.Á.R.-B., methodology, software, data curation, validation, formal analysis; L.G.-R., writing, writing and editing, and original draft preparation; L.G.-R., Geographical Information Systems; P.M.-S., A.Y.-L. and L.H.-C., review and supervision; P.M.-S. and L.H.-C., project administration, resource and funding acquisition; All authors have read and agreed to the published version of the manuscript.
Funding
This research was supported by a project co-financed with ERDF funds of the cooperation program INTERREG-MAC 2014–2020, project PLANCLIMAC (MAC/3.5b/244).
Data Availability Statement
Not applicable.
Acknowledgments
This work is a contribution of a project co-financed with ERDF funds of the cooperation program INTERREG-MAC 2014–2020, project PLANCLIMAC (MAC/3.5b/244), which allowed a contract to the first author, and the project also co-financed with ERDF funds PID2021-124888OB-I00 (National R&D&i Plan, Spain). Leví García-Romero is a beneficiary of the postdoctoral contract programme ‘Catalina Ruiz 2022’ of the Canary Islands Government and the European Social Fund (APCR2022010005). We thank Francisco Martínez Castellanos for his support. We are grateful for the work of the three reviewers who improved the original manuscript.
Conflicts of Interest
The authors declare no conflict of interest.
References
- Kelman, I.; Spence, R.; Palmer, J.; Petal, M.; Saito, K. Tourists and disasters: Lessons from the 26 December 2004 tsunamis. J. Coast. Conserv. 2008, 12, 105–113. [Google Scholar] [CrossRef]
- Nicholls, R.J. Adaptation Options for Coastal Areas and Infrastructure: An Analysis for 2030. 2007. Available online: https://unfccc.int/files/cooperation_and_support/financial_mechanism/application/pdf/nicholls.pdf (accessed on 1 September 2021).
- Williams, A.T.; Rangel-Buitrago, N.; Pranzini, E.; Anfuso, G. The management of coastal erosion. Ocean. Coast. Manag. 2018, 156, 4–20. [Google Scholar] [CrossRef]
- Doody, J.P. Coastal squeeze and managed realignment in southeast England, does it tell us anything about the future? Ocean. Coast. Manag. 2013, 79, 34–41. [Google Scholar] [CrossRef]
- Pontee, N. Defining coastal squeeze: A discussion. Ocean. Coast. Manag. 2013, 84, 204–207. [Google Scholar] [CrossRef]
- Christy, J. The Future Outlook is Fine. The Times, 20 February 2001. [Google Scholar]
- Environmental Scientist. Living in the Greenhouse. Environ. Sci. 1999, 8, 1–3.
- Giles, J. When doubt is a sure thing. Nature 2002, 418, 476–478. [Google Scholar] [CrossRef] [PubMed]
- World Tourism Organisation. Leading the World’s Largest Industry. 2001. Available online: http://www.world-tourism.org/aboutwto.html (accessed on 1 October 2021).
- Michailidou, A.V.; Vlachokostas, C.; Moussiopoulos, Ν. Interactions between climate change and the tourism sector: Multiple-criteria decision analysis to assess mitigation and adaptation options in tourism areas. Tour. Manag. 2016, 55, 1–12. [Google Scholar] [CrossRef]
- Phillips, M.R.; Jones, A.L. Erosion and tourism infrastructure in the coastal zone: Problems, consequences and management. Tour. Manag. 2006, 27, 517–524. [Google Scholar] [CrossRef]
- Moreno, A.; Amelung, B. Climate change and tourist comfort on Europe’s beaches in summer: A reassessment. Coast. Manag. 2009, 37, 550–568. [Google Scholar] [CrossRef]
- Moreno, A.; Becken, S. A climate change vulnerability assessment methodology for coastal tourism. J. Sustain. Tour. 2009, 17, 473–488. [Google Scholar] [CrossRef]
- Becken, S. Harmonising climate change adaptation and mitigation: The case of tourist resorts in Fiji. Glob. Environ. Chang. 2005, 15, 381–393. [Google Scholar] [CrossRef]
- Santana-Gallego, M.; Ledesma-Rodríguez, F.; Pérez-Rodríguez, J.V. Tourism and trade in small island regions: The case of the Canary Islands. Tour. Econ. 2011, 17, 107–125. [Google Scholar] [CrossRef]
- Tsai, C.H.; Chen, C.W. The establishment of a rapid natural disaster risk assessment model for the tourism industry. Tour. Manag. 2011, 32, 158–171. [Google Scholar] [CrossRef]
- UNISDR Terminología Sobre Reducción del Riesgo de Desastres. Estrategia Internacional para la Reducción de Desastres de las Naciones Unidas; United Nations: Geneva, Switzerland, 2009. [Google Scholar]
- Carreño, M.; Cardona, O.D.; Barbat, A. Sistema de Indicadores para la Evaluación de Riesgos; Centre Internacional de Mètodes Numèrics en Enginyeria (CIMNE): Barcelona, Spain, 2002. [Google Scholar]
- Oppenheimer, M.; Glavovic, B.; Hinkel, J.; van de Wal, R.; Magnan, A.K.; Abd-Elgawad, A.; Cai, R.; Cifuentes-Jara, M.; Deconto, R.M.; Ghosh, T.; et al. Sea Level Rise and Implications for Low Lying Islands, Coasts and Communities; The Intergovernmental Panel on Climate Change: Geneva, Switzerland, 2019. [Google Scholar]
- Coller, M.L.F.; Wheeler, P.; Kunapo, J.; Peterson, J. Interactive flood hazard visualization in Adobe Flash. J. Flood Risk Manag. 2018, 11, 134–146. [Google Scholar] [CrossRef]
- IPCC. Climate change 2013: The physical science basis. In Contribution of Working Group I to the Fifth Assessment Report of the Intergovernmental Panel on Climate Change; Stocker, T.F., Qin, D., Plattner, G.-K., Tignor, M., Allen, S.K., Boschung, J., Nauels, A., Xia, Y., Bex, V., Midgley, P.M., Eds.; Cambridge University Press: Cambridge, UK, 2013. [Google Scholar]
- Medina Santamaría, R. (Coord.) Impactos en la Costa Española por Efectos del Cambio Climático; Ministerio de Medio Ambiente: Madrid, Spain, 2004; 423p. [Google Scholar]
- Losada, I.; Izaguirre, C.; Diaz, P. Cambio Climático en la Costa Española; Oficina Española de Cambio Climático, Ministerio de Agricultura, Alimentación y Medio Ambiente, Gobierno de España: Madrid, Spain, 2014; 133p. [Google Scholar]
- Luque, A.Y.; Rodríguez-Báez, J.A.; Suárez, P.M.; Antequera, P.D.; López-Díez, A.; Díaz-Pacheco, J.; Pérez-Chacón, E. Marine storms in coastal tourist areas of the Canary Islands. Nat. Hazards 2021, 109, 1297–1325. [Google Scholar] [CrossRef]
- EN 32007L0060. Directive 2007/60/EC of the European Parliament and of the Council of 23 October 2007 on the Assessment and Management of Flood Risks. European Parliament Council: Strasbourg, France, 2007.
- Garín-Muñoz, T. Inbound international tourism to Canary Islands: A dynamic panel data model. Tour. Manag. 2006, 27, 281–291. [Google Scholar] [CrossRef]
- INE. Spanish Statistical Institute. 2020. Available online: https://www.ine.es (accessed on 15 September 2021).
- Hernández, L. Diagnóstico sobre la Evolución del Sistema de Dunas de Maspalomas (1960–2000); Cabildo de Gran Canaria: Las Palmas de Gran Canaria, Spain, 2006. [Google Scholar]
- Ferrer-Valero, N.; Hernández-Calvento, L.; Hernández-Cordero, A. Human impacts quantification on the coastal landforms of Gran Canaria Island (Canary Islands). Geomorphology 2017, 286, 58–67. [Google Scholar] [CrossRef]
- Máyer Suárez, P.; Pérez-Chacón Espino, E.; Cruz Avero, N.; Hernández-Calvento, L. Características del viento en el campo de dunas de Maspalomas (Gran Canaria, Islas Canarias, España). Nimbus 2012, 29–30, 381–397. Available online: https://dialnet.unirioja.es/servlet/articulo?codigo=4376861 (accessed on 23 September 2020).
- Exceltur. Impactur Canarias 2018. Estudio del Impacto Económico del Turismo Sobre la Economía y el Empleo de las Islas Canarias. Santa Cruz de Tenerife, Exceltur y Gobierno de Canarias. 2019. Available online: https://www.exceltur.org/wp-content/uploads/2019/12/IMPACTUR-Canarias-2018.pdf (accessed on 23 September 2020).
- Lameiras, G.; Fontiela, J.; Borges, P.; Calado, H.; Vieira, O.; Rangel, B.; Gallagher, A. Coastal hazards of Fajã do Calhau (São Miguel—Azores): A first approach. J. Coast. Res. 2009, 1, 827–831. [Google Scholar]
- Arnault, J.; Roux, F. Characteristics of African easterly waves associated with tropical cyclogenesis in the Cape Verde Islands region in July–August–September of 2004–2008. Atmos. Res. 2011, 100, 61–82. [Google Scholar] [CrossRef]
- Moreira, M.E.S. Recreation and conservation of the coastal environment of the Madeira Islands. Ocean. Shorel. Manag. 1988, 11, 409–425. [Google Scholar] [CrossRef]
- Máyer, P. Un siglo de temporales en la prensa de Gran Canaria. Vegueta 1999, 4, 267–282. [Google Scholar]
- Yanes, A.; Marzol, M.V. Los temporales marinos como episodios de riesgo en Tenerife a través de la prensa (1985–2003). Rev. Soc. Geológica España 2009, 22, 95–104. [Google Scholar]
- Yanes, A. Desastres naturales en Canarias. La costa como espacio de riesgo en Tenerife. Sémata 2017, 29, 67–89. [Google Scholar] [CrossRef]
- Máyer, P. Lluvias e Inundaciones en Gran Canaria, Islas Canarias, España; Editorial Académica Española: Madrid, Spain, 2011. [Google Scholar]
- Nielsen, P.; Hanslow, D.J. Wave runup distributions on natural beaches. J. Coast. Res. 1991, 7, 1139–1152. [Google Scholar]
- Tomas, A.; Medina, R.; Méndez, F.J.; Jaime, F.F.; Castellanos, O.F.; Higuera, P.; Fernandez, F.; Minguez, R.; Diaz-Hernandez, G. Metodología para la Elaboración de los Mapas de Peligrosidad y RIESGO requeridos por RD 903/2010 en la Costa Española; Ministerio de Agricultura, Alimentación y Medio Ambiente: Madrid, Spain, 2013; 97p. [Google Scholar]
- González, M.; Medina, R.; Gonzalez-Ondina, J.; Osorio, A.F.; Mendez, F.; García, E. An integrated coastal modeling system for analyzing beach processes and beach restoration projects, SMC. Comput. Geosci. 2007, 33, 916–931. [Google Scholar] [CrossRef]
- Kirby, J.T.; Dalrymple, R.A. Combined Refraction/Diffraction Model REF/DIF 1, Version 2.5: Documentation and User’s Manual; Center for Applied Coastal Research, Department of Civil Engineering, University of Delaware: Newark, DE, USA, 1994. [Google Scholar]
- Kirby, J.T.; Dalrymple, R.A.; Shi, F. Combined Refraction/Diffraction Model. Ref/Dif 1 Version 3.0 Documentation and User’s Manual; University of Delaware: Delaware, DE, USA, 1994. [Google Scholar]
- Puertos del Estado, Dirección Técnica. Red de Mareógrafos del Estado (REDMAR), Resumen de Parámetros Relacionados con el Nivel del mar y la Marea que Afecta a las Condiciones de Diseño y Explotación Portuaria; Área de Medio Físico: Puertos de Las Palmas, Spain, 2019. [Google Scholar]
- McCartney, B.L.; Ahrens, J.P. Stability of Gobi Block Revetment to Wave Attack; US Army Corps of Engineers Coastal Engineering Research Center: Washington, DC, USA, 1975. [Google Scholar]
- Bolaños-Briganty, J.J.; Martínez-Castellanos, F. Diseño del Paseo Marítimo Desde Anfi del Mar Hasta Arguineguín; Escuela de Ingenierías Industriales y Civiles; Universidad de Las Palmas de Gran Canaria: Las Palmas de Gran Canaria, Spain, 2015. [Google Scholar]
- Wolf, J.; Woolf, D.; Bricheno, L. Impacts of climate change on storms and waves relevant to the coastal and marine environment around the UK. MCCIP Sci. Rev. 2020, 2020, 132–157. [Google Scholar]
- Bresnan, E.; Baker-Austin, C.; Campos, C.J.A.; Davidson, K.; Edwards, M.; Hall, A.; McKinney, A.; Turner, A.D. Impacts of climate change on human health, HABs and bathing waters, relevant to the coastal and marine environment around the UK. MCCIP Sci. Rev. 2020, 2020, 521–545. [Google Scholar]
- Toimil, A.; Diaz-Simal, P.; Losada, I.J.; Camus, P. Estimating the risk of loss of beach recreation value under climate change. Tour. Manag. 2018, 68, 387–400. [Google Scholar] [CrossRef]
- Ottersen, G.; Planque, B.; Belgrano, A.; Post, E.; Reid, P.C.; Stenseth, N.C. Ecological effects of the North Atlantic oscillation. Oecologia 2001, 128, 1–14. [Google Scholar] [CrossRef]
- Keim, B.D.; Muller, R.A.; Stone, G.W. Spatial and temporal variability of coastal storms in the North Atlantic Basin. Mar. Geol. 2004, 210, 7–15. [Google Scholar] [CrossRef]
- Bertin, X.; Prouteau, E.; Letetrel, C. A significant increase in wave height in the North Atlantic Ocean over the 20th century. Glob. Planet. Chang. 2013, 106, 77–83. [Google Scholar] [CrossRef]
- Paterson, S.K.; Loomis, D.K.; Young, S.E. The human dimension of changing shorelines along the U.S. North Atlantic Coast. Coast. Manag. 2014, 42, 17–35. [Google Scholar] [CrossRef]
- Macías-González, F. La Problemática Ambiental de Urbanizaciones Turísticas Costeras: El Ejemplo de Puerto Rico-Amadores, Gran Canaria (España). Ph.D. Thesis, Universidad de Las Palmas de Gran Canaria, Las Palmas, Spain, 2017. [Google Scholar]
- Richmond, B.M.; Fletcher, C.H., III; Grossman, E.E.; Gibbs, A.E. Islands at risk: Coastal hazard assessment and mapping in the Hawaiian Islands. Environ. Geosci. 2001, 8, 21–37. [Google Scholar] [CrossRef]
- Sawaragi, T.; Deguchi, I.; Park, S.K. Experimental study on the function of submerged breakwater to control cross-shore sediment transport on artificially nourished beaches. Coast. Eng. Jpn. 1988, 31, 121–130. [Google Scholar] [CrossRef]
- Lorenzoni, C.; Postacchini, M.; Mancinelli, A.; Brocchini, M. The morphological response of beaches protected by different breakwater configurations. In Proceedings of the 33rd International Conference on Coastal Engineering, Santander, Spain, 1–6 July 2012; p. 2. [Google Scholar]
- Dolphin, T.J.; Vincent, C.E.; Bacon, J.C.; Dumont, E.; Terentjeva, A. Decadal-scale impacts of a segmented, shore-parallel breakwater system. Coast. Eng. 2012, 66, 24–34. [Google Scholar] [CrossRef]
- Fletcher, C.H.; Mullane, R.A.; Richmond, B.M. Beach loss along armored shorelines on Oahu, Hawaiian Islands. J. Coast. Res. 1997, 13, 209–215. [Google Scholar]
- Anderson, T.R.; Fletcher, C.H.; Barbee, M.M.; Frazer, L.N.; Romine, B.M. Doubling of coastal erosion under rising sea level by mid-century in Hawaii. Nat. Hazards 2015, 78, 75–103. [Google Scholar] [CrossRef]
- Hunt, I.A. Design of sea-walls and breakwaters. Trans. Am. Soc. Civ. Eng. 1961, 126, 542–570. [Google Scholar] [CrossRef]
- Tainter, S.P. Bluff Slumping and Stability: A Consumer’s Guide; Michigan Sea Grant: Ann Arbor, MI, USA, 1982; Publication MICHU-SG-82-902; p. 65. [Google Scholar]
- Bush, D.M.; Neal, W.J.; Young, R.S.; Pilkey, O.H. Utilization of geoindicators for rapid assessment of coastal-hazard risk and mitigation. Ocean. Coast. Manag. 1999, 42, 647–670. [Google Scholar] [CrossRef]
- Jorgenson, T.; Ely, C. Topography and flooding of coastal ecosystems on the Yukon-Kuskokwim Delta, Alaska: Implications for sea-level rise. J. Coast. Res. 2001, 17, 124–136. [Google Scholar]
- Di Risio, M.; Bruschi, A.; Lisi, I.; Pesarino, V.; Pasquali, D. Comparative analysis of coastal flooding vulnerability and hazard assessment at national scale. J. Mar. Sci. Eng. 2017, 5, 51. [Google Scholar] [CrossRef]
- Lewsey, C.; Cid, G.; Kruse, E. Assessing climate change impacts on coastal infrastructure in the Eastern Caribbean. Mar. Policy 2004, 28, 393–409. [Google Scholar] [CrossRef]
- Bulleri, F.; Chapman, M.G. The introduction of coastal infrastructure as a driver of change in marine environments. J. Appl. Ecol. 2010, 47, 26–35. [Google Scholar] [CrossRef]
- Smythe, T.C. Assessing the Impacts of Hurricane Sandy on the Port of New York and New Jersey’s Maritime Responders and Response Infrastructure; Natural Hazards Center: St. Trenton, NJ, USA, 2013. [Google Scholar] [CrossRef]
- Anderies, J.M.; Janssen, M.A.; Ostrom, E. A Framework to Analyze the Robustness of Social-Ecological Systems from an Institutional Perspective. Ecol. Soc. 2004, 9, 18. Available online: http://www.ecologyandsociety.org/vol9/iss1/art18 (accessed on 1 October 2021). [CrossRef]
- Bruun, P. Sea-level rise as a cause of shore erosion. J. Waterw. Harb. Div. 1962, 88, 117–132. [Google Scholar] [CrossRef]
- Cooper, J.A.G.; Masselink, G.; Coco, G.; Short, A.D.; Castelle, B.; Rogers, K.; Anthony, E.; Green, A.N.; Kelley, J.T.; Pilkey, O.H.; et al. Sandy beaches can survive sea-level rise. Nat. Clim. Chang. 2020, 10, 993–995. [Google Scholar] [CrossRef]
- Toimil, A.; Losada, I.J.; Camus, P.; Díaz-Simal, P. Managing coastal erosion under climate change at the regional scale. Coast. Eng. 2017, 128, 106–122. [Google Scholar] [CrossRef]
- Rosati, J.D.; Dean, R.G.; Walton, T.L. The modified Bruun Rule extended for landward transport. Mar. Geol. 2013, 340, 71–81. [Google Scholar] [CrossRef]
- de Santiago, I.; Camus, P.; Gonzalez, M.; Liria, P.; Epelde, I.; Chust, G.; del Campo, A.; Uriarte, A. Impact of climate change on beach erosion in the Basque Coast (NE Spain). Coast. Eng. 2021, 167, 103916. [Google Scholar] [CrossRef]
- Yohe, G. The Cost of Not Holding Back the Sea: Phase 1 Economic Vulnerability in The Potential Effects of Global Climate Change on the United States; EPA 230-05-89-052; Report to Congress; Appendix B: Sea Level Rise; U.S. Environmental Protection Agency: Washington, DC, USA, 1989. [Google Scholar]
- Yohe, G.; Neumann, J.; Marshall, P.; Ameden, H. The Economic Cost of Greenhouse-Induced Sea-Level Rise for Developed Property in the United States. Clim. Chang. 1996, 32, 387–410. [Google Scholar] [CrossRef]
- Yohe, G.; Schlesinger, M.E. Sea-Level Change: The Expected Economic Cost of Protection or Abandonment in the United States. Clim. Chang. 1998, 38, 447–472. [Google Scholar] [CrossRef]
- Fu, X.; Song, J. Assessing the economic costs of sea level rise and benefits of coastal protection: A spatiotemporal approach. Sustainability 2017, 9, 1495. [Google Scholar] [CrossRef]
- Hanemann, W.M. What is the Economic Cost of Climate Change? (No. 1557-2016-132754); University of California, Berkeley: Berkeley, CA, USA, 2008. [Google Scholar]
- Heberger, M.; Cooley, H.; Herrera, P.; Gleick, P.H.; Moore, E. The Impacts of Sea-Level Rise on the California Coast; California Climate Change Center: San Francisco, CA, USA, 2009. [Google Scholar]
- Michael, J. Episodic Flooding and the Cost of Sea-level Rise. Ecol. Econ. 2007, 63, 149–159. [Google Scholar] [CrossRef]
- Kirshen, P.; Knee, K.; Ruth, M. Adaptation to Sea Level Rise in Metro Boston. Clim. Chang. 2008, 90, 453–473. [Google Scholar] [CrossRef]
- U.S. Army Corps of Engineers (USACE). Economic Guidance Memorandum (EGM) 04-01: Generic Depth-Damage Relationships for Residential Structures with Basements; USACE: Washington, DC, USA, 2003. [Google Scholar]
- King, P.G. Overcrowding and the Demand for Beaches in Southern California; Department of Boating and Waterways: San Francisco, CA, USA, 2001. [Google Scholar]
- Pendleton, L.; King, P.; Mohn, C.; Webster, D.G.; Vaughn, R.; Adams, P.N. Estimating the potential economic impacts of climate change on Southern California beaches. Clim. Chang. 2011, 109, 277–298. [Google Scholar] [CrossRef]
- Gopalakrishnan, S.; Smith, M.D.; Slott, J.M.; Murray, A.B. The value of disappearing beaches: A hedonic pricing model with endogenous beach width. J. Environ. Econ. Manag. 2011, 61, 297–310. [Google Scholar] [CrossRef]
- Tickell, C. Global Warming and Its Effects, Engineering for Climate Change; Institute of Civil Engineers: London, UK, 1993; pp. 9–16. [Google Scholar]
- Arnell, N.W. Impacts of Climatic Change on River Flow Regimes in the UK. Water Environ. J. 1992, 6, 432–442. [Google Scholar] [CrossRef]
- Al-Ansari, N.; Abdellatif, M.; Ali, S.; Knutsson, S. Long term effect of climate change on rainfall in northwest Iraq. Open Eng. 2014, 4, 250–263. [Google Scholar] [CrossRef]


Disclaimer/Publisher’s Note: The statements, opinions and data contained in all publications are solely those of the individual author(s) and contributor(s) and not of MDPI and/or the editor(s). MDPI and/or the editor(s) disclaim responsibility for any injury to people or property resulting from any ideas, methods, instructions or products referred to in the content. |
© 2023 by the authors. Licensee MDPI, Basel, Switzerland. This article is an open access article distributed under the terms and conditions of the Creative Commons Attribution (CC BY) license (https://creativecommons.org/licenses/by/4.0/).