1. Introduction
Geological pit wall mapping is critical for open pit mining operations since accurately and efficiently identifying the location, spatial variation, and type of geological features on working mine faces will greatly decrease dilution and increase geological certainty. By obtaining a better understanding of the geology, geological models can be constructed with accuracy and detail, which improves confidence in the representativity of the in situ conditions and helps highlight regions of potential interest for further exploration. For short-term mine planning, a more detailed geological model will help improve the division of ore-waste blocks in geological block models [
1], and also support ore control, such as identifying deleterious minerals and problematic geological units.
Conventional pit wall mapping techniques typically involve geologists physically examining the pit walls in close proximity and laboratory testing of collected field samples. These methods are subjective, often inconsistent, time-consuming, labour-intensive, and can expose personnel to hazards such as falling rocks and operating machineries. Terrestrial-based remote sensing methods such as tripod-mounted LiDAR or hyperspectral (HS) sensors can improve the mapping process, but they do not fully mitigate the abovementioned issues. In general, their limitations include multiple surveying points requirement, the presence of occlusions and vegetations, and a large offset distance from the pit wall that may affect the spatial resolution of the results [
2]. Equipment assemblage and transport still require a great amount of time and labour work. Satellite and airborne remote sensing techniques allow a large area to be covered but at the expense of a much lower spatial resolution since the distance between the sensor and the target is very large. For pit walls, these high-altitude aerial methods cannot sufficiently capture the entire wall surface, if at all, because of the sub-vertical geometry. Therefore, a safer and more efficient mapping approach that mitigates the risks and shortcomings of conventional methods is needed.
Unmanned aerial vehicles (UAVs), also known as drones, have been widely used, with tremendous results, in various fields such as military reconnaissance, agriculture, forestry, and surveying. Unlike terrestrial methods, UAVs do not have the same proximity requirement while achieving greater image resolution. The technical staff can control the vehicle from a safer distance and more secured locations, and the sensors can be much closer to the mine face. Additionally, the assemblage and transportation time is greatly reduced due to the UAVs’ greater range, thereby allowing larger area coverage.
Most research conducted for geological mapping focused on using HS sensors and terrestrial remote sensing techniques [
3,
4,
5,
6,
7,
8,
9,
10,
11]. While some of these studies have investigated pit wall geological mapping using UAVs, the number of publications is relatively small in comparison. These studies typically used UAV HS data as the primary data source but also frequently included terrestrial-based HS data and sometimes supplemented with RGB photogrammetric or LiDAR models. Kirsch et al. [
12] used a combination of UAV and terrestrial-based HS data with UAV RGB photogrammetry integration for mineral classification using Spectral Angle Mapper (SAM) and Random Forest (RF). Barton et al. [
13] performed mineral mapping using terrestrial and UAV HS data alongside UAV LiDAR data via SAM using unsupervised and supervised data analytics techniques. Thiele et al. [
14] created point clouds fused with HS data (hyperclouds) collected through laboratory, ground, and UAV-based means and also trained an RF classifier using only laboratory data of hand samples to map the pit lithologies. In a different study, Thiele et al. [
15] used UAV HS data to map the lithologies of a vertical cliff.
While it has been demonstrated that HS data provide important spectral information, there are some notable downsides which could impede its implementation in mining environments. Firstly, the cost required to purchase software and HS equipment and the time required to train mine personnel may immediately deter some mine operations from using them if they do not believe that the inconveniences and work involved will bring satisfactory economical and operational benefits. Secondly, the HS data file size is extremely large, and there are many complicated postprocessing steps involved. When combined with other forms of data, such as LiDAR, the amount of time and work required further increases. Lastly, there are some instances where RGB images may suffice due to visual differences in the geology, so there may not even be a need for HS sensors, or at the very least, an initial analysis using RGB images should be conducted first to verify the need for subsequent work. Chesley et al. [
16] evaluated the possibility of using fixed-wing UAV images and Structure from Motion (SfM) photogrammetry to characterize sedimentary outcrops. Through the orthomosaics created, they could confirm existing characterization models and observe small-scale features that otherwise would not be possible to find using ground or aerial imaging. Madjid et al. [
17] conducted a similar application study on diagenetic dolomites in mountainous terrain using a multi-rotor UAV. They also calculated the abundance and surface area of the dolomite bodies from the orthomosaics. Nesbit et al. [
18] conducted 3D stratigraphic mapping using fixed-wing UAV images and SfM photogrammetry. Sedimentary logging and various measurements such as thickness and length of the stratigraphic units done directly through the created 3D point cloud models were comparable to ground-based field work despite taking several hours less. Given that many commercial UAVs come with their own RGB sensors and are very user-friendly, data acquisition should be much quicker, and the smaller data size will require less computational resources. In one of the few studies that only used RGB data for pit wall geological mapping, Beretta et al. [
19] used UAV-captured RGB data and traditional machine learning (ML) algorithms, namely Support Vector Machine, k-Nearest Neighbour, Gradient Tree Boost, and RF, to classify pit lithologies and land cover through 3D point cloud models. Three visually distinguishable geological features (Soil, Granite, and Diorite) were identified and mapped on the pit wall.
Machine learning (ML) has been a growing area of research, especially the deep learning (DL) subdomain, which has shown significant advancement in recent years. DL techniques have been applied in many different fields for various applications. DL models can learn features and patterns automatically without manual feature engineering and have been used for mining-related operations such as drilling, blasting, and mineral processing [
20], as well as rock fragmentation analysis [
21], heap leach pad surface moisture monitoring [
22], and rock-type classification using core samples [
23,
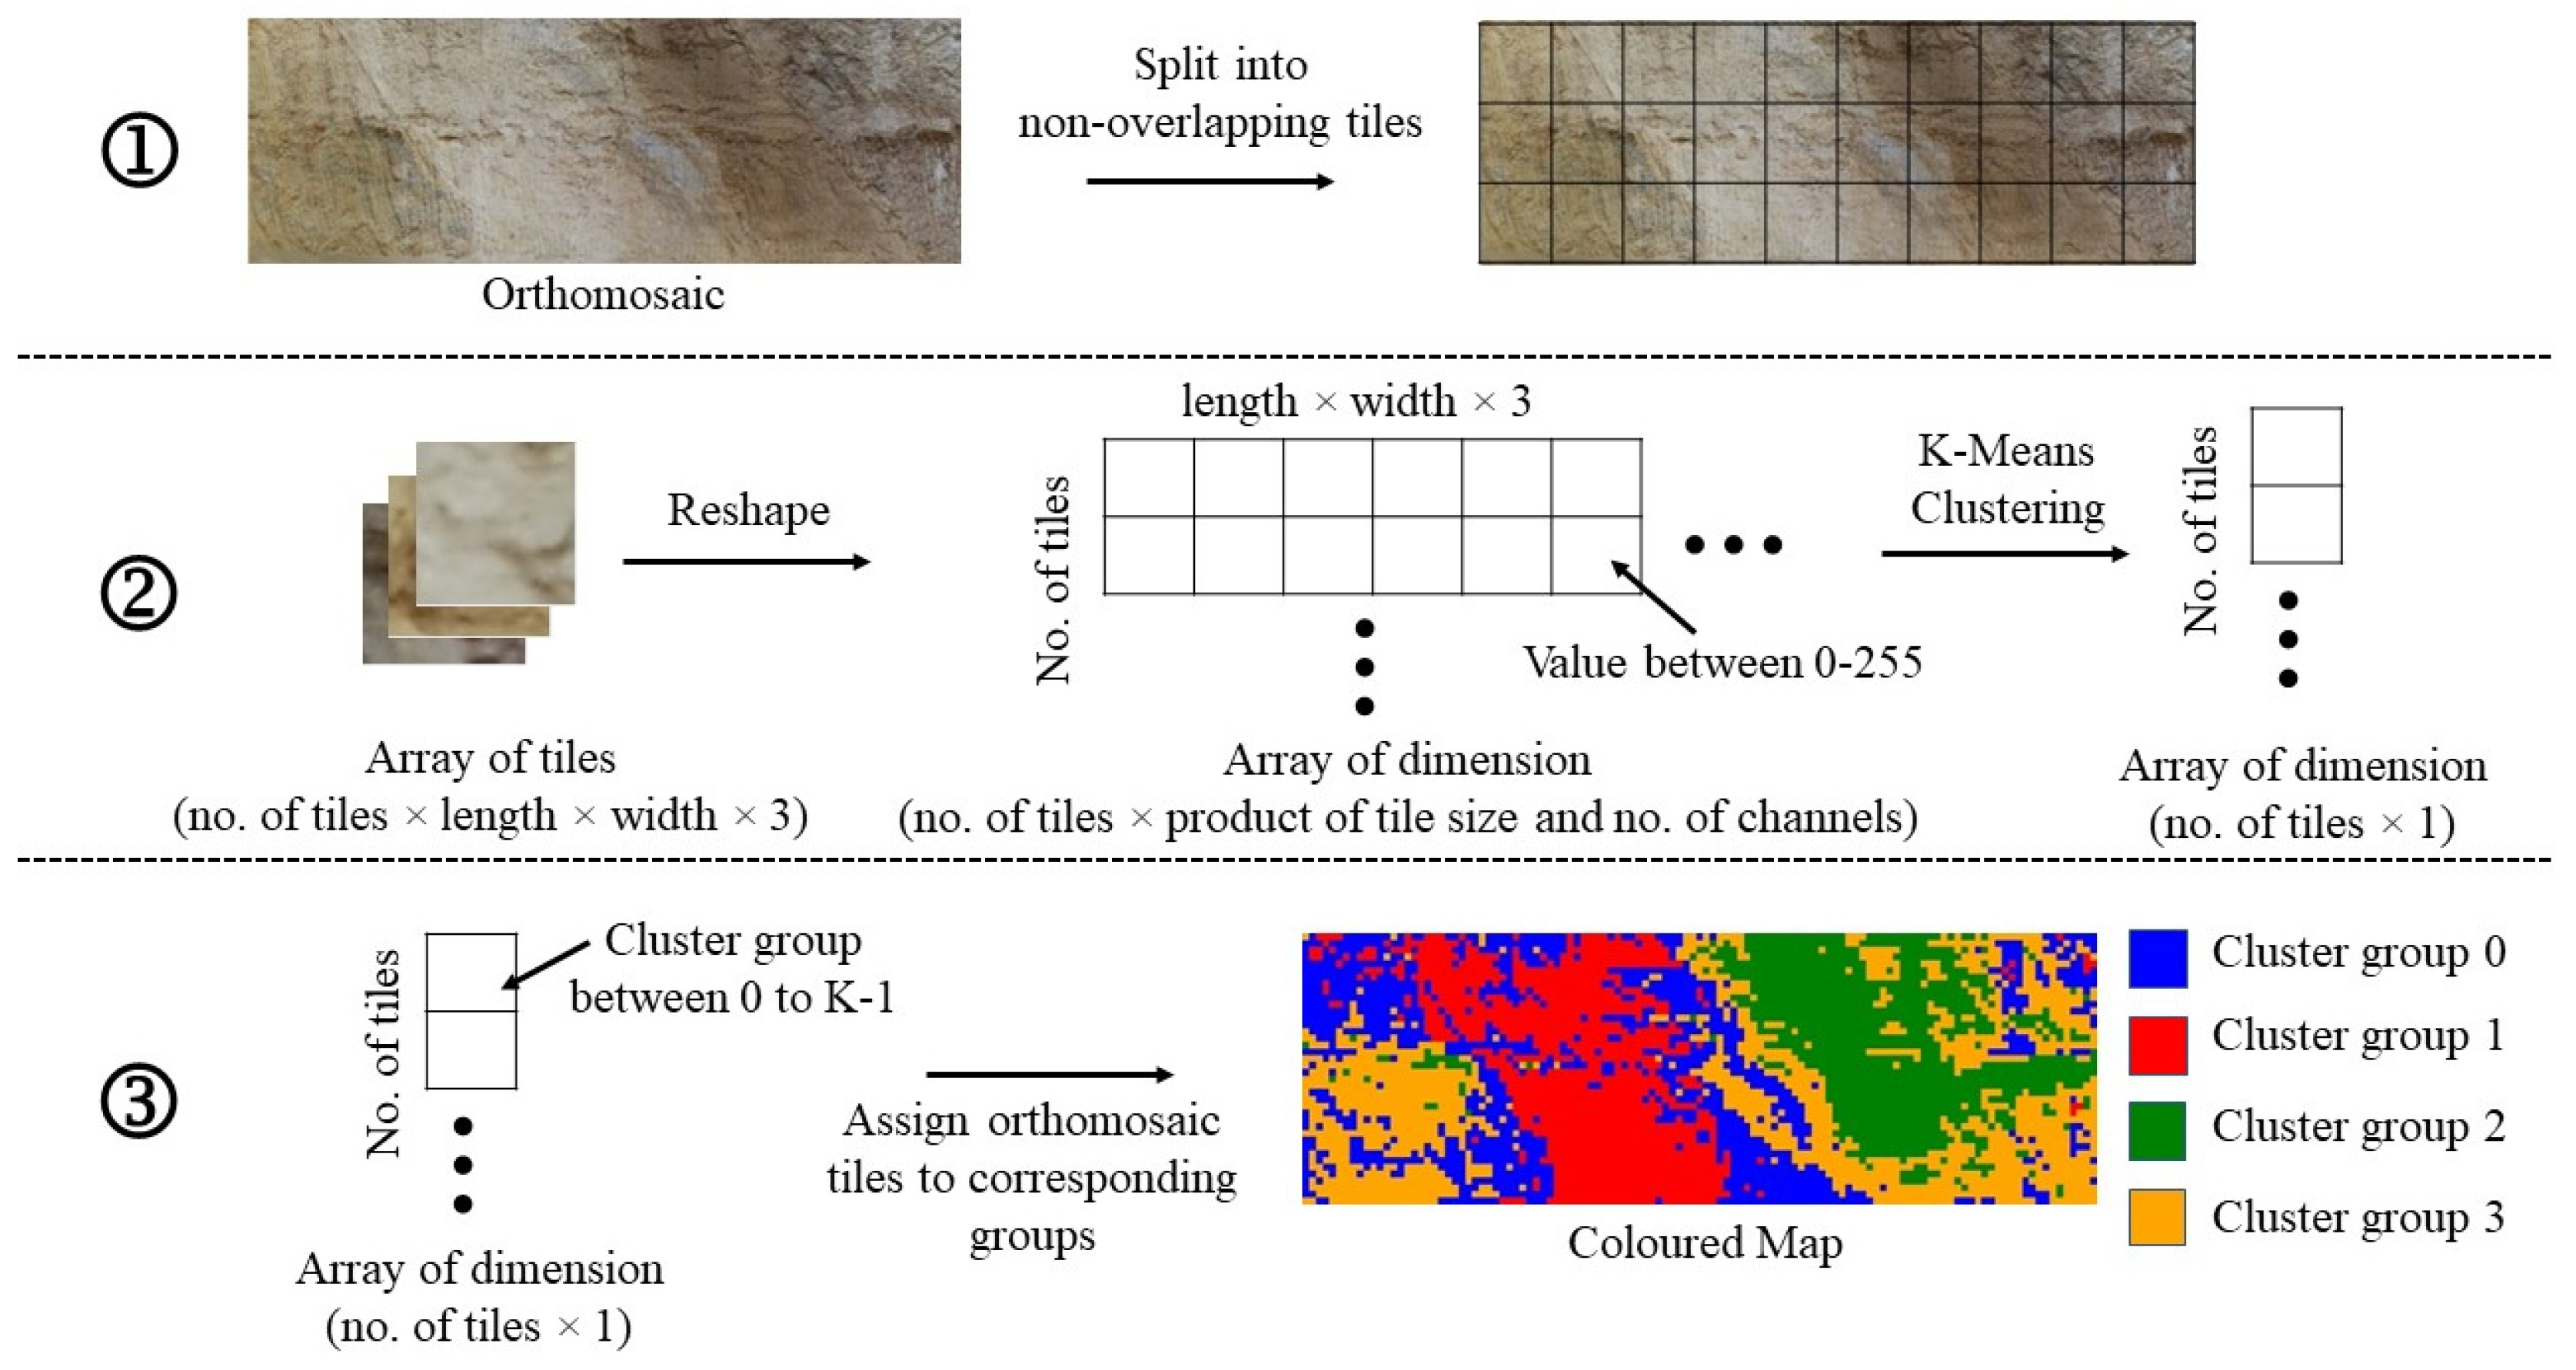
24]. For many ML algorithms, extensive and proper data labelling is extremely important. Given that it is frequently time-consuming and tedious, alternative solutions such as unsupervised learning methods may help alleviate this issue. These methods include different clustering algorithms, such as K-Means clustering [
25,
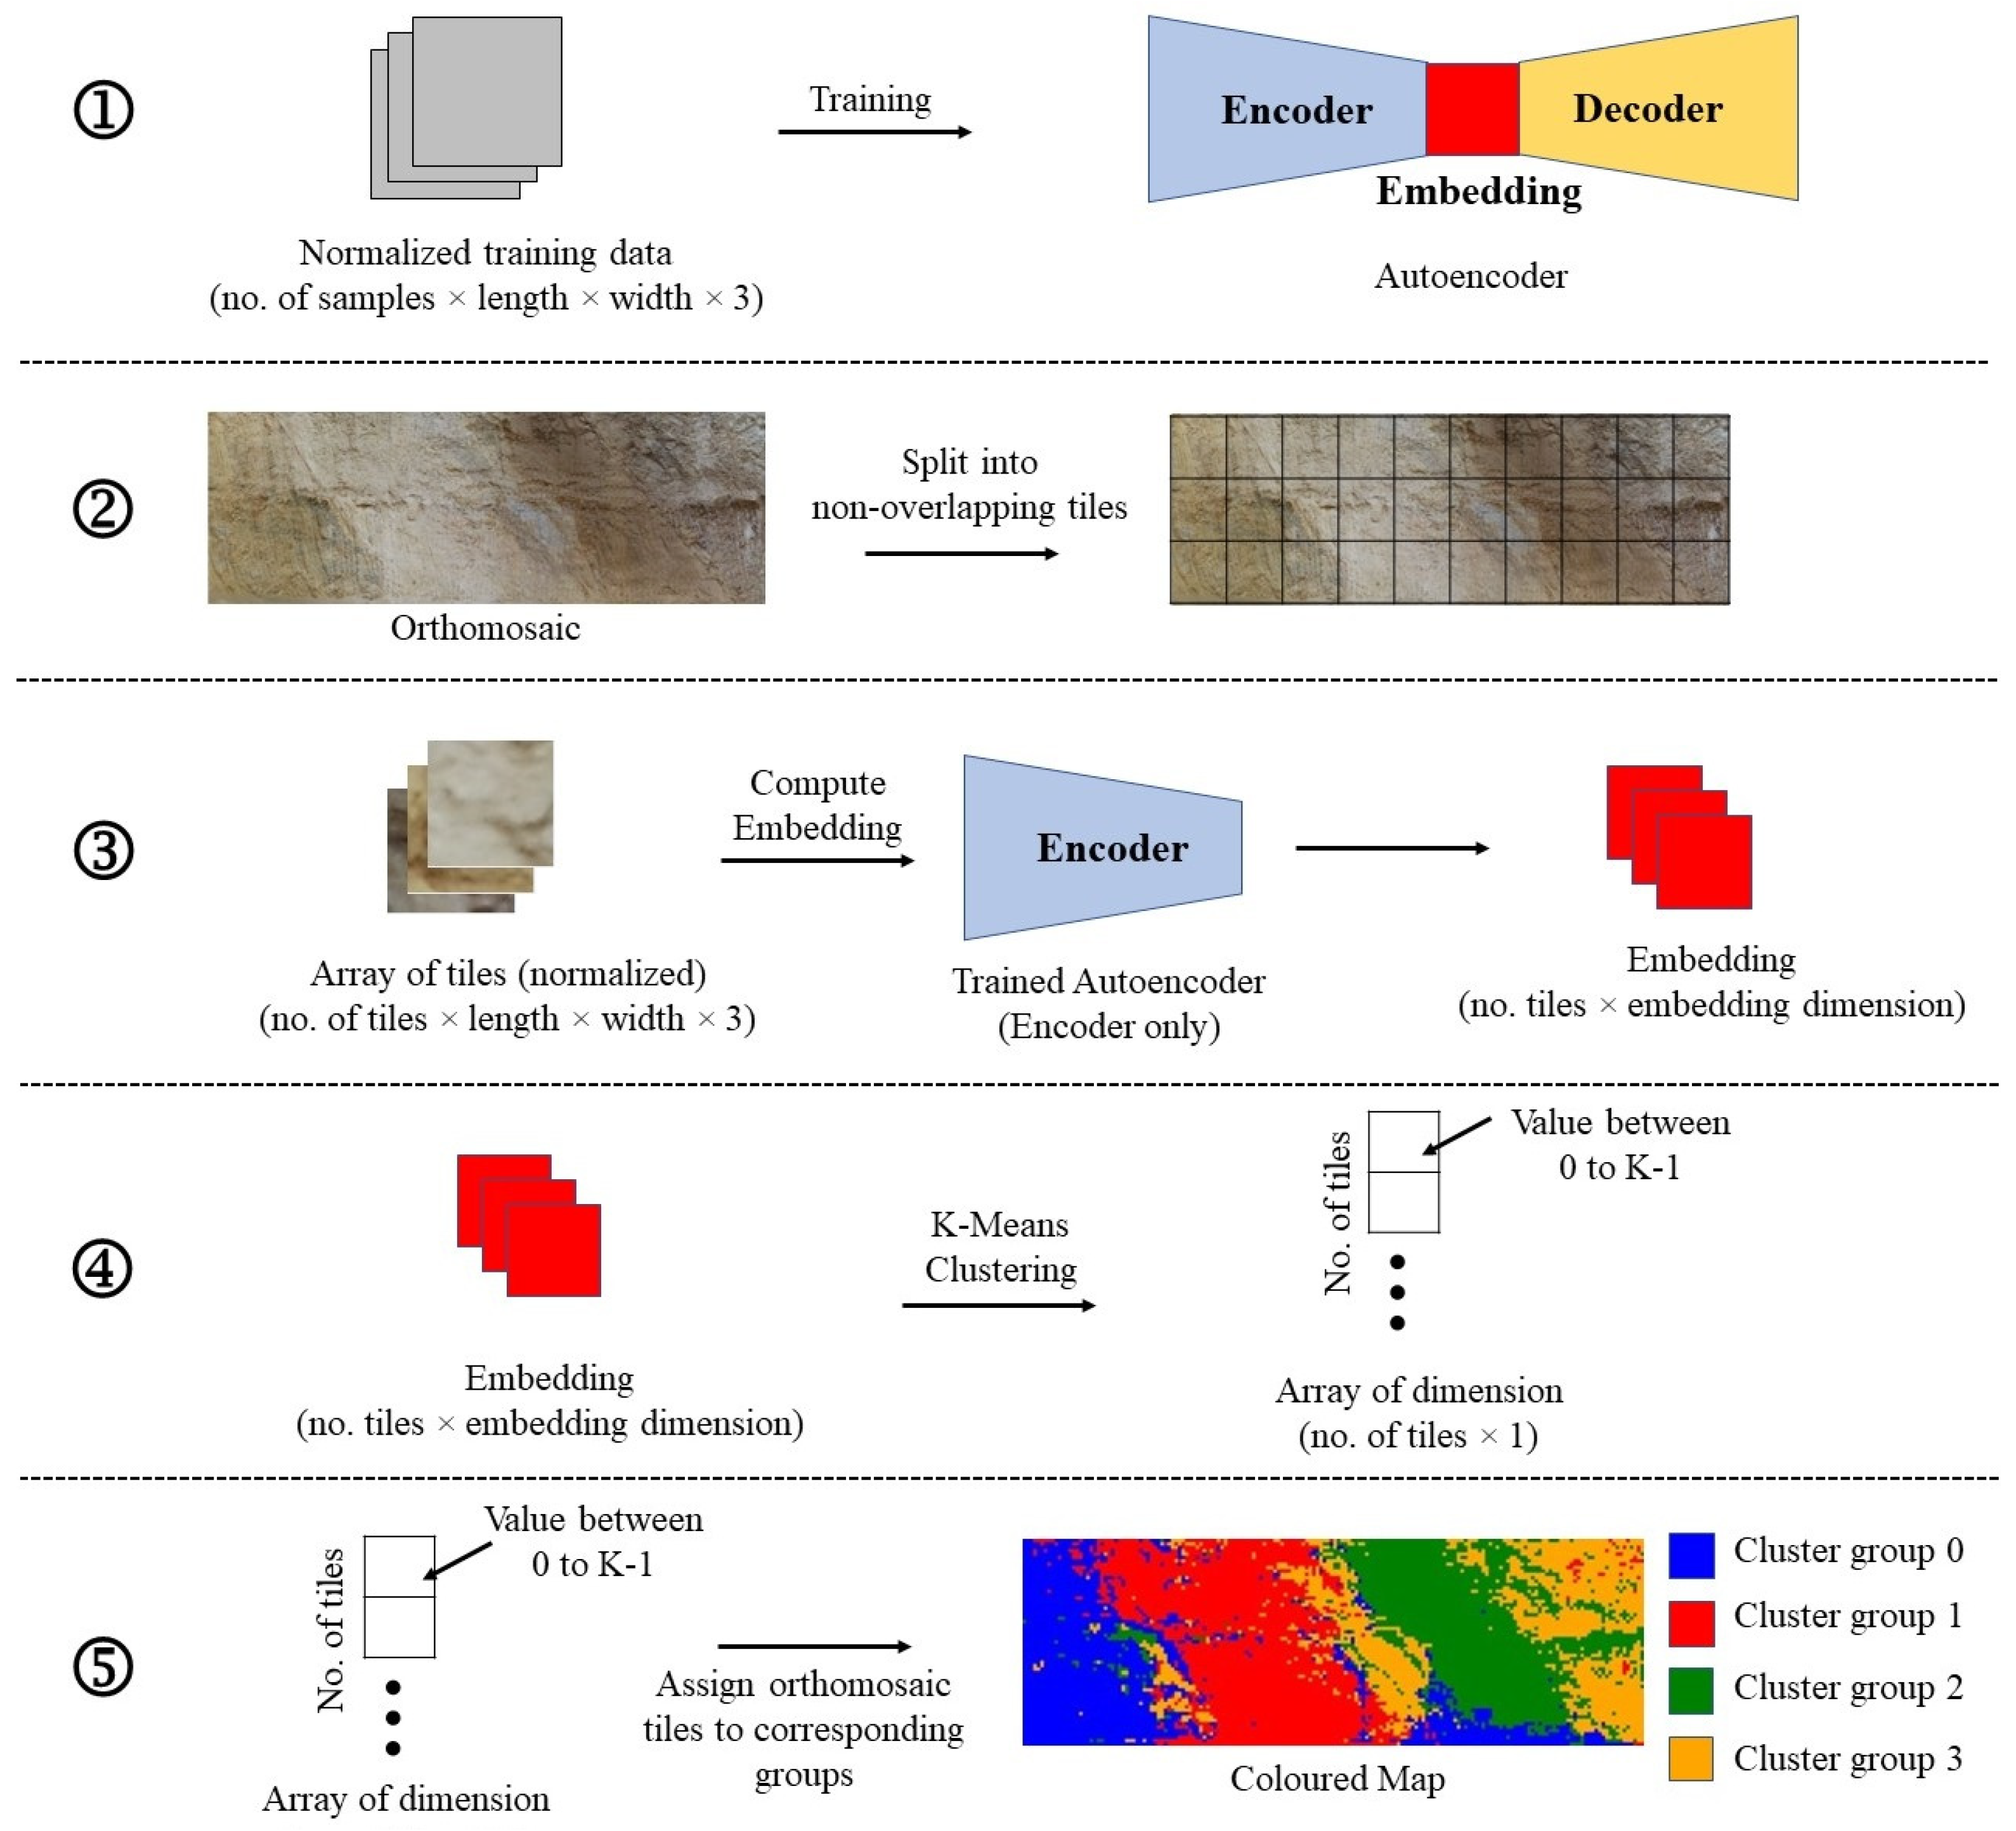
26], as well as an unsupervised DL approach called autoencoders. The concept of combining autoencoders with clustering algorithms has recently drawn increased interest, with many studies using DL architectures and traditional clustering techniques [
27,
28,
29,
30]. However, its use for geological and mining applications has not been well studied.
This study investigates using UAV-acquired RGB pit wall images and unsupervised learning algorithms to map different geological units of small pit wall sections in two mine sites. In particular, the algorithms are used to investigate their potential for geological pit wall mapping when there is an absence of ground truth information. The outcome of this work can form a basis for comparing results obtained through other remote sensing techniques, ML algorithms, and data types.
3. Results
3.1. Top Pit
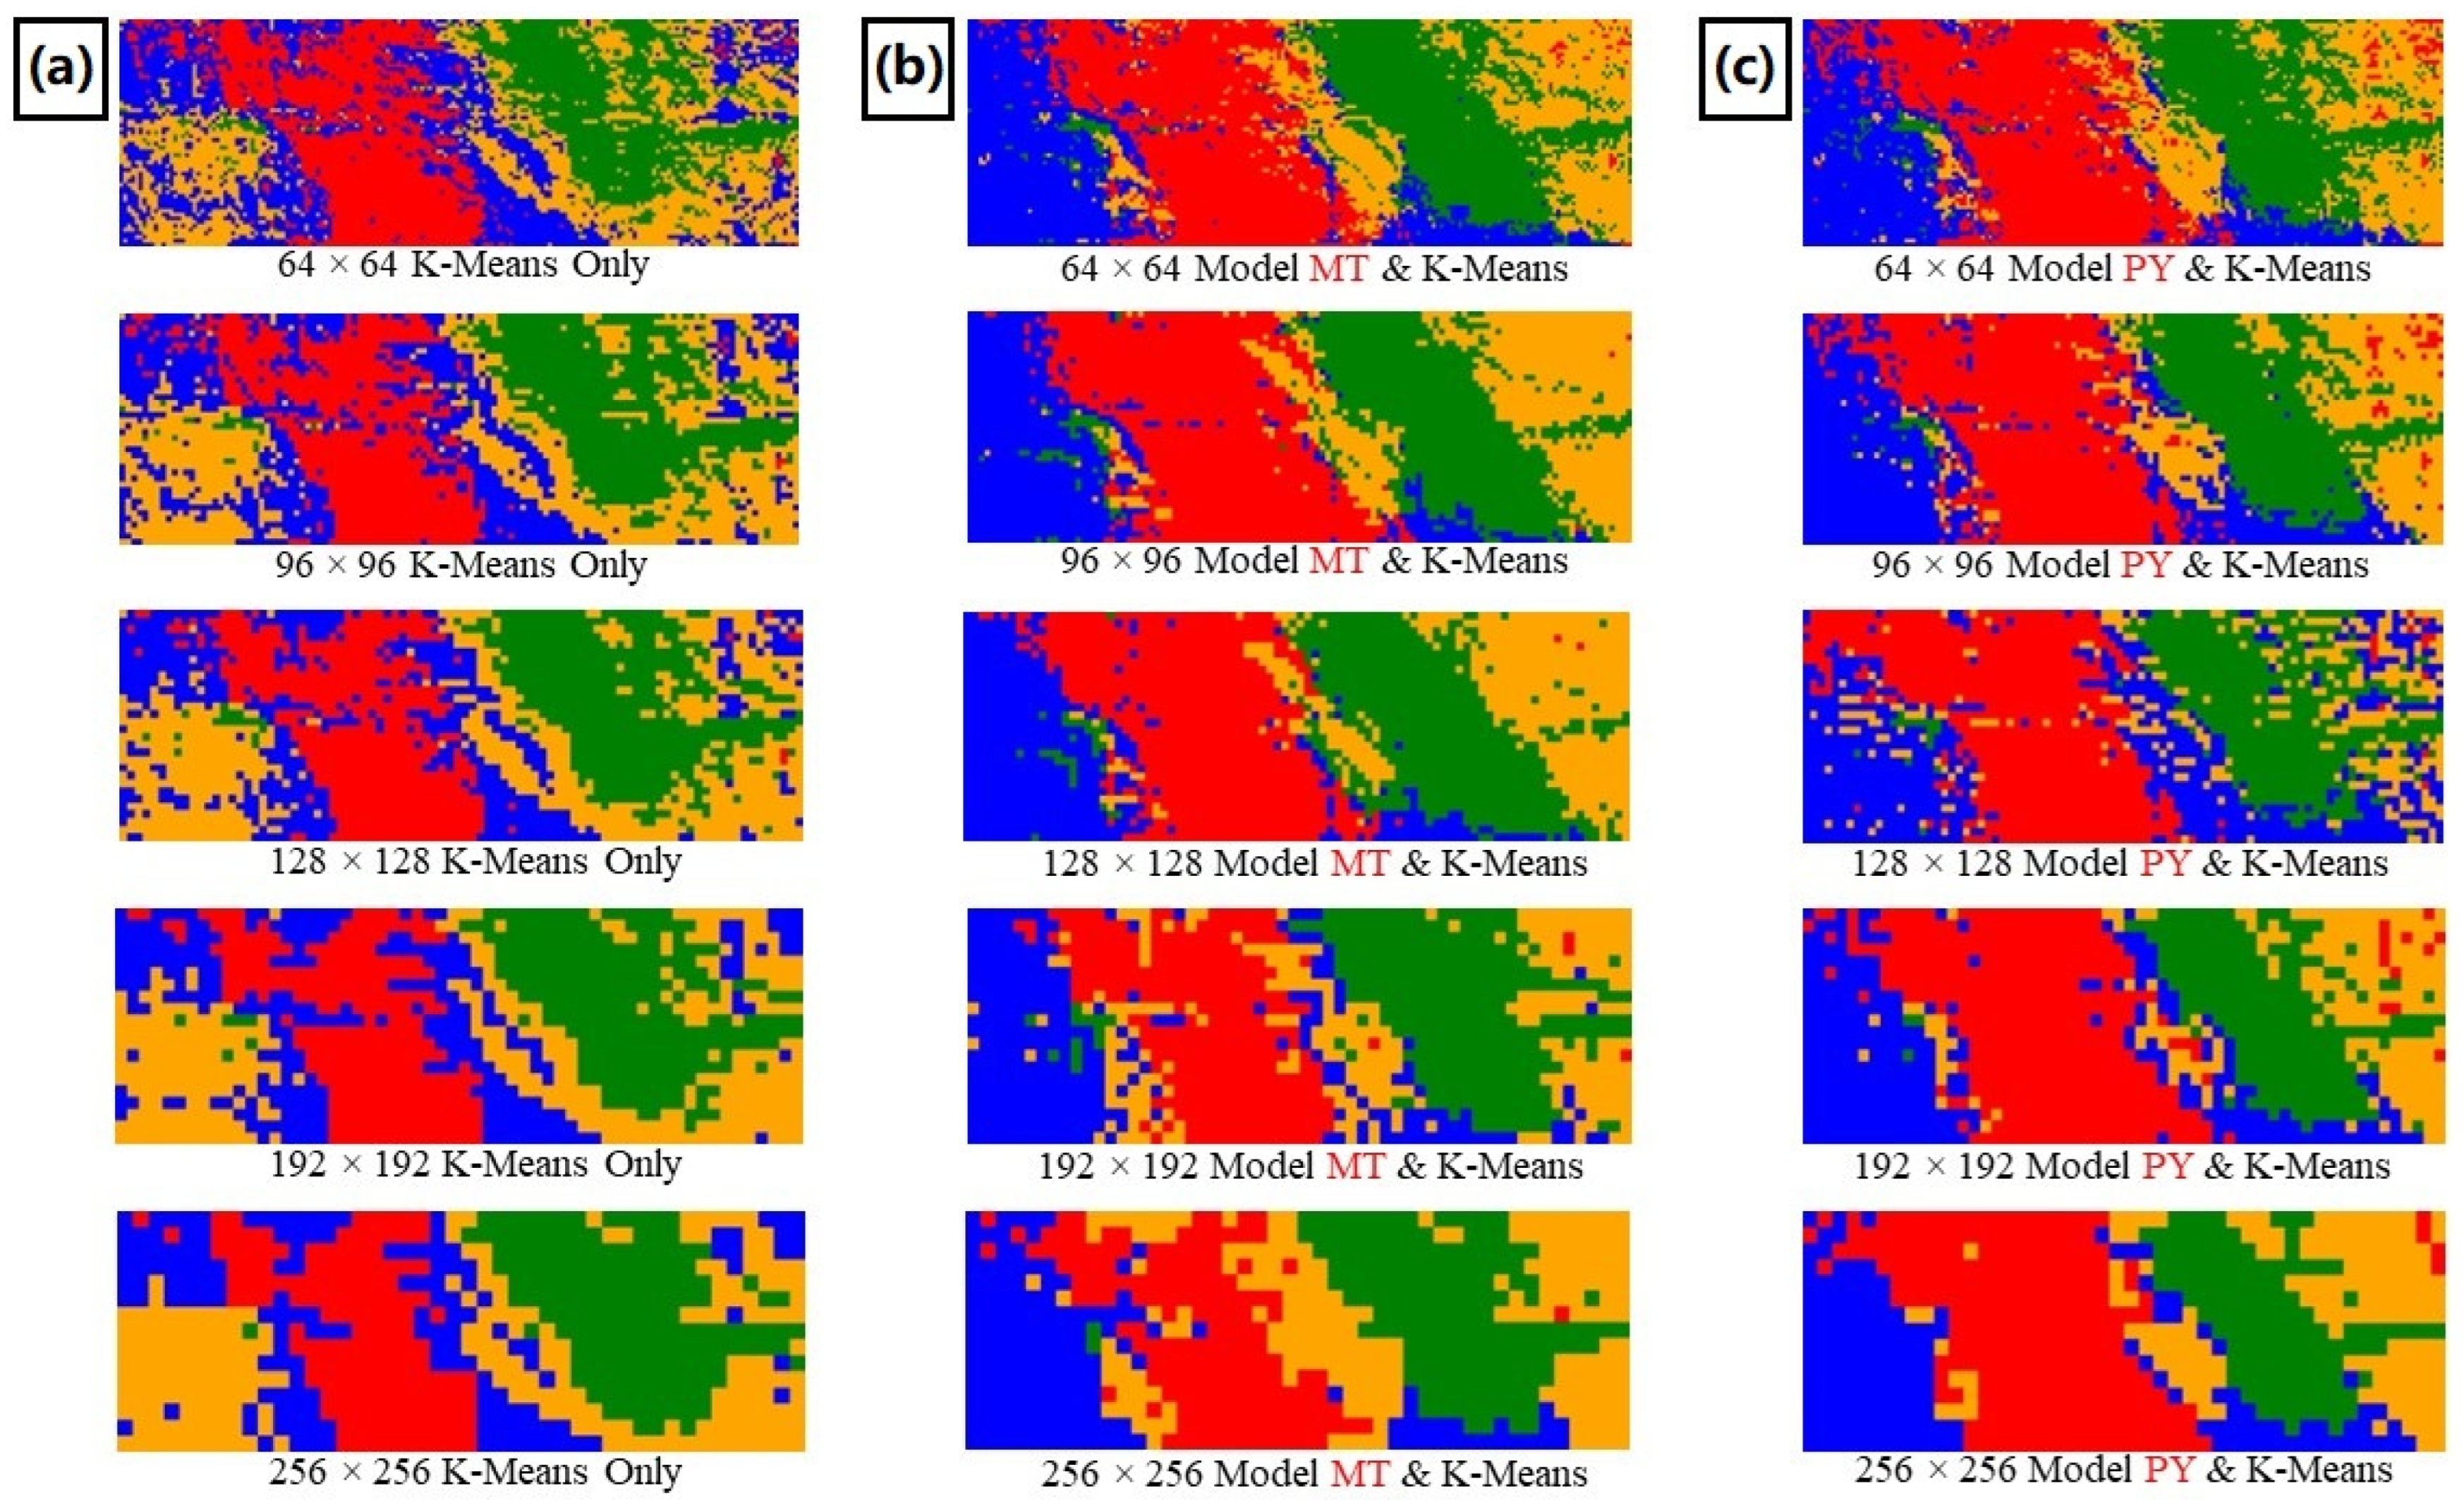
Figure 8 shows the generated maps using the K-Means clustering approach and the autoencoder-first K-Means clustering approaches. To complement the qualitative assessment, tile accuracies (
Table 7) and F1 scores (
Table 8) were calculated to provide some numerical metrics. Tile accuracy is defined as the percentage of correctly clustered tiles compared to the ground truth. This involves converting the ground truth map from pixel-level resolution to tile-level resolution. For the ground truth map, if a tile contained pixels from different classes, the class with the most pixels was assigned to the whole tile.
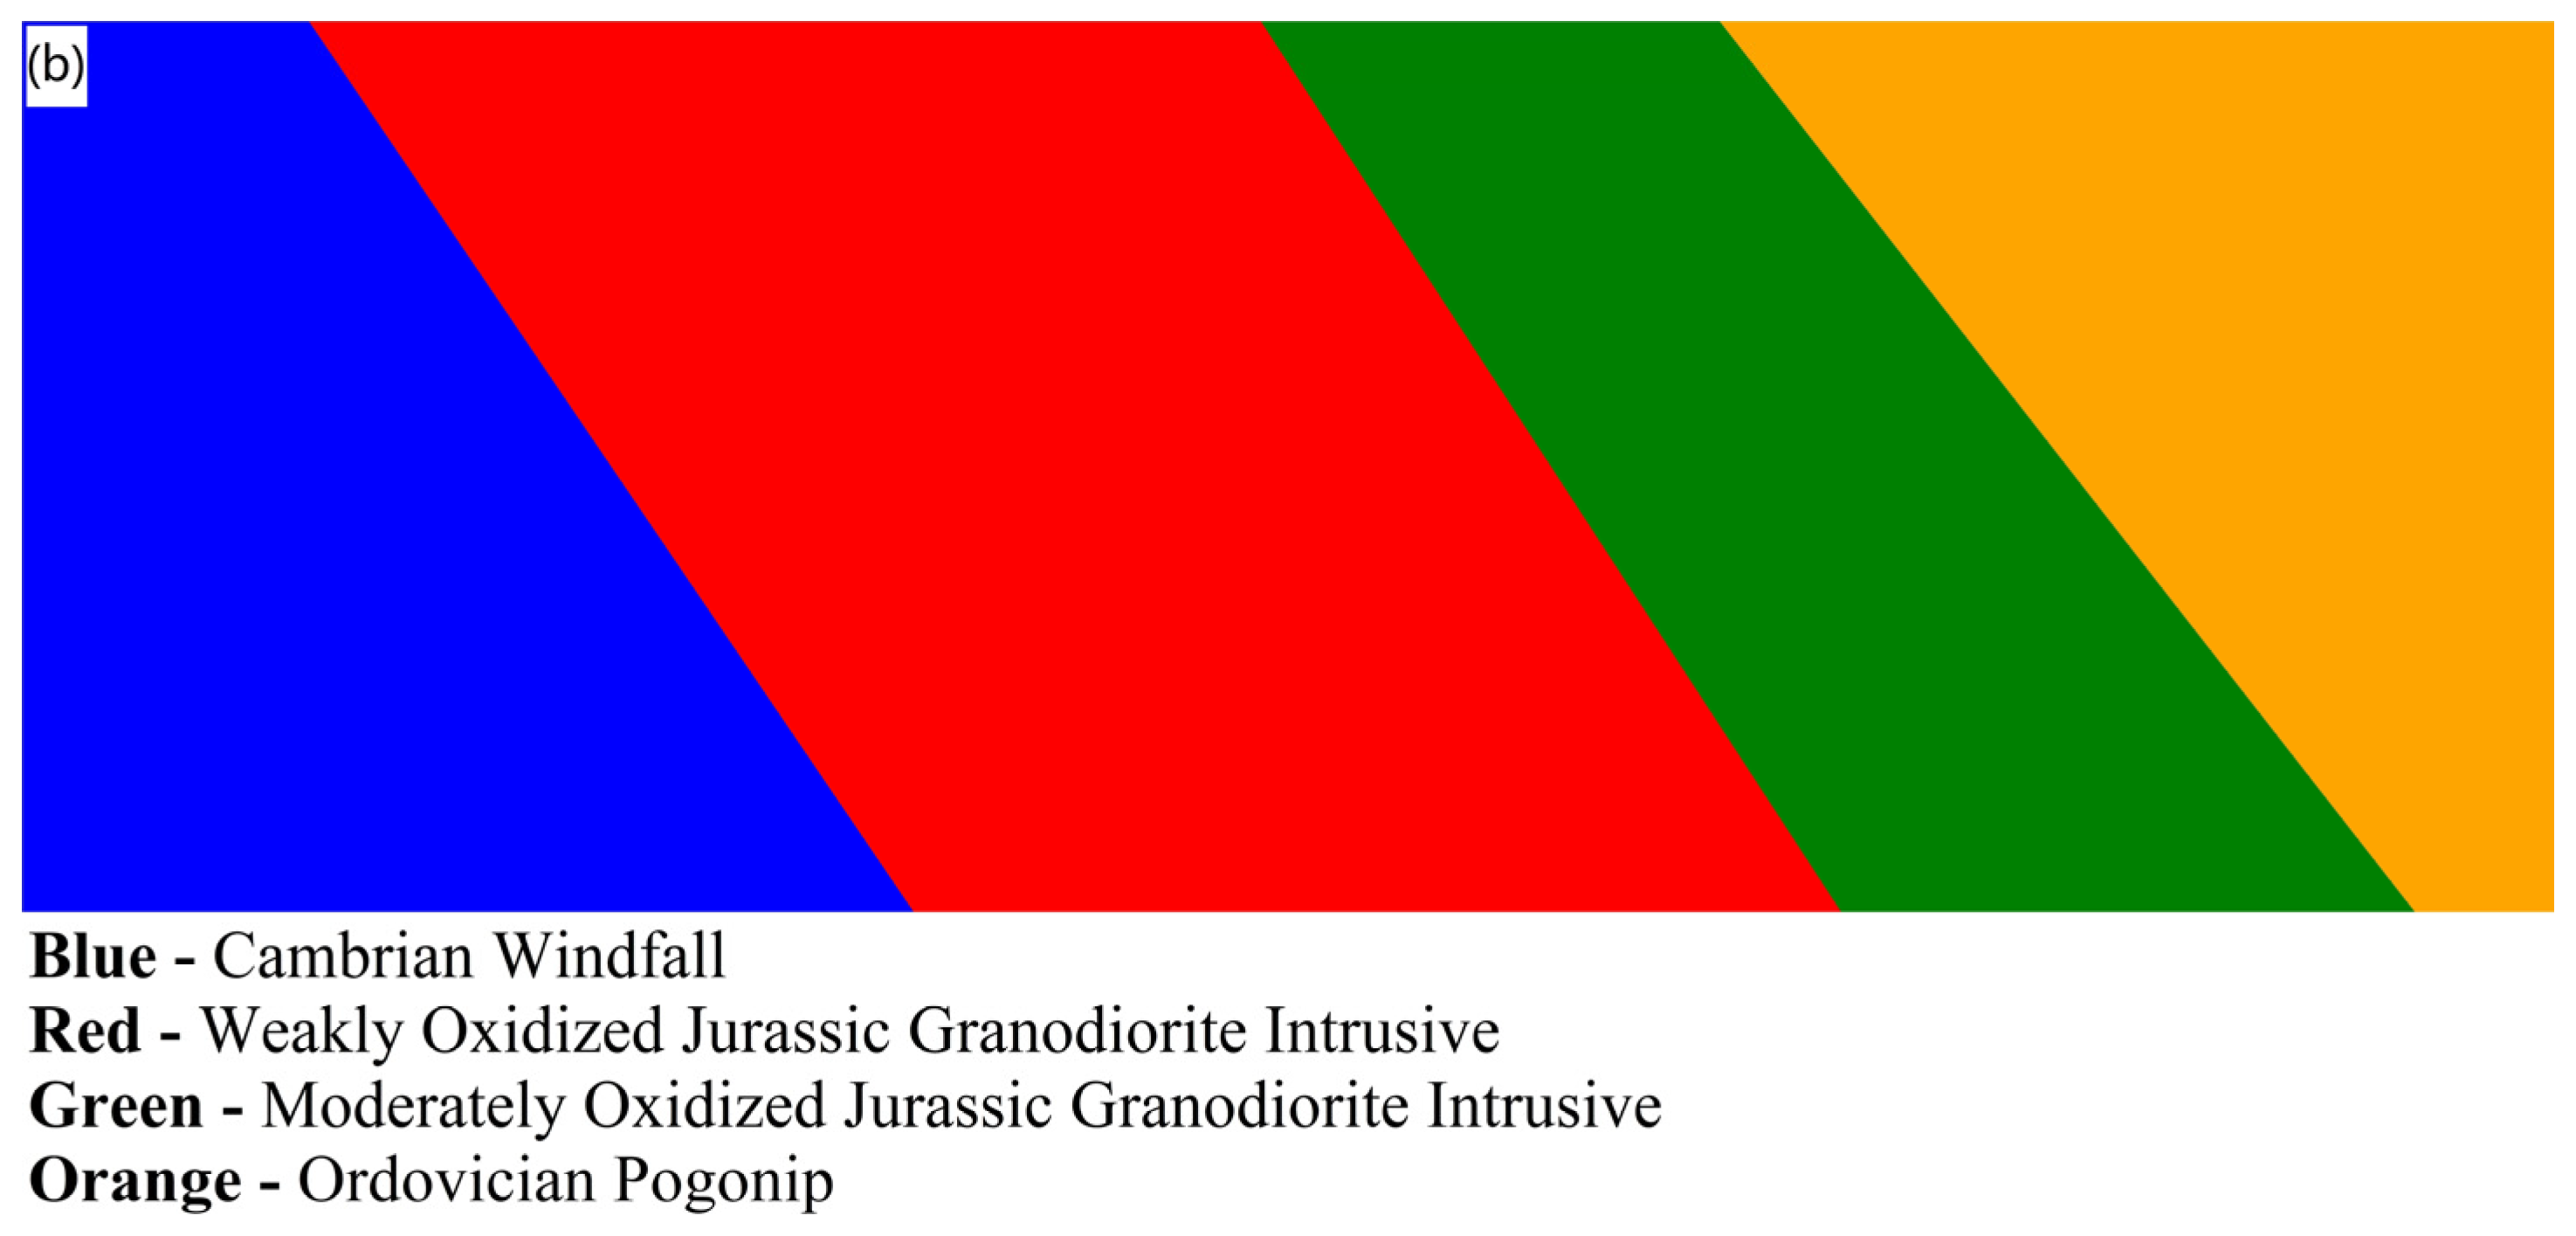
The results between the two unsupervised learning approaches are visually comparable to each other and the ground truth in
Figure 4b, particularly between the outputs of the two autoencoder architectures. However, based on accuracy and F1 scores, it is clear that K-Means clustering by itself does not perform as well. Cambrian Windfall (blue) and Ordovician Pogonip (orange) predictions are much better across all tile dimensions when the encoder embeddings are clustered instead of the original tiles. The maps for different tile dimensions are nearly identical within the K-Means clustering-only results. This suggests that even the smallest tile dimension used is too large for this clustering-only approach due to the high data dimensions when clustering.
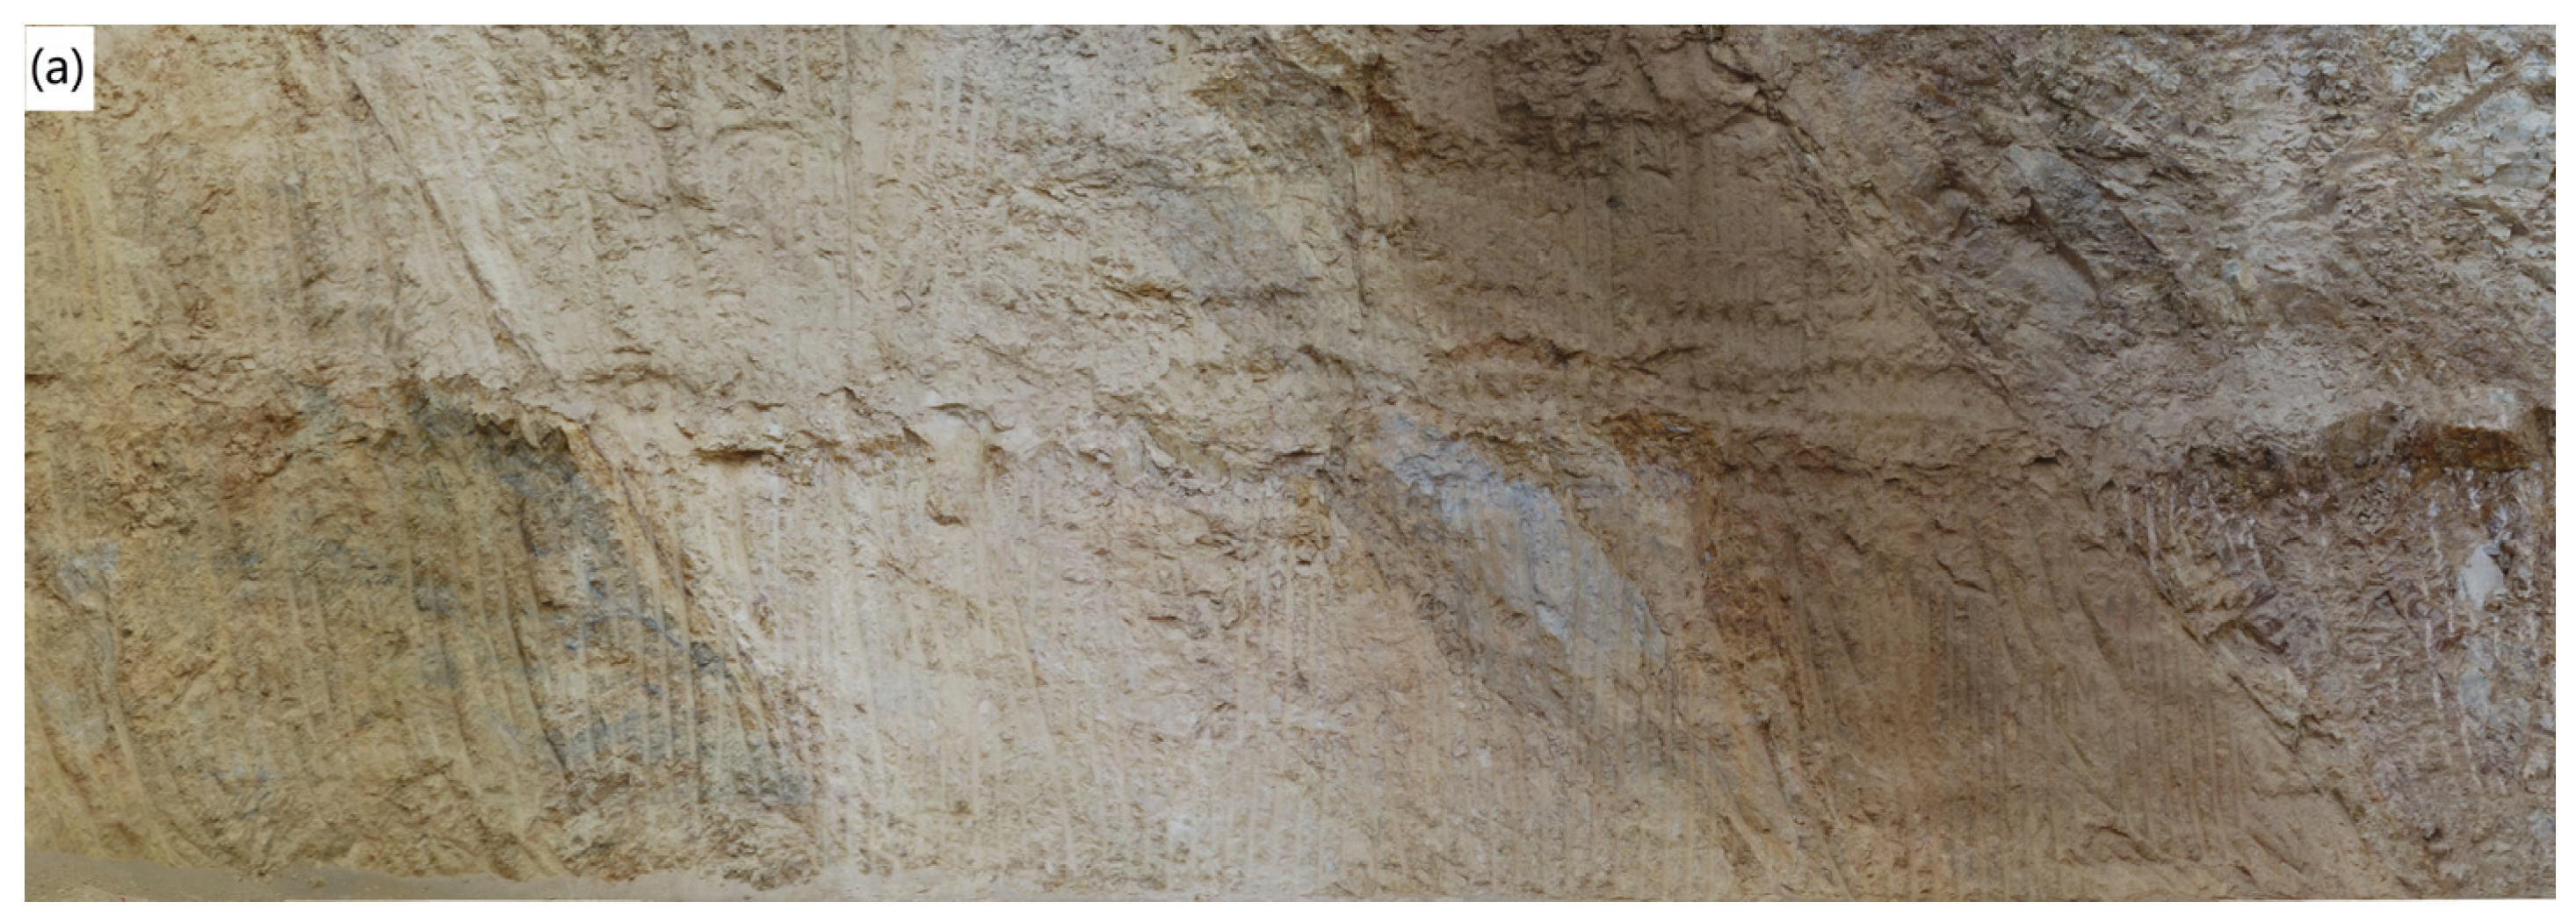
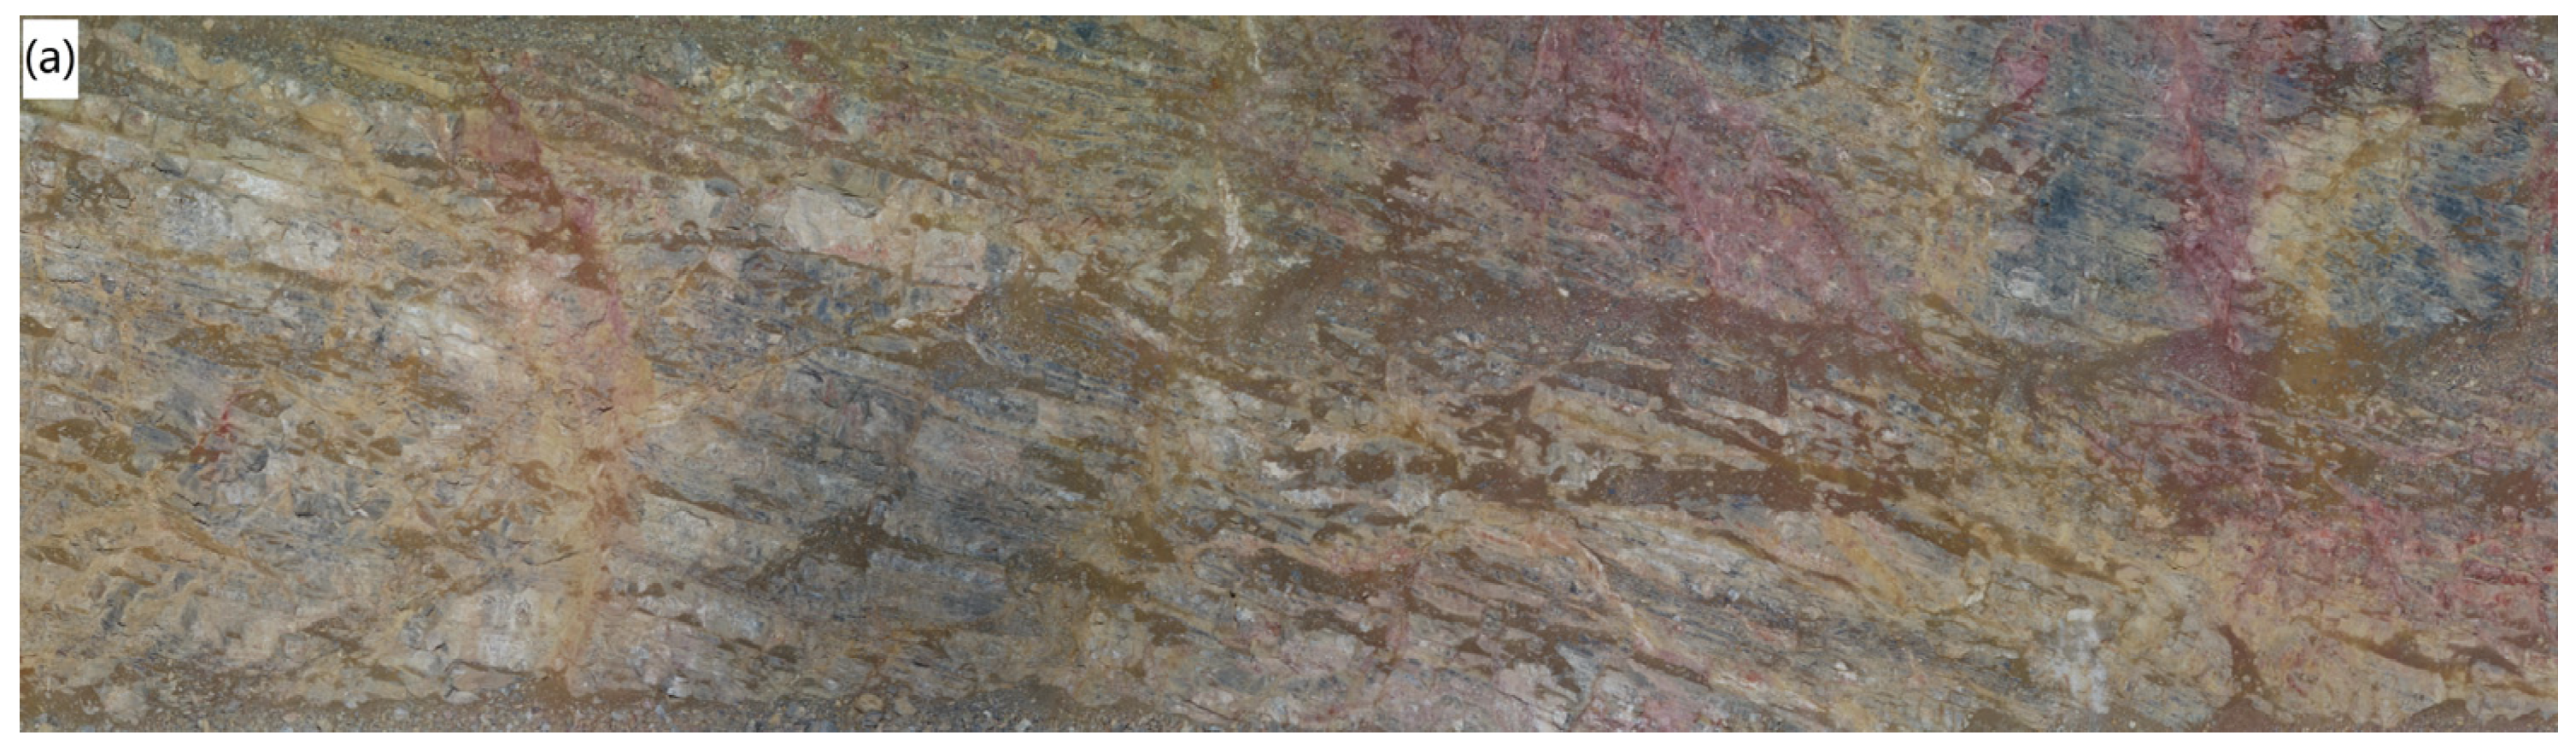
The weakly oxidized Intrusive (red) and moderately oxidized Intrusive (green) match closely across all results, while differences occur primarily in the Cambrian Windfall (blue) and Ordovician Pogonip (orange). From observing the orthomosaic (
Figure 4a), weakly oxidized Intrusive and moderately oxidized Intrusive represent areas of more uniform colouring than Cambrian Windfall and Ordovician Pogonip. This is the most apparent for Ordovician Pogonip, where colour differentials are the most extreme. Additionally, a grey area between weakly oxidized Intrusive and moderately oxidized Intrusive was labelled as the former in the ground truth map but clustered with Ordovician Pogonip in all the results. This is likely due to the presence of grey-coloured regions in the Pogonip. This also occurs near the lower boundary between the Cambrian Windfall and Weakly oxidized Intrusive to a lesser extent. These observations suggest that colour is the main feature for clustering as expected.
For the maps generated using only K-Means, the Cambrian Windfall region is separated into two parts: the bottom portion is clustered with the Pogonip, and the boundary between the weakly oxidized Intrusive and moderately oxidized Intrusive are clustered with the Cambrian Windfall and Pogonip. The maps generated using autoencoder-based K-Means also exhibit the latter but to a much lesser degree. In the orthomosaic, these regions correspond to different shades of the same colour, which may indicate that the degree of shading plays a role in prediction; however, using an autoencoder makes the model more robust to slight changes in shading.
In the middle of the maps for the weakly oxidized Intrusive region, there is a tiny part that has been clustered as a different class, and this is slightly more apparent at smaller tile dimensions. Looking at the orthomosaic (
Figure 4a), this corresponds to shadows caused by the rough textures, which shows that lighting condition has a significant effect. Still, it is slightly reduced when tiles increase in size. This is perhaps because the increasing number of surrounding normal pixels is “covering up the shadows”. In other words, as the number of pixels in each tile increases, the less percentage of the “shadow” pixels are present in the tile, thereby decreasing their influence on the clustering process. Note that this is not the case for the Pogonips because the middle part is actually of similar colour to the moderately oxidized Intrusive.
The results of the two autoencoder architectures are very similar except for the 128 × 128 tiled map for Model PY, which shows significantly higher predictions of Cambrian Windfall. This is mainly due to how the algorithms’ parameters were initialized because the convergence point can differ depending on the starting parameter values. Model PY produces slightly better results at 192 × 192 and 256 × 256 tile dimensions since Model MT erroneously predicted many weakly oxidized Intrusive and moderately oxidized Intrusive areas as Pogonip. Overall, given the simpler spatial distribution of the geology, the coarser resolutions do not appreciably deter visual interpretation of the maps. The lithological units’ boundaries are also somewhat consistent with the ground truth.
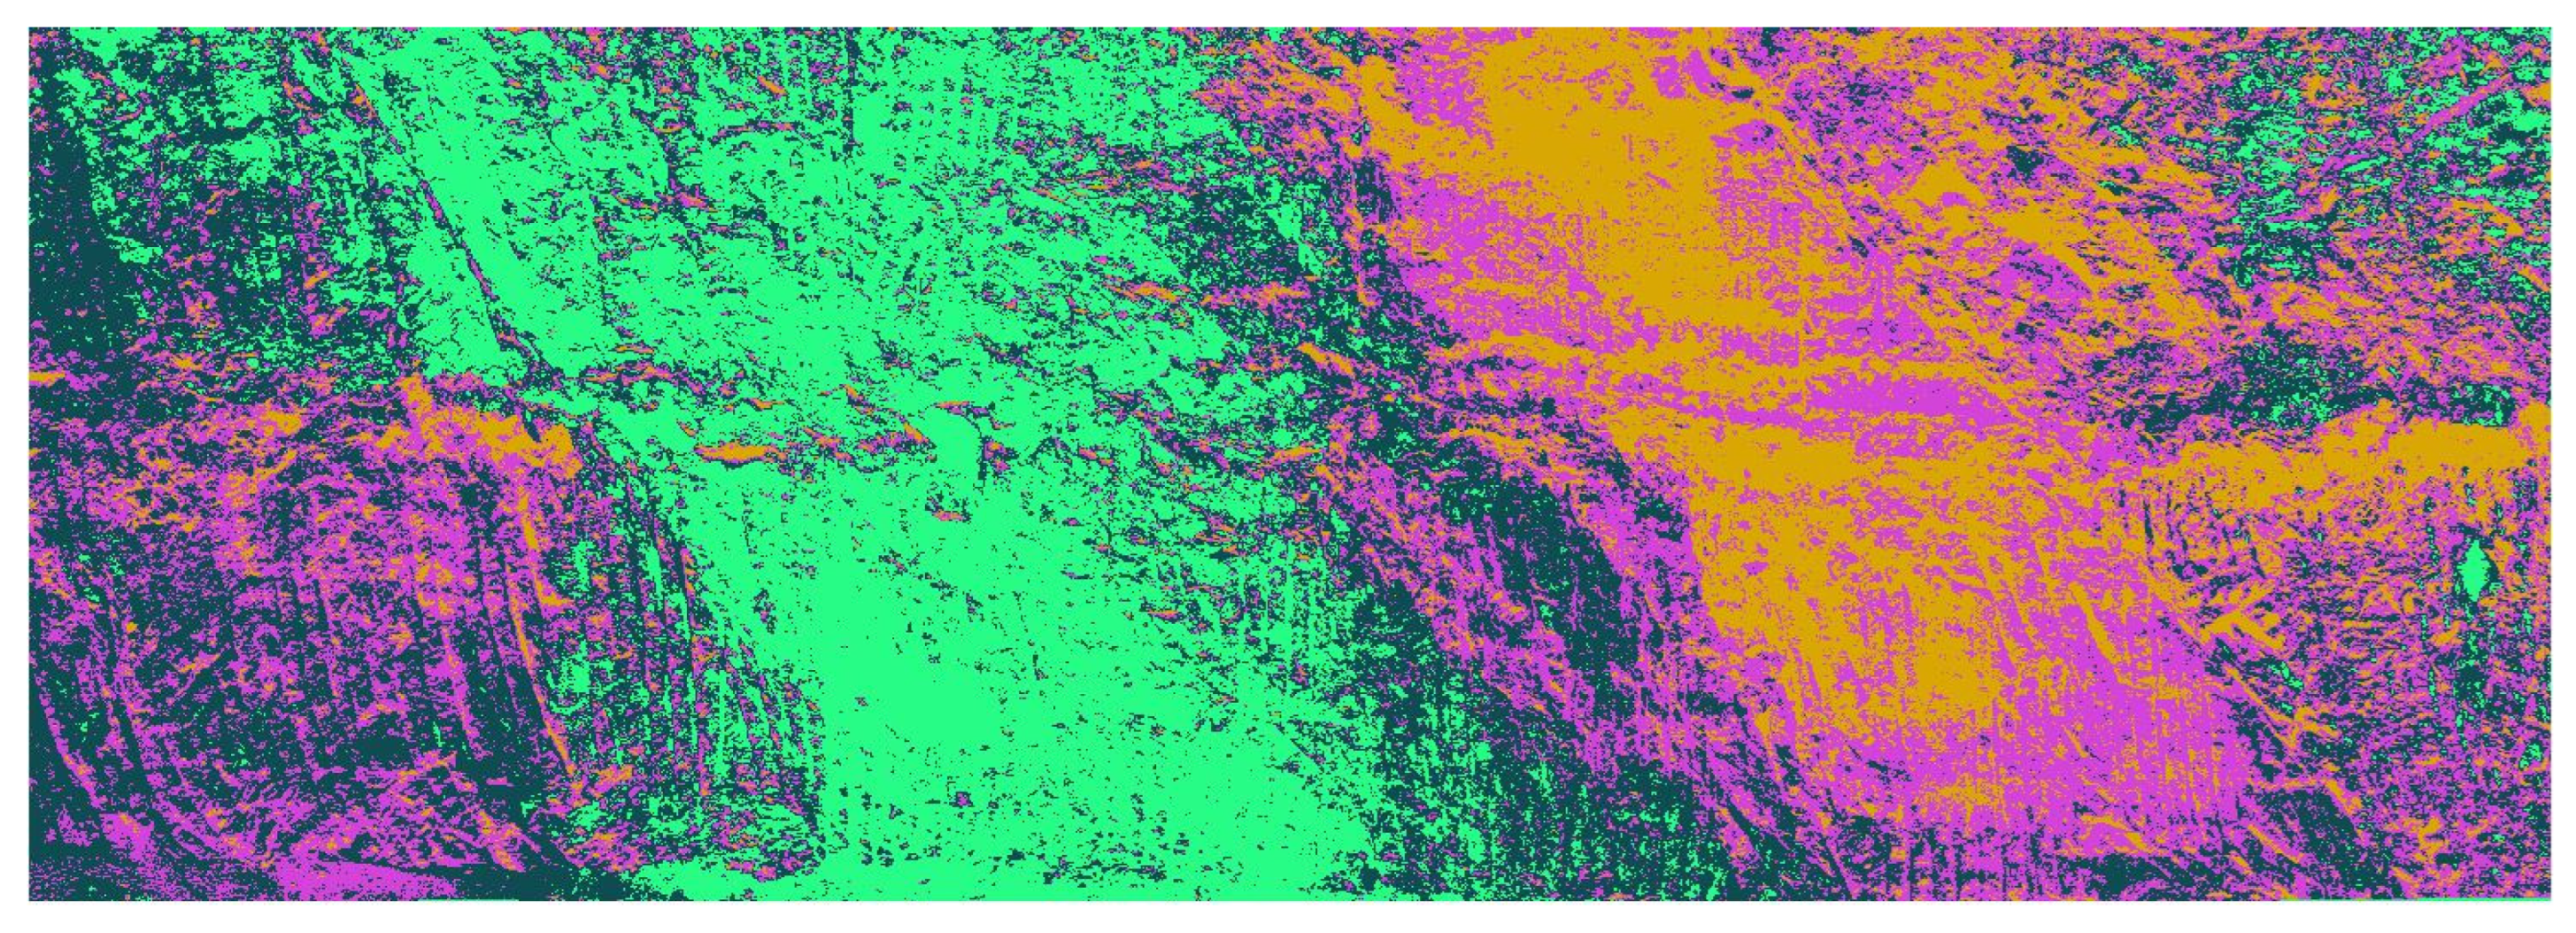
Lastly, the segmentation result in
Figure 9 is reminiscent of the K-Means clustering-only results but with very fine resolution. One notable difference is the vertical streaks across the map, mainly shown in black colour, which were not present in the classification results. While these may suggest some type of structural pattern, they are more likely scratch marks left by shovel claws during excavations. This type of scenario not only deters from the visual clarity of the maps but can also be misleading, so caution should be exerted when making interpretations.
3.2. Pick Pit
Tile accuracies and F1 scores are listed in
Table 9 and
Table 10, respectively, for Pick pit.
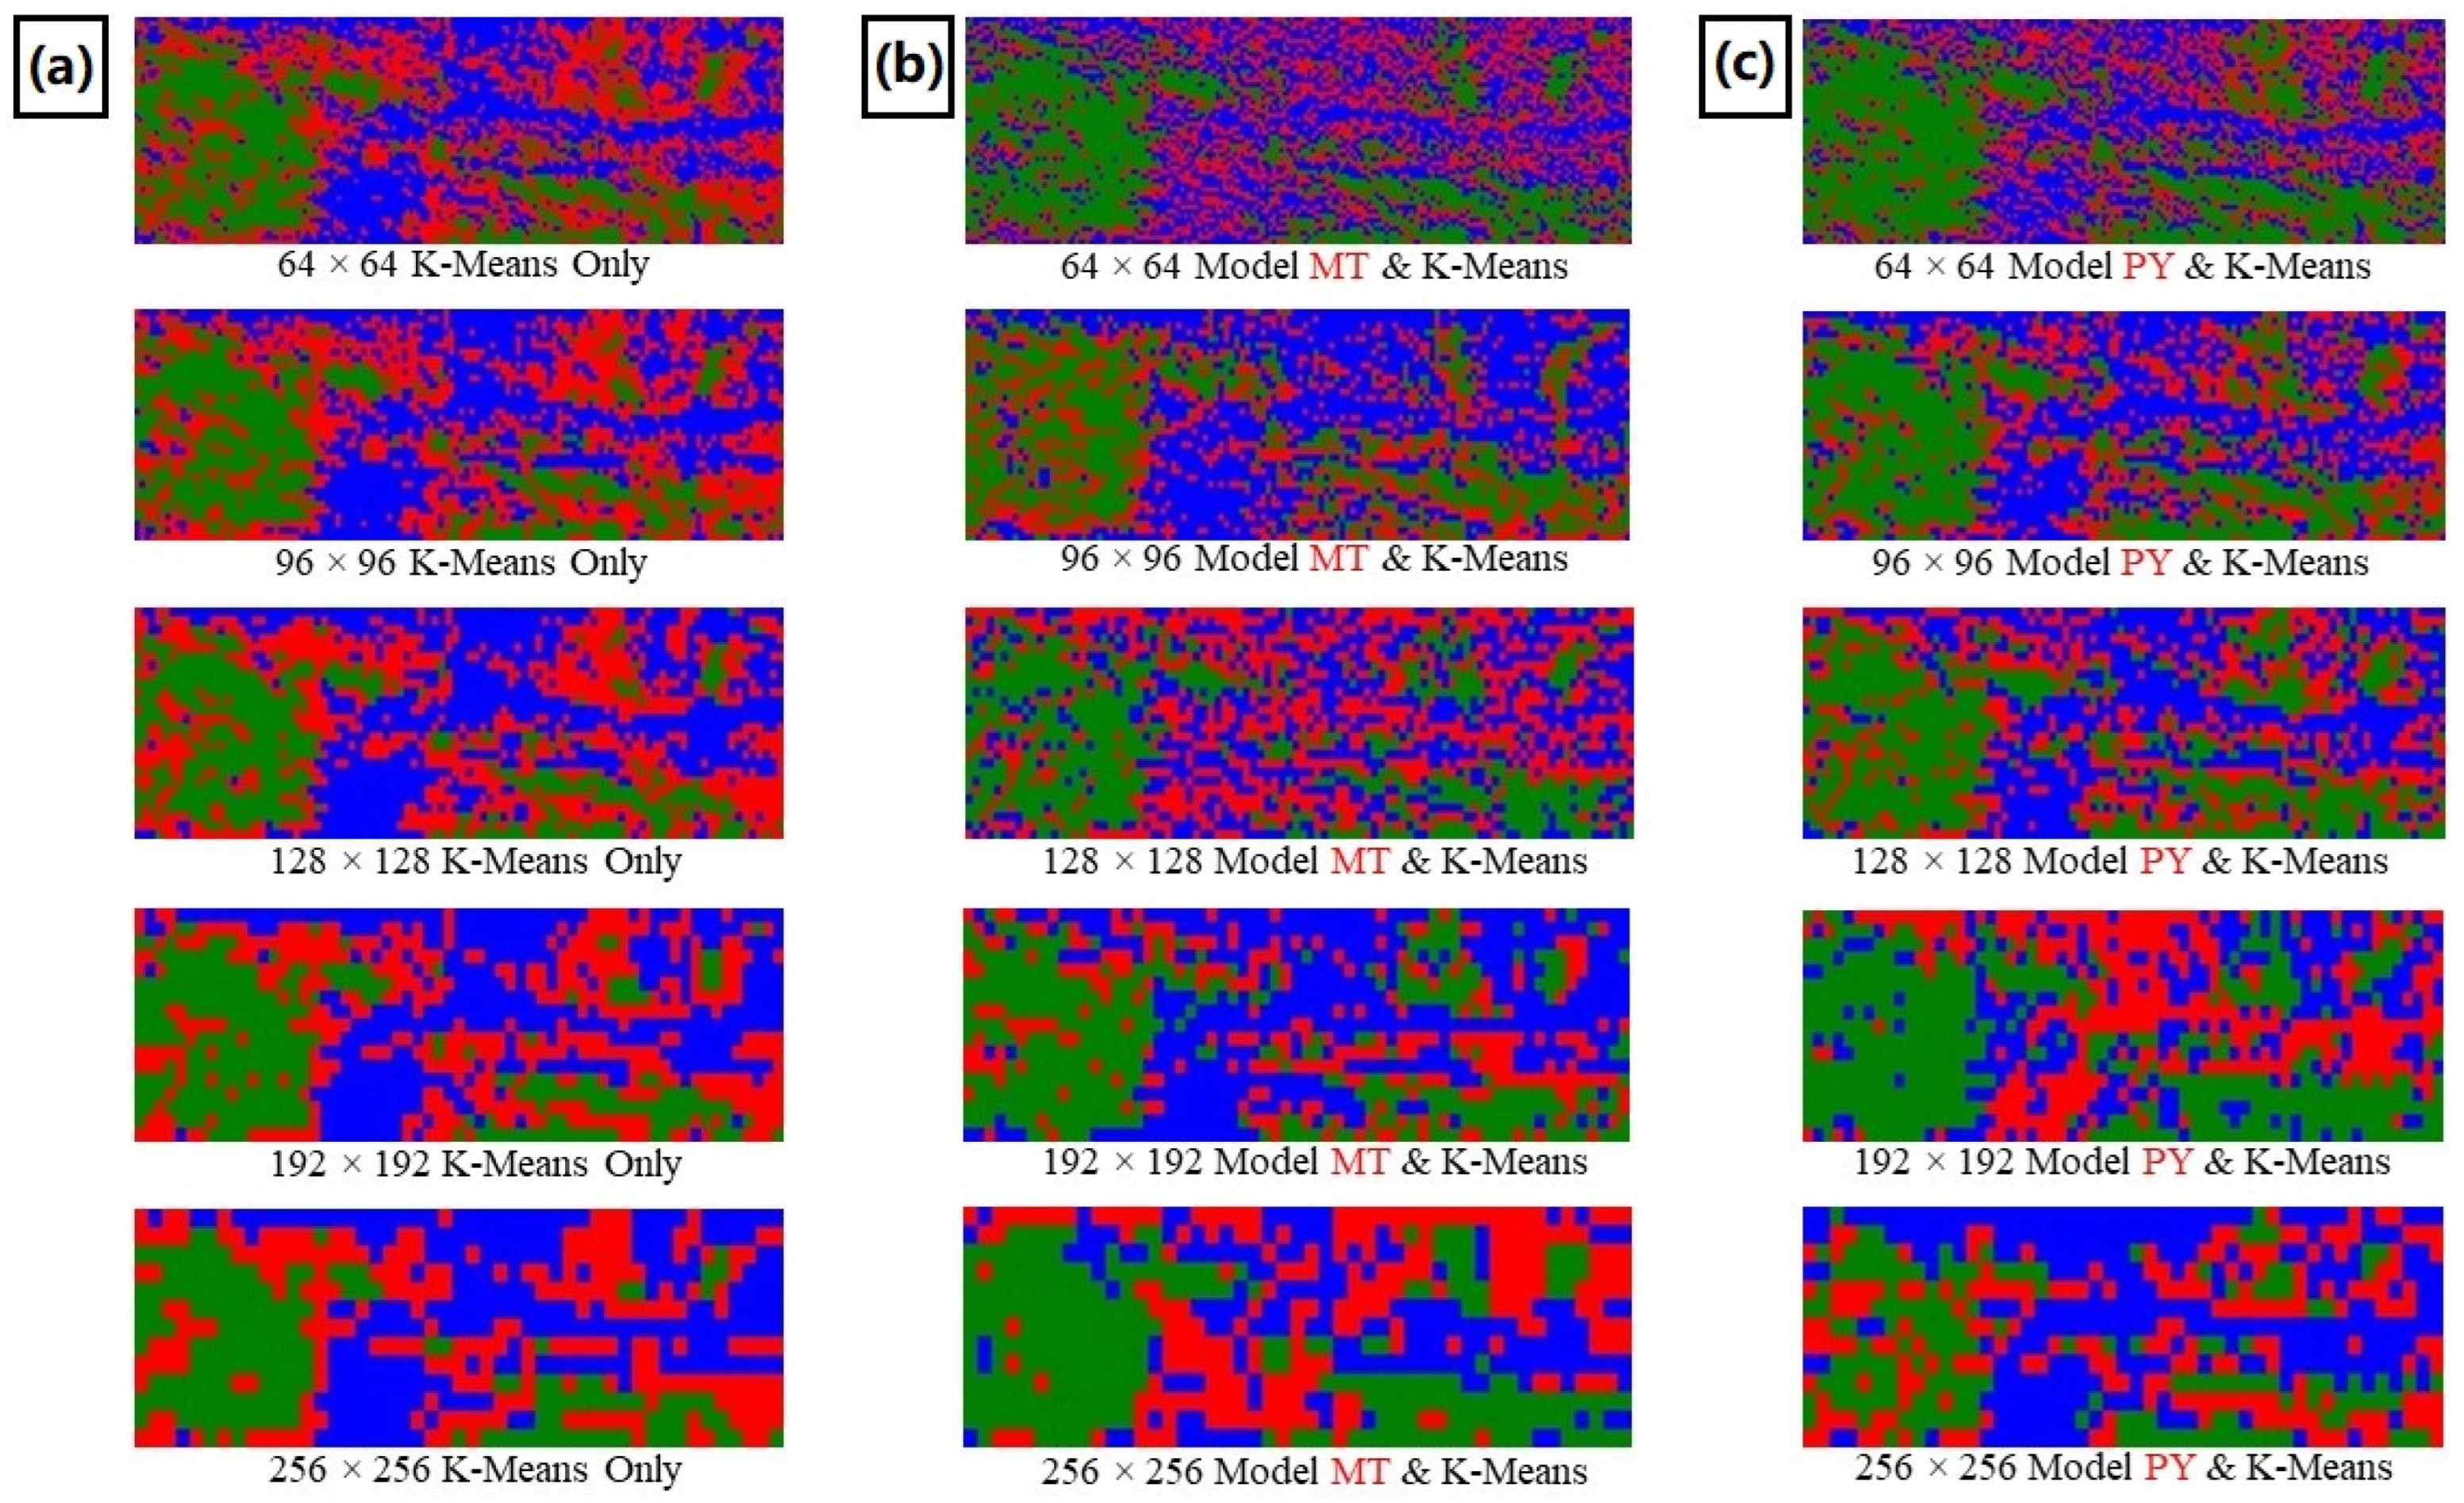
Figure 10 shows the generated maps using the K-Means clustering-only approach and the autoencoder-first K-Means clustering approaches.
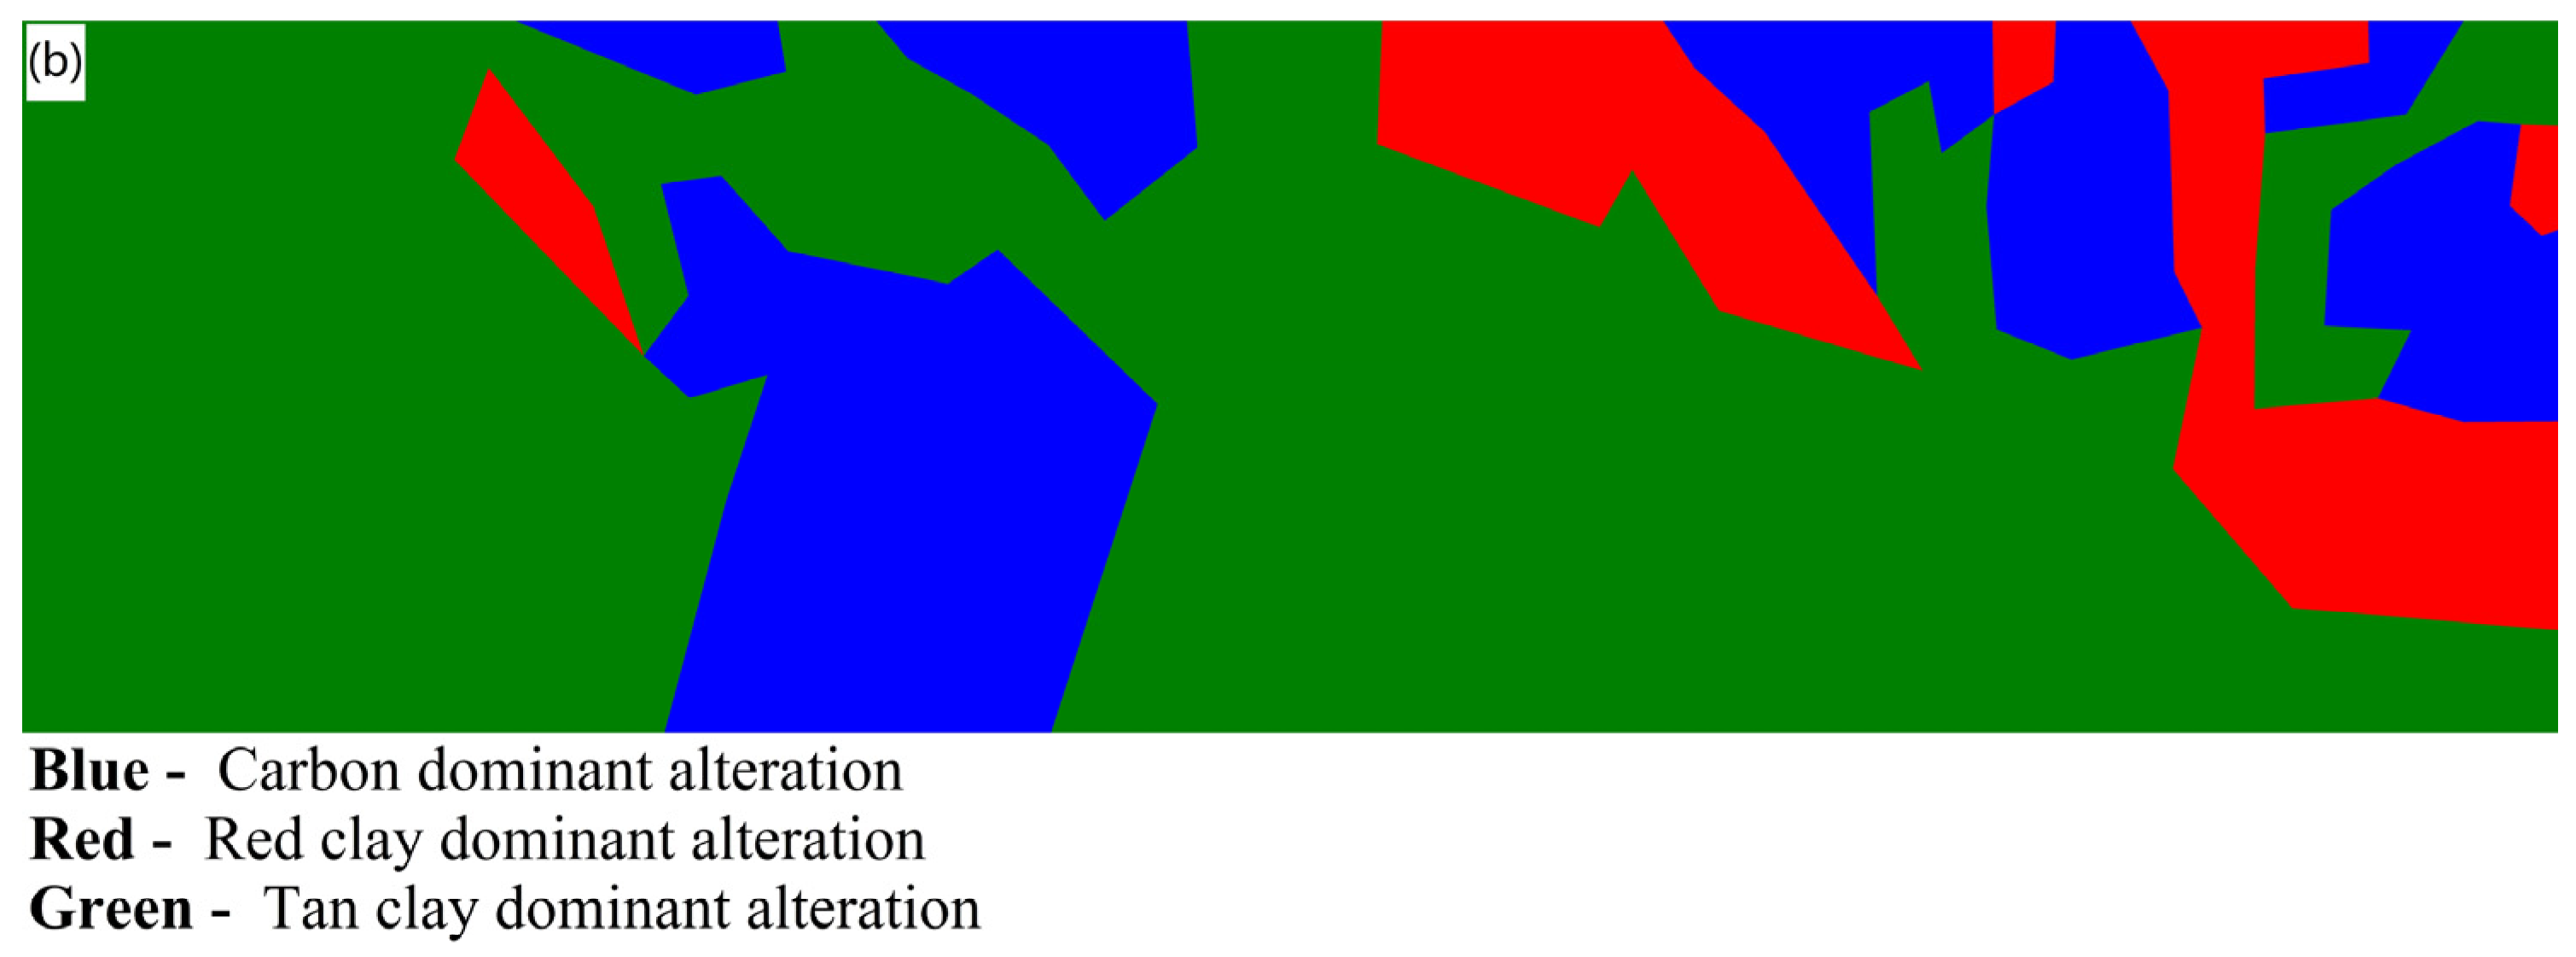
Looking at the results of K-Means clustering-only and the autoencoder-first K-Means clustering, it is apparent that interpretation is not as trivial as Top Pit, particularly due to the noise-like appearance in many areas, which could be the clustering algorithm’s forced attempt at identifying the user-specified number of clusters. Regardless of the method, all maps look different from the ground truth (
Figure 5b) but have many similarities amongst each other. Assigning colours representing the different alteration classes to the cluster groups was difficult due to the stark contrast and large disagreements; hence, the maps do not look nearly as representative of the in situ conditions as the case for Top Pit.
For the tan clay-dominant alteration (green), most of it occurs on the left side and some in the bottom parts of the maps; however, based on the ground truth, it should cover most of the area on the right side as well. Instead, the carbon-dominant alteration (blue) covers large parts of it in each map with a seemingly horizontal orientation. Compared to the orthomosaic (
Figure 5a), this seems to correspond to the dark brown streaks, especially the two large ones stretching from the middle to the right section of the orthomosaic. Based on the information provided by an onsite geologist, much of the tan clay is structurally controlled and thereby could suggest that the streaks are tan clay-dominant alterations or some type of joint filling, but in this case, the streaks are simply dirt or mud produced during mining operations.
The assigned cluster group for the red clay dominant alteration (red) does not correspond to the alteration itself. Many of the regions clustered together do not contain substantial traces of red clay, if at all. For this case, the assignment was only done to be consistent when interpreting the cluster groups as one cluster for each alteration class. In what was labelled as red clay in the ground truth, most, if not all, were considered as carbon- dominant alteration in the generated maps. In general, what was assigned as red clay could be areas representing a mixture of dark and light colours at most since this frequently occurs near boundaries of abrupt colour transitions. In some of the red clay pockets around the tan clay areas, this phenomenon could even represent the tan clay-dominant alteration enclosing the unaltered limestone.
The numerical results further support the poor representation of the alterations by the cluster groups. Although using autoencoders did show slight improvement, they should be disregarded and treated indifferently due to the large disagreements with the ground truth, especially between the red clay alteration and its corresponding cluster group. Visually speaking, it is difficult to say which method and tile dimensions were the best if there is one. K-Means clustering produced largely the same kind of results, something observed for Top Pit as well, while the two autoencoder architectures mainly differed at the larger tile dimensions. In particular, for Model PY’s 192 × 192 tile size map and Model MT’s 256 × 256 tile size map, the tiles were more distributed between the three cluster groups, which increased the tile accuracies. This is extremely misleading because the disagreement with the ground truth is so severe that it is difficult to say which cluster group corresponds to which alteration group. In turn, better quantitative metrics may not indicate improved model performance and could just be mainly based on a poor and forced decision of cluster-alteration assignment.
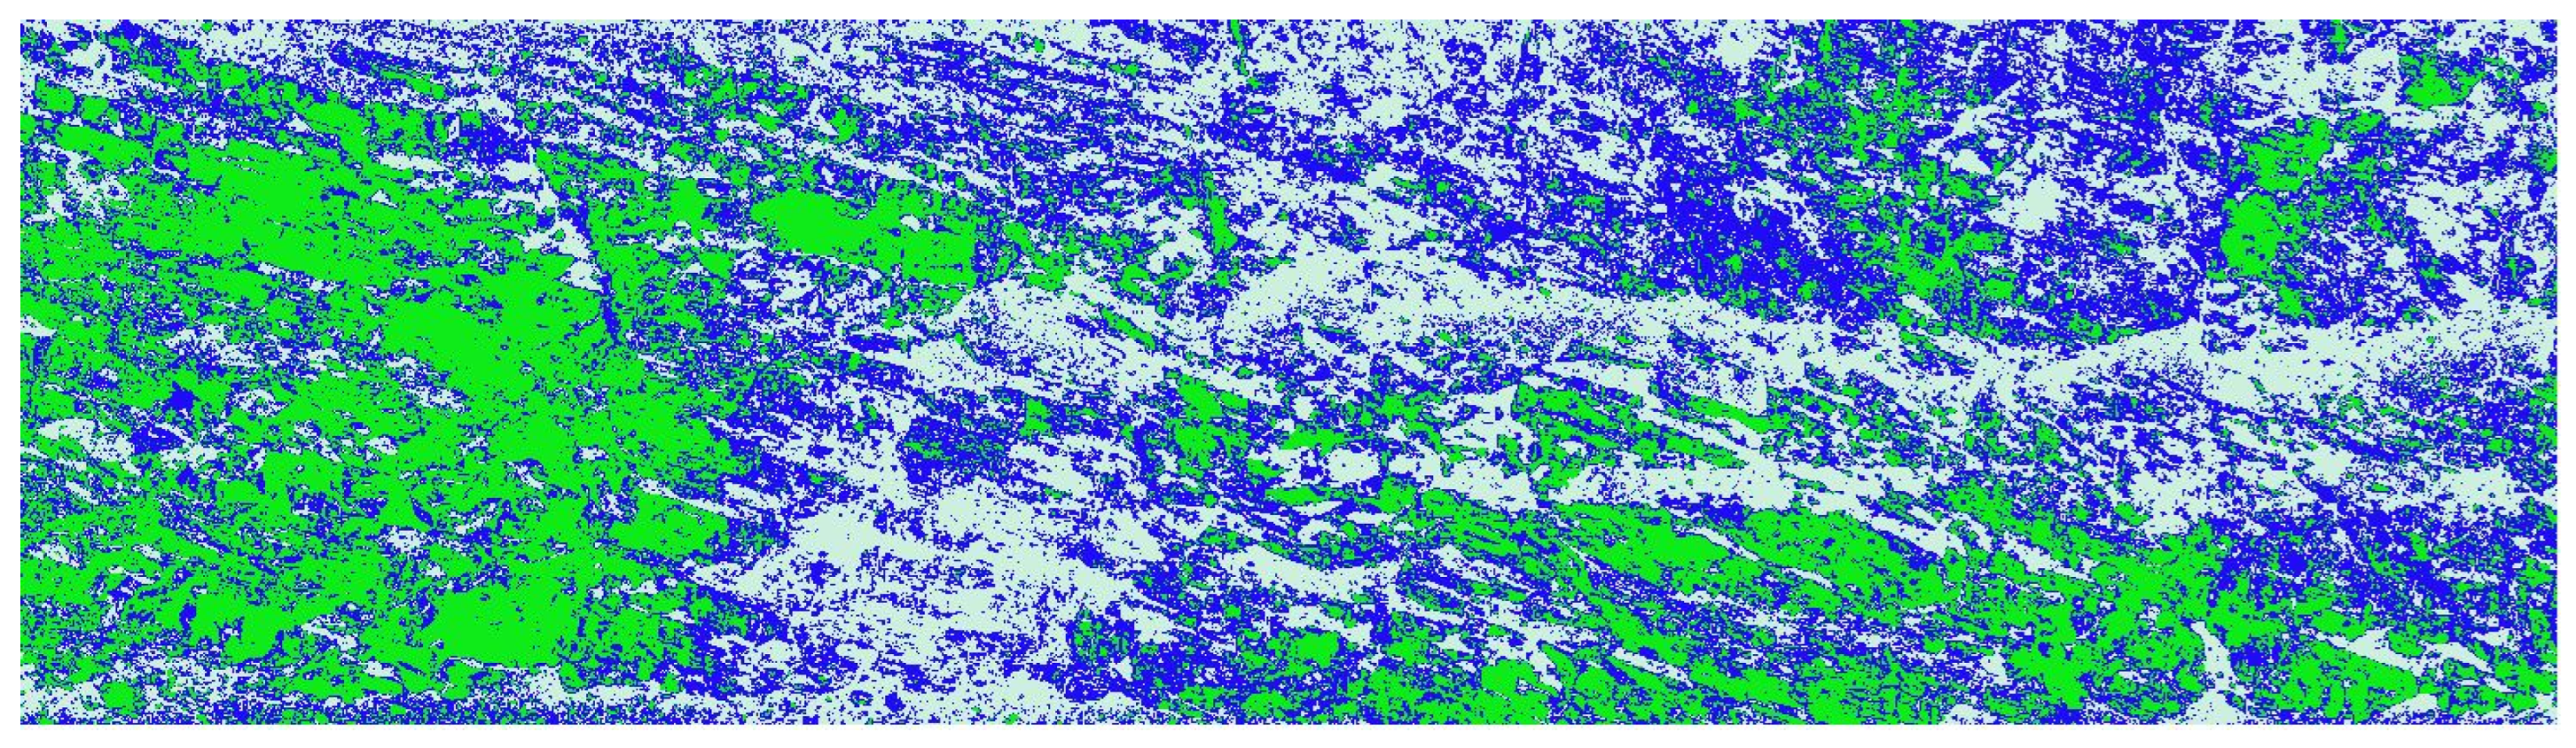
The segmentation result in
Figure 11 shows some noticeable differences from the classification approach, with a few similarities to that of the Top Pit segmentation. Firstly, there is clearly some type of structure outlined by the white colour, including the dark brown streaks previously mentioned. So, unlike Top Pit, this pattern is more likely to correspond to rock structure. Secondly, the green colour appears to represent the unaltered limestone exposed on the wall surface and a bit of surficial calcite. The red clay is, however, not identified as its own group. Despite the finer resolution and noisier appearance, segmentation does yield some useful structural information that was not captured prominently by the classification approaches.
4. Discussion
This study has some limitations and potential areas of concern using unsupervised learning. One of them is that the interpretation of the final product will ultimately rely on at least knowing some geological information, especially during the assessment. Even if the spatial distribution and boundaries are well-defined, the only way to determine if they accurately represent in situ conditions is to compare them with some form of ground truth or assessment criteria. In this study, additional context was required using some type of reference to interpret the cluster maps. Although the ground truth was labelled by a novice, it was still useful to assess the clustering outcome. However, to obtain the ground truth, manual intervention is required, raising the problem of human subjectivity. Unlike conventional labelling tasks where there are usually definitive answers, such as annotating animals versus cars, the same process for mining and geological projects is more complicated and leaves a plethora of room for discussion and interpretation. The decisions made during data labelling directly affect the outcome, and they differ from person to person, even amongst experts.
While unsupervised learning methods are useful in the absence of quality labelled data, they have not been fully explored for geological applications. Without proper optimization and transformation, the high-dimensional space of the data may not be suitable for clustering, as shown in the Pick Pit alteration maps. Outside of the simple situations such as the one represented by the Top Pit data, most in situ conditions are far from ideal and resemble the condition in the Pick Pit orthomosaic, where multiple units of similar colours are mixed together. The 2D geological maps also lack 3D spatial context, limiting their usefulness when integrating with 3D geological models.
For data collection, UAVs are limited to certain operational conditions and exceeding these ranges may result in poor data quality [
33]. Some of these are impossible to manipulate, including environmental conditions, which become intrinsic factors that must always be considered when collecting data. Additionally, the data collection process conducted in this study is far from optimal and requires significant time and manual adjustments, especially when creating flight plans for detailed pit wall mapping, as shown in the case of the Pick Pit point cloud model. In sections of the pit wall with irregular geometry, poor flight planning can result in missing areas in the point cloud models due to insufficient images. Lastly, the lack of GCPs decreases the point clouds’ spatial accuracy. It directly affects their uses for subsequent analyses, but GCPs are difficult to place on pit walls due to accessibility issues. It is also difficult to place GCPs in the surrounding perimeter due to the same accessibility issues and operating machineries on the working bench and pit ramp. In point clouds generated without GCPs or some form of accurate georeference, there is a risk of severe inaccurate orientation and positioning that prevents any form of 3D work to be done on the model such as structural mapping of joints and fractures. This effectively makes the point clouds unusable. One workaround is to use UAV LiDAR to create LiDAR point clouds as a validation for the photogrammetric point clouds. Given that the two-point clouds are created differently (i.e., LiDAR point clouds are generally based on calculated distance from sensor to target while RGB photogrammetric point clouds are created mainly from image features and camera parameters), it is less likely that both models will have the exact same error, if any, and thereby provide a good way to locate any abnormalities. The downside is that both RGB and LiDAR data need to be captured, which will increase cost and time, especially if separate UAV systems or sensor swap out is required. However, it is possible to have dual gimbal UAV setups allowing for both RGB and LiDAR sensors to capture data on the same flight in addition to sensors that integrate LiDAR and RGB modules into one, such as the Zenmuse L1 (DJI, Shenzhen, China). Real-time (RTK) and post-processing kinematic (PPK) techniques can also be used as alternatives [
34] including RTK UAVs. Regardless, it is always best to have GCPs for the highest accuracy.
5. Conclusions
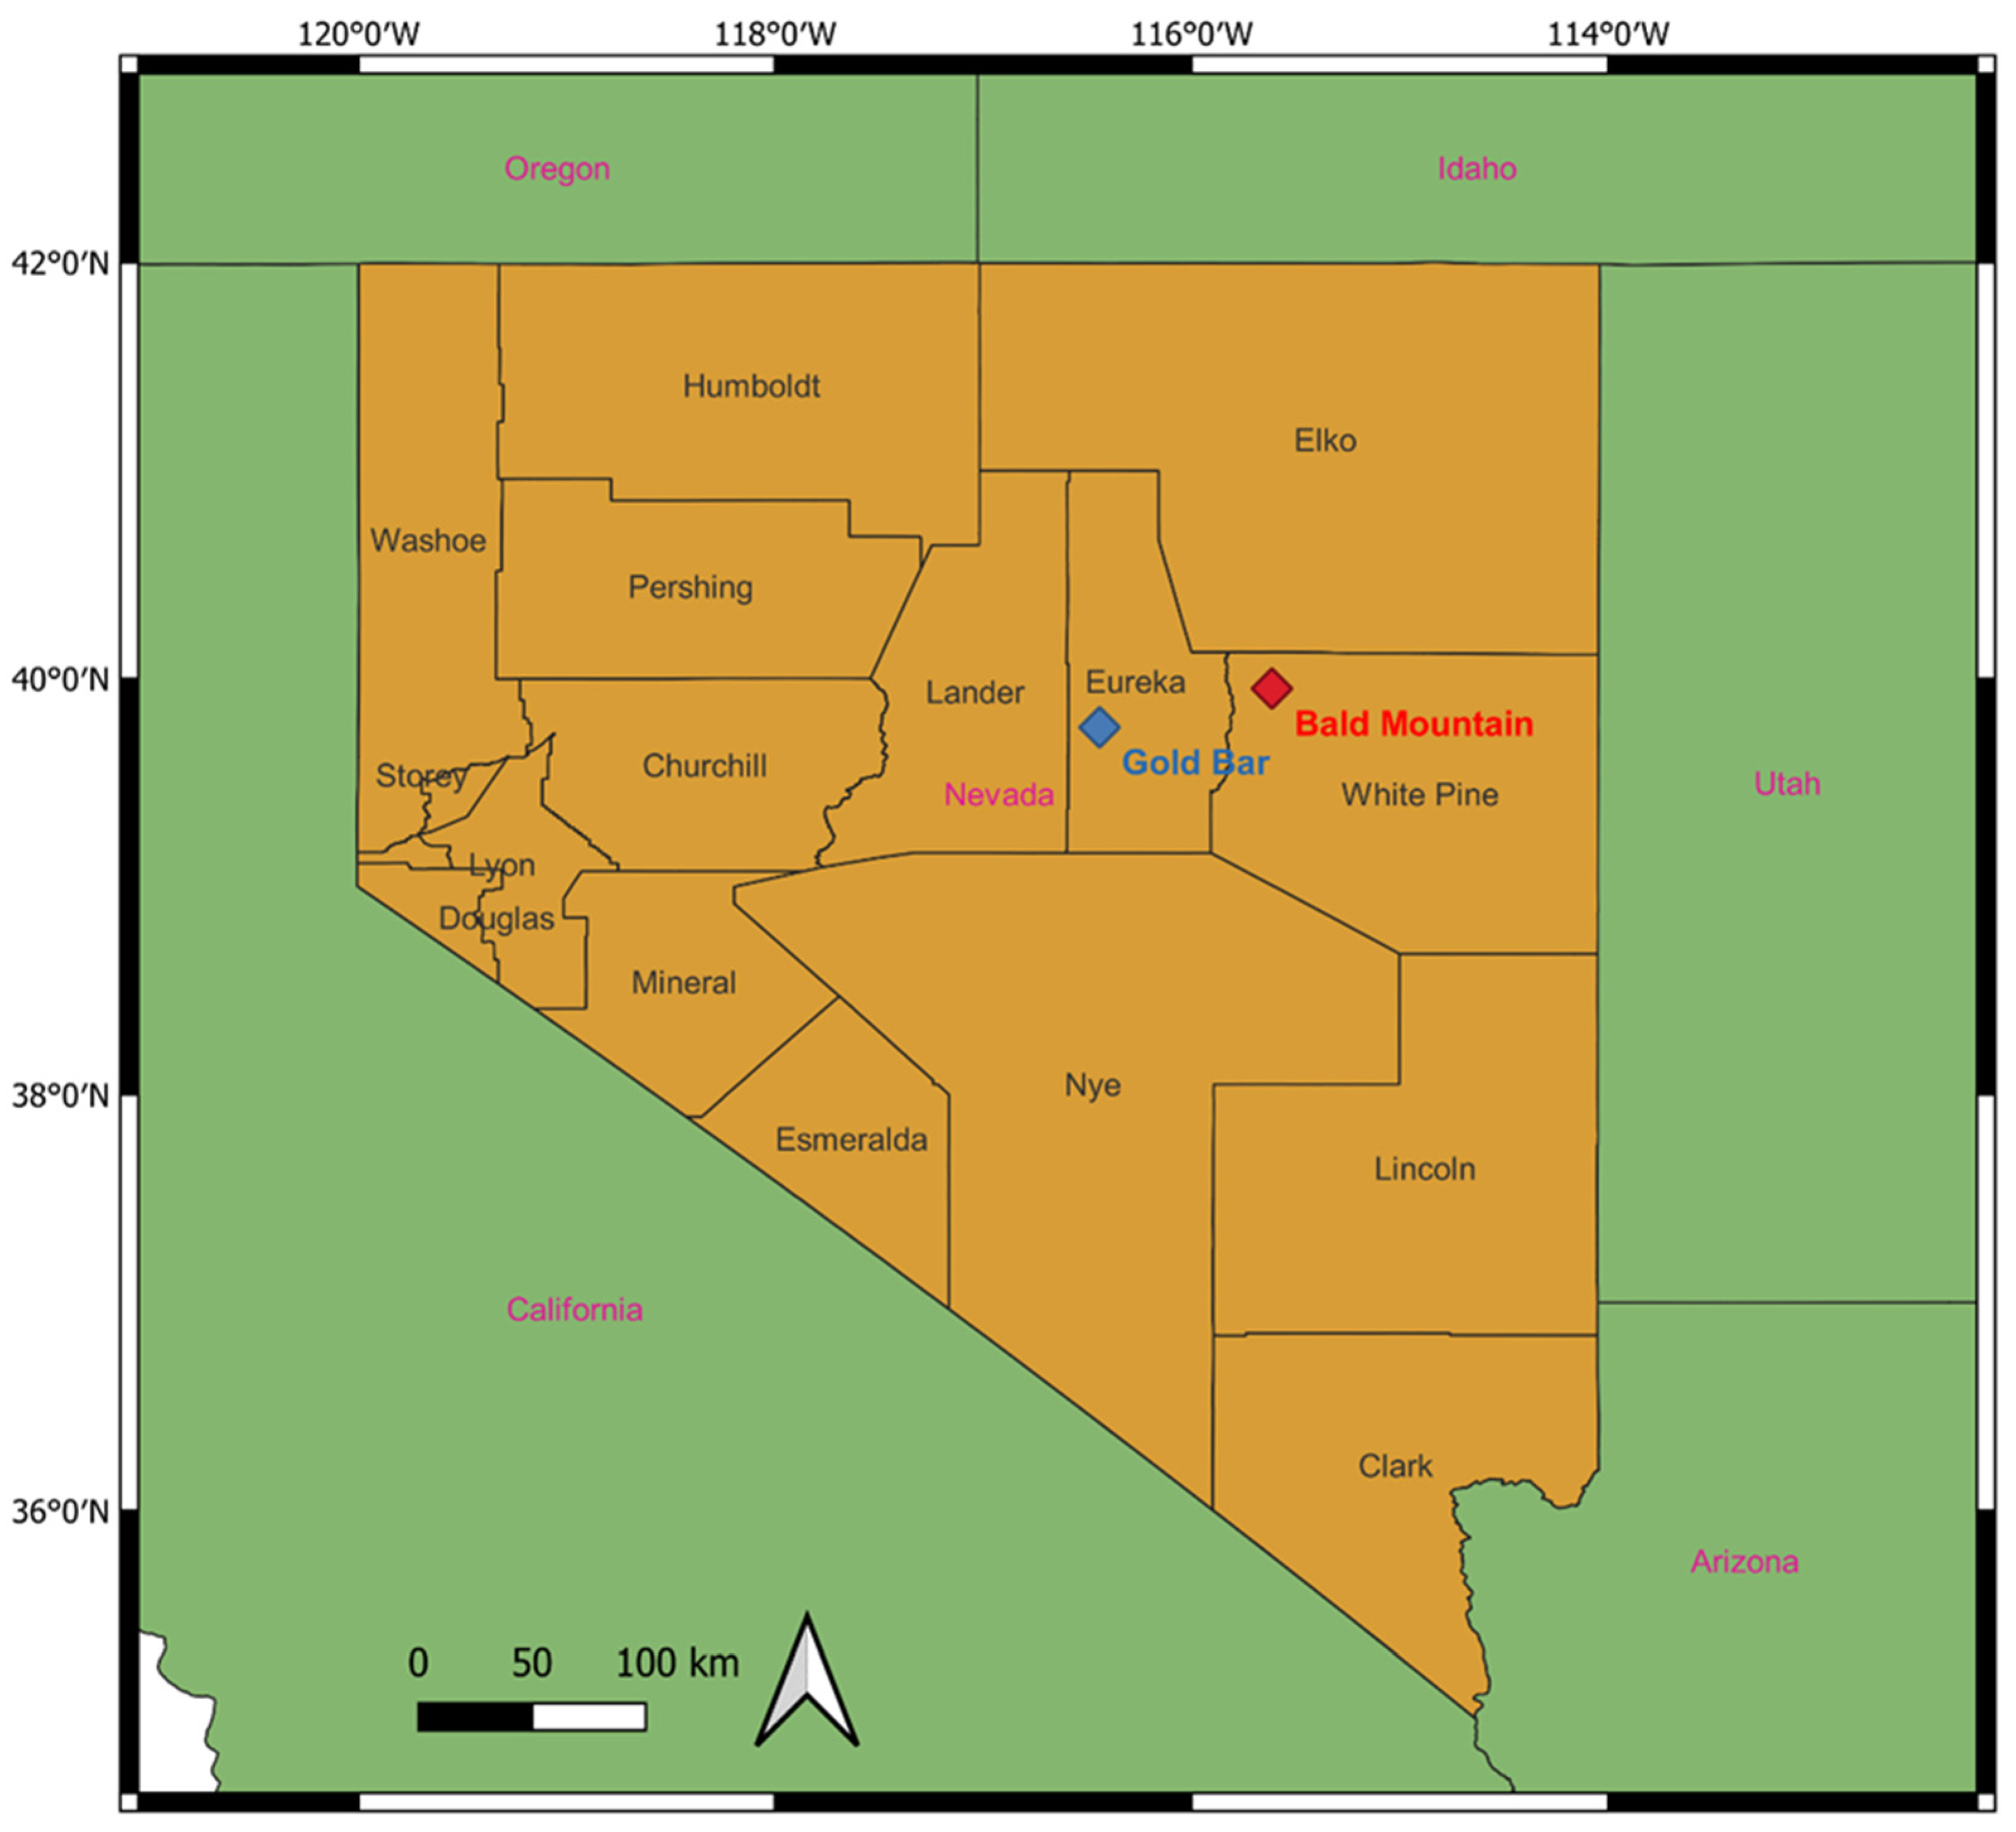
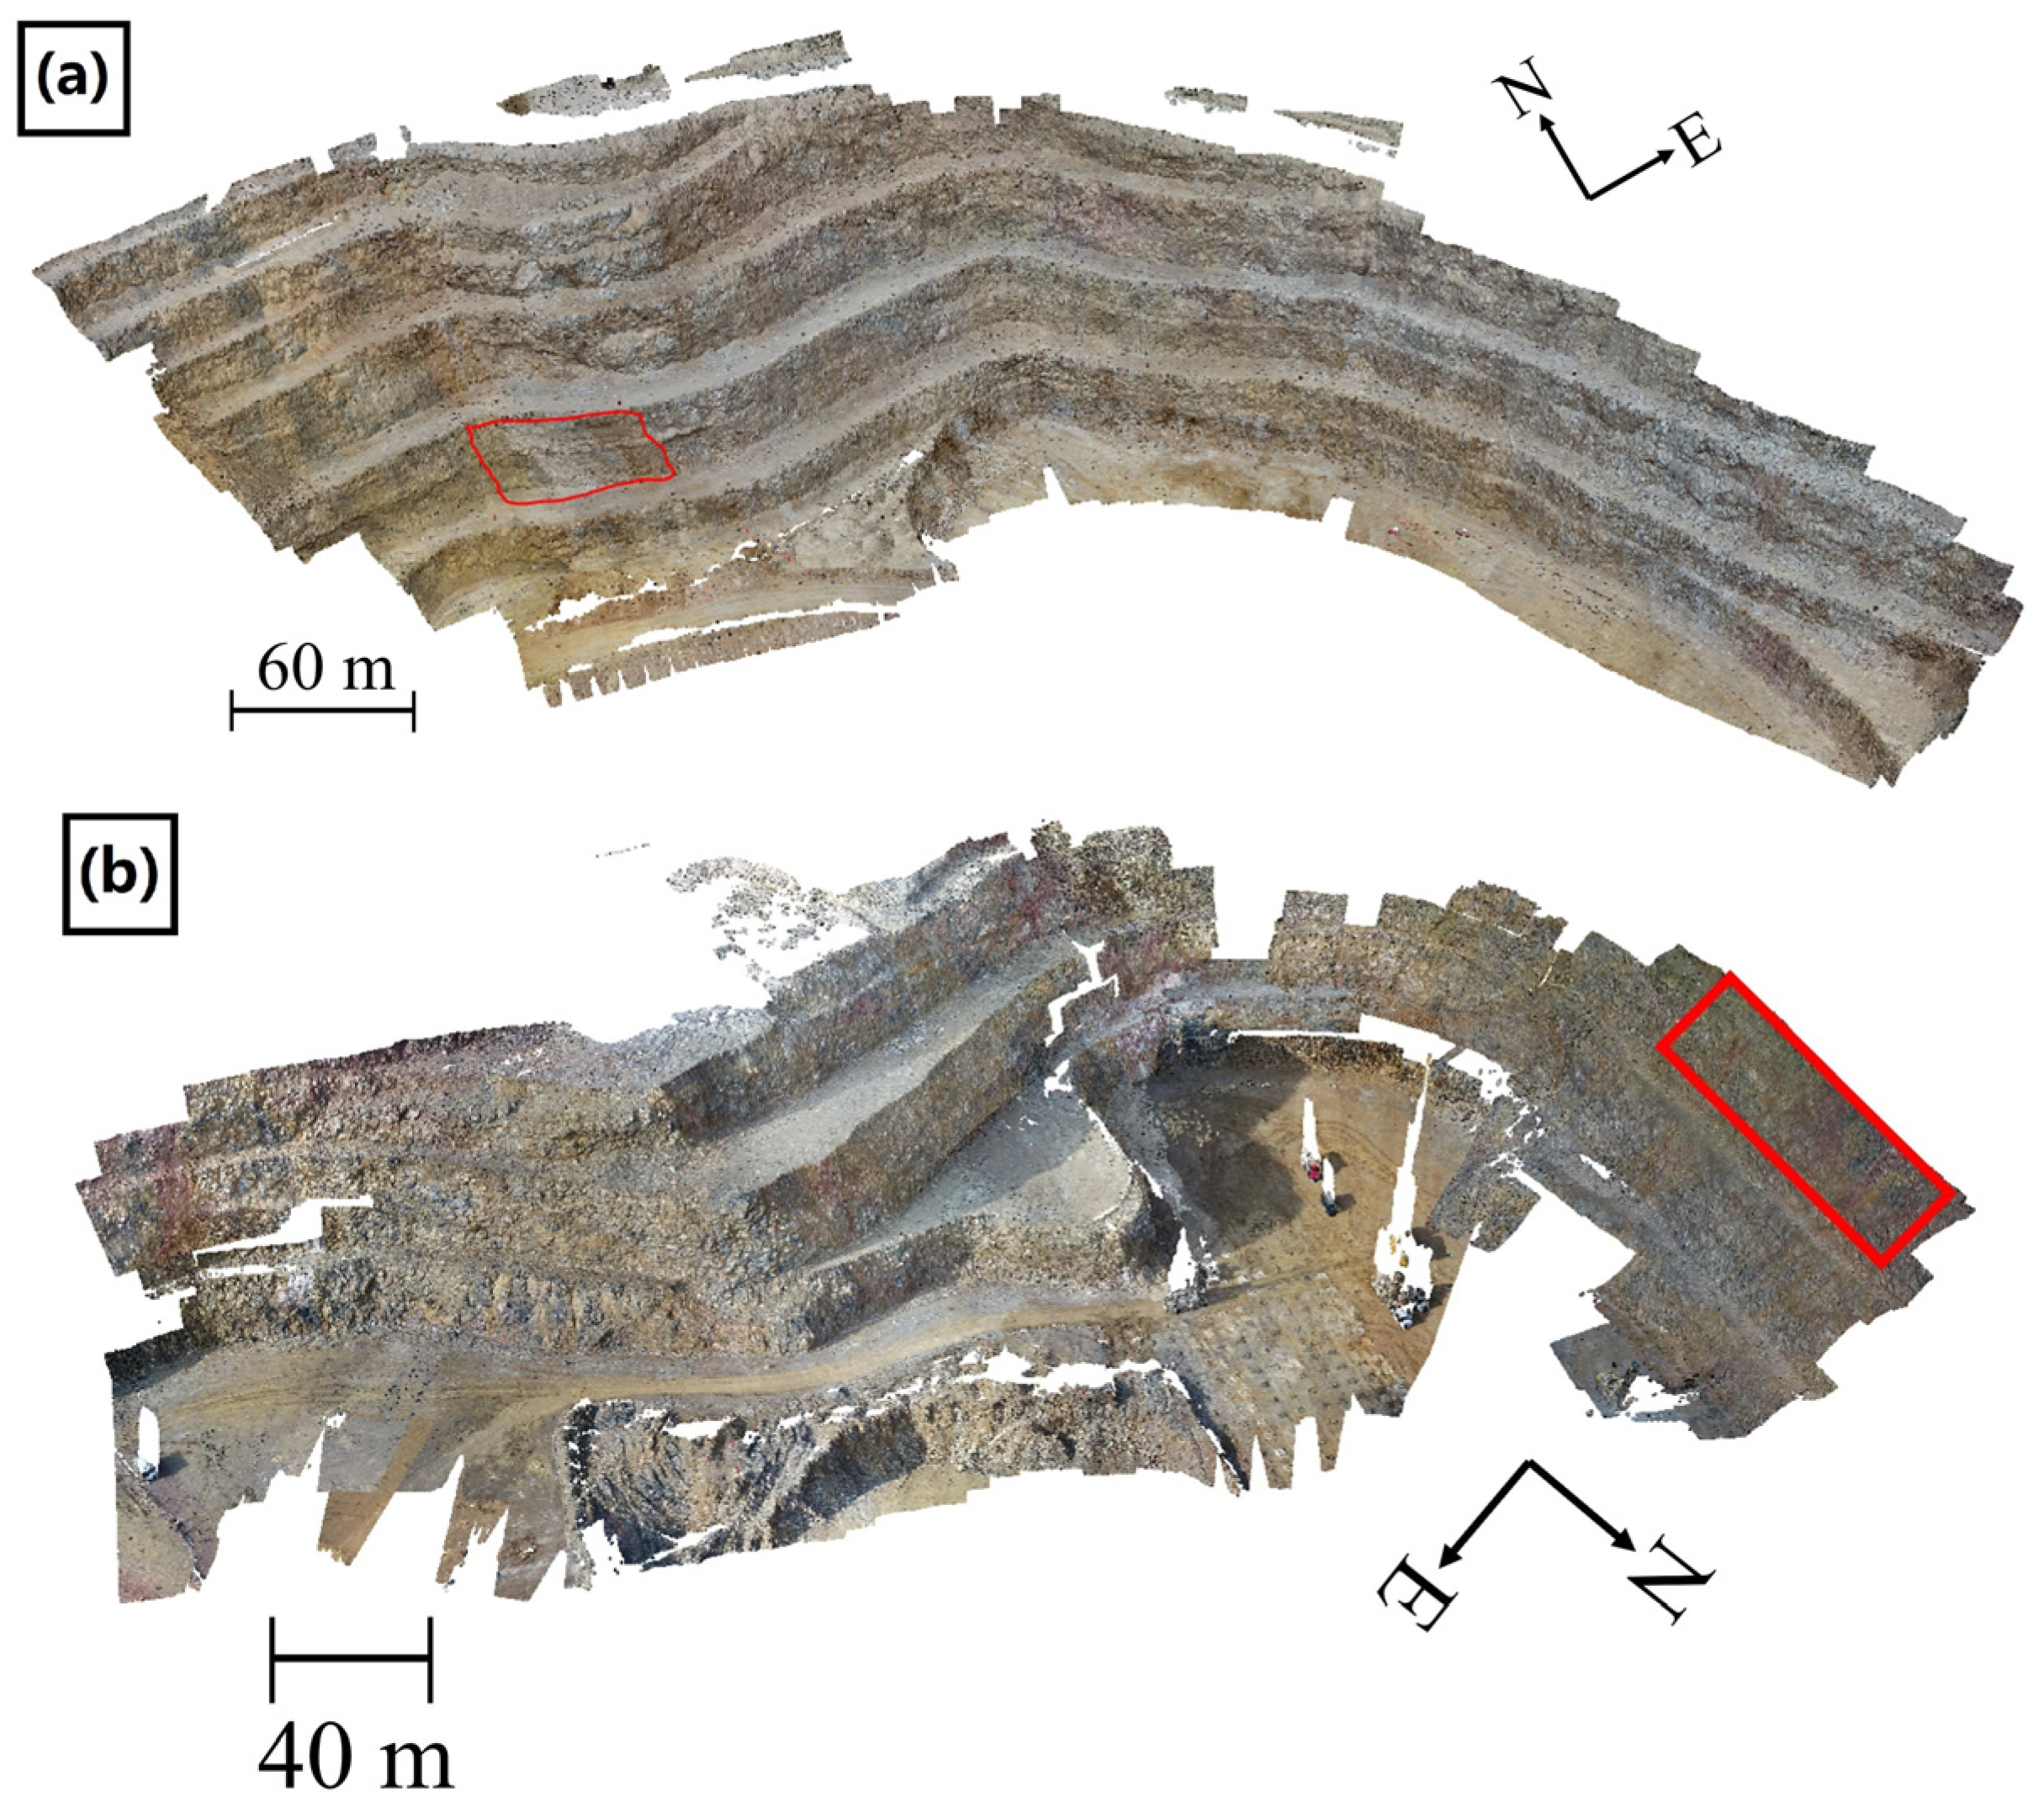
This study investigated using UAV-acquired RGB images and unsupervised learning algorithms for geological pit wall mapping. Using a commercial UAV, the high-resolution RGB images of pit walls were collected at Bald Mountain’s Top Pit and Gold Bar’s Pick Pit mine sites. Orthomosaics of the pit wall sections were then extracted from these point clouds as input data for clustering analysis and mapping of geological units in an unsupervised fashion. The Top Pit orthomosaic contained easily identifiable units and was designated as the simple case study, while the Pick Pit, with a more complicated geological spatial distribution, was used as the complex case study. In the simple case, the cluster groups corresponded well with the ground truth, but the clustering was not ideal in the more complicated case. Regardless, a better understanding of the application of UAV and RGB imaging for pit wall identification of surficial units in the absence of data labels was achieved.
Using two datasets with differing geology and complexity, a preliminary evaluation of identifying lithologies and alterations on pit wall surfaces demonstrated the challenges of using RGB images with unsupervised learning techniques. When colours are distinct, homogeneous, and directly correspondent to different geological units, the data type and techniques used are sufficient for lithological/alteration identification. In these cases, the resolution should primarily depend on the nature of work that will be done using information obtained from the maps. For mining operations, pit wall mapping is generally done at a relatively coarser scale. Usually, it corresponds to the block size of a block model, so a slightly coarser resolution should suffice. It is also dictated by the analytical techniques used to generate the maps. If too coarse, there may be an insufficient number of tiles for clustering and model training, while finer resolution may increase computational time due to the larger number of tiles or capturing unnecessary details.
Future works will investigate the use of semi-supervised learning by combining unsupervised and supervised DL models to reduce training time and the amount of data required. This approach can also be applied to data labelling to minimize labelling time and to reduce some model dependency on human inputs.


