Abstract
Peatlands store up to 2320 Mt of carbon (C) on only ~20% of the land area in Ireland; however, approximately 90% of this area has been drained and is emitting up to 10 Mt C per year. Gross primary productivity (GPP) is a one of the key components of the peatland carbon cycle, and detailed knowledge of the spatial and temporal extent of GPP under changing management practices is imperative to improve our predictions of peatland ecology and biogeochemistry. This research assesses the relationship between remote sensing and ground-based estimates of GPP for a near-natural peatland in Ireland using eddy covariance (EC) techniques and high-resolution Sen-tinel 2A satellite imagery. Hybrid models were developed using multiple linear regression along with six widely used conventional indices and a light use efficiency model. Estimates of GPP using NDVI, EVI, and NDWI2 hybrid models performed well using literature-based light use efficiency parameters and showed a significant correlation from 89 to 96% with EC-derived GPP. This study also reports additional site-specific light use efficiency parameters for dry and hydrologically normal years on the basis of light response curve methods (LRC). Overall, this research has demonstrated the potential of combining EC techniques with satellite-derived models to better understand and monitor key drivers and patterns of GPP for raised bog ecosystems under different climate scenarios and has also provided light use efficiency parameters values for dry and wetter conditions that can be used for the estimation of GPP using LUE models across various site and scales.
1. Introduction
Peatlands are vital ecosystems in the global carbon (C) cycle, as they act as a significant store of carbon [1], with estimates of soil organic carbon (SOC) stocks of between 500 to 700 billion tons of C globally [2]. However, these ecosystems are prone to degradation, primarily through drainage to facilitate a change in land use, which results in a release of approximately 2–3 gigatons of carbon dioxide (CO2) to the atmosphere every year [3]. To better understand how we can rehabilitate these systems and enhance their climate mitigation potential, it is important to quantify their C dynamics and the key drivers of C uptake and release at various spatial and temporal scales.
Natural and managed peatlands in Ireland are estimated to store up to 2320 Mt of C on ~20% of the land area [4,5]. Irish peatlands have been extensively drained over the past several decades for extraction for both energy and horticulture and for conversion to agriculture and forestry [6]. These land-use conversions have significantly affected the greenhouse gas (GHG) dynamics of these ecosystems, and they are estimated to release approximately 11–12.4 Mt CO2 per year [7]. Furthermore, the conservation of near-natural peatlands and the rehabilitation of degraded peatlands is necessary to protect C stocks, reduce emissions, and enhance their C assimilation capacity to further offset national GHG emissions.
Terrestrial gross primary productivity (GPP) describes the total amount of CO2 assimilated by plants in an ecosystem through photosynthesis and is considered the largest flux component of the global carbon cycle [8]. Therefore, detailed knowledge of the spatio-temporal extent of GPP dynamics and the key drivers, such as air temperature, water table depth, and soil water content, is imperative to improve our ability to quantify fluxes and upscale them across various spatial domains.
Current field-based methods of measuring annual carbon exchange between peatlands and the atmosphere include the use of static and dynamic chambers and eddy covariance (EC) towers [9,10]. The integration of both these techniques can encapsulate peatland carbon dynamics at a variety of temporal and spatial scales by capturing seasonal and interannual variability at the point-source and ecosystem scale. While EC techniques have proven to be of great importance in the measurement and modeling of C dynamics in peatlands [11], these measurements account for C fluxes within the footprint of the tower only, which typically spans over an area between 200 m2 to 1 km2. It is, therefore, challenging to scale up EC fluxes from the footprint-derived source to the regional/global scale due to the geographical distribution and limited number of towers [12].
Light use efficiency (LUE) models based on Monteith’s theory (1972) are extensively used to model GPP. This model expresses GPP as the product of the incident photosynthetically active radiation (PAR), the fraction of absorbed photosynthetically active radiation (fPAR) by the vegetation canopy, and the light use efficiency parameter (ε). Spectral indices are important, as they integrate nutrient and absorption characteristics and are used as a proxy for fPAR, which is one of the major parameters for the estimation of GPP in the LUE models [13,14]. Rates of CO2 assimilated by a plant canopy have shown to be strongly correlated with satellite-derived vegetation indices [15,16]. The light use efficiency parameter (ε) can also vary depending on environmental conditions and plant physio-morphological changes [17]. It is also possible to calculate ε directly from the photo–chemical reflectance index (PRI); however, the bands required for PRI index are not available in Sentinel 2 data [16,18,19]. There are also a limited number of studies available that report the derivation of ε values for peatlands using site-derived light response curves (LRC) [20,21,22].
Remote sensing techniques provide a new opportunity to assess the C dynamics of peatlands and other remotely located ecosystems [23,24]. It can facilitate an assessment of multiple ecosystem attributes and can provide information across wider spatial scales. This is important, as EC infrastructure is expensive, requires regular maintenance, and is limited to ecosystem scale perspectives, making direct measurements across multiple sites and spatial scales unfeasible. Because of this, the use of spectral indices as a proxy for carbon flux estimation are becoming more widely used [14,25,26].
Vegetation indices derived from satellite data, such as the normalized difference vegetation index (NDVI) or enhanced vegetation index (EVI), have been correlated with GPP with varying degrees of success at grassland, cropland, and forested sites [14,16,27]. The use of common MODIS-derived vegetation indices (250–500 m), such as NDVI and EVI, can be challenging for GPP estimation over peatlands because of the narrow red absorption feature and narrow near-infrared reflectance peak which is commonly observed in dominant peat-forming species, such as Sphagnum mosses [25,28]. Additionally, vegetation indices derived from MODIS data might incorporate forestry and grasslands into the peatland signals due to the coarse spatial resolution (250 m–1000 m), leading to overestimation of GPP [29,30]. However, the use of higher spatial resolution sensors, such as Sentinel satellite imagery (10–30 m), can help reduce the uncertainty in GPP estimation by providing greater insight into the carbon flux estimation of heterogenous landscapes [8].
The reflectance characteristics of peatlands are different from forest, agricultural, and grassland ecosystems due to the hydrological conditions, water content, and associated vegetation communities [31,32]. Moreover, the spectral signature of sphagnum mosses is characteristically different compared with the vascular vegetation in peatland ecosystems [13]. The spectral reflectance of sphagnum species changes with the available moisture content, and their reflectance increases during dry periods as sphagnum changes its color to yellow-brown [33,34,35,36]. Zhang et al. [37] highlights the importance of using different indices within one model to properly understand the effect of water content on vegetation when using light use efficiency models. Therefore, there is a need to assess the performance of widely used indices to predict GPP and develop a combination of indices specifically for raised bog ecosystems.
In this study, Sentinel-2 high-resolution satellite imagery was used to derive vegetation and water indices, as it offers a new perspective in monitoring ecosystem phenology [8,14,32]. Six widely used indices, which include four vegetation indices (NDVI, EVI, MCARI, and REP2) and two water indices (LSWI and NDWI2) were used in this study to identify the best combination of indices for peatlands. Sentinel-2 images from a climatologically dry year in 2018 were used to derive indices, as it provided an opportunity to acquire seasonal cloud-free imagery for GPP estimation, and it was also useful to gain further insight into how the light use efficiency parameters performed during drier conditions. The objectives of this study were to (1) develop hybrid models using a combination of indices to estimate GPP using LUE models and validate them against EC-derived GPP for a near-natural peatland ecosystem and (2) determine the site-specific light use efficiency parameters for a near-natural peatland under dry and normal conditions, which could be used to refine estimates of LUE-model-based GPP from other sites in the future.
2. Materials and Methods
2.1. Study Site
Clara Bog (Figure 1a) is one of the largest remaining relatively intact raised bogs in Western Europe [38] and is located in County Offaly in the midlands of Ireland (53°19 N, 7°36 W). The site is designated as a special area of conservation (SAC) under the European Union Habitats Directive (Council of the European Communities, 1992). It has an Atlantic temperate climate, with an average annual rainfall of 883 mm and an average annual temperature of 9.6 °C [39,40].
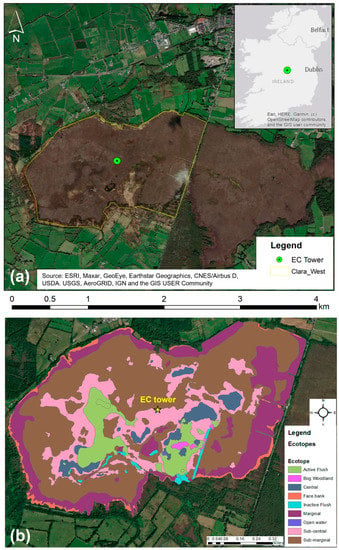
Figure 1.
(a) A map of Clara Bog showing the delineation of the bog into the eastern and western sections (the western section boundary highlighted in yellow) and the location of the EC tower. (b) Ecotope map of Clara Bog West (EU LIFE Irish Raised Bog Restoration Project (LIFE14 NAT/IE/000032)), with EC tower location shown in yellow.
The site is bisected by a road into Clara East (206 ha) and Clara West (234 ha), and this study focuses on Clara West. Despite being a near-natural bog, the site has been subject to continued subsidence, which is attributed to drainage of the regional groundwater table surrounding the bog and the hydrogeological complexity of the bog itself. This has resulted in the progressive loss of approximately 40% of the active raised bog (ARB) area since 1991 [41]. The site is divided into nine ecotopes [42] on the basis of distribution of Sphagnum, as shown in Figure 1b.
2.2. Measurements of Net Ecosystem Carbon Dioxide Exchange and Ancillary Variables
The EC instrumentation consisted of a Sonic Anemometer (Windmaster, Gill Instruments, Lymington, UK), which measures wind speed and direction in three dimensions, and an embedded closed path infra-red gas analyzer (LI-7200, LI-COR Lincoln, NE, USA). The flux tower (Clara EC) is located at the center of Clara West (Figure 1a), and the EC tower flux footprint predominantly covers the submarginal (SM) and subcentral (SC) ecotopes, which constitutes of Narthecium ossifragum, Sphagnum tenellum, and Sphagnum magellanicum. The submarginal and subcentral ecotopes constitute approximately 77% (191.34 ha) of the site, and this study area was used to validate the modelled GPP with EC-derived GPP.
The raw EC data were collected at 10Hz and processed using Eddy Pro version 7.0.6. in advanced mode using site-specific parameters. Additional meteorological and environmental variables were also measured, which included air temperature and humidity (CS215, Campbell Scientific, Shepshed, UK), the volumetric water content of the soil (VWC) (CS616 Water Reflectometer, Campbell Scientific, Shepshed, UK), soil heat flux (HFP01 Hukseflux, Delft, The Netherlands), soil temperature (105E, Campbell Scientific, Shepshed, England), photosynthetically active radiation (PAR) (Skye Instruments, Llandrindod, Wales), and net radiation (NR) (NRLite, Kipp & Zonen, Delft, The Netherlands). The meteorological data were averaged and recorded using a Campbell Scientific micro-logger (model-CR3000) (Campbell Scientific, Shepshed, UK) at thirty minutes intervals. Water table height was recorded at the EC flux tower location using Orpheus Mini vented-pressure level transducers located in phreatic tubes. Precipitation data from the nearby Met Eireann weather station (Horseleap) were used during the study duration.
The EC processing and quality control procedures included spike removal and double coordinate rotation, while tests on developed turbulence and stationarity were also applied [43,44,45]. The flux data were gap-filled using semi-empirical models parameterized using high-quality flux data [46], while fluxes were partitioned through the extrapolation of nighttime respiration [44].
2.3. Modelling Framework
Figure 2 shows the modelling framework used in this study and the model calibration and validation steps. As mentioned in the introduction, the main objective of this study is to find a combination of indices to be used with LUE models for GPP estimation at peatland sites. Additionally, a site-explicit light use efficiency parameter (LUE) for this site was derived. Initially, GPP was modelled using Equation (1), with six satellite-derived indices (Table 1), literature-based LUE parameters values (Table 2), and measured PAR for 2018. The results were then validated against field-based EC-derived GPP for 2018 to obtain the potential indices for the hybrid models. Overall, six hybrid models were developed on the basis of regression analysis, and modelled GPP were validated against EC-derived GPP for 2019 and 2020. Site-specific LUE parameters (εsite) for drier (2018) and wetter years (2019–2020) for the near-natural peatland were established on the basis of the analysis of light response curves at the site.
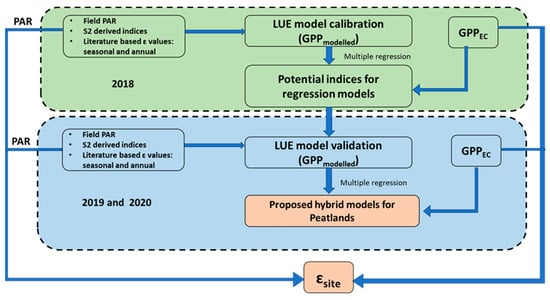
Figure 2.
The modelling framework showing calibration and validation steps to derive hybrid models and to derive site-specific LUE parameters. Light orange boxes show objectives of this study; blue and green boxes show time frame for calibration and validation.

Table 1.
List of vegetation and water indices used as a proxy for fPAR to model GPP.
Table 2.
Literature-based LUE parameter values for peatlands.
2.3.1. Light Use Efficiency Model
The most widely used model for estimating GPP from satellite data is the light use efficiency model developed by Monteith (1977), Equation (1). Clara West is located in the temperate climatic zone, and for this study, it is assumed that the scalar effect of environmental drivers, such as air temperature (Ta) and vapor pressure deficit (VPD), is negligible:
where GPPModelled is LUE-modelled GPP; ε is the radiation use conversion efficiency of the vegetation (g C MJ−1), also known as light use efficiency (LUE) parameter; PAR is the photosynthetically active radiation incident at the canopy (MJ m−2); and fPAR is the fraction of incident PAR absorbed by the canopy (MJ m−2). The fPAR variable is usually modelled as a function of a satellite-derived indices and can be expressed as in Equation (2):
where APAR is absorbed photosynthetically active radiation (MJ m−2 d−1).
GPPModelled = ε × fPAR × PAR
fPAR = APAR/PAR ≈ indices.
2.3.2. Sentinel Data and Indices
The Sentinel-2 product Multispectral Instrument Level 2A (S2-MSIL2A) was made available in March 2018. The Level-2A images are bottom-of-atmosphere (BOA) reflectance in cartographic geometry and are atmospherically corrected. The satellite has a temporal resolution of 5 days, and the spatial resolution varies between 10m and 60m, depending on the wavelengths. The S2 has three vegetation red edge bands (spatial resolution—20 m) dedicated specifically to identifying and analyzing vegetation on the ground. S2 imagery was acquired for the years 2018, 2019, and 2020, with a cloud filter of less than 10% through the Copernicus Open Access Hub (Copernicus Open Access Hub, 2020). The spatial resolution of S2 bands is 10 m, 20 m, and 60 m (depending on the wavelength), and to maintain consistency, all bands were resampled to 10m spatial resolution using the bilinear interpolation technique in SNAP v.7.0. (“SNAP—ESA Sentinel Application Platform”). The images were then subset for the location of Clara Bog using SNAP Subset tool, specifically looking at the subcentral and submarginal ecotopes. The six widely used vegetation and water indices, as mentioned in Table 1, were extracted from Sentinel 2 imagery using SNAP Raster toolbox and were averaged for each subset (using MATLAB v.2019a). These were then used as a proxy for fPAR to model GPP using Equation (1). The formulas and descriptions of the indices are shown in Table 1.
2.3.3. LUE Parameter (ε)
Many remote sensing techniques, such as MODIS, use look-up tables to derive ε values for specific biomes [54], but there is no class for wetlands or peatlands in the MODIS look-up table. Ε is also often calculated from a constant of εmax for a specific biome, such as grassland, forests, and croplands, by adjusting environmental stressors [55]. However, Connolly and Holden [4] showed that ε in peatlands varies over space and time.
Given the dearth of information for the LUE parameter (ε) for peatlands [8], [22], this study uses ε values for growing season and global fixed values based on available studies, as shown in Table 2. For future research at similar near-natural sites, this study provides εsite derived by rectangular hyperbolic curve-fitting using a Michaelis–Menten equation with EC-derived GPP and in situ field PAR data.
2.3.4. The Hybrid Model Calibration
For model calibration (Figure 2), the values for the spectral indices outlined in Table 1 were extracted from nine cloud free Sentinel S2 images in 2018. All six indices (Table 1) were used as a proxy for fPAR to model GPP using equation 1. Field-measured PAR for 2018, along with the literature-based LUE parameters (Table 2), were also used as an input in Equation (1). As a next step, multiple linear regression was performed to test which indices significantly predicted the modelled GPP when compared with the EC-derived GPP. The results of the regression indicated that individually NDWI2, EVI, REP2, and NDVI showed a Spearman correlation between 0.8 and 0.95, whereas LSWI and MCARI showed a Spearman correlation of 0.77, as shown in Figure 3. Therefore, NDWI2, EVI, REP2, and NDVI were selected as potential candidates for the hybrid models, and the fitted regression equations for all three ε values are shown in Table 3. The adjusted R-squared values ranged from 0.97 to 0.98 for all the models, with p-values below 0.05. All the analysis and modelling work were performed using R software (version 3.6.3) and relevant R packages.
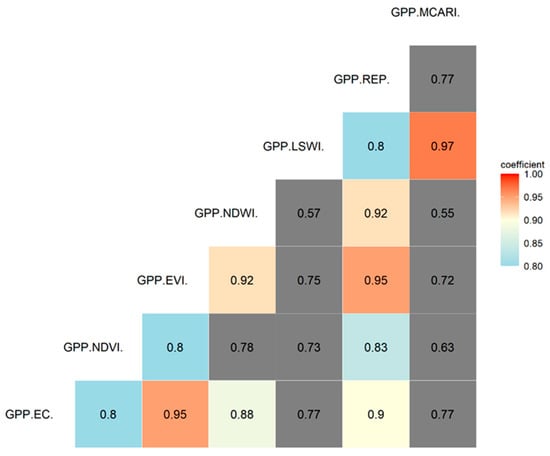
Figure 3.
The correlation matrix of modelled GPP with EC-derived GPP for 2018 (red represents stronger positive correlation, blue and yellow represent moderate positive correlation, and grey color shows correlation below 80%).
Table 3.
Multiple-regression-based hybrid models.
3.1. Seasonal Dynamics of Meteorological Parameters
The seasonal fluctuations of the main meteorological parameters are shown in Figure 4. The average daily air temperature varied between −3.3 °C and 21 °C for the year 2018 and between −1.2 °C and 20 °C for 2019 and 2020 (Figure 4a). The total annual precipitation received for 2019 was 1034 mm, and it was 1065 mm for 2020, whilst the precipitation in 2018 (595 mm) was much lower, highlighting that 2018 was an exceptionally dry year (Figure 4b).
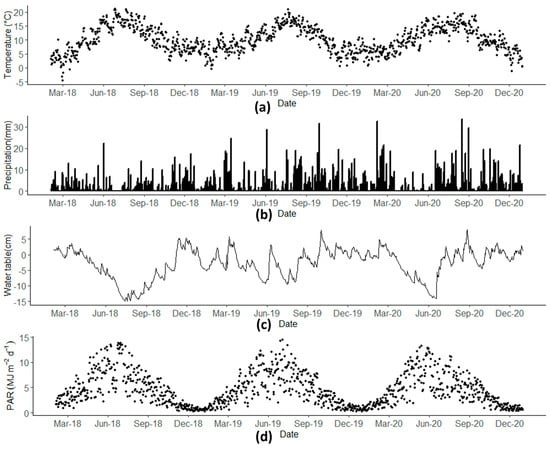
Figure 4.
The seasonal temporal dynamics of meteorological parameters: (a) Average air temperature (°C), (b) Total daily precipitation (mm), (c) Water table depth (cm), and (d) Total daily PAR (MJ m−2 d−1).
In 2018, the water table (Figure 4c) ranged between −15 cm (negative sign indicates below ground level) and 5.4 cm, and it fluctuated between −14 cm and 8.05 cm for the years 2019 and 2020 (Figure 4c). However, the water table dropped to −5 cm on the 4th of June 2018, and remained 5 cm below the bog surface for 147 consecutive days in 2018, which is almost twice the number of consecutive days in 2020 (70 days) and 2020 (81 days).
Daily values of air temperature and PAR showed characteristic seasonal patterns in all years (Figure 4a,d), with maximum measured incident daily PAR coinciding with the maximum air temperatures, representing the peak of the summer period/growing season.
3.2. Light Use Efficiency Parameter (εsite) and Eddy Covariance GPP
The dynamics of GPP followed characteristic seasonal patterns in all years (Figure 5a), with an increase in both carbon assimilation and release associated with increasing air temperatures and incident PAR during the spring and summer months. The total EC-based annual GPP for 2018, 2019, and 2020 was 773.9 g C m−2, 824.33 g C m−2, and 775.7 g C m−2, respectively. GPP also showed seasonal variability, with values for 2018 increasing to a maximum of 6.9 g C m−2 on 28 June 2018, while the maximum GPP (6.6 g C m−2) was observed on 23 July 2019, and on 20 May 2020 (5.7 g C m−2).
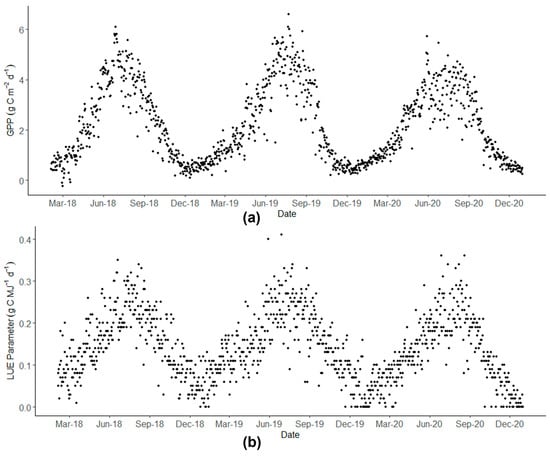
Figure 5.
The seasonal temporal dynamics of meteorological parameters: (a) Daily gross primary productivity (g C m−2 d−1) and (b) Light use efficiency parameter (εsite) (g C MJ−1 d−1).
Significant seasonal variability was also observed in the LUE parameter with LUE values following the seasonal dynamics of temperature and radiation with the highest values during summer (Figure 5b). Values for 2018 ranged from 0.01 g C MJ−1 in mid-February to 0.35 g C MJ−1 in mid-June, returning to 0.01 g C MJ−1 in December. The LUE parameter varied throughout the year from 0 to 0.41 g C MJ−1 for 2019 and 2020, with peaks reaching at 0.41 g C MJ−1 on 28 June 2019, and 0.36 g C MJ−1 on 27 June 2020 (Figure 5b). The annual ecosystem scale value is derived for 2018, 2019, and 2020 using the Michaelis–Menten curve-fitting approach as 0.39, 0.42, and 0.38 g C MJ−1 d−1, with R2 values of 0.71, 0.78, and 0.77, respectively.
3.3. Validation of Hybrid Models
In total, eleven cloud-free Sentinel-2 images were used to derive indices for 2019 and 2020. All six hybrid models, as shown in Table 3, were used as a proxy for fPAR to model GPP using light use efficiency model (Equation (1)) for the ε values presented in Table 2. The modelled GPP was validated against EC-derived GPP for years 2019 and 2020, which were climatologically wet years (Table 4). GPP estimates using Models 2 and 4 showed a strong correlation with the EC-derived GPP, using all the literature-based ε values, with Spearman correlation coefficients of 0.96 and 0.89, respectively, as shown in Figure 6. Models 5 and 6 exhibited moderate correlation from approximately 0.61 to 0.69, with the EC-derived GPP, while Models 1 and 3 were poorly correlated with the EC GPP, with Spearman coefficients of 0.2 to 0.25, respectively.
Table 4.
Modelled GPP validation with EC-derived GPP (EC) (g C m−2) for literature-based LUE parameters ɛ of 0.61, 0.83, and 1.2 g C MJ−1.
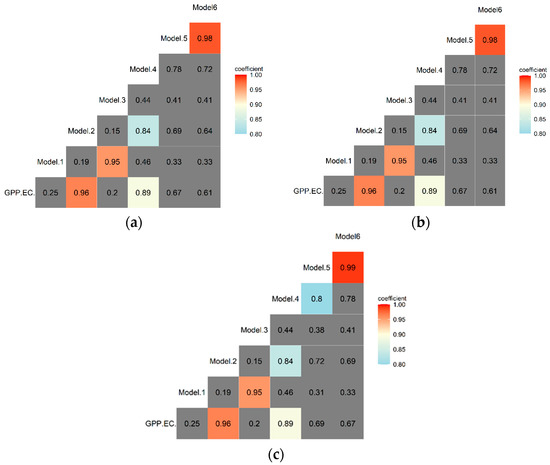
Figure 6.
The correlation matrix of modelled and EC-derived GPP for 2019 and 2020: (a) Correlation matrix for ε = 0.61, (b) Correlation matrix for ε = 0.83, (c) Correlation matrix for ε = 1.2 (warmer colors represent stronger positive correlation, cold colors represent moderate positive correlation, and grey color represents correlation values lower than 80%).
4. Discussion
All of the six Sentinel-derived indices were used to develop hybrid models, which were used as proxies for fPAR to model GPP along with field measured PAR and literature-based LUE parameters using the light use efficiency model approach. The global fixed annual value [21] and growing season values [20,22] of the LUE parameter (ε) were used to model GPP, and these values were then compared with the EC-derived GPP to validate model performance. Model 2, which included NDVI and NDWI2, showed the highest correlation (0.96) with EC-derived GPP; one of the reasons for this might be that it was able to identify vegetation through NDVI and water bodies through NDWI2. Model 4, which included NDVI and EVI, showed a correlation of 0.89 with the EC-derived GPP and was able to detect the vegetation well. A study by Madugundu et al. [56] found that using a single index to model GPP underestimated the flux values by 12% with EVI and overestimated the flux values by 20% with NDVI at an agricultural site. Similar studies highlight the importance of using hybrid models instead of single index for estimating GPP.
Model 1, 3, 5, and 6 showed poor to moderate correlation with EC-derived GPP. Steenvoorden et al. [57] and Bhatnagar et al. [25,58] also highlighted the difference in spectral signatures of raised bogs and challenges for identifying ecotopes. A recent study by Lees et al. [23] found out that MOD17A2H GPP product overestimates GPP modelled from data collected by EC towers situated at two ex-forestry sites undergoing restoration in Scotland and at a near-natural blanket bog site in Ireland [23]. Site-level validation studies have also shown moderate to low performance of MOD17A2H in capturing the seasonal and inter-annual variation in flux estimation [59]. Even though some models [60,61] have tried to incorporate remotely sensed variables to enhance performance, such as land surface temperature (LST) and LSWI in the MODIS products, access to clear cloud-cover-free imagery is a challenge that limits the application of these models across various scales.
In this study, the hybrid models were developed using three years of data that align with the deployment of the EC tower at this site in 2018, and this work represents a novel attempt to develop hybrid models exclusively for raised bog systems. The proposed Models 2 and 4 in this study performed well with limited remote sensing data for a near-natural peatland and highlights the potential to apply the models developed across raised bogs with different management practices. Furthermore, these models could have utility for other wetland systems and could be tested on blanket bogs, fens, and turloughs, and they could also be used to spatially and temporally upscale GPP models using the site-specific LUE parameter developed here or the literature-based approach of LUE parameter integration.
One of the limitations in this study was the availability of LUE parameter values in the wider literature for sites similar to the one in this study, as there are limited studies on peatlands that have reported seasonal, growing season, and annual LUE parameter values [8,21,22]. Even though Sentinel-2 provides relatively high-resolution imagery, there is a need to use ε values from similar sites while using LUE models. Several studies used photochemical reflectance index (PRI) as a direct proxy for ε; however, it is not possible with Sentinel 2 data due to limited band availability [8,13]. This study reports site-specific εsite values based on LRC curves for a near-natural peatland during extremely dry and normal climatic years, which could be useful for the development of additional GPP models. The mean annual ecosystem scale light use efficiency parameter values of 0.39 (dry year) and 0.38–0.42 g C MJ−1 (normal years) were lower than the literature values ranging from 0.61 to 1.2 g C MJ−1 [20,21,22]. The annual ecosystem scale light use efficiency values reported for Clara West were not used to model GPP, as it is calculated using EC-derived GPP and PAR. Validating modelled GPP with EC-derived GPP would have induced circularity into the model. However, the εsite values from this study can be used for modelling similar sites across Ireland and other temperate peatlands. This study did not consider the environmental stressors, such as temperature and vapor pressure deficit, while estimating GPP to reduce model complexity. As mentioned by Kross et al. [21] and Lees et al. [8], scalars developed for other ecosystems may not be appropriate for peatlands, and there is a need of longer dataset from multiple sites to develop or refine existing scalers. A recent study by Gan et al. [22] uses a water use efficiency approach to estimate ecosystem maximum light use efficiency across 52 FLUXNET sites. Their results for seven biomes spread across globe agree well with experimental and modelling methods [22]. As a next step, the approach can be tested on satellites with limited band availability for remote locations and across drainage gradient of peatlands.
5. Conclusions
In this paper, the GPP of a near-natural peatland was successfully modelled using Sentinel 2-derived vegetation indices and a LUE model. Six hybrid models based on multiple regression were developed and tested for various literature-based LUE parameter values specifically for raised bogs; modelled GPP using hybrid Models 2 and 4 correlated well (0.89 to 0.96) with the EC-derived GPP. This study also reports site-specific LUE parameter values based on light response curves for an extremely dry year and normal weather under normal climatological conditions years, which could be useful in the future to help upscale estimates of GPP in other studies on near-natural peatlands. These results provide useful insights on the use of high-resolution-derived vegetation indices and their potential to be used across various scales and peatland types. Additionally, this approach can be further refined using high-resolution imagery, such as planet scope, to estimate carbon fluxes from remote locations. This information will also be useful as a reference for sensor selections and future sensor designs for ecosystem studies.
Author Contributions
R.I. conceived the ideas, designed the methodology, collected and analyzed the data, and wrote the manuscript; S.B. contributed with Sentinel 2A imagery analysis; S.R. provided the water table data; M.S. supervised the research and contributed to the development of the manuscript; J.C. reviewed and helped with development of the manuscript; B.G., J.C., L.G., S.B. and S.R. assisted in reviewing the manuscript. All authors have read and agreed to the published version of the manuscript.
Funding
This work was funded by the Trinity College Dublin, Provost’s Ph.D. Scholarship awards and the Environmental Protection Agency of Ireland 2014–2020 programme of research (project ref: 2018-CCRP-LS.2).
Acknowledgments
The authors wish to thank the Environmental Protection Agency (EPA) for their financial support under the SmartBog project (2019–2023).
Conflicts of Interest
The authors would like to report no existing or potential conflict of interest.
References
- Gorham, E. Northern peatlands: Role in the carbon cycle and probable responses to climatic warming. Ecol. Appl. 1991, 1, 182–195. [Google Scholar] [CrossRef] [PubMed]
- Scharlemann, J.P.W.; Tanner, E.V.J.; Hiederer, R.; Kapos, V. Global soil carbon: Understanding and managing the largest terrestrial carbon pool. Carbon Manag. 2014, 5, 81–91. [Google Scholar] [CrossRef]
- Tanneberger, F.; Tegetmeyer, C. The peatland map of Europe. Mires Peat 2017, 19, 1–17. [Google Scholar] [CrossRef]
- Connolly, J.; Holden, N.M. Mapping peat soils in Ireland: Updating the derived Irish peat map. Ir. Geogr. 2009, 42, 343–352. [Google Scholar] [CrossRef]
- Renou-Wilson, F.; Byrne, K.A.; Flynn, R.; Premrov, A.; Riondato, E.; Saunders, M.; Walz, K.; Wilson, D. Peatland Properties Influencing Greenhouse Gas Emissions and Removal; Environmental Protection Agency: Wexford, Ireland, 2022.
- Connolly, J. Mapping land use on Irish peatlands using medium resolution satellite imagery. Ir. Geogr. 2018, 51, 187–204. [Google Scholar] [CrossRef]
- Renou-Wilson, F.; Moser, G.; Fallon, D.; Farrell, C.A.; Müller, C.; Wilson, D. Rewetting degraded peatlands for climate and biodiversity benefits: Results from two raised bogs. Ecol. Eng. 2019, 127, 547–560. [Google Scholar] [CrossRef]
- Lees, K.J.; Quaife, T.; Artz, R.R.E.; Khomik, M.; Clark, J.M. Potential for using remote sensing to estimate carbon fluxes across northern peatlands—A review. Sci. Total Environ. 2018, 615, 857–874. [Google Scholar] [CrossRef]
- Kiely, G.; Leahy, P.; Lewis, C.; Sottocornola, M.; Laine, A.; Koehler, A.-K. GHG Fluxes from Terrestrial Ecosystems in Ireland, Report No. 227; Environmental Protection Agency: Wexford, Ireland, 2018.
- Laine, A.; Sottocornola, M.; Kiely, G.; Byrne, K.A.; Wilson, D.; Tuittila, E.S. Estimating net ecosystem exchange in a patterned ecosystem: Example from blanket bog. Agric. For. Meteorol. 2006, 138, 231–243. [Google Scholar] [CrossRef]
- Baldocchi, D.; Chu, H.; Reichstein, M. Inter-annual variability of net and gross ecosystem carbon fluxes: A review. Agric. For. Meteorol. 2018, 249, 520–533. [Google Scholar] [CrossRef]
- Barba, J.; Cueva, A.; Bahn, M.; Barron-Gafford, G.A.; Bond-Lamberty, B.; Hanson, P.J.; Jaimes, A.; Kulmala, L.; Pumpanen, J.; Scott, R.L.; et al. Comparing ecosystem and soil respiration: Review and key challenges of tower-based and soil measurements. Agric. For. Meteorol. 2018, 249, 434–443. [Google Scholar] [CrossRef]
- Lees, K.J.; Artz, R.R.; Khomik, M.; Clark, J.M.; Ritson, J.; Hancock, M.H.; Cowie, N.R.; Quaife, T. Using Spectral Indices to Estimate Water Content and GPP in g C Moss and Other Peatland Vegetation. IEEE Trans. Geosci. Remote Sens. 2020, 58, 4547–4557. [Google Scholar] [CrossRef]
- Joiner, J.; Yoshida, Y.; Zhang, Y.; Duveiller, G.; Jung, M.; Lyapustin, A.; Wang, Y.; Tucker, C.J. Estimation of terrestrial global gross primary production (GPP) with satellite data-driven models and eddy covariance flux data. Remote Sens. 2018, 10, 1346. [Google Scholar] [CrossRef]
- Junttila, S.; Kelly, J.; Kljun, N.; Aurela, M.; Klemedtsson, L.; Lohila, A.; Nilsson, M.B.; Rinne, J.; Tuittila, E.S.; Vestin, P.; et al. Upscaling northern peatland CO2 fluxes using satellite remote sensing data. Remote Sens. 2021, 13, 818. [Google Scholar] [CrossRef]
- Schubert, P.; Lund, M.; Eklundh, L. Estimation of gross primary productivity of an ombrotrophic bog in southern Sweden. In Proceedings of the International Geoscience and Remote Sensing Symposium (IGARSS), Boston, MA, USA, 7–11 July 2008; Volume 4, pp. 866–869. [Google Scholar] [CrossRef]
- Hilker, T.; Coops, N.; Wulder, M.; Black, T.A.; Guy, R.D. The use of remote sensing in light use efficiency based models of gross primary production: A review of current status and future requirements. Sci. Total Environ. 2008, 404, 411–423. [Google Scholar] [CrossRef] [PubMed]
- Goerner, A.; Reichstein, M.; Tomelleri, E.; Hanan, N.; Rambal, S.; Papale, D.; Dragoni, D.; Schmullius, C. Remote sensing of ecosystem light use efficiency with MODIS-based PRI. Biogeosciences 2011, 8, 189–202. [Google Scholar] [CrossRef]
- Peng, D.; Zhang, H.; Yu, L.; Wu, M.; Wang, F.; Huang, W.; Liu, L.; Sun, R.; Li, C.; Wang, D.; et al. Assessing spectral indices to estimate the fraction of photosynthetically active radiation absorbed by the vegetation canopy. Int. J. Remote Sens. 2018, 39, 8022–8040. [Google Scholar] [CrossRef]
- Schwalm, C.R.; Black, T.A.; Amiro, B.D.; Arain, M.A.; Barr, A.G.; Bourque, C.P.; Dunn, A.L.; Flanagan, L.B.; Giasson, M.A.; Lafleur, P.M.; et al. Photosynthetic light use efficiency of three biomes across an east-west continental-scale transect in Canada. Agric. For. Meteorol. 2006, 140, 269–286. [Google Scholar] [CrossRef]
- Kross, A.; Seaquist, J.W.; Roulet, N.T. Light use efficiency of peatlands: Variability and suitability for modeling ecosystem production. Remote Sens. Environ. 2016, 183, 239–249. [Google Scholar] [CrossRef]
- Gan, R.; Zhang, L.; Yang, Y.; Wang, E.; Woodgate, W.; Zhang, Y.; Haverd, V.; Kong, D.; Fischer, T.; Chiew, F.; et al. Estimating ecosystem maximum light use efficiency based on the water use efficiency principle. Environ. Res. Lett. 2021, 16, 104032. [Google Scholar] [CrossRef]
- Lees, K.J.; Quaife, T.; Artz, R.R.; Khomik, M.; Sottocornola, M.; Kiely, G.; Hambley, G.; Hill, T.; Saunders, M.; Cowie, N.R.; et al. A model of gross primary productivity based on satellite data suggests formerly afforested peatlands undergoing restoration regain full photosynthesis capacity after five to ten years. J. Environ. Manag. 2019, 246, 594–604. [Google Scholar] [CrossRef]
- Biudes, M.S.; Vourlitis, G.L.; Velasque, M.C.; Machado, N.G.; de Morais Danelichen, V.H.; Pavao, V.M.; Arruda, P.H.; de Souza Nogueira, J. Gross primary productivity of Brazilian Savanna (Cerrado) estimated by different remote sensing-based models. Agric. For. Meteorol. 2021, 307, 108456. [Google Scholar] [CrossRef]
- Bhatnagar, S.; Ghosh, B.; Regan, S.; Naughton, O.; Johnston, P.; Gill, L. Monitoring environmental supporting conditions of a raised bog using remote sensing techniques. Proc. Int. Assoc. Hydrol. Sci. 2018, 380, 9–15. [Google Scholar] [CrossRef]
- Couwenberg, J.; Thiele, A.; Tanneberger, F.; Augustin, J.; Bärisch, S.; Dubovik, D.; Liashchynskaya, N.; Michaelis, D.; Minke, M.; Skuratovich, A.; et al. Assessing greenhouse gas emissions from peatlands using vegetation as a proxy. Hydrobiologia 2011, 674, 67–89. [Google Scholar] [CrossRef]
- Sims, D.A.; Rahman, A.F.; Cordova, V.D.; El-Masri, B.Z.; Baldocchi, D.D.; Flanagan, L.B.; Goldstein, A.H.; Hollinger, D.Y.; Misson, L.; Monson, R.K.; et al. On the use of MODIS EVI to assess gross primary productivity of North American ecosystems. J. Geophys. Res. Biogeosci. 2006, 111, 1–16. [Google Scholar] [CrossRef]
- Lafleur, P.M.; Roulet, N.T.; Bubier, J.L.; Frolking, S.; Moore, T.R. Interannual variability in the peatland-atmosphere carbon dioxide exchange at an ombrotrophic bog. Glob. Biogeochem. Cycles 2003, 17, 1–14. [Google Scholar] [CrossRef]
- Pei, Y.; Dong, J.; Zhang, Y.; Yuan, W.; Doughty, R.; Yang, J.; Zhou, D.; Zhang, L.; Xiao, X. Evolution of light use efficiency models: Improvement, uncertainties, and implications. Agric. For. Meteorol. 2022, 317, 108905. [Google Scholar] [CrossRef]
- Yuan, W.; Berry, J.A.; Zhang, Y.; Joiner, J.; Guanter, L.; Badgley, G.; Lobell, D.B. Deriving a light use efficiency model from eddy covariance flux data for predicting daily gross primary production across biomes. Agric. For. Meteorol. 2007, 143, 189–207. [Google Scholar] [CrossRef]
- Zheng, Y.; Zhang, L.; Xiao, J.; Yuan, W.; Yan, M.; Li, T.; Zhang, Z. Sources of uncertainty in gross primary productivity simulated by light use efficiency models: Model structure, parameters, input data, and spatial resolution. Agric. For. Meteorol. 2018, 263, 242–257. [Google Scholar] [CrossRef]
- Lin, S.; Li, J.; Liu, Q.; Li, L.; Zhao, J.; Yu, W. Evaluating the effectiveness of using vegetation indices based on red-edge reflectance from Sentinel-2 to estimate gross primary productivity. Remote Sens. 2019, 11, 1303. [Google Scholar] [CrossRef]
- Van Gaalen, K.E.; Flanagan, L.B.; Peddle, D.R. Photosynthesis, chlorophyll fluorescence and spectral reflectance in Sphagnum moss at varying water contents. Oecologia 2007, 153, 19–28. [Google Scholar] [CrossRef]
- Lees, K.J.; Clark, J.M.; Quaife, T.; Khomik, M.; Artz, R.R.E. Changes in carbon flux and spectral reflectance of Sphagnum mosses as a result of simulated drought. Ecohydrology 2019, 12, e2123. [Google Scholar] [CrossRef]
- Vogelmann, J.E.; Moss, D.M. Spectral Reflectance Measurements in the Genus Sphagnum. Remote Sens. Environ. 1993, 45, 273–279. [Google Scholar] [CrossRef]
- Harris, A. Spectral reflectance and photosynthetic properties of Sphagnum mosses exposed to progressive drought. Ecohydrology 2008, 1, 35–42. [Google Scholar] [CrossRef]
- Zhang, Y.; Song, C.; Sun, G.; Band, L.E.; Noormets, A.; Zhang, Q. Understanding moisture stress on light use efficiency across terrestrial ecosystems based on global flux and remote-sensing data. J. Geophys. Res. Biogeosci. 2015, 120, 2053–2066. [Google Scholar] [CrossRef]
- Crushell, P.; Connolly, A.; Schouten, M.; Mitchell, F.J.G. The changing landscape of Clara Bog: The history of an Irish raised bog. Ir. Geogr. 2008, 41, 89–111. [Google Scholar] [CrossRef]
- Hammond, R.F. The Peatlands of Ireland, 2nd ed.; An Foras Taluntais: Dublin, Ireland, 1981. [Google Scholar]
- Van der Schaff, S.; Streefkerk, J.G. Relationships between Ecotopes, Hydrological Position and Subsidence on Clara Bog; Warsaw Agricultural University Press: Warsaw, Poland, 2011; pp. 127–136. [Google Scholar]
- Regan, S.; Flynn, R.; Gill, L.; Naughton, O.; Johnston, P. Impacts of Groundwater Drainage on Peatland Subsidence and Its Ecological Implications on an Atlantic Raised Bog. Water Resour. Res. 2019, 55, 6153–6168. [Google Scholar] [CrossRef]
- Van der Schaaf, S. Bog Hydrology. In Conservation and Restoration of Raised Bogs, No. 4; Schouten, M.G.C., Ed.; Staatsbosbeheer, Geological Survey of Ireland: Dublin, Ireland, 2002; pp. 54–109. [Google Scholar]
- Mauder, M.F.T. Documentation and Instruction Manual of the Eddy Covariance Software Abt. Mikrometeorologie Arbeitsergebnisse; No. 2014; Universität Bayreuth, Abt. Mikrometeorologie: Garmisch-Partenkirchen, Germany, 2011; ISSN 1614-8916. [Google Scholar] [CrossRef]
- Reichstein, M.; Baldocchi, D.; Aubinet, M.; Bernhofer, C. On the Separation of Net Ecosystem Exchange into Assimilation and Ecosystem Respiration: Review and Improved Algorithm. Glob. Chang. Biol. 2005, 11, 1424–1439. [Google Scholar] [CrossRef]
- Foken, T.; Mathias, G.; Mauder, M.; Mahrt, L.; Amiro, B.; Munger, W. Chapter 9 post-field data quality control. In Handbook of Micrometeorology: A Guide for Surface Flux Measurement and Analysis; Kluwer: Dordrecht, The Netherlands, 2004; pp. 181–208. [Google Scholar]
- Falge, E.; Baldocchi, D.; Olson, R.; Anthoni, P.; Aubinet, M.; Bernhofer, C.; Burba, G.; Ceulemans, R.; Clement, R.; Dolman, H.; et al. Gap filling strategies for defensible annual sums of net ecosystem exchange. Agric. For. Meteorol. 2001, 107, 43–69. [Google Scholar] [CrossRef]
- Liu, H.Q.; Huete, A. A feedback based modification of the NDVI to minimize canopy background and atmospheric noise. IEEE Trans. Geosci. Remote Sens. 1995, 33, 457–465. [Google Scholar] [CrossRef]
- Huete, A.R.; Liu, H.; Leeuwen, W.J.D. The use of vegetation indices in forested regions: Issues of linearity and saturation. In Proceedings of the IGARSS’97. 1997 IEEE International Geoscience and Remote Sensing Symposium Proceedings. Remote Sensing—A Scientific Vision for Sustainable Development, Singapore, 3–8 August 1997; Volume 4, pp. 1966–1968. [Google Scholar] [CrossRef]
- Gao, X.; Huete, A.R.; Ni, W.; Miura, T. Optical–Biophysical Relationships of Vegetation Spectra without Background Contamination. Remote Sens. Environ. 2000, 74, 609–620. [Google Scholar] [CrossRef]
- Gao, B.C. A normalized difference water index for remote sensing of vegetation liquid water from space Bo-Cai Gao Joint Center for Earth System Sciences Code 913, NASA Goddard Space Flight Center, Greenbelt, MD 20771. Remote Sens. Environ. 1996, 58, 257–266. [Google Scholar] [CrossRef]
- Mcfeeters, S.K. The use of the Normalized Difference Water Index (NDWI) in the delineation of open water features. Int. J. Remote Sens. 1996, 17, 1425–1432. [Google Scholar] [CrossRef]
- Daughtry, C.S.T.; Walthall, C.L.; Kim, M.S.; De Colstoun, E.B. Estimating Corn Leaf Chlorophyll Concentration from Leaf and Canopy Reflectance. Remote Sens. Environ. 2000, 74, 229–239. [Google Scholar] [CrossRef]
- Curran, P.J.; Windham, W.R.; Gholz, H.L. Exploring the relationship between reflectance red edge and chlorophyll concentration in slash pine leaves. Tree Physiol. 1995, 3, 203–206. [Google Scholar] [CrossRef] [PubMed]
- Heinsch, F.A.; Vierling, L.; Deering, D.; Conley, A. Evaluation of remote sensing based terrestrial productivity from MODIS using regional tower eddy flux network observations. IEEE Trans. Geosci. Remote Sens. 2006, 44, 1908–1923. [Google Scholar] [CrossRef]
- Zhang, J.; Wang, X.; Ren, J. Simulation of gross primary productivity using multiple light use efficiency models. Land 2021, 10, 329. [Google Scholar] [CrossRef]
- Madugundu, R.; Al-Gaadi, K.A.; Tola, E.K.; Kayad, A.G.; Jha, C.S. Estimation of gross primary production of irrigated maize using Landsat-8 imagery and Eddy Covariance data. Saudi J. Biol. Sci. 2017, 24, 410–420. [Google Scholar] [CrossRef]
- Steenvoorden, J.; Limpens, J.; Crowley, W.; Schouten, M.G.C. There and back again: Forty years of change in vegetation patterns in Irish peatlands. Ecol. Indic. 2022, 145, 109731. [Google Scholar] [CrossRef]
- Bhatnagar, S.; Gill, L.; Ghosh, B. Drone image segmentation using machine and deep learning for mapping raised bog vegetation communities. Remote Sens. 2020, 12, 2602. [Google Scholar] [CrossRef]
- Zhang, Y.; Xiao, X.; Wu, X.; Zhou, S.; Zhang, G.; Qin, Y.; Dong, J. A global moderate resolution dataset of gross primary production of vegetation for 2000–2016. Sci. Data 2017, 4, 170165. [Google Scholar] [CrossRef]
- Huang, X.; Xiao, J.; Ma, M. Evaluating the performance of satellite-derived vegetation indices for estimating gross primary productivity using FLUXNET observations across the globe. Remote Sens. 2019, 11, 1823. [Google Scholar] [CrossRef]
- Kang, X.; Yan, L.; Zhang, X.; Li, Y.; Tian, D.; Peng, C.; Wu, H.; Wang, J.; Zhong, L. Modeling gross primary production of a typical Coastal Wetland in China using MODIS time series and CO2 Eddy Flux Tower Data. Remote Sens. 2018, 10, 708. [Google Scholar] [CrossRef]


Disclaimer/Publisher’s Note: The statements, opinions and data contained in all publications are solely those of the individual author(s) and contributor(s) and not of MDPI and/or the editor(s). MDPI and/or the editor(s) disclaim responsibility for any injury to people or property resulting from any ideas, methods, instructions or products referred to in the content. |
© 2023 by the authors. Licensee MDPI, Basel, Switzerland. This article is an open access article distributed under the terms and conditions of the Creative Commons Attribution (CC BY) license (https://creativecommons.org/licenses/by/4.0/).