Article

Two-Way Generation of High-Resolution EO and SAR Images via Dual Distortion-Adaptive GANs

School of Electrical and Electronic Engineering, Nanyang Technological University, Block S2.1, 50 Nanyang Avenue, Singapore 639798, Singapore
*
Author to whom correspondence should be addressed.
Remote Sens. 2023, 15(7), 1878; https://doi.org/10.3390/rs15071878
Submission received: 28 February 2023 / Revised: 27 March 2023 / Accepted: 29 March 2023 / Published: 31 March 2023
(This article belongs to the Special Issue Deep Learning for the Analysis of Multi-/Hyperspectral Images)

Abstract

:
Synthetic aperture radar (SAR) provides an all-weather and all-time imaging platform, which is more reliable than electro-optical (EO) remote sensing imagery under extreme weather/lighting conditions. While many large-scale EO-based remote sensing datasets have been released for computer vision tasks, there are few publicly available SAR image datasets due to the high costs associated with acquisition and labeling. Recent works have applied deep learning methods for image translation between SAR and EO. However, the effectiveness of those techniques on high-resolution images has been hindered by a common limitation. Non-linear geometric distortions, induced by different imaging principles of optical and radar sensors, have caused insufficient pixel-wise correspondence between an EO-SAR patch pair. Such a phenomenon is not prominent in low-resolution EO-SAR datasets, e.g., SEN1-2, one of the most frequently used datasets, and thus has been seldom discussed. To address this issue, a new dataset SN6-SAROPT with sub-meter resolution is introduced, and a novel image translation algorithm designed to tackle geometric distortions adaptively is proposed in this paper. Extensive experiments have been conducted to evaluate the proposed algorithm, and the results have validated its superiority over other methods for both SAR to EO (S2E) and EO to SAR (E2S) tasks, especially for urban areas in high-resolution images.

Graphical Abstract

1. Introduction

Electro-optical (EO) satellite imagery has been widely utilized for land surface property analysis [1,2,3,4,5]. However, poor visibility during the night and the presence of occlusions, such as clouds and haze, are hindering the practical deployment of EO data [6,7,8,9]. While weather and illumination determine the quality and reliability of EO imagery, synthetic aperture radar (SAR) provides an all-weather all-time imaging platform. Due to its unique sensor characteristics, clouds and other weather conditions have minimal effects on SAR imagery, which significantly enables the feasibility of SAR as a valuable source of information for earth observation in real-world settings. Since the analysis of SAR imagery conventionally requires expert knowledge and can be time-consuming, one potential and promising solution for robust, fast, and low-cost earth observation is to develop AI models specifically targeted for SAR imagery.
AI-based algorithms have made huge progress in processing natural images [10], and other imaging modalities have also benefited [11,12,13,14]. Yet, high acquisition costs and lack of large-scale, high-quality SAR imagery datasets pose challenges for intelligent remote sensing applications that automatically identify crucial features of buildings and installations, given that data quality and quantity play the most important roles in all AI-based deep learning methods. Unlike SAR imagery, large-scale EO datasets with annotations are publicly available and accessible. By leveraging annotated EO datasets, synthesized labor-free SAR datasets can improve the training stability and performance of large neural networks in the SAR imagery domain. Image-to-image translation (I2I) with deep generative adversarial networks (GANs) [15] has shown great potential in mapping images in two different domains while preserving the main content, such as style transfer and super-resolution. Although GAN-based I2I is widely used in the natural image domain, its application in remote sensing imagery requires further exploration and improvements due to significant divergences in imaging properties. SAR-to-EO (S2E) image translation has been studied in the past with the main objective of synthesizing EO from SAR imagery to aid the interpretation of EO images and compensate for deficiencies due to atmospheric conditions [9,16]. The other direction, EO to SAR (E2S), is seldom explicitly considered from the perspective of dataset augmentation via SAR image synthesis to tackle the data scarcity problem.
The vast majority of S2E methods are applicable to the E2S task. However, one common obstacle hampers the effectiveness of GAN-based I2I algorithms for EO-SAR imagery mapping in both directions, which is not adequately addressed by existing methods. Optical and radar imagery mainly differ from each other in terms of radiometric and physical image formation principles. These differences have introduced nonlinear distortions to EO-SAR image pairs within the same viewing regions, resulting in insufficient pixel-wise correspondence. Current supervised I2I algorithms have a relatively low tolerance for misalignment between training pairs [17], and unsupervised I2I algorithms struggle with local information loss [18,19]. Moreover, we noticed that existing S2E methods are evaluated on datasets with relatively low resolution, i.e., 5 m for Sentinel-1/2. Unlike rural and natural environments, the geometrical resolution of remote sensing data primarily determines its competence for various tasks in urban areas. High-resolution SAR images provide more detailed spatial and textural features of the Earth’s surface [20], opening up possibilities for high-level vision tasks in the remote sensing domain, such as building footprint extraction for urban planning and cargo ship detection for harbor monitoring. To address the limitations in remote sensing image translation, we propose a novel I2I algorithm designed to tackle the nonlinear distortions between EO and SAR. In our proposed algorithm, we design a two-way distortion-adaptive module to mitigate the ambiguity caused by non-uniform distortions, enhancing the pixel-level supervision during the training phase and facilitating the performance of both S2E and E2S tasks. Additionally, to promote further development of remote sensing image translation with high-resolution data, we introduce a new sub-meter resolution EO-SAR dataset, SN6-SAROPT. This new benchmark EO-SAR dataset features the challenges of modality transfer tasks in fine-scale remote sensing imagery, using metadata from SpaceNet 6 [21]. Heterogeneous land cover categories, including urban regions with varying building densities, as well as natural regions like farmland and forests, are all presented in SN6-SAROPT. The key contributions of this work are summarized as follows:
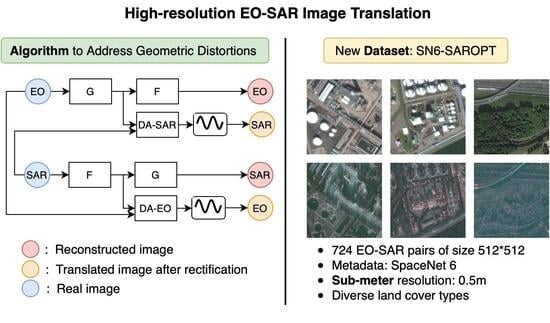
  • We construct a new benchmark high-resolution (0.25 m spatial resolution) EO-SAR dataset SN6-SAROPT, which is comprised of over 700 non-overlapping image pairs (Capella Space’s X-band quad-pol SAR of size 1024 × 1024 and Maxar WorldView 2 EO of size 512 × 512 ) covering the port of Rotterdam, the Netherlands;
  • We present a GAN-based I2I algorithm for EO-SAR images with a distortion-adaptive module to handle nonlinear distortions caused by different imaging characteristics of optical and radar sensors. To the best of our knowledge, this is the first work that models the nonlinear distortions between two imaging domains via a trainable network for remote sensing applications;
  • Extensive experiments on both low-resolution and high-resolution datasets are conducted and have demonstrated the superiority of the proposed method for both S2E and E2S tasks, especially for high-resolution remote sensing data in urban areas.
This paper is organized as follows: Related works on image translation and EO-SAR datasets are reviewed in Section 2. In Section 3, our new benchmark dataset construction is introduced. The proposed novel GAN-based I2I algorithm for EO-SAR with a two-way distortion-adaptive module is described in detail in Section 4. In Section 5, experiments of both E2S and S2E image translation on multiple datasets are conducted and analyzed. Lastly, conclusions are given in Section 6.

2. Related Works

2.1. I2I Translation in Remote Sensing

Since the deep generative GAN model was proposed in 2014 [15], its application to vision tasks has been studied and evolved to tailor to a wide and diverse variety of deployment configurations. Image translation is one of the most common tasks where GANs have ushered in a revolution. As a generic training framework for generative model approximation, GAN-based models typically consist of a generator G and a discriminator D Y , trained in an adversarial manner, as illustrated in Figure 1. Given training images from source domain X and target domain Y, I2I aims to learn a mapping function G, such that given any unseen image in domain X, it can synthesize a fake image indistinguishable from the real image from domain Y, yet keep the semantic content preserved. The generator and discriminator are optimized alternatively to compete with each other. The objective of the generator is to generate fake images capable of fooling the discriminator, while the discriminator is trained to differentiate fake images from real ones. The overall training objective of GANs is known as the adversarial loss; it can be expressed as follows:
arg min G max D Y L G A N ( G , D Y ) = E y Y [ log D Y ( y ) ] + E x X [ log ( 1 D Y ( G ( x ) ) ) ]
Since the only supervising signal is from the discriminator D Y , which makes predictions based on high-level features, the detailed reconstruction performance of the generator G is sub-optimal. Thus, on top of the original GANs optimized with Equation (1), recent GAN-based I2I algorithms have exploited additional loss terms for further enhancement. According to the availability of training data, GAN-based I2I algorithms can be summarized into two types: unsupervised and supervised methods. For the unsupervised methods, images from the source and target domain are required. For the supervised ones, training images from both domains need to be paired. Pix2Pix [17] is one representative supervised I2I algorithm, in which an extra loss term is added to guide the generator G to not only fool the discriminator D Y but also produce fake images close to the ground-truth in the image space. The training objective is given in Equation (2). In addition to the adversarial loss term L G A N , a pixel-level reconstruction loss with a weighting coefficient λ L 1 in the form of L 1 norm is used to enforce that the fake images are similar to real ones in the target domain.
arg min G max D Y L G A N ( G , D Y ) + λ L 1 L L 1 ( G ) L L 1 ( G ) = E x X , y Y [ | | G ( x ) y | | 1 ]
CyleGAN [18] is one representative unsupervised I2I algorithm and it introduces the idea of transitivity into the I2I task. Two sets of generators (G and F) and discriminators ( D Y and D X ) are used to learn two mapping functions, namely G , D Y for X Y and F , D X for Y X . Instead of minimizing the distance between real and fake images, a cycle-consistency loss is imposed to regularize the mapping functions. The assumption adopted in CycleGAN is that the two mapping functions should be inverse to each other so that an image after forward-backward translations should be consistent with itself: F ( G ( x ) ) x and G ( F ( y ) ) y for x X and y Y . As given in Equation (3), a new loss term L c y c with a weighting coefficient λ L c y c , together with two adversarial losses, forms the final training objective of CycleGAN.
arg min G , F max D X , D Y L G A N ( G , D Y ) + L G A N ( F , D X ) + λ L c y c L c y c ( G , F ) L c y c ( G , F ) = E x X [ | | x F ( G ( x ) ) | | 1 ] + E y Y [ | | y G ( F ( y ) ) | | 1 ]
By virtue of the cycle-consistency constraint, paired images from the source and target domains are no longer required. In CycleGAN, mapping functions { G , F } in both directions are learned and the new supervising signal comes in the form of self-reconstruction. The illustration of comparisons between Pix2Pix and CycleGAN is shown in Figure 2.
Both Pix2Pix and CycleGAN were applied to remote sensing image translation in previous works [19,22,23]; the empirical results show that these two GAN-based I2I algorithms are superior to others, but there is still significant room for improvement due to relatively inferior IQA values compared to the natural image domain. Additionally, several GAN-based algorithms have been proposed recently, specifically tailored for EO-SAR translation tasks. Yang et al. [19] proposed FG-GAN to tackle the detailed deficiencies in unsupervised methods. Wang et al. [24] incorporated a vision transformer (ViT) into the GAN-based I2I framework to capture long-distance feature correlations, resulting in a hybrid cGAN. In [25], Tan et al. designed Serial GANs, which decouple the translation process into two stages (despeckling and colorization) to enhance image quality. Our method differs from these works in the following two aspects: 1. Data: Geometric distortions are barely discussed and studied in the previous works due to the false sense of success on relatively low-resolution SAR datasets, e.g., SEN1-2. The focus of our work is to explore and handle novel challenges in I2I translation tasks for sub-meter high-resolution EO-SAR images. 2. Problem Setting: FG-GAN is specifically designed for unsupervised EO-SAR translation. Hybrid cGAN requires additional category information, such as the land type associated with each pair. Serial GANs are limited to single-polarization SAR. Our model, however, is designed for general supervised I2I translation tasks, with no specific requirements on polarization or additional information. Therefore, we dig into the current limitations of Pix2Pix and CycleGAN on high-resolution EO-SAR images and aim to further boost the performance by incorporating prior physical knowledge into the algorithm.
As an active data collection, SAR images are the result of received backscatter after sending electromagnetic waves to the Earth’s surface. In contrast, passive optical sensors, similar to the human visual system, create more intuitive EO images for human perception. Due to the disparate imaging mechanisms, paired EO and SAR images differ not only in style but also in geometric changes. Specifically, the geometric distortions in SAR images can alter the shape of buildings, terrains, and almost all installations with significant height changes. These geometric distortions are non-linear and non-uniform, as volume background natural objects like trees and grass will be almost free from elevation changes. Therefore, geometric distortions, including foreshortening and layover induced by the side-looking nature of SAR images, not only create interpretation barriers for non-experts but also hinder the utilization of deep neural networks due to poor pixel-wise correspondence between EO and SAR images. For example, the use of L 1 loss in image space, as proposed by Pix2Pix, can introduce unnecessary noise. Similar challenges are also encountered in other tasks, such as the image-matching problem. Traditional methods [26,27] that rely on hand-crafted descriptors have been designed for image matching between SAR and EO. However, these methods fail on complex geometric distortions as they only consider low-level features like edges and corners. More recent methods [28] that utilize deep neural networks have been proposed for more robust image matching via high-level feature extraction in the remote sensing domain, but their proposed solutions to address geometric distortion are in an implicit form.
Although the unsupervised I2I algorithm (CycleGAN) can remove the rigorous pixel-level correspondence requirements set out in the supervised I2I algorithm (Pix2Pix), it has been shown that the absence of paired training examples poses a highly under-constrained condition, which may result in undesirable solutions [29,30]. More importantly, for our image translation task in the remote sensing domain, a narrow solution space is desired to minimize the uncertainty in the outputs. Thus, the two-way distortion-adaptive module proposed in this paper aims to enhance the pixel-wise correspondence between the EO and SAR domains by rectifying the geometric distortions via two neural networks. Similar approaches of utilizing extra neural networks for noise elimination during I2I tasks have been designed for medical image analysis [31]. However, unlike those works whose focus is on estimating image misalignment in the target domain only, our method models geometric distortions in both domains with two individual neural networks. The main motivation of the two-way distortion-adaptive module is that geometric distortions are generally much more complicated than misalignment, so domain-specific biases may be captured in the training phase if only images from a single domain are used. Our proposed distortion-adaptive module can better filter out the biases and obtain a reliable domain-agnostic geometric distortion field. More importantly, for our image translation task in the remote sensing domain, a narrow solution space is desired to minimize the uncertainty in the outputs. Thus, the two-way distortion-adaptive module proposed in this paper aims to enhance the pixel-wise correspondence between the EO and SAR domains by rectifying the geometric distortions via two neural networks. Similar approaches of utilizing extra neural networks for noise elimination during I2I tasks have been designed for medical image analysis [31]. However, unlike those works whose focus is on estimating image misalignment in the target domain only, our method models geometric distortions in both domains with two individual neural networks. The main motivation of the two-way distortion-adaptive module is that geometric distortions are generally much more complicated than misalignment, so domain-specific biases may be captured in the training phase if only images from a single domain are used. Our proposed distortion-adaptive module can better filter out the biases and obtain a reliable domain-agnostic geometric distortion field.

2.2. EO-SAR Datasets

Among the existing remote sensing datasets, the vast majority are solely focused on optical images, and few SAR-specific datasets exist, let alone well-organized EO-SAR datasets. Paired EO-SAR datasets for data fusion and image translation tasks have only been introduced in the last few years after the launch of several SAR satellites. In particular, Sentinel-1A [32], which has been operated by the European Space Administration (ESA) since 2014, has provided publicly available land monitoring SAR data at no cost. The SEN1-2 dataset, published in 2018 [33], which utilizes SAR images from Sentinel-1 and EO images from Sentinel-2, has fostered the exploration of deep learning approaches for SAR-EO data analysis. Despite this growing trend of research works on I2I, the development of object-level high-resolution remote sensing applications is still lagging behind the emerging advances in the natural image domain, and the major limitation is the lack of high-quality datasets. For example, the resolution of SAR data from Sentinel-1A is down to 5 m, which is a coarse spatial resolution where only region-level tasks can be performed. Given the high acquisition cost, open-source high-resolution SAR datasets are scarce. One of the most established data sources for higher spatial resolution is the satellite TerraSAR-X [34], launched by a partnership between the German Aerospace Center (DLR) and EADS Astrium, which provides high-resolution SAR data with a GSD of 1 m. We have selected two commonly-used and representative paired EO-SAR datasets, one with low resolution and the other with high resolution, for further illustration and comparison.

2.2.1. SEN1-2

SEN1-2 [33] is a dataset consisting of 282,384 paired EO-SAR image patches of size 256 × 256 . It covers the entire globe and all four seasons. The raw SAR and EO data are collected from Sentinel-1 and Sentinel-2 satellites, respectively. Sentinel-1 is a C-band SAR satellite with a resolution of 5 m, and the SAR images in SEN1-2 are acquired under the interferometric wide swath (IW) mode with a single VV polarization.

2.2.2. SAR2Opt

SAR2Opt [23], published in 2022, is a high-resolution dataset comprising 2076 paired EO-SAR image patches of size 600 × 600 . The coverage of SAR2Opt is around 70 km 2 over multiple cities around the world. The raw SAR and EO data are collected from the TerraSAR-X satellite and Google Earth Engine respectively. TerraSAR-X is an X-band SAR satellite with a resolution of 1 m, and the SAR images in SAR2Opt are acquired under a high-resolution spotlight mode with single polarization.
Sample images from SEN1-2 and SAR2Opt are given in Figure 3 and Figure 4, respectively. It can be observed that low-resolution SAR images in SEN1-2 cover much wider areas than the high-resolution ones in SAR2Opt. Macro-scale tasks, including vegetation monitoring [35,36,37], ocean observation [38,39], and even natural disaster management, such as flood water delineation [40,41,42] and typhoon estimation [43,44], have benefited from the SAR imagery of Sentinel-1. However, more complex tasks [4,5,45], which require discrimination of fine structures such as single buildings in cities and vessels near harbors, are far beyond the scope of datasets with coarse resolution. In the SAR2Opt dataset, more details and features of urban areas are preserved in the SAR images. Although some scattering events still occur in the resolution cell, the phenomenon of over-averaging with the surrounding background is largely alleviated.

3. Construction of the Novel Dataset SN6-SAROPT

The expanded version of the SpaceNet 6 dataset [21] (E-SN6) is exploited to construct a new well-organized EO-SAR benchmark dataset. The raw EO and SAR images in E-SN6 are provided in the following forms:
  • A full Maxar WorldView 2 optical image of size 22,800 × 16,202 and spatial resolution of 0.5 m, without cropping;
  • A total of 202 overlapping SAR image strips are included in the dataset, each with a size of ∼2800 × 40,000 and a spatial resolution of 0.25 m. Four channels of SAR intensity information, i.e., HH, HV, VH, and VV, and two channels derived from Pauli polarimetric decomposition, i.e., Alpha2 and Beta2, are contained.
Sample images of the raw EO and SAR data are illustrated in Figure 5. Upon acquisition of the raw data, we conducted the following two steps to generate a well-organized dataset: SAR image processing and EO-SAR Matching.

3.1. SAR Image Processing

As a common phenomenon in SAR images, speckle noise formed by coherent interference of reflected electromagnetic waves degrades visual quality and causes interpretation difficulty. Thus, for the raw SAR image strips in E-SN6, speckle reduction is performed using a Wiener 2D adaptive filter. Magnitude adjustments, including gamma correction and white balancing, are also conducted to enhance the final image quality.

3.2. EO-SAR Matching

The full-size optical image is cropped into patches of size 512 × 512 without any overlapping regions. Meanwhile, the geo-coordinates of each patch are manually annotated. For the SAR strips, they are cropped into patches of size 1024 × 1024 , which is two times larger than the optical patches due to the higher resolution of SAR. Similar to the optical patches, the geo-coordinates of SAR patches are annotated first and then used for EO-SAR patch co-registration. We end up with 724 EO-SAR pairs for this new dataset. We have further categorized the image pairs into four land types: building, forest, river, and road. The image pairs for the four categories are 402, 113, 141, and 68, respectively. A comparison with existing paired EO-SAR datasets is presented in Table 1, and sample image patches are given in Figure 6. Even though SN6-SAROPT has no significant advantage over others in terms of image patch numbers, it is worth noting that this is mainly due to the fact that overlap is avoided in the construction. For the current high-resolution datasets, we have noticed that overlap has inflated the scale of datasets, and the overlapping region in a single patch is 60% for SAR2Opt, more than 50% for SARptical, and 20% for QXS-SAROPT. More importantly, the resolution and polarization channels of SN6-SAROPT, which are intrinsic properties that determine the quality and quantity of carried information, have an undoubted ascendancy over the existing ones. Especially for I2I tasks in the remote sensing domain, additional spatial-wise and channel-wise information contained in SN6-SAROPT can explore the full potential of SAR imagery.

4. Methodology

Given two sets of paired EO and SAR images, denoted as domain X and domain Y, respectively, the objective is to learn a mapping function G for the E2S task, such that for any previously unseen EO image, the generated fake SAR image is as similar as possible to real SAR images, and to learn a mapping function F for the S2E task, such that for any previously unseen SAR image, the generated fake EO image is as similar as possible to real EO images.

4.1. Two-Way Distortion-Adaptive Module

To better eliminate noise arising from geometric distortions, a two-way distortion-adaptive module is proposed. As illustrated in Figure 7, the overall training framework takes advantage of both Pix2Pix and CycleGAN, incorporating an additional network called the distortion-adaptive (DA) module in both directions. Each DA module aims to learn the geometric changes between the two domains. Specifically, DA-SAR models the geometric changes from EO to SAR and vice versa for DA-EO. Since both image style and geometric structure contribute to the final visual appearance, learning geometric changes can be difficult if image styles are changing simultaneously. To address this, image translation is performed first and only images from the same domain are fed into each DA module. DA-SAR takes the fake SAR image G ( x ) and the real SAR image y as inputs and produces a distortion field ϕ S A R . The distortion field ϕ S A R is then used to perform a resampling process on fake SAR image G ( x ) to obtain R ( G ( x ) , ϕ S A R ) . DA-EO takes the fake EO image F ( y ) and real EO image x as inputs and produces a de-distortion field ϕ E O . The de-distortion field ϕ E O is then used to perform a resampling process on the fake EO image F ( y ) to obtain R ( F ( y ) , ϕ E O ) . The objective of the two-way distortion-adaptive module is to enhance pixel-level correspondence between the image pairs by explicitly modeling geometric distortions between SAR and EO domains. Therefore, we expect that the resampling operations with the guidance from the two fields will produce outputs similar to the real images, i.e., R ( G ( x ) , ϕ S A R ) y and R ( F ( y ) , ϕ E O ) x . Both the distortion field ϕ S A R and de-distortion field ϕ E O have the size of H × W × 2 for image patches x , y of size H × W , which specifies the shifts of each pixel in horizontal and vertical directions. The image sampling strategy in the Spatial Transformer [50] is adopted in our method to achieve a differentiable resampling mechanism. The general 2D image resampling operation can be defined as follows:
V i c = n = 1 H m = 1 W U n , m c k ( p n ; Φ h ) k ( q m ; Φ v ) i [ 1 H W ] c [ 1 C ]
where V i c denotes the value of pixel i at coordinates ( p , q ) of the output image in channel c, U n , m c denotes the pixel value at coordinates ( n , m ) of the input image in channel c, and { Φ h , Φ v } are the parameters of interpolation function k ( · ) in horizontal and vertical axes, respectively. With ϕ S A R and ϕ E O , the resampling results can be expressed as follows:
R i c ( G ( x ) , ϕ S A R ) = n = 1 H m = 1 W G ( x ) n , m c δ ( ϕ i S A R [ 0 ] + p n ) δ ( ϕ i S A R [ 1 ] + q m ) i [ 1 H W ] c [ 1 C ]
R i c ( F ( y ) , ϕ E O ) = n = 1 H m = 1 W F ( y ) n , m c δ ( ϕ i E O [ 0 ] + p n ) δ ( ϕ i E O [ 1 ] + q m ) i [ 1 H W ] c [ 1 C ]
where δ ( · ) is the Kronecker delta function, ϕ i S A R [ 0 ] and ϕ i S A R [ 1 ] denote the values of pixel i at coordinates ( p , q ) of the distortion field ϕ S A R and similar notations apply to ϕ E O . Equations (5) and (6) reduce to R i c ( G ( x ) , ϕ S A R ) = G ( x ) n , m c with { n = ϕ i S A R [ 0 ] + p , m = ϕ i S A R [ 1 ] + q } and R i c ( F ( y ) , ϕ E O ) = F ( y ) n , m c with { n = ϕ i E O [ 0 ] + p , m = ϕ i E O [ 1 ] + q } , respectively. As the coordinates of images should be integers, bi-linear interpolation is used because of the float data type of the two fields. Therefore, the final results are:
R i c ( G ( x ) , ϕ S A R ) = r N ( 1 | r [ 0 ] n | ) ( 1 | r [ 1 ] m | ) G ( x ) r c i [ 1 H W ] c [ 1 C ] n = ϕ i S A R [ 0 ] + p , m = ϕ i S A R [ 1 ] + q
R i c ( F ( y ) , ϕ E O ) = r N ( 1 | r [ 0 ] n | ) ( 1 | r [ 1 ] m | ) F ( y ) r c i [ 1 H W ] c [ 1 C ] n = ϕ i E O [ 0 ] + p , m = ϕ i E O [ 1 ] + q
where N represents the set of locations of four neighbors of coordinates ( n , m ) , i.e., N = { ( n , m ) , ( n , m ) , ( n , m ) , ( n , m ) } .

4.2. Overall Training Scheme

With the two-way distortion-adaptive module, it is possible to achieve the pixel-level reconstruction of real images. Since the two generators G and F have already performed the task of style/texture transfer, and the resampling operations have rectified the geometric distortions, we can safely minimize the L 1 distance between the synthetic and real images:
L L 1 ( G , F , ϕ S A R , ϕ E O ) = E x X , y Y [ | | R ( G ( x ) , ϕ S A R ) y | | 1 + | | R ( F ( y ) , ϕ E O ) x | | 1 ]
The two fields ϕ S A R and ϕ E O can be highly uneven in order to achieve nearly-zero distance in Equation (9), which may give trivial solutions of over-fitted DA modules and under-fitted generators. Hence, a gradient loss is imposed as a regularization constraint:
L s m o o t h ( G , F , ϕ S A R , ϕ E O ) = E x X , y Y [ | | ϕ S A R | | 2 + | | ϕ E O | | 2 ] ϕ S A R = ( ϕ S A R [ : , 1 : , : ] ϕ S A R [ : , : 1 , : ] , ϕ S A R [ 1 : , : , : ] ϕ S A R [ : 1 , : , : ] ) ϕ E O = ( ϕ E O [ : , 1 : , : ] ϕ E O [ : , : 1 , : ] , ϕ E O [ 1 : , : , : ] ϕ E O [ : 1 , : , : ] )
In addition, cycle-consistency loss is also incorporated into our methods for a more controllable solution space. To this end, we have the following full training objective:
arg min G , F , ϕ S A R , ϕ E O max D X , D Y L G A N ( G , D Y ) + L G A N ( F , D X ) + λ L c y c L c y c ( G , F ) + λ L 1 L L 1 ( G , F ) + λ L s m o o t h L s m o o t h ( G , F , ϕ S A R , ϕ E O )
where L c y c ( G , F ) is defined in Equation (3) and λ L c y c , λ L 1 , λ L s m o o t h are weights of the corresponding loss terms, respectively. Similar to the two discriminators, D Y and D X , the two DA modules will not be used during the inference phase, because the ground-truth images in the target domain are not available.

5. Experiments

To provide more comprehensive experimental results, the performances on both E2S and S2E translation tasks are assessed. According to the empirical results presented in previous work [23], we have selected the three top-performing GAN-based I2I algorithms for the S2E task on both high-resolution and low-resolution EO-SAR datasets. These algorithms are CycleGAN [18], Pix2Pix [17], and NICEGAN [51], and they will be compared to our proposed method. Since NICEGAN is a holistic approach that has incorporated multiple components, e.g., multi-scale discriminator, residual attention mechanism, and cycle consistency, two variants of NICEGAN are tested: NICEGAN with and without cycle consistency loss, denoted as NICEGAN(C) and NICEGAN(NC), respectively. Three benchmark datasets, i.e., SEN1-2, SAR2Opt, and SN6-SAROPT, are evaluated. For SEN1-2, we randomly selected 500 images from each sub-dataset (spring, summer, fall, and winter), and then keep 10 % of the images for testing and the remaining 90 % for training. For SAR2Opt, the original train/test split is adopted. Similar to SEN1-2, we split the new dataset (SN6-SAROPT) by randomly selecting 10 % for testing and the remaining 90 % for training.

5.1. Experiment Setup

All experiments were conducted on a server running Ubuntu 18.04 with 4 NVIDIA GeForce RTX 2080 Ti GPUs, 128 GiB RAM, and an Intel Xeon CPU E5-1660. The programming environment used was Python 3.6.13 and PyTorch 1.8.1. The Adam optimizer with a learning rate of 1 × 10 4 was employed, and the total number of training epochs was set to 80. The network architecture used for generators G and F mainly consisted of two downsampling convolutional layers, nine residual blocks, and two upsampling convolutional layers. For the discriminator D X and D Y , a five-layer convolutional neural network is used. Similar to the previous works [31,52], U-Net architecture is used for the two DA modules. The hyperparameters in Equation (11) are set as follows: λ L c y c = 10 , λ L 1 = 20 and λ L s m o o t h = 10 for SAR2Opt and SN6-SAROPT; λ L c y c = 10 , λ L 1 = 0.5 and λ L s m o o t h = 0.5 for SEN1-2. The model collapse is observed when λ L 1 and λ L s m o o t h take large values for SEN1-2, so they are adjusted to lower levels.

5.2. Evaluation Metrics

Four evaluations metrics are used to assess the quality of generated images: PSNR, SSIM [53], FID [54], and LPIPS [55]. Note that all metrics used in this work belong to full-reference image quality assessment (FR-IQA), where reference images are required. No-reference Image Quality Assessment (NR-IQA) is not considered, due to the fact that most NR-IQA scores are solely dependent on the images to be assessed, and pre-established models are based on natural images, which have significant differences from remote sensing imagery.
  • Peak signal-to-noise ratio (PSNR): Based on the average L 2 distance between two images, x and y of size C × H × W , also known as the mean-squared error (MSE). PSNR is defined as:
    P S N R ( x , y ) = 10 log 10 ( 1 M S E ) , M S E = 1 H W C i = 1 H W C ( x i y i ) 2
  • Structural SIMilarity (SSIM): Image similarity is measured by comparing the contrast, luminance, and structural information:
    S S I M ( x , y ) = ( 2 μ x μ y + C 1 ) ( 2 σ x y + C 2 ) ( μ x 2 + μ y 2 + C 1 ) ( σ x 2 + σ y 2 + C 2 )
    where μ x / y , σ x / y , and σ x y denote the mean, standard deviation, and covariance of the corresponding images respectively, and C 1 and C 2 are two constants.
  • Fréchet Inception Distance (FID): FID is defined as the Wasserstein-2/Fréchet distance between the feature embeddings of images from the last pooling layer of the Inception-V3 model pre-trained on ImageNet.
    F I D ( x , y ) = | | m x m y | | 2 2 + Tr ( C x + C y 2 ( C x C y ) 0.5 )
    where m x / y and C x / y denote the mean and covariance of the corresponding feature embeddings, respectively.
  • Learned perceptual image patch similarity (LPIPS):
    L P I P S ( x , y ) = l 1 H l W l h , w | | w l ( s x l s y l ) | | 2 2
    where s x / y l and w l denote the corresponding normalized feature embeddings and scaling coefficient of layer l.

5.3. Quantitative Evaluations

The quantitative results are presented in Table 2, Table 3 and Table 4 for the three datasets. Our method has shown significant improvements on both S2E and E2S tasks for high-resolution datasets SAR2Opt and SN6-SAROPT. In Table 2 and Table 3, seven out of the eight best scores of evaluation metrics are achieved by our method. Although the FID scores of our method on the S2E task are slightly worse than those of CycleGAN, we consider this as a result of the evaluation bias of FID, which only addresses high-level feature similarity and ignores low-level reconstruction quality. Moreover, we observed that the scores on the E2S task are generally better than those on the S2E task, indicating an imbalance in the difficulties of the two transfer tasks. We believe this is due to the fact that EO images contain more information compared to SAR images, which makes the E2S task easier than the S2E task under the same conditions. More visual samples from SAR2Opt and SN6-SAROPT will be presented in the following section. For SEN1-2, our method performs comparably to others, as shown in Table 4. However, the advantages of our proposed DA module are not fully realized on low-resolution EO-SAR datasets. Nonlinear distortions due to different imaging characteristics of optical and radar sensors are less severe in low-resolution SAR images, limiting potential improvements. Additionally, evaluation results for each land type in SN6-SAROPT are provided in Table 5. We have observed correlations between the effectiveness of our method and the urbanization level of the region. For building and road areas, our method outperforms others in seven out of eight scores. While for forest and river areas, the performances are still generally superior, but slightly degraded compared to more urbanized areas. Since human-made objects in high-resolution SAR images are more vulnerable to noises arising from geometric distortions than natural objects, the empirical results have successfully validated our assumption that the proposed DA module is capable of addressing such an issue.
The comparison of model complexity is presented in Table 6, where the number of trainable parameters and test time are compared among the algorithms. The proposed algorithm has a comparable number of parameters to CycleGAN and is less complex than Pix2Pix and NICEGAN(C). The additional computational cost brought by the proposed DA modules is not significant. For the test time, Pix2Pix achieved significantly faster inference than others.

5.4. Qualitative Evaluations

Visual samples generated by different models are shown in Figure 8, Figure 9, Figure 10 and Figure 11. Because the model collapse is observed for NICEGAN(NC), the visual results of NICEGAN(NC) are omitted. SN6-SAROPT: In Figure 8, both global and local structures of the EO images have been correctly reconstructed by our method. Significant structure deformations are observed in images generated by NICEGAN(C). Pix2Pix fails to preserve the global structure information and, thus, ends up with meaningless outputs. CycleGAN performed better than Pix2Pix and NICEGAN(C), as most of the spatial structures are correctly captured. However, many wrong interpretations are made by CycleGAN, e.g., the white storage tanks in the real EO images are incorrectly reconstructed for the first two samples. In Figure 9, similar observations can be made, i.e., NICEGAN(C) fails to generate realistic images; Pix2Pix totally ignores the overall structure information; and CycleGAN is prone to generating wrong details. For example, the upper right building blocks in the real SAR images of the first two samples were only correctly produced by our method. SAR2Opt: For the first sample in Figure 10, NICEGAN(C) generates checkerboard artifacts; CycleGAN fails to preserve the detailed structures; and the roads produced by Pix2Pix are not as clear as those reconstructed by our method. For the other two samples, Pix2Pix has only learned partial texture information. NICEGAN(C) and CycleGAN have generated incorrect items, such as blue buildings in the second sample and vegetation in the third sample. In Figure 11, the translation results of E2S are particularly distinct among the four methods. Specifically, Pix2Pix introduces severe noise and produces blurry boundaries for the installations. CycleGAN and NICEGAN(C), on the other hand, only adjust the color tone of the EO images without making significant changes to other content. In contrast, our method has accurately captured the correlations between the two modalities regarding both texture and contour information. To summarize, we can make the following observations: (1) Despite cycle consistency being effective in preventing model collapse, NICEGAN(C) is still prone to significant artifacts. (2) Pix2Pix suffers from a loss of structural information and only learns texture correlations. (3) The outputs from CycleGAN may seem reasonable at first glance without comparing them to ground-truth images, but most of the generated local details deviate from the real ones upon closer inspection. (4) The proposed DA module provides extra supervision signals via the rectification of geometric distortions, such that not only the image style in terms of color and texture is learned, but also local reconstruction quality is substantially enhanced.

5.5. Ablation Study

To validate the effectiveness of each module in the proposed method, an ablation study was conducted to further analyze the contribution of each. The comparisons of IQA scores from our method and its three variants are given in Table 7. Referring back to the overall training framework in Figure 7, DA-SAR is designed to map the distortion field ϕ S A R and is jointly trained with generator G, which translates images from the EO domain to the SAR domain, i.e., the gradients of loss L L 1 are back-propagated through both of them. Therefore, DA-SAR is expected to have a great impact on the performance of the proposed method on the E2S task. Similar reasoning applies to DA-EO, and we expect that the performances on the S2E task are largely dependent on the learning of the de-distortion field ϕ E O . The results in Table 7 have validated the above analyses. Considerable performance degradation happens when DA-SAR is removed on the E2S task or DA-EO is removed on the S2E task. Moreover, we observed that the performances of our method on the E2S task are not only determined by DA-SAR but also enhanced by DA-EO. By just removing DA-EO, three out of the four evaluation metrics have worsened on the E2S task. While for the S2E task, both PSNR and SSIM scores degraded after removing DA-SAR. Visual samples are provided in Figure 12 and Figure 13 for the S2E and E2S tasks, respectively. By comparing the generated images with the ground-truth, the importance of each DA module is demonstrated. In Figure 12, the generated EO images show the wrong land type after removing DA-EO, i.e., buildings in the first sample and bare grounds in the latter two samples all change to grasslands. After removing DA-SAR, several buildings in the first sample disappear, and the upper-left region of the second sample changes to grassland. In Figure 13, the generated SAR images treat shadows/backgrounds as targets after removing DA-SAR. Moreover, the boundaries of buildings in the generated SAR images become blurry after removing DA-EO. Therefore, the synergistic effects of the proposed two-way distortion-adaptive module are confirmed, i.e., each single DA network is indispensable.

6. Conclusions

In this paper, we address two limitations in the current GAN-based I2I studies for EO-SAR mapping tasks: (1) The lack of high-resolution datasets gives a false sense of success that existing methods have solved the problem, and (2) the non-linear distortions between EO and SAR images arising from different sensors are ignored. We introduce a new dataset, SN6-SAROPT, which provides EO-SAR image patches with a resolution of 0.25 m, the highest among all publicly available datasets. We also design a novel algorithm that incorporates a two-way distortion-adaptive module into translation networks. We conduct extensive experiments on three datasets with resolutions ranging from 5 m to 0.25 m for both E2S and S2E tasks. The empirical results demonstrate the superiority of our method over others, especially for high-resolution datasets where more regions have severe geometric distortion issues.
For future work, we plan to incorporate high-level tasks into the learning of EO-SAR mapping. Firstly, high-level tasks, including (but not limited to) object detection, classification, and anomaly detection, can provide more comprehensive evaluations of the transfer model. As one of the main motivations of EO-SAR mapping is data augmentation via synthetic image generation, the performance of the detector/classifier trained with synthetic data is a good indicator of the efficacy of the deployed I2I translation network. Secondly, current I2I translation algorithms for remote sensing applications are mainly focused on general solutions, whereas task-specific image mapping will benefit downstream applications by selectively emphasizing task-discriminative information.
The defense against the misuse of generated images for remote sensing applications is also worth further investigation. In the natural image domain, widely accessible online image-generation platforms have already raised ethical and legal concerns. While remote sensing imagery is not as common as natural images, the trustworthiness of data is becoming more important than ever due to its extensive use in security-critical scenarios.

Author Contributions

Conceptualization, Y.Q.; Methodology, Y.Q.; Software, Y.Q.; Validation, Y.Q.; Formal analysis, Y.Q., J.Z. and B.W.; Investigation, J.Z. and H.F.; Resources, J.Z., W.L. and B.W.; Data curation, J.Z. and H.F.; Writing—original draft, Y.Q.; Writing—review & editing, Y.Q. and B.W.; Visualization, Y.Q.; Supervision, W.L. and B.W.; Project administration, W.L. and B.W.; Funding acquisition, W.L. and B.W. All authors have read and agreed to the published version of the manuscript.

Funding

This research received no external funding.

Data Availability Statement

Not applicable.

Conflicts of Interest

The authors declare no conflict of interest.

Abbreviations

The following abbreviations are used in this manuscript:
EO Electro-optical
SAR Synthetic Aperture Radar
I2I Image to image translation
GAN Generative Adversarial Network
S2E SAR to EO
E2S EO to SAR
GSD Ground Sample Distance
ESA European Space Administration
DLR German Aerospace Center
IW Interferometric Wide
E-SN6 Expanded version of the SpaceNet 6 dataset
DA Distortion-adaptive
FR-IQA Full-reference Image Quality Assessment
NR-IQA No-reference Image Quality Assessment
PSNR Peak Signal-to-Noise Ratio
SSIM Structural SIMilarity
FID Fréchet Inception Distance
LPIPS Learned Perceptual Image Patch Similarity

References

  1. Hansen, M.C.; Defries, R.S.; Townshend, J.R.G.; Sohlberg, R. Global Land Cover Classification at 1 Km Spatial Resolution Using a Classification Tree Approach. Int. J. Remote Sens. 2000, 21, 1331–1364. [Google Scholar] [CrossRef]
  2. Zhong, Y.; Ma, A.; soon Ong, Y.; Zhu, Z.; Zhang, L. Computational Intelligence in Optical Remote Sensing Image Processing. Appl. Soft Comput. 2018, 64, 75–93. [Google Scholar] [CrossRef]
  3. Li, K.; Wan, G.; Cheng, G.; Meng, L.; Han, J. Object Detection in Optical Remote Sensing Images: A Survey and a New Benchmark. ISPRS J. Photogramm. Remote Sens. 2020, 159, 296–307. [Google Scholar] [CrossRef]
  4. He, X.; Zhou, Y.; Zhao, J.; Zhang, D.; Yao, R.; Xue, Y. Swin Transformer Embedding UNet for Remote Sensing Image Semantic Segmentation. IEEE Trans. Geosci. Remote Sens. 2022, 60, 4408715. [Google Scholar] [CrossRef]
  5. Chen, H.; Qi, Z.; Shi, Z. Remote Sensing Image Change Detection with Transformers. IEEE Trans. Geosci. Remote Sens. 2022, 60, 4408715. [Google Scholar] [CrossRef]
  6. Pan, X.; Xie, F.; Jiang, Z.; Yin, J. Haze Removal for a Single Remote Sensing Image Based on Deformed Haze Imaging Model. IEEE Signal Process. Lett. 2015, 22, 1806–1810. [Google Scholar] [CrossRef]
  7. Jiang, H.; Lu, N. Multi-Scale Residual Convolutional Neural Network for Haze Removal of Remote Sensing Images. Remote Sens. 2018, 10, 945. [Google Scholar] [CrossRef] [Green Version]
  8. Guo, Q.; Hu, H.M.; Li, B. Haze and Thin Cloud Removal Using Elliptical Boundary Prior for Remote Sensing Image. IEEE Trans. Geosci. Remote Sens. 2019, 57, 9124–9137. [Google Scholar] [CrossRef]
  9. Darbaghshahi, F.N.; Mohammadi, M.R.; Soryani, M. Cloud Removal in Remote Sensing Images Using Generative Adversarial Networks and SAR-to-Optical Image Translation. IEEE Trans. Geosci. Remote Sens. 2022, 60, 4105309. [Google Scholar] [CrossRef]
  10. He, K.; Zhang, X.; Ren, S.; Sun, J. Deep Residual Learning for Image Recognition. arXiv 2015, arXiv:1512.03385. [Google Scholar] [CrossRef]
  11. Sumbul, G.; Charfuelan, M.; Demir, B.; Markl, V. Bigearthnet: A Large-Scale Benchmark Archive for Remote Sensing Image Understanding. In Proceedings of the IGARSS 2019—2019 IEEE International Geoscience and Remote Sensing Symposium, Yokohama, Japan, 28 July–2 August 2019; pp. 5901–5904. [Google Scholar] [CrossRef] [Green Version]
  12. Mahdianpari, M.; Salehi, B.; Rezaee, M.; Mohammadimanesh, F.; Zhang, Y. Very Deep Convolutional Neural Networks for Complex Land Cover Mapping Using Multispectral Remote Sensing Imagery. Remote Sens. 2018, 10, 1119. [Google Scholar] [CrossRef] [Green Version]
  13. Esteva, A.; Chou, K.; Yeung, S.; Naik, N.; Madani, A.; Mottaghi, A.; Liu, Y.; Topol, E.; Dean, J.; Socher, R. Deep Learning-Enabled Medical Computer Vision. NPJ Digit. Med. 2021, 4, 1–9. [Google Scholar] [CrossRef] [PubMed]
  14. Hatamizadeh, A.; Tang, Y.; Nath, V.; Yang, D.; Myronenko, A.; Landman, B.; Roth, H.R.; Xu, D. UNETR: Transformers for 3D Medical Image Segmentation. In Proceedings of the 2022 IEEE/CVF Winter Conference on Applications of Computer Vision (WACV), Waikoloa, HI, USA, 3–8 January 2022; IEEE: Waikoloa, HI, USA, 2022; pp. 1748–1758. [Google Scholar] [CrossRef]
  15. Goodfellow, I.J.; Pouget-Abadie, J.; Mirza, M.; Xu, B.; Warde-Farley, D.; Ozair, S.; Courville, A.; Bengio, Y. Generative Adversarial Networks. arXiv 2014, arXiv:1406.2661. [Google Scholar] [CrossRef]
  16. Fuentes Reyes, M.; Auer, S.; Merkle, N.; Henry, C.; Schmitt, M. SAR-to-Optical Image Translation Based on Conditional Generative Adversarial Networks—Optimization, Opportunities and Limits. Remote Sens. 2019, 11, 2067. [Google Scholar] [CrossRef] [Green Version]
  17. Isola, P.; Zhu, J.Y.; Zhou, T.; Efros, A.A. Image-to-Image Translation with Conditional Adversarial Networks. arXiv 2018, arXiv:1406.2661. [Google Scholar]
  18. Zhu, J.Y.; Park, T.; Isola, P.; Efros, A.A. Unpaired Image-to-Image Translation Using Cycle-Consistent Adversarial Networks. arXiv 2020, arXiv:1703.10593. [Google Scholar]
  19. Yang, X.; Wang, Z.; Zhao, J.; Yang, D. FG-GAN: A Fine-Grained Generative Adversarial Network for Unsupervised SAR-to-Optical Image Translation. IEEE Trans. Geosci. Remote Sens. 2022, 60, 5621211. [Google Scholar] [CrossRef]
  20. Ao, D.; Dumitru, C.O.; Schwarz, G.; Datcu, M. Dialectical GAN for SAR Image Translation: From Sentinel-1 to TerraSAR-X. Remote Sens. 2018, 10, 1597. [Google Scholar] [CrossRef] [Green Version]
  21. Shermeyer, J. SpaceNet 6: Expanded Dataset Release. 2020. Available online: https://medium.com/the-downlinq/spacenet-6-expanded-dataset-release-e1a7ddaf030 (accessed on 27 February 2023).
  22. Wang, L.; Xu, X.; Yu, Y.; Yang, R.; Gui, R.; Xu, Z.; Pu, F. SAR-to-Optical Image Translation Using Supervised Cycle-Consistent Adversarial Networks. IEEE Access 2019, 7, 129136–129149. [Google Scholar] [CrossRef]
  23. Zhao, Y.; Celik, T.; Liu, N.; Li, H.C. A Comparative Analysis of GAN-Based Methods for SAR-to-Optical Image Translation. IEEE Geosci. Remote Sens. Lett. 2022, 19, 3512605. [Google Scholar] [CrossRef]
  24. Wang, Z.; Ma, Y.; Zhang, Y. Hybrid cGAN: Coupling Global and Local Features for SAR-to-Optical Image Translation. IEEE Trans. Geosci. Remote Sens. 2022, 60, 5236016. [Google Scholar] [CrossRef]
  25. Tan, D.; Liu, Y.; Li, G.; Yao, L.; Sun, S.; He, Y. Serial GANs: A Feature-Preserving Heterogeneous Remote Sensing Image Transformation Model. Remote Sens. 2021, 13, 3968. [Google Scholar] [CrossRef]
  26. Dellinger, F.; Delon, J.; Gousseau, Y.; Michel, J.; Tupin, F. SAR-SIFT: A SIFT-like Algorithm for Applications on SAR Images. In Proceedings of the 2012 IEEE International Geoscience and Remote Sensing Symposium, Munich, Germany, 22–27 July 2012; pp. 3478–3481. [Google Scholar] [CrossRef] [Green Version]
  27. Ma, W.; Wen, Z.; Wu, Y.; Jiao, L.; Gong, M.; Zheng, Y.; Liu, L. Remote Sensing Image Registration with Modified SIFT and Enhanced Feature Matching. IEEE Geosci. Remote Sens. Lett. 2017, 14, 3–7. [Google Scholar] [CrossRef]
  28. Cui, S.; Ma, A.; Zhang, L.; Xu, M.; Zhong, Y. MAP-Net: SAR and Optical Image Matching via Image-Based Convolutional Network with Attention Mechanism and Spatial Pyramid Aggregated Pooling. IEEE Trans. Geosci. Remote Sens. 2022, 60, 1000513. [Google Scholar] [CrossRef]
  29. Cohen, J.P.; Luck, M.; Honari, S. How to Cure Cancer (in Images) with Unpaired Image Translation. 2018. Available online: https://openreview.net/pdf?id=SJIA3pijM (accessed on 27 February 2023).
  30. Moriakov, N.; Adler, J.; Teuwen, J. Kernel of CycleGAN as a Principle Homogeneous Space. arXiv 2020, arXiv:2001.09061. [Google Scholar]
  31. Kong, L.; Lian, C.; Huang, D.; Li, Z.; Hu, Y.; Zhou, Q. Breaking the Dilemma of Medical Image-to-image Translation. arXiv 2021, arXiv:2110.06465. [Google Scholar]
  32. Sentinel-1-Overview-Sentinel Online-Sentinel Online. Available online: https://sentinels.copernicus.eu/web/sentinel/missions/sentinel-1/overview (accessed on 27 February 2023).
  33. Schmitt, M.; Hughes, L.H.; Zhu, X.X. The SEN1-2 dataset for deep learning in sar-optical data fusion. ISPRS Ann. Photogramm. Remote Sens. Spat. Inf. Sci. 2018, IV-1, 141–146. [Google Scholar] [CrossRef] [Green Version]
  34. DLR—About the Arth-Observation Satellite TerraSAR-X. Available online: https://www.dlr.de/content/en/articles/missions-projects/terrasar-x/terrasar-x-earth-observation-satellite.html (accessed on 27 February 2023).
  35. Vreugdenhil, M.; Wagner, W.; Bauer-Marschallinger, B.; Pfeil, I.; Teubner, I.; Rüdiger, C.; Strauss, P. Sensitivity of Sentinel-1 Backscatter to Vegetation Dynamics: An Austrian Case Study. Remote Sens. 2018, 10, 1396. [Google Scholar] [CrossRef] [Green Version]
  36. Mandal, D.; Kumar, V.; Ratha, D.; Dey, S.; Bhattacharya, A.; Lopez-Sanchez, J.M.; McNairn, H.; Rao, Y.S. Dual Polarimetric Radar Vegetation Index for Crop Growth Monitoring Using Sentinel-1 SAR Data. Remote Sens. Environ. 2020, 247, 111954. [Google Scholar] [CrossRef]
  37. Vreugdenhil, M.; Navacchi, C.; Bauer-Marschallinger, B.; Hahn, S.; Steele-Dunne, S.; Pfeil, I.; Dorigo, W.; Wagner, W. Sentinel-1 Cross Ratio and Vegetation Optical Depth: A Comparison over Europe. Remote Sens. 2020, 12, 3404. [Google Scholar] [CrossRef]
  38. Malenovský, Z.; Rott, H.; Cihlar, J.; Schaepman, M.E.; García-Santos, G.; Fernandes, R.; Berger, M. Sentinels for Science: Potential of Sentinel-1, -2, and -3 Missions for Scientific Observations of Ocean, Cryosphere, and Land. Remote Sens. Environ. 2012, 120, 91–101. [Google Scholar] [CrossRef]
  39. Han, H.; Lee, S.; Kim, J.I.; Kim, S.H.; Kim, H.c. Changes in a Giant Iceberg Created from the Collapse of the Larsen C Ice Shelf, Antarctic Peninsula, Derived from Sentinel-1 and CryoSat-2 Data. Remote Sens. 2019, 11, 404. [Google Scholar] [CrossRef] [Green Version]
  40. Twele, A.; Cao, W.; Plank, S.; Martinis, S. Sentinel-1-Based Flood Mapping: A Fully Automated Processing Chain. Int. J. Remote Sens. 2016, 37, 2990–3004. [Google Scholar] [CrossRef]
  41. Li, Y.; Martinis, S.; Plank, S.; Ludwig, R. An Automatic Change Detection Approach for Rapid Flood Mapping in Sentinel-1 SAR Data. Int. J. Appl. Earth Obs. Geoinf. 2018, 73, 123–135. [Google Scholar] [CrossRef]
  42. Uddin, K.; Matin, M.A.; Meyer, F.J. Operational Flood Mapping Using Multi-Temporal Sentinel-1 SAR Images: A Case Study from Bangladesh. Remote Sens. 2019, 11, 1581. [Google Scholar] [CrossRef] [Green Version]
  43. Li, X. The First Sentinel-1 SAR Image of a Typhoon. Acta Oceanol. Sin. 2015, 34, 1–2. [Google Scholar] [CrossRef]
  44. Liu, W.; Fujii, K.; Maruyama, Y.; Yamazaki, F. Inundation Assessment of the 2019 Typhoon Hagibis in Japan Using Multi-Temporal Sentinel-1 Intensity Images. Remote Sens. 2021, 13, 639. [Google Scholar] [CrossRef]
  45. Xia, G.S.; Bai, X.; Ding, J.; Zhu, Z.; Belongie, S.; Luo, J.; Datcu, M.; Pelillo, M.; Zhang, L. DOTA: A Large-scale Dataset for Object Detection in Aerial Images. arXiv 2019, arXiv:1711.10398. [Google Scholar]
  46. Wang, Y.; Zhu, X.X. The SARptical Dataset for Joint Analysis of SAR and Optical Image in Dense Urban Area. In Proceedings of the IGARSS 2018—2018 IEEE International Geoscience and Remote Sensing Symposium, Valencia, Spain, 22–27 July 2018; IEEE: Piscataway, NJ, USA, 2018; pp. 6840–6843. [Google Scholar] [CrossRef] [Green Version]
  47. Huang, M.; Xu, Y.; Qian, L.; Shi, W.; Zhang, Y.; Bao, W.; Wang, N.; Liu, X.; Xiang, X. The QXS-SAROPT Dataset for Deep Learning in SAR-Optical Data Fusion. arXiv 2021, arXiv:2103.08259. [Google Scholar]
  48. Schmitt, M.; Hughes, L.H.; Qiu, C.; Zhu, X.X. SEN12MS—A Curated Dataset of Georeferenced Multi-Spectral Sentinel-1/2 Imagery for Deep Learning and Data Fusion. arXiv 2019, arXiv:1906.07789. [Google Scholar] [CrossRef] [Green Version]
  49. Zhu, X.X.; Hu, J.; Qiu, C.; Shi, Y.; Kang, J.; Mou, L.; Bagheri, H.; Häberle, M.; Hua, Y.; Huang, R.; et al. So2Sat LCZ42: A Benchmark Dataset for Global Local Climate Zones Classification. arXiv 2019, arXiv:1912.12171. [Google Scholar]
  50. Jaderberg, M.; Simonyan, K.; Zisserman, A.; Kavukcuoglu, K. Spatial Transformer Networks. arXiv 2016, arXiv:1506.02025. [Google Scholar]
  51. Chen, R.; Huang, W.; Huang, B.; Sun, F.; Fang, B. Reusing discriminators for encoding: Towards unsupervised image-to-image translation. In Proceedings of the IEEE/CVF Conference on Computer Vision and Pattern Recognition, Seattle, WA, USA, 13–19 June 2020; pp. 8168–8177. [Google Scholar]
  52. Balakrishnan, G.; Zhao, A.; Sabuncu, M.R.; Guttag, J.; Dalca, A.V. VoxelMorph: A Learning Framework for Deformable Medical Image Registration. IEEE Trans. Med. Imaging 2019, 38, 1788–1800. [Google Scholar] [CrossRef] [PubMed] [Green Version]
  53. Wang, Z.; Bovik, A.C.; Sheikh, H.R.; Simoncelli, E.P. Image Quality Assessment: From Error Measurement to Structural Similarity. IEEE Trans. Image Process. 2004, 13, 600–612. [Google Scholar] [CrossRef] [Green Version]
  54. Heusel, M.; Ramsauer, H.; Unterthiner, T.; Nessler, B.; Hochreiter, S. GANs Trained by a Two Time-Scale Update Rule Converge to a Local Nash Equilibrium. arXiv 2018, arXiv:1706.08500. [Google Scholar]
  55. Zhang, R.; Isola, P.; Efros, A.A.; Shechtman, E.; Wang, O. The Unreasonable Effectiveness of Deep Features as a Perceptual Metric. arXiv 2018, arXiv:1801.03924. [Google Scholar]
Figure 1. Training framework of GAN. The discriminator D Y is optimized to approximate the possibility that the incoming image is from the real SAR domain rather than the generator G. On the other hand, the generator G is optimized to maximize the possibility that the discriminator D Y makes wrong predictions on the fake SAR image G ( x ) , which is conditioned on a real EO image x.
Remotesensing 15 01878 g001
Figure 2. Comparisons between Pix2Pix and CycleGAN. Discriminators are omitted for simplicity.
Remotesensing 15 01878 g002
Figure 3. Sample pairs from dataset SEN1-2. The (top) row depicts the SAR images from Sentinel-1 and the (bottom) row depicts the corresponding EO images from Sentinel-2.
Remotesensing 15 01878 g003
Figure 4. Sample pairs from dataset SAR2Opt. The (top) row depicts the SAR images from TerraSAR-X and the (bottom) row depicts the corresponding EO images from Google Earth Engine.
Remotesensing 15 01878 g004
Figure 5. Sample raw images from E-SN6. The (top) are the optical data and the (bottom) four strips are SAR data.
Remotesensing 15 01878 g005
Figure 6. Sample patches of paired EO-SAR datasets. From (left) to (right): SN6-SAROPT, SAR2Opt, SARptical, QXS-SAROPT, SEN1-2/SEN1-2MS, So2Sat-LCZ42. The (top) row depicts the SAR images and the (bottom) row depicts the corresponding EO images. The shown image patches are resized to the same scale for visualization purposes.
Remotesensing 15 01878 g006
Figure 7. Training framework of our proposed method.
Remotesensing 15 01878 g007
Figure 8. Visual samples of different methods for the S2E translation task on the SN6-SAROPT dataset.
Remotesensing 15 01878 g008
Figure 9. Visual samples of different methods for the E2S translation task on the SN6-SAROPT dataset.
Remotesensing 15 01878 g009
Figure 10. Visual samples of different methods for the S2E translation task on the SAR2Opt dataset.
Remotesensing 15 01878 g010
Figure 11. Visual samples of different methods for the E2S translation task on the SAR2Opt dataset.
Remotesensing 15 01878 g011
Figure 12. Ablation study: visual samples of different variants for the S2E translation task on the SAR2Opt dataset.
Remotesensing 15 01878 g012
Figure 13. Ablation study: visual samples of different variants for E2S translation task on SAR2Opt dataset.
Remotesensing 15 01878 g013
Table 1. Comparisons of paired EO-SAR datasets.
NameSource of SARResolution of SARCoverageChannel
SN6-SAROPTCapella Space’s
X-band quad-pol sensor
0.25 mRotterdam
(724 pairs, 512 × 512)
4
SAR2Opt [23]TerraSAR-X1 mAsia cities (2076 pairs,
600 × 600)
1
SARptical [46]TerraSAR-X1 mBerlin (Over 10,000 pairs,
112 × 112)
1
QXS-SAROPT [47]Gaofen-31 mPort cities (20,000 pairs,
256 × 256)
1
SEN1-2 [33]Sentinel-1/2down to 5 mMultiple locations
(282,384 pairs, 256 × 256)
1
SEN1-2MS [48]Sentinel-1/2down to 5 mMultiple locations
(282,384 pairs, 256 × 256)
2
So2Sat-LCZ42 [49]Sentinel-1/2down to 5 mMultiple locations
(400,673 pairs, 32 × 32)
2
Table 2. Comparisons of IQA scores on SAR2Opt for S2E (SAR to EO) and E2S (EO to SAR) tasks. The best and second best results are highlighted as red bold and blue italic, respectively.
MethodsS2EE2S
PSNR↑SSIM↑FID↓LPIPS↓PSNR↑SSIM↑FID↓LPIPS↓
Ours15.720.240178.760.49115.220.203116.290.380
CycleGAN [18]13.230.072164.290.58112.130.058188.010.567
Pix2Pix [17]14.600.110237.090.53113.780.111168.950.380
NICEGAN(NC) [51]11.660.026308.590.67411.700.069366.850.582
NICEGAN(C) [51]13.700.189186.630.55612.120.101151.890.437
Table 3. Comparisons of IQA scores on SN6-SAROPT for S2E (SAR to EO) and E2S (EO to SAR) tasks. The best and second best results are highlighted as red bold and blue italic, respectively.
MethodsS2EE2S
PSNR↑SSIM↑FID↓LPIPS↓PSNR↑SSIM↑FID↓LPIPS↓
Ours15.140.188255.220.46118.100.262130.810.377
CycleGAN [18]13.490.146200.470.48516.780.105137.580.416
Pix2Pix [17]14.710.143355.480.52517.730.114277.150.397
NICEGAN(NC) [51]11.630.157411.640.71511.110.079448.960.723
NICEGAN(C) [51]13.750.143323.570.52217.140.217159.770.418
Table 4. Comparisons of IQA scores on SEN1-2 for S2E (SAR to EO) and E2S (EO to SAR) tasks. The best and second best results are highlighted as red bold and blue italic, respectively.
MethodsS2EE2S
PSNR↑SSIM↑FID↓LPIPS↓PSNR↑SSIM↑FID↓LPIPS↓
Ours10.920.027219.410.61512.870.016163.290.459
CycleGAN [18]11.410.005177.850.61010.140.035168.180.450
Pix2Pix [17]11.530.061241.020.62111.820.014141.730.388
NICEGAN(NC) [51]10.230.059336.320.74911.370.001169.080.449
NICEGAN(C) [51]10.460.051199.260.61710.320.005116.920.430
Table 5. Comparisons of IQA scores per category of SN6-SAROPT for S2E (SAR to EO) and E2S (EO to SAR) tasks. The best and second best results are highlighted as red bold and blue italic, respectively.
Land TypeMethodsS2EE2S
PSNR↑SSIM↑FID↓LPIPS↓PSNR↑SSIM↑FID↓LPIPS↓
BuildingOurs14.310.108283.070.46917.900.238139.600.401
CycleGAN [18]12.360.053205.020.49216.440.096146.150.447
Pix2Pix [17]13.630.063374.920.51517.430.105330.290.431
NICEGAN(NC) [51]11.110.079448.960.72317.520.129482.440.724
NICEGAN(C) [51]12.940.057377.930.52916.750.188177.670.458
ForestOurs16.750.163337.810.50017.900.260222.160.357
CycleGAN [18]15.060.150328.700.55716.570.087210.200.370
Pix2Pix [17]16.850.159388.830.56417.500.107226.370.353
NICEGAN(NC) [51]11.420.151494.870.75916.770.133431.060.751
NICEGAN(C) [51]13.870.106371.680.60717.160.227224.880.360
RiverOurs16.280.446307.210.39318.750.320214.140.324
CycleGAN [18]15.490.418296.190.39217.710.135239.290.369
Pix2Pix [17]16.150.364353.590.50618.630.137308.490.337
NICEGAN(NC) [51]13.260.390389.400.63918.130.145432.200.708
NICEGAN(C) [51]15.860.423365.650.42118.380.287246.560.354
RoadOurs14.790.149439.590.50018.270.282217.430.381
CycleGAN [18]13.150.098353.400.52117.180.127257.670.418
Pix2Pix [17]14.300.104488.100.55317.940.127396.680.395
NICEGAN(NC) [51]11.480.119525.640.75917.990.146481.530.736
NICEGAN(C) [51]13.810.110464.750.55216.730.218288.810.428
Table 6. Comparisons of model complexity.
MethodsNumber of Trainable Parameters (M)Test Time
GeneratorDiscriminatorDA ModulesTotal(ms/per image)
Ours22.765.514.1232.4041.76
CycleGAN [18]22.765.51-28.2935.55
Pix2Pix [17]54.412.77-57.188.82
NICEGAN(NC) [51]9.4511.72-21.1762.23
NICEGAN(C) [51]18.5793.75-112.3274.14
Table 7. Ablation study on SAR2Opt: IQA scores of our proposed method and its three variants. The best and second best results are highlighted as red bold and blue italic, respectively.
VariantsS2EE2S
PSNR↑SSIM↑FID↓LPIPS↓PSNR↑SSIM↑FID↓LPIPS↓
Ours w/o DA modules13.070.078185.690.57212.720.018274.660.940
Ours w/o DA-SAR15.260.220161.950.48311.390.084117.240.516
Ours w/o DA-EO13.600.097189.560.57915.330.199143.140.416
Ours15.720.240178.760.49115.220.203116.290.380
Disclaimer/Publisher’s Note: The statements, opinions and data contained in all publications are solely those of the individual author(s) and contributor(s) and not of MDPI and/or the editor(s). MDPI and/or the editor(s) disclaim responsibility for any injury to people or property resulting from any ideas, methods, instructions or products referred to in the content.

