Article

Visual Detection and Association Tracking of Dim Small Ship Targets from Optical Image Sequences of Geostationary Satellite Using Multispectral Radiation Characteristics

1
Institute of Microelectronics of the Chinese Academy of Sciences, Beijing 100029, China
2
School of Integrated Circuits, University of Chinese Academy of Sciences, Beijing 101408, China
3
China Center for Resources Satellite Data and Application, Beijing 100094, China
4
School of Networks and Tele-Communications Engineering, Jinling Institute of Technology, Nanjing 211169, China
*
Author to whom correspondence should be addressed.
Remote Sens. 2023, 15(8), 2069; https://doi.org/10.3390/rs15082069
Submission received: 16 February 2023 / Revised: 9 April 2023 / Accepted: 12 April 2023 / Published: 14 April 2023
(This article belongs to the Special Issue Remote Sensing for Maritime Monitoring and Vessel Identification)

Abstract

:
By virtue of the merits of wide swath, persistent observation, and rapid operational response, geostationary remote sensing satellites (e.g., GF-4) show tremendous potential for sea target system surveillance and situational awareness. However, ships in such images appear as dim small targets and may be affected by clutter, reef islands, clouds, and other interferences, which makes the task of ship detection and tracking intractable. Considering the differences in visual saliency characteristics across multispectral bands between ships and jamming targets, a novel approach to visual detecting and association tracking of dense ships based on the GF-4 image sequences is proposed in this paper. First, candidate ship blobs are segmented in each single-spectral image of each frame through a multi-vision salient features fusion strategy, to obtain the centroid position, size, and corresponding spectral grayscale information of suspected ships. Due to the displacement of moving ships across multispectral images of each frame, multispectral association with regard to the positions of ship blobs is then performed to determine the final ship detections. Afterwards, precise position correction of detected ships is implemented for each frame in image sequences via multimodal data association between GF-4 detections and automatic identification system data. Last, an improved multiple hypotheses tracking algorithm with multispectral radiation and size characteristics is put forward to track ships across multi-frame corrected detections and estimate ships’ motion states. Experiment results demonstrate that our method can effectively detect and track ships in GF-4 remote sensing image sequences with high precision and recall rate, yielding state-of-the-art performance.

1. Introduction

Sea target system awareness (especially ship detection and tracking) is one highly significant task for marine information surveillance, which has a wide range of applications, in the areas of maritime piracy, marine traffic, sea pollution, illegal fishing, irregular migration, defense and maritime security, border control, and so on [1]. With the advancement of space-based remote sensing technology, satellite data with various modalities, including satellite automatic identification system (AIS), synthetic aperture radar (SAR), multispectral and hyperspectral optical sensors, and global navigation satellite system reflectometry (GNSS-R) [2], have become an important means of ship targets monitoring. Among them, the geostationary orbit (GEO) remote sensing satellite has attracted more and more attention because of the merits of wide-swath scanning, nearly real-time persistent observation, and high response sensitivity, and consequently has tremendous application potential in marine surveillance. The Chinese GF-4 satellite, launched in 2015, is equipped with a staring-imaging optical sensor, providing images with a spatial resolution of 50 m and wide coverage of 400 km × 400 km in the panchromatic and multispectral (PMS) bands. This video-like satellite has high-revisit observation capability with temporal resolutions of up to 20 s. The above-mentioned advantages enable detecting and tracking ships to obtain the motion parameters, such as geographic position, speed, course, and moving trajectory [3,4], which can assist decision making and guide low Earth orbit (LEO) satellites with a higher spatial resolution for further recognition and identification [5,6].
However, ships in GEO satellite images appear as dim small targets that possess fewer pixels, fewer features, and lower discrimination. Moreover, optical remote sensing images are usually affected by sea clutter, reef islands, clouds, and other interferences, which makes it intractable to detect and track ships. The current GF-4-image-based ship tracking strategy mainly involves two steps: (1) ships are detected in each single frame of GF-4 image sequences, and then (2) ship tracking is performed via data association across the detected results of multi-frame images [7]. As for ship detection, the mainstream approaches developed in optical remote sensing images embody the methods based on grayscale-statistical features analysis, deep-learning-based methods, and methods utilizing the human vision system (HVS) mechanism [3]. The first category of methods [6,8,9,10] detects ships aided by the grayscale statistics of their hulls or wakes, which cannot work when reef islands, broken clouds, clutter, and target-intensive scenarios occur. Deep-learning-based methods [7,11,12,13,14] can extract the middle-level and high-level features of targets through training and improve the robustness of target detection. Nevertheless, the limitation of deep learning for dim small target detection is the lack of texture, structure, and shape information, resulting in performance degradation of the trained detector. By contrast, HVS-based methods [15,16,17,18,19,20,21] have received great interest because of the sensitivity to local singularity and the selective attention mechanism, which fully utilize the intensity, contrast, color, shape, multiscale representation, and other characteristics to yield the visual saliency map and extract regions of interest from the whole scene. Yao et al. [5] designed a local saliency map algorithm based on the peak signal-to-noise ratio (PSNR) to detect the weak and small ships in GF-4 images. Likewise, a multiscale dual-neighbor difference contrast measure method was proposed in [3] to determine the positions of candidate ships, followed by false alarm removal via shape characteristics analysis. The deficiencies of these methods applied to GF-4 images lie in (1) they do not exploit multispectral radiation characteristics of ships that are distinguishable from those of other jamming targets, and more importantly, (2) they ignore the displacement of moving ships across multiple bands. Both these issues cause numerous false alarms.
As regards another essential procedure for ship tracking, data association aims to correlate the detected results across multi-frame images, which can assist in eliminating the false alarms and simultaneously reducing the missed alarms generated in the single-frame detection stage. Classical data association methods mainly include nearest neighbor (NN) and its variants [22], probability hypothesis density (PHD) [23], joint probabilistic data association (JPDA) [24], and multiple hypothesis tracking (MHT) [25,26,27] methods. The MHT method was introduced in [6] to track ships from GF-4 sequential images. By embedding the amplitude information of the near-infrared (NIR) band into the ships’ motion model, an improved MHT approach was proposed by Yao et al. [5], which can further suppress the false alarms and achieve better tracking performance. In [28], the discriminative correlation filter with channel and spatial reliability [29] was adopted to track ships and correlate the results of multi-frame detections. Yu et al. [3] utilized the JPDA method to associate the detected ships from GF-4 time-series images, while [7] correlated the detected ships via the intersection over union (IoU) and then computed the similarity measurement to estimate the appearance stability of the ships in the detected trails. Nonetheless, these existing methods do not fully utilize the unique vision information (such as multispectral radiation and size characteristics) of each ship itself. This can lead to erroneous associations when dealing with scenes of dense ship targets and severely interfering targets (such as reef islands and broken clouds).
The motivation of our work is to develop a robust tracking method for dim small ship targets in GEO optical remote sensing image sequences, with higher precision and recall rate to tackle the dilemma of existing methods. By analyzing the visual saliency and motion features of ships across multispectral images, we propose a visual detection and association tracking method embedded with multispectral radiation characteristics, to track ships’ trajectories from GF-4 PMS image sequences. First, for each single-spectral image of each frame, preliminary ship detection is performed through an image segmentation strategy that incorporates multi-vision salient features, to extract the centroid position, size (number of pixels), and corresponding intensity (mean grayscale) information of candidate ship blobs. Subsequently, considering the displacement of moving ships across multispectral images, multispectral association with regard to the positions of ship blobs is carried out to determine the final ship detection result in each frame. Meanwhile, because the geometric positioning error of the GF-4 satellite will affect the following multi-frame association and tracking accuracy, we utilize multimodal data association between GF-4 detected positions and AIS positions of ships to register each frame of GF-4 image and correct the detected positions. Last, an improved multiple hypothesis tracking model embedded with multispectral radiation and size characteristics is put forward for multi-frame association and trajectory tracking.
The rest of this paper is organized as follows: the methodological framework is described in detail in Section 2. In Section 3, we demonstrate the experiments and analysis of our method for ship tracking in GF-4 time-series images. Finally, discussions and conclusions are presented in Section 4.

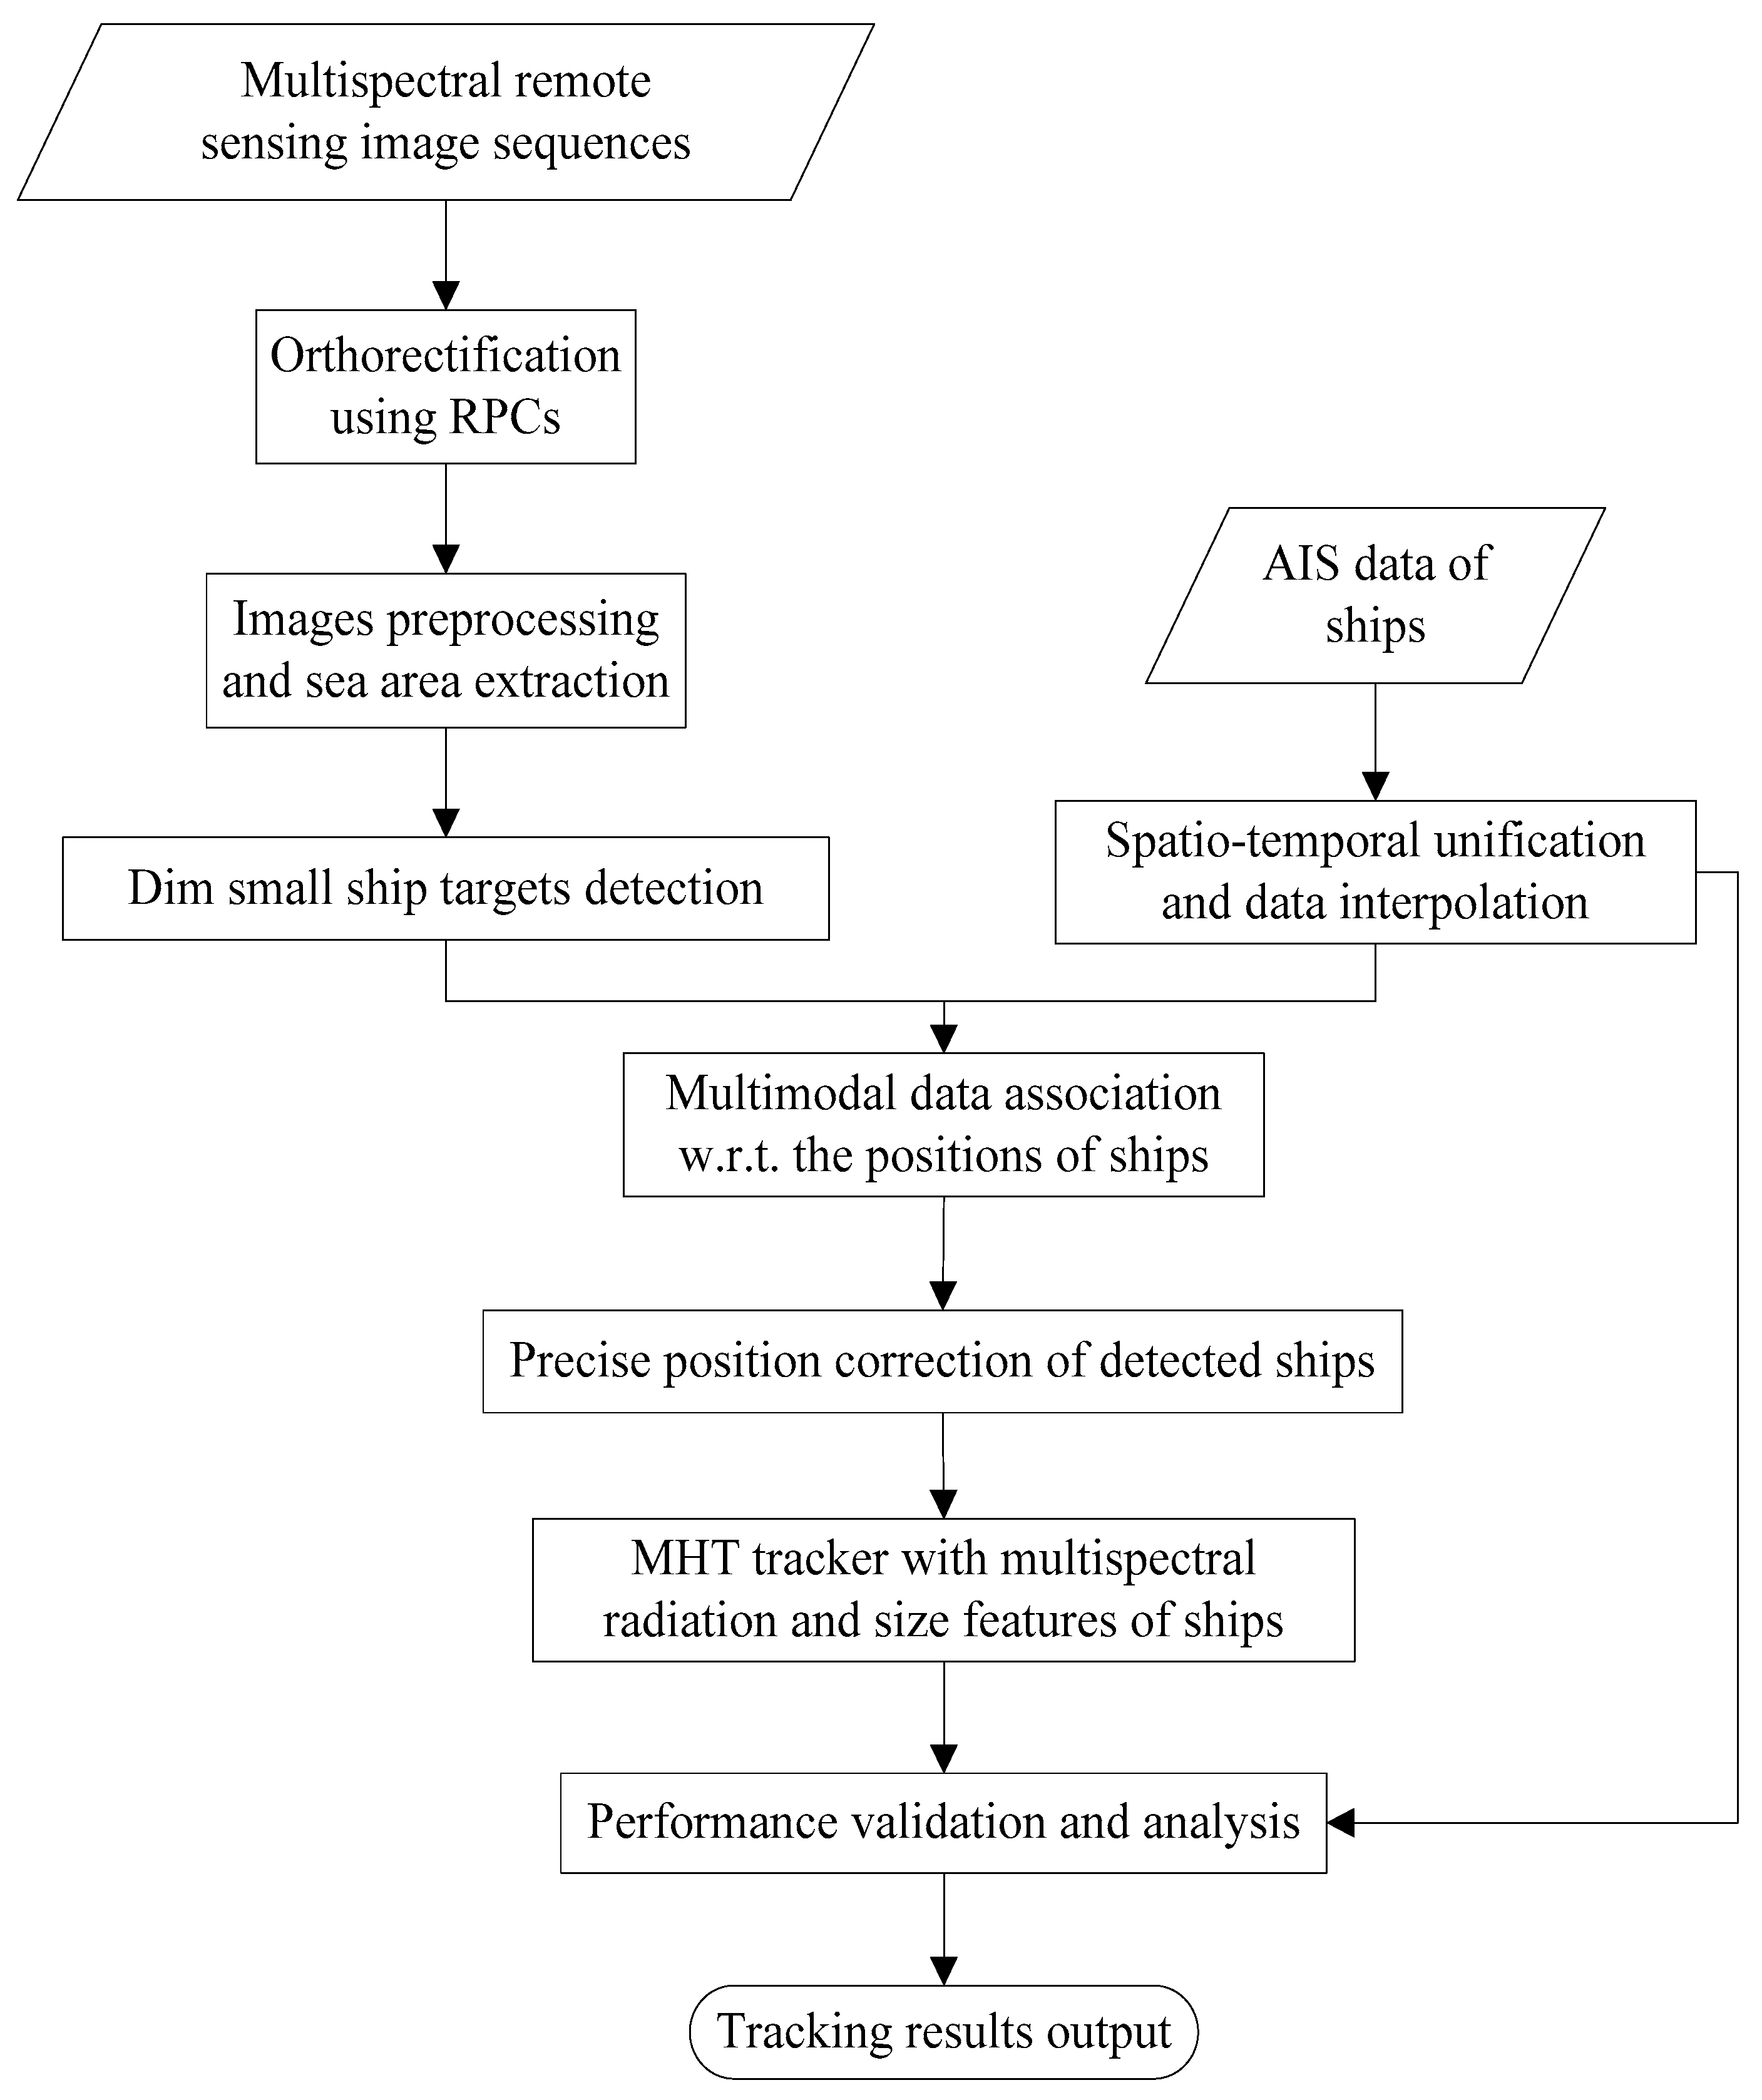
2. Methodological Framework

The whole flowchart of the proposed visual detection and association tracking method for dim small ships is illustrated in Figure 1. At the preliminary stage of multi-source data preprocessing, sea–land separation and cloud removal are performed based on the normalized difference water index (NDWI) and thresholding segmentation [6], to extract sea region of interest (ROI) from GF-4 multispectral image sequences. The spatiotemporal interpolation of ships’ AIS data is also implemented to derive ships’ motion information (e.g., geographic positions) at the acquisition time of GF-4 sequential images. The motion information is used partly as ground control points (GCPs) of geometric correction and partly as performance verification of the proposed method. In order to facilitate subsequent processing and display, we adjust each single-band image of sea ROI to an 8-bit grayscale after data preprocessing. To sum up, the workflow mainly consists of four steps: (1) preliminary ship blobs segmentation, (2) multispectral association for final ship detection in each frame, (3) multimodal data association for position correction of detected ships, and (4) MHT tracking across multi-frame detections. The core techniques will be introduced below in detail.

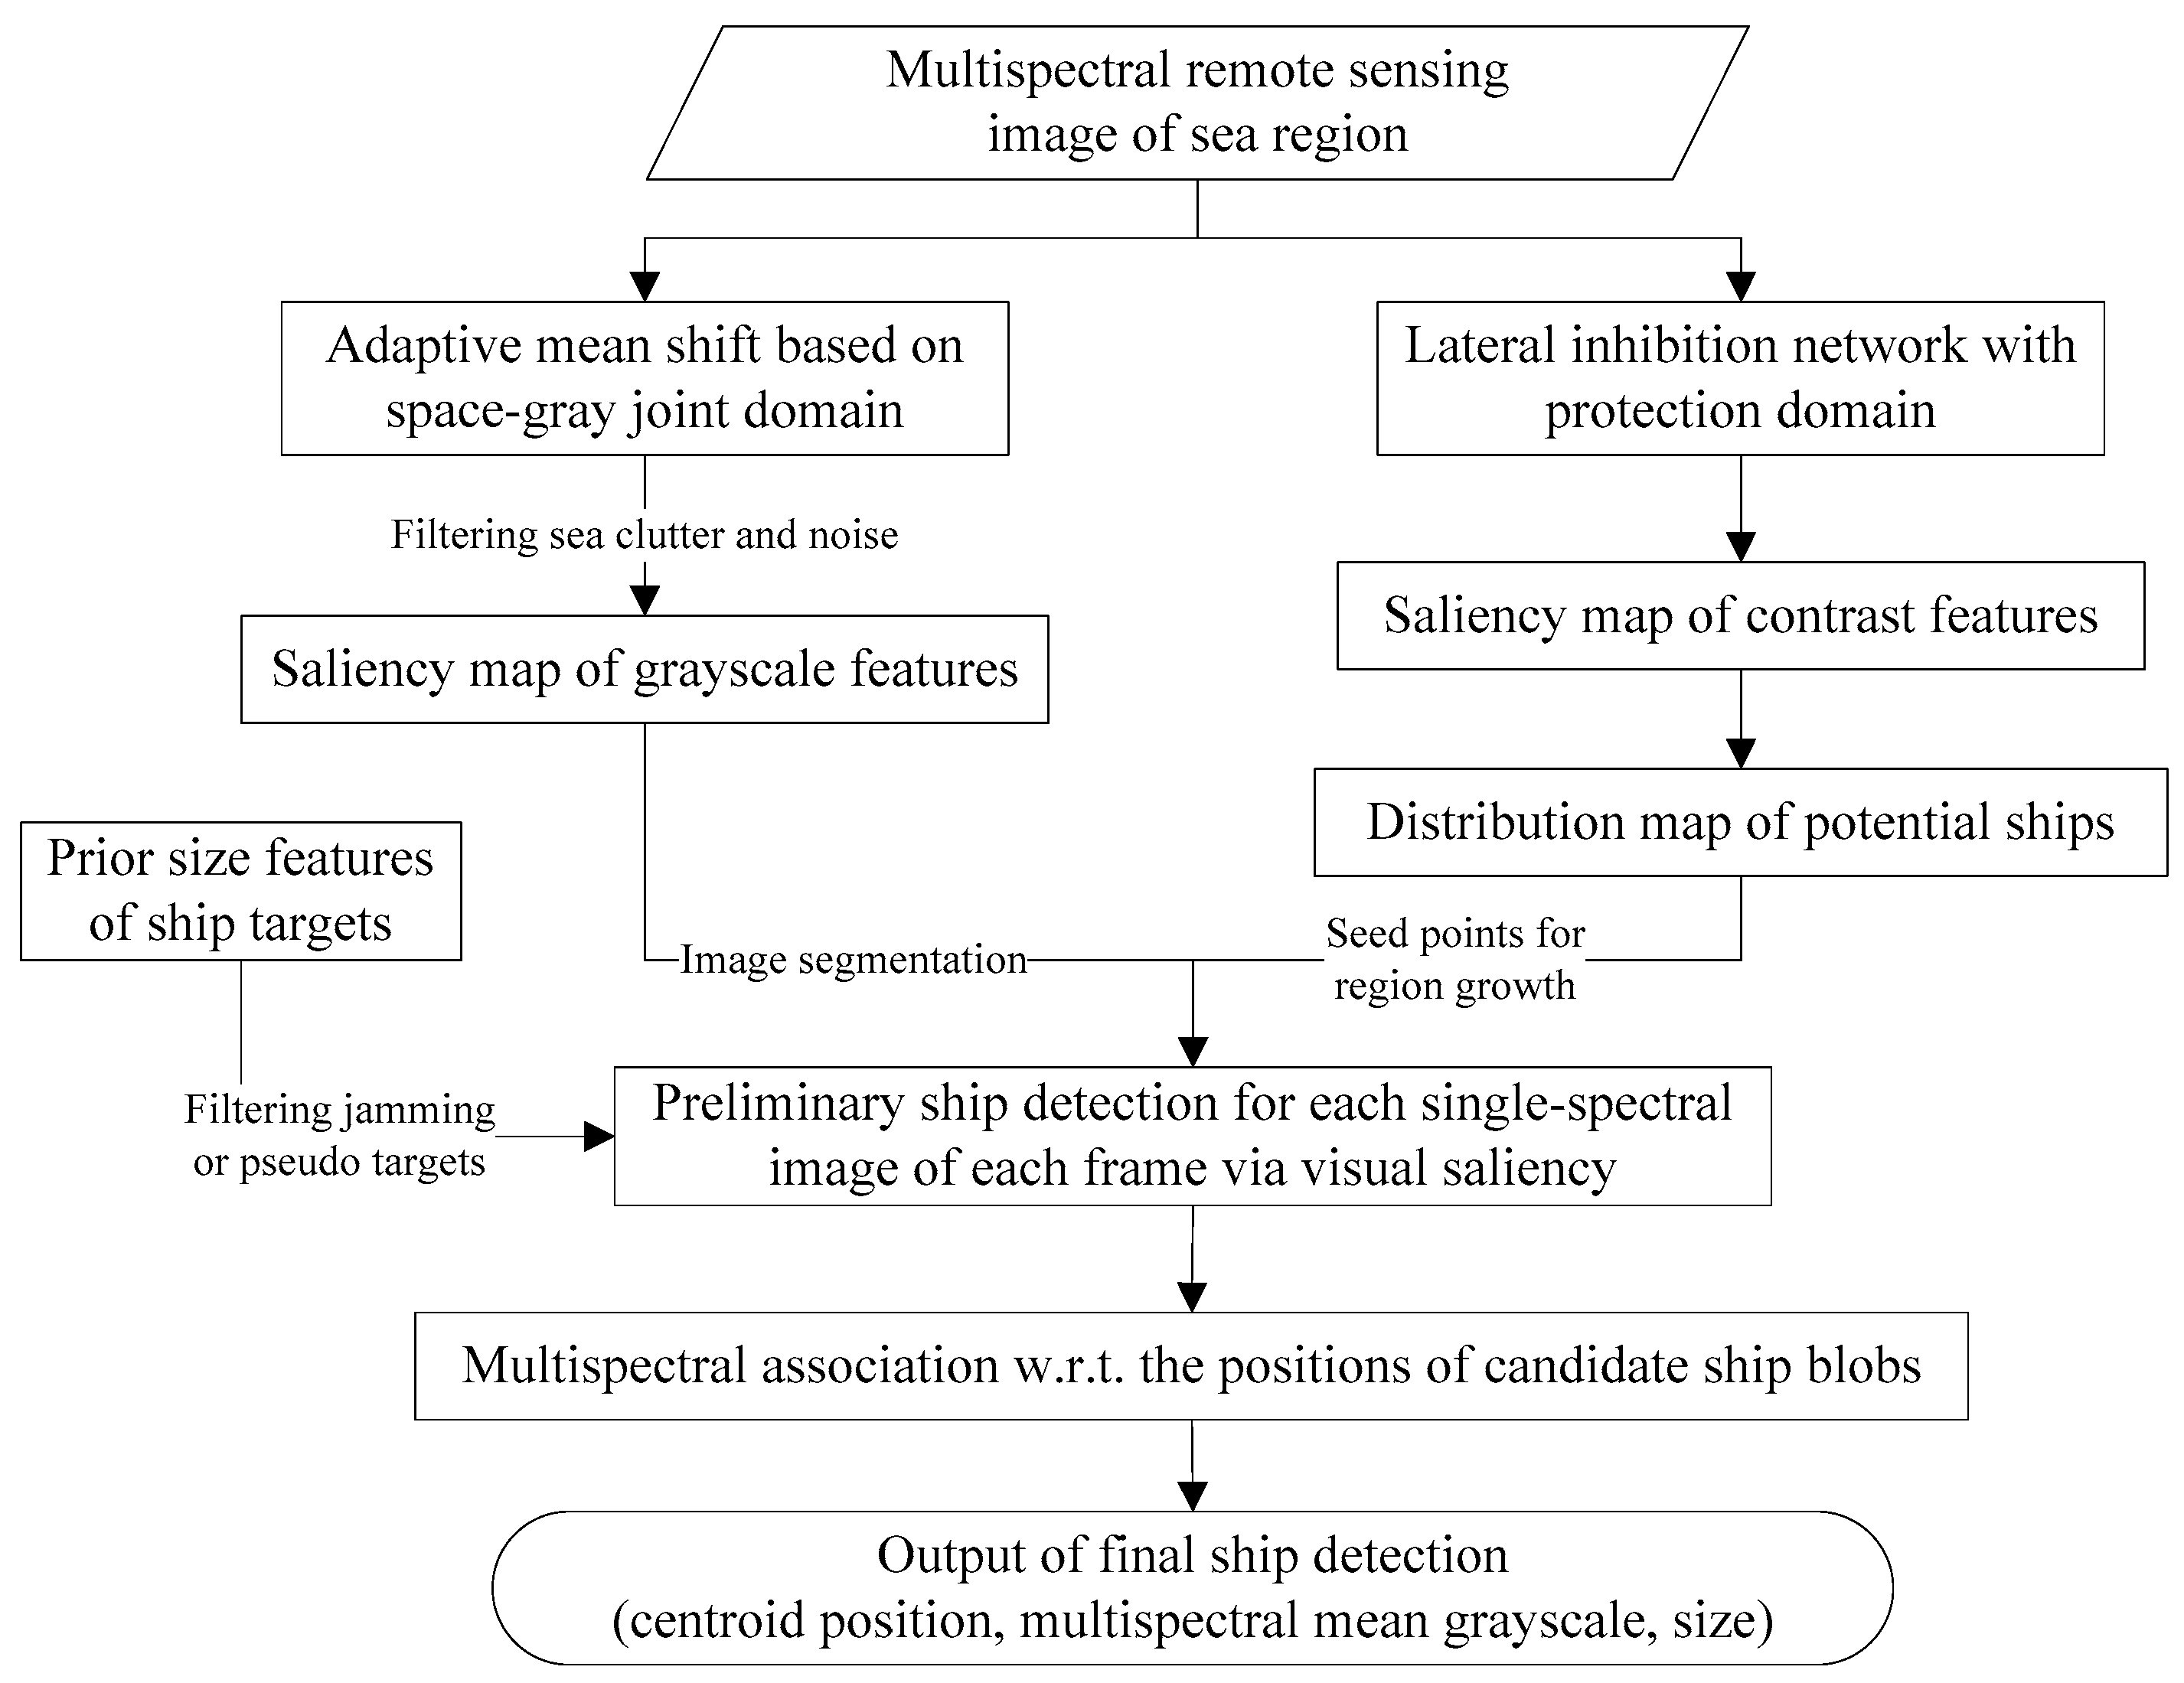
2.1. Preliminary Ship Detection in Single-Spectral Image of Each Frame

As mentioned above, ships in the GF-4 geostationary satellite images possess a few pixels and low distinguishability (see Figure 2), which can be considered as dim small targets. As shown in Figure 2, the visual saliency of a ship generally depends on its multispectral radiation (i.e., intensity and color), contrast, size, and other characteristics. It should be noted that object detection methods based on the HVS mechanism have recently attracted more and more attention and demonstrated the highly robust performance for dim small targets detection from complex scenarios. Herein, we design a multi-vision salient features fusion strategy to segment candidate ship blobs from the single-spectral image of each frame, which mainly includes: (1) adaptive mean shift based on space-gray joint domain to generate a saliency map of grayscale features and simultaneously filter sea clutter and noises, (2) lateral inhibition network with protection domain to generate a saliency map of contrast features, (3) region growth based image segmentation of grayscale saliency map through seed points derived from the contrast saliency map, and finally (4) candidate ship blobs extraction aided by prior size features of ships.

2.1.1. Adaptive Mean Shift with Space-Gray Joint Domain

The basic idea of the mean shift algorithm lies in that: given an initial sample space, the density function can be calculated according to the sample points in the feature space, and the position where the function value is the largest is the solution [30]. Let { z i R d , i = 1 , 2 , , N } denote the set of feature vectors in a d -dimensional feature space. The density function at point z can be estimated by the kernel function K ( ) and bandwidth h:
f ^ ( z ) = 1 N h d i = 1 N K ( z i z h )
The mean shift vector is given as
M ( z ) = i = 1 N z i g ( z i z h 2 ) i = 1 N g ( z i z h 2 ) z
where g ( ) = K ( ) .
In this paper, we utilize the Gaussian kernel function with a space-gray joint domain to process the GF-4 images. The spatial and gray feature vectors are adopted to estimate the corresponding feature bandwidths h s and h g . Based on such kernel function, the distribution of point z = ( z s , z g ) on the GF-4 image can be estimated as
K h s , h g ( z ) = C h s 2 h g k ( z s h s 2 ) k ( z g h g 2 )
where z s and z g denote the spatial part and the gray part of the feature vector, respectively; C is the normalization constant; and k ( ) is the profile function of the kernel K ( ) . Correspondingly, the men shift vector is formulated as
M ( z ) = i = 1 N z i g ( z i s z s h s 2 ) g ( z i g z g h g 2 ) i = 1 N g ( z i s z s h s 2 ) g ( z i g z g h g 2 ) z
When utilizing the mean shift algorithm to obtain grayscale salient features, the spatial bandwidth determines the region range of the density gradient estimation of the current point. A too-small value may lead to ship target splitting or poor clutter/noise removal performance, while a too-large bandwidth may cause over-smoothing and loss of target features. In addition, the selection of spatial bandwidth also affects the iteration speed of the algorithm. Therefore, adaptive spatial bandwidth is adopted; that is, the spatial bandwidth is initialized as 2 according to the statistics of ships’ size features, and the increment step is set to 1. Experiments show that, when the number of sample points whose grayscale values are similar to the currently smoothed point is less than half the number of all sample points in the spatial bandwidth, the corresponding spatial bandwidth is the optimal solution. The grayscale value of the sample point is considered to be similar to that of the currently smoothed point, provided that the grayscale difference is not more than 4. When processing the scenario with dense ship targets, smaller spatial bandwidth can preserve details and grayscale features. Otherwise, the larger the bandwidth, the better the smoothing effect.
Similarly, a larger grayscale bandwidth may cause over-smoothing, while a smaller bandwidth cannot better filter the noise and sea clutter. Generally, global optimal fixed-range bandwidth and adaptive-range bandwidth are two common bandwidth selection methods. Herein, we introduce the asymptotic mean integrated square error (AMISE) criterion commonly used by the plug-in rule to estimate the adaptive grayscale bandwidth [31],
h g = ( 4 d + 2 ) 1 / ( d + 4 ) n 1 / ( d + 4 ) σ j σ j = 1 n 1 i = 1 n ( g i g ¯ ) 2
where d is the dimension of feature space, n is the number of pixels, σ j is the standard deviation, and g i , g ¯ denotes the pixel grayscale and mean grayscale, respectively.
The adaptive mean shift algorithm with a space-gray joint domain considers the space and grayscale information simultaneously, which can well preserve the intensity feature of one ship, filter sea clutter and noise, and yield a better grayscale saliency map without changing the size of the target.

2.1.2. Lateral Inhibition Network with Protection Domain

Due to the advantages of highlighting object edges and enhancing contrast, a lateral inhibition network [32] is employed to improve the contrast of dim small ships. The model used in our work is formulated as
r i , j = e i , j + p = R R q = R R k i j , p q e p , q
where e i , j , r i , j denote the input and output of the receptor cell ( i , j ) , respectively; k i j , p q is the inhibition coefficient of the receptor cell ( i , j ) regarding the cell ( p , q ) ; and R is the radius of the inhibition domain. For the grayscale image, if the radius is 2 pixels, the model can be expressed as
r ( i , j ) = g ( i , j ) + k 1 [ p = 1 1 q = 1 1 g ( i + p , j + q ) g ( i , j ) ]   + k 2 [ p = 2 2 q = 2 2 g ( i + p , j + q ) p = 1 1 q = 1 1 g ( i + p , j + q ) ]
where g ( i , j ) denotes the grayscale of pixel ( i , j ) , and k i ( i = 1 , 2 ) are inhibition coefficients.
Considering the intensity and size characteristics of dim small ships, we design a protection domain surrounding the current pixel to prevent target pixels from contributing to the output. In this study, we set the radius of the protection domain and the inhibition domain as 1 and 2, respectively, and the formula is as follows:
r ( i , j ) = g ( i , j ) + k 1 [ p = 2 2 q = 2 2 g ( i + p , j + q ) p = 1 1 q = 1 1 g ( i + p , j + q ) ]   + k 2 [ p = 3 3 q = 3 3 g ( i + p , j + q ) p = 2 2 q = 2 2 g ( i + p , j + q ) ]
As for the coefficients, let k i = α / R i , R 1 , R 2 be set as 2 and 3, respectively, and α is a constant, which is subject to the condition 1 + 16 k 1 + 24 k 2 = 0 . The matrix of inhibition coefficients is a template with the size of 7 × 7, where 24 coefficients with value k 2 are distributed in the outermost circle, 16 coefficients with value k1 are distributed in the secondary outer circle, and the central coefficient is 1.
Through convolution operation on the image using the coefficient matrix, the contrast saliency map is obtained. The position distribution of potential ships is then derived by thresholding the contrast saliency map. Based on such a coefficient template, the contrast features of small weak ships can be further enhanced, and meanwhile, the integrity of the target ontology can also be protected. As shown in Figure 3, compared with the conventional lateral inhibition network, the contrast features of most ships have been amplified, and almost the entire sea background information has been suppressed based on our lateral inhibition network with a protection domain.
In summary, the combination of grayscale and contrast saliency can utilize the complementary advantages to weaken sea clutter and background interference, and diminish false alarms and missed alarms simultaneously. By introducing adaptive parameter selection and protection domain, the features of dim small ship targets can be well preserved or even enhanced. Under the guidance of the distribution of potential ships, we perform image segmentation on the grayscale saliency map. By virtue of the size characteristics of ships in the GF-4 satellite image, we can then extract the candidate ship blobs in each single-spectral image of each frame. Finally, the centroid position, mean grayscale, and size features of ship blobs in each band can be obtained. Herein, the image blobs whose sizes are between 2 and 75 pixels will be kept because of the possible contribution of ship wakes. The whole workflow of the proposed dim small ship target detection method is given in Figure 4.

2.2. Ship Positions Association across Multispectral Detections and across Multimodal Data

2.2.1. Multispectral Association for Final Ship Detection

Almost all existing ship detection approaches based on GF-4 images only utilize single-spectral information, such as the NIR band, where the contrast between ships and sea background is the largest among five bands, which generates a large number of false alarms due to the presence of jamming targets (e.g., reef islands, broken clouds, and sea clutter). Furthermore, the accuracy and efficiency of the subsequent ship tracking will also be greatly decreased. Indeed, multispectral radiation characteristics are inherent attributes of the target itself, which are the salient features discriminable from those of other targets. As can be seen from Figure 5, the reefs and islands, which usually have larger contrast features in the NIR band may tremendously affect ship detection, and there are some static islands that are similar to ships in appearance. By contrast, the reef islands disappear in the red and green bands, while the contrast of some weak ships becomes weaker in the red band until it disappears in the green band. So, ship detection in the single NIR band will bring many false alarms, while detection in other bands may cause missed alarms. For these reasons, we should make full use of the multispectral radiation information.
Meanwhile, there is a common phenomenon of time lag between the acquisitions of different spectral images. As for GF-4 PMS images, the band-to-band time interval is as long as several seconds, and the time lag between the panchromatic and NIR bands is about 40 s [4], which results in a displacement of the detected positions across multispectral images (see Figure 6). The larger the ship’s velocity, the greater the offset distance. Therefore, in order to determine the final ship detection results in each frame, it is still essential to perform multispectral association on the positions of ship blobs. Specifically, the related criteria in this paper are as follows: (1) the association is founded upon the positions of candidate ships in each single-spectral image of one frame; (2) positions of ship blobs in all the other bands should be associated to those in the NIR band; (3) fix a contrast threshold (e.g., 45), and define the candidate ship in the NIR band where the contrast value in the saliency map is larger than the threshold as a high-contrast target; (4) set a distance threshold (e.g., 15 pixels), and it is considered that the association cannot occur if the distance between two detections in two bands exceeds the threshold; (5) a candidate ship is discarded if it is a high-contrast target and is not associated with any detection in other bands; (6) if the detection in a band is associated with one in the NIR band, the mean grayscale of the band is retained, and if no association occurs, the corresponding grayscale of the band is marked as NULL; (7) the attribute features of the ultimately determined ships include their centroid positions in the NIR band, mean-grayscale vectors across multiple bands, and the sizes in the NIR band.
As one of the most popular methods for data association, the global nearest neighbor (GNN) algorithm is adopted in this paper to associate across multispectral detections and across multimodal data. GNN assignment seeks the best association with the lowest global cost, which allows each element θ j in set Θ to be assigned to only one element ψ i in set Ψ . The optimization model can be formulated as
arg min i j j = 1 n i = 1 m d i j M i j s . t . d i j δ   a n d i = 1 m M i j 1 , j = 1 n M i j 1 , M i j { 0 , 1 }
where d i j = θ j ψ i , n and m are separately the number of elements in the sets Θ and Ψ , δ is the distance threshold, and M i j denotes the association variable. M i j = 1 denotes one-to-one association, while M i j = 0 means no association. The association relationship in GNN assignment can be obtained by the Hungarian algorithm, which is an efficient and simplest method to solve the linear assignment problem.

2.2.2. Multimodal Data Association for Ship Positions Correction

After the association across multispectral detections, the final ships in each frame and their corresponding static attribute characteristics can be determined. The combination of motion and static attribute features greatly improves the reliability and accuracy of ship tracking. However, due to the systematic error of RPCs-based rectification, the precision of ships’ positions is quite low, which may affect the performance of the ship tracker. To precisely correct the geometric positions, the commonly used affine transformation model is introduced, i.e.,
{ l = e 0 + e 1 l + e 2 s s = f 0 + f 1 l + f 2 s
where ( l , s ) and ( l , s ) are image coordinates obtained from RPC-based GCP projection and matching points in the GF-4 image, respectively. ( e i , f i ) , ( i = 0 , 1 , 2 ) are the transformation coefficients. As there are few or even no GCPs on the sea surface, AIS information on ships will be an alternative choice. AIS is a type of cooperative self-reporting system that records ships’ static information (e.g., identification number, type, length, and width) and motion information (e.g., longitude, latitude, course, and speed). In our work, a portion of AIS data is used for geometric correction.
Since the positions of detected ships in the NIR band are retained for the following ship tracking, a time lag of approximately 40 s between the acquisition time of the NIR band and the time given in the image files should be considered when performing the linear interpolation of AIS data. After the spatiotemporal unification of GF-4 detections and AIS data, GNN-based data association will also be employed to seek the optimal association matching of ship positions between multimodal data. To robustly correct the system error, we further utilize the random sample consensus (RANSAC) algorithm to eliminate the gross errors in point-pair association. Later, the precise geographic coordinates of ships in each frame can be transformed using the RPCs-based model and Equation (10).

2.3. Multi-Frame Association Tracking

2.3.1. Motion Modeling of Ships

Single-frame detection can only obtain the system distribution and attribute characteristics of ship targets. More importantly, for sea surveillance, it is necessary to track the motion trajectories of ships in order to predict the overall situation. Moreover, multi-frame data association can further reduce false alarms caused by jamming targets, as well as occasionally missed alarms in single-frame detection. Based on the attribute features of ultimately detected ships, we embed multispectral radiation and size information into the tracking framework in this paper.
The motion state of a ship at frame k is depicted as x k = ( λ k , v k λ , φ k , v k φ , g k n i r , g k r , , s k ) T , where λ k , φ k and v k λ , v k φ denote the geographic position and velocity components along the longitude and latitude directions, respectively; ( g k n i r , g k r , ) represents the vector of multispectral grayscale values; and s k is the size. The speed and course over ground (relative to true north) can be calculated by the velocity components in the plane rectangular coordinate system. The measurement at frame k can be described as z k = ( l o n k , l a t k , g r a y k n i r , g r a y k r , , s i z e k ) T , where l o n k and l a t k denote the longitude and latitude coordinates of the measurement, ( g r a y k n i r , g r a y k r , ) is the mean-grayscale vector across multiple bands, and s i z e k is the size of the measurement. The unit of longitude, latitude, and course is the degree (°), and the units of distance, time, and velocity are separately nautical mile (nm), hour (h), and knot (kn).
The state transition model used in our study can be formulated as
x k = f k 1 ( x k 1 ) + G k 1 v k 1
where f k 1 is the state transition function, and G k 1 and v k 1 are the process noise matrix and process noise, respectively. Let v k 1 = ( a k 1 λ , a k 1 φ , 0 , 0 , , 0 ) T follow a multivariate Gaussian distribution with zero mean and covariance B k 1 = d i a g ( σ v 2 , σ v 2 , 0 , 0 , , 0 ) , where σ v is the standard deviation of process noise. The dead reckoning of a rhumb-line track from one point ( λ 1 , φ 1 ) to another ( λ 2 , φ 2 ) can be described as
{ φ 2 = φ 1 + v 1 φ T / a λ 2 = λ 1 + v 1 λ T sec ( φ 1 m i d ) / a
where T is the time interval, a 60   n m / denotes a constant that converts the distance (nm) to degree (°), and φ 1 m i d = φ 1 + v 1 φ T / 2 a is the middle latitude. Consequently, the state transition equation can be expressed as
x k = [ λ k v k λ φ k v k φ g k n i r g k r s k ] = [ λ k 1 + v k 1 λ T k 1 sec ( φ k 1 m i d ) / a v k 1 λ φ k 1 + v k 1 φ T k 1 / a v k 1 φ g k 1 n i r g k 1 r s k 1 ] + [ T k 1 2 sec ( φ k 1 m i d ) / 2 a 0   0 0 0 T k 1 0   0 0 0 0 T k 1 2 / 2 a   0 0 0 0 T k 1   0 0 0 0 0   1 0 0 0 0   0 1 0         0 0   0 0 1 ] [ a k 1 λ a k 1 φ 0 0 0 ]
The first-order extended Kalman filter (EKF) is adopted to predict and update ships’ states in the tracking procedure as Equation (13) is nonlinear.
The measurement equation can be modeled as
z k = H k x k + w k , w k N ( 0 , R k )
where
H k = [ 1 0 0 0   0 0 0 0 0 1 0   0 0 0 0 0 0 0   1 0 0 0 0 0 0   0 1 0         0 0 0 0   0 0 1 ] , R k = d i a g ( σ p 2 , σ p 2 , σ g 2 , σ g 2 , , σ s 2 )
where H k is the measurement matrix, w k denotes the measurement noise following the Gaussian distribution with zero mean and covariance R k , and σ p , σ g , and σ s are separately the standard deviations of position, grayscale, and size components.

2.3.2. MHT with Multispectral Saliency Characteristics

Known as the theoretically optimal data association algorithm, MHT generates alternative logical hypotheses to delay the decision making when measurement–track association conflicts so that the subsequent measurements can resolve the uncertainty. In this work, we propose an improved MHT tracker embedded with multispectral grayscale and size features for dim small ship tracking across multi-frame detections. The cumulative log-likelihood ratio is often used as the track score to evaluate the probability of track hypotheses, and the score of track j at frame k can be expressed as the following recursive form
S j ( k ) = S j ( k 1 ) + Δ S j ( k )
where Δ S j ( k ) is the increment of the score and can be calculated by
Δ S j ( k ) = { ln ( P D 2 π ( λ n + λ f ) | S k i j | ) d i j 2 2 , i > 0 ln ( 1 P D ) , i = 0
where P D is the probability of detection, λ n and λ f are the spatial densities of new targets and clutter, respectively; S k i j denotes the residual covariance matrix; and d i j is the Mahalanobis distance. i = 0 means no association, while i > 0 represents track j is associated with measurement i at frame k.
Generally, the static attribute features of a target are independent of its motion information and also contribute greatly to association tracking. For static attribute features such as multispectral grayscale and size, we utilize the normal distribution function to measure the similarity between measurements and predicted tracks. Therefore, the score increments produced by target features can be expressed as
Δ S m j ( k ) = ln ( 1 c exp ( ( g r a y i m g j m ) 2 σ g 2 ) ) , Δ S s j ( k ) = ln ( 1 c exp ( ( s i z e i s j ) 2 σ s 2 ) )
where Δ S m j ( k ) and Δ S s j ( k ) are separately the multispectral and size increments, m denotes the spectral band, g r a y i m and s i z e i are the features of measurement i , g j m and s j are the predicted features of track j , and c is the constant probability for the posterior of the background (null) hypothesis. Ultimately, the overall score increment is the joint increment produced by motion, multispectral radiation, and size features, i.e., the sum of Equations (17) and (18).
At the stage of multi-frame association, since it is not guaranteed that the grayscale features of all bands can be extracted during ship detection, only the spectral components common to the measurement and the track will be used for association. Empirically, most ships detected in the NIR band can also be detected in the red band, so it is useful to balance performance and efficiency by utilizing grayscale information of these two bands to participate in association tracking. In addition, the maximum speed threshold for moving ships is essential to avoid infeasible data association, while the minimum speed constraint can further remove the jamming targets such as reefs and islands.

3. Experiments and Analysis

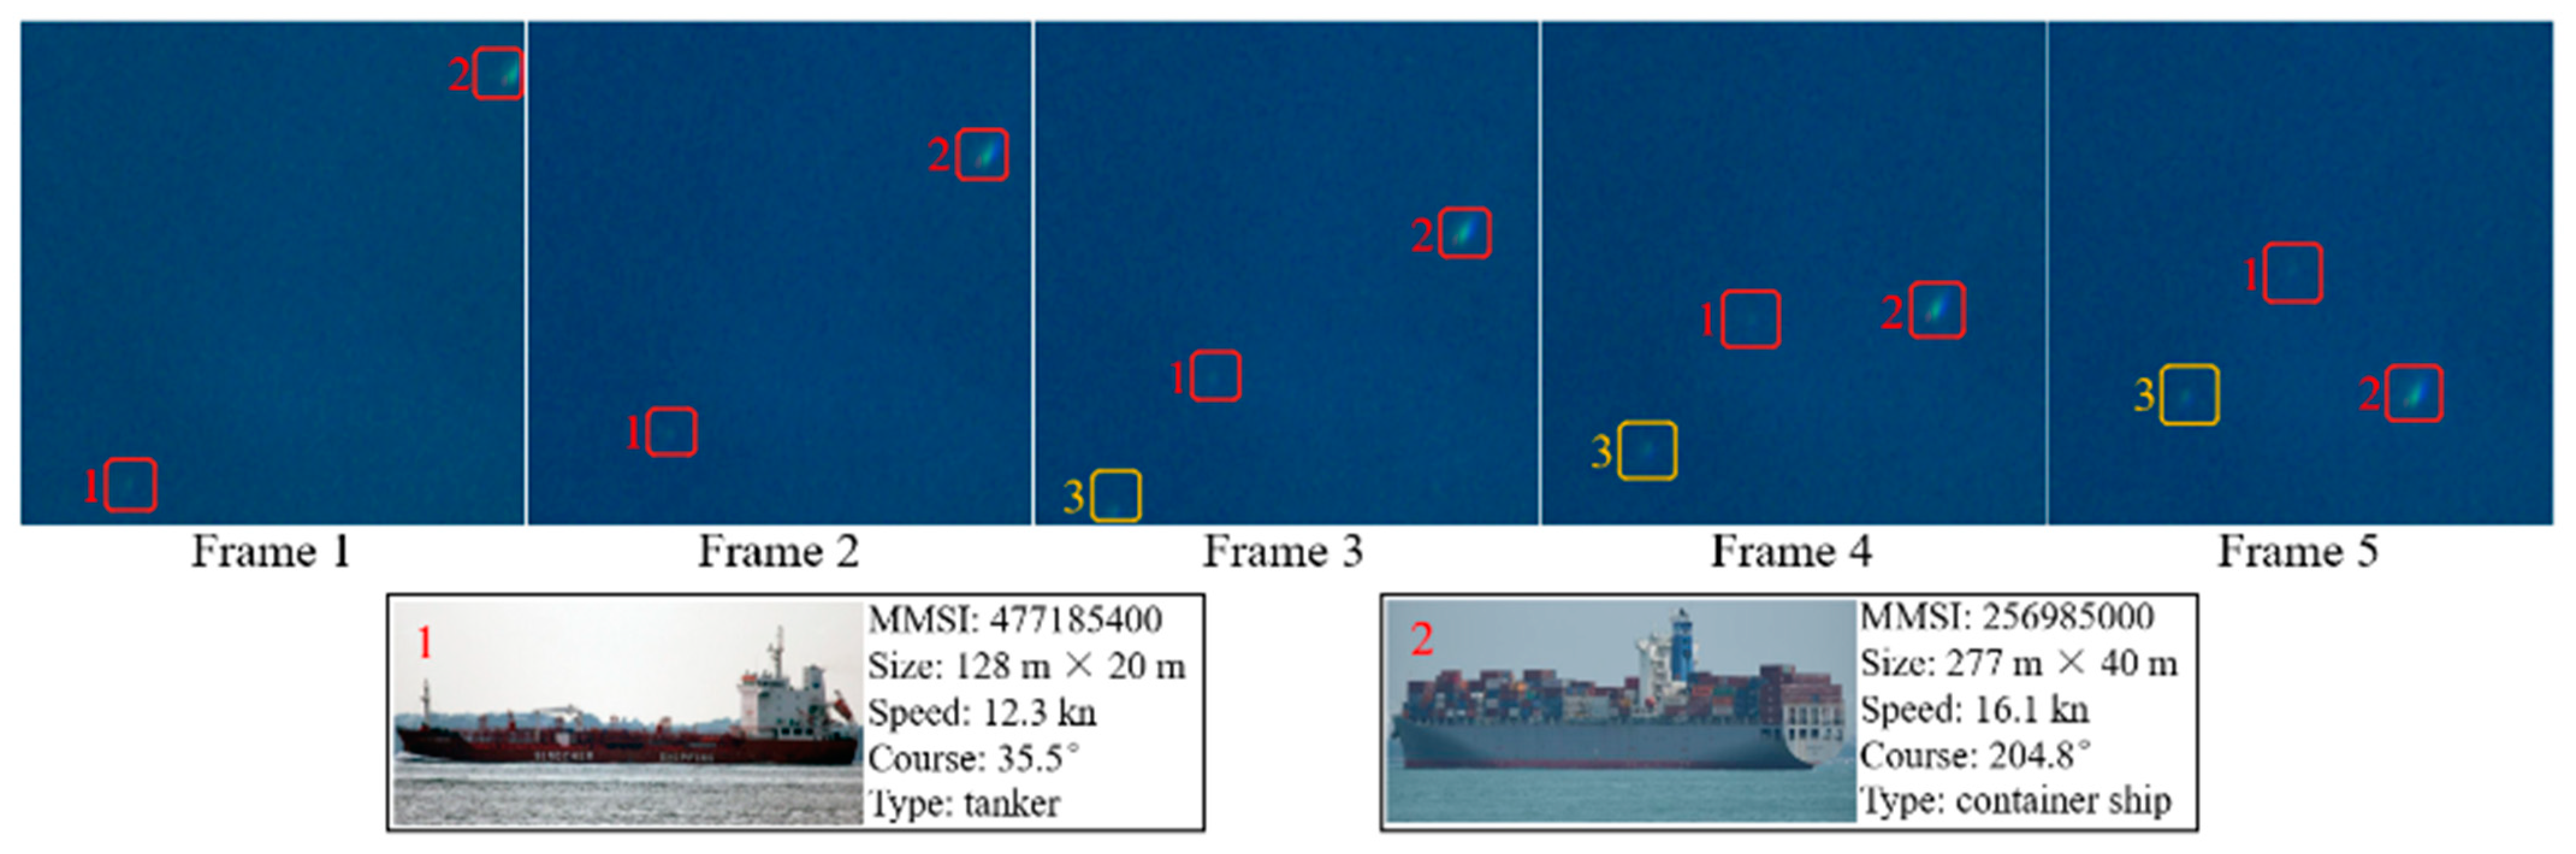
3.1. Research Area and Dataset

The GF-4 PMS sequential images composed of five frames of Level 1A data are selected to demonstrate the detection and tracking experiments of dim small ships. The imaging area is located in the East China Sea, as shown in Figure 7. The time range is from 03:47:24 to 03:59:47 (UTC) on 9 March 2017, and the time interval between adjacent frames is about 186 s. Each frame has five spectral bands (i.e., the NIR, red, green, blue, and panchromatic bands), each with a size of 10,240 × 10,240 pixels, and a spatial resolution of 50 m. Two ROIs bounded by red boxes are chosen for the experiments, with each ROI exceeding 100 km × 100 km coverage. Furthermore, the AIS dataset of ships is used for geometric position correction and performance verification, which covers the entire study area in space and time.

3.2. Results and Analysis

At the ship detection stage, the region growth threshold for image segmentation is 2 in this paper, and the other parameters are mostly adaptive or automatically calculated. Figure 8 shows a locally enlarged view of preliminary ship detection in the NIR band. There are many dense ships in Figure 8a, where some ships seem smaller and weaker. From Figure 8b, we can find that all the ships have been well detected. The visual effect of final ship detection about two ROIs in the first frame is presented in Figure 9, where the positions of the detected ships are marked with red circles. The size of a circle represents the size of a ship, while the grayscale of green color filled inside the circle means the average grayscale of a ship in the NIR band. We can learn that ships with stronger radiation characteristics typically have larger size features, and the distribution of ships becomes increasingly sparse as the size of ships increases. ROI1 is an inhomogeneous region with brighter intensity on the whole, which makes the contrast of ships seem lower. ROI2 contains some reef islands at the top-left corner of the image and a few broken clouds at the bottom of the image.
The multispectral grayscale and size characteristics extracted after ship detection are the static attributes of ships, which vary quite slightly across multi-frame images, as shown in Figure 10 and Figure 11. Figure 10 presents the grayscale variations of 10 ships in the NIR and red bands over multiple frames, where different marks denote different ships, and the red and green curves separately represent the grayscale values of NIR and red bands. It should be noted that the grayscale variation in the red band is generally much smaller than that in the NIR band, and the variation value is not more than 8. Moreover, some ships have larger grayscale values in the red band than in the NIR band. Similarly, the variation values of size features are usually not more than 4 pixels in the NIR band (see Figure 11). Further, we can find that the multispectral grayscale and size features of a ship are distinguishable from those of other ships. This is also the reason we embed these characteristics into the ship tracking model. The point pairs in the first frame after multimodal data association and RANSAC processing are shown in Figure 12, which are uniformly distributed in the study area for position correction of the detected ships. The positioning errors differ within different sea areas.
In the ship tracking procedure, the relevant parameters are set as follows: σ p = 0.002 , σ v = 0.01   nm / h 2 , σ g = 10 , σ s = 4 , c = 0.1 , P D = 0.95 , λ f = 10 11 , and λ n = 0 . Figure 13 presents the results of ship detection and tracking based on the GF-4 image sequences. In Figure 13a,b, we show the ship detection results of the two ROIs in all five frames where the positions have been geometrically corrected. We note that there are still some false alarms and very few missed alarms in the detection results. Nevertheless, through the subsequent multi-frame association tracking, most of the false alarms have been removed, and simultaneously a few missed detections have been well estimated and appropriately filled. A group of five circles with the same color represent one ship’s tracks generated by our tracker in Figure 13c,d, from where we can see that the tracking results can maintain high consistency with the interpolated AIS points. At last, the ships’ trajectories in the two ROIs are presented in Figure 13e,f, where a red line denotes one trajectory, and the asterisk and diamond marks represent the starting and ending of a trajectory, respectively.

3.3. Comparison and Evaluation

To validate the performance of our method for ship detection and tracking, quantitative evaluation metrics such as the precision and recall are employed, and some recently related methods are also used for comparison. The precision and recall can be calculated by
p r e c i s i o n = N T P N T P + N F P r e c a l l = N T P N T P + N F N
where N T P , N F P and N F N are the number of true positives, false positives and false negatives, respectively. Figure 14 shows comparison of visual effects on ship detection, which contains scenarios with dense targets (Figure 14a), broken clouds (Figure 14f) and severe sea clutter (Figure 14k). The red string labels on the three GF-4 image chips denote ground-truth ship targets and their numbers. We can intuitively see that our method has fewer false and missed alarms than other methods. Table 1 presents the calculated measures about ship detection and tracking of two ROIs in five frames. N T P , N F P and N F N are determined by AIS data cross reference and manual identification. There are separately 86 ships and 39 ships in ROI1 and ROI2, whose lifetimes run through the entire image sequences. In total, 49 tracked ships can be verified by AIS data of ships. Again from Table 1, we can see that both false and missed targets can be further reduced effectively by MHT tracking. By comparison, our method outperforms other methods in terms of the total precision and recall, and seems to have a more prominent advantage in ship detection, which further demonstrates the effectiveness of integrating multispectral vision saliency into the methodological framework.
The ship trajectories of two ROIs verified by AIS data are utilized to estimate the motion states. Figure 15 presents the proximity of motion states between the tracking results and AIS data in five frames. Table 2 shows the comparison of estimation error of motion states between our method and others, indicating the high accuracy and reliability of our method. The average estimation errors for location, speed, and course of our method can reach up to 83.2 m, 0.26 kn, and 2.24°, respectively.

4. Conclusions

The GEO remote sensing satellite, which has the capabilities of wide swath, high revisit, and persistent observation, shows good application prospects in sea surveillance and situational awareness. Most existing methods of ship detection and tracking based on such satellite images will produce high false alarms and missed alarms, since ships appear as dim small targets, which are usually interfered with by sea clutter, reef islands, broken clouds, and so on. Moreover, erroneous associations are prone to occur when tracking dense ship targets. Through analyzing the multispectral radiation and motion characteristics of marine ships, we found that the reason for the current dilemma is that the issue of modeling the time-series characteristics of dim small targets has not been effectively resolved. By introducing visual saliency characteristics across multispectral bands, we can (1) capture or even enhance the visual self-attention of dim small ships, significantly reducing false alarms and missed alarms while suppressing background interferences; and (2) robustly track ship trajectories in scenarios with dense targets and high sea states, further improving the precision and recall rate of ship tracking.
Overall, the contributions of our work are as follows: (1) developing a feature fusion method based on multi-vision saliency to segment candidate blobs of dim small ship targets from GEO remote sensing images; (2) constructing the criteria of multispectral association to determine the final results of ship detection; (3) embedding multispectral visual saliency into the motion model and MHT tracker. Experiments and comparisons demonstrate the high performance and reliability of our approach.
Nevertheless, due to the high mobility of targets on the sea, the tracking performance will be greatly diminished when the course or speed of the ship suddenly changes significantly, which is the biggest limitation of our method and also a key factor that puzzles existing methods. Hence, more robust and reliable motion modeling for ship states prediction and updating can ameliorate the accuracy of ship tracking. Motion parameter estimation across multispectral bands in an image frame is also useful for multi-frame association tracking. In addition, space-based multimodal remote sensing data (e.g., satellite videos, hyperspectral, and SAR images) fusion can utilize the complementary advantages to better serve marine vessel surveillance. These are the potential study areas we will focus on in the future.

Author Contributions

G.Z. (Guojun Zhang) guided the method design. F.M. designed the whole method and experiments. F.M. and G.Z. (Guocan Zhao) wrote the paper. Z.L. provided and processed the dataset. F.M. and K.D. performed the experimental analysis. G.Z. (Guocan Zhao) and Z.L. gave advice for the preparation and revision of the paper. All authors have read and agreed to the published version of the manuscript.

Funding

This work was funded by the National Natural Science Foundation of China (Grant No. 42101383), and the National Natural Science Foundation of China (Grant No. 41801303).

Data Availability Statement

Not applicable.

Acknowledgments

The authors thank China Center for Resources Satellite Data and Application for providing the GF-4 image sequences. They also would like to thank the editors and reviewers for their helpful comments and suggestions.

Conflicts of Interest

The authors declare no conflict of interest.

References

  1. Kanjir, U.; Greidanus, H.; Oštir, K. Vessel Detection and Classification from Spaceborne Optical Images: A Literature Survey. Remote Sens. Environ. 2018, 207, 1–26. [Google Scholar] [CrossRef]
  2. Soldi, G.; Gaglione, D.; Forti, N.; Di Simone, A.; Daffina, F.C.; Bottini, G.; Quattrociocchi, D.; Millefiori, L.M.; Braca, P.; Carniel, S.; et al. Space-Based Global Maritime Surveillance. Part I: Satellite Technologies. IEEE Aerosp. Electron. Syst. Mag. 2021, 36, 8–28. [Google Scholar] [CrossRef]
  3. Yu, W.; You, H.; Lv, P.; Hu, Y.; Han, B. A Moving Ship Detection and Tracking Method Based on Optical Remote Sensing Images from the Geostationary Satellite. Sensors 2021, 21, 7547. [Google Scholar] [CrossRef]
  4. Zhang, Z.; Shao, Y.; Tian, W.; Wei, Q.; Zhang, Y.; Zhang, Q. Application Potential of GF-4 Images for Dynamic Ship Monitoring. IEEE Geosci. Remote Sens. Lett. 2017, 14, 911–915. [Google Scholar] [CrossRef]
  5. Yao, L.; Liu, Y.; He, Y. A Novel Ship-Tracking Method for GF-4 Satellite Sequential Images. Sensors 2018, 18, 2007. [Google Scholar] [CrossRef] [PubMed] [Green Version]
  6. Liu, Y.; Yao, L.; Xiong, W.; Jing, T.; Zhou, Z. Ship Target Tracking Based on a Low-resolution Optical Satellite in Geostationary Orbit. Int. J. Remote Sens. 2018, 39, 2991–3009. [Google Scholar] [CrossRef]
  7. Wang, Q.; Hu, Y.; Pan, Z.; Liu, F.; Han, B. Spatiotemporal Data Fusion and CNN Based Ship Tracking Method for Sequential Optical Remote Sensing Images from the Geostationary Satellite. IEEE Geosci. Remote Sens. Lett. 2022, 19, 6518305. [Google Scholar] [CrossRef]
  8. Yang, G.; Li, B.; Ji, S.; Gao, F.; Xu, Q. Ship Detection from Optical Satellite Images Based on Sea Surface Analysis. IEEE Geosci. Remote Sens. Lett. 2014, 11, 641–645. [Google Scholar] [CrossRef]
  9. Li, T.; Liu, Z.; Xie, R.; Ran, L. An Improved Superpixel-Level CFAR Detection Method for Ship Targets in High-Resolution SAR Images. IEEE J. Sel. Top. Appl. Earth Obs. Remote Sens. 2018, 11, 184–194. [Google Scholar] [CrossRef]
  10. Liu, Y.; Yao, L.; Xiong, W.; Zhou, Z. GF-4 Satellite and Automatic Identification System Data Fusion for Ship Tracking. IEEE Geosci. Remote Sens. Lett. 2019, 16, 281–285. [Google Scholar] [CrossRef]
  11. Lin, L.; Wang, S.; Tang, Z. Using Deep Learning to Detect Small Targets in Infrared Oversampling Images. J. Syst. Eng. Electron. 2018, 29, 71–76. [Google Scholar]
  12. Li, Q.; Mou, L.; Liu, Q.; Wang, Y.; Zhu, X. HSF-Net: Multiscale Deep Feature Embedding for Ship Detection in Optical Remote Sensing Imagery. IEEE Trans. Geosci. Remote Sens. 2018, 56, 7147–7161. [Google Scholar] [CrossRef]
  13. Wang, N.; Li, B.; Xu, Q.; Wang, Y. Automatic Ship Detection in Optical Remote Sensing Images Based on Anomaly Detection and SPP-PCANet. Remote Sens. 2019, 11, 47. [Google Scholar] [CrossRef] [Green Version]
  14. Wu, J.; Pan, Z.; Lei, B.; Hu, Y. LR-TSDet: Towards Tiny Ship Detection in Low-Resolution Remote Sensing Images. Remote Sens. 2021, 13, 3890. [Google Scholar] [CrossRef]
  15. Cheng, M.M.; Mitra, N.J.; Huang, X.; Torr, P.H.; Hu, S.M. Global Contrast Based Salient Region Detection. IEEE Trans. Pattern Anal. Mach. Intell. 2014, 37, 569–582. [Google Scholar] [CrossRef] [PubMed] [Green Version]
  16. Wei, Y.; You, X.; Li, H. Multiscale Patch-based Contrast Measure for Small Infrared Target Detection. Pattern Recognit. 2016, 58, 216–226. [Google Scholar] [CrossRef]
  17. Bai, X.; Bi, Y. Derivative Entropy-Based Contrast Measure for Infrared Small-Target Detection. IEEE Trans. Geosci. Remote Sens. 2018, 56, 2452–2466. [Google Scholar] [CrossRef]
  18. Li, H.C.; Chen, L.; Li, F.; Huang, M.Y. Ship Detection and Tracking Method for Satellite Video Based on Multiscale Saliency and Surrounding Contrast Analysis. J. Appl. Remote Sens. 2019, 13, 026511. [Google Scholar] [CrossRef]
  19. Li, C.; Luo, B.; Hong, H.; Su, X.; Wang, Y.; Liu, J.; Wang, C.; Zhang, J.; Wei, L. Object Detection Based on Global-Local Saliency Constraint in Aerial Images. Remote Sens. 2020, 12, 1435. [Google Scholar] [CrossRef]
  20. Dong, L.; Wang, B.; Zhao, M.; Xu, W. Robust Infrared Maritime Target Detection Based on Visual Attention and Spatiotemporal Filtering. IEEE Trans. Geosci. Remote Sens. 2017, 55, 3037–3050. [Google Scholar] [CrossRef]
  21. Du, P.; Hamdulla, A. Infrared Small Target Detection Using Homogeneity-Weighted Local Contrast Measure. IEEE Geosci. Remote Sens. Lett. 2020, 17, 514–518. [Google Scholar] [CrossRef]
  22. Mazzarella, F.; Vespe, M.; Santamaria, C. SAR Ship Detection and Self-reporting Data Fusion Based on Traffic Knowledge. IEEE Geosci. Remote Sens. Lett. 2015, 12, 1685–1689. [Google Scholar] [CrossRef]
  23. Granstrom, K.; Lundquist, C.; Orguner, O. Extended Target Tracking Using a Gaussian-Mixture PHD Filter. IEEE Trans. Aerosp. Electron. Syst. 2012, 48, 3268–3286. [Google Scholar] [CrossRef] [Green Version]
  24. Fortmann, T.; Bar-Shalom, Y.; Scheffe, M. Sonar Tracking of Multiple Targets Using Joint Probabilistic Data Association. IEEE J. Ocean. Eng. 1983, 8, 173–184. [Google Scholar] [CrossRef] [Green Version]
  25. Reid, D. An Algorithm for Tracking Multiple Targets. IEEE Trans. Autom. Control 1979, 24, 843–854. [Google Scholar] [CrossRef]
  26. Ren, X.; Huang, Z.; Sun, S.; Liu, D.; Wu, J. An Efficient MHT Implementation Using GRASP. IEEE Trans. Aerosp. Electron. Syst. 2014, 50, 86–101. [Google Scholar] [CrossRef]
  27. Sheng, H.; Chen, J.; Zhang, Y.; Ke, W.; Xiong, Z.; Yu, J. Iterative Multiple Hypothesis Tracking with Tracklet-level Association. IEEE Trans. Circuits Syst. Video Technol. 2019, 29, 3660–3672. [Google Scholar] [CrossRef]
  28. Xiao, F.; Yuan, F.; Cheng, E. Detection and Tracking Method of Maritime Moving Targets Based on Geosynchronous Orbit Satellite Optical Images. Electronics 2020, 9, 1092. [Google Scholar] [CrossRef]
  29. Lukezic, A.; Vojir, T.; Cehovin Zajc, L.; Matas, J.; Kristan, M. Discriminative Correlation Filter with Channel and Spatial Reliability. In Proceedings of the IEEE Conference on Computer Vision and Pattern Recognition, Honolulu, HI, USA, 21–26 July 2017; pp. 6309–6318. [Google Scholar]
  30. Yang, T.; Zhou, S.; Xu, A.; Yin, J. A Method for Tree Image Segmentation Combined Adaptive Mean Shifting with Image Abstraction. J. Inf. Process. Syst. 2020, 16, 1424–1436. [Google Scholar]
  31. Hong, Y.; Yi, J.; Zhao, D. Improved Mean Shift Segmentation Approach for Natural Images. Appl. Math. Comput. 2007, 185, 940–952. [Google Scholar] [CrossRef]
  32. Zhao, X.; Hu, X.; Liao, Y.; He, T.; Zhang, T.; Zou, X.; Tian, J. Accurate MR Image Super-resolution via Lightweight Lateral Inhibition Network. Comput. Vis. Image Underst. 2020, 201, 103075. [Google Scholar] [CrossRef]
Figure 1. The flowchart of the proposed method.
Remotesensing 15 02069 g001
Figure 2. Moving ships in GF-4 sequential image chips (displayed as false-color composites) and corresponding automatic identification system (AIS) information. The lifetimes of two ships in two red boxes run through the entire image sequences, while the ship in yellow box is treated as a new target.
Remotesensing 15 02069 g002
Figure 3. Comparison of the contrast saliency maps of GF-4 image: (a) result generated by conventional lateral inhibition network; (b) result by ours with protection domain.
Remotesensing 15 02069 g003
Figure 4. The whole workflow of the proposed dim small ship target detection method.
Remotesensing 15 02069 g004
Figure 5. Multispectral radiation characteristics of different targets: (a) GF-4 false-color image (i.e., composites of near-infrared (NIR), red and green bands); (b) corresponding NIR band; (c) the red band; (d) the green band.
Remotesensing 15 02069 g005
Figure 6. The displacement of moving ships’ positions across multispectral images. The displacement distances of ships in three red boxes vary depending on their velocities.
Remotesensing 15 02069 g006
Figure 7. Research area and dataset coverage.
Remotesensing 15 02069 g007
Figure 8. Locally enlarged result of preliminary ship detection in the NIR band: (a) local view of NIR band; (b) detection result in the NIR band.
Remotesensing 15 02069 g008
Figure 9. Visual effect of final ship detection in two regions of interest (ROIs): (a) result of ROI1; (b) result of ROI2.
Remotesensing 15 02069 g009
Figure 10. Multispectral grayscale variations of 10 ships over multiple frames. Different marks denote different ships.
Remotesensing 15 02069 g010
Figure 11. The size variations of 10 ships over multiple frames. Lines with different colors and marks denote different ships.
Remotesensing 15 02069 g011
Figure 12. The point pairs in the first frame used for geometric correction. The blue lines connecting AIS points and GF-4 points denote the associations between point pairs.
Remotesensing 15 02069 g012
Figure 13. The results of ship detection and tracking in GF-4 image sequences: (a,b) are ship detection results of two ROIs in all five frames; (c,d) are ship tracking results of two ROIs along with AIS data for verification; (e,f) are ships’ trajectories in the two ROIs. Different colors of circles denote trajectories of different ship targets in the subfigure (c,d).
Remotesensing 15 02069 g013aRemotesensing 15 02069 g013b
Figure 14. Comparison of visual effects on ship detection: (a,f,k) are locally enlarged GF-4 image chips; (b,g,l) are corresponding results of Liu et al. [6]; (c,h,m) are results of Yao et al. [5]; (d,i,n) are results of Wang et al. [7]; (e,j,o) are results of ours.
Remotesensing 15 02069 g014
Figure 15. The proximity of motion states between the tracking results and AIS data in five frames: (a) location error between estimated positions and AIS positions; (b) estimated speed with regard to AIS speed; (c) estimated course with regard to AIS course.
Remotesensing 15 02069 g015
Table 1. Metrics comparison of ship detection and tracking.
RegionFrameShip DetectionShip Tracking
NTPNFPNFNPrecision
(%)
Recall
(%)
NTPNFPNFNPrecision
(%)
Recall
(%)
ROI118210589.1394.25831398.8196.51
28512387.6396.59
3849390.3296.55
48315384.6996.51
5829490.1195.35
ROI21374290.2494.873702100.0094.87
2378282.2294.87
33615370.5992.31
43810279.1795.00
5357483.3389.74
Total PerformanceOur Method599993185.8295.081201599.1796.00
Liu et al. [6]---37.6881.36---91.5679.66
Yao et al. [5]---47.6089.00---98.5087.40
Yu et al. [3]---70.7094.80---98.2093.10
Wang et al. [7]---78.6093.20---95.7094.90
Table 2. Comparison of estimation error of motion states.
Estimation ErrorAverage Error of ROI1Average Error of ROI2Total Error of Our MethodTotal Error of Yao et al. [5]Total Error of Liu et al. [10]
Location (m)71.9114.683.289.884.7
Speed (kn)0.270.250.260.30.3
Course (°)2.192.382.242.52.6
Disclaimer/Publisher’s Note: The statements, opinions and data contained in all publications are solely those of the individual author(s) and contributor(s) and not of MDPI and/or the editor(s). MDPI and/or the editor(s) disclaim responsibility for any injury to people or property resulting from any ideas, methods, instructions or products referred to in the content.

