Article

An Improved SAR Image Semantic Segmentation Deeplabv3+ Network Based on the Feature Post-Processing Module

Information Technology Department, Nanjing University of Aeronautics and Astronautics, Nanjing 210016, China
*
Author to whom correspondence should be addressed.
Remote Sens. 2023, 15(8), 2153; https://doi.org/10.3390/rs15082153
Submission received: 7 February 2023 / Revised: 14 April 2023 / Accepted: 15 April 2023 / Published: 19 April 2023

Abstract

:
Synthetic Aperture Radar (SAR) can provide rich feature information under all-weather and day-night conditions because it is not affected by climatic conditions. However, multiplicative speckle noise exists in SAR images, which makes it difficult to accurately identify some fuzzy targets in SAR images, such as roads and rivers, during semantic segmentation. This paper proposes an improved Deeplabv3+ network that can be effectively applied to the semantic segmentation task of SAR images. Firstly, this paper added the attention mechanism and, combined with the idea of an image pyramid, proposed the Feature Post-Processing Module (FPPM) to post-process the network output feature map, obtain better fine image features, and solve the problem of fuzzy texture and spectral features of SAR images. Compared to the original Deeplabv3+ network, the segmentation accuracy has been improved by 3.64% and mIoU improved by 1.09%. Secondly, to solve the problems of limited SAR image data and an unbalanced sample, this paper used the focal loss function to improve the backbone function of the network, which increased the mIoU by 1.01%. Finally, the Atrous Spatial Pyramid Pooling (ASPP) module was improved and the 3 × 3 void convolution in ASPP was decomposed into 2D, which can maintain the void ratio and effectively reduce the calculation amount of the module, shorten the training time by 19 ms and improve the semantic segmentation effect.

1. Introduction

Semantic segmentation of SAR images is a basic and important problem in remote sensing image interpretation. Its purpose is to assign a category label to each pixel in SAR images. Due to their all-weather and rich feature information, SAR images have received special attention from scholars at home and abroad in recent years. SAR image semantic segmentation gives pixel segment semantic information to guide the further analysis and understanding of SAR images, which is of great significance to promote the development of SAR image processing technology. With the rapid development of Deep Learning, Deep Convolutional Neural Networks (DCNN) are vital for feature extraction and characterization. Fully Convolutional Networks (FCN) [1], based on the emergence of the end-to-end classical semantic segmentation model, have achieved great success. However, at the same time, due to the fixed network structure, FCN also reveals many disadvantages. Without considering the global context information, the sampling of the feature map will be restored to the image size of the original image, resulting in inaccurate pixel positioning. Ronnerberge [2] proposed a U-Net network for biomedical image segmentation. However, when doing multi-classification tasks, U-Net convolutional networks have poor edge contour segmentation and easily cause GPU RAM overflow. Marmanisac [3] proposed an integrated learning method combining FCN, SegNet, and edge detection, reducing the segmentation error and improving the segmentation accuracy when segmenting high-resolution remote sensing images. When dealing with objects with similar appearance, PSPNet [4] network uses a space pyramid pool to aggregate contexts in different regions, which improves the network’s ability to utilize global context information. In addition, semantic segmentation networks such as SegNet [5] and RefineNet [6] adopt encoder-decoder structures to capture detailed information and improve segmentation accuracy. However, with the development of remote sensing image processing technology in recent years, the research and use of SAR images are gradually increasing, which promotes the development of SAR image processing and interpretation technology. SAR image semantic segmentation is the basis of SAR image processing, interpretation and more profound research [7]. Zhang Zejun [8] proposed a region-merging SAR image segmentation algorithm based on edge information. Philipp Krahenbuhl proposed a fully connected CRF [9] for SAR image semantic segmentation. MTT Teichmann added a solid and effective conditional independent hypothesis to the framework of fully connected CRF, which enabled the model to represent most of the reasoning as convolution. This can be highly realized using the GPU efficiently and this method is called convolution CRF (convCRF) [10]. This method has a high segmentation performance. However, this method is insufficient in extracting semantic information from deep feature maps and will lead to the loss of spatial information. Secondly, this method is still unsatisfactory in segmenting full SAR images or radar images containing complex interference. With further research, the Deeplab series is emerging in semantic segmentation. The Google team developed the first Deeplab [11] model and the subsequent Deeplab series has been improved on this model. In addition, to obtain better semantic segmentation results, its performance is improved every year, and then a series of Deeplab models are developed [12,13,14]. The latest version of the Deeplab series Deeplabv3+ [14] network creatively incorporates jump connections into the codecs structure. It resolves the problem of the previous Deeplab series’ output resolution being only one-eighth of the original image. Deeplabv3+ achieves the best semantic segmentation task compared to other Deeplab-series networks. However, in the relatively complex SAR image semantic segmentation task, improving the accuracy of extracted features is the most critical problem to be solved. At present, the attention mechanism is widely used in deep learning, especially in the rapid development of image processing, which can solve this problem well. Fu [15] designed the DANet network and improved the segmentation accuracy by introducing the self-attention mechanism, integrating local semantic features and global dependencies. SENet, proposed by Hu [16], compresses each two-dimensional feature map to effectively construct the interdependence between channels. Cost Benefit Analysis Method (CBAM) [17] further promoted this idea and introduced spatial information coding through the convolution of large-size cores. However, the volume of the CBAM brought a significant burden to the training process of the network. In order to solve the above problems, this paper attempts to redesign its attention mechanism based on Deeplabv3+ network [14], combine the Efficient Channel Attention (ECA) mechanism proposed by Qilong Wang [18] with the Non Local mechanism, and try to use the focal loss function proposed by Tsung Yi Lin [19] to improve the backbone function of the network, hoping to achieve better segmentation effect, and then consider using convolution decomposition theory [20] to optimize the ASPP module. It tries to reduce module computation and memory consumption while maintaining its void ratio.
In order to solve the problems of polarimetric SAR images, such as being seriously affected by speck noise, easy to produce shadows, and low spatial resolution, an attention mechanism was introduced and combined with the idea of an image pyramid. A FPPM was proposed to post-process the network output feature map and the image quality analysis method was used to calculate the branch number of this module. More detailed image features are obtained. In order to solve the problem of limited data and unbalanced samples in polarimetric SAR images, this paper uses focal loss function to improve the backbone function of the network. To solve the problem of the long operation time of the model, the ASPP module is optimized, and the 3 × 3 void convolution in ASPP is decomposed into 2D, so as to maintain the void ratio and effectively reduce the calculation amount of the module.
The second section of this article introduces the theories related to the content of this article, laying the groundwork for the subsequent content. In the third section, the improvement measures for Deeplabv3+ network are described in detail. In the fourth section, the experimental results of this article are listed, including FPPM model parameter determination experiments, ablation experiments, and results on synthetic and SAR images. Compared to the original Deeplabv3+ network, the segmentation accuracy has been improved by 3.64% and mIoU improved by 2.1%, shortening the training time by 19 ms.

2. Relevant Theories

In this paper, Mobilenet-v2 is selected as the backbone network of the Deeplabv3+ model. Mobilenet-v2 is a further improvement on the Mobilenet-v1 version model. It is consistent with the Mobilenet-v1 model and is a lightweight convolutional neural network. This paper uses the Coordinate Attention (CA) method after the backbone network. This is a lightweight attention method that effectively captures the relationship between location information and channel information. CA is a computing unit designed to enhance the expression ability to learn features. It can take any intermediate feature tensor X = [x1, x2,…, xc] as the input and the transformation tensor Y = [y1, y2,…, yc] with enhanced representation of the same size as X is output. CA encodes channel relationships and long-term dependencies through accurate location information. The specific operations are divided into two steps: embedding the Coordinate Information and generating the CA:
(1)
Coordinate Information Embedding
The global pooling method is usually used for the global coding of the channel attention coding spatial information, such as the SE (Sequence and Exception) block [16] extrusion step. Given the input X, the compression step of the c th channel can be expressed as Formula (1). Because it compresses the global information into the channel descriptor, it is not easy to save the location information. In order to enable the attention module to capture the remote spatial relationships with accurate location information, the global pooling is decomposed according to Formula (1) and converted into a pair of one-dimensional feature encoding operations:
z c = 1 H × W 0 j H 0 j W x c ( i , j )
where Z c represents the output of channel c, x c ( i , j ) represents the height coordinate i and width coordinate j of channel c, and H and W represent the height and width of the feature map, respectively. Specifically, given the input x, each channel is first coded along the horizontal and vertical coordinates using pooled kernels with dimensions (H, 1) and (1, W). Therefore, the output with height h of channel c can be expressed as:
z c h ( h ) = 1 W 0 j W x c ( h , j )
In the formula, z c h ( h ) represents the output with the height of channel c as h, the width coordinate with the height of channel c as h is the value of the feature map of j, and W represents the width of the feature map. Similarly, the output with width w of channel c can be written as:
z c w ( w ) = 1 H 0 i H x c ( i , w )
where z c w ( w ) represents the output with the width of channel c as w, the height coordinate with the width of channel c as w is the value of the feature map of i, and H represents the height of the feature map.
The above two transformations aggregate features along two spatial directions to obtain a pair of direction-aware feature maps. This differs from the SE [16] module that generates a single feature vector in the channel attention method. These two transformations also allow the attention module to capture long-term dependencies along one spatial direction and preserve accurate location information along the other. This helps the network to locate the target of interest.
(2)
Coordinate Attention Generation
By (1), the global receptive field can be well obtained and accurate position information can be encoded. In order to use the resulting features, the following two transformations are given, called Coordinated Attention generation. After the transformation in Information Embedding, the aggregation feature map generated by Formulas (4) and (5) is concatenated, and the 1 × 1 convolution transformation function F1 is used to transform it:
f = δ ( F 1 [ z h , z w ] )
where [▪, ▪] is a splicing operation along the spatial dimension, δ is a nonlinear activation function, f is an intermediate feature map that encodes spatial information in the horizontal and vertical directions. Here r is used to control the reduction rate of SE and SE block size, and then decompose f into two separate tensors f h along the spatial dimension f h and f w . Utilize the other two 1 × 1 Convolution transformation Fh and Fw transform f h and f w into tensors with the same number of channels to input X respectively, and obtain:
g h = σ ( F h ( f h ) )
g w = σ ( F w ( f w ) )
where σ is a sigmoid activation function, to reduce the model’s complexity and computational overhead, an appropriate reduction ratio r is usually used to reduce the number of channels of f. Then the output gh and gw are expanded as attention weights, respectively. Finally, the output of the Coordinate Attention block Y = [y1, y2,..., yc] can be written as:
y c ( i , j ) = x c ( i , j ) × g c h ( i ) × g c w ( j )

3. Method

Deeplabv3+ is widely used in optical image semantic segmentation and has achieved good results. Given the approximate color, position, and other characteristics between optical and SAR images, this paper uses Deeplabv3+ to achieve the SAR image semantic segmentation task. Given the characteristics of SAR images, the focal loss function proposed by Tsung Yi Lin [19] is used to improve the semantic segmentation loss function. The decomposition theory proposed by Alvarez J [20] is used to improve the ASPP module of Deeplabv3+. At the same time, the Feature Post-Processing Module (FPPM) proposed in this paper is added to the Decoder module of Deeplabv3+, which improves the accuracy of Deeplabv3+ in SAR image semantic segmentation tasks. The improved Deeplabv3+ network model is shown in Figure 1:
The new focal loss function, FPPM model, improved ASPP module and attention mechanism module in Figure 1 will be introduced in detail in the following sections. The rate in the figure represents the step size. As can be seen from Figure 1, our improvements to the Deeplabv3+ network are mainly reflected in the following aspects: First, in order to solve the problems of polarimetric SAR images, such as being seriously affected by speck noise, easy to produce shadows, and low spatial resolution, we introduced the attention mechanism and combined with the image pyramid idea, proposed an FPPM to post-process the feature map output from the network, and used the image quality analysis method to calculate the number of branches of the module to obtain more detailed image features. Secondly, in order to solve the problem of limited data and unbalanced samples in polarimetric SAR images, the focal loss function is used to improve the backbone function of the network. Finally, aiming at the problem of long calculation time of the model, the ASPP module was optimized, and 3 × the void convolution of 3 is decomposed into 2D to maintain its void ratio, while effectively reducing the computational complexity of the module.

3.1. Feature Post-Processing Module (FPPM)

Although the SAR image has more abundant feature information, the signal-to-noise ratio of the nonlinear FM continuous pulse signal is low. Due to the side-looking coherent imaging mode, image noise pollution is severe, and it is easy to produce shadow, speckle noise, etc., and the spatial resolution is low. In order to make full use of the fine features of SAR images inspired by the pyramid pool, this paper proposes the FPPM. The FPPM structure is shown in Figure 2. The subgraph (a) in Figure 2 describes the detailed architecture of FPPM. Its first branch applies the primary non-local attention mechanism to the whole image, and the second branch divides the image into ( H / 2 ) × ( W / 2 ) blocks. Each block uses the Non-local mechanism. In the figure, XC represents the channel number of X characteristic graphs with a channel number of C. The third branch divides the image into ( H / 4 ) × ( W / 4 ) and applies it to Non-local, and so on. The detailed operation of non-local blocks on a single patch is described in (b), which divides the image into small blocks, performs Non-local on each block respectively, and folds it back to the entire image. The results of X branches are combined and then sent to the ECA module to generate weight parameters better to capture the feature map’s local information.
In this paper, the ECA module is introduced into the FPPM to better mine the channel information of the output characteristic graph of the previous network. The ECA module is a new method to capture local cross-channel information interaction, ensuring good network performance and low computational complexity. The ECA module obtains features through GAP (Global Average Pooling) and uses one-dimensional convolution with convolution kernel size k to generate channel weights. In the process of enhancing channel dependency, it is assumed that the output feature AA is integrated through GAP, and the channel weight is generated by one-dimensional convolution with convolution kernel size k without dimension reduction operation ω, as shown in Formula (8):
ω = σ ( C 1 D k ( y ) )
Among them, σ Represents the Sigma function and C1D represents one-dimensional convolution. In order to adequately capture local cross-channel information interaction, it is necessary to determine the approximate range of channel interaction information, that is, the convolution kernel size k of one-dimensional convolution. The ECA module adaptively selects k through Equation (9):
k = ϕ ( C ) = b ( C ) γ + b γ o d d
where |t|odd means the odd number nearest to t, the same as the original γ = 2, b = 1. It is worth noting that the parameters and computation of this attention module can be almost ignored and it is a highly lightweight network architecture. The network model of ECA is shown in Figure 3.

3.2. Determination of FPPM Model Parameters

This section determines the optimal value of branch number X of the FPPM through the image quality evaluation algorithm. X branches of the FPPM divide image into H/X × H/X, and each block uses the Non-local mechanism, which will impact the image quality during the division process. The image quality evaluation algorithm is used to calculate the quality and distortion of the block image after each layer of branch division. According to the image quality score, the optimal number of branches of the FPPM is obtained: how many times the FPPM should divide the image in pyramid mode and the best effect for image feature extraction.
The objective quality evaluation algorithm calculates the image quality by establishing a model. Its goal is to use computers to replace human vision systems to achieve automatic and accurate image quality evaluation [21]. According to the dependence of the image to be evaluated on the information related to the original image, the objective image quality evaluation methods can be roughly divided into three categories: the complete reference, partial reference, and no reference. The reference method has the most mature development and has been widely concerned and studied by the academic community. It has achieved fruitful research results, such as the relatively typical structure similarity evaluation algorithm, and its improved algorithm has achieved considerable success [22,23,24,25,26]. The image quality evaluation algorithm used in this section is a general NR evaluation algorithm that uses the logarithmic statistical characteristics of images. This algorithm is based on the idea of NSS (Natural Scene Statistics) in the general nonreference quality evaluation algorithm that does not require learning. It does not require any training or learning process. It only extracts the spatial features of the image and does not need to transform it. The algorithm has relatively low computational complexity.

3.2.1. Logarithmic Energy Characteristics

As an actual performance to evaluate image quality, image definition can use the logarithmic energy statistical characteristics of the normalized luminance coefficient in the spatial domain. The logarithmic energy characteristic formula of the normalized luminance coefficient is as follows:
E n = log ( 1 + 1 N i , j I n 2 ^ i , j )
where, N represents the number of normalized luminance coefficients in the n th image block.
The simulation results show that the logarithmic energy feature strongly correlates with image visual perception and the spatial characteristics significantly reduce the computational complexity. Under different levels of distortion, the logarithmic energy characteristics change monotonously, and the standard deviation between the logarithmic energy of the image is minimal, which proves that it is suitable for nonreference image quality evaluation.

3.2.2. Spatial Feature Extraction

Statistical characteristics model the distribution rule between adjacent pixels. Since the normalized luminance coefficient of the natural image conforms to the zero mean Gaussian distribution, the statistical model based on logarithmic derivative can adopt the generalized Gaussian distribution(GGD). The expression of the generalized Gaussian distribution is:
f x , μ , α , β = α 2 β Γ 1 / α exp   [ ( x μ β ) α ]
where Γ X = 0 t x 1 e t dt ,   x > 0 is the gamma equation, μ, α, β They are mean value, shape parameter, and scale parameter α, β. The shape and variance of the generalized Gaussian distribution curve are determined, respectively (α, β). It can be estimated effectively by the time-matching algorithm. For each image block, the log energy feature of the normalized luminance coefficient plus the GGD parameter of the log derivative forms a 13-dimensional feature vector. In order to capture image multi-resolution features, spatial features are extracted under two different resolution conditions: original image resolution and reduced image resolution. Continuing to reduce the resolution has little impact on the algorithm performance, so the image resolution is only reduced by twice. Finally, for each image block, 26-dimensional spatial feature vectors are extracted.

3.2.3. MVG (Multivariate Gaussian) Model

Based on the idea of NSS, the final image quality evaluation score is obtained by calculating the distance between the test image and the MVG model of the raw image library. Firstly, the MVG model of the natural image library is constructed, and the extracted spatial feature vector of the natural image is modeled using MVG to obtain the mean vector of a spatial feature of the natural image ν and covariance matrix Σ. The MVG model is as follows:
f x x 1 , , x k = 1 2 π 1.2 1 / 2 exp 1 2 x υ T 1 x υ
where, (x1,…, xk) is the extracted statistical feature of natural image. The MVG modeling process of the test image is the same as that of the natural image. The objective evaluation quality score of the test image is obtained by calculating the distance between the test image and the MVG model of the white natural image library:
D υ 1 , υ 2 , 1 , 2 = υ 1 υ 2 T 1 + 2 2 1 υ 1 υ 2
Among them, ν1ν2, and Σ1, Σ2 represent the mean vector and covariance matrix (D (ν1, ν2, Σ1, Σ2). The higher the value, the greater the deviation between the test image and the SAR image, that is, the more serious the distortion of the test image; on the contrary, the less distortion. It can be calculated from the above formula that when the number of branches X is 3, the quality of the smallest unit image block decreases the least, and the feature extraction effect is the best.

3.3. Focal Loss Function

Although SAR images contain more abundant feature information of ground structure, imaging technology is cumbersome, and data post-processing is complex. Therefore, the SAR image data sets that can be used for segmentation are limited, and the feature labels of most data sets are incredibly uneven. In the dataset used in this paper, the number of tags such as “road” and “mountain” is large, and the number of tags such as “forest” is small. This imbalance will lead to the problem of low training efficiency. Since most samples are simple targets, these samples provide less valuable information to the model in training. The advantage of a simple sample size will affect the training of the model and degrade its performance of the model. The focal loss function proposed by Tsung Yi Lin [19] solves the problem of category imbalance by reducing the internal weight. This function focuses on training using data sets with sparse complex samples. The loss function is a dynamic scaling cross-entropy loss. As a more effective alternative to deal with the previous class imbalance, the scaling factor decays to zero with increased confidence in the correct class, as shown in Figure 4. Intuitively, this scale factor can automatically reduce the contribution of simple samples in the training process and quickly focus the model on complex samples. Experiments show that the focal loss this paper proposed enables us to train a high-precision single-stage segmentation model that is significantly better than the original loss function, which is the most advanced function for training unbalanced samples.
The focal loss is designed to solve the imbalance between different samples in the training process of single stage target detection scene. For binary classification 1, focal loss will be introduced from cross entropy (CE) loss:
C E ( p , y ) = log ( p )                     if   y = 1   log ( 1 p )       otherwise
A common way to solve class imbalance is to introduce weight factors p ∈ [0, 1] as the weight of class 1, 1 − p. As the weight of class-1, in practice, it can be set by inverse class frequency or as a super parameter for cross-validation. For the convenience of symbols, pt is defined. p-balanced CE loss will be written as:
p t = p                       if   y = 1 1 p         otherwise
This loss is a simple extension of CE and serves as the experimental baseline for the focal loss we propose.
CE loss function cannot balance the learning of fewer samples well, so we introduce focal loss as a loss function to solve the problem of sample imbalance in segmentation tasks. Focal loss is improved based on the cross-entropy function by modifying the cross-entropy function and adding a sample difficulty weight adjustment factor (1 − Pt) γ. The mathematical expression is:
L F L ( P t ) = ( 1 P t ) γ log P t
In fact, you can also add a category weight α, The form (10) is rewritten as:
L F L ( P t ) = α ( 1 P t ) γ log P t
where α is the weight parameter between categories (0–1 two categories); (1 − Pt) γ adjusts the factor for simple/complex samples, γ is the focal parameter. When the prediction of a particular category is accurate, that is, when Pt is close to 1, (1 − Pt) γ the value of is close to 0. When the prediction of a specific category is inaccurate, that is, when Pt is close to 0, (1 − Pt) γ the value of is close to 1 set up γ = 2, α = 0.25. We use this form in the experiment because its accuracy is higher than that of the non-equilibrium form.

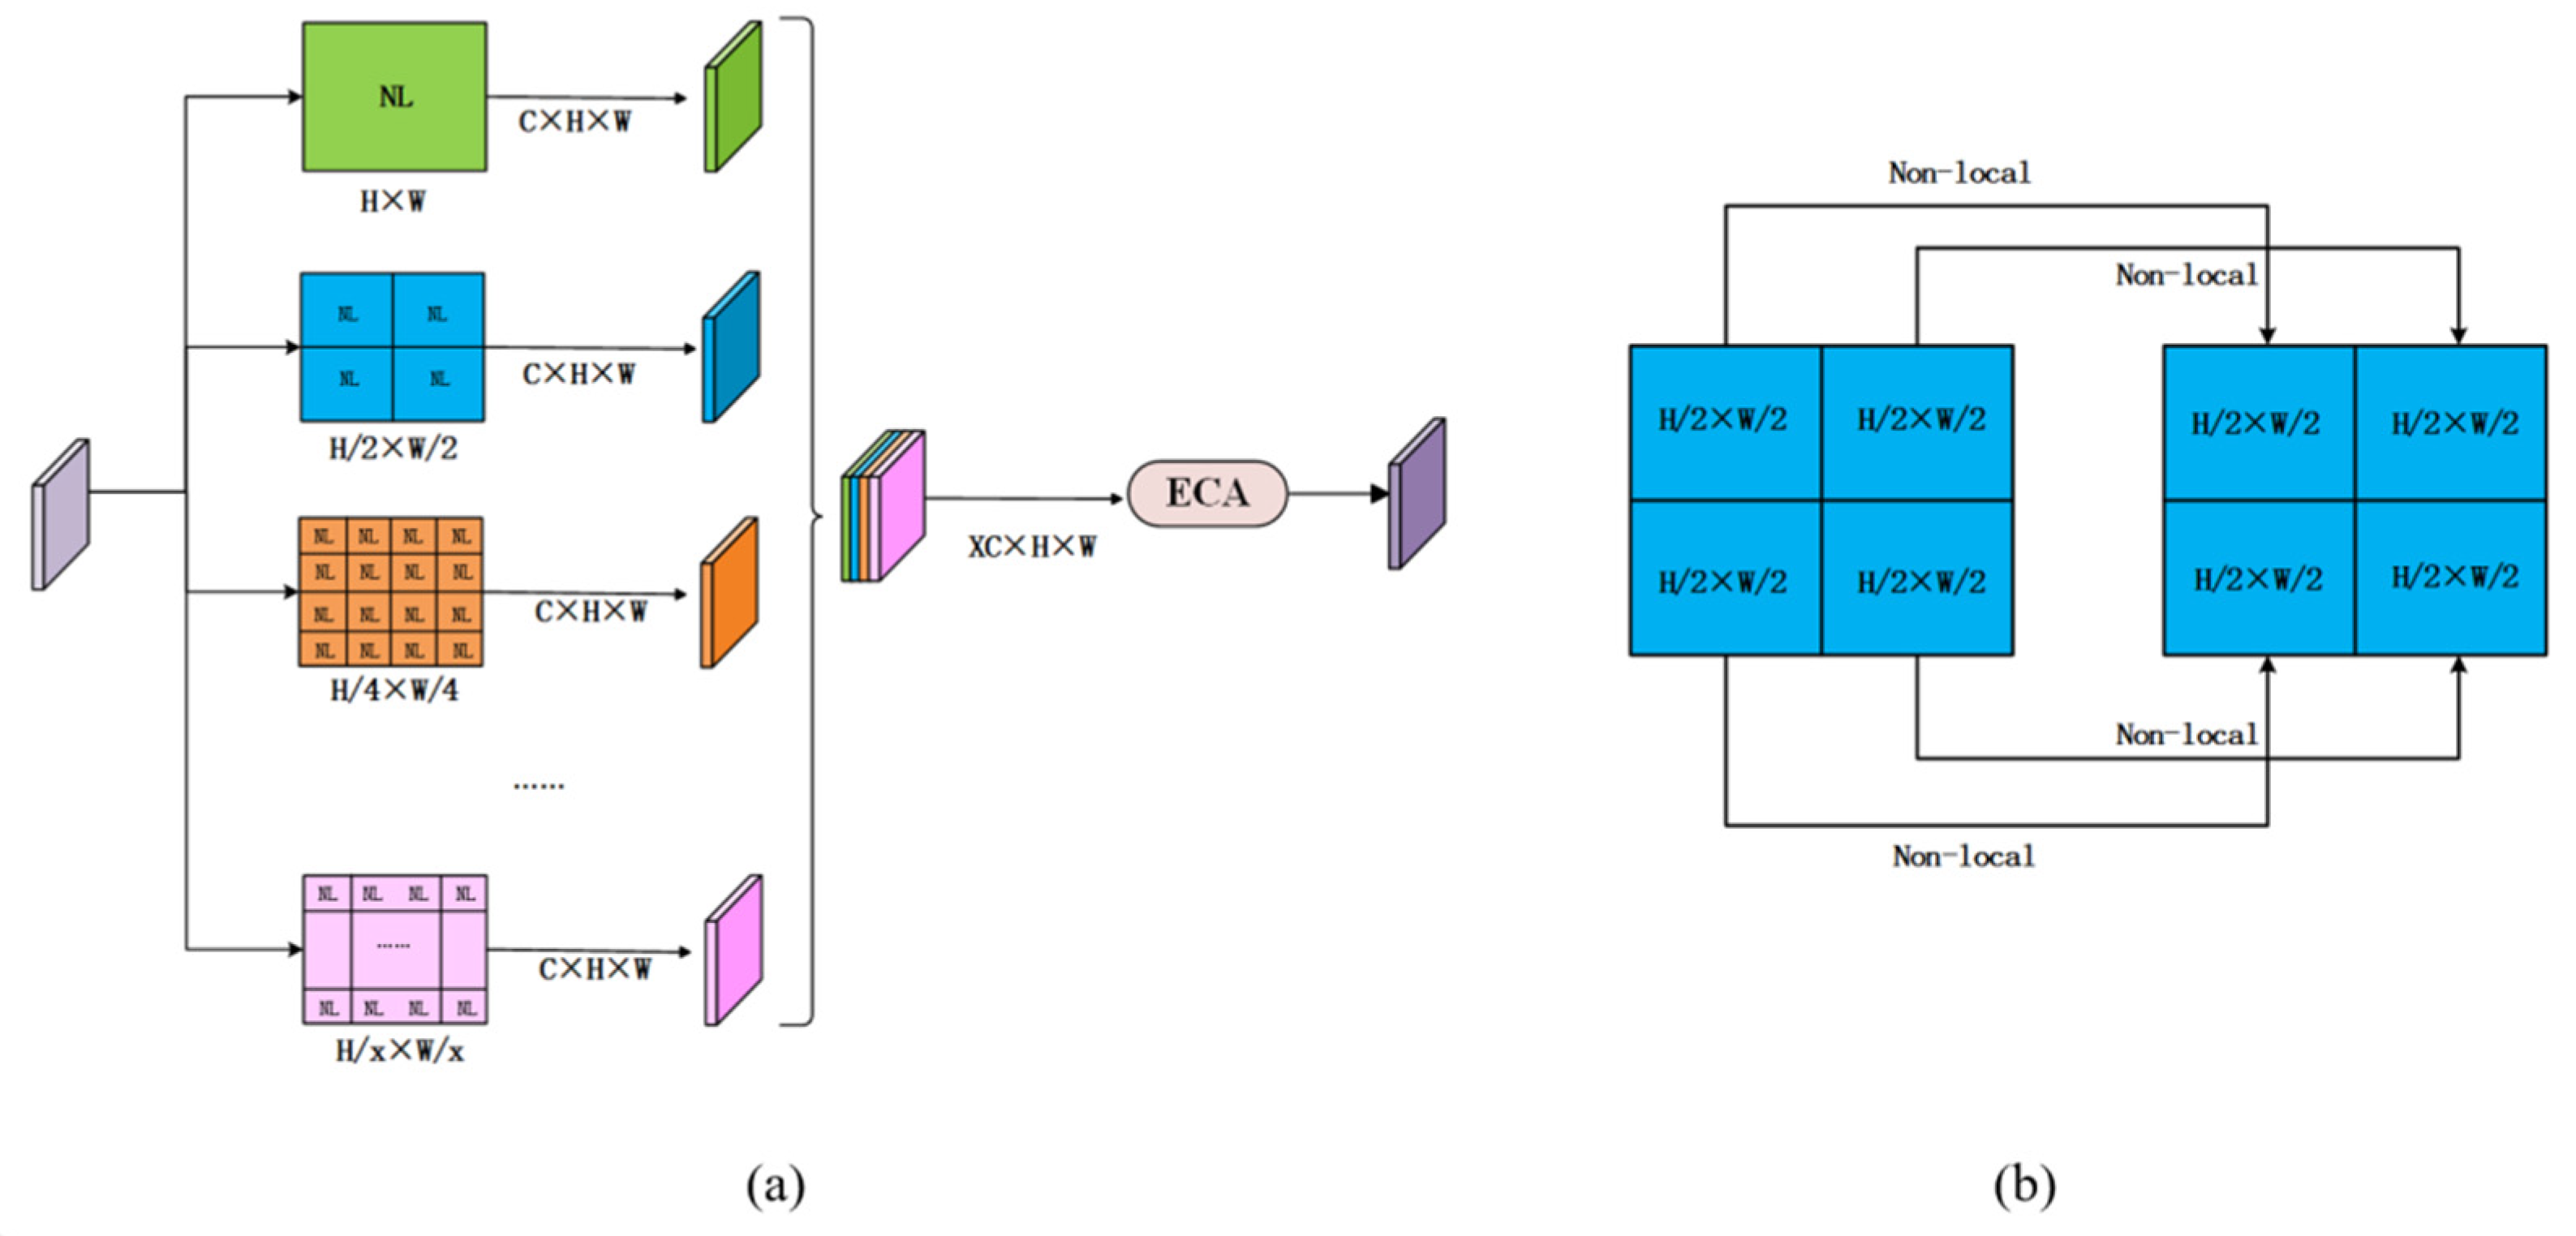
3.4. Improvement of ASPP Module

SAR images can collect data of different wavelengths and polarizations and contain more spectrum, texture, and other feature information for different ground objects. Therefore, this paper uses a pyramid pooling structure to divide the features of SAR images, but this dramatically increases the amount of data, increases the memory occupied by the network model, and prolongs the processing time of a single image. Therefore, this paper redesigns the residual unit of the backbone network and optimizes the ASPP module.
It has been proved that two-dimensional convolutions can be decomposed into a series of one-dimensional convolutions According to the literature [20], under the constraint that the relaxation rank of convolution layer is 1, the convolution layer fi can be rewritten as:
f i = K = 1 K σ k i v k i ( h ¯ k i ) T
The sum is a vector with the length of d and is a weight scale and K is the rank of fi. Based on this expression, Alvarez and Peterson proposed that each convolution layer can be decomposed into 1D convolution and a nonlinear operation. Under the condition that the input of the decomposition layer is a c 0 , the i-th output ail expression is:
a i l = ϕ ( b i h + l = 1 L h ¯ i l T [ ϕ ( b l v + c = 1 C v ¯ l c a c 0 ) ] )
where L is the number of convolution layers, ϕ (·) is ReLU. Replace the bottleneck unit of the backbone network with a 1D non-bottleneck unit at 3 × 3. With the same number of channels in the convolution input characteristic graph, 1D non-bottleneck units can reduce the parameters of non-bottleneck units by 33% and bottleneck units by 29% (If c is 3 × 3 Number of convolution output channels, then 3 × 3 Conventional convolution parameter value is w0 × 3 × 3 × c). The parameter quantity after 2D decomposition is w0 × 3 × 1 × c + w0 × 1 × 3 × c. After decomposition, the weight parameters can be reduced by about 33%.
Because 3 × 3 convolution will learn some redundant information, and the number of parameters is large, it will take a long time to train. Conventional convolution has been proven to compute much overlapping redundant information. According to the method shown in Figure 5, 3 × 3′s cavity convolution is decomposed into 3 by 2D × 1 and 1 × 3 to maintain its void ratio. The rate in the figure represents the step size. The convolution parameters of the improved ASPP module are 33% less than those of the conventional convolution, and the speed is 3 × 3. The convolution is fast, and essential semantic information can be extracted, effectively reducing the calculation of this module.

4. Results

This paper used the SAR image taken by the Sentinel 1 satellite in Nanjing and surrounding areas in Jiangsu Province, China, as the original data set, with an image resolution of 10 m. The data were obtained on 19 April, 2011, the corresponding optical image resolution was 5 m, and the acquisition time was April 2017. The reason for adopting this data set is that it is one of the few existing SAR image data sets that can perfectly correspond to the precise optical image, which is convenient for extracting the visual image feature information for the supplement. Secondly, compared with other SAR image data sets, this data set has more sample categories, and the differences between different types are more prominent, which is convenient for testing semantic segmentation tasks. In this paper, LabelMe labeling software was used to label SAR images, and then the labeled SAR images were cut into 256 × 256 small images. The marked SAR data set was subjected to data enhancement operations such as random rotation image, and finally, the whole data set was divided into a training set of one thousand eight hundred images and a verification set of two hundred images. Unlike the training set, the two hundred images in the validation set did not participate in learning the network model, but only tested the segmentation effect of the model after the model was trained and then calculated various indicators for verification. The two hundred pictures in the verification set were from different regions of the whole image, and the number of samples of different categories was equal.
This paper quantitatively measures network performance using pixel Dice Similarity Coefficient (DICE), intersection-over-union ( I o U ), mean intersection-over-union ( m I o U ), and global accuracy (GA), including:
D I C E ( P , T ) = P 1 T 1 ( P 1 + T 2 ) / 2
I o U c l s = n i i t i n i i + j k n j i
m I o U = 1 k i = 1 k n i i t i n i i + j = 1 k n j i
G A = i = 1 k n i i i = 1 k t i
P represents the true value and T represents the predicted value. t i represents the total number of pixels and i . k represents the number of categories of pixels. n i j represents the number of pixel categories and i is predicted to be in the category j . GA is a good way to show that the network training precision, I o U c l s , is also the appropriate punishment for the classification of network errors, and the two complement each other, while I o U c l s only represents the network’s prediction accuracy of a single pixel. In order to obtain a general evaluation of the overall evaluation results, the average of the m I o U is compared to the overall semantic segmentation accuracy of the network for all pixels.

4.1. Determination of CA Attention Mechanism

Although SE (Squeeze-and-Excitation) Block [16] has been widely used in recent years, it only considers measuring the importance of each channel by modeling channel relationships and ignoring location information, which is important for generating spatially selective attention maps. Later, the CBAM (Convolutional Block Attention Module) [17] attempted to utilize location information by reducing the channel dimensions of the input tensor and then using convolution to calculate spatial attention. GALA (Global-Local Attentive Latent Alignment) [27] extends this concept by designing advanced attention spans. In the GALA attention mechanism, the global attention mechanism is used to capture the global information and context of an image to better understand the overall meaning and semantics of the image. The ECA-Net (Efficient Channel Attention Network) [21] analyzed the side effects of dimensionality reduction in SE channel attention and proposed a local cross-channel interaction strategy without dimensionality reduction, effectively avoiding the impact of dimensionality reduction on channel attention learning effectiveness. The MS-FPN (Multi-scale Feature Pyramid Network) [28] adopted a pyramid structure to extract shallow and deep feature maps, adaptively learning and selecting important feature maps obtained from different scales, thereby improving detection and segmentation accuracy. However, none of the above methods effectively model the remote dependencies required for visual tasks. The CA attention mechanism not only considers the relationship between channels, but also considers the location information in the feature space. In order to prove the difference between the CA attention mechanism used in this article and other attention mechanisms in the original Deeplabv3+ network, we set up a comparative experiment in this section, and the experimental results are shown in Table 1.
In Table 1, the subscript cls0, cls1, cls2, cls3, cls4, cls5 represents the labels of different pixel categories in 5: {0: background (black)}, {1: river (red)}, {2: forest (green)}, {3: building (blue)}, {4: road (yellow)}. mIoUcls represents the average pixel intersection ratio result of five-pixel categories. From Table 1, we can see that the model with CA attention performs much better than the model using other attention and adds less training time. The red boxes indicate the areas where this method performs better than other methods. Experiments have verified the performance of the CA attention mechanism, proving that it can enhance and improve the performance of the model. In the following figure, we visualize the segmentation results generated by models using different attention methods, as shown in Figure 6. Obviously, CA attention is more helpful than other attention mechanisms in accurately dividing target boundaries.

4.2. FPPM Model Parameter Experimental Results

According to the image quality evaluation algorithm in Section 3.2, this section has been verified and calculated that when the number of branches X in the FPPM was taken as 3, the image quality decreased least, and was closest to the target pixel value of the original feature image, and the feature extraction effect was the best. In order to further verify the optimal value, a contrast experiment was set up after the ablation experiment. This section studied the influence of different branch numbers X on the prediction results of the model in this paper. Since X = 1 model is equivalent to direct feature extraction, which is meaningless for the FPPM model, this experiment set the value of X to start from 2, that is, X = 2, X = 3, X = 4, X = 5, X = 6. The results are shown in Table 2.
Table 2 shows that the network prediction results obtained under the three weighting coefficients are similar. When X = 3, the optimal value of m I o U c l s was obtained and the consumption duration increased the least. The global accuracy of the model decreased with the increase of X, and time consumption increased dramatically. When the number of branches exceeds three layers, the image information in the feature map will be enlarged excessively and the marked targets in the image will be divided into new targets that are difficult to recognize. In this way, new noise interference will be added to the segmentation, affecting the model segmentation effect. Therefore, the X value in this paper is verified. When the feature map was divided into pyramid levels in the FPPM model, the three-layer model segmentation was the best. The contrast effect is shown in Figure 6.
Figure 7 shows the results of SAR image processing by the FPPM model. The red boxes indicate the areas where this method performs better than other methods. From top to bottom, there are original SAR images, optical images, and output results with different values of X from 2 to 6. Figure 7 also shows that when the branch number X of FPPM model is 3, the image segmentation effect is the closest to the label, and the feature extraction effect is the best. In the segmentation process, after the third pyramid division, the image feature pixel value is close to the target pixel value, which is easy to divide, and the image quality has not decreased significantly, so the segmentation effect is more refined than other control groups.

4.3. Ablation Experiment

In this section, ablation experiments were carried out on some of the improvements proposed in this paper and the experimental results proved its effectiveness. First, to verify the effectiveness of the CA attention mechanism module, the Deeplabv3+ model, equipped with the CA module, was compared with the original model through experiments. It was verified through the analysis of experimental results. Then, in order to prove the applicability of the focal loss function, a comparative experiment was carried out with the Deeplabv3+ model based on the cross-entropy loss function. The experimental results show that the focal loss function can significantly improve the segmentation effect compared with the cross-entropy loss function in data set segmentation with uneven samples. Secondly, the influence of the improved ASPP module proposed in this paper on the performance of the Deeplabv3+ model is compared and based on the above improvements, the effectiveness of the FPPM proposed in this paper on SAR image semantic segmentation is further verified.
In the Table 3, we have listed all the changes to the Deeplabv3+ network. ‘✓’ indicates that the experimental group in this row has used the method represented by this column, and the blank indicates that the experimental group in this row has not used the method represented by this column.
Figure 8 shows the results of SAR image processing by the model. The red boxes indicate the areas where this method performs better than other methods. From top to bottom, there are original SAR images, optical images, tag images, and the output results of the first five groups of ablation experiments. The experimental results show that the focal loss function and CA module are helpful for the processing tasks of Deeplabv3+ network, and improving the ASPP module is also helpful for improving the processing speed of the model.

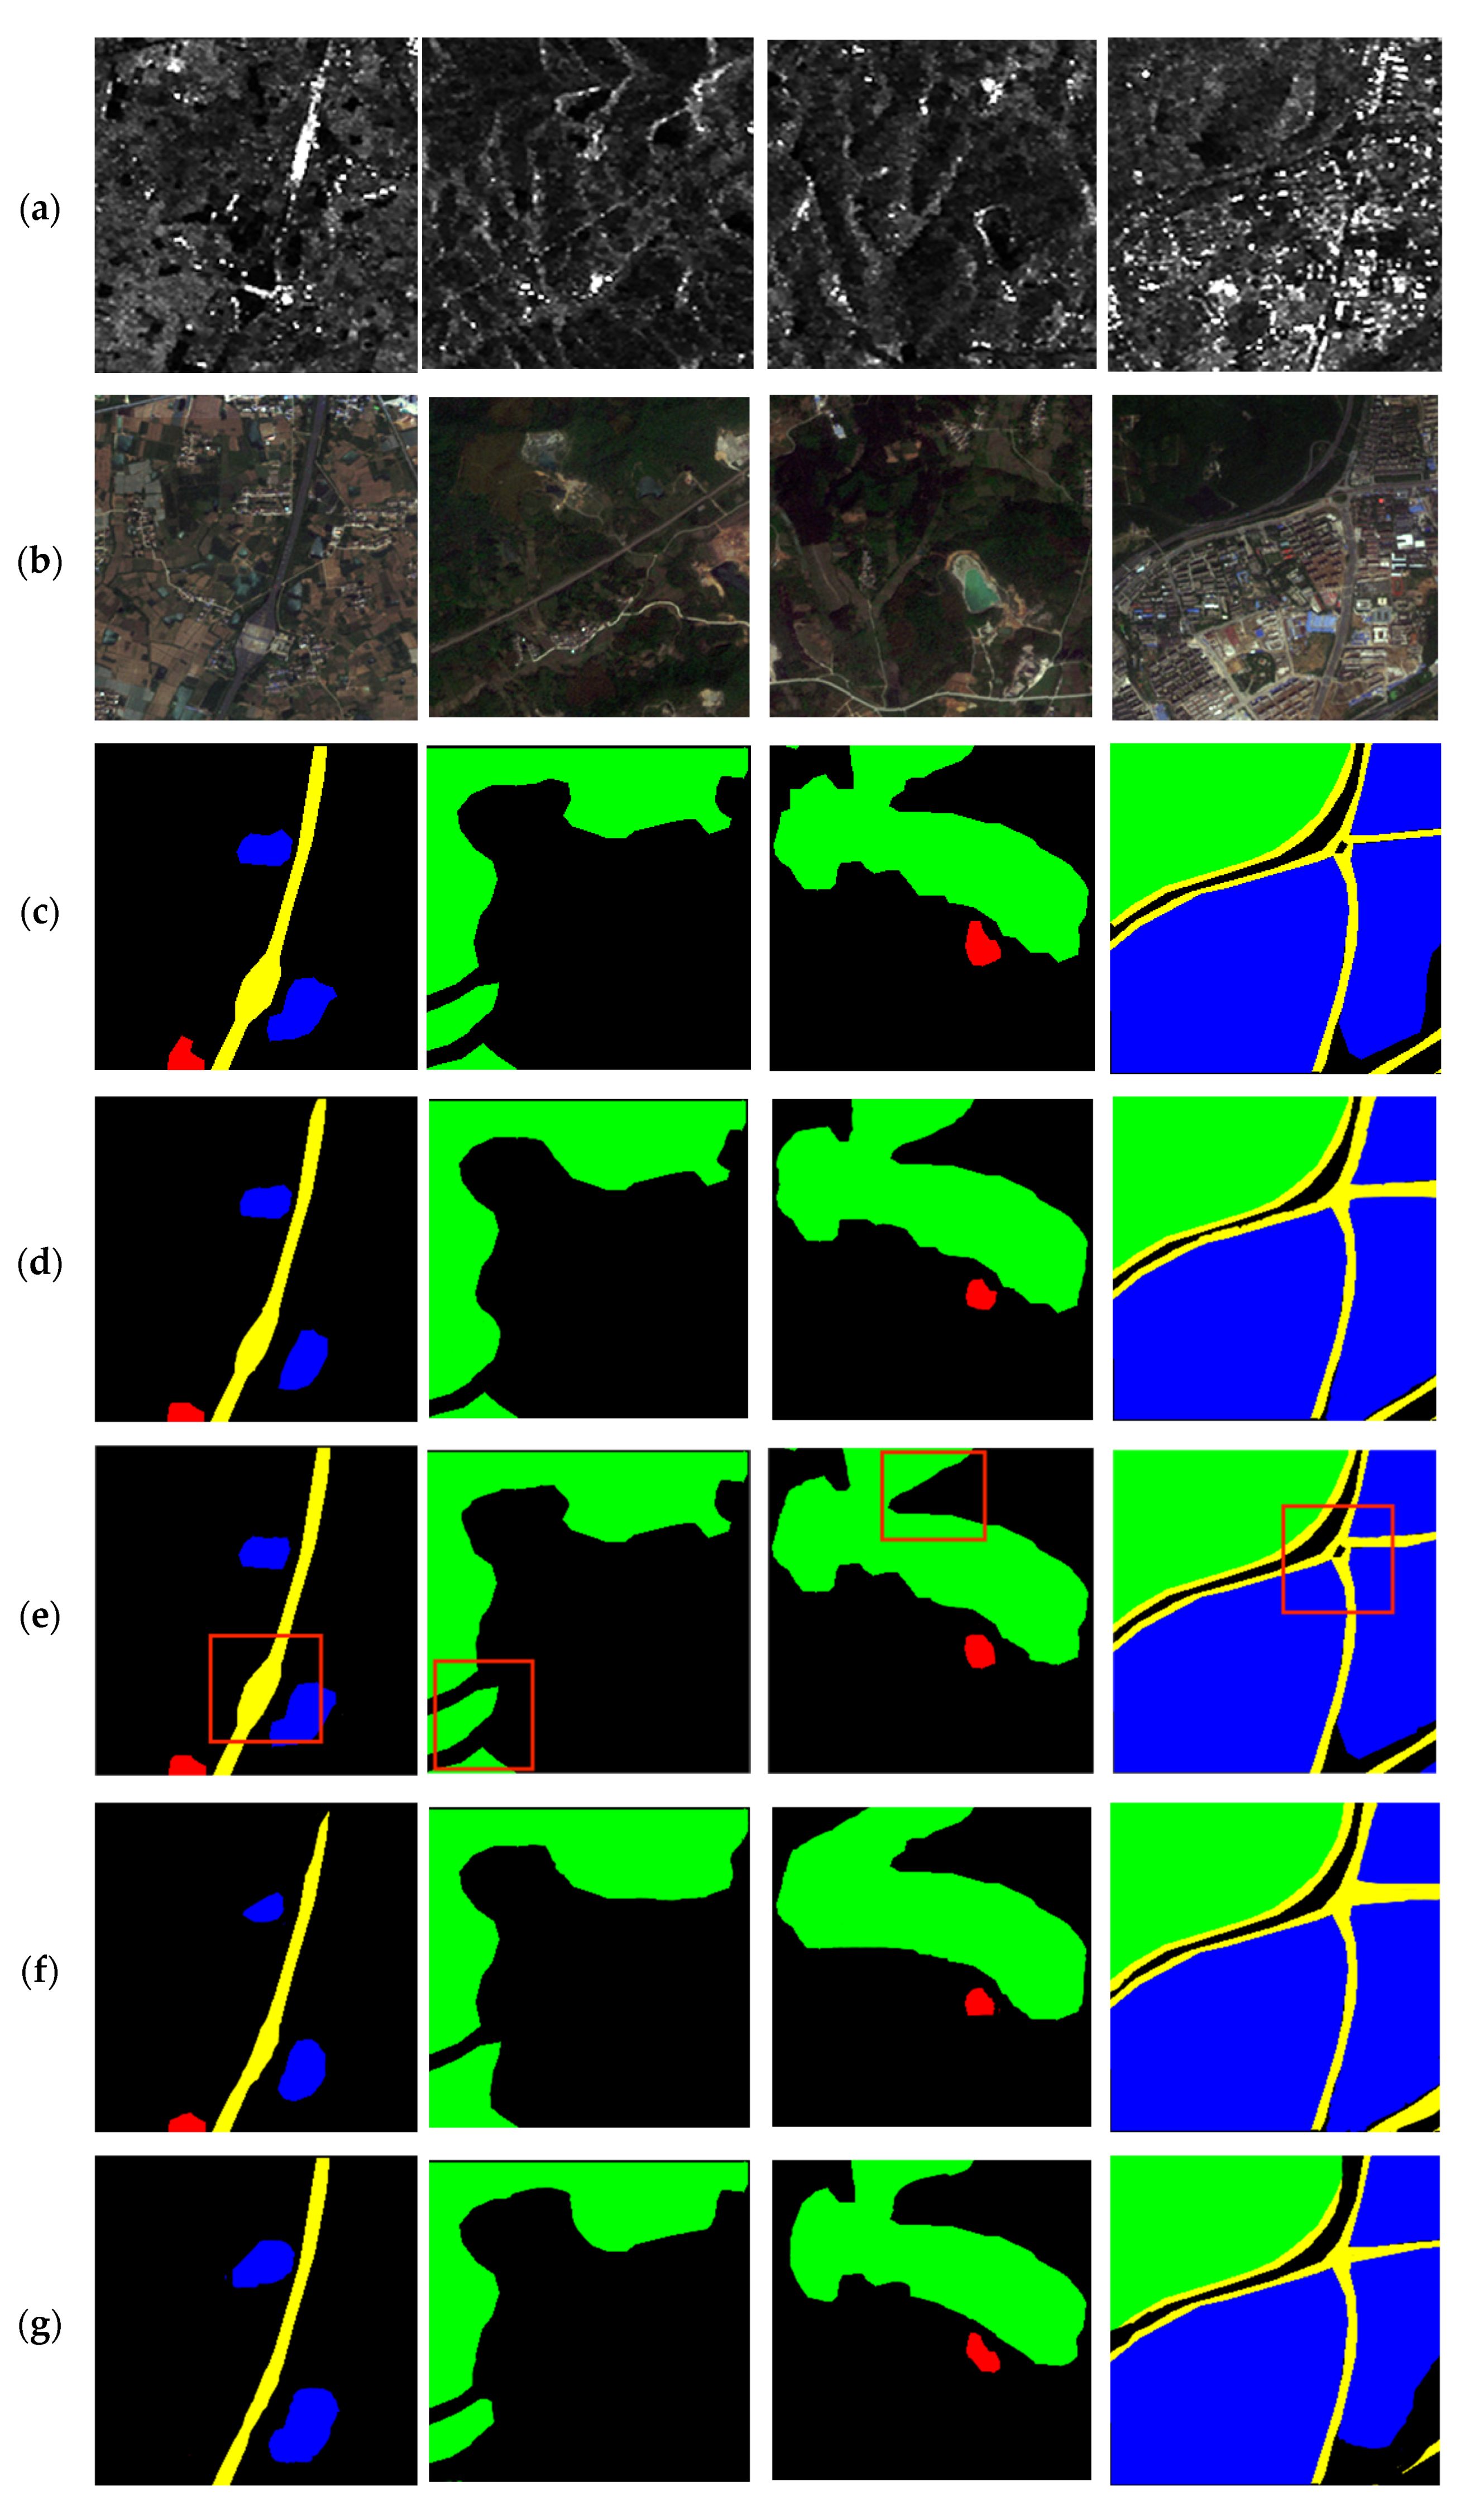
4.4. Results Comparison on Composite Images

To show the performance of the improved Deeplabv3+ model, the effect of the model on synthetic data is evaluated first. This section uses the model to process the composite data by adding noise to the label image as the input image. This paper uses two traditional shallow image segmentation algorithm models: the adaptive threshold method and the maximum inter-class variance method (OSTU algorithm). At the same time, four methods based on depth learning algorithm are used: FCN, PSPNet, Deeplabv3+, and the improved Deeplabv3+ in this paper, and the segmentation results of the above six methods on synthetic images are compared. Finally, the output results of FCN, PSPNet, Deeplabv3+ and the improved Deeplabv3+ are compared with the original label graph, and the results are shown in Table 4.
Table 4 shows that compared with the traditional shallow method, the deep learning method has higher segmentation accuracy. From the traditional method to the deep learning method, SAR image semantic segmentation accuracy has made significant progress, increasing by more than 30%. In the range of deep learning, the accuracy and mIoUcls of the improved Deeplabv3+ network model in this paper have been improved to some extent compared with other previous algorithms. Compared with the original Deeplabv3+ network, the accuracy has been improved by 2.44%, and the IoUcls4 has been improved by nearly 5%. Figure 9 shows the results of the model after processing the composite image. From top to bottom are the original SAR image, optical image, composite image, tag image, adaptive threshold method result, OSTU algorithm result, FCN network result, PSPNet network result, Deeplabv3+ network result, and the result of the improved network model in this paper. It can be seen from the area marked by the red box in Figure 9 that after the improvement of the Deeplabv3+ network model, the model has more accurate image segmentation, greatly improved recognition ability of small targets, more accurate recognition of the shape and contour of the target, and transparent edges and corners can be achieved for the segmentation of irregular targets. The background areas between different targets have been clear. It can be seen that the SAR image semantic segmentation model based on the improved Deeplabv3+ network proposed in this paper can achieve a better semantic segmentation effect in the processing of composite images.

4.5. Results on SAR Images

In order to verify that the improved Deeplabv3+ model proposed in this paper can improve the segmentation effect of SAR images, this section used the SAR images of Nanjing and its surrounding areas, and carried out experiments on two traditional shallow image segmentation algorithm models: adaptive threshold method and maximum inter-class variance method (OSTU algorithm). At the same time, four methods based on deep learning algorithm were used: FCN, PSPNet Deeplabv3+ and the improved Deeplabv3+ models in this paper have carried out semantic segmentation experiments. Finally, the SAR image segmentation results of the above six methods were compared, and the results are shown in Table 5.
As can be seen from Table 5, first of all, the segmentation accuracy of the deep learning method is higher than that of the traditional algorithm, which has improved by more than 40%, and will not cause label errors. Secondly, within the scope of deep learning algorithm, Deeplabv3+ network is significantly better than other networks in SAR image semantic segmentation and has dramatically improved accuracy and time consumption. The improved Deeplabv3+ network in this paper has higher accuracy, which is 2.09% higher than the original Deeplabv3+ network. This is because the focal loss function used in this paper has improved the backbone function of the network, reducing the impact of sample imbalance. The FPPM is used to post-process the feature map output from the network and the feature map generated by the previous network is filtered hierarchically to obtain better fine image features. The results of several network models are shown in Figure 10. The red boxes indicate the areas where this method performs better than other methods. From top to bottom, they are SAR images, optical images, label images, adaptive threshold method results, OSTU algorithm results, FCN network results, PSPNet network results, Deeplabv3+ network results, and the results of the methods proposed in this paper. It can be seen from Figure 10 that the SAR image semantic segmentation model based on the improved Deeplabv3+ network proposed in this paper is closer to the actual tag image in SAR image processing results, which further proves the effectiveness of this method in improving the SAR image semantic segmentation effect.
In recent years, many experts and scholars at home and abroad have tried to improve the image semantic segmentation network to achieve better results in the SAR image semantic segmentation task. Many of these improved methods have made good progress, such as the Lightweight Attention Model proposed by FU Guodong [29], the CG-Net model proposed by Sun Y [30] and so on. Compared with these methods, the improved method proposed in this paper has more novel technology in feature information expansion and can fully use data feature information. The CBAM-Unet++ method presented by Zhao Z [31] in 2021 combines Unet++and convolution block attention module based on the original CBAM, which makes it easier for the architecture to ignore irrelevant background information, and adds the original feature map and channel attention output to the spatial attention network, thus improving the accuracy of image segmentation. However, this method is only a simple superposition of feature attention mechanism; without multi-dimensional aggregation of multiple attention mechanisms, only shallow indication features can be extracted and cannot be used in complex sample segmentation tasks with small sample sizes. In this paper, the pyramid idea is first proposed to be used in the attention mechanism module to post-process the feature map and comprehensively capture the image feature information, which can also improve the segmentation effect in the case of limited data. From the view of the ability of feature extraction, the change of loss function, and the efficiency of the ASPP model, the improved method of Deeplabv3+ network proposed in this paper is more practical. The above three experiments prove that the model presented in this paper has the best effect compared with other models.

5. Conclusions

As one of the main data sources of a satellite remote sensing platform, SAR is widely used in geological exploration and other fields because its imaging is not affected by climate and other conditions. As the imaging result of SAR, SAR image processing effect is of great significance in urban construction control, surface vegetation classification and other aspects. However, due to the multiplicative speckle noise in the SAR image, it is more difficult to accurately identify than the optical image, so using the existing network model for optical image segmentation is not satisfactory. Moreover, the SAR image imaging technology is relatively cumbersome and there is little data available for training. The existing network model needs to be improved in order to achieve better segmentation accuracy. Focusing on the Deeplabv3+ network, this paper deeply studies the SAR image semantic segmentation technology and proposes a network model suitable for SAR image semantic segmentation with good performance. The main work completed is as follows:
(1) Feature Post-Processing Module: Aiming at the problem that there is multiplicative speckle noise in the SAR image, which makes some slender targets such as roads and rivers in the polarimetric SAR image challenging to be accurately identified during semantic segmentation, this paper proposes a Feature Post-Processing Module (FPPM), as a supplement to the original Deeplabv3+ network feature extraction module, to capture the image feature map in-depth and refined, and then send the folded feature map into different branches in turn, undertake the feature and channel attention mechanism, and complete the deep capture of local information on the feature map. This paper also determines the number of branches of the FPPM through the MVG model based on the image quality evaluation algorithm and improves the model structure. Compared with the original Deeplabv3+ network, the mIoUcls improves by 3.63% and the segmentation accuracy improves by 1.09%.
(2) Improvement of loss function: The SAR image imaging technology is complicated and the data processing is complex. Therefore, the SAR image data set that can be used in the segmentation field is limited and the distribution of feature labels in most data sets is highly uneven, which significantly impacts the segmentation effect. To solve this problem, this paper uses the unbalanced sample focal loss function to optimize the original Deeplabv3+ network and improves the model performance degradation caused by the uneven data set. By adjusting the internal weighting of the loss function, the training times of simple category samples are reduced and the mIoUcls is increased by 1.01%.
(3) Improvement of ASPP module: Because the convolution method of the ASPP model in the original Deeplabv3+ network is too simple and direct, it can lead to the overlapping of the information learned in the convolution layer, bringing a large number of redundant parameters, and can increase unnecessary time for model training. Aiming at this problem, this paper decomposes the ASPP model in 2D and decomposes the convolution layer into 3 × 1 and 1 × 3. The parallel stacking of convolution can not only keep the void ratio of the model unchanged but can also reduce the number of parameters by about 33% and the model’s training time by 19 ms.
To sum up, the improved Deeplabv3+ network model proposed in this paper has achieved good results in the SAR image semantic segmentation task, improving the segmentation accuracy of the original model by 1.09% and the mIoUcls by 4.64%. However, due to the use of the pre-training model for training, this module is currently only optimized for the feature map extracted from the previous network. Whether the attention mechanism module can be added to the backbone network of the Deeplabv3+ model in the future, and whether the attention module can be added to the overall network to achieve the goal of re-optimizing network performance while ensuring that the network does not fit, is worth further exploration in the future.

Author Contributions

Conceptualization, Y.K. and Q.L.; methodology, Q.L.; validation, Y.K. and Q.L.; formal analysis, Y.K.; investigation, Q.L.; writing—review and editing, Q.L.; supervision, Y.K.; funding acquisition, Y.K. All authors have read and agreed to the published version of the manuscript.

Funding

This research was funded by National Natural Science Foundation of China (No. 61501228, No. 62171220); Aeronautical Science Foundation of China (No. 20152052029, No. 20182052012); National Science and Technology Major Project (2017-II-0001-0001); Program of Remote Sensing Intelligent Monitoring and Emergency Services for Regional Security Elements.

Institutional Review Board Statement

Not applicable.

Informed Consent Statement

Not applicable.

Data Availability Statement

The data presented in this study are available on request from the corresponding author. The data are not publicly available due to [this data is also used for other experimental studies and cannot be made public].

Conflicts of Interest

The authors declare no conflict of interest.

References

  1. Long, J.; Shelhamer, E.; Darrell, T. Fully convolutional networks for semantic segmentation. In Proceedings of the IEEE Conference on Computer Vision and Pattern Recognition, Boston, MA, USA, 7–12 June 2015; IEEE: Piscataway, NJ, USA, 2015; pp. 3431–3440. [Google Scholar]
  2. Ronneberger, O.; Fischer, P.; Brox, T. U-net: Convolutional networks for biomedical image segmentation. In Proceedings of the International Conference on Medical Image Computing and Computer-Assisted Intervention, Munich, Germany, 5–9 October 2015; Springer: Cham, Switzerland, 2015; pp. 234–241. [Google Scholar]
  3. Marmanis, D.; Schindler, K.; Wegner, J.D.; Galliani, S.; Datcu, M.; Stilla, U. Classification with an edge: Improving semantic image segmentation with boundary detection. ISPRS J. Photogramm. Remote Sens. 2018, 135, 158–172. [Google Scholar] [CrossRef]
  4. Zhao, H.; Shi, J.; Qi, X.; Wang, X.; Jia, J. Pyramid scene parsing network. In Proceedings of the IEEE Conference on Computer Vision and Pattern Recognition, Honolulu, HI, USA, 21–26 July 2017; pp. 2881–2890. [Google Scholar]
  5. Badrinarayanan, V.; Kendall, A.; Cipolla, R. Segnet: A deep convolutional encoder-decoder architecture for image segmentation. IEEE Trans. Pattern Anal. Mach. Intell. 2017, 39, 2481–2495. [Google Scholar] [CrossRef]
  6. Lin, G.; Milan, A.; Shen, C.; Reid, I. Refinenet: Multi-path refinement networks for high-resolution semantic segmentation. In Proceedings of the IEEE Conference on Computer Vision and Pattern Recognition, Honolulu, HI, USA, 21–26 July 2017; pp. 1925–1934. [Google Scholar]
  7. Yu, H.; Zhang, X.; Wang, S.; Hou, B. Context-based hierarchical unequal merging for SAR image segmentation. IEEE Trans. Geosci. Remote Sens. 2013, 51, 995–1009. [Google Scholar] [CrossRef]
  8. Zhang, Z.J.; Shui, P.L. SAR images segmentation algorithm based on region merging using edge information. Xi Tong Gong Cheng Yu Dian Zi Ji Shu/Syst. Eng. Electron. 2014, 36, 1948–1954. [Google Scholar]
  9. Krähenbühl, P.; Koltun, V. Efficient inference in fully connected crfs with gaussian edge potentials. In Proceedings of the Advances in Neural Information Processing Systems, Granada, Spain, 12–15 December 2011; pp. 109–117. [Google Scholar]
  10. Teichmann, M.; Cipolla, R. Convolutional CRFs for Semantic Segmentation. arXiv 2018, arXiv:1805.04777. [Google Scholar]
  11. Chen, L.C.; Papandreou, G.; Kokkinos, I.; Kokkinos, I.; Murphy, K.; Yuille, A.L. Semantic Image Segmentation with Deep Convolutional Nets and Fully Connected CRFs. Comput. Sci. 2014, 40, 357–361. [Google Scholar]
  12. Chen, L.-C.; Papandreou, G.; Kokkinos, I.; Murphy, K.; Yuille, A.L. DeepLab: Semantic Image Segmentation with Deep Convolutional Nets, Atrous Convolution, and Fully Connected CRFs. IEEE Trans. Pattern Anal. Mach. Intell. 2018, 40, 834–848. [Google Scholar] [CrossRef] [PubMed]
  13. Chen, L.C.; Papandreou, G.; Schroff, F.; Adam, H. Rethinking Atrous Convolution for Semantic Image Segmentation. arXiv 2017, arXiv:1706.05587. [Google Scholar]
  14. Chen, L.C.; Zhu, Y.; Papandreou, G.; Schroff, F.; Adam, H. Encoder-decoder with atrous separable convolution for semantic image segmentation. In Proceedings of the European Conference on Computer Vision (ECCV), Munich, Germany, 8–14 September 2018; pp. 801–818. [Google Scholar]
  15. Fu, J.; Liu, J.; Tian, H.; Li, Y.; Bao, Y.; Fang, Z.; Lu, H. Dual attention network for scene segmentation. In Proceedings of the IEEE Conference on Computer Vision and Pattern Recognition, Long Beach, CA, USA, 16–17 June 2019; pp. 3146–3154. [Google Scholar]
  16. Hu, J.; Shen, L.; Sun, G. Squeeze-and-excitation networks. In Proceedings of the IEEE Conference on Computer Vision and Pattern Recognition, Salt Lake City, UT, USA, 18–23 June 2018; IEEE: Piscataway, NJ, USA, 2018; pp. 7132–7141. [Google Scholar]
  17. Woo, S.; Park, J.; Lee, J.-Y.; Kweon, I.S. Cbam: Convolutional block attention module. In Proceedings of the European Conference on Computer Vision (ECCV), Munich, Germany, 8–14 September 2018; pp. 3–19. [Google Scholar]
  18. Wang, Q.; Wu, B.; Zhu, P.; Li, P.; Zuo, W.; Hu, Q. ECA-Net: Efficient Channel Attention for Deep Convolutional Neural Networks. In Proceedings of the 2020 IEEE/CVF Conference on Computer Vision and Pattern Recognition (CVPR), Seattle, WA, USA, 13–19 June 2020; IEEE: Piscataway, NJ, USA, 2020. [Google Scholar]
  19. Lin, T.-Y.; Goyal, P.; Girshick, R.; He, K.; Dollár, P. Focal Loss for Dense Object Detection. In Proceedings of the IEEE Transactions on Pattern Analysis and Machine Intelligence, Venice, Italy, 7 August 2017; pp. 2999–3007. [Google Scholar]
  20. Alvarez, J.; Petersson, L. DecomposeMe: Simplifying ConvNets for end-to-end learning. arXiv 2016, arXiv:1606.05426. [Google Scholar]
  21. Wang, B. Research on Digital Image Scaling and Its Quality Evaluation Method; Harbin Engineering University: Harbin, China, 2015. [Google Scholar]
  22. Wang, Z.; Simoncelli, E.P.; Bovik, A.C. Multiscale structural similarity for image quality assessment. In Proceedings of the Conference Record of the Thirty-Seventh Asilomar Conference on Signals, Systems and Computers, Asilomar, Pacific Grove, CA, USA, 9–12 November 2003; Volume 2, pp. 1398–1402. [Google Scholar]
  23. Brooks, A.C.; Zhao, X.; Pappas, T.N. Structural similarity quality metrics in a coding context: Exploring the space of realistic distortions. IEEE Trans. Image Process. 2008, 17, 1261–1273. [Google Scholar] [CrossRef] [PubMed]
  24. Sampat, M.P.; Wang, Z.; Gupta, S.; Bovik, A.C.; Markey, M.K. Complex wavelet structural similarity: A new image similarity index. IEEE Trans. Image Process. 2009, 18, 2385–2401. [Google Scholar] [CrossRef] [PubMed]
  25. Li, C.; Bovik, A.C. Three-component weighted structural similarity index. In Proceedings of the IS&T/SPIE Electronic Imaging, San Jose, CA, USA, 18–22 October 2008; International Society for Optics and Photonics: San Jose, CA, USA, 2009; pp. 72420Q–72420Q-9. [Google Scholar]
  26. Li, C.; Bovik, A.C. Content-partitioned structural similarity index for image quality assessment. Signal Process. Image Commun. 2010, 25, 517–526. [Google Scholar] [CrossRef]
  27. Linsley, D.; Dan, S.; Eberhardt, S.; Serre, T. Learning what and where to attend. In Proceedings of the International Conference on Learning Representations, Vancouver, BC, Canada, 30 April–3 May 2018. [Google Scholar]
  28. Sun, Z.; Meng, C.; Cheng, J.; Zhang, Z.; Chang, S. A Multi-Scale Feature Pyramid Network for Detection and Instance Segmentation of Marine Ships in SAR Images. Remote Sens. 2022, 14, 6312. [Google Scholar] [CrossRef]
  29. Fu, G.; Huang, J.; Yang, T.; Zheng, S. Improved Lightweight Attention Model Based on CBAM. Comput. Eng. Appl. 2021, 57, 150–156. [Google Scholar]
  30. Sun, Y.; Hua, Y.; Mou, L.; Zhu, X.X. CG-Net: Conditional GIS-Aware Network for Individual Building Segmentation in VHR SAR Images. IEEE Trans. Geosci. Remote Sens. 2022, 60, 1–15. [Google Scholar] [CrossRef]
  31. Zhao, Z.; Chen, K.; Yamane, S. CBAM-Unet++:easier to find the target with the attention module “CBAM”. In Proceedings of the 2021 IEEE 10th Global Conference on Consumer Electronics (GCCE), Kyoto, Japan, 12–15 October 2021. [Google Scholar]
Figure 1. Schematic diagram of the improved Deeplabv3+ model.
Remotesensing 15 02153 g001
Figure 2. Schematic diagram of Feature Post-Processing Model: (a) detailed architecture of FPPM, (b) detailed operations on a single block.
Remotesensing 15 02153 g002
Figure 3. Diagram of ECA Module.
Remotesensing 15 02153 g003
Figure 4. Weight loss function change figure.
Remotesensing 15 02153 g004
Figure 5. Schematic diagram of improved ASPP model.
Remotesensing 15 02153 g005
Figure 6. Comparative figure of improvement effects of different attention mechanisms: (a) SAR image, (b) optical image, (c) tag image, (d) Deeplabv3+, (e) +SE, (f) +GALA, (g) +CBAM, (h) +ECA-Net, (i) +MS-FPN, (j) +CA.
Remotesensing 15 02153 g006aRemotesensing 15 02153 g006b
Figure 7. Model prediction results: (a) SAR image, (b) optical image, (c) tag image, (d) X = 2, (e) X = 3, (f) X = 4, (g) X = 5, (h) X = 6.
Remotesensing 15 02153 g007aRemotesensing 15 02153 g007b
Figure 8. Model prediction results: (a) SAR image, (b) optical image, (c) tag image, (d) No. 1, (e) No. 2, (f) No. 3, (g) No. 4, (h) No. 5.
Remotesensing 15 02153 g008aRemotesensing 15 02153 g008b
Figure 9. Model prediction results: (a) SAR images, (b) optical images, (c) composite data, (d) tag images, (e) adaptive threshold results, (f) OSTU results, (g) FCN network results, (h) PSPNet network results, (i) Deeplabv3+ network results, (j) our method results.
Remotesensing 15 02153 g009aRemotesensing 15 02153 g009b
Figure 10. Model prediction results: (a) SAR image, (b) optical image, (c) label image, (d) adaptive threshold results, (e) OSTU results, (f) FCN network results, (g) PSPNet network results, (h) Deeplabv3+ network results, (i) method results in this paper.
Remotesensing 15 02153 g010aRemotesensing 15 02153 g010b
Table 1. Comparison of improvement effects of different attention mechanisms.
DICE G A V a l I o U c l s 0 I o U c l s 1 I o U c l s 2 I o U c l s 3 I o U c l s 4 m I o U c l s Time[ms]
Deeplabv3+0.7988.16%96.95%90.69%95.20%93.33%54.25%85.69%28
+SE0.8188.22%96.99%90.79%95.49%93.60%54.88%85.91%37
+GALA0.8188.34%97.03%90.97%95.86%93.79%54.97%86.07%46
+CBAM0.8389.03%97.09%91.40%96.34%94.03%55.38%86.11%59
+ECA-Net0.8388.41%97.10%91.48%96.46%94.06%55.75%86.12%30
+MS-FPN0.8388.52%97.09%91.55%96.68%93.88%56.17%86.05%47
+CA0.8588.79%97.11%91.64%96.90%94.21%56.87%86.20%35
Table 2. The global accuracy rate and cross merge ratio index of the model under different X.
DICE G A V a l I o U c l s 0 I o U c l s 1 I o U c l s 2 I o U c l s 3 I o U c l s 4 m I o U c l s
X = 20.5589.60%96.58%92.39%95.99%89.67%48.33%85.45%
X = 30.7390.25%97.66%93.50%97.39%94.22%58.78%90.33%
X = 40.6389.15%96.17%92.92%95.77%88.85%42.60%84.13%
X = 50.4688.60%95.89%91.85%94.69%88.36%41.65%83.47%
X = 60.4188.05%95.63%91.30%94.09%87.26%37.08%82.27%
Table 3. Analysis of Deeplabv3+ model ablation experiment.
No.Deeplabv3+CAFocal-LossImproved ASPPFPPM m I o U c l s Time[ms]
1 85.69%28
2 86.20%35
3 87.50%35
4 88.82%20
590.33%37
Table 4. Results of six models on composite images.
MethodsDICE A c c u r a c y I o U c l s 0 I o U c l s 1 I o U c l s 2 I o U c l s 3 I o U c l s 4 m I o U c l s Time[ms]
adaptive threshold0.4943.95%50.36%42.58%48.15%45.17%25.66%40.66%789
OSTU0.5250.67%55.69%50.45%54.67%50.14%22.68%47.82%541
FCN0.6180.12%94.82%88.06%94.93%91.27%13.62%78.22%71
PSPNet0.6782.14%95.81%89.22%95.01%92.00%32.58%79.69%356
Deeplabv3+0.7187.66%96.03%90.01%94.80%92.56%52.70%84.90%36
Improved Deeplabv3+0.7790.10%96.60%90.60%96.98%94.10%57.77%90.14%40
Table 5. Results of six models on SAR images.
MethodsDICE A c c u r a c y I o U c l s 0 I o U c l s 1 I o U c l s 2 I o U c l s 3 I o U c l s 4 m I o U c l s Time[ms]
adaptive threshold0.5040.22%48.33%40.74%39.85%41.09%44.52%35.62%669
OSTU0.5943.85%47.19%45.61%50.21%47.51%20.36%41.83%580
FCN0.7380.51%95.61%89.36%95.15%92.88%14.20%78.60%63
PSPNet0.7783.57%96.31%90.12%96.62%93.10%35.45%80.30%332
Deeplabv3+0.7988.16%96.95%90.69%95.20%93.33%54.25%85.69%28
Improved Deeplabv3+0.8390.25%97.66%93.50%97.39%94.22%58.78%90.33%38
Disclaimer/Publisher’s Note: The statements, opinions and data contained in all publications are solely those of the individual author(s) and contributor(s) and not of MDPI and/or the editor(s). MDPI and/or the editor(s) disclaim responsibility for any injury to people or property resulting from any ideas, methods, instructions or products referred to in the content.

