Article

Effects of Directional Wave Spectra on the Modeling of Ocean Radar Backscatter at Various Azimuth Angles by a Modified Two-Scale Method

1
College of Oceanography and Space Informatics, China University of Petroleum, Qingdao 266580, China
2
Technology Innovation Center for Ocean Telemetry, Ministry of Natural Resources, Qingdao 266061, China
3
First Institute of Oceanography, Ministry of Natural Resources, Qingdao 266061, China
*
Author to whom correspondence should be addressed.
Remote Sens. 2023, 15(8), 2191; https://doi.org/10.3390/rs15082191
Submission received: 4 February 2023 / Revised: 11 April 2023 / Accepted: 17 April 2023 / Published: 20 April 2023
(This article belongs to the Section Ocean Remote Sensing)

Abstract

:
Knowledge of the ocean backscatter at various azimuth angles is critical to the radar detection of the ocean environment. In this study, the modified two-scale model (TSM), which introduces a correction term in the conventional TSM, is improved based on the empirical model, CMOD5.n. Then, the influences of different directional wave spectra on the prediction of azimuthal behavior of ocean radar backscatter are investigated by comparing the simulated results with CMOD5.n and the Advanced Scatterometer (ASCAT) measurements. The results show that the overall performance of the single spectra of D, A, E, and H18 and the composite spectra of AH18 and AEH18 in predicting ocean backscatter are different at different wind speeds and incidence angles. Generally, the AH18 spectrum has better performance at low and moderate wind speeds, while the A spectrum works better at high wind speed. Nevertheless, the wave spectra have little effect on the prediction of the azimuthal fluctuation of scattering, which is highly dependent on the directional spreading function. The relative patterns of azimuthal undulation produced by different spreading functions are rather different at different wind speeds, but similar under different incidence angles. The Gaussian spreading function generally has better performance in predicting the azimuthal fluctuation of scattering.

1. Introduction

The theoretical study of electromagnetic scattering from the ocean surface is important for the geophysical interpretation of microwave remote sensing data to retrieve information on ocean surface winds, waves, currents, and so on. Over the past decades, numerous attempts have been made to describe the physical process involved in the electromagnetic interaction at the sea surface. In particular, many robust backscattering models have been developed starting from the Bragg asymptotic theory to explain the ocean backscatter at intermediate incidence angles to the small perturbation method (SPM), two-scale model (TSM), small-slope approximation (SSA), and integral equation method (IEM) [1,2,3,4,5,6]. TSM has always been the most popular analytical scattering model since it was presented in the 1960s due to its reliable precision and high efficiency [2,3,7,8,9,10,11,12]. Under the assumption that the ocean surface consists of large-scale waves and small-scale waves superimposed on the large-scale surface, TSM combines the Bragg scattering from the small-scale roughness, whose wavelengths are on the order of the electromagnetic waves, and the modulations due to the longer waves. TSM has been commonly used for the scattering simulation in monostatic and bistatic configurations at different bands, such as HF-VHF, L-, S-, C-, X-, and Ku-bands [2,13,14,15,16,17].
However, to date, most scattering studies have focused on the Gaussian case and ignored the non-Gaussianity effects of the sea surface, and thus cannot finely describe the azimuthal behavior, especially the upwind–downwind asymmetry of backscatter from the ocean. The hydrodynamic modulation of short waves induced by long waves gives rise to the skewness of ocean surface waves [18]. The skewness is believed to be the cause for the upwind–downwind asymmetry of ocean backscatter [19]. The skewness function or its Fourier transform, the bispectral function, has been used in several studies to interpret the difference between the backscatter in upwind and downwind directions [19,20,21,22,23]. Chen [19] and Xie [20] systematically explored the effects of bispectrum on radar backscatter predicted with the integral equation method and found that the IEM can simulate the upwind–downwind difference in the ocean backscattering normalized radar cross section (NRCS) when the bispectrum part comes into the model. Bourlier [21,22] showed that the first-order small-slope approximation scattering model (SSA-1) can predict the upwind–downwind asymmetry by introducing the skewness function into the model. Wang et al. [23] found that the TSM modified by adding a correction term could describe the upwind and downwind difference as well. The modified TSM adds a correction term into the conventional TSM. It is a good choice for simulating the upwind–downwind difference in the ocean backscatter.
Furthermore, the impacts of sea surface morphology and distribution characteristics are very significant for the sea surface backscatter calculation [23]. It is of great necessity to analyze the effects of directional wave spectra on the performance of the scattering model in predicting ocean backscatter. There have been several studies focusing on the influences of wave spectra on backscatter prediction in recent years [24,25,26,27]. Hwang [24] systematically explored the effects of four wind wave spectra on the scattering prediction of the multiscale model. Zheng [25] evaluated the effects of six wind spectra on the prediction of NRCS by SSA. Xie [26] analyzed the influences of five single-wave spectra and three combined-wave spectra on the performance of the advanced IEM in predicting NRCS. Miao [27] combined three wave spectra and two spreading functions to estimate the effects of directional wave spectra on the prediction of wind–wave-induced Doppler shift. In general, the influences of wind wave spectra on IEM and SSA have been analyzed systematically. However, there are few studies in regard to the impact of spectra on TSM, which is commonly used in SAR imaging of the sea surface. Additionally, the effect of the directional spreading function on the estimation of azimuthal fluctuation of ocean backscatter has hardly been analyzed.
In this paper, the empirical parameter in the modified TSM is first determined by fitting the modified model to the empirical ocean backscatter geophysical model function (GMF), CMOD5.n. Then, the effects of different wave spectra and directional spreading functions on the modeling of ocean radar backscatter at various azimuth angles by the modified TSM are systematically investigated. Section 2 introduces the data, the methods, the wave spectra, and the directional spreading functions. In Section 3, the values of the empirical parameter at different conditions are estimated, and then the model predictions are compared with the CMOD5.n GMF and the Advanced Scatterometer (ASCAT) measurements for different directional wave spectra. Section 4 and Section 5 present the discussion and conclusions.

2. Data and Methods

2.1. NRCS Data

The NRCS data provided by the CMOD5.n GMF and the ASCAT measurements were used as a reference to improve and validate the modified TSM. The CMOD family was developed to provide the information of wind fields, in which the CMOD5.n was validated with many measured data and can be regarded as a reliable reference [16,28,29]. The CMOD5.n gives the relationship between C-band VV NRCS and the incidence angle, wind speed, and wind direction (relative to the radar look direction) [30]. It takes the form of:
σ 0 θ U 10 ϕ = B 0 θ U 10 1 + B 1 θ , U 10 cos ϕ + B 2 θ , U 10 cos 2 ϕ 1.6
where σ0 is the natural NRCS, θ is the incidence angle, U 10 is the neutral wind speed at the height of 10 m above sea level, and ϕ is the angle of wind direction. B 0 , B 1 , and B 2 can be expressed as a function of θ and U 10 , and they were obtained by fitting (1) to the European Remote Sensing Satellite ERS-2 scatterometer data. The average absolute difference between ASCAT and CMOD5.n is about 0.3 dB, and the root mean square difference is lower than 2 dB [31].
The MetOp-A ASCAT level-1B 12.5-km σ0 products produced by EUMETSAT from January 2014 to December 2016 were used in this paper [32,33]. The ASCAT-A σ0 measurements influenced by non-wave phenomena were rejected based on the following principles: (1) The default filling data and the abnormal data flagged as bad quality were excluded; (2) The measurements contaminated by rainfall, ice, and land were eliminated. Then, the ASCAT-A σ0 measurements were matched with the ocean surface winds provided by 57 moored buoys from the American National Data Buoy Center (NDBC) with a separation of time within 30 min and separation of space less than 25 km. The buoys are all located in waters more than 50 km away from land and 150 m deep, and correspondingly, the matched ASCAT-A measurements are also far away from land. Finally, 3,502,466 matching pairs were obtained. Additionally, the buoy wind speeds sampled at 2–5 m heights above the sea surface were converted to 10 m neutral wind speeds based on the logarithmic marine boundary layer assumption proposed by Liu and Tang [34] after eliminating low-quality observations:
U 10 = U Z κ 2 C d ln 1 z z 0
where UZ is the wind speed measured at a height Z above sea level. z0 = 3.271 × 10⁻⁴ m is the surface roughness length, κ = 0.4 is the von Karman constant, and Cd = 1.5 × 10⁻³ is the drag coefficient.

2.2. Wave Spectra and Spreading Functions

The wave spectrum covering a wide range of wavenumbers, e.g., from millimeter wavelengths to wavelengths on the order of hundreds of meters, is required for the backscattering calculation. Over the past decades, many full-wave-number spectra have been proposed, of which the D (Donelan–Banner–Plant) spectrum [35], the A (Apel) spectrum [36], the E (Elfouhaily et al.) spectrum [37], and the most recent version of the Hwang (Hwang et al.) spectrum, H18 [38], are used in this paper. The D spectrum is the synthesis of the results of measurements with wave gauge arrays, stereo photography, and microwave backscatter [39,40,41]. The A spectrum is derived from the in situ measurements in the gravity wave region and the wave tank results in gravity–capillary wave region. It addresses the consistency with the measured NRCS. The E spectrum emphasizes the consistency with the measured mean square slopes in [42], and is developed based on the unification of optical, in situ, and wave tank data. The H18 spectrum is a combination of the H15 spectrum [43] and the G spectrum [38]. The details of the four spectral models can been seen in [35,36,37,38,44].
Figure 1 illustrates the curvature spectra B(K) of D, A, E, and H18 for wind speeds varying from 2 m/s to 24 m/s, and the step is 2 m/s. We can see that the intermediate- and short-scale waves roughly from 1 rad/m to 1000 rad/m make the dominant contribution to the surface roughness. As wind speed increases, the wind speed sensitivity of spectral density decreases gradually. Furthermore, the spectral density exhibits very little wind speed sensitivity over the whole wind speed range for decimeter- to meter-scale waves. This may be partly due to the fact that waves of these scales are the main wave-breaking regions that generate short-scale waves [6]. In addition, there is a spectral peak in the capillary wave region, followed by a rapid drop-off. This peak is at 190 rad/m (3.3 cm wavelength) for the D spectrum, 700 rad/m (0.9 cm wavelength) for the A spectrum, 370 rad/m (1.7 cm wavelength) for the E spectrum, and 530 rad/m (1.19 cm wavelength) for the H18 spectrum. More importantly, the magnitude of the spectral density varies from one model to another, especially in the gravity–capillary wave region. For example, at a 16 m/s wind speed, the curvature spectral density is about 0.0132 rad2 at 143 rad/m (the C-band resonance Bragg wave number at 40° incidence angle) for the D spectrum, about 0.0225 rad2 for the A spectrum, about 0.0159 rad2 for the E spectrum, and about 0.0135 rad2 for the H18 spectrum.
The prediction of the directional anisotropy of ocean backscatter requires the knowledge of the directional distribution of ocean waves. It is known that this distribution can be described by the directional spreading function f K , φ . Three widely used spreading functions are the Cosine [37], Sech [35], and Gaussian [27] spreading functions.
  • Cosine spreading function:
f K , φ = 1 2 π [ 1 + Δ ( K ) cos ( 2 φ ) ]
where K is ocean wave number magnitude and φ is its angle with respect to the direction toward which the wind blows. Δ(K) can be expressed as:
Δ ( K ) = tanh a 0 + a p c / c p 2.5 + a m c m / c 2.5
where c is the wave phase velocity:
c = g K + T K
where g is the acceleration due to gravity, T = 7.25 × 10⁻⁵. cp is the phase speed at the dominant wave, a0 = ln(2)/4, and ap = 4. am is:
a m = 0.13 u * c m
where u * is the friction velocity and cm is the minimum phase speed that is equal to 0.32 m/s.
2.
Sech spreading function:
f K , φ = 0.5 β Ω ( K , φ )
Ω ( K , φ ) = sech 2 ( β φ ) + sech 2 ( β | φ ± π | ) / 2
β = β g ( 1 a ) + 0.84 a
a = 0.165 + 0.835 tanh K 5 U 10 / 25 U 10
β g = 1.22 , K / K p 0.31 2.61 ( K / K p ) 0.65 , 0.31 < K / K p 0.97 2.28 ( K / K p ) 0.65 , 0.97 < K / K p 2.56 10 [ 0.4 + 0.8393 exp ( 0.56 ln ( K / K p ) ) ] , 2.56 < K / K p 30 / K p
where Kp is the wave number at the peak spectral density. In (8), the “−” sign is used when 0 < φ ≤ π, while the “+” sign is used when –π < φ ≤ 0.
3.
Gaussian spreading function:
f K , φ = D ( K , φ ) / I D
I D = D ( K , φ ) · d φ
D ( K , φ ) = exp φ 2 2 δ 2
1 2 δ 2 = 0.14 + 0.5 1 exp K u 10 c 1 + 5 exp 2.5 2.6 ln u 10 u n 1.3 ln K K n
where c1 is equal to 400 rad/s and Kn is equal to 1 rad/m.
Figure 2 shows the symmetrical forms of the Cosine, Sech, and Gaussian spreading functions at 10 m/s wind speed for wave numbers of 0.1, 1, 10, and 100 rad/m. As can be seen, the wave directional distributions of the Cosine spreading function are anisotropic over all wave numbers, with the most wave energy propagating in upwind and downwind directions and the least in the crosswind direction. However, the directionality at different wave numbers is different, which shows a trend of first weakening and then slightly strengthening as the wave number increases. The other two spreading functions generally exhibit similar behavior, except for a near-isotropic distribution at decimeter- to meter-scale waves and a stronger directionality at longer waves.

2.3. Construction of Non-Gaussian Sea Surface

We used the Tayfun model [45] to construct a non-Gaussian large-scale sea surface. The Tayfun model can be expressed as:
z ( x ) = z l + 1 2 K ˜ z l 2 z ˜ 2 + 2 z l z ˜
where K ˜ is the mean wavenumber, K ˜ = m 1 / m 0 , m j = K j S ( K ) d K , S ( · ) is the ocean wave spectrum, and
z ˜ x m , y n , t = x = 1 M y = 1 N 2 S K , φ d K sin K x x m + K y y n ω K x , K y t + ε K x , K y
and z l is the height of the Gaussian sea surface.
z ˜ x m , y n , t = x = 1 M y = 1 N 2 S K , φ d K c o s K x x m + K y y n ω K x , K y t + ε K x , K y
where M and N are the facets’ numbers in range and azimuth directions. K x and K y represent the components of wave number K on the range and azimuth coordinates. x is the range direction, parallel to the antenna look direction; y is the azimuth direction, perpendicular to the range direction. ω K x , K y is the angular frequency. ε K x , K y is uniformly distributed over (0, 2π). The coordinate system is:
x m = Δ x ( m M / 2 ) m = 1 , 2 , , M y n = Δ y ( n N / 2 ) n = 1 , 2 , , N
in which Δ x and Δ y are the facet sizes in ground range and azimuth directions.
Figure 3 compares the probability density functions (pdfs) of the Gaussian and Tayfun sea surfaces based on the A spectrum and Cosine spreading function at wind speed of 10 m/s and incidence angle of 30° in the upwind direction. The size of the sea surface is 2 km × 2 km, and the facet size is 10 m × 10 m. From Figure 3a, it can be seen that the distribution of the elevation of Tayfun sea surface deviates from that of the Gaussian surface owing to the inclusion of nonlinear effects, and the mean value shifts to a negative value, which is consistent with the results in [46]. Figure 3b shows that the Tayfun sea surface has higher probability near small slopes in comparison with the Gaussian surface, and the pdfs of the Gaussian and Tayfun sea surface slopes have little difference near large slopes. All these results are similar to the performance of the CWM (Choppy Wave Model) reported in [46].

2.4. Modified TSM

In order to account for the difference between NRCSs in upwind and downwind directions, the modified TSM was developed by introducing a correction term into the conventional TSM. The NRCS for sea surface can be written as:
σ p p 0 θ = σ p p s θ + σ p p c θ
where the subscript pp indicates the VV or HH polarization state and θ is the local incidence angle of each individual facet. σ s is the standard term proportional to the wave spectral density at the Bragg wave number and can be calculated by the conventional TSM [30,31]:
σ p p s θ = 16 π k i 4 cos 4 θ G p p S K B x , K B y
where S is the wave spectrum of ocean surface, Gpp is the VV- or HH-polarized scattering coefficient, ki is the radar wave number, KB = 2kisinθ′ is the Bragg wave number, and KBx and KBy are the two components of Bragg resonance waves in range and azimuth directions. σc is the complementary term which is proportional to the sea surface bispectrum and can be given by [23]:
σ p p c θ = k i 5 cos 3 θ B a K B , φ 4 f p p 2 + 1.5 R e f p p · F p p + 0.125 F p p 2
where Ba is the imaginary part of sea surface bispectrum, and fpp and Fpp are two polarization dependent coefficients. Ba can be written as [23]:
B a K , φ = K s 0 6 6 K 2 s 0 2 cos 2 φ cos φ exp K 2 s 0 2 / 4 / 16
where s 0 is the skewness parameter, which can be expressed as [23]:
s 0 = ζ ξ σ R U 12.5 A / B 1 / 3 U 12.5 1 / 2
ξ = ( 6 / B ) 1 / 3 0.5 C
where A = 5.0 × 10⁻², B = 42 × 10−3, and C = 5.1 × 10⁻³. A and B are the coefficients in the relation between skewness coefficient and wind speed, and C is the coefficient in the relation between total slope variance and wind speed, which are provided by Cox and Munk in [42]. U 12.5 denotes the wind speed at the height of 12.5 m over the ocean surface. σ R 2 is the small-scale vertical variance, and can be evaluated from:
δ = k i σ R
δ = 0.205 log 10 u * 0.0125
where ζ is an empirical coefficient to be determined. The value of ζ depends on polarization, incidence angle, and wind speed. It can be obtained by fitting the predictions of modified TSM to the reference data. The mean NRCS at a certain incidence angle, wind speed, wind direction, and directional wave spectrum can be obtained by averaging the local NRCSs over surface samples.

3. Results

In this section, we first estimate the values of the empirical parameters ζ in the modified TSM with different wave directional spectra input at different wind speeds and incidence angles. Then effects of wave spectra and directional spreading functions on the performance of the modified TSM in predicting C-band VV-polarized NRCS at various azimuth angles are analyzed by comparing the simulated NRCS values with CMOD5.n and the ASCAT data over wind speed range of 3 m/s–16 m/s and incidence angles range of 30°–50°.

3.1. Determination of the Modified TSM

The values of the empirical parameter ζ in the modified TSM are estimated by minimizing the upwind–downwind asymmetry predicted by the modified TSM and that given by CMOD5.n.
Figure 4 shows the estimations of ζ as functions of incidence angle at wind speeds of 3 m/s, 9 m/s, and 16 m/s under different directional wave spectra of D + Cosine, D + Sech, D + Gaussian, A + Cosine, A + Sech, A + Gaussian, E + Cosine, E + Sech, E + Gaussian, H18 + Cosine, H18 + Sech, and H18 + Gaussian. Figure 4 indicates that the ζ does not exhibit any dependence on incidence angle when the wind speed is low (3 m/s) for all the directional wave spectra. The value of ζ remains at 0.01 over the 30°–50° incidence angle range for the D spectrum, and remains at 0.02 for the A, E, and H18 spectra. At moderate wind speed (9 m/s), different wave spectra yield rather different ζ behaviors with incidence angle, while that produced by different spreading functions is similar. The ζ estimated with the E spectrum is the most sensitive to the incidence angle, followed by the H18 spectrum, and the values of ζ based on the D and A spectra are independent of the incidence angle. The ζ value based on the D and A spectra remains at 0.16 and 0.18, respectively. The ζ values calculated with the E and H18 spectra fluctuate up and down with the incidence angle, and the fluctuations are within 0.03 when the incidence angle increases from 30° to 50°. At high wind speed (16 m/s), the estimations of ζ with different directional wave spectra all show a stronger dependence on incidence angle. They generally first increase and then decrease with the increase in the incidence angle. The ζ values do not fluctuate more than 0.1 over the 30°–50° incidence angle range. Additionally, the ζ estimated with the A spectrum is the largest, followed by that estimated with the E spectrum; the ζ values estimated with the D and H18 spectra are the smallest. It is worth noting that one peak occurs in each curve for the E and H18 spectra at a moderate wind speed in Figure 4d–f, and for all spectra at a high wind speed in Figure 4g–i. This phenomenon occurs because the ζ is determined by the level of upwind–downwind difference, and the difference in the upwind and downwind NRCSs calculated by CMOD5.n created a peak value near low incidence angles (see Figure 10b,c).
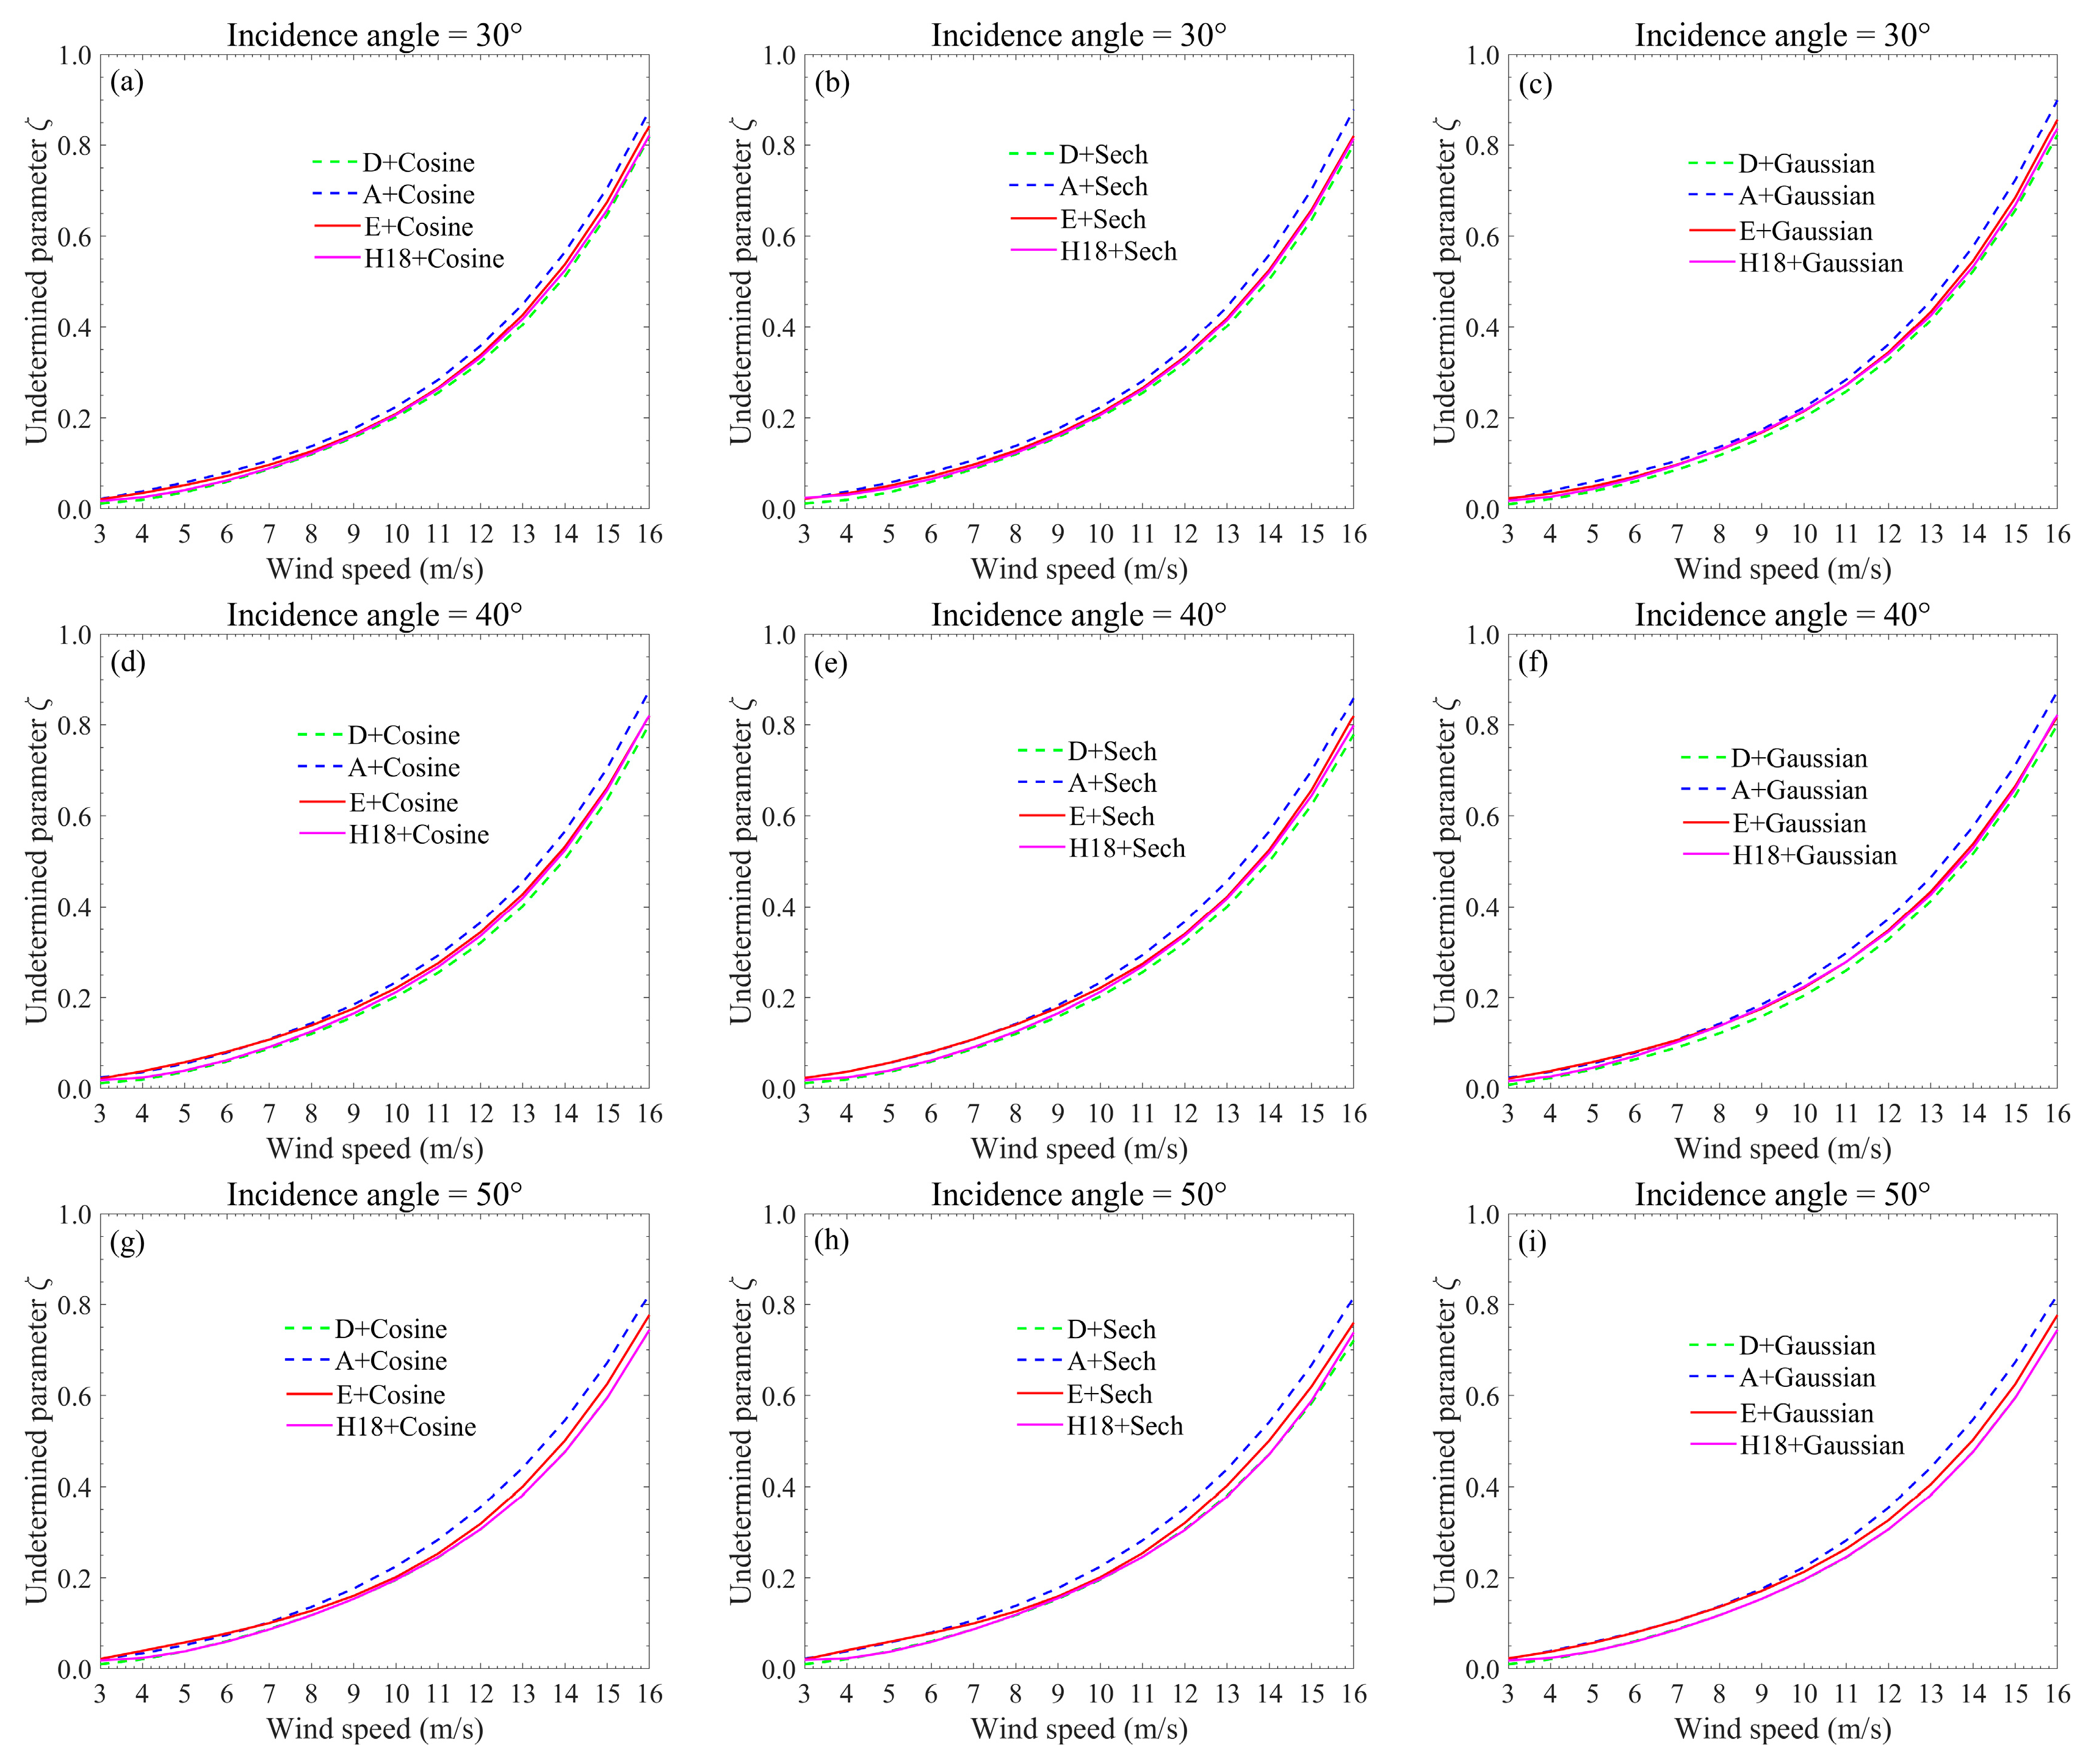
Figure 5 shows the variation in ζ with wind speed at incidence angles of 30°, 40°, and 50°. As shown, the value of ζ increases roughly from 0.02 to 0.90 when the wind speed increases from 3 m/s to 16 m/s. For a certain incidence angle, ζ increases with wind speed and the increasing rate gradually accelerates. These results are different from those shown in Figure 1 of [23], where ζ increases linearly from 0.03 to 0.21 as the wind speed increases from 2 m/s to 20 m/s. The ζ values in [23] are obtained based on the airborne measurements under large incidence angles of 60°–80°. In addition, the estimated ζ values under different spreading functions are almost the same for a given wave spectrum over the wind speed range of 3–16 m/s. The ζ values estimated based on different wave spectra for a given spreading function are somewhat different at higher wind speeds, where the ζ value of A spectrum is always larger than others. The ζ values obtained based on the D, E, and H18 spectra are almost the same, except for the high incidence angle (50°), where the ζ of the E spectrum is larger than that of the D and H18 spectra. What deserves special mention is that the sensitivity of ζ to wind speed is much stronger than its sensitivity to incidence angle. This result is similar to that of [23], in which only the wind speed dependence of ζ is considered.
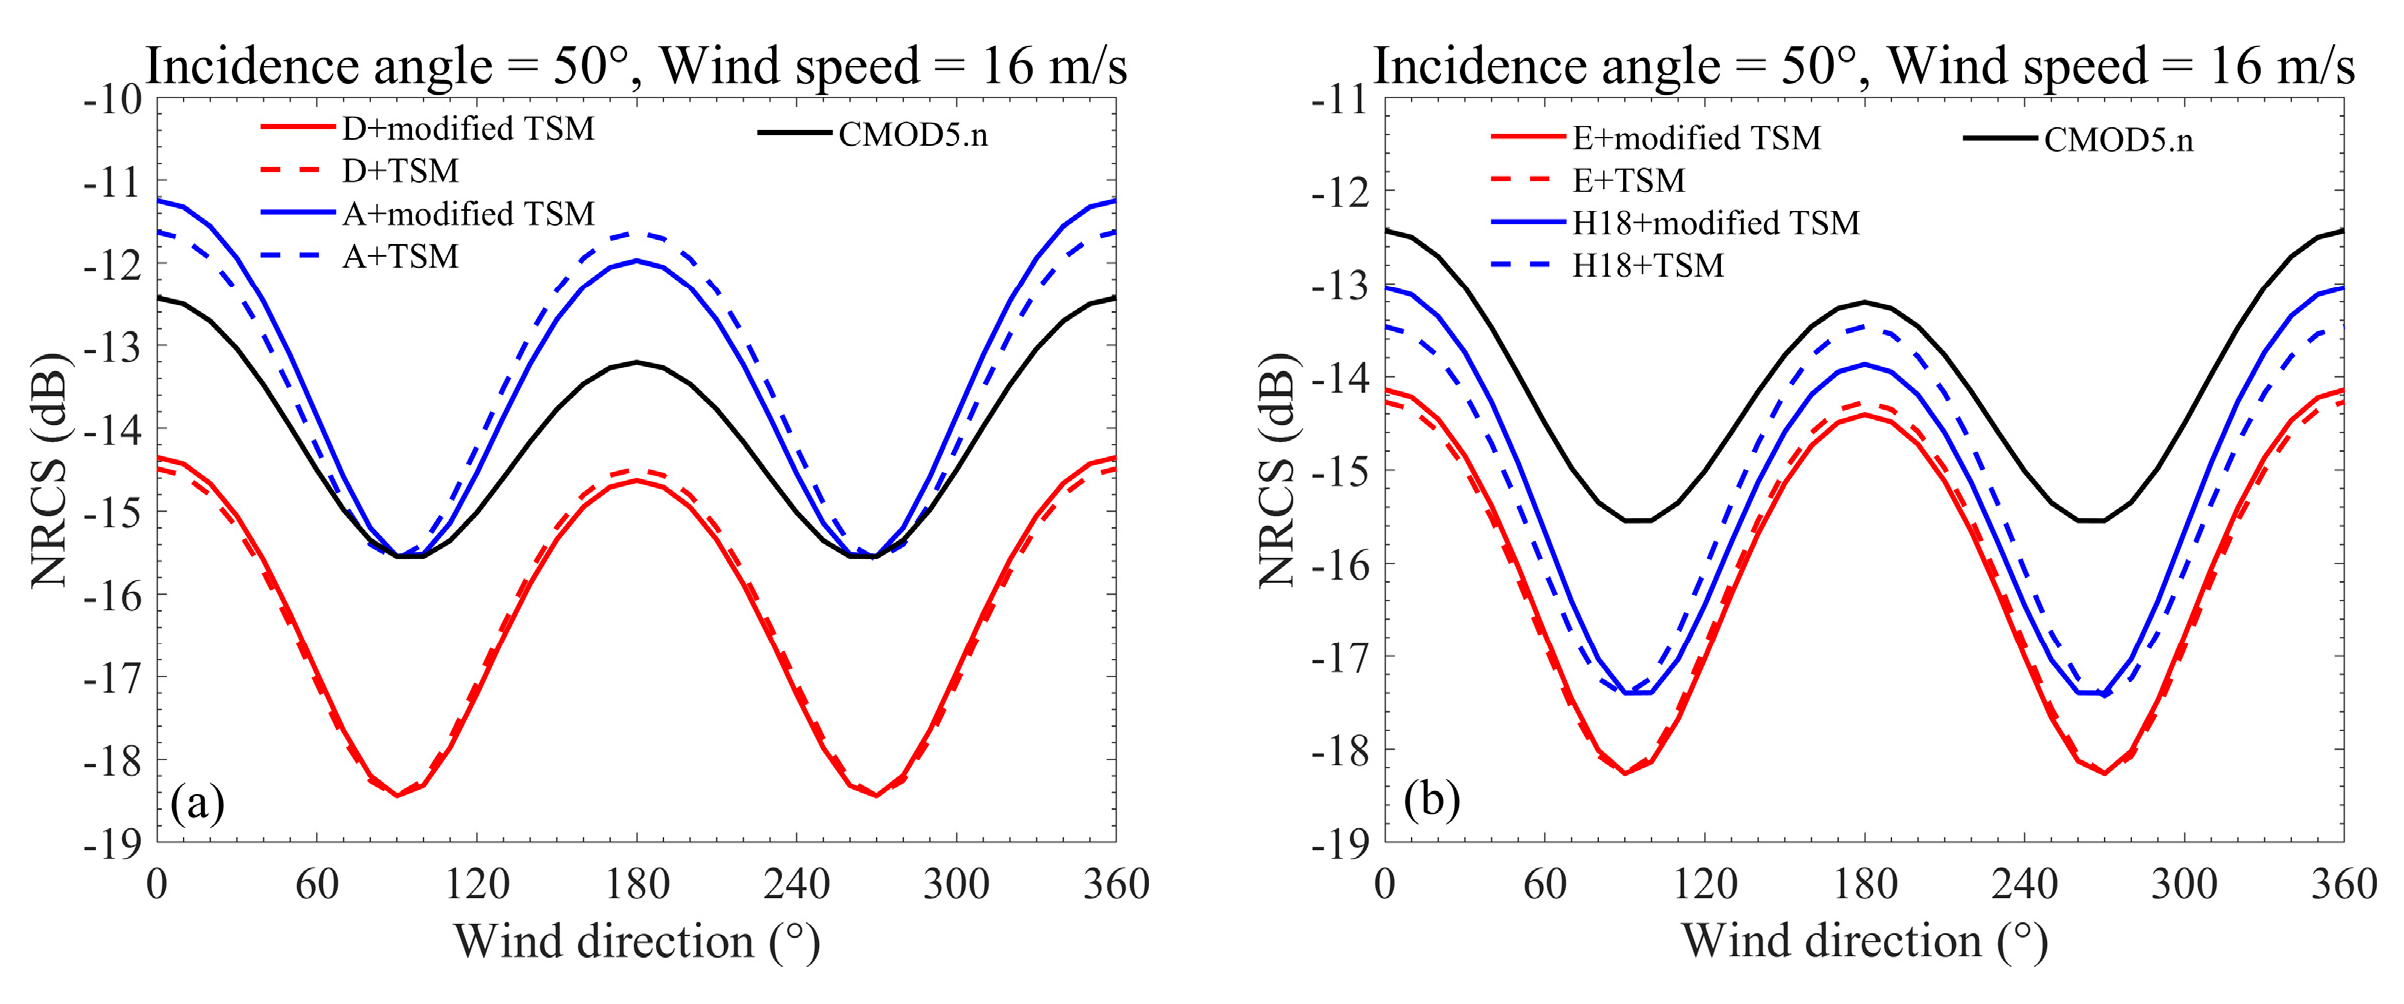
Figure 6 shows an example of comparison of the NRCSs predicted by the modified TSM (solid curves) and the conventional TSM (dashed curves) using different wave spectra and the Cosine spreading function, and their comparisons with CMOD5.n at a wind speed of 16 m/s and an incidence angle of 50°. As can be seen, whichever wave spectrum is used, the modified TSM can well simulate the upwind–downwind asymmetry, which cannot be described by the conventional TSM. It achieves this by introducing a negative correction in the downwind direction (180°) and a positive correction in the upwind direction (0°) using the additional bispectral term. Moreover, the minimum of the modified-TSM-simulated NRCS deviates from the crosswind direction (90°/270°) and moves to the downwind direction. All these changes diminish the gap between the predictions of model and CMOD5.n [47].

3.2. The Influence of Directional Wave Spectra on NRCS Simulation at Different Azimuth Angles

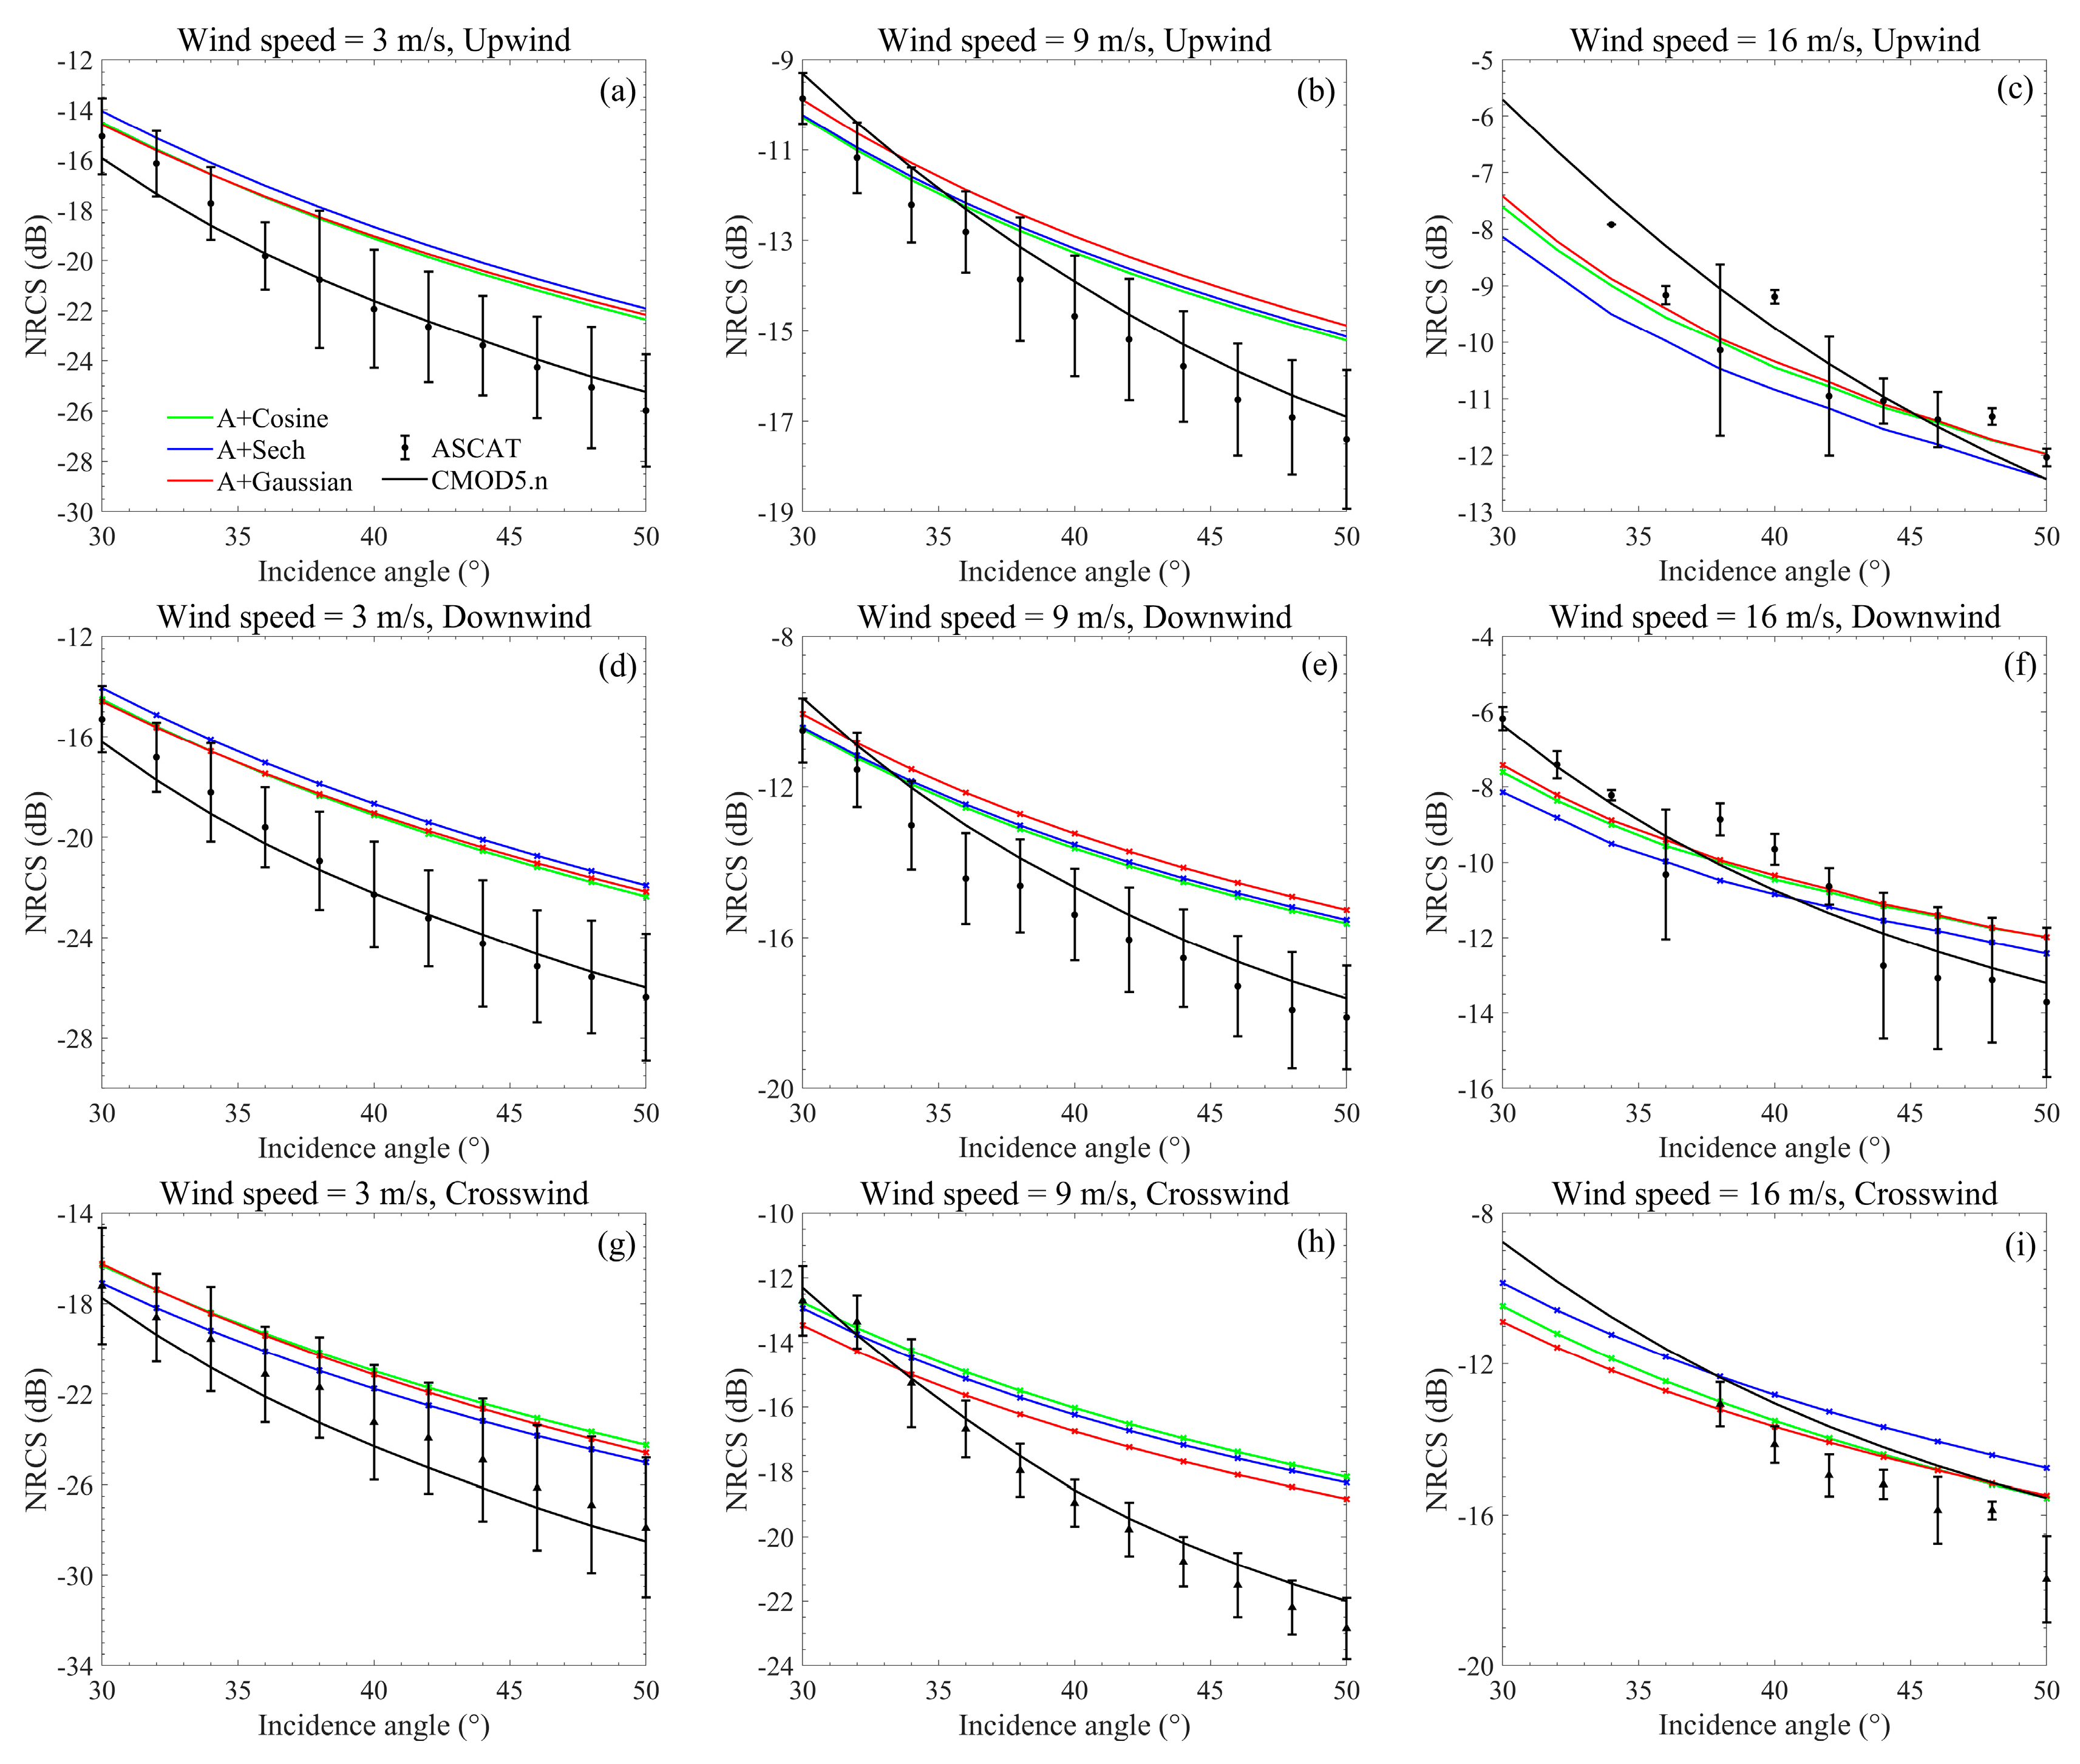
Figure 7 gives the modified-TSM NRCSs simulated with A + Cosine, A + Sech, and A + Gaussian, and their comparisons with the ASCAT data and CMOD5.n as functions of incidence angle at wind speeds of 3 m/s, 9 m/s, and 16 m/s in upwind, downwind, and crosswind directions. The ASCAT NRCS is averaged within ±0.5 m/s wind speed, 6° wind direction, and ±0.5° incidence angle bins. The mean values and standard deviations of every bin are shown in Figure 7. We can see that the CMOD5.n NRCSs exhibit reasonably good agreement with the ASCAT NRCS measurements. For a certain incidence angle, wind speed, and wind direction, the properties of three spreading functions to underestimate or overestimate the reference data are almost the same. For different azimuthal directions, different spreading functions yield rather similar incidence angles and wind speed dependences.
Figure 8 shows the simulated NRCSs based on the D + Cosine, A + Cosine, E + Cosine, H18 + Cosine, AH18 + Cosine, and AEH18 + Cosine, and their comparisons with the ASCAT data and CMOD5.n as functions of incidence angle at wind speeds of 3 m/s, 9 m/s, and 16 m/s along upwind, downwind, and crosswind directions. The results show that the incidence angle and wind speed dependences of scattering produced by the different wave spectra are rather different. For the upwind direction, at a low wind speed, the ASCAT data and CMOD5.n are consistent with the A and E spectra at low incidence angles (<37°), but closer to the H18 spectrum when the incidence angle is larger than 37°. At a moderate wind speed, compared with the ASCAT data, the A spectrum works better at low incidence angles (<34°), and the E spectrum has better performance at incidence angles of 34°–44°. When the incidence angle is larger than 44°, the E and H18 spectra achieve relatively good agreement with the ASCAT data. Compared with CMOD5.n, the A spectrum works well when the incidence angle is smaller than 37°, and the E spectrum performs better for incidence angles larger than 37°. At a high wind speed, the A spectrum always performs better than the others compared with the ASCAT data and COMD5.n for incidence angles of 30°–50°.
For the downwind direction, the results are similar to those along the upwind direction, except for the high wind speed, where all four spectra have good agreement with the ASCAT data when the incidence angle is larger than 42°. For the crosswind direction, the results at a low wind speed are similar to those in the upwind and downwind directions. However, at a moderate wind speed, the reference data are consistent with the predictions based on the A spectrum when the incidence angle is less than 35°, in good agreement with the E spectrum for the incidence angles of 35°–39°, and consistent with the H18 and D spectra for incidence angles larger than 39°. At a high wind speed, the A spectrum performs better than the other spectra generally, except that the H18 spectrum is in good agreement with the ASCAT data when the incidence angle is larger than 38°.
The above analysis reveals that the satisfactory sea surface spectrum for NRCS simulation at different wind speeds and incidence angles varies, and we conjecture that a combination of these spectra might have wider applicability. Therefore, we chose the A, H18, and E spectra, which have better performance, to obtain composite spectra. Two composite wave spectra were obtained through averaging: the average of the A spectrum and the H18 spectrum (hereafter, “AH18”), and the average of the A spectrum, E spectrum, and H18 spectrum (hereafter, “AEH18”).
It can be seen from Figure 8 that in upwind direction, the AH18 spectrum always performs well at a low wind speed compared with the reference data. The NRCS simulated with the two combined spectra are almost the same at a moderate wind speed, and the differences between the predictions of the two combined spectra and the reference data are within 1.5 dB. At a high wind speed, both the AH18 and the AEH18 spectra underestimate the mean NRCS in comparison with that of ASCAT and CMOD5.n, and the AH18 spectrum works relatively better than the AEH18 spectrum. In the downwind and crosswind directions, the performances of the two combined spectra at different wind speeds and incident angles are similar to the performance in the upwind direction, except that in the crosswind direction at a moderate wind speed, the prediction with AH18 has a better consistency with the reference data when the incidence angle is larger than 40°.
In order to show the performances of different wind–wave spectra more clearly and intuitively, Table 1 shows the offset and standard deviation of the simulated scattering shown in Figure 8 relative to CMOD5.n. Table 2 shows the offset and standard deviation of the simulated scattering relative to the ASCAT measurements. The incidence angle is divided into 30°–40° and 40°–50°. The mean biases and standard deviations of the simulated scattering relative to the reference data under the three wind speeds are shown in each incidence angle cell. After comparing the offsets and standard deviations of the six wave spectra, we obtained the best-performing wave spectra in different cases and marked the corresponding results in red and bold. The results clearly show that the AH18 spectrum has better performance at low and moderate wind speeds, and the A spectrum works better at a high wind speed. These conclusions are exactly the same as those obtained from Figure 8.
In general, the above comprehensive evaluation of different directional wave spectra in the NRCS simulation reveals that the directional spreading function has little influence on the prediction of the incidence angle and wind speed dependences of scattering at different azimuth angles, while the wave spectrum has significant influence. The AH18 spectrum has better performance at low and moderate wind speeds, and the A spectrum works better at a high wind speed.
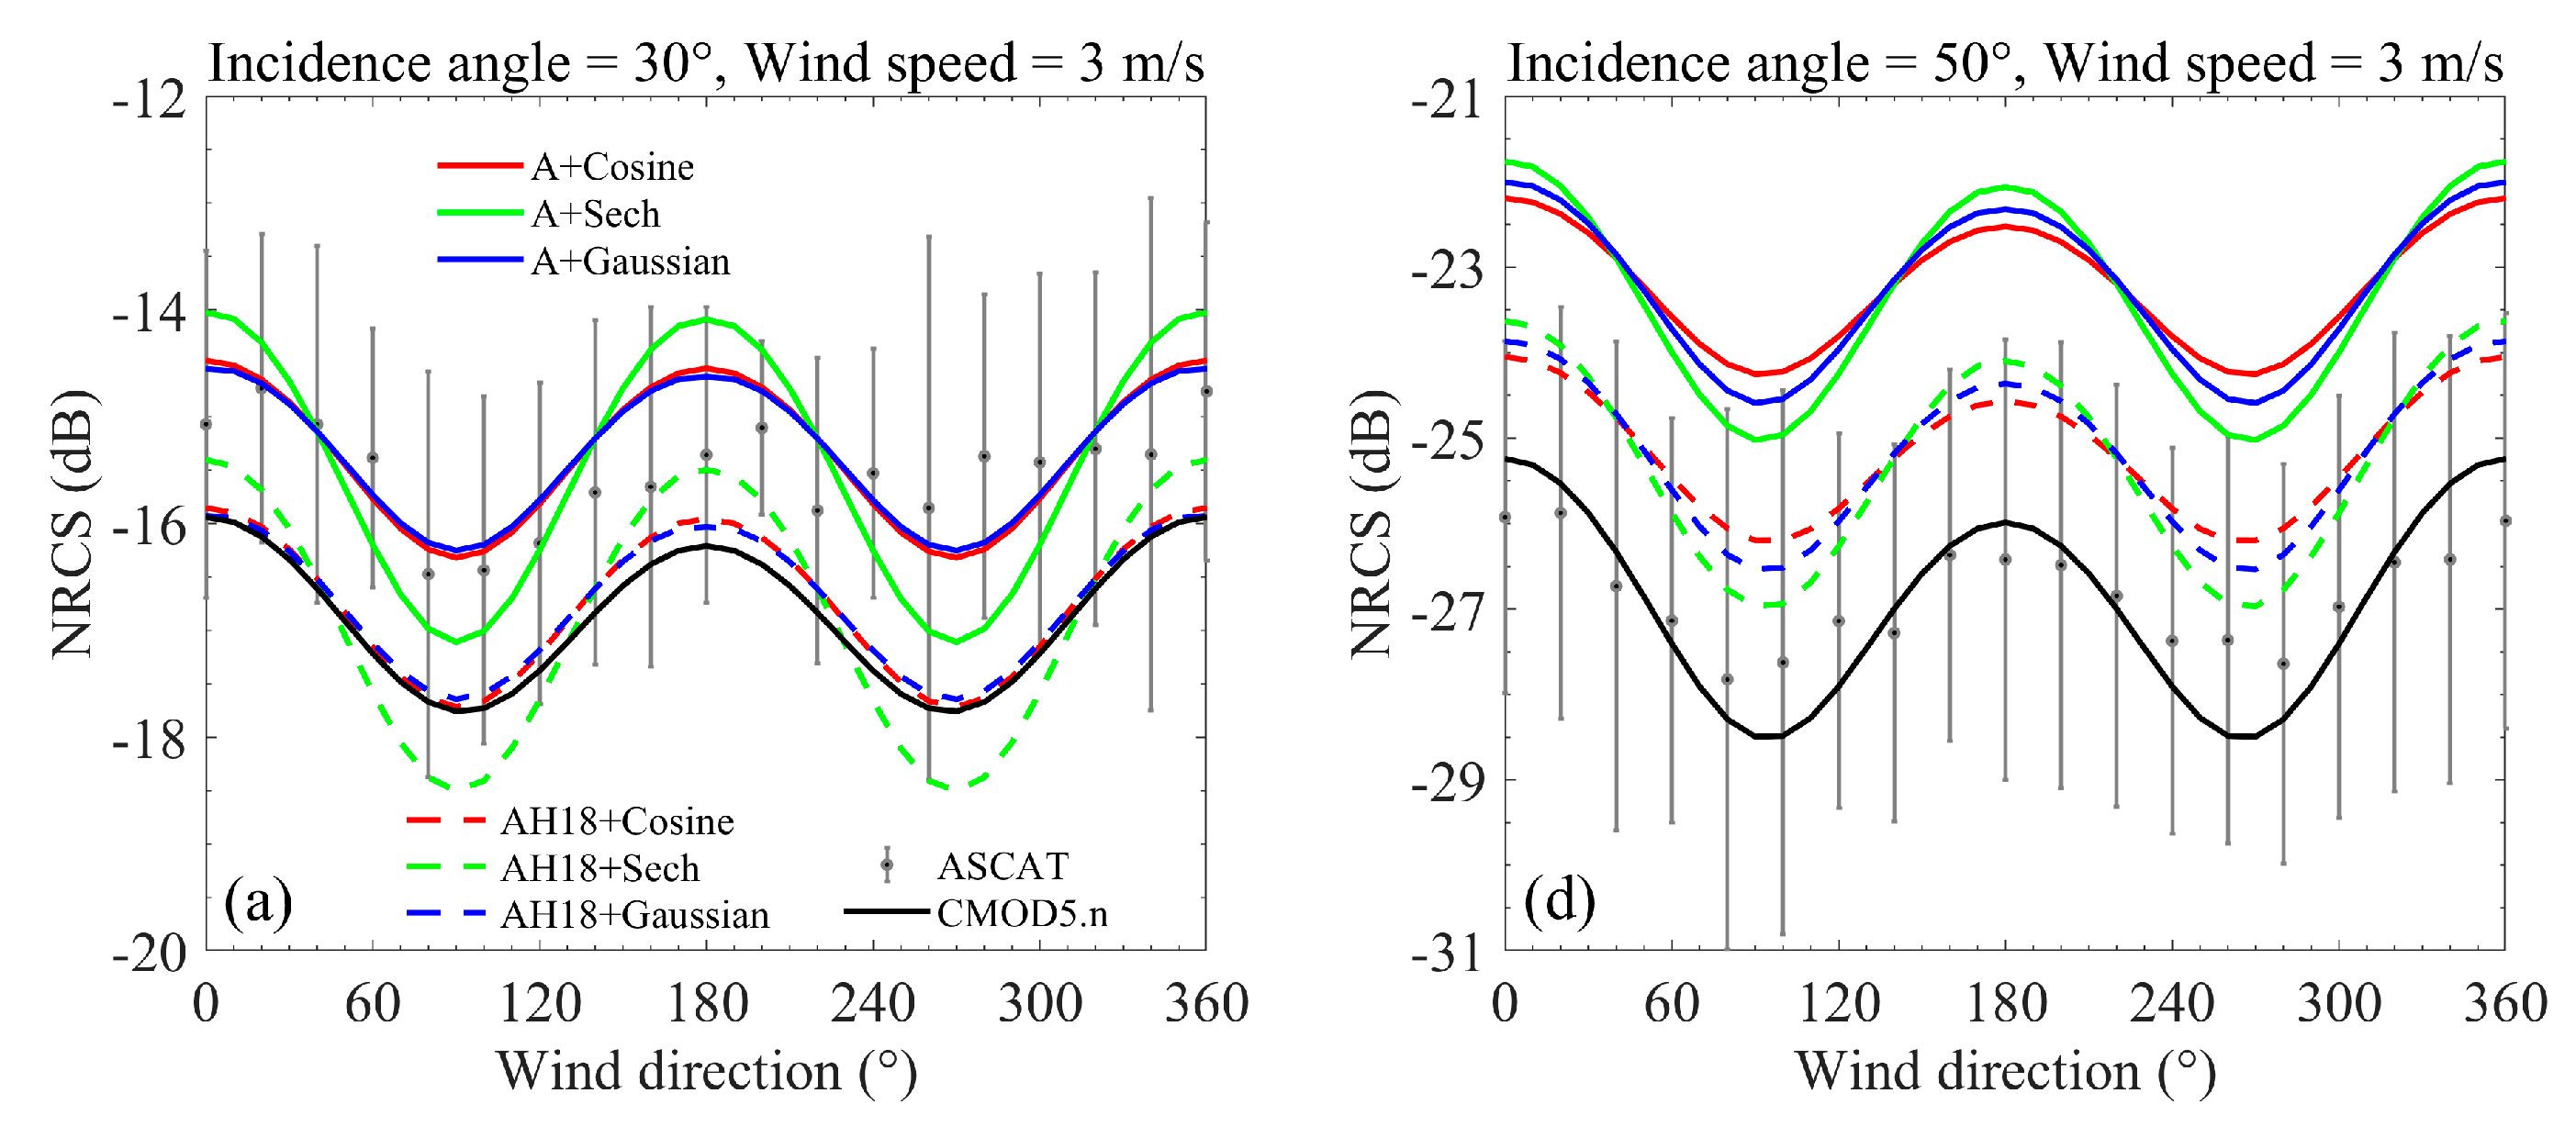
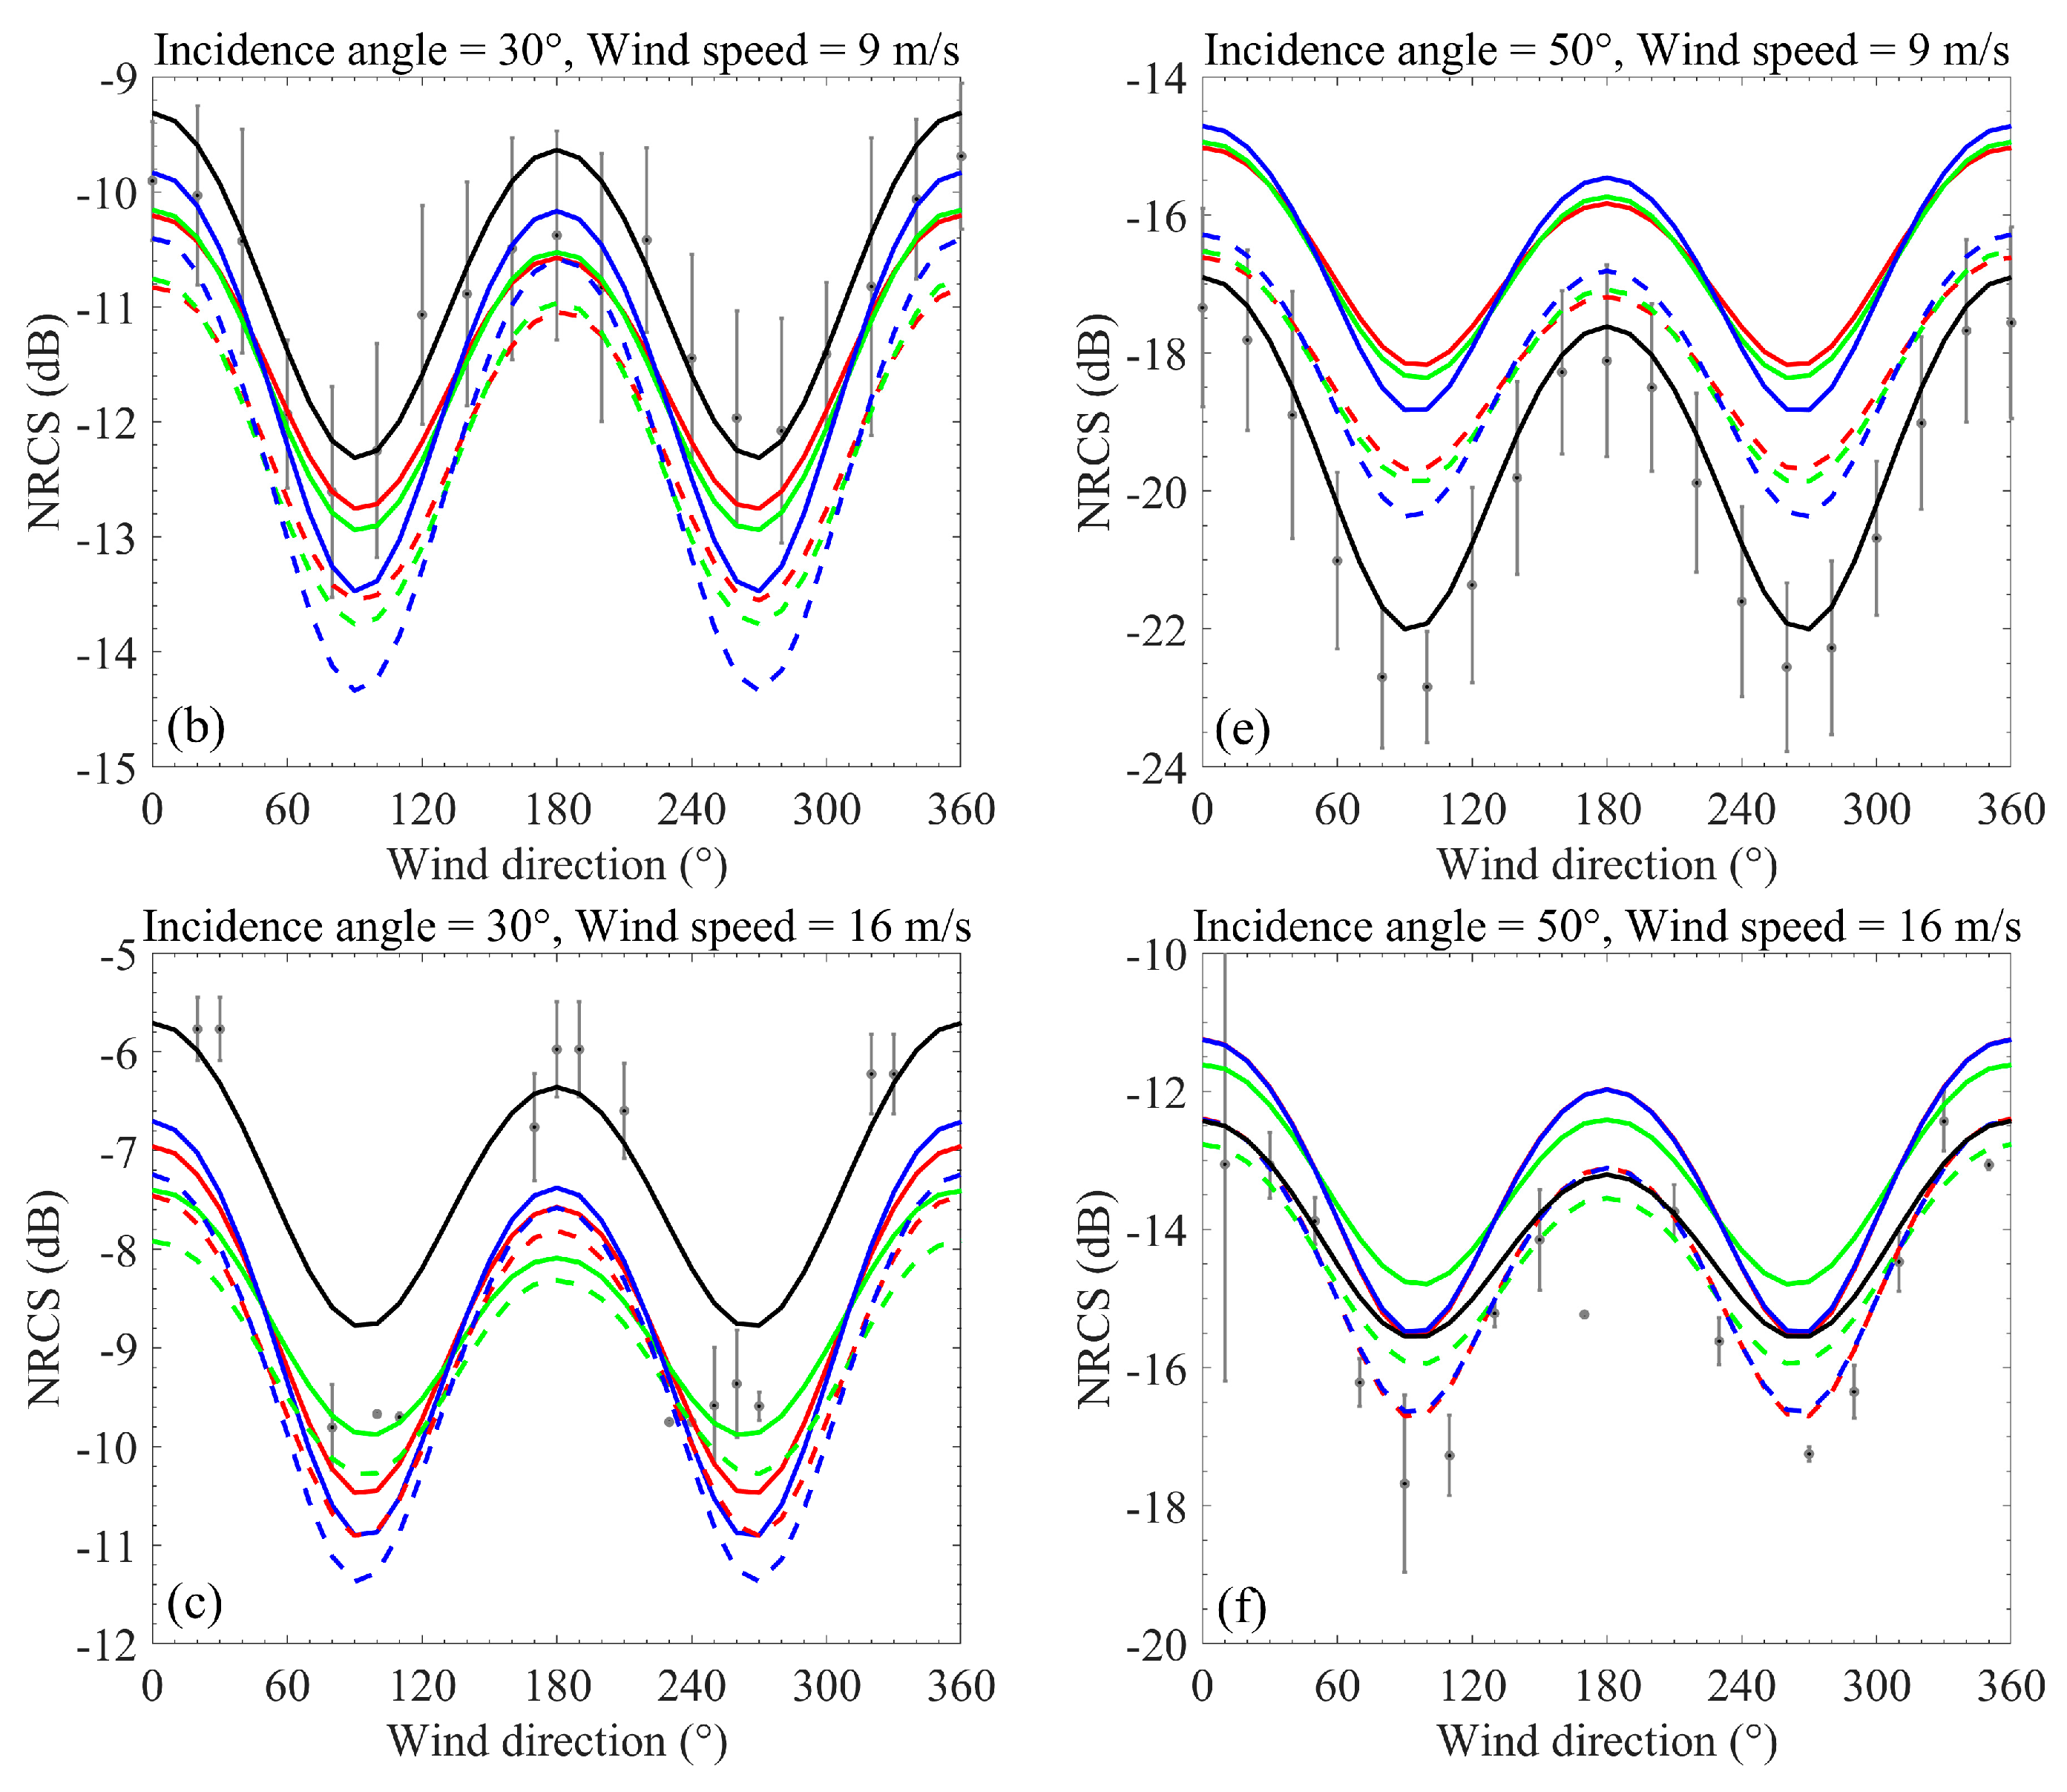
Then, the effects of wave spectra and directional spreading functions on the estimation of azimuthal fluctuation of ocean backscatter are analyzed. Figure 9 illustrates the predictions of the modified TSM with different wave directional spectra input, and their comparison with CMOD5.n and the ASCAT measurements as functions of azimuthal wind direction at incidence angles of 30° and 50° under wind speeds of 3 m/s, 9 m/s, and 16 m/s. As can be seen from Figure 9, the use of different wave spectra has little effect on the prediction of azimuthal fluctuation of the modified TSM, though it results in rather different performance under different wind speeds and incidence angles. To some extent, the directional spreading function affects the azimuthal fluctuation of the scattering simulated by the modified TSM. Different directional spreading functions yield different azimuth fluctuations. Additionally, the relative undulating patterns produced by different spreading functions are rather different at different wind speeds, whereas they are mostly similar at different incidence angles.
At a low wind speed, the Sech spreading function yields larger NRCS in the upwind/downwind directions (0°/180°) and smaller NRCS in the crosswind directions (90°/270°) than the Cosine and Gaussian spreading functions. That is, the NRCS estimated with the Sech spreading function has slightly greater ups and downs with wind direction. At a lower incidence angle, the Cosine and Gaussian spreading functions are in better agreement with CMOD5.n and the ASCAT data. At a higher incidence angle, the Sech spreading function achieves a similar up and down pattern to the CMOD5.n, while the Cosine and Gaussian spreading functions, which have slightly weaker ups and downs with wind direction, are in better agreement with the ASCAT data.
At a moderate wind speed, the Cosine and Sech spreading functions, which yield almost the same results, have better performance at lower incidence angles compared with CMOD5.n and the ASCAT data. However, at a higher incidence angle, the Gaussian spreading function, which produces the largest ups and downs, performs better. At a high wind speed, the Cosine spreading function is in better agreement with CMOD5.n at lower incidence angles. However, the Gaussian spreading function achieves a similar up and down pattern to the ASCAT data. At a higher incidence angle, the Sech spreading function achieves a similar up and down pattern to CMOD5.n. Meanwhile, the Cosine and Gaussian spreading functions are in better agreement with the ASCAT data. As can be seen, the optimum spreading function is different when the wind speed and incidence angle are different.
In general, the Gaussian spreading function has better performance in predicting the azimuthal fluctuation of scattering, except that the Cosine and Sech spreading functions work better at a moderate wind speed when the incidence angle is low.
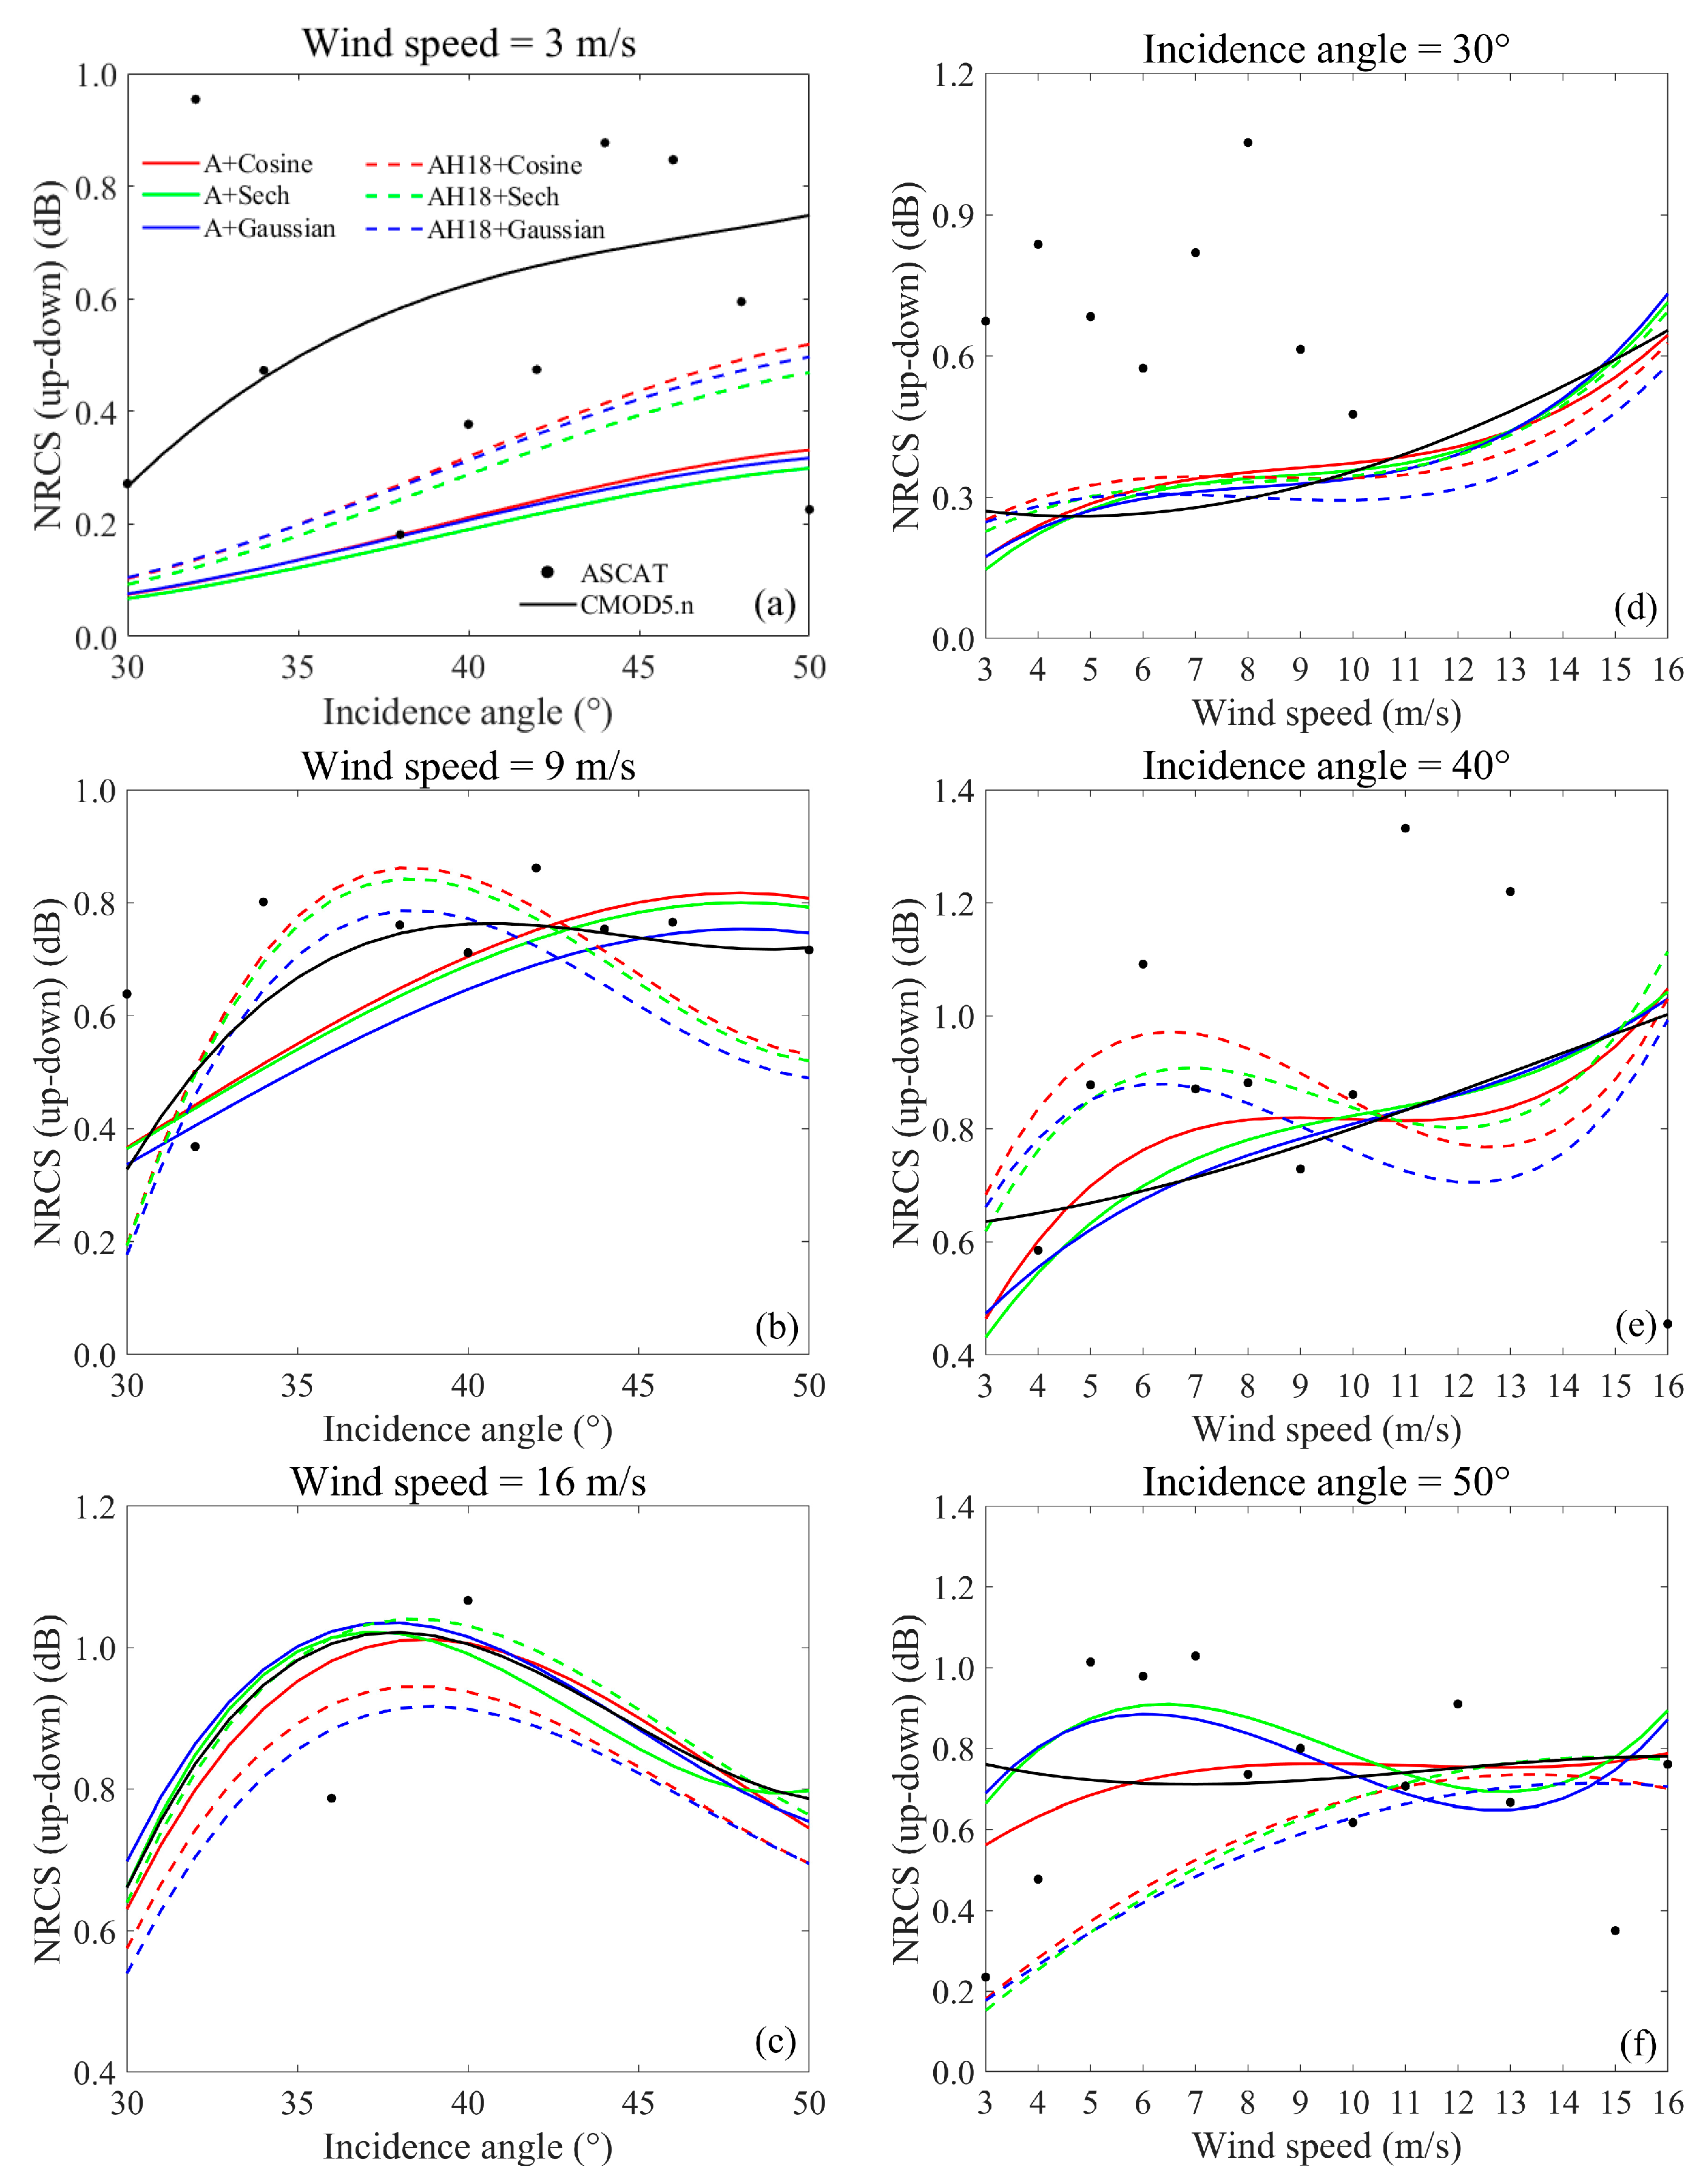
The most important azimuth behavior of ocean radar backscatter is the upwind–downwind asymmetry. The upwind–downwind asymmetry estimated with different directional wave spectra is different. Figure 10 shows the differences between the NRCSs in upwind and downwind directions calculated by the modified TSM with A + Cosine, A + Sech, A + Gaussian, AH18 + Cosine, AH18 + Sech, and AH18 + Gaussian input, and the results of ASCAT and CMOD5.n ((a)–(c)) as functions of incidence angle at wind speeds of 3 m/s, 9 m/s and 16 m/s, and ((d)–(f)) as functions of wind speed at incidence angles of 30°, 40°, and 50°.
At low winds, the computed upwind–downwind differences using the six wave directional spectra are lower than the ASCAT data and CMOD5.n, but they show a similar increasing trend with the incidence angle increasing from 30° to 50°. The AH18 spectrum yields larger upwind–downwind NRCS differences than the A spectrum, which is more consistent with the reference data, while the results produced by the Cosine, Sech, and Gaussian directional spreading functions are almost the same over the whole incidence angle range of 30°–50°. At moderate winds, different wave spectra yield rather different incidence angle dependences of the upwind–downwind differences. The AH18 spectrum produces a faster increasing trend at lower incidence angles and a faster decreasing trend at higher incidence angles. The transition angle is about 37° for all the three spreading functions. By comparison, the A spectrum yields a much slower increasing and decreasing trend, and a larger transition angle that is approximately within 46°–48°. The upwind–downwind difference estimated with the Cosine spreading function is the largest, followed by the Sech one, and the Gaussian one is the smallest. The best agreement with CMOD5.n is obtained by the AH18 + Gaussian at lower incidence angles, while at higher incidence angles it is the A + Gaussian. The ASCAT data are close to the AH18 spectrum with all three spreading functions when the incidence angle <44°, but in good agreement with the A + Gaussian at incidence angles larger than 44°. At high winds, the upwind–downwind differences first increase then decrease with the incidence angle increasing, and the transition angle is approximately 37°. All the six directional wave spectra yield rather good results, expect that the simulations based on the AH18 + Cosine and AH18 + Gaussian underestimate the results of CMOD5.n over the incidence angles of 30°–50°. In general, the A spectrum + Sech achieves the best agreement with CMOD5.n. However, the results predicted by the CMOD5.n and modified model are in poor agreement with the ASCAT data at a high wind speed. That might be because the amount of ASCAT data is insufficient at a high wind speed, and the upwind–downwind NRCS differences calculated by the ASCAT data are not accurate enough.
At an incidence angle of 30°, the A spectrum and the AH18 spectrum yield slightly different behaviors of the upwind–downwind differences with wind speed, while that produced by the different spreading functions is rather similar. All the six wave directional spectra yield an increasing trend as wind speed changes from 3 m/s to 16 m/s, which is not consistent with the slightly decreasing trend seen in CMOD5.n when the wind speed is less than 7 m/s. The discrepancies at low wind speeds could be attributed to the uncertainties in the bispectrum, which become greater with decreasing wind speeds. In general, the A + Gaussian performs better than the others over the wind speed range from 3 m/s to 16 m/s compared with CMOD5.n. Compared with the ASCAT data, all the six directional wave spectra and CMOD5.n underestimate the upwind–downwind differences at wind speeds lower than 10 m/s. At an incidence angle of 40°, the AH18 spectrum, regardless of the spreading function used, yields a different trend with wind speed compared to CMOD5.n at wind speeds of 3 m/s-16 m/s, and so does the A + Cosine. Overall, the upwind–downwind differences estimated with the A + Gaussian show the best agreement with CMOD5.n for different wind speeds. The AH18 + Sech performs better when the wind speed is lower than 10 m/s compared with the ASCAT data. At an incidence angle of 50°, none of the six directional wave spectra yield the decreasing trend seen in CMOD5.n with wind speed at wind speeds less than about 6 m/s. When the wind speed is greater than 6 m/s, the differences between the upwind and downwind NRCSs estimated with the A + Cosine reach the same magnitude as those in CMOD5.n. The A + Sech and A + Gaussian have better agreement with the ASCAT data. The upwind–downwind differences from the ASCAT data first increase and then decrease with the increase in wind speed, and this trend can be well simulated by the A + Sech and A + Gaussian.
Overall, compared with the ASCAT data, the AH18 + Sech performs better at low and moderate incidence angles, while the A + Sech and A + Gaussian spectra work better at high incidence angles. Compared with the CMOD5.n, the A + Gaussian generally has overall satisfactory performance in predicting the upwind–downwind differences at different conditions, except for the high wind condition, where the A + Sech has better performance.

4. Discussion

From the results above, we can see that the upwind–downwind asymmetry could be well described by the modified TSM with the A spectrum input at different wind speeds and incidence angles. However, we find that the modified TSM performs poorly in predicting upwind/crosswind anisotropy. Here, we scale the anisotropy by the B parameter, defined as (σ0(upwind) + σ0(downwind)—2σ0(crosswind))/2. Figure 11 shows estimations of B based on the modified TSM using different directional wave spectra, and their comparisons with the ASCAT data and CMOD5.n; Figure 11a–c as functions of incidence angle at wind speeds of 3 m/s, 9 m/s, and 16 m/s, and Figure 11d–f as functions of wind speed at incidence angles of 30°, 40°, and 50°. As can be seen, the use of different wave spectra has little effect on the prediction of the B values, while the B values estimated with different spreading functions are rather different. We can see that none of the directional spreading functions provide reasonably good agreement with the ASCAT data and CMOD5.n in predicting upwind/crosswind anisotropy, though the Gaussian spreading function performs relatively better than the other two spreading functions. In other words, all the three directional spreading functions—the Cosine form, the Sech form, and the Gaussian form—cannot well describe the upwind/crosswind anisotropy of ocean backscatter. This might be due to the fact that most of the existing directional spreading functions cannot describe the directionality of the short gravity waves [48]. In [48], Du et al. constructed an improved spreading function based on the Cosine spreading function to describe the upwind–crosswind asymmetry of L-band ocean surface backscattering. That is to say, an improved spreading function also needs to be developed to better describe the C-band upwind/crosswind anisotropy.
Furthermore, the applicability of the modified TSM at high wind speeds is discussed here. It can be seen from Figure 10 that the spreading function has little influence on the variation trend of NRCS and upwind–downwind asymmetry with wind speed. Therefore, the Gaussian distribution function, which has overall good performance, is selected here. Table 3, Table 4 and Table 5 show the ζ values at different wind speeds and incidence angles of 30°, 40°, and 50° based on the A and AH18 wave spectra. It can be seen that the ζ value first increases sharply and then decreases with wind speed increasing, and the transition wind speed is approximately 25 m/s.
Figure 12 shows the upwind–downwind asymmetry predicted by the modified TSM with A + Gaussian and AH18 + Gaussian input, and their comparison with CMOD5.n as functions of wind speed at incidence angles of 30°, 40°, and 50° at high wind speeds of 16-30 m/s. The results show that, compared with CMOD5.n, the upwind–downwind difference can be well predicted by the modified TSM at high wind speeds under different incidence angles, except that the prediction of CMOD5.n gradually decreases with wind speed at the wind speeds of 16–19 m/s under incidence angle of 40°, while the results of modified model show an increasing trend. Although the upwind–downwind difference predicted by the modified model is highly consistent with CMOD5.n, the predictions of modified TSM in upwind and downwind directions gradually deviate from the results of CMOD5.n and the measurements with wind speed increasing. This may be because the wind wave spectra only work well at low and moderate wind speeds, and are no longer accurate at high wind speeds.

5. Conclusions

Knowledge of the ocean backscatter at various azimuth angles is important for the interpretation of microwave remote sensing data. However, the azimuth angle dependence of ocean radar backscatter cannot be accurately described at present due to the lack of a clear understanding of the non-Gaussianity of the ocean surface. The numerical estimation of the ocean backscatter at different azimuth angles is affected by the selection of the directional wave spectra. In this paper, the effects of directional wave spectra on the prediction of ocean backscatter at various azimuth angles with the modified TSM improved based on CMOD5.n are investigated over the wind speed range of 3–16 m/s, the wind direction range of 0°–360°, and the incidence angle range of 30°–50° by comparing the simulated results with the ASCAT data and CMOD5.n.
At first, the skewness-related parameter ζ in the modified TSM was estimated based on CMOD5.n under various incidence angles and wind speeds for different wave directional spectra. Results show that the magnitude of ζ increases quadratically with wind speed increasing, and generally it first increases and then decreases with the incidence angle. The sensitivity of ζ to the incidence angle is much weaker than to wind speed. The estimation of ζ is slightly affected by the selection of the wave spectra, but is barely affected by the use of different spreading functions.
Then, the simulated results with the modified TSM were compared with CMOD5.n and the ASCAT measurements to discover the effects of different wave spectra and directional spreading functions on the prediction of azimuthal features of ocean radar backscatter. The results show that in upwind, downwind, and crosswind directions, the overall performance of the modified TSM under different wind speeds and incidence angles is highly dependent on the selection of the wave spectra. The AH18 spectrum has better performance at low and moderate wind speeds over an incidence angle range of 30°–50°, while the A spectrum works better at a high wind speed. In addition, the difference in upwind–downwind NRCSs depends on the selection of the wave spectra as well, and the A spectrum generally works better.
Nevertheless, the wave spectra have little effect on the azimuthal fluctuation of scattering. The azimuthal fluctuation of scattering is highly dependent on the type of directional spreading function. The relative patterns of azimuthal undulation produced by different spreading functions are rather different at different wind speeds, whereas they are mostly similar at different incidence angles. At a low wind speed, the scattering estimated with the Sech spreading function has greater ups and downs with wind direction, while at moderate and high wind speeds, the Gaussian spreading function produces the largest ups and downs. The Gaussian spreading function generally has better performance in predicting the azimuthal fluctuation of scattering, except that the Cosine and Sech spreading functions work better at moderate wind speed when the incidence angle is low.

Author Contributions

Conceptualization, C.F. and Q.Y.; methodology, Y.W. and Q.Y.; software, Y.W.; validation, T.S., J.M. and J.Z.; writing—original draft preparation, Q.Y. and Y.W.; writing—review and editing, Q.Y. and C.F.; funding acquisition, J.Z. and J.M. All authors have read and agreed to the published version of the manuscript.

Funding

This work was supported by the National Natural Science Foundation of China under Grant 61931025, by the Key Program of Joint Fund of the National Natural Science Foundation of China and Shandong Province under Grant U2006207, by the Fundamental Research Funds for the Central Universities under Grant 21CX06015A, and by the Fund of Technology Innovation Center for Ocean Telemetry, Ministry of Natural Resources under Grant 2022003.

Data Availability Statement

Not applicable.

Acknowledgments

The authors would like to thank EUMETSAT for providing electronic access to the ASCAT data. The authors would also like to thank NDBC for providing the buoy data.

Conflicts of Interest

The authors declare no conflict of interest.

References

  1. Rice, S.O. Reflection of electromagnetic waves from slightly rough surfaces. Commun. Pure Appl. Math. 1951, 4, 351–378. [Google Scholar] [CrossRef]
  2. Khenchaf, A. Bistatic scattering and depolarization by randomly rough surfaces: Application to the natural rough surfaces in X-band. Waves Random Media 2001, 11, 61–89. [Google Scholar] [CrossRef]
  3. Bass, F.G.; Fuks, I.M. Wave Scattering from Statistically Rough Surface; Pergamon: Oxford, NY, USA, 1979; pp. 418–442. [Google Scholar]
  4. Voronovich, A.G. Small-slope approximation for electromagnetic wave scattering at a rough interface of two dielectric half-spaces. Waves Random Media 1994, 4, 337–367. [Google Scholar] [CrossRef]
  5. Fung, A.K.; Li, Z.; Chen, K.S. Backscattering from a randomly rough dielectric surface. IEEE Trans. Geosci. Remote Sens. 1992, 30, 356–369. [Google Scholar] [CrossRef]
  6. Hwang, P.A. Comparison of composite Bragg theory and quad-polarization radar backscatter from RADARSAT-2: With applications to wave breaking and high wind retrieval. J. Geophys. Res. Oceans 2010, 115, C11099. [Google Scholar] [CrossRef]
  7. Rizaev, I.G.; Karakuş, O.; Hogan, S.J.; Achim, A. Modeling and SAR imaging of the sea surface: A review of the state-of-the-art with simulations. ISPRS J. Photogramm. Remote Sens. 2022, 187, 120–140. [Google Scholar] [CrossRef]
  8. Zhang, M.; Chen, H.; Yin, H.-C. Facet-based investigation on EM scattering from electrically large sea surface with two-scale profiles: Theoretical model. IEEE Trans. Geosci. Remote Sens. 2011, 49, 1967–1975. [Google Scholar] [CrossRef]
  9. Wan, Y.; Zhang, X.; Dai, Y.; Shi, X. Research on a method for simulating multiview ocean wave synchronization data by networked sar satellites. J. Mar. Sci. Eng. 2019, 7, 180. [Google Scholar] [CrossRef]
  10. Di Martino, G.; Iodice, A.; Riccio, D. Closed-form anisotropic polarimetric two-scale model for fast evaluation of sea surface backscattering. IEEE Trans. Geosci. Remote Sens. 2019, 57, 6182–6194. [Google Scholar] [CrossRef]
  11. Li, D.; Zhao, Z.; Qi, C.; Huang, Y.; Zhao, Y.; Nie, Z. An improved two-scale model for electromagnetic backscattering from sea surface. IEEE Geosci. Remote Sens. Lett. 2020, 17, 953–957. [Google Scholar] [CrossRef]
  12. Wang, T.; Tong, C. An improved facet-based tsm for electromagnetic scattering from ocean surface. IEEE Geosci. Remote Sens. Lett. 2018, 15, 644–648. [Google Scholar] [CrossRef]
  13. Awada, A.; Ayari, M.Y.; Khenchaf, A. Bistatic scattering from an anisotropic sea surface: Numerical comparison between the first-order SSA and the TSM models. Wave Random Complex 2006, 16, 383–394. [Google Scholar] [CrossRef]
  14. Vaitilingom, L.; Khenchaf, A. Radar Cross Section of Sea and Ground Clutter Estimated by Two Scale Model and Small Slope Approximation in HF-VHF Bands. Electromagn Waves 2011, 29, 311–338. [Google Scholar] [CrossRef]
  15. Sajjad, N.; Khenchaf, A.; Coatanhay, A. Depolarization of electromagnetic waves from bare soil surfaces. In Scientific Computing in Electrical Engineering SCEE 2010; Springer: Berlin/Heidelberg, Germany, 2012; Volume 16, pp. 107–115. [Google Scholar]
  16. Ayari, M.Y.; Khenchaf, A.; Coatanhay, A. Simulations of the bistatic scattering using two-scale model and the unified sea spectrum. J. Appl. Remote Sens. 2007, 1, 013532. [Google Scholar] [CrossRef]
  17. Arnold-Bos, A.; Khenchaf, A.; Martin, A. Bistatic radar imaging of the marine environment—Part I: Theoretical background. IEEE Trans. Geosci. Remote Sens. 2007, 45, 3372–3383. [Google Scholar] [CrossRef]
  18. Longuet-Higgins, M.S. On the skewness of sea-surface slopes. J. Phys. Ocean 1982, 12, 1283–1291. [Google Scholar] [CrossRef]
  19. Chen, K.S.; Fung, A.K.; Amar, F. An empirical bispectrum model for sea surface scattering. IEEE Trans. Geosci. Remote Sens. 1993, 31, 830–835. [Google Scholar] [CrossRef]
  20. Xie, D.; Chen, K.S.; Yang, X. Effect of bispectrum on radar backscattering from non-Gaussian sea surface. IEEE J. Sel. Topics Appl. Earth Observ. Remote Sens. 2019, 12, 4367–4378. [Google Scholar] [CrossRef]
  21. Bourlier, C. Upwind-downwind asymmetry of the sea backscattering normalized radar cross section versus the skewness function. IEEE Trans. Geosci. Remote Sens. 2018, 56, 17–24. [Google Scholar] [CrossRef]
  22. Bourlier, C. Azimuthal harmonic coefficients of the microwave backscattering from a non-Gaussian ocean surface with the first-order SSA model. IEEE Trans. Geosci. Remote Sens. 2004, 42, 2600–2611. [Google Scholar] [CrossRef]
  23. Wang, Y.H.; Guo, L.X.; Wu, Z.S. Modified two-scale model for electromagnetic scattering from the non-Gaussian oceanic surface. Chin. Phys. Lett. 2005, 22, 2808–2811. [Google Scholar]
  24. Hwang, P.A.; Plant, W.J. An analysis of the effects of swell and surface roughness spectra on microwave backscatter from the ocean. J. Geophys. Res. Ocean. 2010, 115. [Google Scholar] [CrossRef]
  25. Zheng, H.; Khenchaf, A.; Wang, Y.; Ghanmi, H.; Zhang, Y.; Zhao, C. Sea surface monostatic and bistatic EM scattering using SSA-1 and UA VSAR data: Numerical evaluation and comparison using different sea spectra. Remote Sens. 2018, 10, 1084. [Google Scholar] [CrossRef]
  26. Xie, D.; Chen, K.S.; Yang, X. Effects of wind wave spectra on radar backscatter from sea surface at different microwave bands: A numerical study. IEEE Trans. Geosci. Remote Sens. 2019, 57, 6325–6334. [Google Scholar] [CrossRef]
  27. Miao, Y.; Dong, X.; Bourassa, M.A.; Zhu, D. Effects of ocean wave directional spectra on Doppler retrievals of ocean surface current. IEEE Trans. Geosci. Remote Sens. 2021, 60, 1–12. [Google Scholar] [CrossRef]
  28. La, T.V.; Khenchaf, A.; Comblet, F. Assessment of wind speed estimation from C-band Sentinel-1 images using empirical and electromagnetic models. IEEE Trans. Geosci. Remote Sens. 2018, 56, 4075–4087. [Google Scholar] [CrossRef]
  29. La, T.V.; Khenchaf, A.; Comblet, F. Exploitation of C-band Sentinel-1 images for high-resolution wind field retrieval in coastal zones (Iroise Coast, France). IEEE J. Sel. Topics Appl. Earth Observ. Remote Sens. 2017, 10, 5458–5471. [Google Scholar] [CrossRef]
  30. Zhang, B.; Perrie, W.; He, Y. Wind speed retrieval from RADARSAT-2 quad-polarization images using a new polarization ratio model. J. Geophys. Res. Oceans 2011, 116, 1–13. [Google Scholar] [CrossRef]
  31. Verspeek, J.; Stoffelen, A.; Portabella, M. Validation and calibration of ASCAT using CMOD5.n. IEEE Trans. Geosci. Remote Sens. 2009, 48, 386–395. [Google Scholar] [CrossRef]
  32. Wu, Y.; Fan, C.; Yan, Q.; Zhang, J. Modified Two-Scale Model for Better Prediction of the Up/Down Wind Asymmetry in Radar Backscattering from the Ocean Surface. IGARSS 2022, 2022, 1991–1994. [Google Scholar]
  33. Wilson, J.J.; Anderson, C.; Baker, M.A.; Bonekamp, H.; Saldaña, J.F.; Dyer, R.G.; Lerch, J.A.; Kayal, G.; Gelsthorpe, R.V.; Brown, M.A.; et al. Radiometric calibration of the advanced wind scatterometer radar ASCAT carried onboard the METOP-A satellite. IEEE Trans. Geosci. Remote Sens. 2010, 48, 3236–3255. [Google Scholar] [CrossRef]
  34. Liu, W.T.; Tang, W. Equivalent Neutral Wind; JPL Publ. Lab: Pasadena, CA, USA, 1996; pp. 17–96. [Google Scholar]
  35. Plant William, J. Effects of wind variability on scatterometry at low wind speeds. J. Geophys. Res. Oceans 2000, 105, 16899–16910. [Google Scholar] [CrossRef]
  36. Apel, J.R. An improved model of the ocean surface wave vector spectrum and its effects on radar backscatter. J. Geophys. Res. Oceans 1994, 99, 16269–16291. [Google Scholar] [CrossRef]
  37. Elfouhaily, T.; Chapron, B.; Katsaros, K.; Vandemark, D. A unified directional spectrum for long and short wind-driven waves. J. Geophys. Res. Oceans 1997, 102, 15781–15796. [Google Scholar] [CrossRef]
  38. Hwang, P.A.; Fan, Y. Low-frequency mean square slopes and dominant wave spectral properties: Toward tropical cyclone remote sensing. IEEE Trans. Geosci. Remote Sens. 2018, 56, 7359–7368. [Google Scholar] [CrossRef]
  39. Donelan, M.A.; Hamilton, J.; Hui, W.H. Directional spectra of wind-generated waves. Philos. Trans. R. Soc. London Ser. A Math. Phys. Sci. 1985, 315, 509–562. [Google Scholar]
  40. Banner, M.L. Equilibrium spectra of wind waves. J. Phys. Oceanogr. 1990, 20, 966–984. [Google Scholar] [CrossRef]
  41. Plant, W.J. A two-scale model of short wind-generated waves and scatterometry. J. Geophys. Res. Oceans 1986, 91, 10735–10749. [Google Scholar] [CrossRef]
  42. Cox, C.; Munk, W. Measurement of the roughness of the sea surface from photographs of the Sun’s Glitter. J. Opt. Soc. Amer. 1954, 44, 838–850. [Google Scholar] [CrossRef]
  43. Hwang, P.A.; Fois, F. Surface roughness and breaking wave properties retrieved from polarimetric microwave radar backscattering. J. Geophys. Res. Oceans 2015, 120, 3640–3657. [Google Scholar] [CrossRef]
  44. Yurovskaya, M.V.; Dulov, V.A.; Chapron, B. Directional short wind wave spectra derived from the sea surface photography. J. Geophys. Res. Oceans 2013, 118, 4380–4394. [Google Scholar] [CrossRef]
  45. Tayfun, M.A. On narrow-band representation of ocean waves: 1. Theory. J. Geophys. Res. Oceans 1986, 91, 7743–7752. [Google Scholar] [CrossRef]
  46. Nouguier, F.; Guérin, C.A.; Chapron, B. “Choppy wave” model for nonlinear gravity waves. J. Geophys. Res. Oceans 2009, 114, 1–14. [Google Scholar] [CrossRef]
  47. Wu, Y.; Fan, C.; Yan, Q.; Meng, J.; Song, T.; Zhang, J. Effects of Wind Wave Spectra, Non-Gaussianity, and Swell on the Prediction of Ocean Microwave Backscatter with Facet Two-Scale Model. Remote Sens. 2023, 15, 1469. [Google Scholar] [CrossRef]
  48. Du, Y.L.; Yang, X.F.; Chen, K.S. An Improved Spectrum Model for Sea Surface Radar Backscattering at L-Band. Remote Sens. 2017, 9, 776. [Google Scholar] [CrossRef]
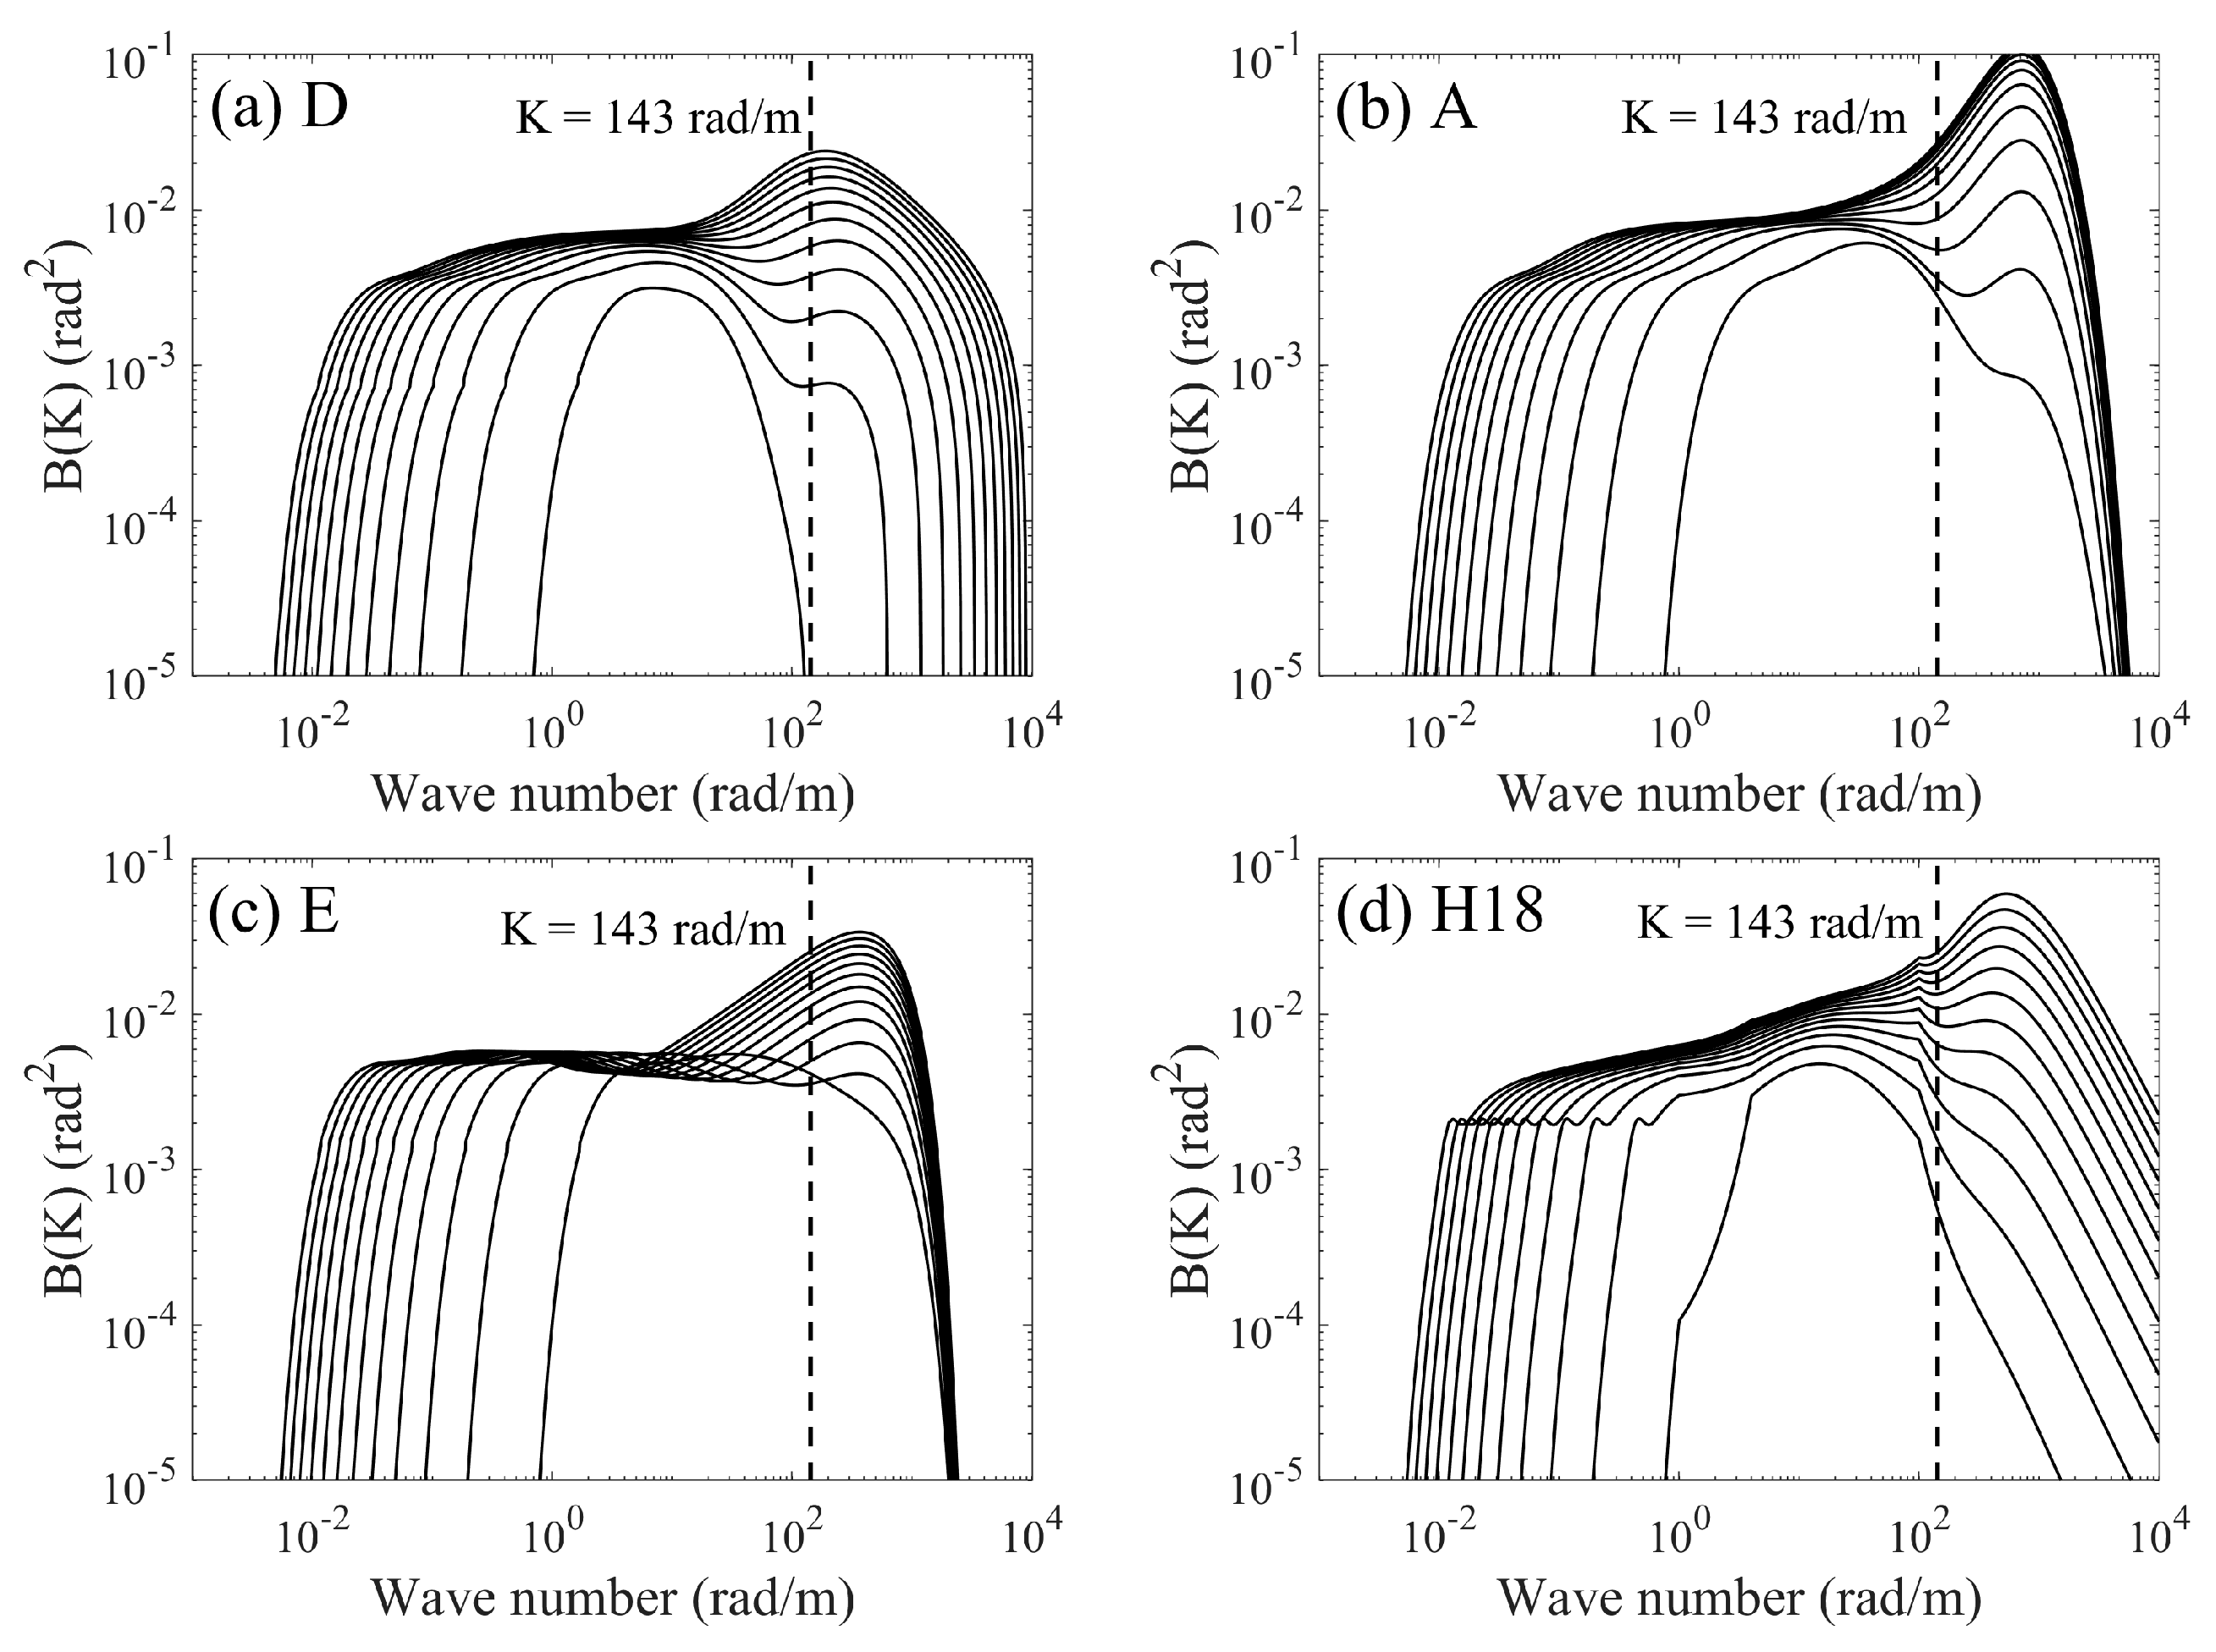
Figure 1. Curvature spectra B(K) in log−log scales: (a) the D spectrum, (b) the A spectrum, (c) the E spectrum, and (d) the H18 spectrum. Wind speed increases upward from 2 m/s to 24 m/s in 2 m/s steps.
Remotesensing 15 02191 g001
Figure 2. The (a) Cosine, (b) Sech, and (c) Gaussian spreading functions at 10 m/s wind speed for wave numbers of 0.1, 1, 10, and 100 rad/m.
Remotesensing 15 02191 g002
Figure 3. Comparison of distributions of Gaussian sea surface and Tayfun sea surface based on the A spectrum and Cosine spreading function at 10 m/s wind speed and 30° incidence angle along upwind direction. (a) Pdfs for surface elevation; (b) Pdfs for slope along range direction. Blue solid curve, Gaussian sea surface; red dashed curve, non−Gaussian sea surface constructed by Tayfun model.
Remotesensing 15 02191 g003
Figure 4. Estimations of the ζ parameter with the use of different directional wave spectra of D + Cosine, D + Sech, D + Gaussian, A + Cosine, A + Sech, A + Gaussian, E + Cosine, E + Sech, E + Gaussian, H18 + Cosine, H18 + Sech, and H18 + Gaussian as a function of incidence angle (ac) at wind speed of 3 m/s, (df) at wind speed of 9 m/s, (gi) at wind speed of 16 m/s.
Remotesensing 15 02191 g004
Figure 5. Estimations of the ζ parameter with the use of different directional wave spectra of D + Cosine, D + Sech, D + Gaussian, A + Cosine, A + Sech, A + Gaussian, E + Cosine, E + Sech, E + Gaussian, H18 + Cosine, H18 + Sech, and H18 + Gaussian as functions of wind speed (ac) at incidence angle of 30°, (df) at incidence angle of 40°, (gi) at incidence angle of 50°.
Remotesensing 15 02191 g005
Figure 6. Example of comparison of the NRCSs predicted by the modified TSM (solid curves) and the conventional TSM (dashed curves) using different wave spectra and the Cosine spreading function, and their comparisons with CMOD5.n at wind speed of 16 m/s and incidence angle of 50°. (a) Results obtained with the D and A spectra. (b) Results obtained with the E and H18 spectra.
Remotesensing 15 02191 g006
Figure 7. Simulated NRCSs based on A + Cosine, A + Sech, and A + Gaussian, and their comparison with the ASCAT data and CMOD5.n as functions of incidence angle at wind speeds of 3 m/s, 9 m/s, and 16 m/s in the (ac) upwind direction, (df) downwind direction, and (gi) crosswind direction.
Remotesensing 15 02191 g007
Figure 8. Simulated NRCSs based on D + Cosine, A + Cosine, E + Cosine, H18 + Cosine, AH18 + Cosine, and AEH18 + Cosine, and their comparison with the ASCAT data and CMOD5.n as functions of incidence angle at wind speeds of 3 m/s, 9 m/s, and 16 m/s along the (ac) upwind direction, (df) downwind direction, and (gi) crosswind direction.
Remotesensing 15 02191 g008
Figure 9. Predictions of the modified TSM using A + Cosine, A + Sech, A + Gaussian, AH18 + Cosine, AH18 + Sech, and AH18 + Gaussian, and their comparisons with CMOD5.n and the ASCAT measurements. (ac) At incidence angle of 30° under wind speeds of 3 m/s, 9 m/s, and 16 m/s. (df) At incidence angle of 50° under wind speeds of 3 m/s, 9 m/s, and 16 m/s.
Remotesensing 15 02191 g009aRemotesensing 15 02191 g009b
Figure 10. Upwind–downwind asymmetry predicted by the modified TSM with different wave directional spectra input, and their comparison with the ASCAT and CMOD5.n. (ac) As a function of incidence angle at wind speeds of 3 m/s, 9 m/s, and 16 m/s. (df) As a function of wind speed at incidence angles of 30°, 40°, and 50°.
Remotesensing 15 02191 g010
Figure 11. Upwind–crosswind anisotropy predicted by the modified TSM with different directional wave spectra input, and their comparisons with the ASCAT data and CMOD5.n. (ac) Results plotted as functions of incidence angle for wind speeds of 3 m/s, 9 m/s, and 16 m/s. (df) Results plotted as functions of wind speed for incidence angles of 30°, 40°, and 50°.
Remotesensing 15 02191 g011
Figure 12. Upwind–downwind asymmetry predicted by the modified TSM with A + Gaussian and AH18 + Gaussian input at high wind speeds, and their comparison with CMOD5.n as functions of wind speed (a) at incidence angle of 30°, (b) at incidence angle of 40°, and (c) at incidence angle of 50°.
Remotesensing 15 02191 g012
Table 1. The offset (bias) and standard deviation (std) of the simulated NRCS shown in Figure 8 relative to CMOD5.n.
Wave Spectrum3 m/s9 m/s16 m/s
30°–40°40°–50°30°–40°40°–50°30°–40°40°–50°
Biasstd Biasstd Biasstd Biasstd Biasstd Biasstd
D−8.20.8−6.60.6−3.10.9−1.61.0−2.80.6−2.20.6
A2.40.63.30.50.41.02.01.0−0.90.60.20.6
E2.40.84.10.7−0.91.00.71.0−2.30.5−1.50.5
H18−1.90.3−2.00.5−1.80.5−1.40.8−2.10.5−2.00.6
AH180.70.41.40.4−0.60.80.70.9−1.40.5−0.60.5
AEH181.40.62.50.6−0.70.80.70.9−1.70.5−1.00.5
The results of best-performing wave spectra in different cases are marked in red and bold.
Table 2. The offset (bias) and standard deviation (std) of the simulated NRCS shown in Figure 8 relative to the ASCAT measurements.
Wave Spectrum3 m/s9 m/s16 m/s
30°–40°40°–50°30°–40°40°–50°30°–40°40°–50°
Biasstd Biasstd Biasstd Biasstd Biasstd Biasstd
D −8.91.0−6.70.7−2.50.9−1.01.0−2.40.7−1.80.8
A 1.70.83.20.51.00.92.61.0−0.50.70.60.9
E 1.81.14.00.7−0.31.01.31.0−1.90.7−1.10.9
H18 −2.60.4−2.10.4−1.20.5−0.80.8−1.80.7−1.60.8
AH18 0.10.71.30.40.10.71.31.0−1.00.8−0.20.7
AEH18 0.70.82.40.6−0.10.81.31.0−1.20.7−0.60.9
The results of best-performing wave spectra in different cases are marked in red and bold.
Table 3. The ζ values at different wind speeds under incidence angle of 30°.
Wave
Spectrum
Wind Speed (m/s)
161718192021222324252627282930
A0.801.001.401.802.403.405.008.0029.0025.009.005.004.003.002.00
AEH180.801.001.401.802.403.405.008.0029.0025.009.005.004.003.002.00
Table 4. The ζ values at different wind speeds under incidence angle of 40°.
Wave SpectrumWind Speed (m/s)
161718192021222324252627282930
A0.841.001.401.802.203.204.808.0027.0024.009.005.004.003.002.50
AEH180.841.001.401.802.203.204.808.0027.0024.009.005.004.003.002.50
Table 5. The ζ values at different wind speeds under incidence angle of 50°.
Wave SpectrumWind Speed (m/s)
16 1718192021222324252627282930
A0.801.001.201.602.002.804.207.0025.0022.008.005.003.003.002.00
AEH180.801.001.201.602.002.804.207.0025.0022.008.005.003.003.002.00
Disclaimer/Publisher’s Note: The statements, opinions and data contained in all publications are solely those of the individual author(s) and contributor(s) and not of MDPI and/or the editor(s). MDPI and/or the editor(s) disclaim responsibility for any injury to people or property resulting from any ideas, methods, instructions or products referred to in the content.