Article

A Spatiotemporal Drought Analysis Application Implemented in the Google Earth Engine and Applied to Iran as a Case Study

by
Adel Taheri Qazvini
and
Daniela Carrion
*
Politecnico di Milano, Department of Civil and Environmental Engineering, Piazza L. da Vinci, 32, 20133 Milan, Italy
*
Author to whom correspondence should be addressed.
Remote Sens. 2023, 15(9), 2218; https://doi.org/10.3390/rs15092218
Submission received: 28 February 2023 / Revised: 15 April 2023 / Accepted: 19 April 2023 / Published: 22 April 2023

Abstract

:
Drought is a major problem in the world and has become more severe in recent decades, especially in arid and semi-arid regions. In this study, a Google Earth Engine (GEE) app has been implemented to monitor spatiotemporal drought conditions over different climatic regions. The app allows every user to perform analysis over a region and for a period of their choice, benefiting from the huge GEE dataset of free and open data as well as from its fast cloud-based computation. The app implements the scaled drought condition index (SDCI), which is a combination of three indices: the vegetation condition index (VCI), temperature condition index (TCI), and precipitation condition index (PCI), derived or calculated from satellite imagery data through the Google Earth Engine platform. The De Martonne climate classification index has been used to derive the climate region; within each region the indices have been computed separately. The test case area is over Iran, which shows a territory with high climate variability, where drought has been explored for a period of 11 years (from 2010 to 2021) allowing us to cover a reasonable time series with the data available in the Google Earth Engine. The developed tool allowed the singling-out of drought events over each climate, offering both the spatial and temporal representation of the phenomenon and confirming results found in local and global reports.

1. Introduction

1.1. What Is Drought?

Climate change and global warming have been two main concerns in recent decades and have contributed to put at least 45 countries at risk of drought [1]. In the latest (2022) report of Intergovernmental Panel on Climate Change (IPCC) [2], it is mentioned that terrestrial, freshwater, coastal, and open ocean marine ecosystems have all suffered significant harm from climate change. The United Nations Office for Disaster Risk Reduction says that drought has affected 1.5 billion people since the turn of the century and led to an economic loss of more than USD 124 billion across the world, while indirect loss is impossible to measure [3]. Drought is a periodic phenomenon that can last for weeks or decades and affects significant portions of the Earth [1]. As we know, drought happens when there is a period of lower than normal precipitation which declines streamflow, drops lake and reservoir levels, and decreases groundwater levels [4]. Drought impacts are widespread and can affect the transportation system, soil quality, ecosystem, energy generation, global export, etc. [5]. Its indirect and cascading impacts can also affect employment rates, food security, and international trade [6].
Droughts are commonly grouped into three basic types, namely meteorological, hydrological, and agricultural drought [7]. Meteorological drought is the most important and main type of drought that occurs when the amount of rainfall over a period is less than a threshold [5]. If meteorological drought continues, it will lead to hydrological drought [8] which is the result of the depletion of water resources, decline of groundwater and rivers, and the drying of aqueducts in a certain period [9]. Agricultural drought is caused by a decrease in soil moisture during the growing season of plants [10].

1.2. Climate Classification

Aridity is the extent to which a climate lacks productive moisture or, as far as a climate is concerned, aridity is the opposite of humidity [5,11]. The aridity index (AI) has been developed based on aridity that is defined as the ratio of precipitation to mean temperature [12,13]. This index is a reliable tool for classifying climate and examining the dryness or humidity of any region [14]. Many different aridity indices have been suggested for different parts of the world [15]. To be more specific, the indices suggested by Lang (1920), De Martonne (1926), UNESCO (1979), and UNEP (1992) have been used by many scientists to indicate spatial variation of aridity in lots of areas [16,17]. A very well-known aridity parameter, especially in European countries, is the De Martonne aridity index (IDM) [15,18], which can be calculated for different time scales, such as months, seasons, oryears [19].

1.3. Drought Indices

In studies of last decades, droughts have been analyzed and classified mostly through station observations [8,20]. One effective in situ parameter that has been mostly used is the standardized precipitation index (SPI), which provides information on meteorological drought by measuring precipitation anomalies based on a comparison of observed total precipitation amounts for an accumulation period of interest (e.g., 1, 3, 6, 12, or 48 months) with the long-term historical precipitation record [21,22]. However, in areas with limited sampling, station-based drought indicators are not suitable for expressing drought conditions [23,24]. Furthermore, there might be other problems such as an epidemic or a war, conditions which could prevent accessing field data. In particular, when the availability of field data is limited, remote sensing can be used as a valid source of information [25]. In the last few decades, more and more drought indices have been using remote sensing data, which can provide useful information on the spatial and temporal distribution of drought [26,27]. In the 1970s, the normalized difference vegetation index (NDVI) [28] was developed for the AVHRR satellite to assess and monitor drought [29,30]. Then, in 1995, Kogan and his team provided vegetation condition index (VCI), and temperature condition index (TCI) for drought monitoring and management, which are based on NDVI and land surface temperature (LST) [31,32]. TCI can monitor the weather-related vegetation soil stress and with VCI, agricultural drought is detected [33]; however, among the researchers exploiting remote sensing, TCI and VCI are the most widely used indicators in drought monitoring [34].

1.4. Previous Research on Drought

In 1999, the US Space Agency (NASA) launched the MODIS sensor. Since then, its products have been widely used to monitor vegetation changes and assess drought and other natural hazards, such as floods or fires [35,36]. In addition to TCI and VCI indicators precipitation should be considered as well in order to effectively detect drought [27]. In 2013, Du et al. defined the precipitation condition index (PCI), which is an indicator of rainfall conditions in a particular year, and which will be later defined in Section 2.2.3. In order to monitor and assess drought, another indicator, called the scaled drought condition index (SDCI) can be defined [37], which is a combination of VCI, TCI, and PCI, using different empirical weights [38]. Han et al. [39] conducted a study in 2019 with the aim of assessing drought using several remote sensing measurement sources in China. In this research, they have found a relationship between PCI, TCI and VCI to calculate drought. Another study in China by Pei et al. in 2018 [40] with the aim of monitoring plant health using TCI, VCI, and vegetation health index (VHI) indicators noted that the relationship between these indicators varies in different regions. In 2019, Shen et al. [41] used a multi-satellite sensor to monitor drought by using MODIS satellite images and precipitation data, and they introduced a new index called the comprehensive meteorological drought index (CI) to analyze drought in the USA.

1.5. Drought Monitoring Services

Furthermore, it is relevant to mention available services which provide drought maps at a continental or country scale. In the framework of the Copernicus program, in particular within the Copernicus Emergency Management System (CEMS), the European Commission developed two services based on satellite observation and field data for drought monitoring. These services are called the European Drought Observatory and Global Drought Observatory (EDO and GDO, respectively), and they provide data and information regarding drought over Europe and worldwide. EDO produces continuously updated drought indicators called the standardized precipitation Index (SPI), soil moisture anomaly (SMA), and fraction of absorbed photosynthetically active radiation (FAPAR anomaly) at the European scale and then combines them as a single index called the combined drought indicator (CDI). CDI can monitor the affected area or the area that may be affected by drought and categorizes the event in three main classes: “Watch”, which denotes below-average precipitation; “Warning”, which denotes a lack of soil moisture; and “Alert”, which denotes stressed plants [42]. The stages of the vegetation recovery process are shown by two further groups called “Partial recovery” and “Recovery” (Figure 1). GDO, on the other hand, maps the risk of drought for agriculture (RDrI-Agri) over the globe and provides the drought risk with specific attention to the impacts on agricultural sector for every country [43]. RdrI-Agri is calculated as a combination of dynamic layers of drought hazard, exposure, and vulnerability; as Figure 2 shows, it classifies the drought risk for agriculture in three levels (low, medium, and high). It is a good indicator to define the ranking and comparison of the input geographic regions; however, it cannot express or measure absolute losses or damage to human wellbeing and/or to the environment [43].
The US Drought Monitor (USDM), established in 1999, is a map released every Thursday showing the drought conditions in the US. It is produced jointly by the National Oceanic and Atmospheric Administration, the US Department of Agriculture, and the National Drought Mitigation Center (NDMC). The map uses five classifications, including abnormally dry (D0), which shows areas that can enter and exit the drought, and four levels of drought: moderate (D1), severe (D2), extreme (D3), and exceptional (D4). What is unique about the drought monitor is that it is not based on modeling only. In fact, USDM relies on experts to integrate the best data available from multiple sources and work with local observers to localize information as much as possible.

1.6. Iran as a Study Area for Drought Monitoring

While drought has always been a global threat, climate change projections suggest that the arid and semi-arid areas will experience droughts that are more frequent and more severe [1]. Drought in these areas can endanger food security, human health, and if not adequately managed, it could accelerate social instability as well. Iran is a country which faces these conditions; it is located in a special geographical position, between 25°N and 32.6°N and from 44.7°E to 54.4°E in the northern hemisphere, showing a high climate variability from arid to very humid. Studies have shown that this country suffers from an arid climate, and it is at risk of drought [44]. Drought has been studied in this country over the years, as discussed in the following, and many scientists have used remote sensing data to detect and study drought. For example, in January 2022 Safarianzengir et al. [45] conducted research about meteorological drought condition in Iran and its impact on the environment. To do so, they used NDVI and Palmer drought severity index indicators (PDSI) to monitor drought and estimate the soil moisture by the soil moisture calculation index (SMAP). Findings showed an increase in the severity and frequency of drought in recent years and a decrease in soil moisture, stating the inverse relationship between drought intensity and soil moisture. Shahabfar et al. [46] studied the meteorological drought condition in Iran between 2000 and 2005 and mentioned that the use of remote sensing indicators for monitoring drought can be highly beneficial. In another study by Hamzeh et al. [47], the spatiotemporal agricultural drought in the area of Markazi province of Iran was analyzed from 2009 to 2013 using different remote sensed data (TCI, VCI, transformed difference vegetation index (TDVI), and soil water index (SWI)) and each of them was separately compared to the standard precipitation index (SPI). The outcomes showed that the VCI has the best consistency in the province of Markazi and was selected for monitoring the agricultural drought. In 2019, Reza Doustan [48] collected and categorized the history of drought studies in Iran. He noted that several articles have dealt with drought problems in Iran, and half of them have used remote sensing data to study one aspect of drought and aridity. In addition, a review of the research background shows that studies conducted in this country used only indicators such as NDVI, VCI, TCI, and SPI separately to assess drought in the province or the city scale. However, in most studies around the world, combined indicators are proposed to assess drought. As the literature review shows, remote sensing-based indicators are widely used to monitor drought, its intensity and duration. Looking into those studies in Iran, it is possible to notice that scientists mostly used single indicators such as VCI, TCI, VHI, etc., to assess drought in some regions or provinces or that they assessed one type of drought such as agricultural, meteorological, or hydrological [29,47,49]. Furthermore, this country possesses a variety of climates from arid to very humid, and it is necessary to study each climate separately in order to get better results. In this paper, we propose the use of the SDCI combined indicator, applied over homogenous climate zones.

1.7. Remote Sensing-Based Monitoring of Drought with Google Earth Engine

The tools designed and discussed in this paper aim to provide decision makers and researchers with an automatic instrument for visualizing the evolution of drought over a territory from both a spatial and temporal point of view. Differently to other available platforms, the provided tools take into account the classification of the area of interest into climate zones according to the De Martonne aridity index. Then, VCI, TCI, and PCI indices are computed and combined to obtain the comprehensive scaled drought condition index (SDCI) for each climate class, providing maps with information which is consistent with respect to the climate characteristics of the territory. The processing is performed with the Google Earth Engine platform (GEE) and made available through two publicly available apps, taking advantage of remote sensing-based data. The implementation of the indices computation in GEE provides the users with fast retrieval of the data and allows them to obtain up-to-date results thanks to the constant update of remote sensing time-series data and the very fast cloud-based computation offered by GEE. The availability of up-to-date information is crucial to support emergency management: the indices can be calculated on a regular basis (e.g., every two weeks); the decision makers can build their own drought analysis panel [25] and see what has changed with respect to the other periods of interest.

2. Materials and Methods

2.1. Study Area

According to scientists, water security in the Middle East is likely to remain a major concern over the coming decades [50,51,52]. Iran is one of the countries where water security is generally low and has been further impacted by the effects of climate change [49]. The Iranian annual renewable water resources fell gradually from 3938 m3 per capita in 1977 to 1675 m3 per capita in 2018 and with the current population growth rate (~1.19 %; CIA, 2020), it is expected to reduce and to reach a value of less than 1000 m3 per capita by 2025 [53,54].
Iranian territory is spread over a 1648 million km2 area; it is the second largest country in the Middle East (after Saudi Arabia) and the sixteenth in the world. It borders the Caspian Sea to the north, the Persian Gulf to the south, and is characterized by a tropical zone to the north and a temperate one to the south.
Iran is characterized by a variable climate and a diverse topography. Iran is also known as “a land of four seasons”, which points out its capability of having one of four seasons at any moment of the year [52]. For instance, during winter (from December to March), although most of the country experiences cold weather (between −10 °C and 5 °C), the temperature does not fall below 20 °C near the Persian Gulf coastline; on the other hand, during summer (from June to September), the temperature does not exceed 15 °C in the northwest part, whereas southern parts have temperature greater than 40 °C. The amount of rainfall also fluctuates across the country; from less than 50 mm per year in the southeast to 1900 mm per year in areas near the Caspian Sea [14]. The average annual rainfall in the country is close to 400 mm, with most of the country receiving less than 100 mm of rain per year. Moreover, nearly 65% of the country is arid or semi-arid [55,56]. Most of the rainfall which the country receives is concentrated in the north of the country, where there are the high mountains of the Alborz [44]. This has contributed to developing a fertile and forested area, depriving the central parts of the country of vital water resources [44]. Figure 3 shows the average annual temperature of Iran between 2010 and 2021. All these geographical and topographical conditions have caused most of Iran to be prone to a variety of weather-related disasters [52] such as floods, fires, and drought. In this research, drought is addressed, which has affected the Iranian plateau, especially in recent decades [57].

2.2. Remotely Sensed Derived Data

In this research, three remotely sensed derived indices (VCI, TCI, and PCI) are used to assess drought condition in Iran from 2010 to 2021. These indicators are computed using Google Earth Engine platform [25], a service allowing to retrieve satellite imagery as well as remote sensing derived products, such as NDVI, LST, and CHIRPS, and to process them in the cloud. Temperature and vegetation parameters are acquired from the MODIS (moderate resolution imaging spectroradiometer) sensor mounted on the Terra satellite [58], and precipitation data calculated by the Climate Hazards Group InfraRed Precipitation with Station (CHIRPS) data [59] are considered. The considered datasets, as well as the sensors they are derived from, are discussed in the following sections. The results are given in maps and charts that are imported into ArcGIS Pro v2.9 and Excel for map production, reclassification, and the presentation of the final outcomes. The results are visible also in the GEE applications (see Section 4.5); however, customized graphs and figures can be produced outside the apps. A flowchart of the whole process for map and chart production is represented in Figure 4.

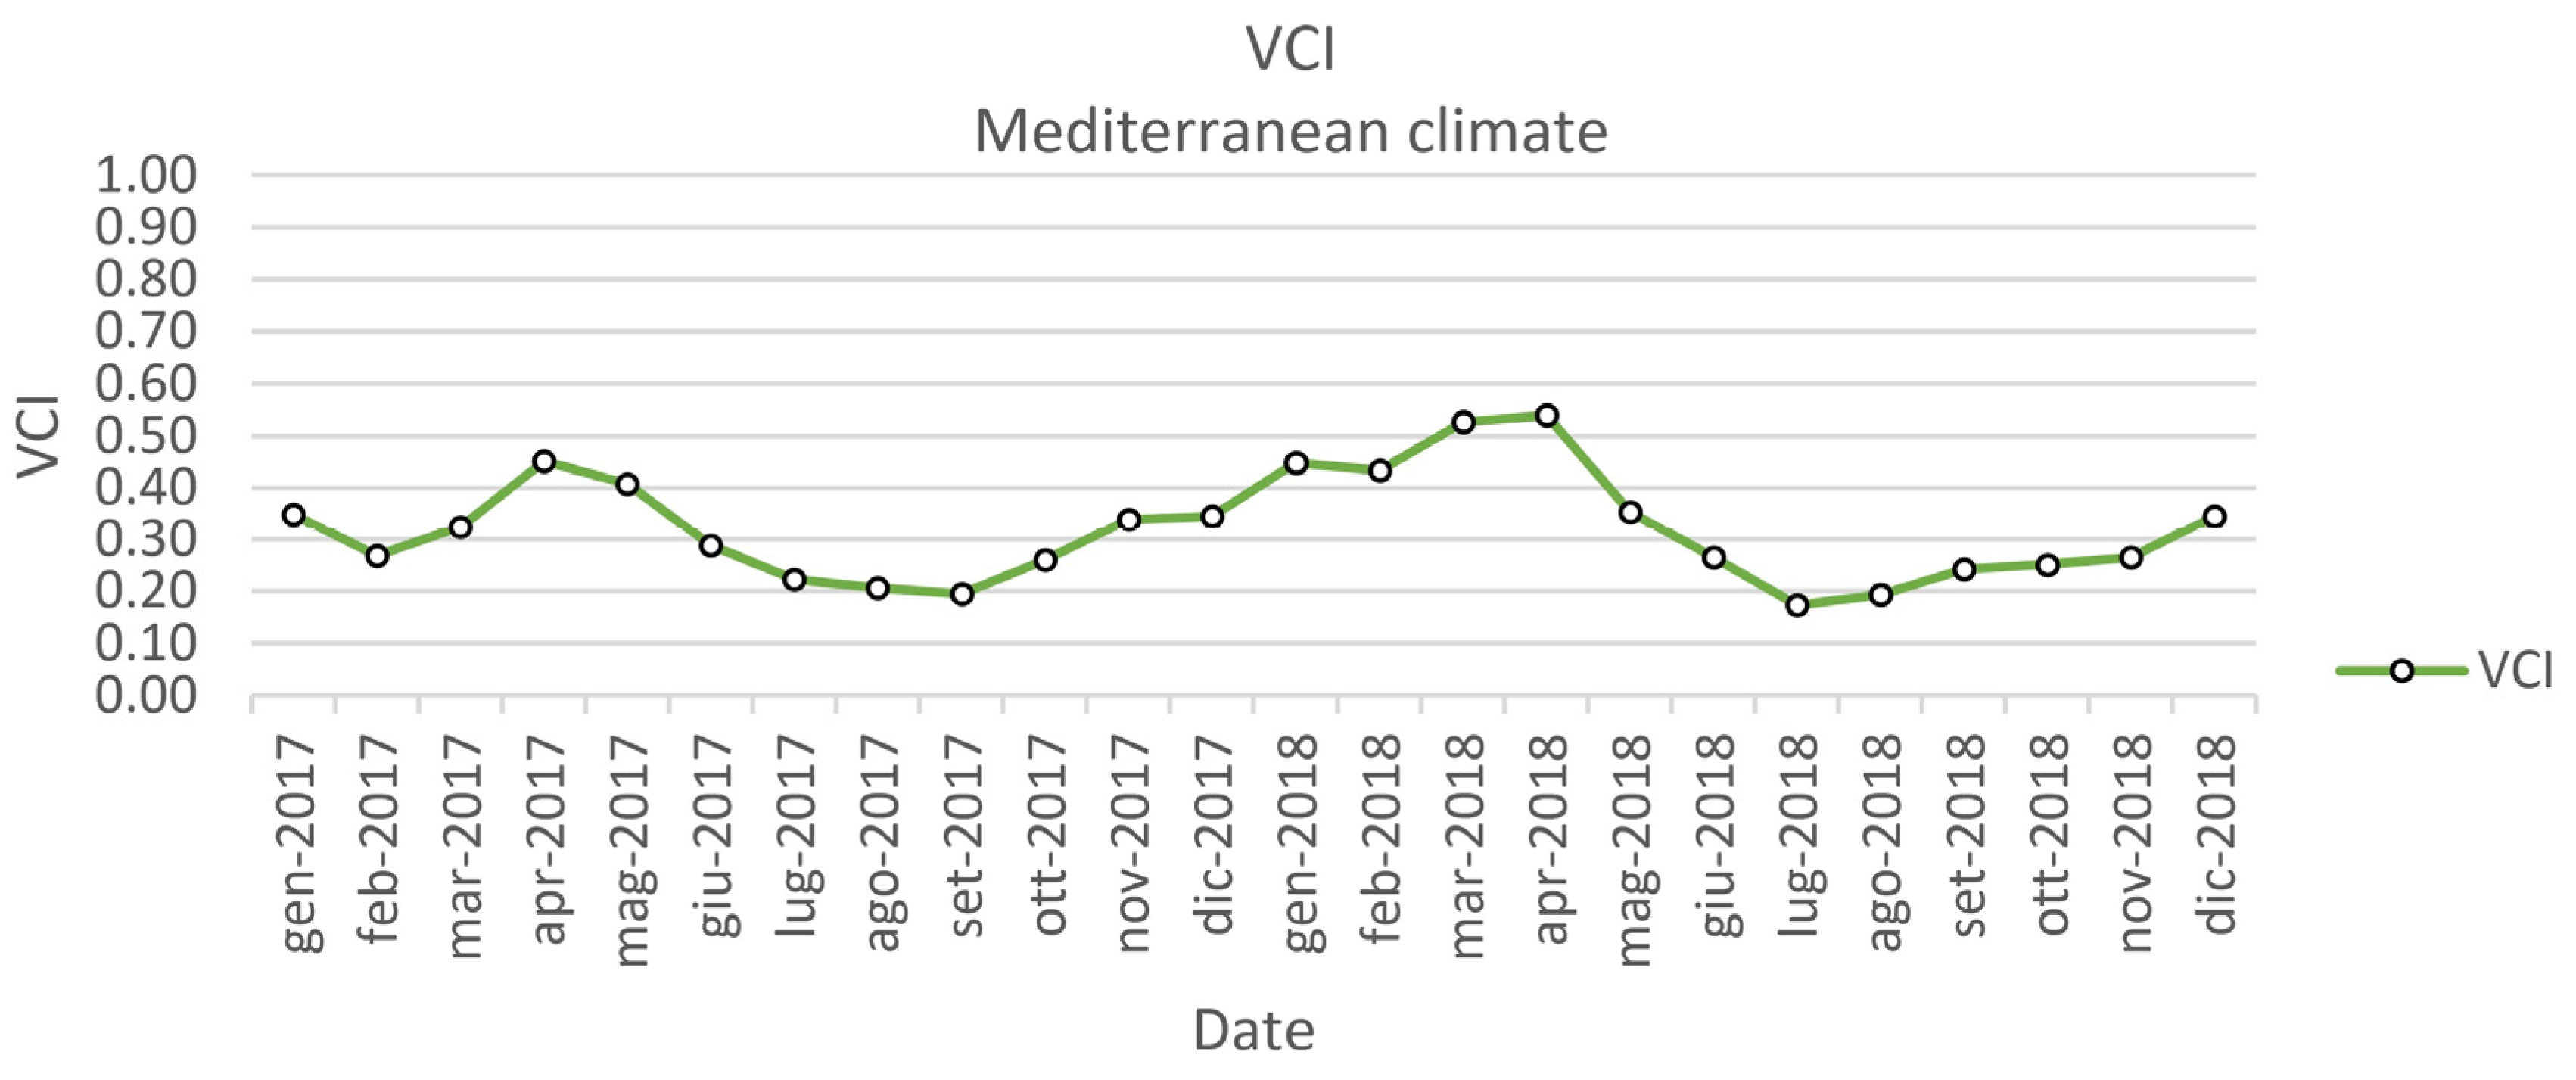
2.2.1. Vegetation Condition Index (VCI)

The National Oceanic and Atmospheric Administration (NOAA) has designed an AVHRR-based vegetation condition index (VCI) that is highly useful for agricultural drought monitoring [32]. VCI compares the current NDVI to the range of values observed in the same period in previous years (Copernicus Global Land Service, https://land.copernicus.eu/global/products/vci, accessed on 21 February 2023) and can detect the vegetation growth in a time interval [60]. VCI is derived using Equation (1) and can provide information about the intensity and extent of drought [32].
VCI = NDVI - NDVImin NDVImax - NDVImin ,
where NDVI, NDVImax, and NDVImin are the average monthly NDVI, and the corresponding multi-year absolute maximum and minimum for the same month as NDVI, respectively. NDVI is obtained using MOD13Q1 which is a product of MODIS sensor and is generated every 16 days at 250 m resolution [60]. Lower and higher values of VCI indicate bad and good vegetation state conditions, respectively. Since VCI is not applicable to water bodies, areas where at least 60% is covered by permanent water bodies are masked from the map. The water bodies have been detected considering the MCD12Q1 product, Version 6.1, that is derived using supervised classifications of MODIS Terra and Aqua reflectance data [61].

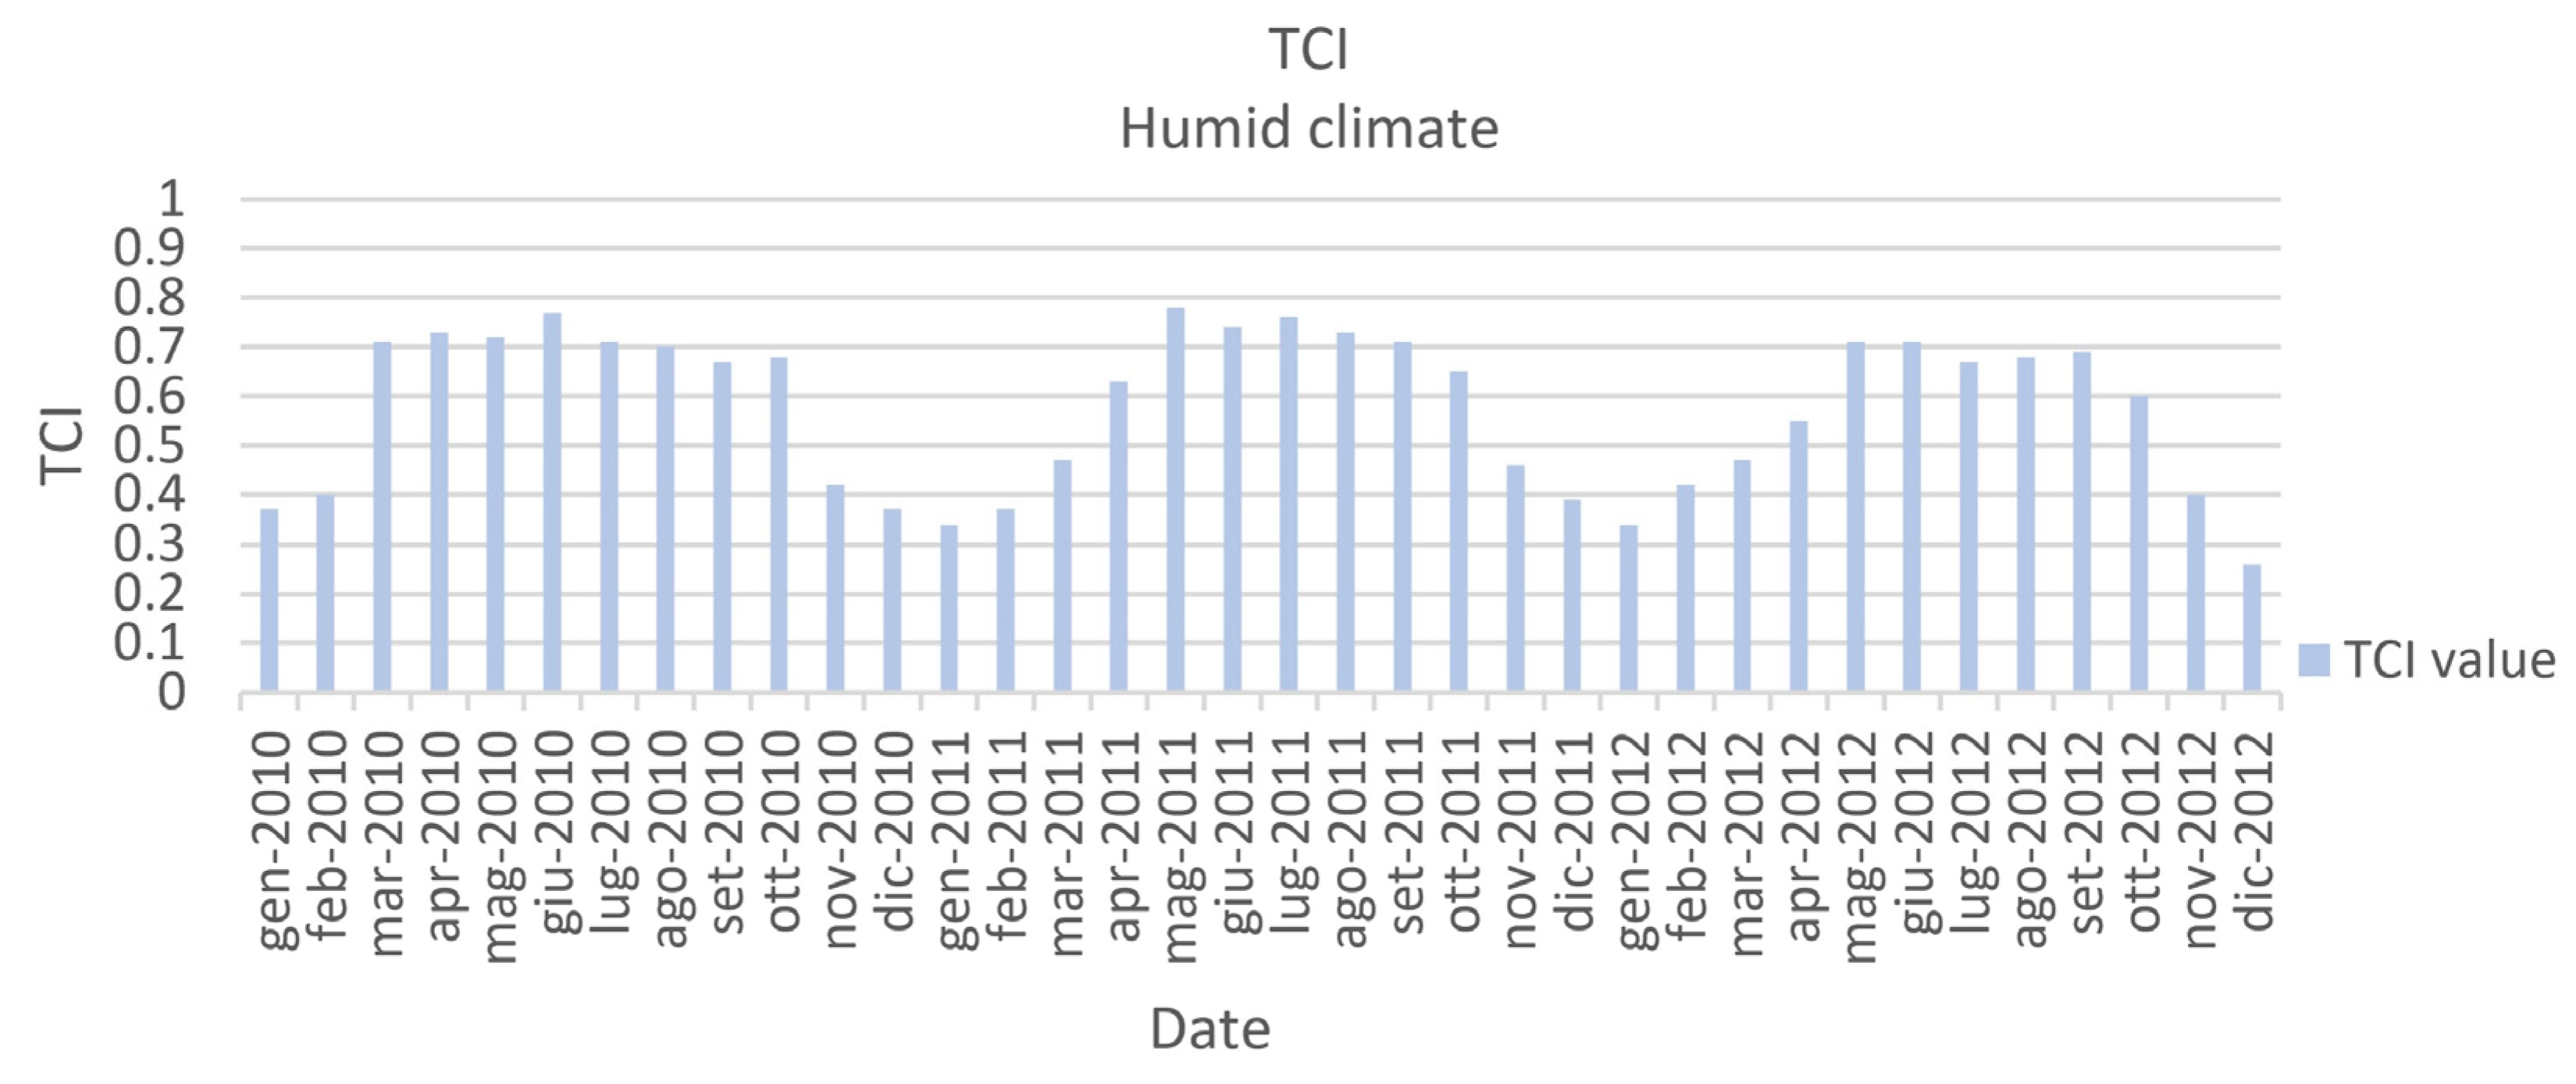
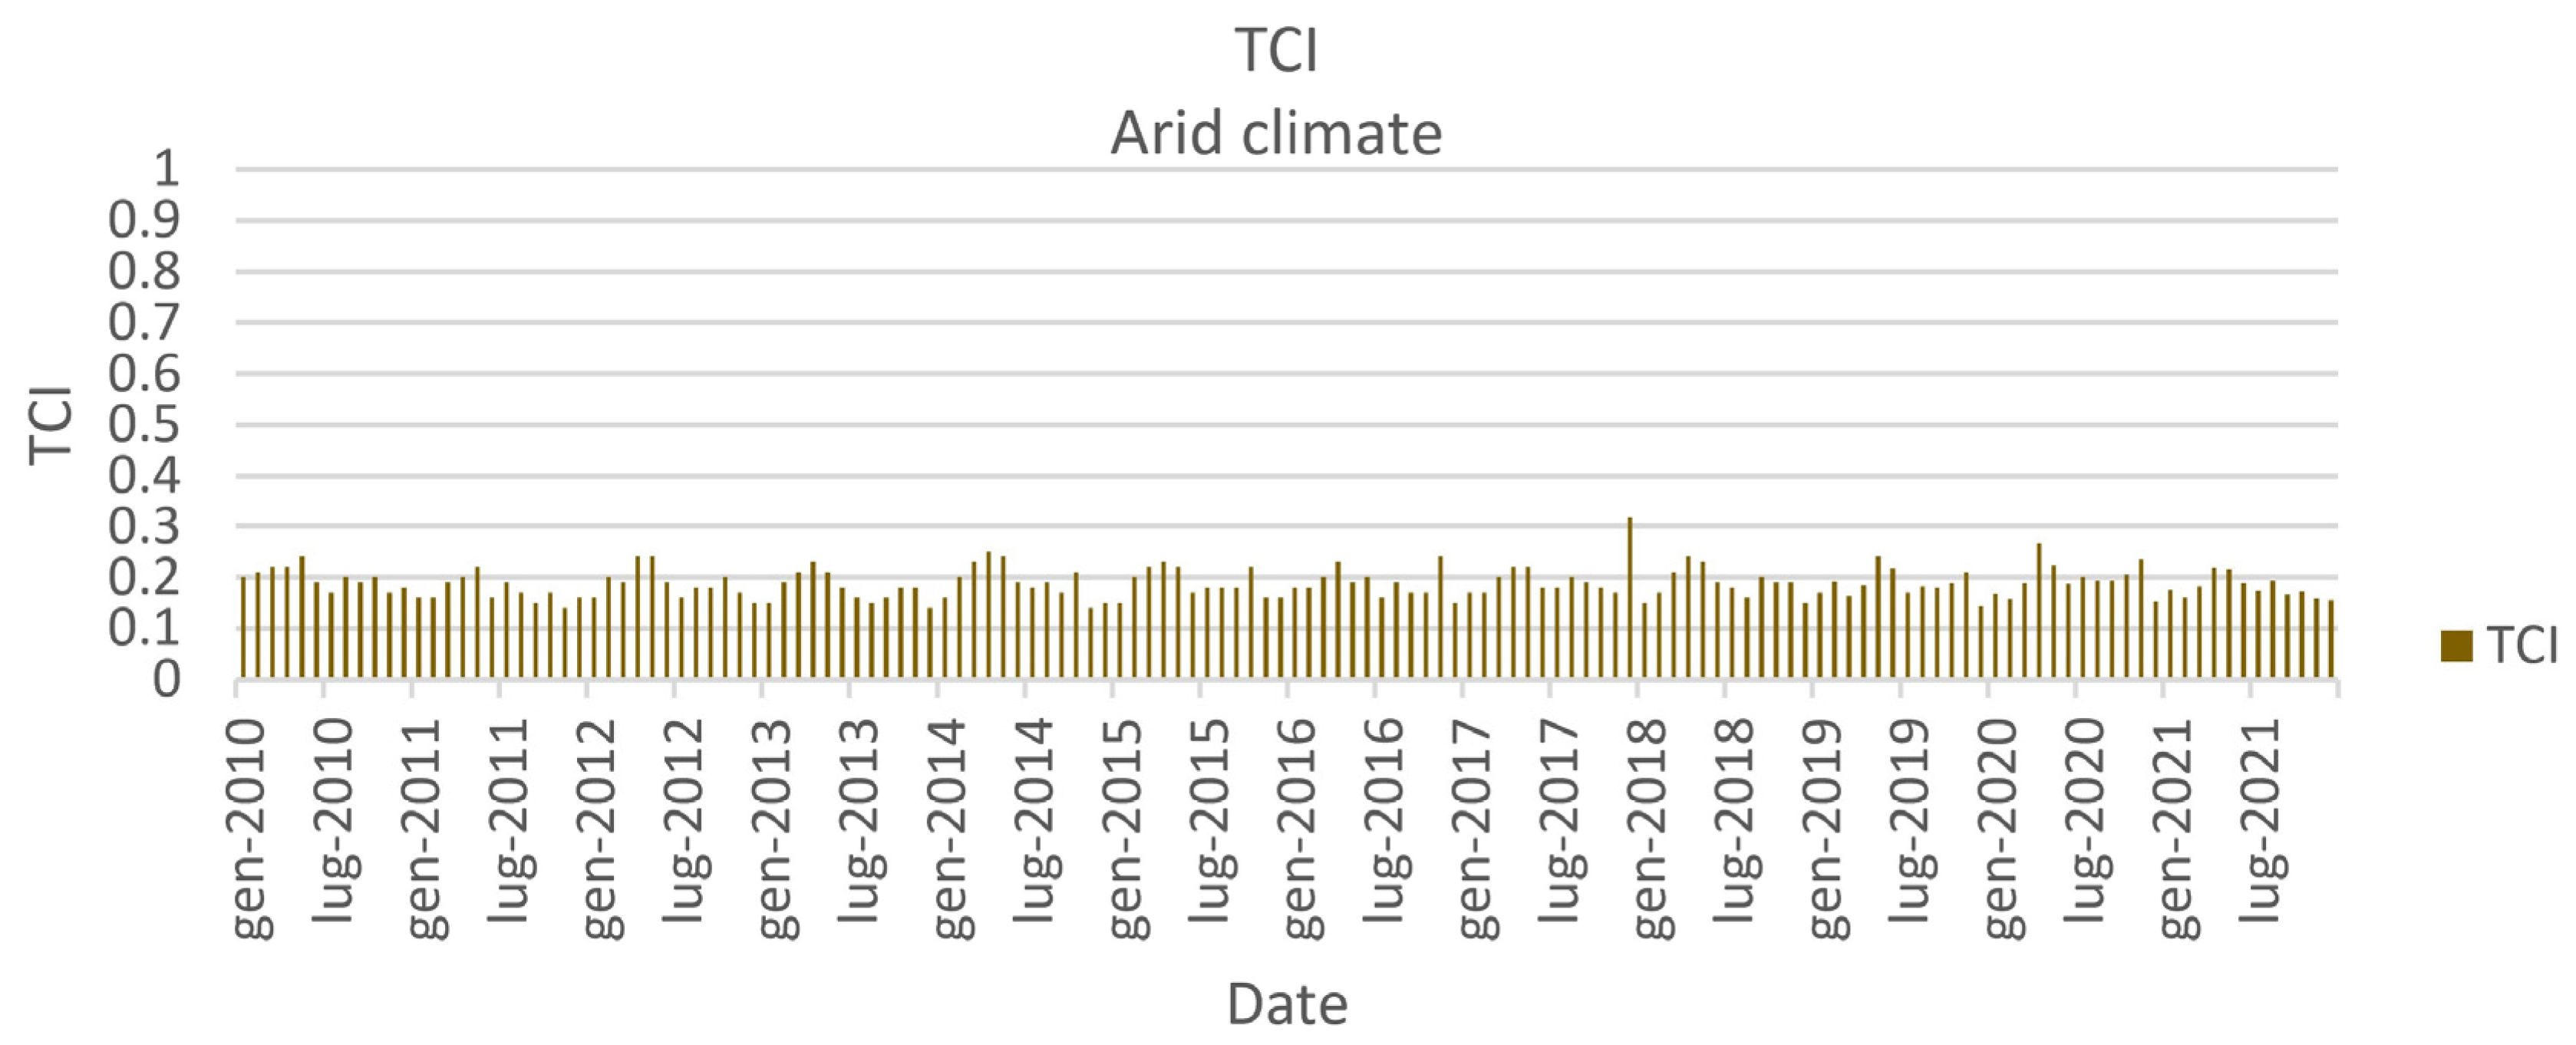
2.2.2. Temperature Condition Index (TCI)

TCI is used to determine temperature-related vegetation stress and stress due to excessive moistness [32]. This indicator has a similar formula with respect to VCI [27]. To calculate TCI, the MOD11A2 products of the MODIS sensor are used that provide land surface temperature (LST) every 8 days with 1000 m spatial resolution [58]. TCI is then obtained using Equation (2) [32]:
TCI = Tmax - T Tmax - Tmin ,
where T, Tmax, and Tmin are the average monthly temperature coming from LST, and its multi-year maximum and minimum for the same month, respectively. TCI varies from 0, for extremely unfavorable temperature conditions, to 1, for optimal temperature conditions.

2.2.3. Precipitation Condition Index (PCI)

Since one of the main causes of aridity in any region is lack of rainfall, in addition to the defined indicators, the amount of rainfall should be explicitly defined. In this research, precipitation condition index (PCI) is calculated using Climate Hazards Group InfraRed Precipitation with Station data (CHIRPS) (https://www.chc.ucsb.edu/data/chirps, accessed on 21 February 2023) and is used to detect the precipitation deficits from climate signals. PCI has the following expression [27]:
PCI = CHIRPS - CHIRPSmin CHIRPSmax - CHIRPSmin ,
where CHIRPS is the monthly average rainfall, and CHIRPSmax and CHIRPSmin are its multi-year maximum and minimum for the same month, respectively. This index ranges from 0 to 1 corresponding to changes in precipitation from extremely unfavorable to optimal rainfall conditions. In case of a meteorological drought which has an extremely low precipitation, PCI is close or equal to 0, and at flooding conditions, PCI is close to 1 [27].

3. Methodology

The approach followed in this paper considers first the classification of the territory into homogeneous climate zones, according to the De Martonne index, and then the SDCI combined index is computed. This allows for the computation of coherent values of TCI, VCI and PCI, in particular over territories where different characteristics are present, such as for the country under study, Iran. The data being used are derived from remote sensing imagery and the processing is automatized in the Google Earth Engine, taking advantage of GEE cloud computing, allowing for periodical monitoring of the territory of interest (e.g., by decision makers).

3.1. Climate Classification

The climate of a region corresponds to its prevailing meteorological characteristics over a long period of time; therefore, it should be determined taking into account long time series of data, such as temperature, rainfall, humidity, radiation, wind etc., [58]. A territory can be characterized by several climate characteristics, and to compute the drought indices in a consistent way it is thus necessary to define areas which are homogeneous from the climate point of view. For this purpose, the De Martonne aridity index (IDM) presented in Equation (4) is used to classify the climate of the area of interest:
IDM = P / ( Ta + 10 ) ,
where P and Ta are the annual amount of rainfall (in millimeters) and the mean annual air temperature in Celsius degrees, respectively. For precipitation P, CHIRPS data have been considered and temperature Ta has been taken from MOD11A2 product of MODIS satellite. For the test case of this paper, a time series of 11 years is considered, from January 2010 to December 2021, and data have been retrieved using Google Earth Engine platform. Based on De Martonne aridity index, the types of climates listed in Table 1 can be singled out [18].

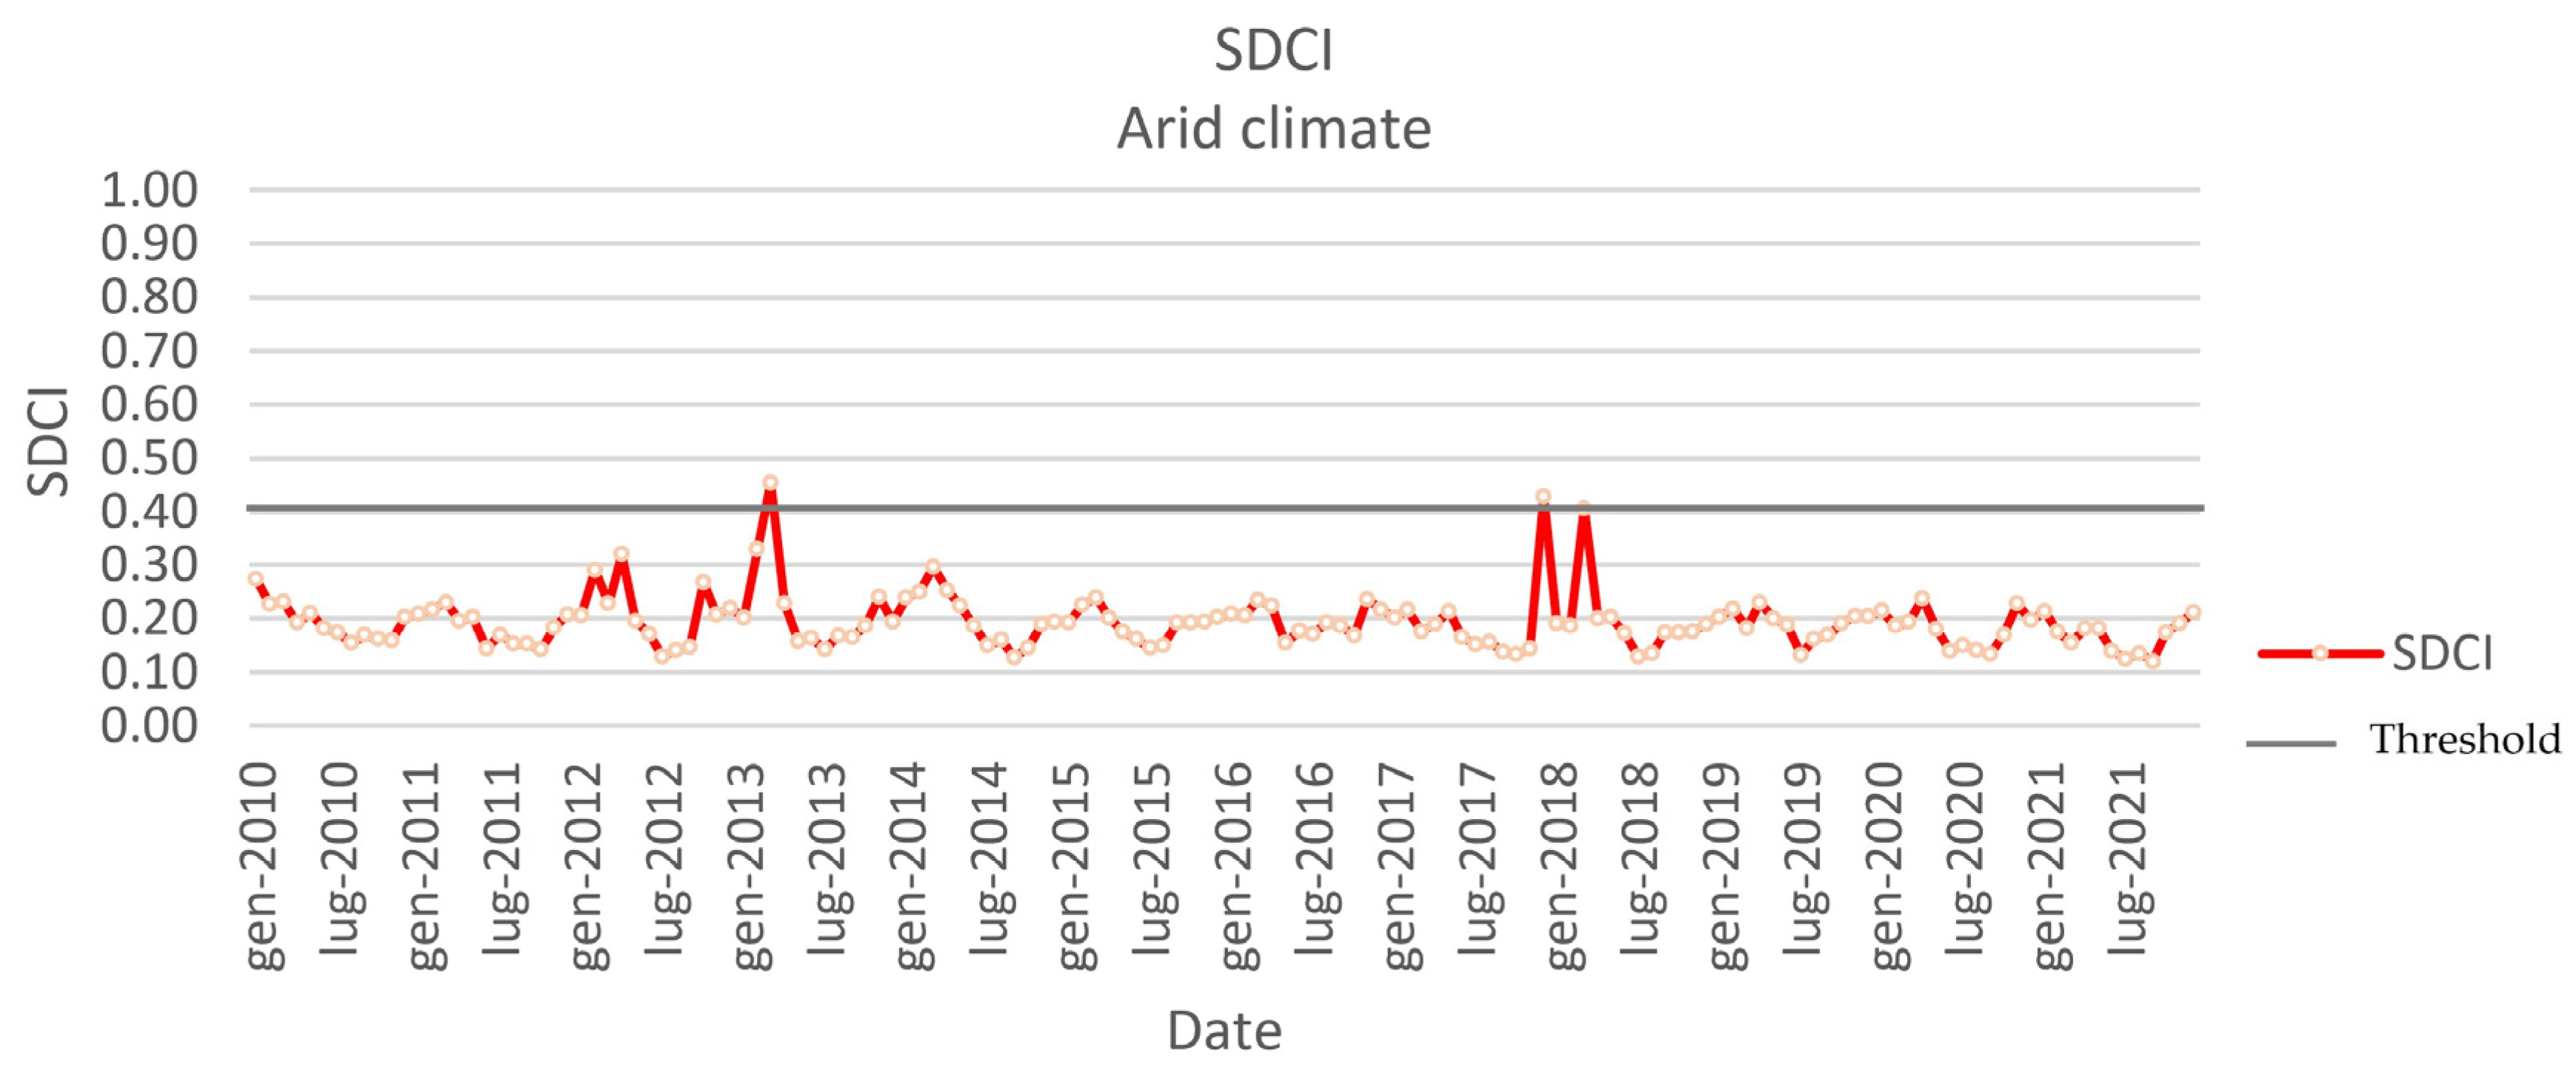
3.2. Scaled Drought Combined Indicator (SDCI)

Since the climate classes obtained from the De Martonne aridity index are based on long-term precipitation and temperature data, we assume that the precipitation pattern and temperature are similar within each class. Therefore, instead of a temporal analysis of drought over the whole country or territory of interest, it is possible to consider each climatic region separately and obtain changes in the VCI, TCI, and PCI indices for each region. Then, the indices are combined into a high-level indicator called the scaled drought condition index (SDCI) [37], which allows observing the drought condition and its extent and shows various aspects of agricultural, meteorological, and hydrological drought [38]. Another advantage of the SDCI is that in addition to the possibility of monitoring drought in arid and semi-arid regions, it allows studying drought in humid and semi-humid areas as well [37]. This index is calculated differently according to the type of climate as Equation (5) shows, precipitation contributes more in semi-humid, humid, and very humid climates. In Mediterranean, semi-arid and arid zones, PCI, TCI, and VCI have the same empirical weights according to Equation (6) as it is found in literature [37,38]. The classification of drought based on this index is shown in Table 2.
SDCI = 1 2   PCI + 1 4   TCI + 1 4   VCI
For semi humid, humid, and very humid climate and
SDCI = 1 3   PCI + 1 3   TCI + 1 3   VCI
for arid, semi-arid, and Mediterranean climates.

4. Results of Drought Analysis over Iran

First, the climate classification of Iran obtained with the De Martonne index is presented, then, the spatial and temporal distribution of drought over Iran from January 2010 to December 2021 evaluated with SDCI is presented and described in the following sections. It should be noted that undesirable temperatures (very high or very low) combined with low precipitation result in low values of VCI and SDCI, which means drought conditions prevail. The graphs showing the most relevant changes have been selected and discussed in the following sections, while the full set of results is available at https://github.com/ADELTaheri/Drought-analyisis-data-and-results.

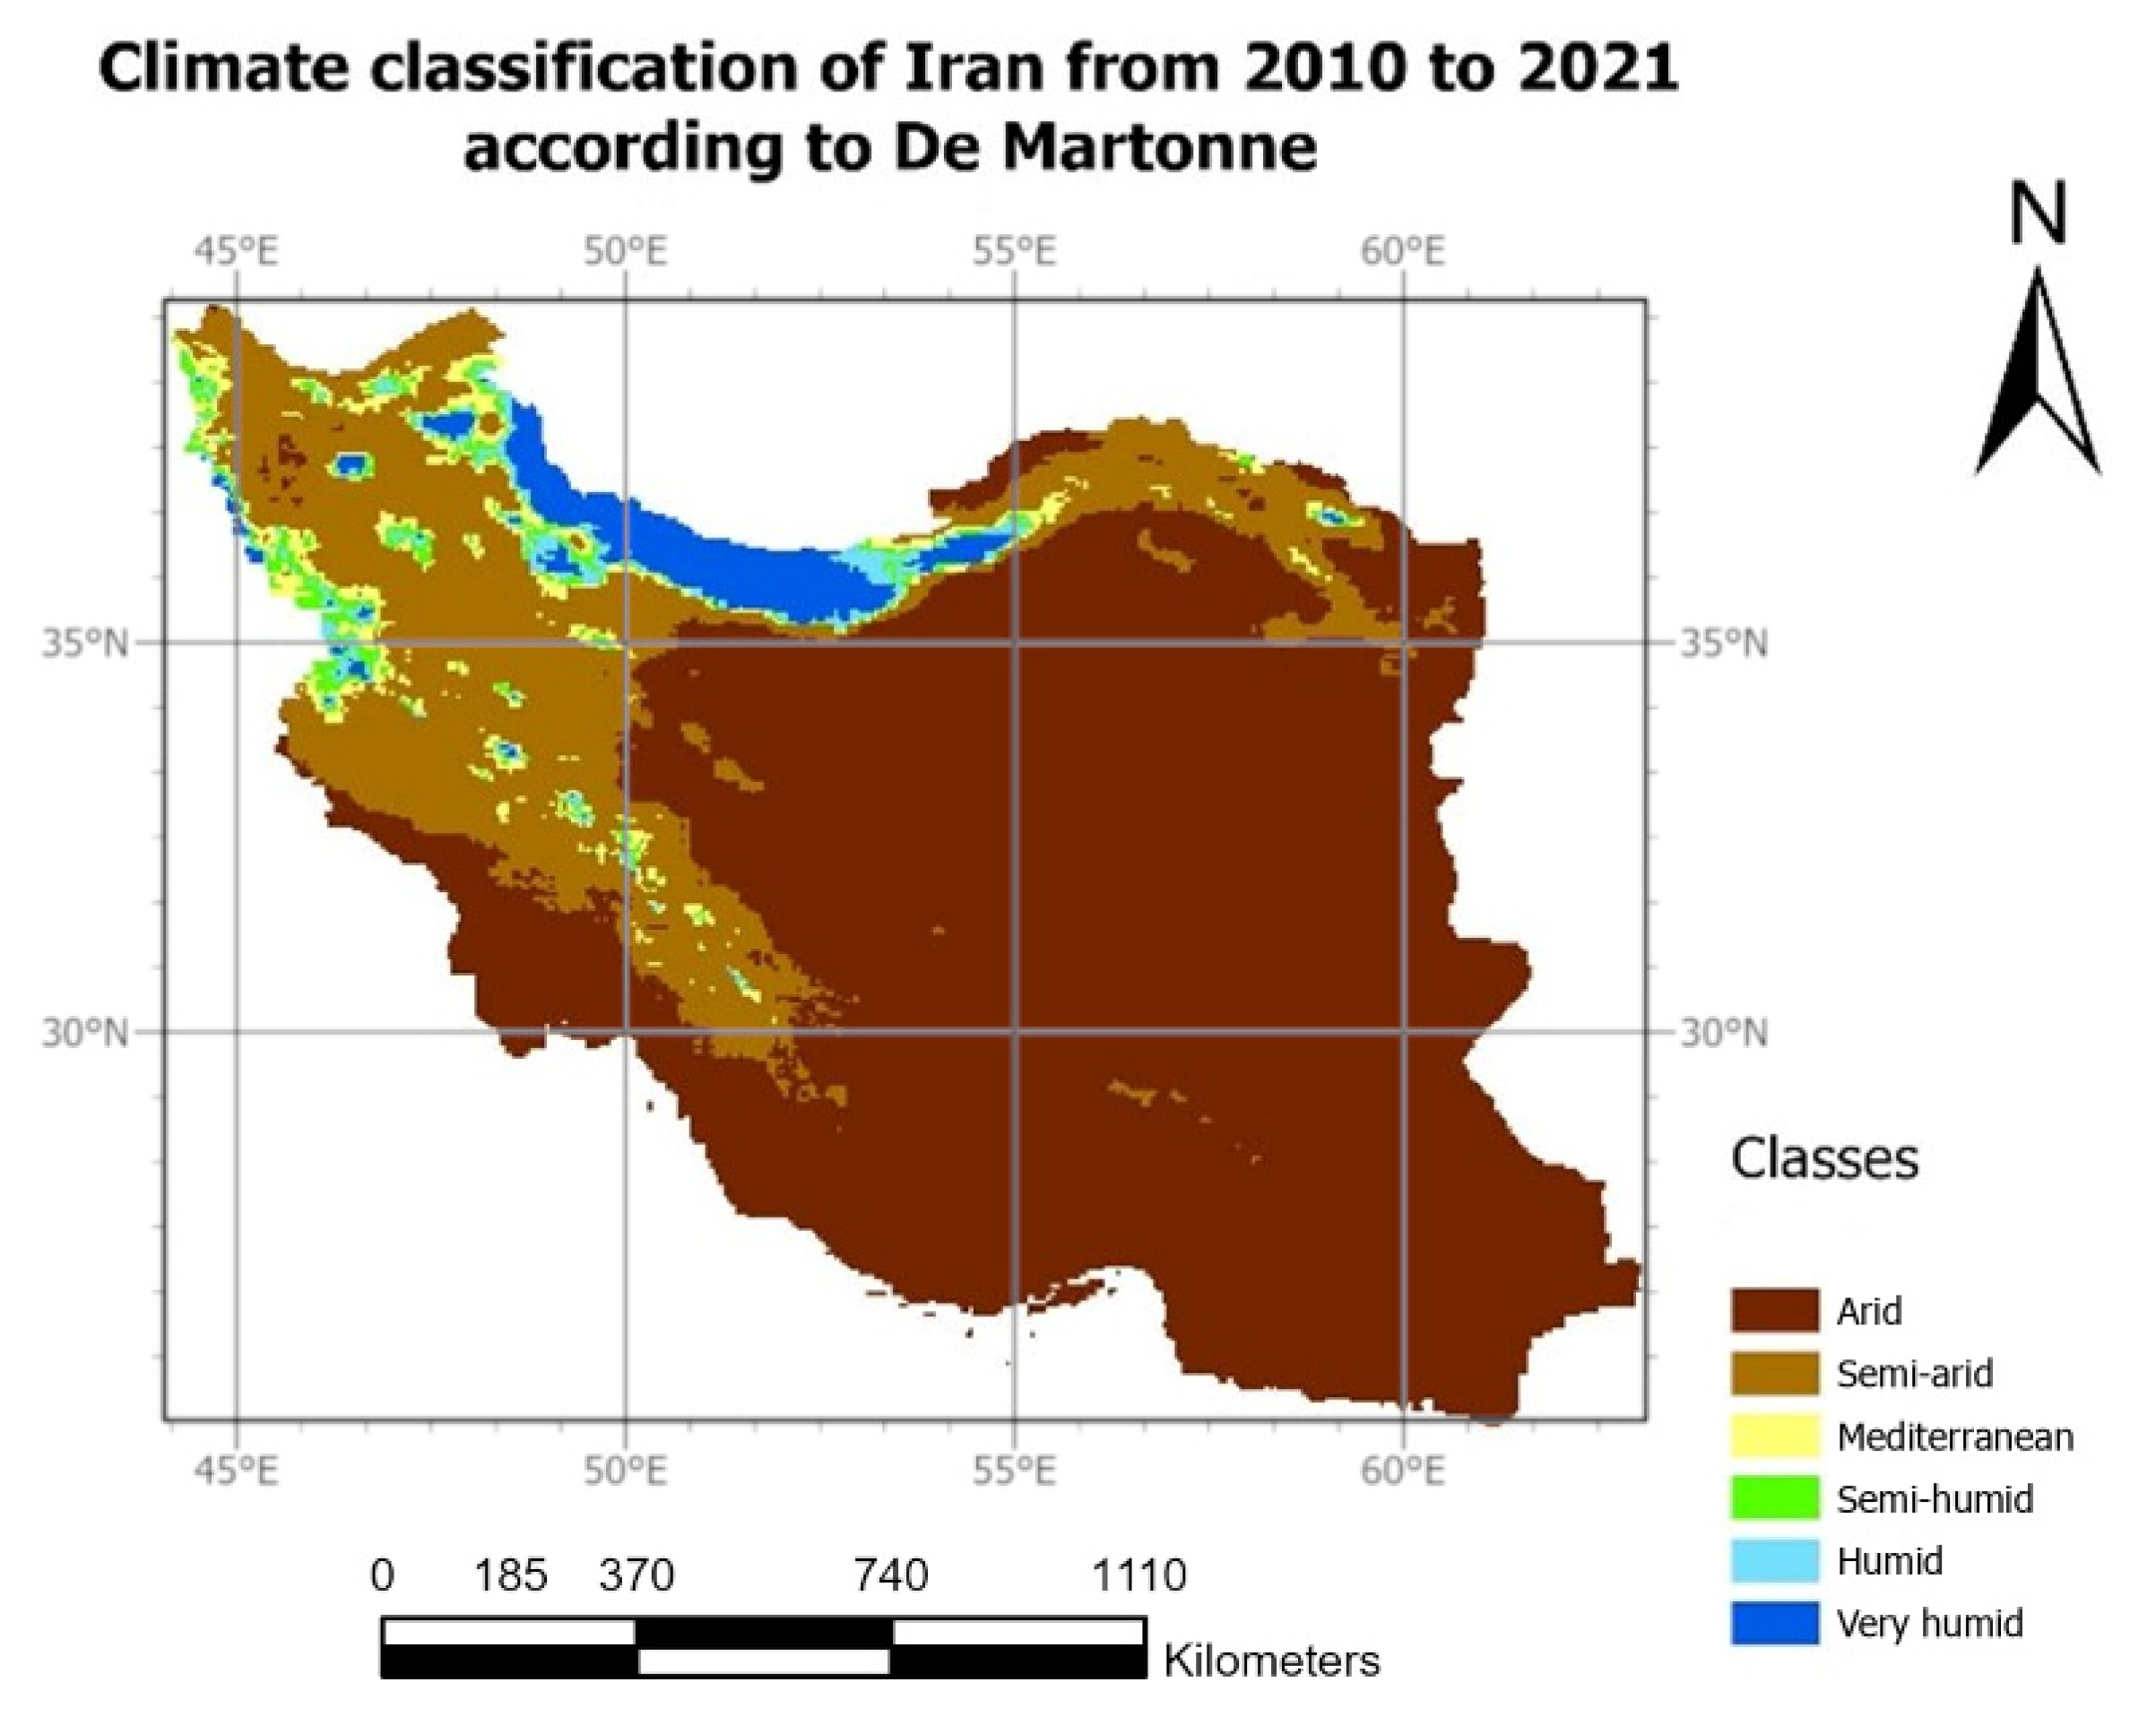
4.1. Climate Classification of Iran

Figure 5 shows the climate classification of Iran which has been produced computing the De Martonne index over the period of interest.
According to De Martonne aridity index classification, Iran consists of six climate classes and, as expected, the majority of the territory (66%) is arid and semi-arid, including mostly the central and eastern zones, regions near the Persian Gulf coastline in the south, and the Esfahan and Khuzestan provinces in southwest and south of the country. The Mediterranean climate covers 12% of Iran and includes regions around the Zagros and Alborz Mountain belt as well as parts of Mashhad city in the province of Khorasan in eastern zones. The semi-humid regions, which represent 6% of Iran, include the northwestern border strip as well as some parts of Urmia and Tabriz cities. The humid climate covers 7% and is located in northwest, and includes the provinces of Zanjan, East and West Azerbaijan, Kurdistan, and Sari. The very humid climate takes 9% of the country and includes the cities in the Caspian Sea coastline in the north as well as Ardebil province, and eastern parts of Zanjan and West Azerbaijan in the northwest. The climate classes according to the De Martonne classification are consistent with other classifications found in the literature. For example, Raziei T. in 2022 [62] studied the types of existing climate in Iran and applied the Köppen–Geiger climate classification system [63], which divides climates into five main groups, with each group being divided based on seasonal precipitation and temperature patterns. To do so, he collected 155 weather stations’ data with relatively regular distribution over Iran from 1990 to 2014. Raziei T. [62] mentions that the presence of the Alborz and Zagros mountains as well as of the Caspian Sea has created distinct climate types in the northern and western parts of the country. He also highlights that the arid climate is the dominant climate of the country covering the southern parts of the Alborz and eastern parts of the Zagros mountains, central-eastern and southern zones, and provinces such as Khuzestan, Fars, and Bushehr. This classification is consistent with climate classification that has been obtained in this paper with the De Martonne index, despite a few minor differences which may be due to the different considered time frame.

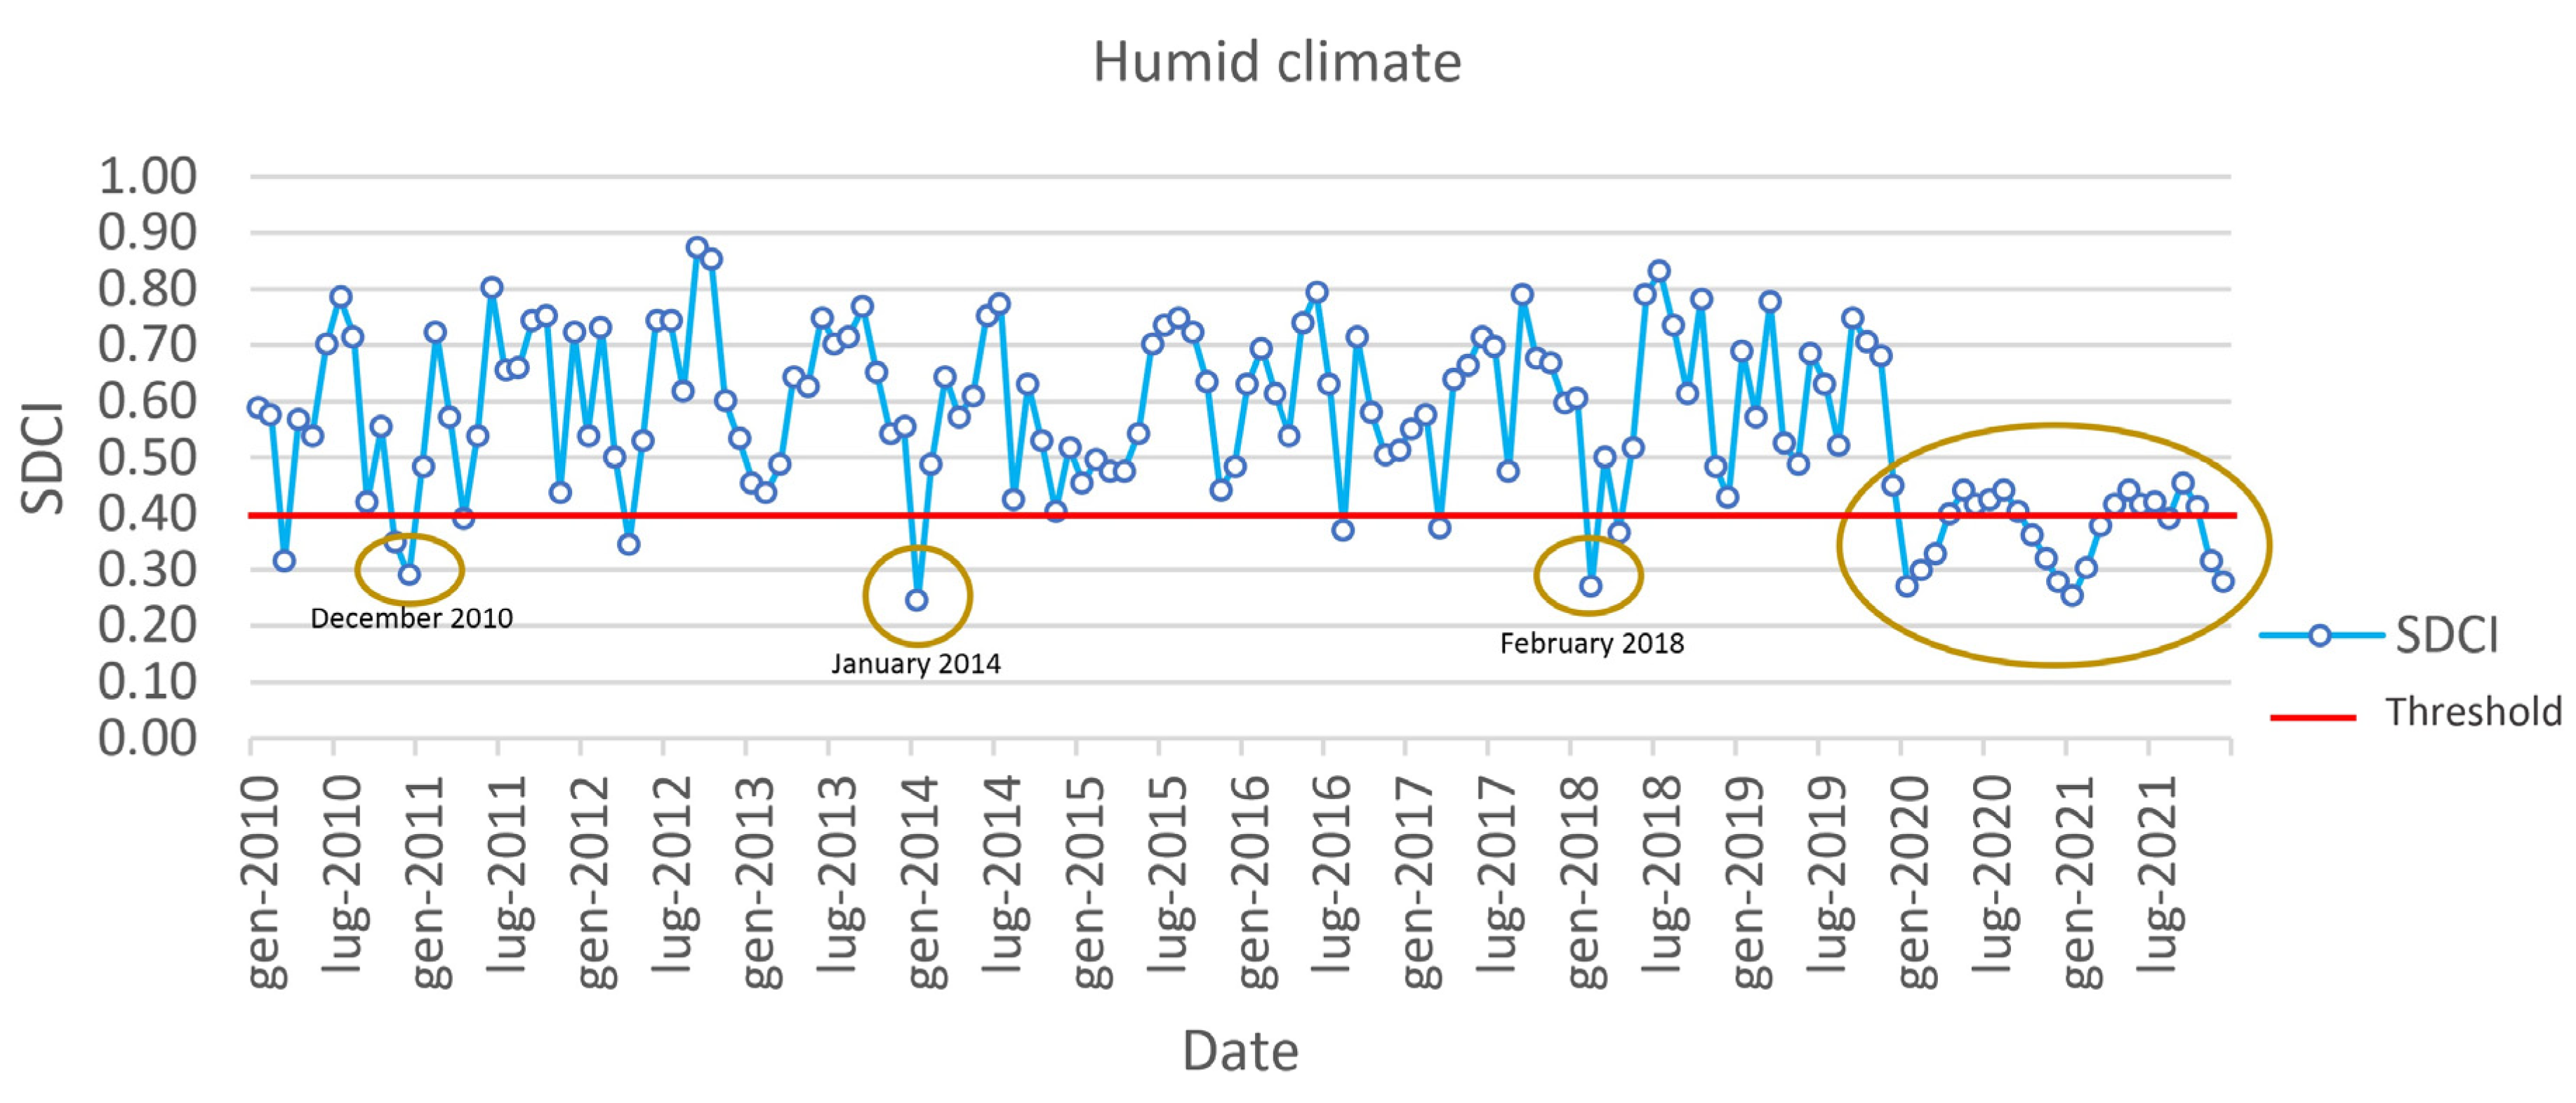
4.2. Humid and Very Humid Climate

For humid and very humid climates the indices show similar results throughout the 11-year time span considered. These two climates generally experienced favorable situations, and a drought condition has not lasted for more than one or two months. However, as Figure 6 and Figure 7 show, starting from 2020 low values of SDCI (below red threshold line), compared to other years, show the initiation of moderate to severe drought. The Water Research Institute at the Iranian Center for Caspian Sea Studies and Research (https://www.wri.ac.ir/national-center-for-caspian-sea-studies-and-research/, accessed on 1 December 2022) pointed in a report published in July 2021 that the cities around the Caspian Sea have faced a significant drop in rainfall which has led to a 25% loss of agricultural products in 2020 and 2021. This report also blames human activities and poor water management as the main causes of this dry condition. In addition to what happened in 2020 and 2021, these climates sometimes ran into a moderate drought during the time period of interest such as in December 2010, January 2014, and February 2018. Moreover, SDCI values between 0.3 and 0.4 in August 2014 and March 2017 indicate the presence of light drought in the very humid area.
It is worth mentioning that the PCI trend in these two climates reflects an extreme loss of precipitation which results in low value of PCI. For instance, if the results of this index in 2020 and 2021 are compared with those of the three previous years (Figure 8), a significant precipitation shortage is evident. This scant rainfall is also reported in Iran Water Resources Management, available at https://www.wrm.ir/ (accessed on 21 February 2023).
The analysis of the TCI trend in humid climates also reflects interesting results. Figure 9 represents a three-year time span of TCI values (which is similar for the other years) and shows that unfavorable weather conditions have been often related to the cold season of the year, between December and early March. According to Iran Meteorological Organization (https://www.irimo.ir/, accessed on 14 December 2022), the humid climate of Iran, mostly the northwest of Iran, experiences extremely cold weather in winter which results in increased stress to soil because of freezing. On the other hand, the temperature is relatively mild in summer, which leads to favorable conditions for vegetation. This shows that the temperature condition indicator (TCI) can differentiate meteorological drought condition for different types of climatic regions according to their temperature difference.

4.3. Semi-Humid Climate

Results show that the semi-humid regions have significant SDCI variability from 0.1 to 0.75. Figure 10 indicates that this climate experiences severe drought every year starting from June which usually lasts for four to six months. For example, in 2010, there was a continuous five-month severe drought from June to November, and the low value of PCI during this time is the main cause of it (See Figure 11). In addition, an unexpected low value of SDCI from March to October 2013 shows that this climate experienced an eight-months severe to moderate drought during this period. Drought has also been a serious problem since May 2020, and a severe or extreme drought has always persisted in this region.
Furthermore, VCI behavior shows that this index is not as variable as SDCI in the semi-humid area: the vegetation condition needs time to recover, it cannot beneficiate enough of short periods of rain. For example, according to Figure 12, plants in semi-humid zones experienced a moderate drought from May to December 2010 followed by a moderate improvement in the next four months. However, the vegetation state is still critical. VCI behavior over the following years (2012 to 2021) experienced the same trend as 2010 and 2011.

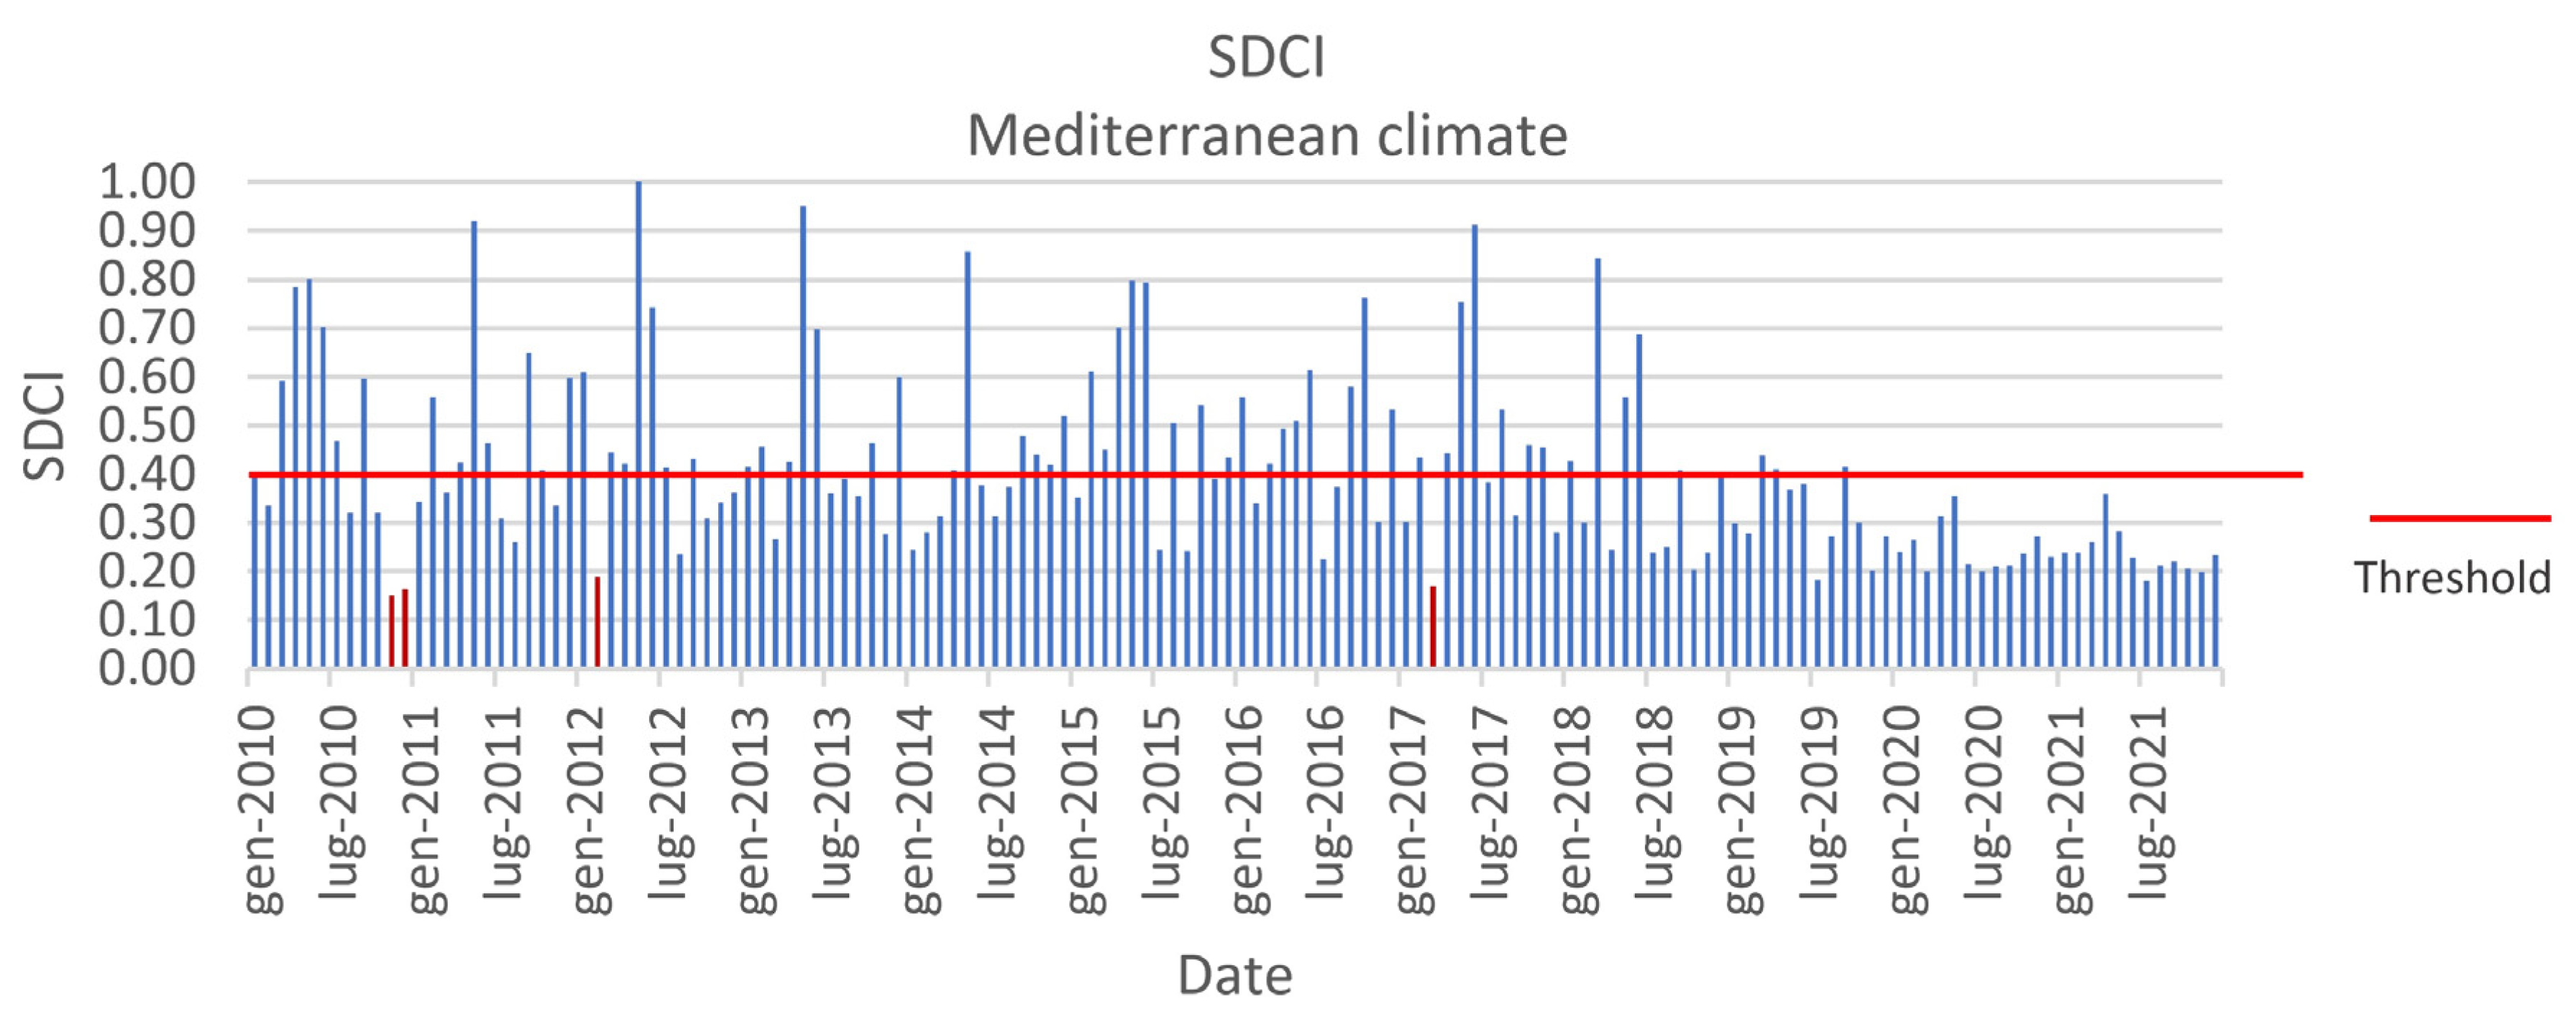
4.4. Mediterranean Climate

Observing the drought condition according to SDCI in Figure 13, it is possible to see that the Mediterranean climate has suffered from a light to moderate drought since July 2018. Furthermore, as highlighted in Figure 13, this climate experienced a severe drought in November and December 2010, February 2012, and March 2017. For the Mediterranean climate only, in order to ease the interpretation of the results, SDCI is represented using a bar chart.
Furthermore, the study of VCI in this area indicates a relatively healthy vegetation condition during spring. In addition, Figure 14 represents a two-year time span of VCI, corresponding to 2017 and 2018, as representative of the eleven-year period because the of similarity of the results, showing that vegetation experienced healthier state during winter compared to summer and fall because this climate is characterized by mild winters and hot summers. The analysis of PCI in the Mediterranean area reflects that this climate benefited from good precipitation condition during the spring and winter, whereas summer and fall generally had less precipitation compared to those seasons.

4.5. Semi-Arid Climate

SDCI values in a semi-arid area, according to Figure 15, have generally fluctuated during the chosen time span, showing the drought condition from a light to moderate state, underlying that the driest condition has occurred during summer each year. The situation has usually improved after summer since this climate often had a rainy fall with moderate weather conditions, which can contribute to less vegetation and soil stress. SDCI analysis also shows that the areas belonging to this climate did not experience extreme and severe drought except in July 2018 and July, August, and September 2021.
According to Figure 16, results also demonstrate that the semi-arid climate has experienced less drought compared to the semi-humid climate since April 2019, even though the semi-humid climate had relatively more precipitation throughout the year. This is mainly because of the high vegetation stress in the semi-humid climate, which results in low values of VCI. Vegetation condition index is an indicator that is most affected in areas with very cold or very hot temperatures because excessive evaporation in high temperature climates and soil freezing in very low temperatures increase plant stress. Therefore, although the semi-arid regions have shown to have less precipitation, drought does not occur during most of the year because of a balanced and temperate weather.

4.6. Arid Climate

According to Figure 17, SDCI values for the considered 11 years show that a moderate to severe dryness is always a predominant weather condition in the arid regions, except for March 2013, December 2017, and March 2018. This poor condition is evident from undesirable weather condition, low precipitation, and high vegetation stress, visible for TCI, PCI, and VCI indicators. Furthermore, based on the De Martonne classes, the arid regions of Iran include the areas that are either deserts, dry pastures, or cities with a zero or very low and unbalanced precipitation pattern (Figure 18).
This climate experiences freezing winters and falls and hot summers and springs (Iran Meteorological Organization, https://www.irimo.ir/, accessed on 14 December 2022) which leads to increased soil stress during all seasons, and, as a consequence, temperature-related soil=stress values are usually close to zero. Therefore, as Figure 19 shows, the values of TCI have been around 0.2 during this eleven-year period.

4.7. Spatial Analysis of Drought in Iran

In addition to temporal analysis, the same method allows exploring drought from the spatial point of view over the area of interest. The considered indices TCI, PCI, and VCI (excluding water bodies) were calculated for each year from 2010 to 2021 for the whole country, and then combined to produce the SDCI indicator using the empirical weights of Equation (5) through the GEE platform. SDCI was then classified and bounded according to Table 2 into five different classes from the extreme drought to no drought condition. Comparing the time series of drought maps of SDCI allows us to investigate the changes in aridity condition over the country. When observing Figure 20 and Figure 21, for instance, which show maps of SDCI for 2010 and 2020, it is possible to notice that the country has undergone drought conditions specially in the north and north-western areas. The maps of other years are available at https://github.com/ADELTaheri/Drought-analyisis-data-and-results.
The produced maps of SDCI show a dry condition in 2020. A report that was published in the Global Drought Observatory (GDO) in May 2021 also confirms the initiation of a severe drought over the country in early 2020, and an extreme drought in the northeast, followed by an extreme depletion of water resources and high vegetation stress over the same year. This aridity is still proceeding and has caused a loss of EUR 623 million just in the agricultural sector (http://edo.jrc.ec.europa.eu/gdo, accessed on 21 February 2023). The study of SDCI in other years also illustrates extreme dryness in 2019 in the center, northeast, and northwest of the country. From 2010 to 2013, except for the areas near the Caspian Sea coastline in the north, the country was under moderate to extreme drought conditions, which partially recovered over the following year.
The proposed applications enable the spatial analysis of drought according to SDCI over time. Figure 22 shows the landcover map from MODIS Land Cover Type MCD12Q1 Version 6, obtained using GEE and exported into ArcGIS Pro v2.9 (Esri). As an example, the area of interest (AOI) shown in Figure 22 is taken into account for the months of March, April, and May from 2010 to 2021. That area presented a very high variability in the SDCI. The months of March, April, and May have been chosen because they are the most humid ones, when precipitations are most significant. Figure 22 shows the land cover map of the area of interest, which is mainly covered by deciduous broadleaf forests with the presence of croplands. The area of interest includes the city of Zanjan and part of Ghazvin and Gilan provinces which mostly have semi-humid to very humid climate classes according to the De Martonne climate classification. Figure 23 shows the time series of SDCI maps for the Area of Interest, which allows us to see the potential of this type of spatial analysis. It is possible to notice that the spatial distribution of the SDCI classes varies over time.
In particular, it is possible to see a similar behavior of the SDCI distribution for the years 2010 and 2011 and from 2016 to 2019, characterized by no drought in the northeast and light to moderate drought for the remaining part of the AOI. Contrastingly, in the years 2014, 2015, 2020, and 2021, moderate drought prevails, with severe drought appearing in the southeastern zone, and affecting the areas covered by croplands. This type of visualization allows the decision makers to have a visual representation of the change in the distribution of drought over space and time, and to measure the capability of recovery of the territory and to plan the interventions.
According to the report about drought in Iran by the International Federation of Red Cross and Red Crescent Societies, published on 11 May 2022 [64], two provinces of south Khorasan and Sistan (east and southeast of the country) have experienced a drop in rainfall of 50% and 80%, respectively, starting from the water year of 2020 (starting in September), compared to the long-term average precipitation. Based on the methodology used in this study, the lack of precipitation, followed by an abnormal temperature condition in the country, is evident from 2020. This condition is more evident in the center, south, and southeast of the country.
According to the National Center for Drought and Crisis Management in Iran (https://ndmo.ir/, accessed on 14 December 2022), from the 2020 water year (which started on September 23 2020), precipitation has dropped by 41% in comparison with the long-term average and 53% compared to the same period in the previous year. In 2020, the lowest rainfall occurred in the Hormozgan, Sistan-Baluchestan, and Kerman provinces (central, south, and southeast area), being short of rain by 86%, 82%, and 65%, respectively. This report indicates that in 2018 and 2019, Iran experienced unusually high rainfall which was unprecedented during the previous 50 years, but from 2020 on, most areas of the country experienced dramatic aridity and vegetation stress. In the results of this research, high rainfall in 2018 and 2019 is evident according to the PCI charts in most parts of the country, and temporal analysis according to SDCI shows that the high temperature and low rainfall in the coming years have put the country at risk of medium to high drought, especially in the central and southern parts.

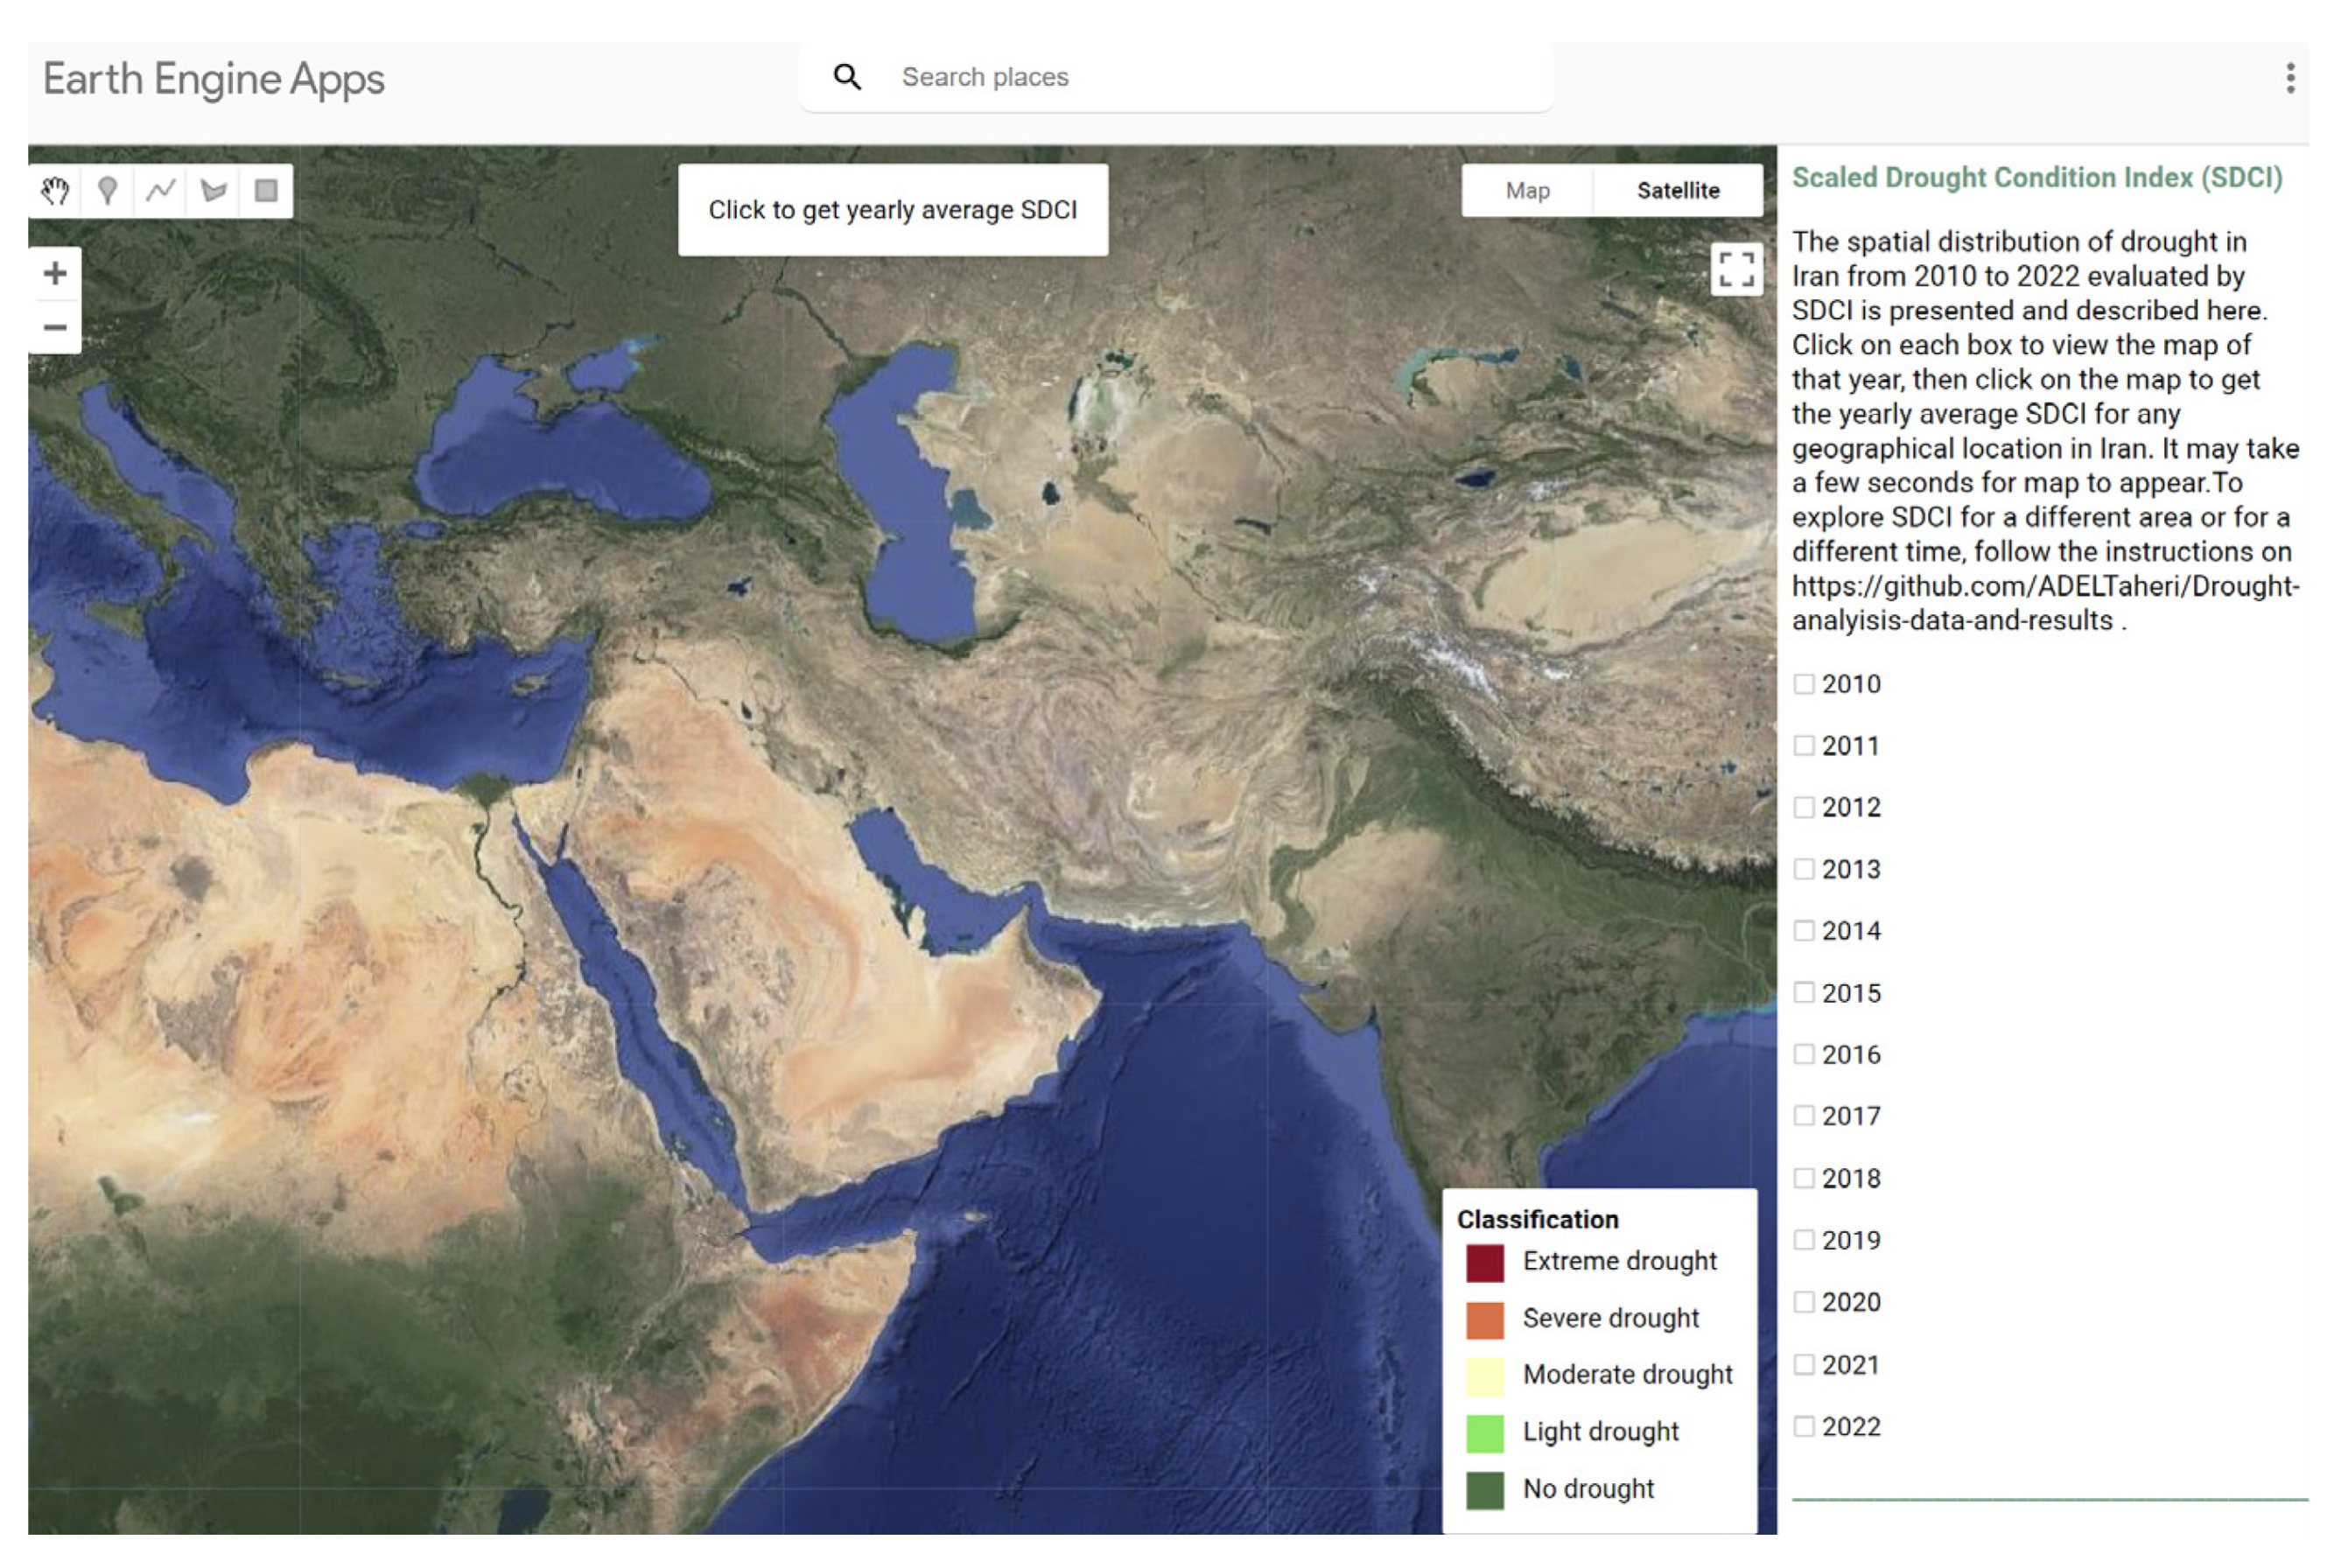
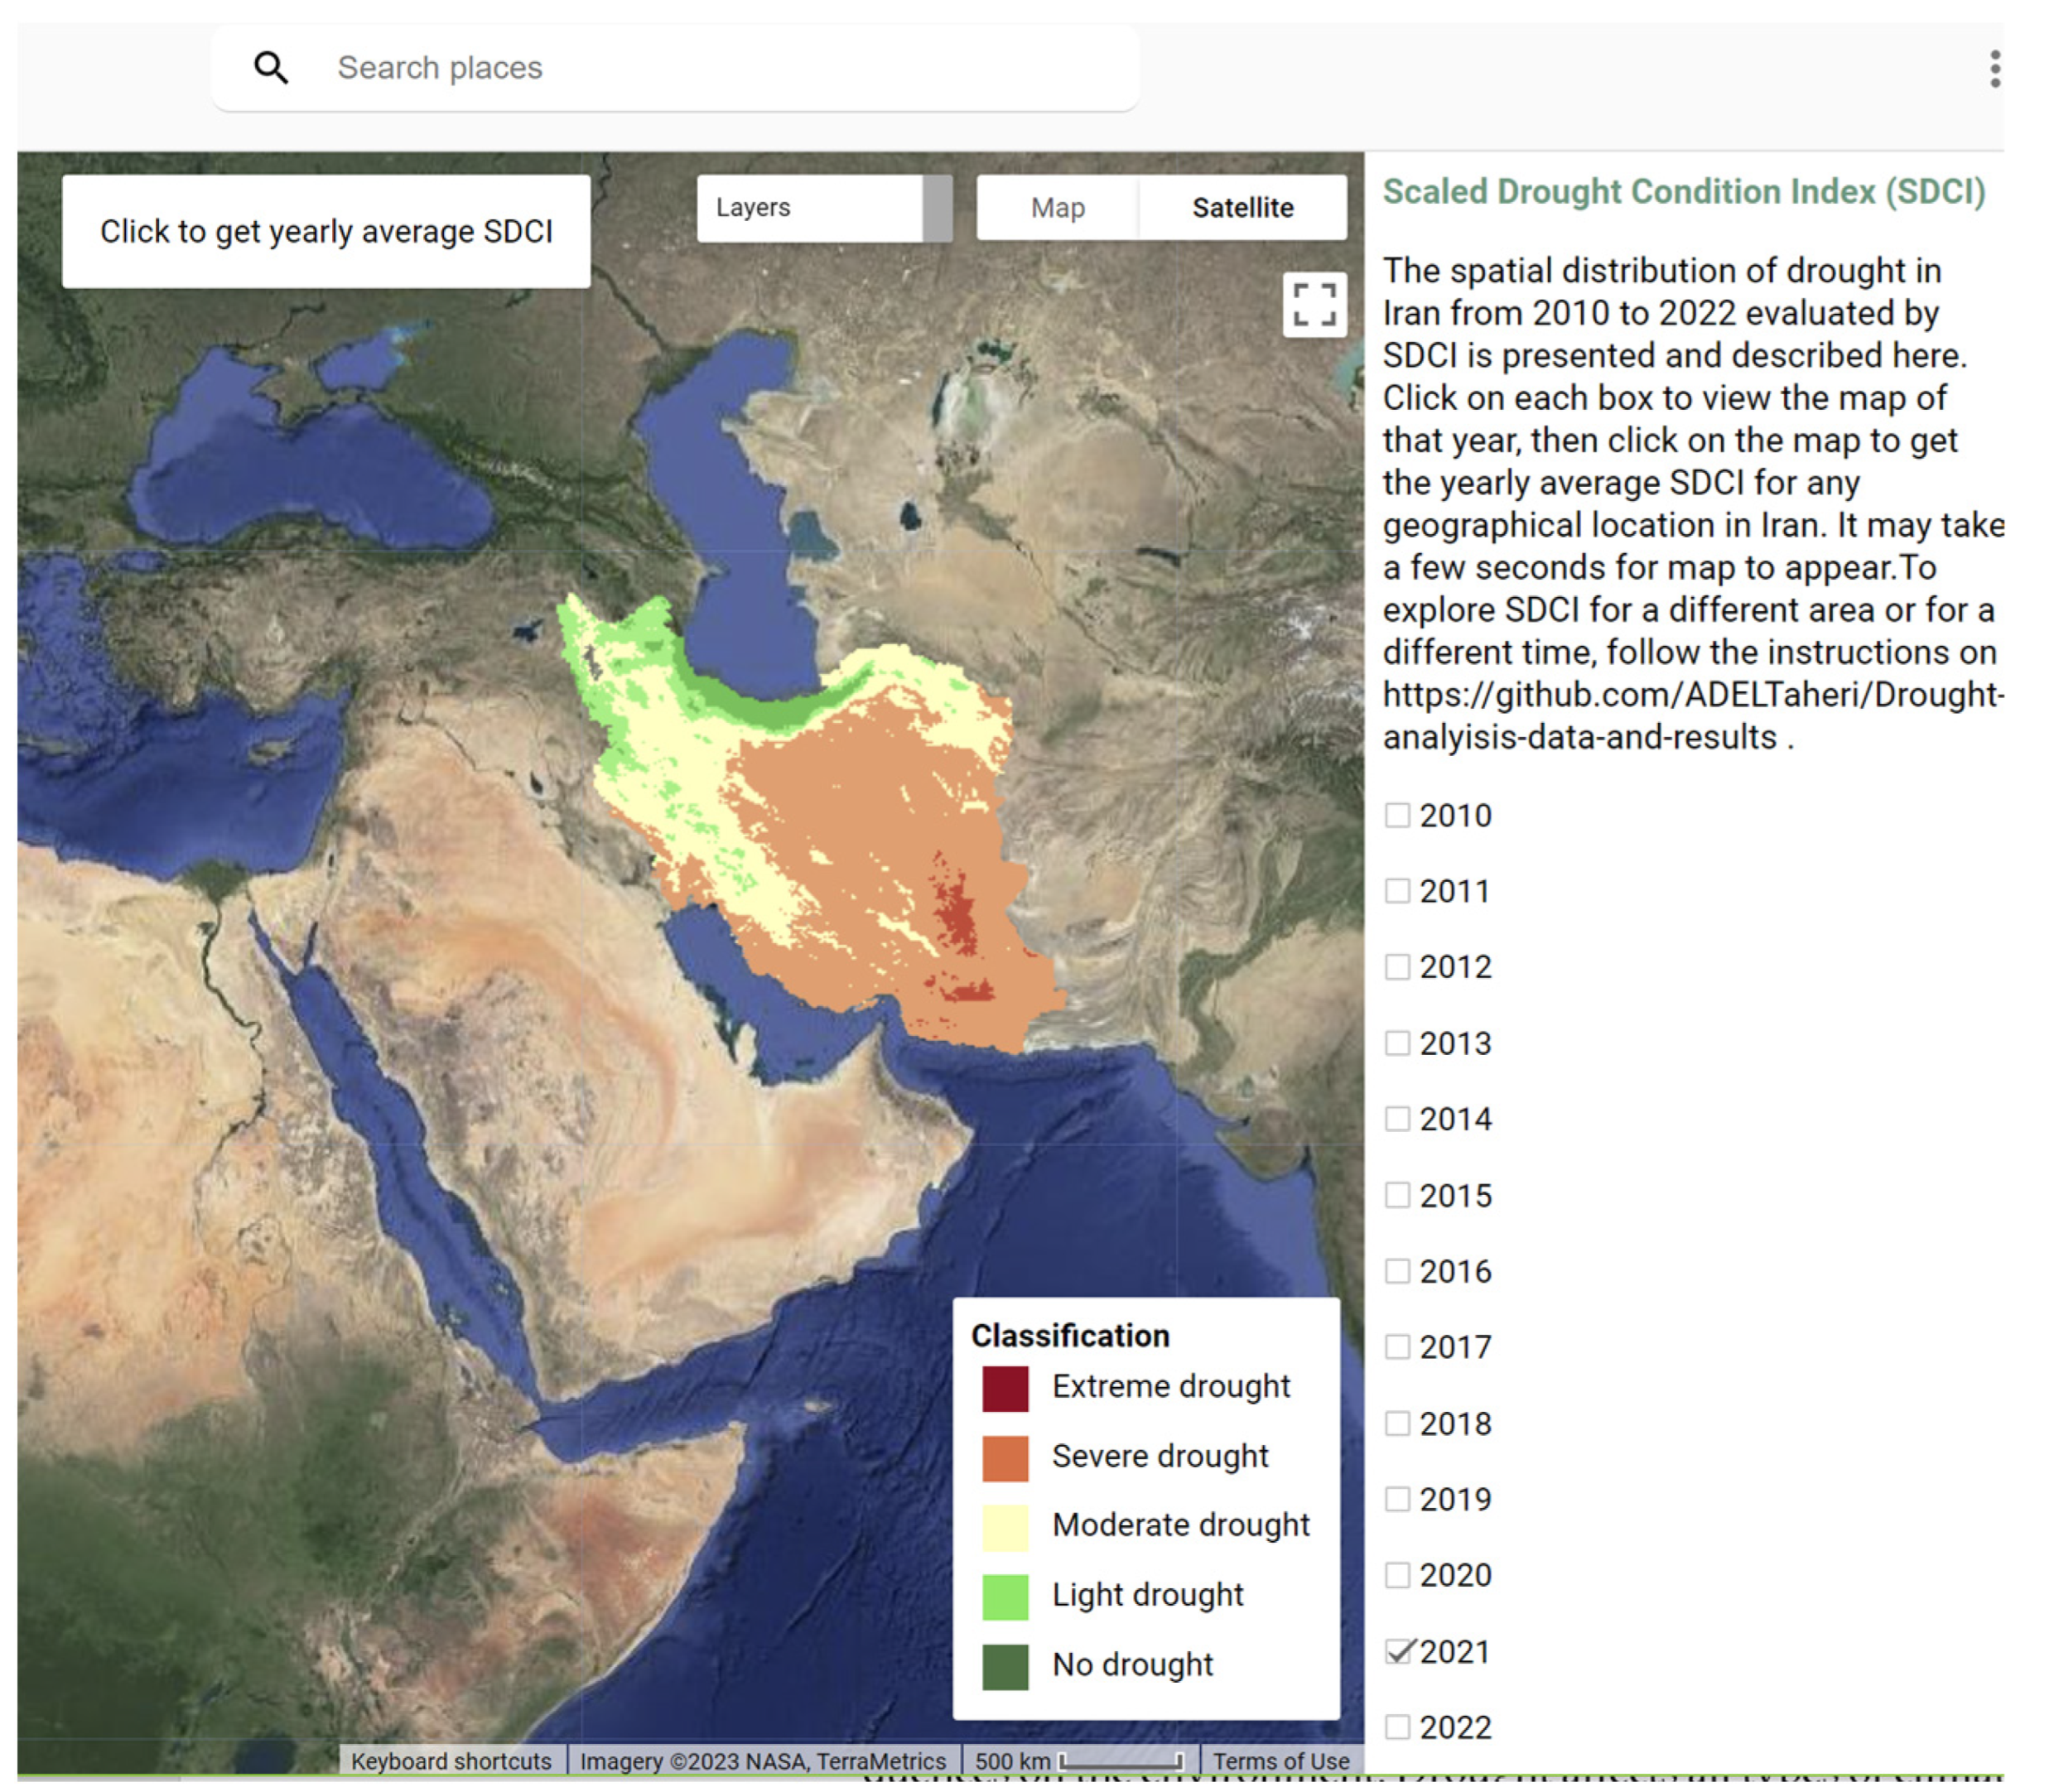
4.8. Google Earth Engine Drought Application

The analysis conducted in this study can be accessed with a browser through two Google Earth Engine apps. The first application (https://adeltaheripolimi.users.earthengine.app/view/temporaldroughtindices-final, accessed on 21 February 2023, Figure 24) provides the temporal analysis of drought, and allows inspecting and extracting the values of TCI, VCI, and PCI indices. Graphs for the time series of the three indices are produced when clicking on a specific point over the map of Iran, excluding the water bodies, which cannot be considered to compute VCI.
In order to reduce the computational cost, the monthly precipitation data extracted from the integrated multi-satellite retrievals for GPM (IMERG) [65] have been considered instead of CHIRPS, and the values are shown for a three-year time span from January 2019 to September 2021 (Figure 24). The area of interest of the analysis as well as the time span can be freely customized by the user taking advantage of the code of the Google Earth Engine provided at https://github.com/ADELTaheri/Drought-analyisis-data-and-results.
The second application (https://adeltaheripolimi.users.earthengine.app/view/yearlyaveragesdcifinal, accessed on 21 February 2023, Figure 25 and Figure 26) provides the yearly average scaled drought condition index from 2010 to 2021.
This application allows the user to display the map of SDCI for Iran and to query the value of SDCI for any point over the area of interest. It is possible to select which year to investigate from the checkbox panel. F in this case, the application can be customized by changing the period and area of interest via modification of the code provided at https://github.com/ADELTaheri/Drought-analyisis-data-and-results (accessed on 21 February 2023).

5. Conclusions

Drought is a serious problem that can have devastating short- and long-term consequences on the environment. Drought affects all types of climates; however, the arid and semi-arid climates often experience droughts that are more frequent and more severe. In this paper, a publicly available tool is presented which is provided through the Google Earth Engine and based on JavaScript programming language and which can provide the spatial and temporal distribution of drought computed with a combined index over homogenous climate zones. This tool is shared through two GEE applications, available with specific URLs, that allow the users to view and interact with the results, build their own maps, and extract the data. The drought in this study was analyzed based on the scaled drought condition index (SDCI) [37], which is a combination of three remotely sensed derived indices, namely the temporal condition index (TCI), which is calculated using land surface temperature (LST) obtained from MODIS sensor placed on the Terra satellite; the vegetation condition index (VCI), which is calculated from NDVI obtained from another MODIS sensor; and the precipitation condition index (PCI), that is based on precipitation data from the Climate Hazards Group InfraRed Precipitation with Station data (CHIRPS).
In this paper, Iran was selected for case study; very different climate conditions apply over the territory, including arid and semi-arid weather conditions, and the need for applying drought analysis on homogeneous climate zones becomes relevant. For this reason, the drought analysis was conducted separately for each climate type, which was characterized according to the De Martonne climate classification and by excluding water areas such as lakes, river sheds, basins, etc., and the SDCI was then calculated for a time span ranging from 2010 to 2021. Results show that different climates in Iran have occasionally experienced moderate to extreme drought during the considered period. Results also demonstrate the initiation of a severe to extreme drought in the northern and northwestern parts of the country that have humid and very humid climates. The outcomes have been checked with respect to local and global drought reports showing that specific events, such as the extreme drought which started in 2020, could be detected thanks to the tools implemented in GEE.
The methodology applied in this study directly recognizes the drought and its severity for any region and any class, and considers the variability of temperature and rainfall condition of each climatic region. In addition, using the Google Earth Engine platform facilitates the extraction of the satellite data, calculation, and updating of the indices, allowing for a fast response supporting emergency management. The methods described herein are openly shared and repeatable, and have the potential to be scaled to perform similar analyses on a global scale.
The applications allow exploring in detail not only the SDCI Indicator, but also others such as VCI, TCI, and PCI, which enable the study of various types of droughts in each region. For example, using the VCI index, agricultural drought can be identified and the plant health status in each region can be assessed; the TCI index indicates the state of stress in the soil due to weather-related conditions; analyzing the PCI index over a long period of time and comparing it with previous years allows for the detection of hydrological drought. In this paper, a selection of the obtained results of drought analysis over Iran for a twelve-year time span has been presented; the full outcomes are available at https://github.com/ADELTaheri/Drought-analyisis-data-and-results (accessed on 21 February 2023). Drought is a very complex phenomenon, and the analysis performed in this paper could be further improved by including additional parameters such as soil moisture, soil type, land use and human activities, which can be factors leading to drought. The analysis performed so far exploits available data to show drought maps over time; further studies and additional data could lead to modeling and support decision makers in forecasting potential effects to plan future decisions.

Author Contributions

Conceptualization, D.C.; methodology, A.T.Q. and D.C.; software, A.T.Q.; investigation, A.T.Q.; writing—original draft preparation, A.T.Q.; writing—review and editing, A.T.Q. and D.C.; visualization, A.T.Q.; supervision, D.C.; funding acquisition, D.C. All authors have read and agreed to the published version of the manuscript.

Funding

This research received no external funding.

Data Availability Statement

Conflicts of Interest

The authors declare no conflict of interest.

References

  1. Erian, W.; Pulwarty, R.; Vogt, J.V.; AbuZeid, K.; Bert, F.; Bruntrup, M.; El-Askary, H.; de Estrada, M.; Gaupp, F.; Grundy, M.; et al. GAR Special Report on Drought 2021; United Nations Office for Disaster Risk Reduction (UNDRR): Geneva, Switzerland, 2021. [Google Scholar]
  2. Pörtner, H.-O.; Roberts, D.C.; Tignor, M.M.B.; Poloczanska, E.; Mintenbeck, K.; Alegría, A.; Craig, M.; Langsdorf, S.; Löschke, S.; Möller, V.; et al. Climate Change 2022: Impacts, Adaptation and Vulnerability; IPCC Sixth Assessment Report; Cambridge University Press: Cambridge, UK; New York, NY, USA, 2022. [Google Scholar]
  3. United Nations Office for Disaster Risk Reduction (UNDRR). Global Assessment Report on Disaster Risk Reduction 2019; UN Office for Disaster Risk Reduction: Geneva, Switzerland, 2019. [Google Scholar]
  4. Alcamo, J.; Henrichs, T. Critical regions: A model-based estimation of world water resources sensitive to global changes. Aquat. Sci. 2002, 64, 352–362. [Google Scholar] [CrossRef]
  5. Deniz, A.; Toros, H.; Incecik, S. Spatial Variations of Climate Indices in Turke. Int. J. Climatol. 2011, 31, 394–403. [Google Scholar] [CrossRef]
  6. Spinoni, J.; Barbosa, P.; De Jager, A.; McCormick, N.; Naumann, G.; Vogt, J.V.; Magni, D.; Masante, D.; Mazzeschi, M. A new global database of meteorological drought events from 1951 to 2016. J. Hydrol. Reg. Stud. 2019, 22, 100593. [Google Scholar] [CrossRef] [PubMed]
  7. Wilhite, D.A.; Svoboda, M.D.; Hayes, M.J. Understanding the complex impacts of drought: A key to enhancing drought mitigation and preparedness. Water Resour. Manag. 2007, 21, 763–774. [Google Scholar] [CrossRef]
  8. Farajzadeh, M.; Ahmadian, K. Temporal and Spatial Analysis of Drought with use of SPI Index in Iran. J. Nat. Environ. Hazards 2014, 3, 1–16. [Google Scholar]
  9. Wilhite, D.A.; Glantz, M.H. Understanding the Drought Phenomenon: The Role of Definitions. Water Int. 1985, 10, 111–120. [Google Scholar] [CrossRef]
  10. Sepulcre-Canto, G.; Horion, S.; Singleton, H.; Carrao, H.; Vogt, J. Development of a Combined Drought Indicator to detect agricultural drought in Europe. Nat. Hazards Earth Syst. Sci. 2012, 12, 3519–3531. [Google Scholar] [CrossRef]
  11. Arora, V.K. The use of the aridity index to assess climate change effect on annual runoff. J. Hydrol. 2002, 265, 164–177. [Google Scholar] [CrossRef]
  12. Liu, X.; Zhang, D.; Luo, Y.; Liu, C. Spatial and temporal changes in aridity index in northwest China: 1960 to 2010. Theor. Appl. Climatol. 2013, 112, 307–316. [Google Scholar] [CrossRef]
  13. Levin, N.E.; Cerling, T.E.; Passey, B.H.; Harris, J.M.; Ehleringer, J.R. A stable isotope aridity index for terrestrial environments. Proc. Natl. Acad. Sci. USA 2006, 103, 11201–11205. [Google Scholar] [CrossRef]
  14. Araghi, A.; Martinez, C.J.; Adamowski, J.; Losen, J.E. Spatiotemporal variations of aridity in Iran using high-resolution gridded data. Int. J. Climatol. 2018, 38, 2701–2717. [Google Scholar] [CrossRef]
  15. Pellicone, G.; Caloiero, T.; Guagliardi, I. The De Martonne aridity index in Calabria (Southern Italy). J. Maps 2019, 15, 788–796. [Google Scholar] [CrossRef]
  16. Paltineanu, C.; Tanasescu, N.; Chitu, E.; Mihailescu, I.F. Relationships between the De Martonne aridity index and water requirements of some representative crops: A case study from Romania. Int. Agrophysics 2007, 21, 81–93. [Google Scholar]
  17. Haider, S.; Adnan, S. Classification and assessment of aridity over Pakistan provinces (1960–2009). Int. J. Environ. 2014, 3, 24–35. [Google Scholar] [CrossRef]
  18. De Martonne, E. Notions Generales. Climat. Hydrographie 9; Librarie Armand Colin: Paris, France, 1957; Volume 1. [Google Scholar]
  19. Gavrilov, M.B.; An, W.; Xu, C.; Radaković, M.G.; Hao, Q.; Yang, F.; Guo, Z.; Perić, Z.; Gavrilov, G.; Marković, S.B. Independent aridity and drought pieces of evidence based on meteorological data and tree ring data in Southeast Banat, Vojvodina, Serbia. Atmosphere 2019, 10, 586. [Google Scholar] [CrossRef]
  20. Mishra, V.N.; Rai, P.K. A remote sensing aided multi-layer perceptron-Markov chain analysis for land use and land cover change prediction in Patna district (Bihar), India. Arab. J. Geosci. 2016, 9, 249. [Google Scholar] [CrossRef]
  21. World Meteorological Organization (WMO). WMO Statement on the Status of the Global Climate in 2012; World Meteorological Organization: Geneva, Switzerland, 2013. [Google Scholar]
  22. Pande, C.B.; Al-Ansari, N.; Kushwaha, N.L.; Srivastava, A.; Noor, R.; Kumar, M.; Moharir, K.N.; Elbeltagi, A. Forecasting of SPI and Meteorological Drought Based on the Artificial Neural Network and M5P Model Tree. Land 2022, 11, 2040. [Google Scholar] [CrossRef]
  23. Yazdanpanah, M.; Hayati, D.; Hochrainer-Stigler, S.; Zamani, G.H. Understanding farmers’ intention and behavior regarding water conservation in the Middle-East and North Africa: A case study in Iran. J. Environ. Manag. 2014, 135, 63–72. [Google Scholar] [CrossRef]
  24. Dehkordi, R.M.; Yadegari, M.; Hamedi, B. Effect of temperature, drought and salinity stresses on germination of Portulaca oleracea L., Trigonella foenum-graecium L., Borago officinalis L. and Hypericum perforatum L. Adv. Environ. Biol. 2015, 9, 148–152. [Google Scholar]
  25. Gorelick, N.; Hancher, M.; Dixon, M.; Ilyushchenko, S.; Thau, D.; Moore, R. Google Earth Engine: Planetary-scale geospatial analysis for everyone. Remote Sens. Environ. 2017, 202, 18–27. [Google Scholar] [CrossRef]
  26. Qin, Y.; Yang, D.; Lei, H.; Xu, K.; Xu, X. Comparative analysis of drought based on precipitation and soil moisture indices in Haihe basin of North China during the period of 1960–2010. J. Hydrol. 2015, 526, 55–67. [Google Scholar] [CrossRef]
  27. Du, L.; Tian, Q.; Yu, T.; Meng, Q.; Jancso, T.; Udvardy, P.; Huang, Y. A comprehensive drought monitoring method integrating MODIS and TRMM data. Int. J. Appl. Earth Obs. Geoinf. 2013, 23, 245–253. [Google Scholar] [CrossRef]
  28. Rouse, J.W.; Haas, R.H.; Schell, J.A.; Deering, D.W. Monitoring Vegetation Systems in the Great Plains with ERTS (Earth Resources Technology Satellite). In Proceedings of the 3rd Earth Resources Technology Satellite Symposium, Washington, DC, USA, 10–14 December 1973; SP-351. pp. 309–317. [Google Scholar]
  29. Fazel Dehkordi, L.; Alsadat Sohrabi, T.; Mahmoodi Kohan, F. Drought monitoring by using of MODIS satellite images in dry lands (Case study: Isfahan Rangelands). Geogr. Environ. Plan. 2016, 27, 177–190. (In Farsi) [Google Scholar]
  30. Anyamba, A.; Tucker, C.J. Historical perspective of AVHRR NDVI and vegetation drought monitoring. Remote Sens. Drought Innov. Monit. Approaches 2012, 23, 20. [Google Scholar]
  31. Kogan, F.N. Droughts of the late 1980s in the United States as derived from NOAA polar-orbiting satellite data. Bull. Am. Meteorol. Soc. 1995, 76, 655–668. [Google Scholar] [CrossRef]
  32. Kogan, F.N. Application of vegetation index and brightness temperature for drought detection. Adv. Space Res. 1995, 15, 91–100. [Google Scholar] [CrossRef]
  33. Kogan, F.N. Global drought watch from space. Bull. Am. Meteorol. Soc. 1997, 78, 621–636. [Google Scholar] [CrossRef]
  34. Bhuiyan, C.; Singh, R.; Kogan, F. Monitoring drought dynamics in the Aravalli region (India) using different indices based on ground and remote sensing data. Int. J. Appl. Earth Obs. Geoinf. 2006, 8, 289–302. [Google Scholar] [CrossRef]
  35. Qu, C.; Hao, X.; Qu, J.J. Monitoring Extreme Agricultural Drought over the Horn of Africa (HOA) Using Remote Sensing Measurements. Remote Sens. 2019, 11, 902. [Google Scholar] [CrossRef]
  36. Choi, T.; Qu, J.J.; Xiong, X. A thirteen-year analysis of drought in the horn of Africa with MODIS NDVI and NWDI measurements. In Proceedings of the 2013 Second International Conference on Agro-Geoinformatics (Agro-Geoinformatics), Fairfax, VA, USA, 12–16 August 2013; pp. 302–307. [Google Scholar]
  37. Cao, Y.; Chen, S.; Wang, L.; Zhu, B.; Lu, T.; Yu, Y. An agricultural drought index for assessing droughts using a water balance method: A case study in Jilin Province, Northeast China. Remote Sens. 2019, 11, 1066. [Google Scholar] [CrossRef]
  38. Rhee, J.; Im, J.; Carbone, G.J. Monitoring agricultural drought for arid and humid regions using multi-sensor remote sensing data. Remote Sens. Environ. 2010, 114, 2875–2887. [Google Scholar] [CrossRef]
  39. Han, H.; Bai, J.; Yan, J.; Yang, H.; Ma, G. A combined drought monitoring index based on multi-sensor remote sensing data and machine learning. Geocarto Int. 2021, 36, 1161–1177. [Google Scholar] [CrossRef]
  40. Pei, F.; Wu, C.; Liu, X.; Li, X.; Yang, K.; Zhou, Y.; Wang, K.; Xu, L.; Xia, G. Monitoring the vegetation activity in China using vegetation health indices. Agric. For. Meteorol. 2018, 248, 215–227. [Google Scholar] [CrossRef]
  41. Shen, R.; Hiang, A.; Li, B.; Guo, J. Construction of a drought monitoring model using deep learning based on multi-source remote sensing data. Int. J. Appl. Earth Obs. Geoinf. 2019, 79, 48–57. [Google Scholar] [CrossRef]
  42. Cammalleri, C.; Arias-Muñoz, C.; Barbosa, P.; de Jager, A.; Magni, D.; Masante, D.; Mazzeschi, M.; McCormick, N.; Naumann, G.; Spinoni, J.; et al. A revision of the Combined Drought Indicator (CDI) used in the European Drought Observatory (EDO). Nat. Hazards Earth Syst. Sci. 2021, 21, 481–495. [Google Scholar] [CrossRef]
  43. Vogt, J.; Naumann, G.; Masante, D.; Spinoni, J.; Cammalleri, C.; Erian, W.; Pischke, F.; Pulwarty, R.; Barbosa, P. Drought Risk Assessment and Management: A Conceptual Framework; Publications Office of the European Union: Luxembourg, 2018. [Google Scholar]
  44. Mesgaran, M.; Madani, K.; Hashemi, H.; Azadi, P. Evaluation of Land and Precipitation for Agriculture in Iran; Stanford Iran 2040 Project; Stanford University: Stanford, CA, USA, 2016; Available online: https://purl.stanford.edu/vf990qz0340 (accessed on 10 February 2023).
  45. Safarianzengir, V.; Fatahi, A.; Sobhani, B.; Amiri Doumari, S. Temporal and spatial analysis and monitoring of drought (meteorology) and its impacts on environment changes in Iran. Atmos. Sci. Lett. 2022, 23, e1080. [Google Scholar] [CrossRef]
  46. Shahabfar, A.; Ghulam, A.; Eitzinger, J. Drought monitoring in Iran using the perpendicular drought indices. Int. J. Appl. Earth Obs. Geoinf. 2012, 18, 119–127. [Google Scholar] [CrossRef]
  47. Hamzeh, S.; Farahani, Z.; Mahdavi, S.; Chatrobgoun, O.; Gholamnia, M. Spatio-temporal monitoring of agricultural drought using remotely sensed data (Case study of Markazi province of Iran). J. Spat. Anal. Environ. Hazards 2017, 4, 53–70. (In Farsi) [Google Scholar]
  48. Doostan, R. Analysis of drought researches of Iran. J. Spat. Anal. Environ. Hazards 2020, 6, 53–94. (In Farsi) [Google Scholar] [CrossRef]
  49. Karimi, M.; Shahedi, K.; Raziei, T.; Miryaghoobzadeh, M. Analysis of Performance of vegetation indices on agricultural drought using remote sensing technique in Karkheh basin. Iran. J. Remote Sens. GIS 2020, 11, 29–46. (In Farsi) [Google Scholar] [CrossRef]
  50. Mehryar, S.; Sliuzas, R.; Sharifi, A.; van Maarseveen, M.F.A.M. The water crisis and socio-ecological development profile of Rafsanjan Township, Iran. WIT Trans. Ecol. Environ. 2015, 199, 271–285. [Google Scholar]
  51. Bozorg-Haddad, O.; Zolghadr-Asli, B.; Sarzaeim, P.; Aboutalebi, M.; Chu, X.; Loáiciga, H.A. Evaluation of water shortage crisis in the Middle East and possible remedies. J. Water Supply: Res. Technol. -AQUA 2020, 69, 85–98. [Google Scholar] [CrossRef]
  52. Ashraf, S.; AghaKouchak, A.; Nazemi, A.; Mirchi, A.; Sadegh, M.; Moftakhari, H.R.; Hassanzadeh, E.; Miao, C.H.; Madani, K.; Mousavi Baygi, M.; et al. Compounding effects of human activities and climatic changes on surface water availability in Iran. Clim. Change 2019, 152, 379–391. [Google Scholar] [CrossRef]
  53. Moridi, A. State of water resources in Iran. Int. J. Hydrol. 2017, 1, 111–114. [Google Scholar] [CrossRef]
  54. Larijani, K.M. Iran’s water crisis: Inducers, challenges and counter-measures. In Proceedings of the ERSA 45th Congress of the European Regional Science Association, Amsterdam, The Netherlands, 23–27 August 2005. [Google Scholar]
  55. Madani, K.; AghaKouchak, A.; Mirchi, A. Iran’s socio-economic drought: Challenges of a water-bankrupt nation. Iran. Stud. 2016, 49, 997–1016. [Google Scholar] [CrossRef]
  56. Madani, K. Water management in Iran: What is causing the looming crisis? J. Environ. Stud. Sci. 2014, 4, 315–328. [Google Scholar] [CrossRef]
  57. Barthold, V.V. An Historical Geography of Iran; Princeton University Press: Princeton, NJ, USA, 2014; Volume 65. [Google Scholar]
  58. Wan, Z.; Hook, S.; Hulley, G. MOD11A2 MODIS/Terra land surface temperature/emissivity 8-day L3 global 1km SIN grid V006; NASA EOSDIS Land Processes DAAC: Sioux Falls, SD, USA, 2015; Volume 10, p. 10.5067. [Google Scholar]
  59. Funk, C.; Peterson, P.; Landsfeld, M.; Pedreros, D.; Verdin, J.; Shukla, S.; Husak, G.; Rowland, J.; Harrison, L.; Hoell, A.; et al. The climate hazards infrared precipitation with stations—A new environmental record for monitoring extremes. Sci. Data 2015, 2, 150066. [Google Scholar] [CrossRef] [PubMed]
  60. Tsiros, E.; Domenikiotis, C.; Spiliotopoulos, M.; Dalezios, N. Use of NOAA/AVHRR-based vegetation condition index (VCI) and temperature condition index (TCI) for drought monitoring in Thessaly, Greece. In Proceedings of the EWRA Symposium on Water Resources Management: Risks and Challenges for the 21st Century, Izmir, Turkey, 2–4 September 2004. [Google Scholar]
  61. Friedl, M.; Sulla-Menashe, D. MODIS/Terra+Aqua Land Cover Type Yearly L3 Global 500m SIN Grid V061; NASA EOSDIS Land Processes DAAC: Sioux Falls, SD, USA, 2022. [Google Scholar]
  62. Raziei, T. Climate of Iran according to Köppen-Geiger, Feddema, and UNEP climate classifications. Theor. Appl. Climatol. 2022, 148, 1395–1416. [Google Scholar] [CrossRef]
  63. Köppen, V.; Geiger, R. Handbuch der Klimatologie, 5 Vols.; Gerbrüder Borntraegar: Berlin, Germany, 1930; 44p. [Google Scholar]
  64. Available online: https://reliefweb.int/report/iran-islamic-republic/iran-droughts-operation-update-report-n-1-dref-n-mdrir005 (accessed on 21 February 2023).
  65. Huffman, G.J.; Bolvin, D.T.; Braithwaite, D.; Hsu, K.; Joyce, R.; Kidd, C.; Nelkin, E.J.; Sorooshian, S.; Tan, J.; Xie, P. NASA global precipitation measurement (GPM) integrated multi-satellite retrievals for GPM (IMERG). In Algorithm Theoretical Basis Document (ATBD) Version 06; National Aeronautics and Space Administration: Washington, DC, USA, 2019; Volume 4. [Google Scholar]
Figure 1. Combined drought indicator for the first 10 days of September 2021: Sardinia, Italy. Extracted from https://edo.jrc.ec.europa.eu/gdo (accessed on 21 February 2023).
Remotesensing 15 02218 g001
Figure 2. RdrI-Agri for the first 10 days of March 2021: Khorasan, Iran. Extracted from https://edo.jrc.ec.europa.eu/gdo.
Remotesensing 15 02218 g002
Figure 3. Average annual temperature distribution in Iran (°C).
Remotesensing 15 02218 g003
Figure 4. The processing of SDCI calculation.
Remotesensing 15 02218 g004
Figure 5. Climate classes of Iran obtained according to De Martonne aridity index between 2010 and 2021.
Remotesensing 15 02218 g005
Figure 6. SDCI trend for “very humid” climate from January 2010 to December 2021: Iran.
Remotesensing 15 02218 g006
Figure 7. SDCI trend for “humid” climate from January 2010 to December 2021: Iran.
Remotesensing 15 02218 g007
Figure 8. PCI comparison from 2017 to 2021 in the humid and very humid climates: Iran.
Remotesensing 15 02218 g008
Figure 9. TCI trend for humid climate from January 2010 to December 2012: Iran.
Remotesensing 15 02218 g009
Figure 10. SDCI trend for semi-humid climate from January 2010 to December 2021: Iran.
Remotesensing 15 02218 g010
Figure 11. PCI value in semi-humid climate in 2010: Iran.
Remotesensing 15 02218 g011
Figure 12. VCI trend in semi-humid climate from 2010 to 2011: Iran.
Remotesensing 15 02218 g012
Figure 13. SDCI trend for Mediterranean climate from January 2010 to December 2021: Iran.
Remotesensing 15 02218 g013
Figure 14. VCI in Mediterranean climate in 2017 and 2018: Iran.
Remotesensing 15 02218 g014
Figure 15. SDCI trend in semi-arid climate from January 2010 to December 2021: Iran.
Remotesensing 15 02218 g015
Figure 16. SDCI values in semi-humid and semi-arid climates in 2018, 2019, 2020, and 2021: Iran.
Remotesensing 15 02218 g016
Figure 17. SDCI trend in arid climate from January 2010 to December 2021: Iran.
Remotesensing 15 02218 g017
Figure 18. PCI trend for arid climate from January 2010 to December 2021: Iran.
Remotesensing 15 02218 g018
Figure 19. TCI trend for arid climate from 2010 to 2021: Iran.
Remotesensing 15 02218 g019
Figure 20. SDCI map of 2010, Iran.
Remotesensing 15 02218 g020
Figure 21. SDCI map of 2020, Iran.
Remotesensing 15 02218 g021
Figure 22. Land cover map of Iran, MOD12Q1 product of MODIS [61].
Remotesensing 15 02218 g022
Figure 23. Time series of SDCI map of city of Zanjan, part of the Ghazvin and Gilan provinces, in Iran for the months of March, April, and May from 2010 to 2021.
Remotesensing 15 02218 g023
Figure 24. Temporal analysis of drought using drought analysis application made through GEE. URL application: https://adeltaheripolimi.users.earthengine.app/view/temporaldroughtindices-final (accessed on 21 February 2023).
Remotesensing 15 02218 g024
Figure 25. Yearly average SDCI results using GEE apps. URL application: https://adeltaheripolimi.users.earthengine.app/view/yearlyaveragesdcifinal (accessed on 21 February 2023).
Remotesensing 15 02218 g025
Figure 26. Yearly average SDCI results using GEE apps. URL application: https://adeltaheripolimi.users.earthengine.app/view/yearlyaveragesdcifinal (accessed on 21 February 2023).
Remotesensing 15 02218 g026
Table 1. The De Martonne aridity index classification [18].
Type of ClimatesValues of Idm
AridIDM < 10
Semi-arid10 ≤ IDM < 20
Mediterranean20 ≤ IDM < 24
Semi-humid24 ≤ IDM < 28
Humid28 ≤ IDM < 35
Very humidIDM ≥ 35
Table 2. Drought classification based on SDCI [38].
ClassificationSdci Index
Extreme drought0 ≤ SDCI < 0.1
Severe drought0.1 ≤ SDCI < 0.2
Moderate drought0.2 ≤ SDCI < 0.3
Light drought0.3 ≤ SDCI < 0.4
No droughtSDCI ≥ 0.4
Disclaimer/Publisher’s Note: The statements, opinions and data contained in all publications are solely those of the individual author(s) and contributor(s) and not of MDPI and/or the editor(s). MDPI and/or the editor(s) disclaim responsibility for any injury to people or property resulting from any ideas, methods, instructions or products referred to in the content.

