Method of Validating Satellite Surface Reflectance Product Using Empirical Line Method
Abstract
1. Introduction
1.1. Background
1.2. Literature Review
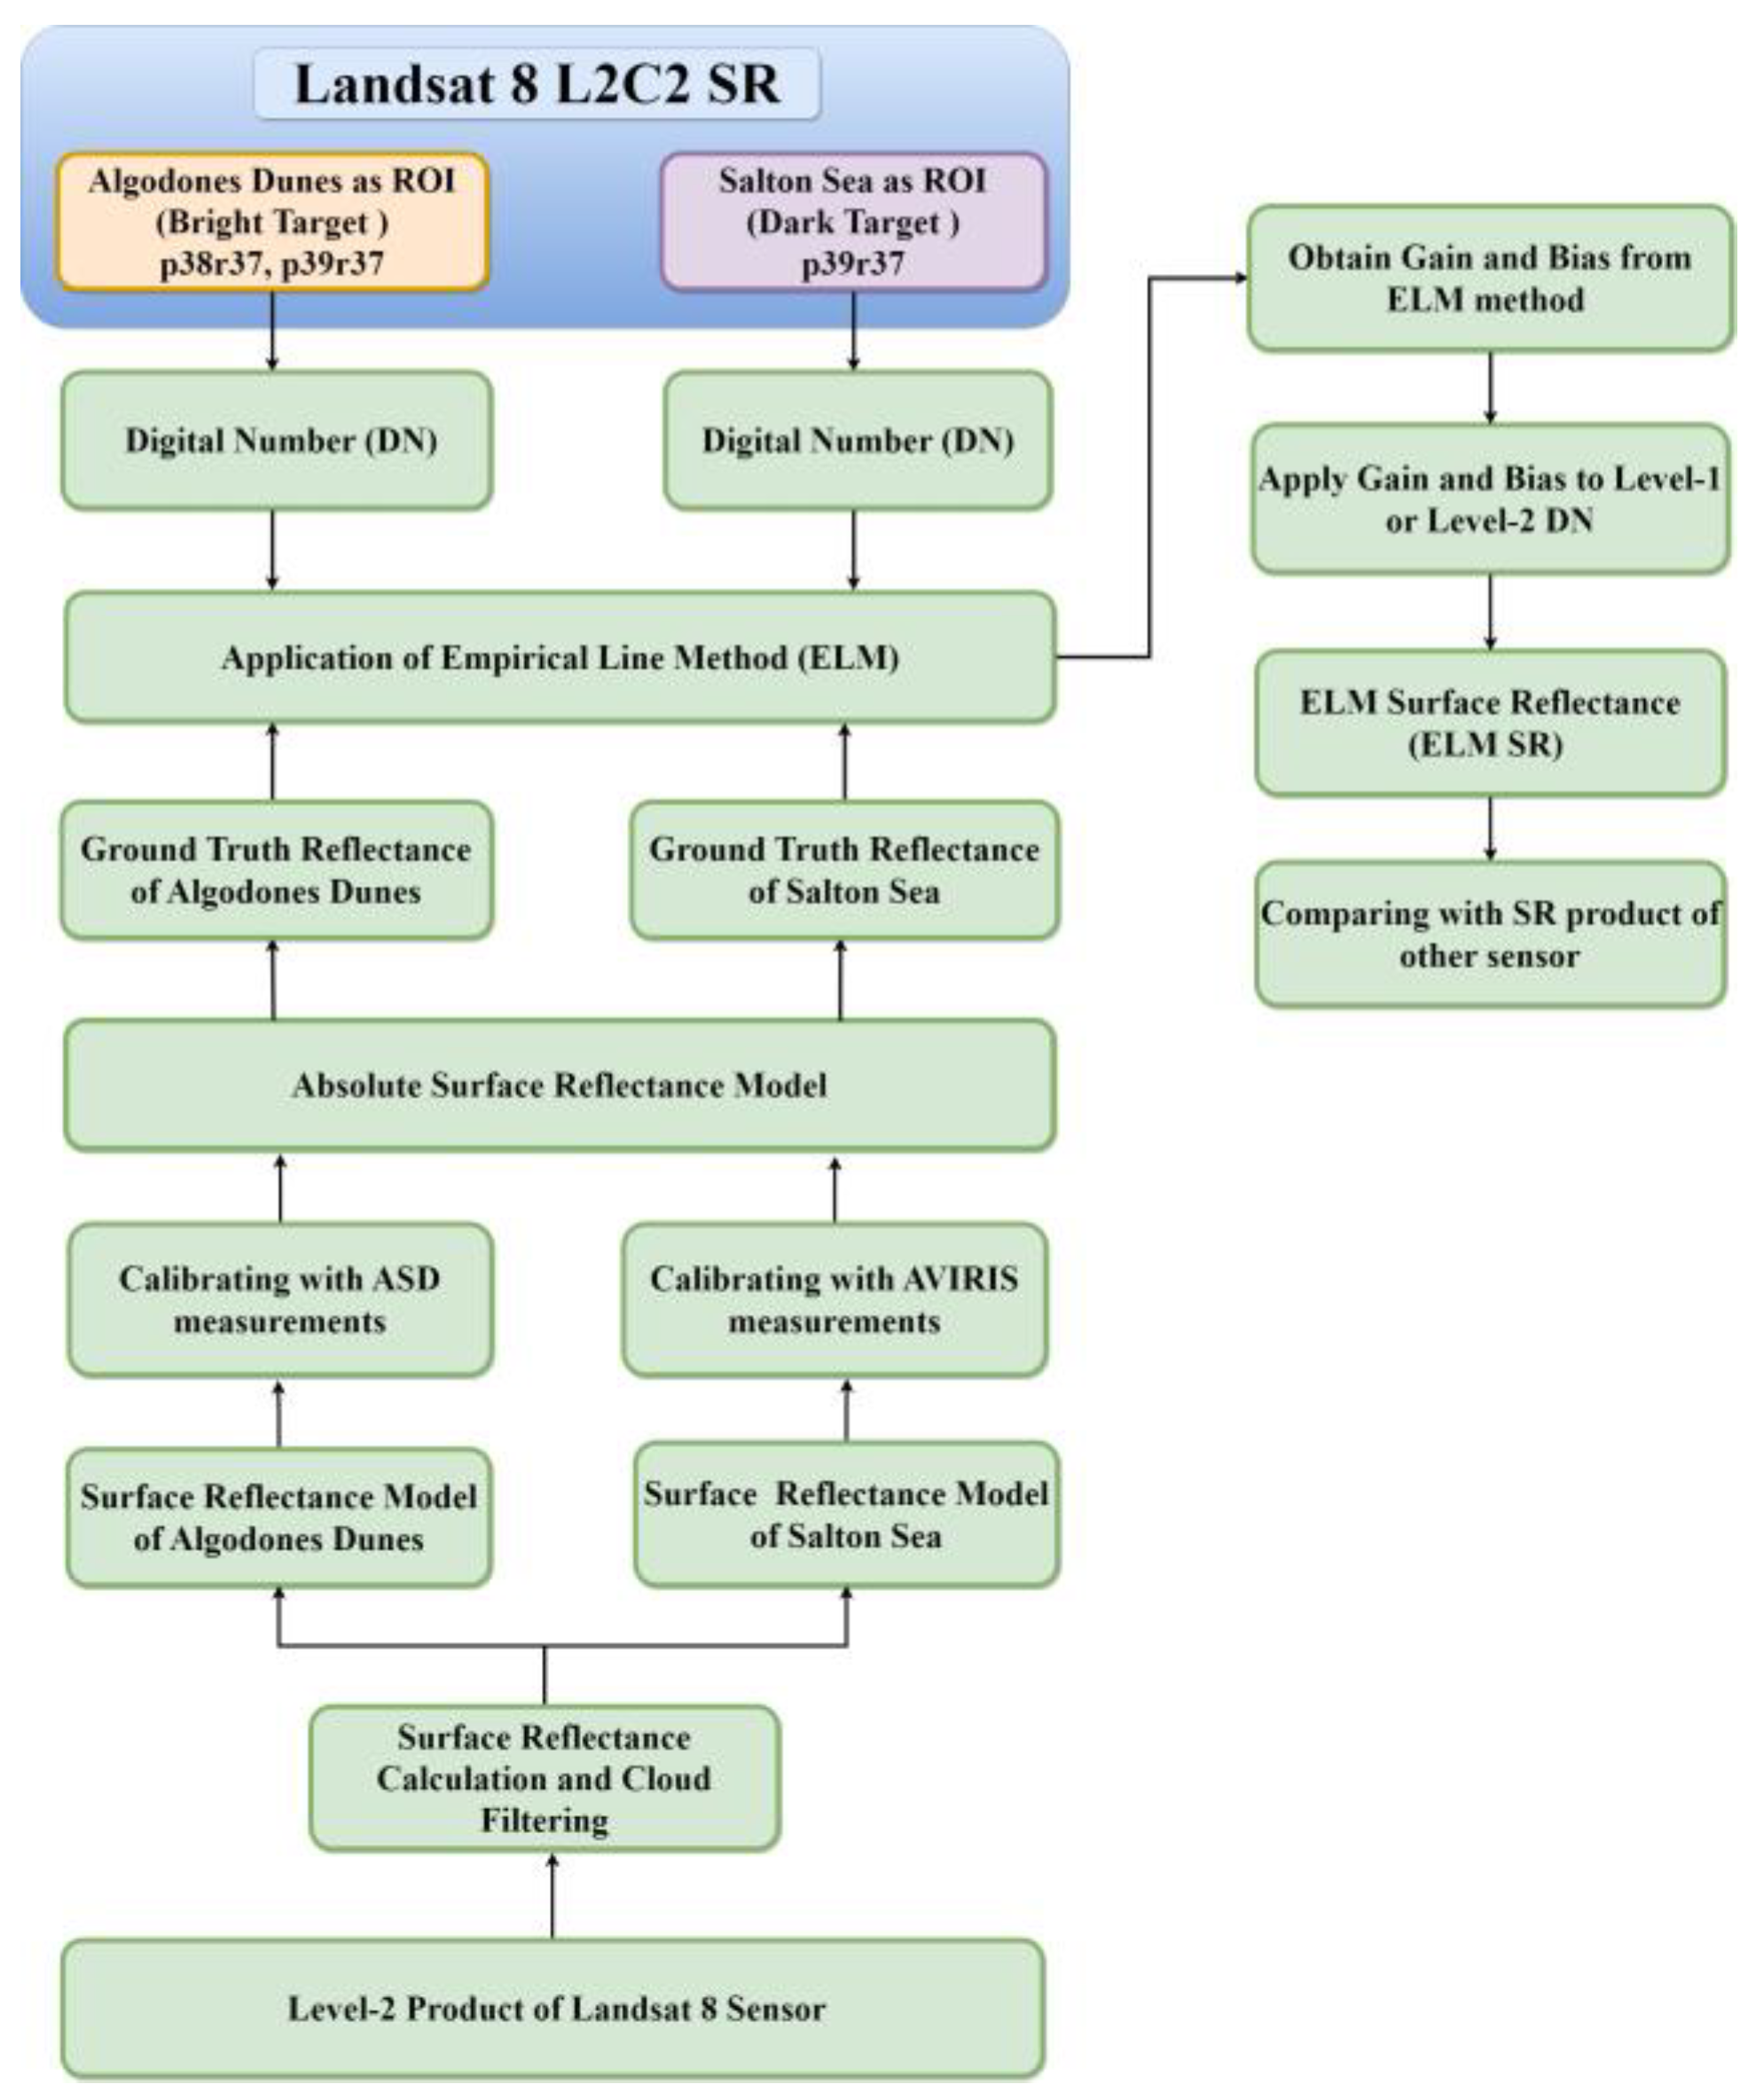
1.3. Proposed Method of Atmospheric Correction and Validation
2. Data Sources Overview
2.1. Landsat 9 OLI-2
2.2. Landsat 8 OLI
2.3. Landsat 5 TM
2.4. ASD
2.5. AVIRIS
3. Methodology
3.1. Method of Obtaining ELM Surface Reflectance
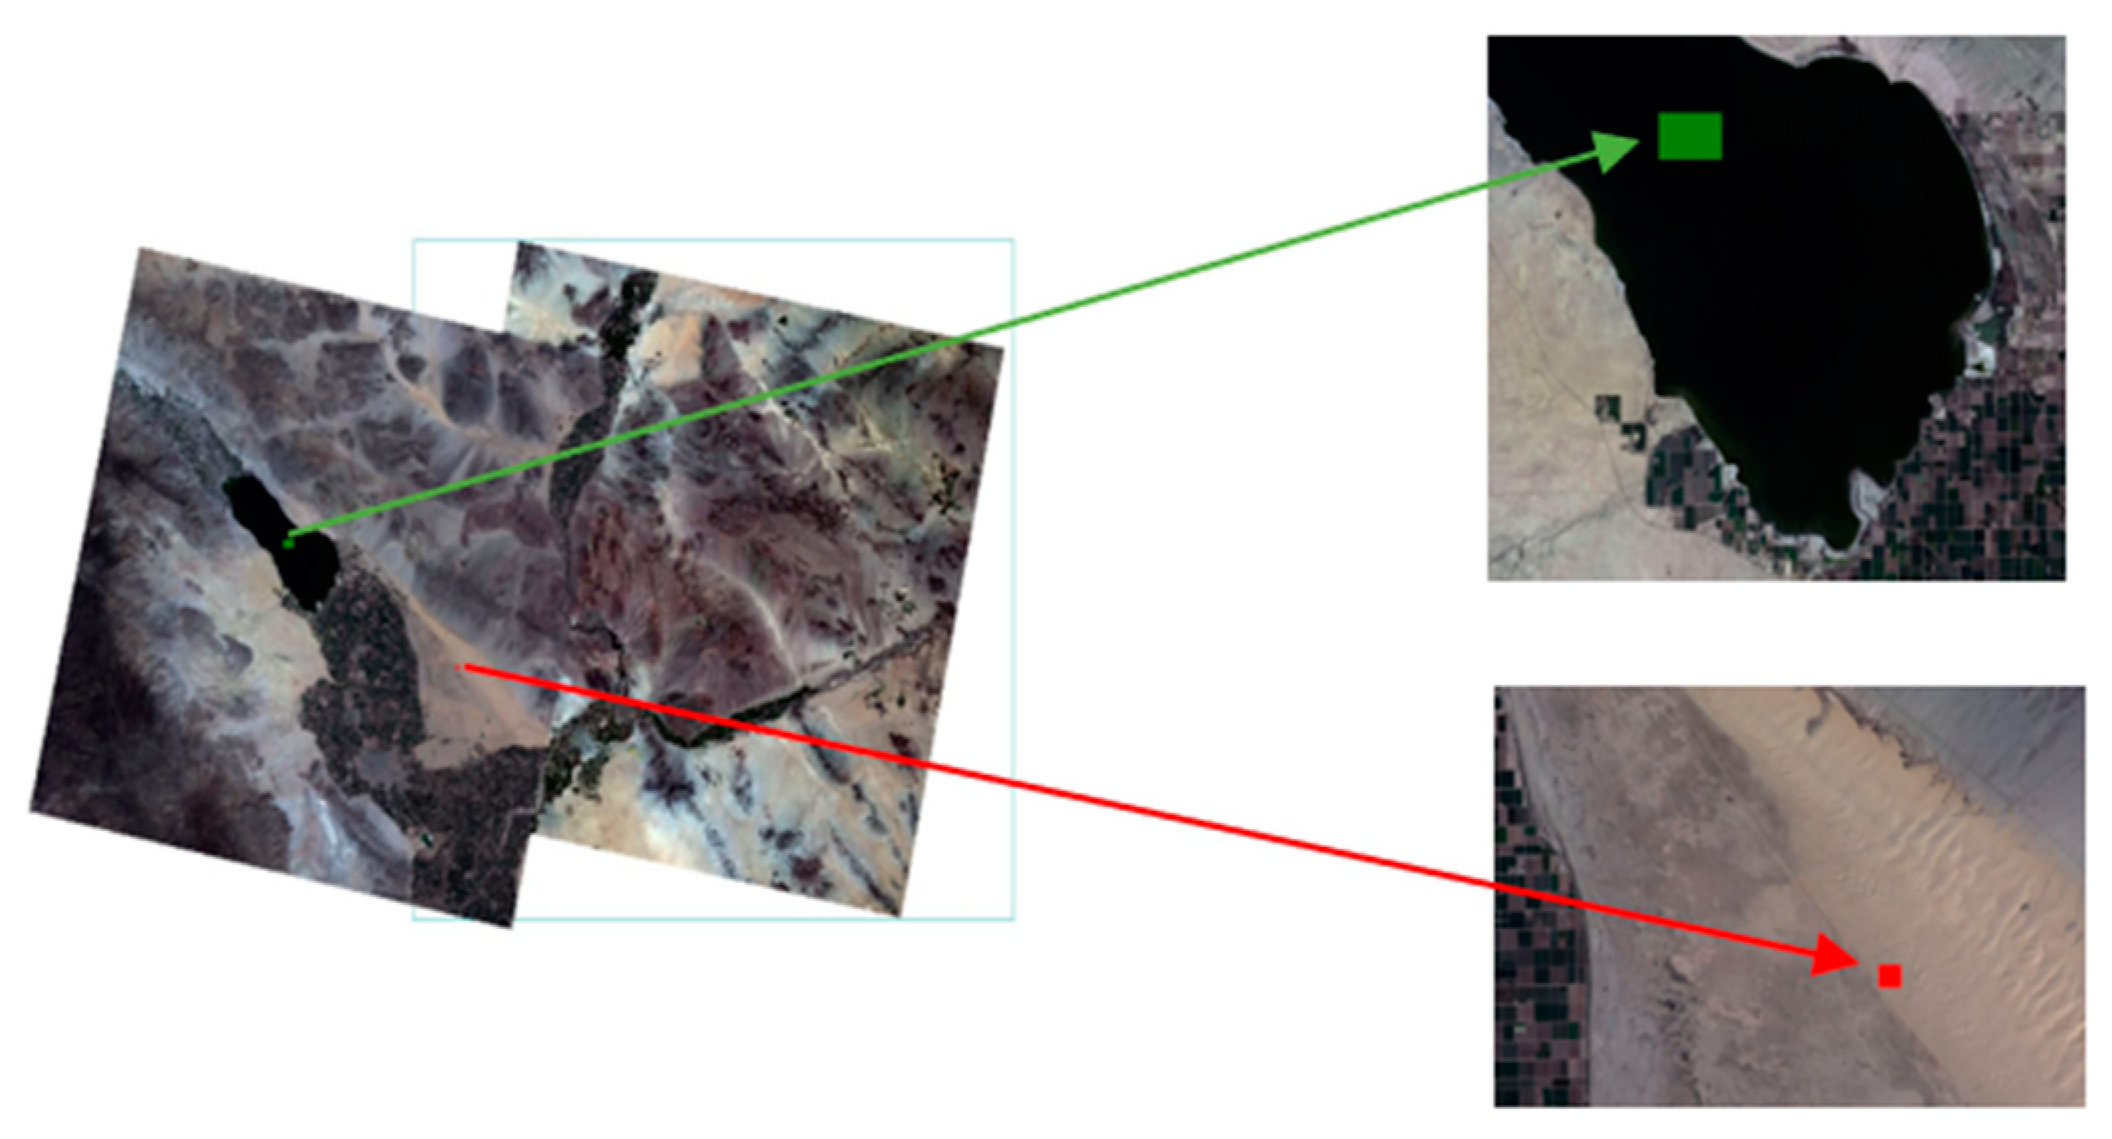
3.1.1. Site Selection and Region of Interest (ROI)
3.1.2. Surface Reflectance Calculation and Cloud Filtering
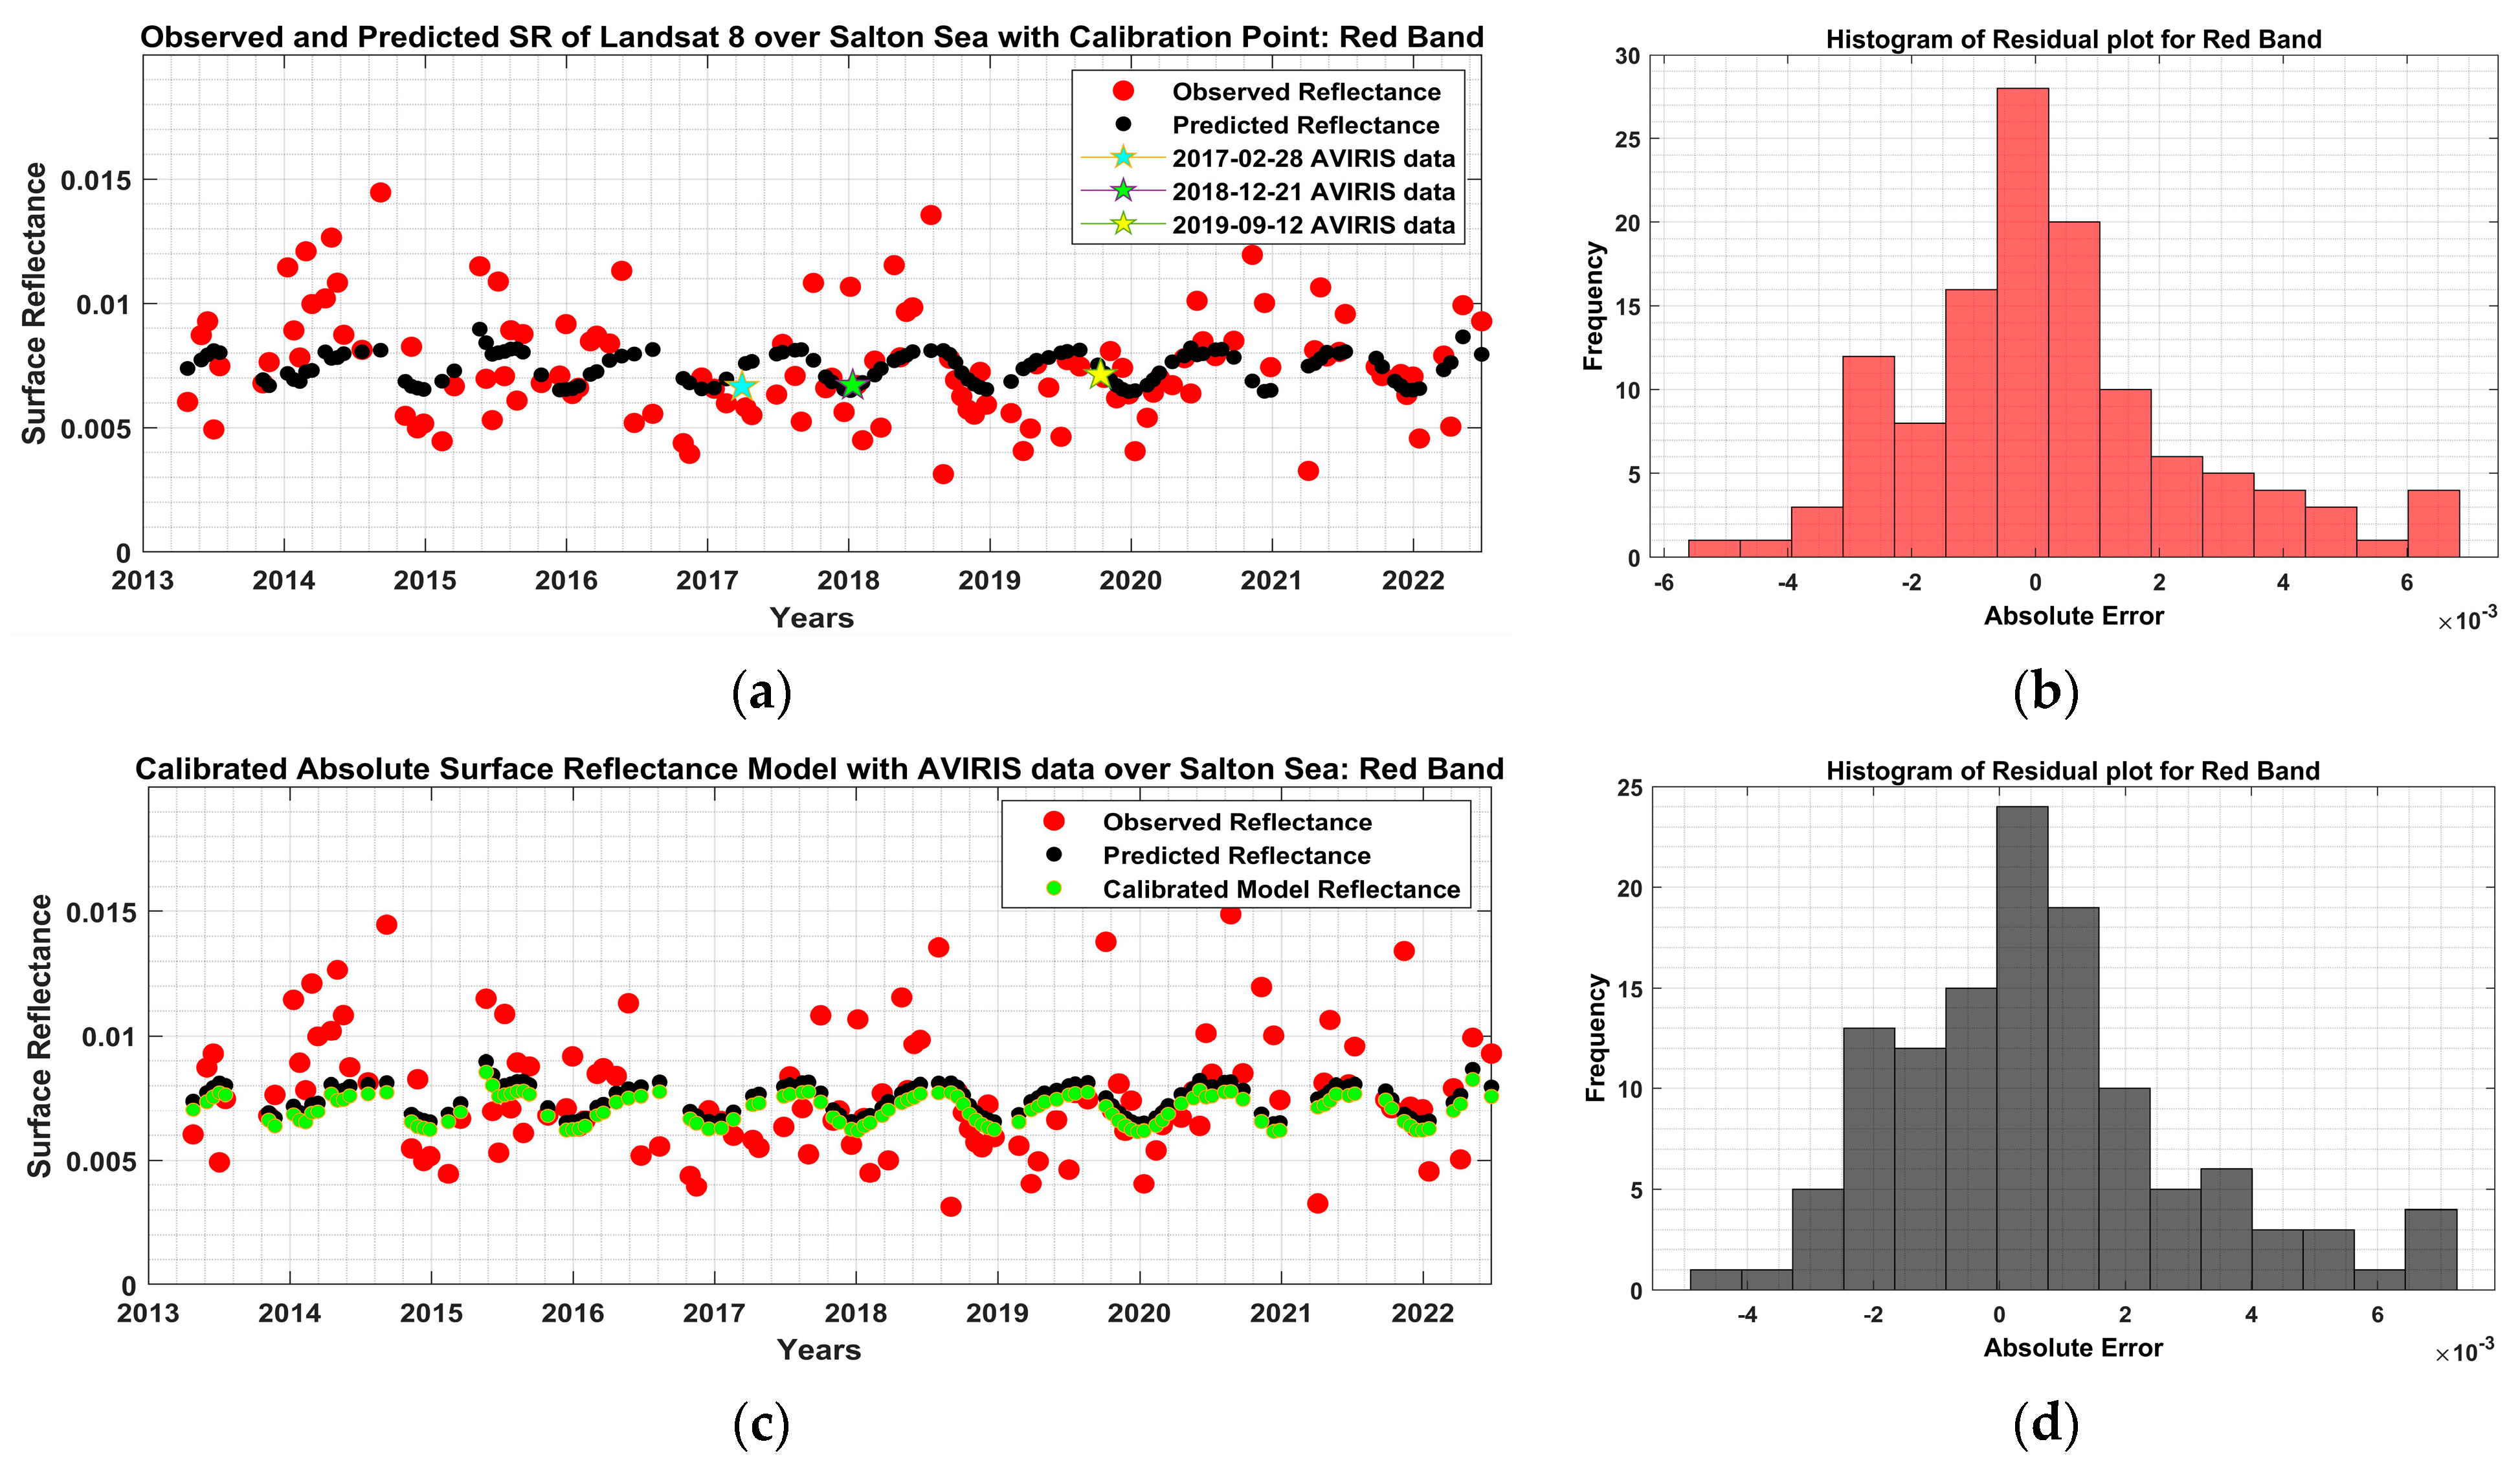
3.1.3. Absolute Surface Reflectance Model for Algodones Dunes and Salton Sea
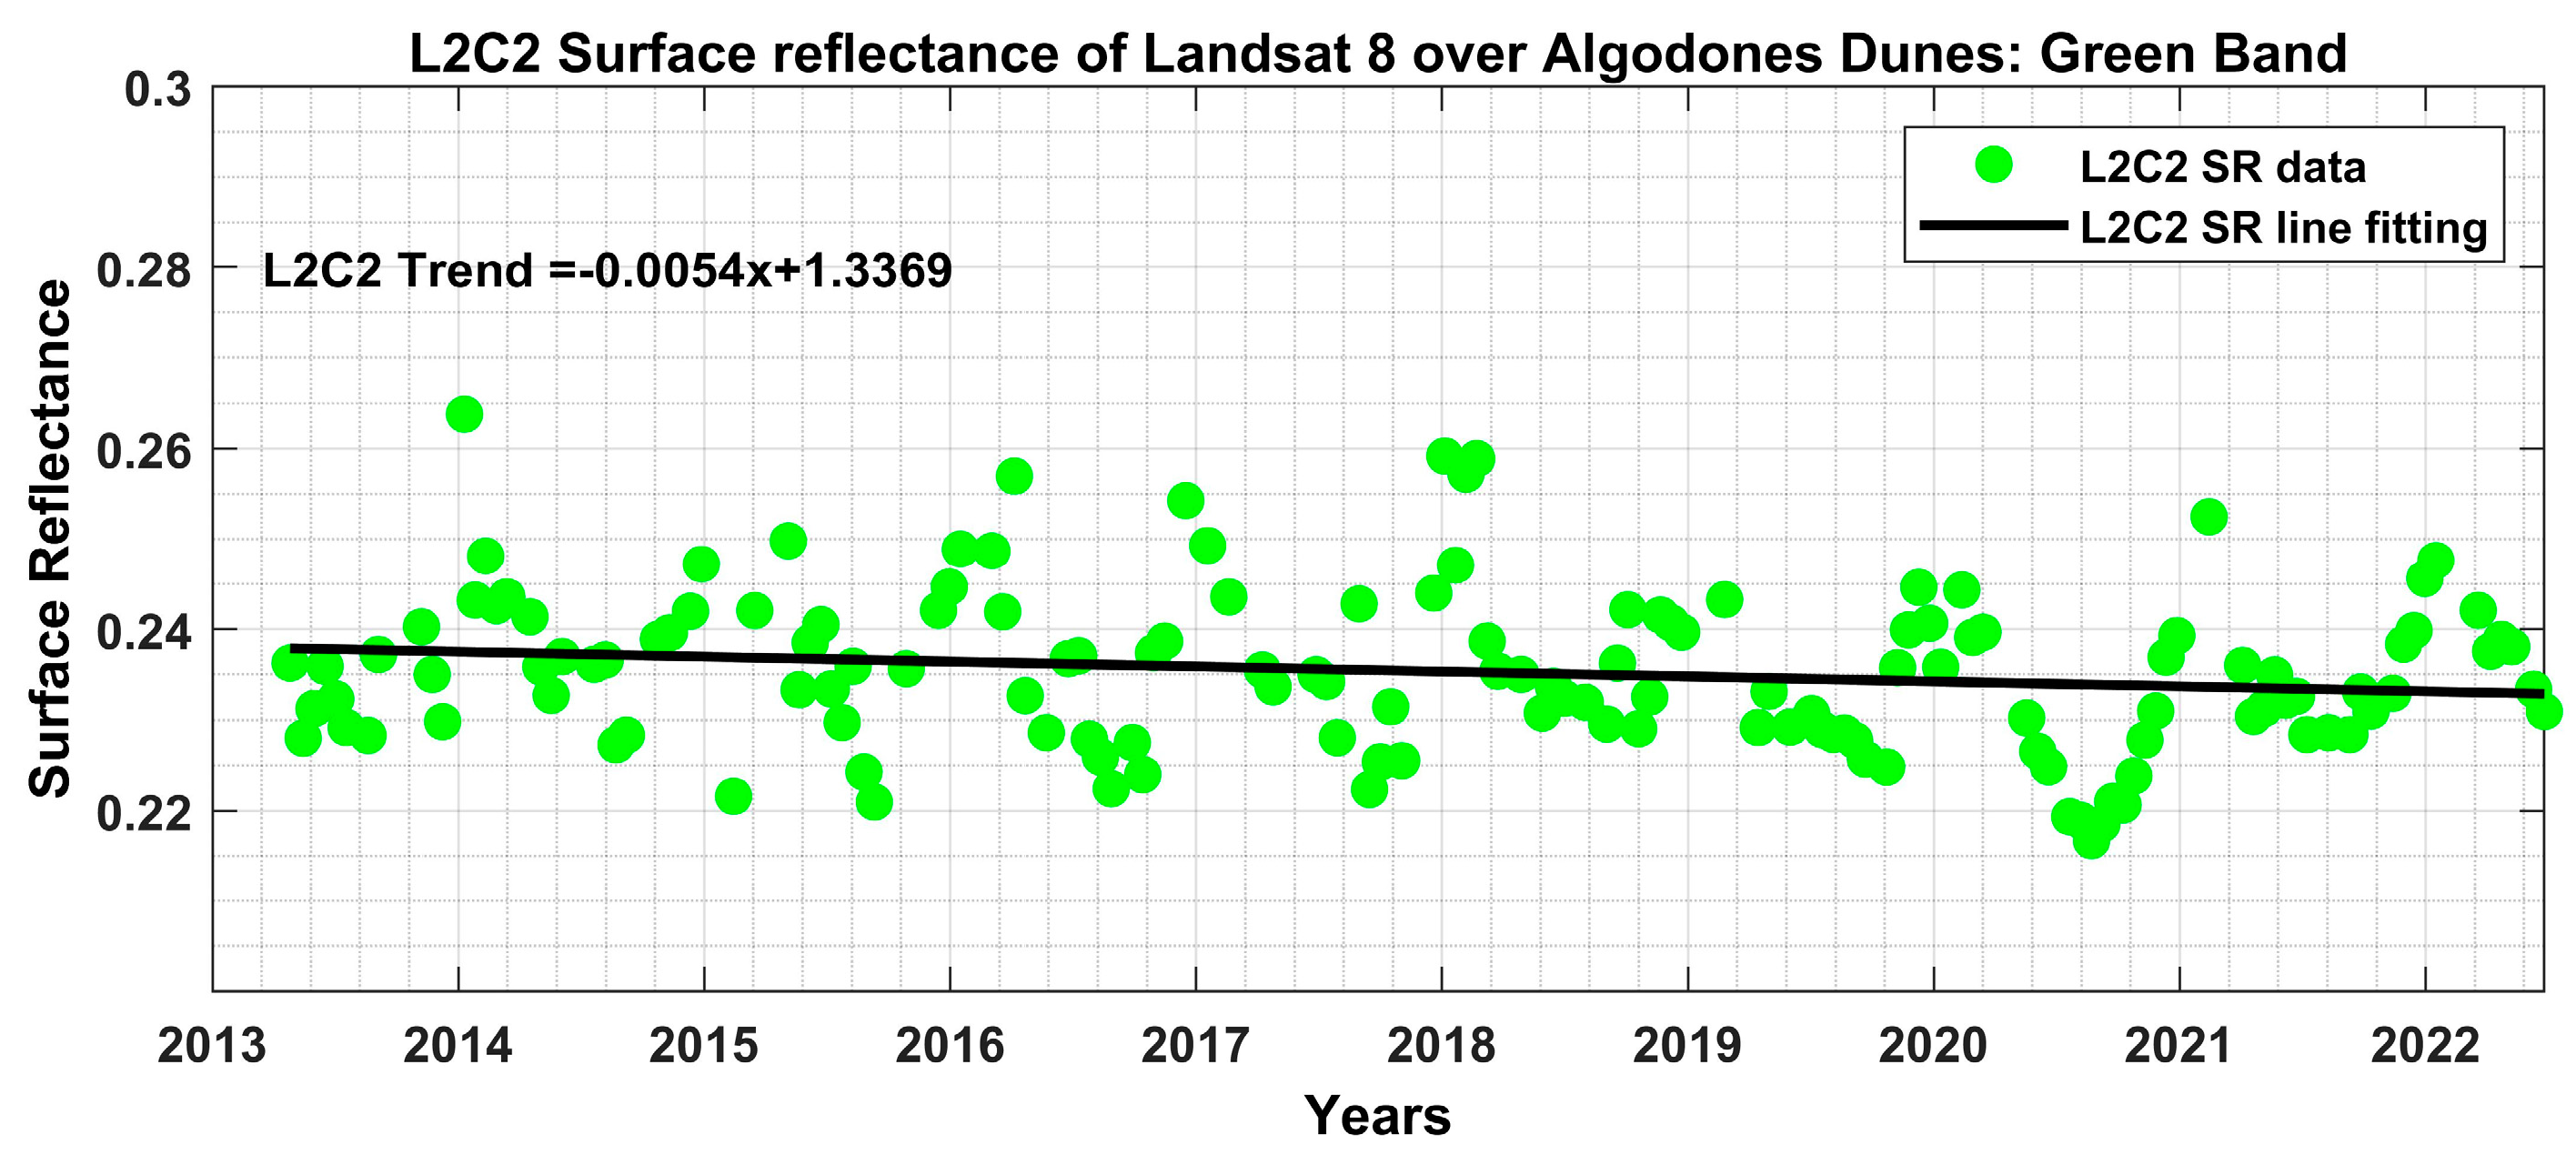
- Trend Analysis of Algodones Dunes
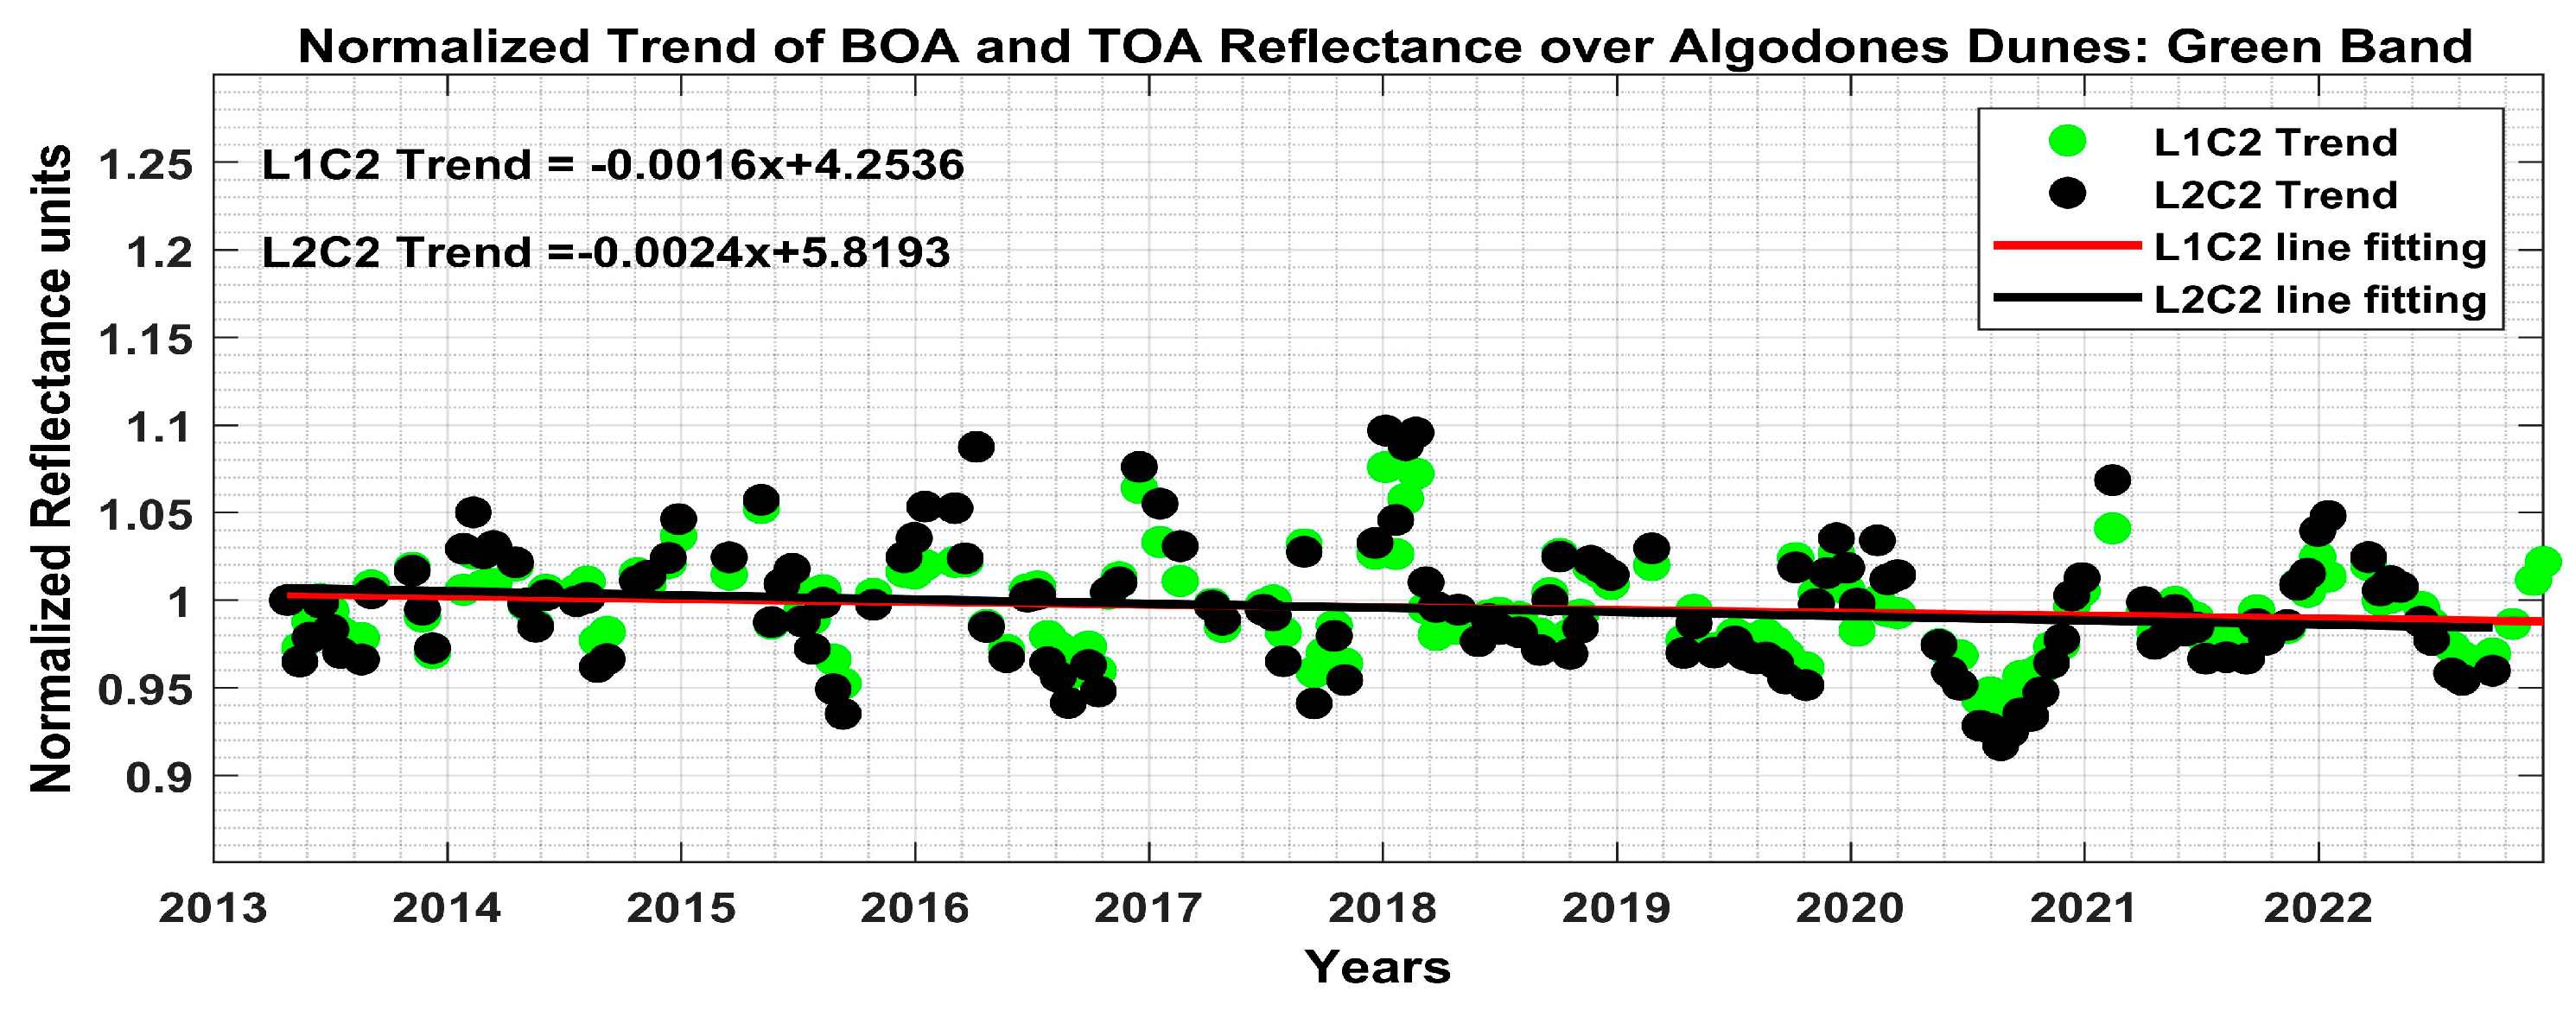
- Investigation of atmospheric correction algorithm for L2C2 SR products: To see whether the decreasing negative trend was due to an issue with the atmospheric correction algorithm, the temporal trend of TOA L1C2 and Bottom of Atmosphere (BOA) L2C2 reflectance was observed for Algodones Dunes. To see a clear trend and pattern of both products, TOA and BOA reflectance were normalized at the first data point by dividing entire time series data with first data point of time series, and the normalized trend was obtained. While observing the normalized trend of TOA and BOA reflectance, as shown in Figure 4, both product trends and angular patterns follow each other where green dots represent the TOA L1C2 trend and black dots represent the BOA L2C2 trend. Again, the decreasing negative trend was observed in the temporal trend of BOA and TOA reflectance. This investigation shows that the decreasing negative trend was not due to an issue in the atmospheric correction algorithm of L2C2 SR products by Landsat 8 OLI sensor.
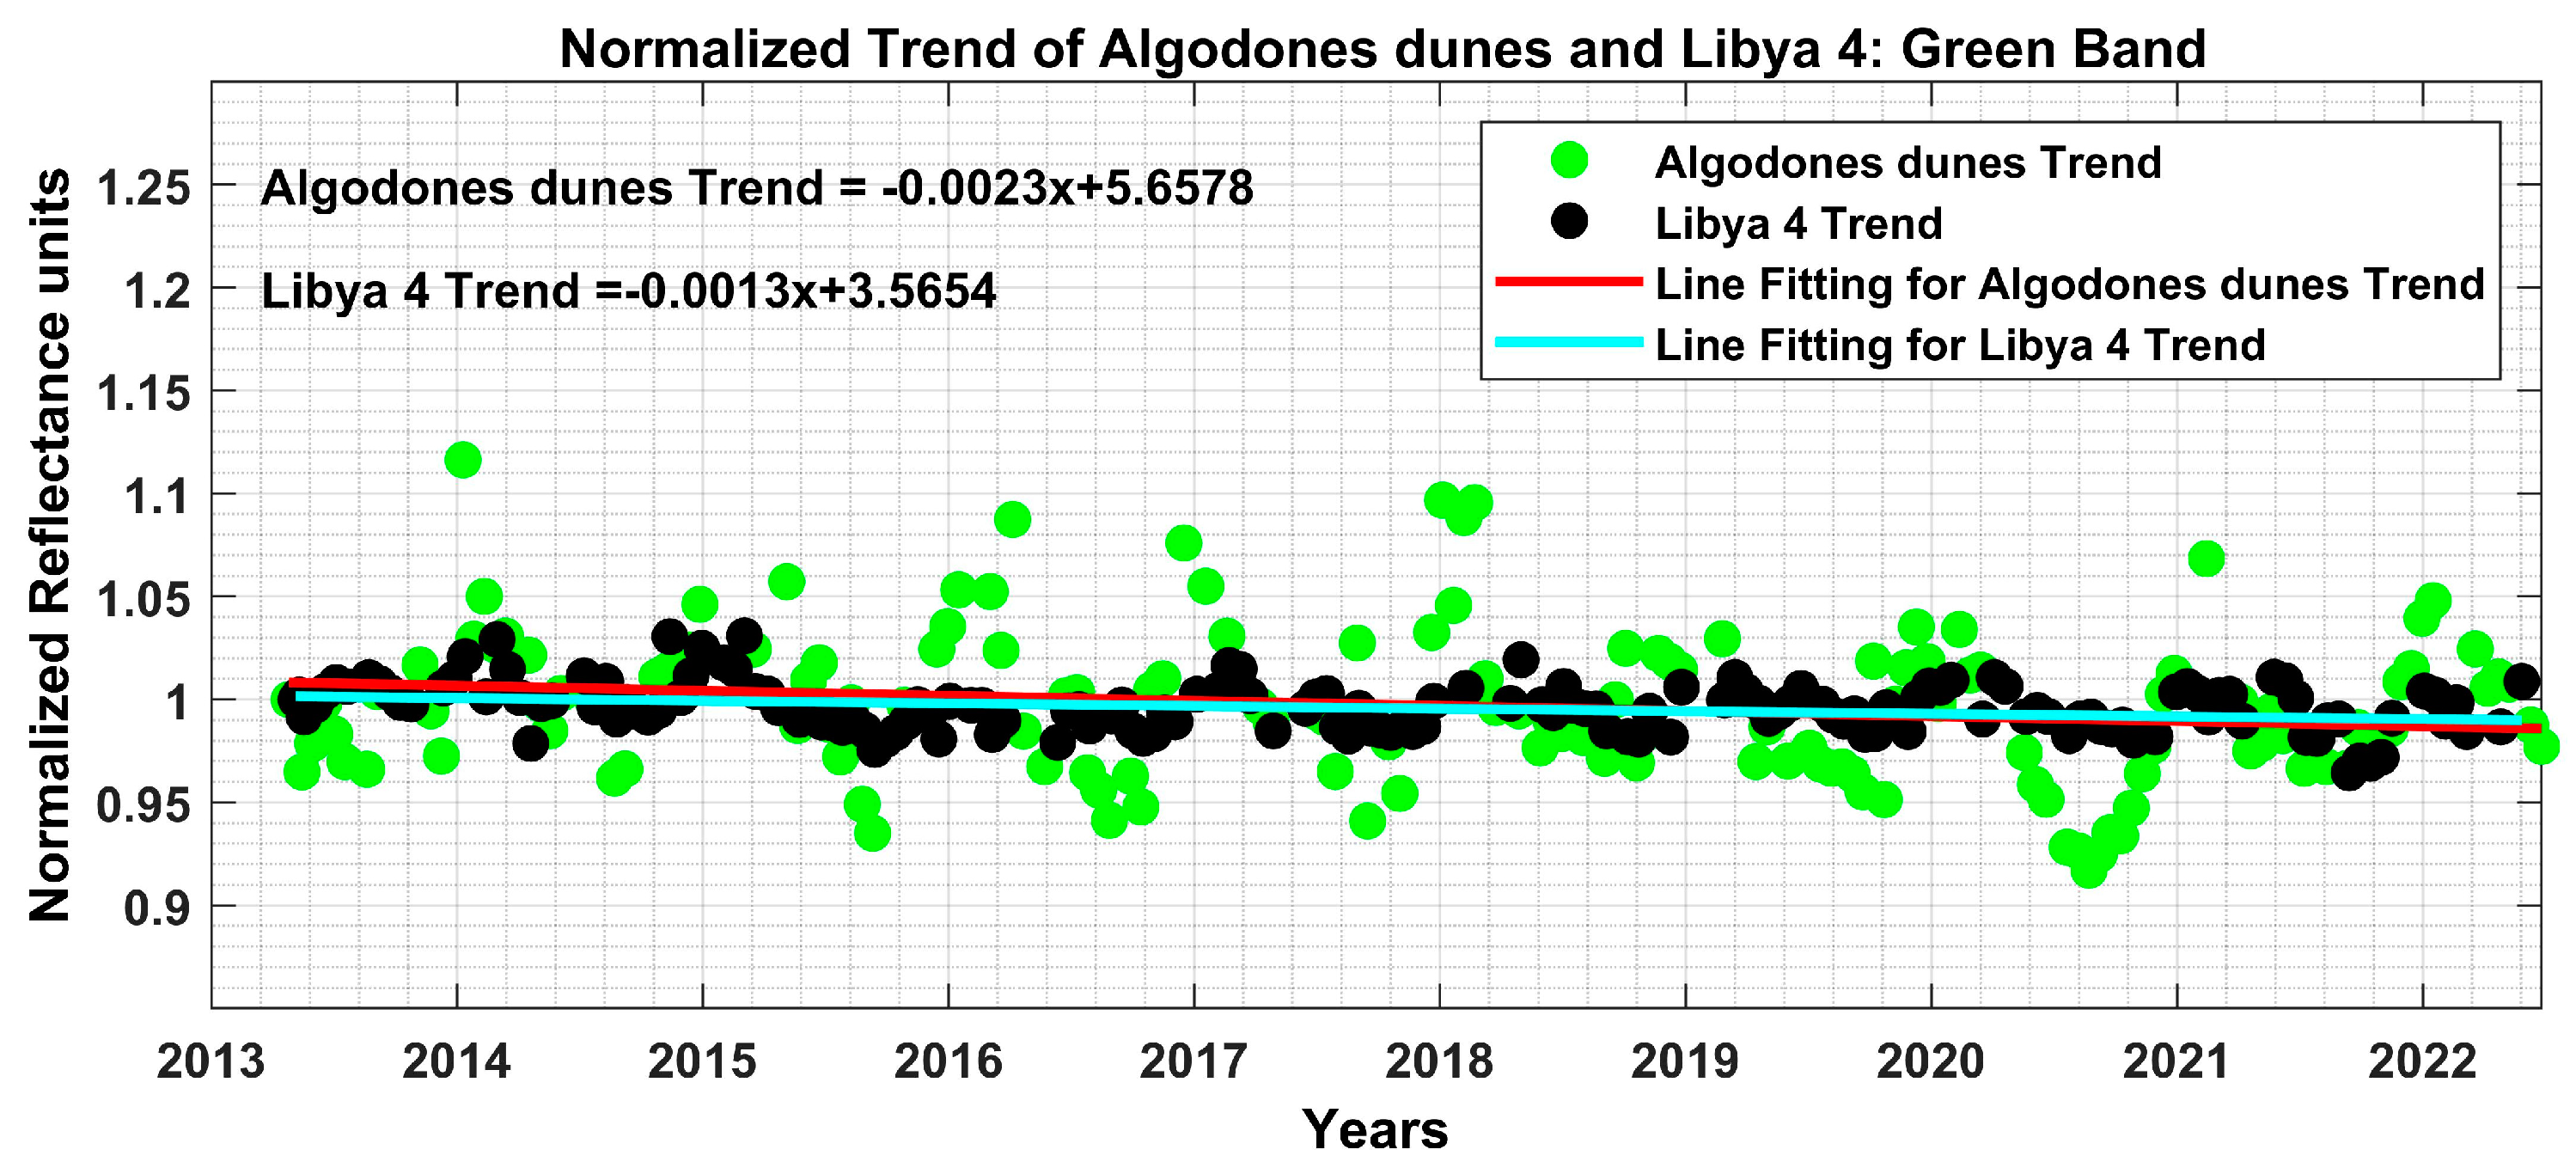
- Investigation for the site might be changing: To see whether the decreasing negative trend was due to the changing site, another Pseudo Invariant Calibration site (PICS site) called Libya-4 from Path 181 Row 40 was taken into consideration. The Libya-4 is the PICS site, which is temporally, spectrally, and spatially stable over a period of time with relatively low uncertainties [29]. Figure 5 shows the normalized trend of Algodones dunes and Libya 4 by Landsat 8 where green dots represent the Algodones Dunes trend and black dots represent the Libya 4 trend. The decreasing negative trend was observed in the temporal trend of Libya-4 PICS, the same as of Algodones Dunes, as shown in Figure 5. It is nearly impossible for two sites in a different path and row to change at the same period, so this investigation shows that the negative decreasing trend was not due to the site. For further analysis, this investigation was extended to another satellite, i.e., Landsat 7 ETM+ for the Algodones Dunes.
- Investigation for artifacts in the Landsat 8 OLI sensor used for analysis: To see whether the decreasing negative trend was due to artifacts in the Landsat 8 OLI sensor, another satellite was used to analyze Algodones Dunes. Landsat 7 ETM+ sensor was used for producing the temporal trend of L2C2 SR products for Algodones Dunes. Figure 6 demonstrates Landsat 8 & 7 normalized temporal trend of Algodones dunes, where green dots represent the L8 trend and black dots represent the L7 trend. While observing trends from Landsat 8 & 7, it’s uncertain that there is any decreasing negative trend in the Landsat 7 dataset of Algodones Dunes over Landsat 8. The Algodones Dunes seem to be stable without any trend over time. This investigation suggests that the decreasing negative trend might be due to the artifacts in the sensor.
3.1.4. Estimation of Spectral Band Adjustment Factor
3.1.5. Implementation of Empirical Line Method (ELM)
- The DN value from the Algodones Dunes as ROI was the first input for the ELM. The DNs from Algodones Dunes were the higher value.
- The DN value from the Salton Sea as ROI was the second input for the ELM. The DNs from the Salton Sea were the lower value.
- The absolute surface reflectance model of Algodones Dunes gave the ground truth reflectance of Algodones Dunes.
- The absolute surface reflectance model of the Salton Sea gave the ground truth reflectance of the Salton Sea.
3.2. Uncertainty Analysis
3.3. Data Evaluation and Comparison Methodology
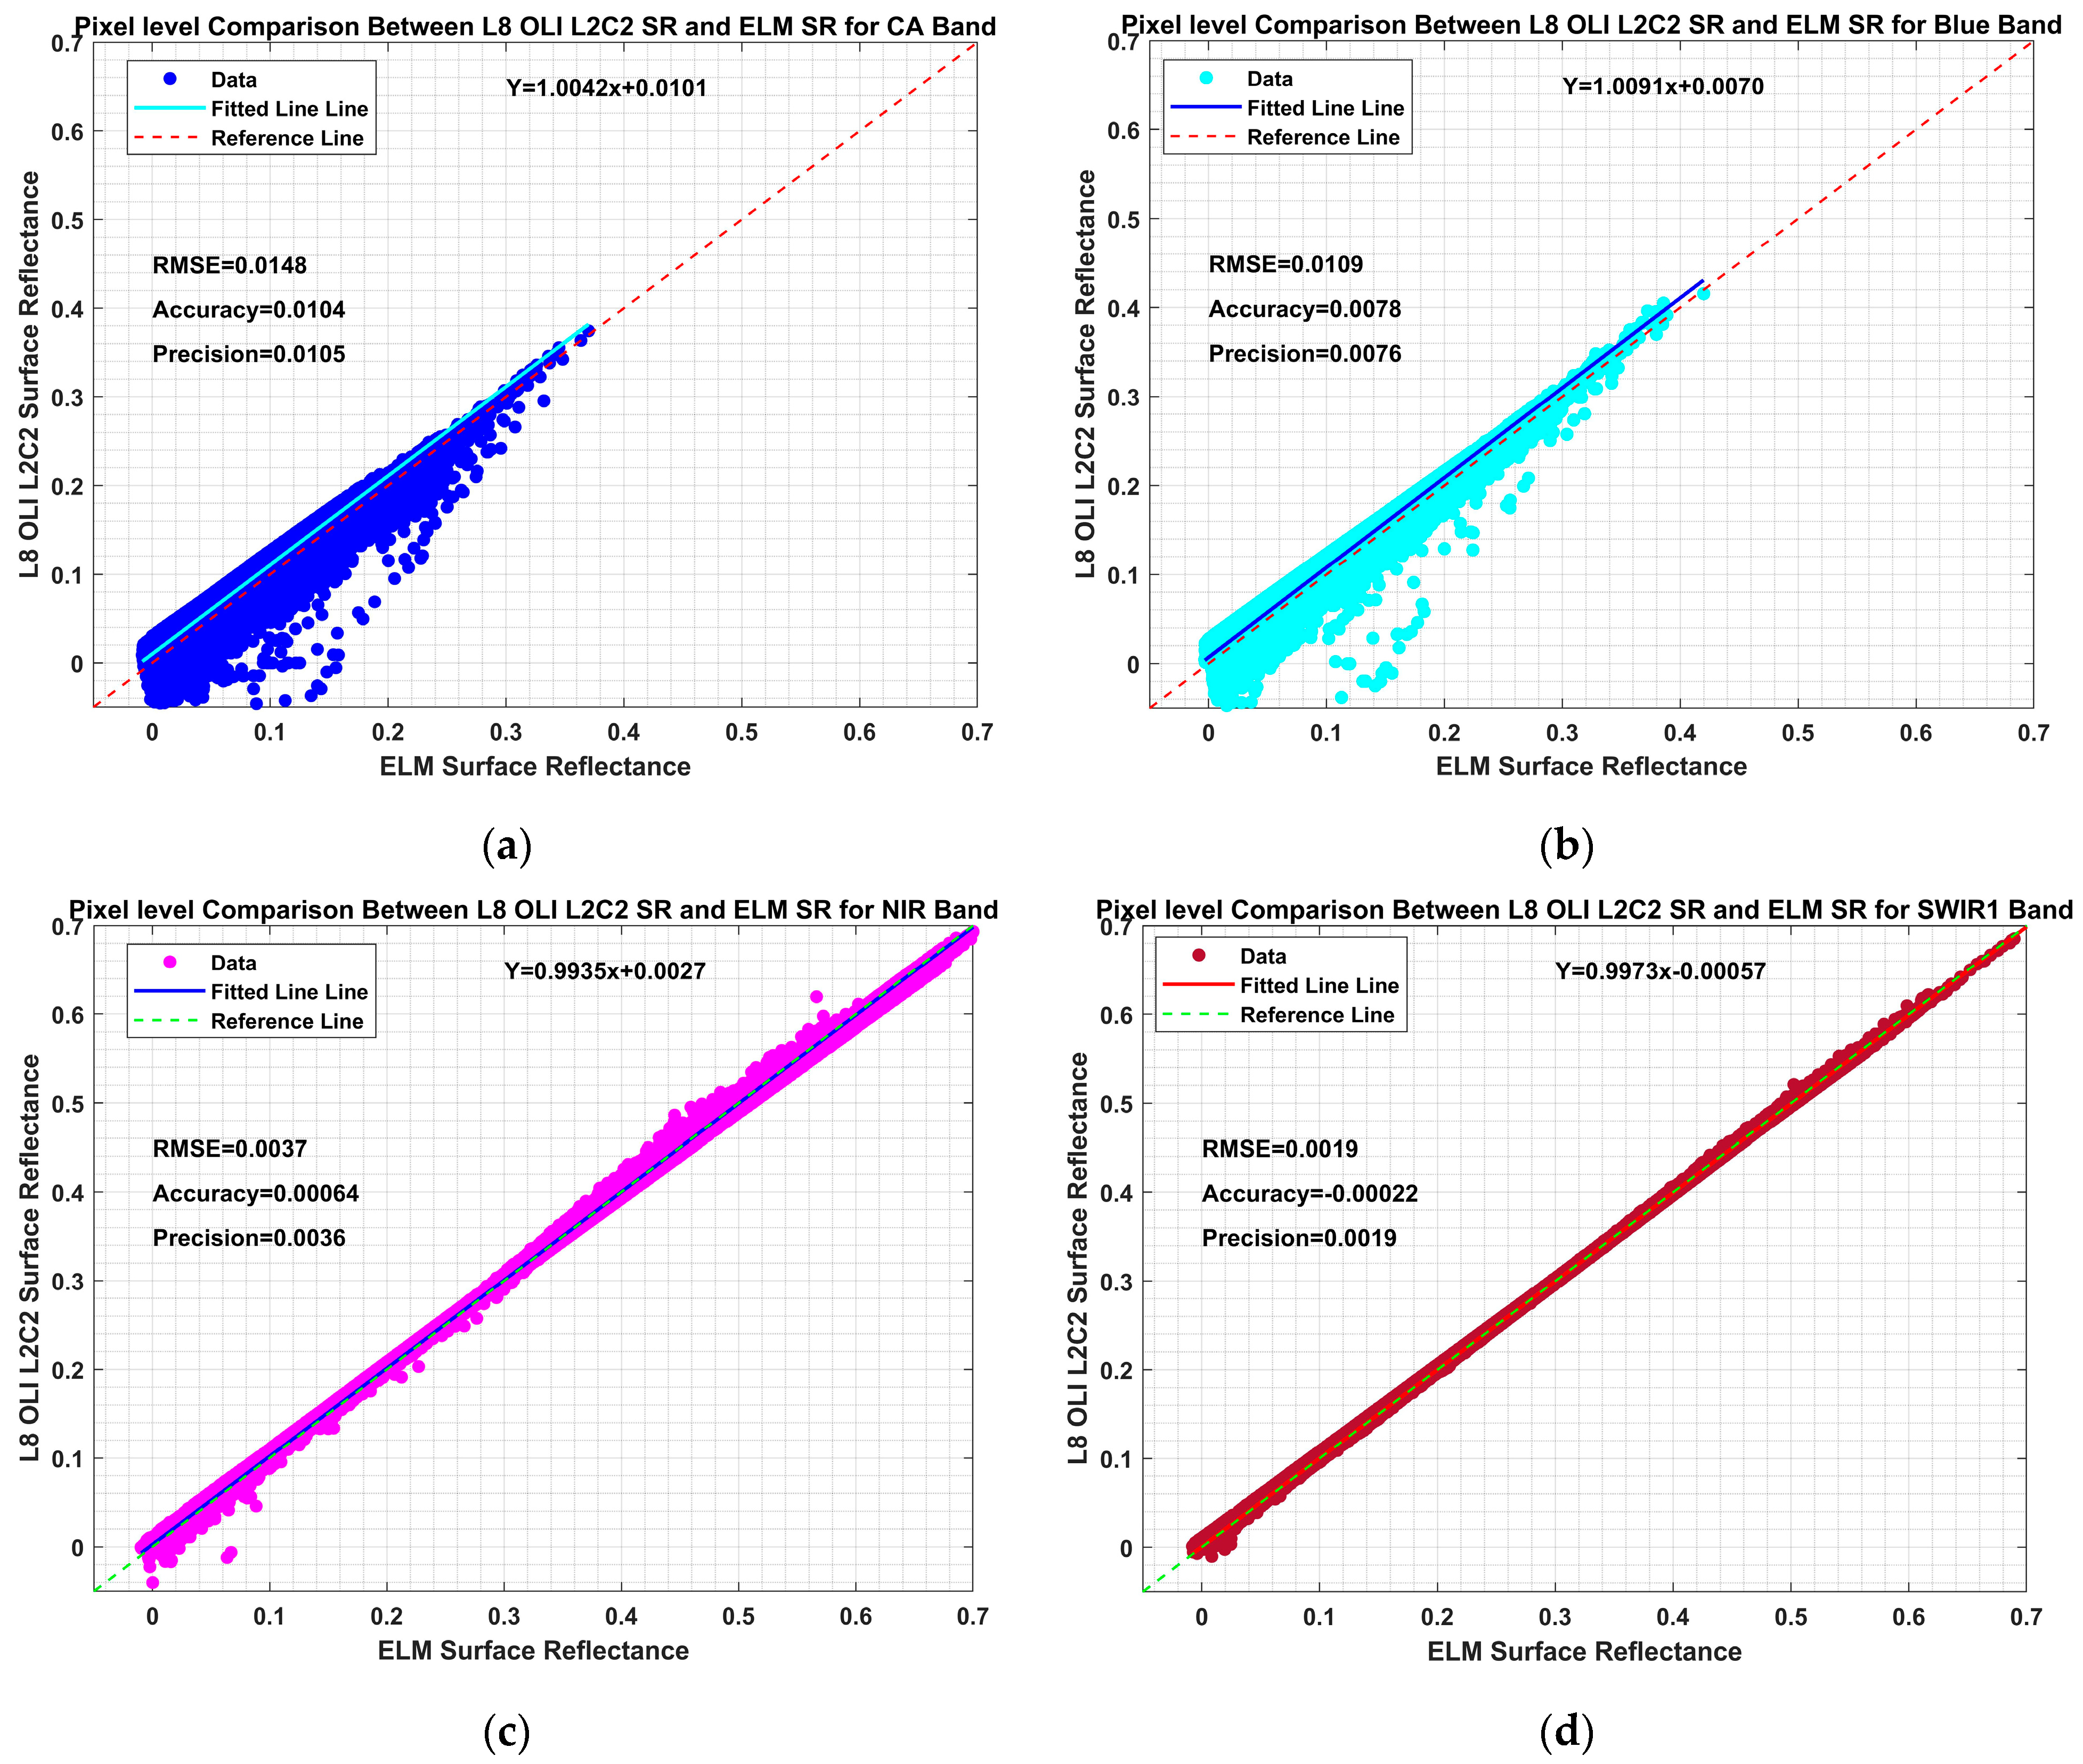
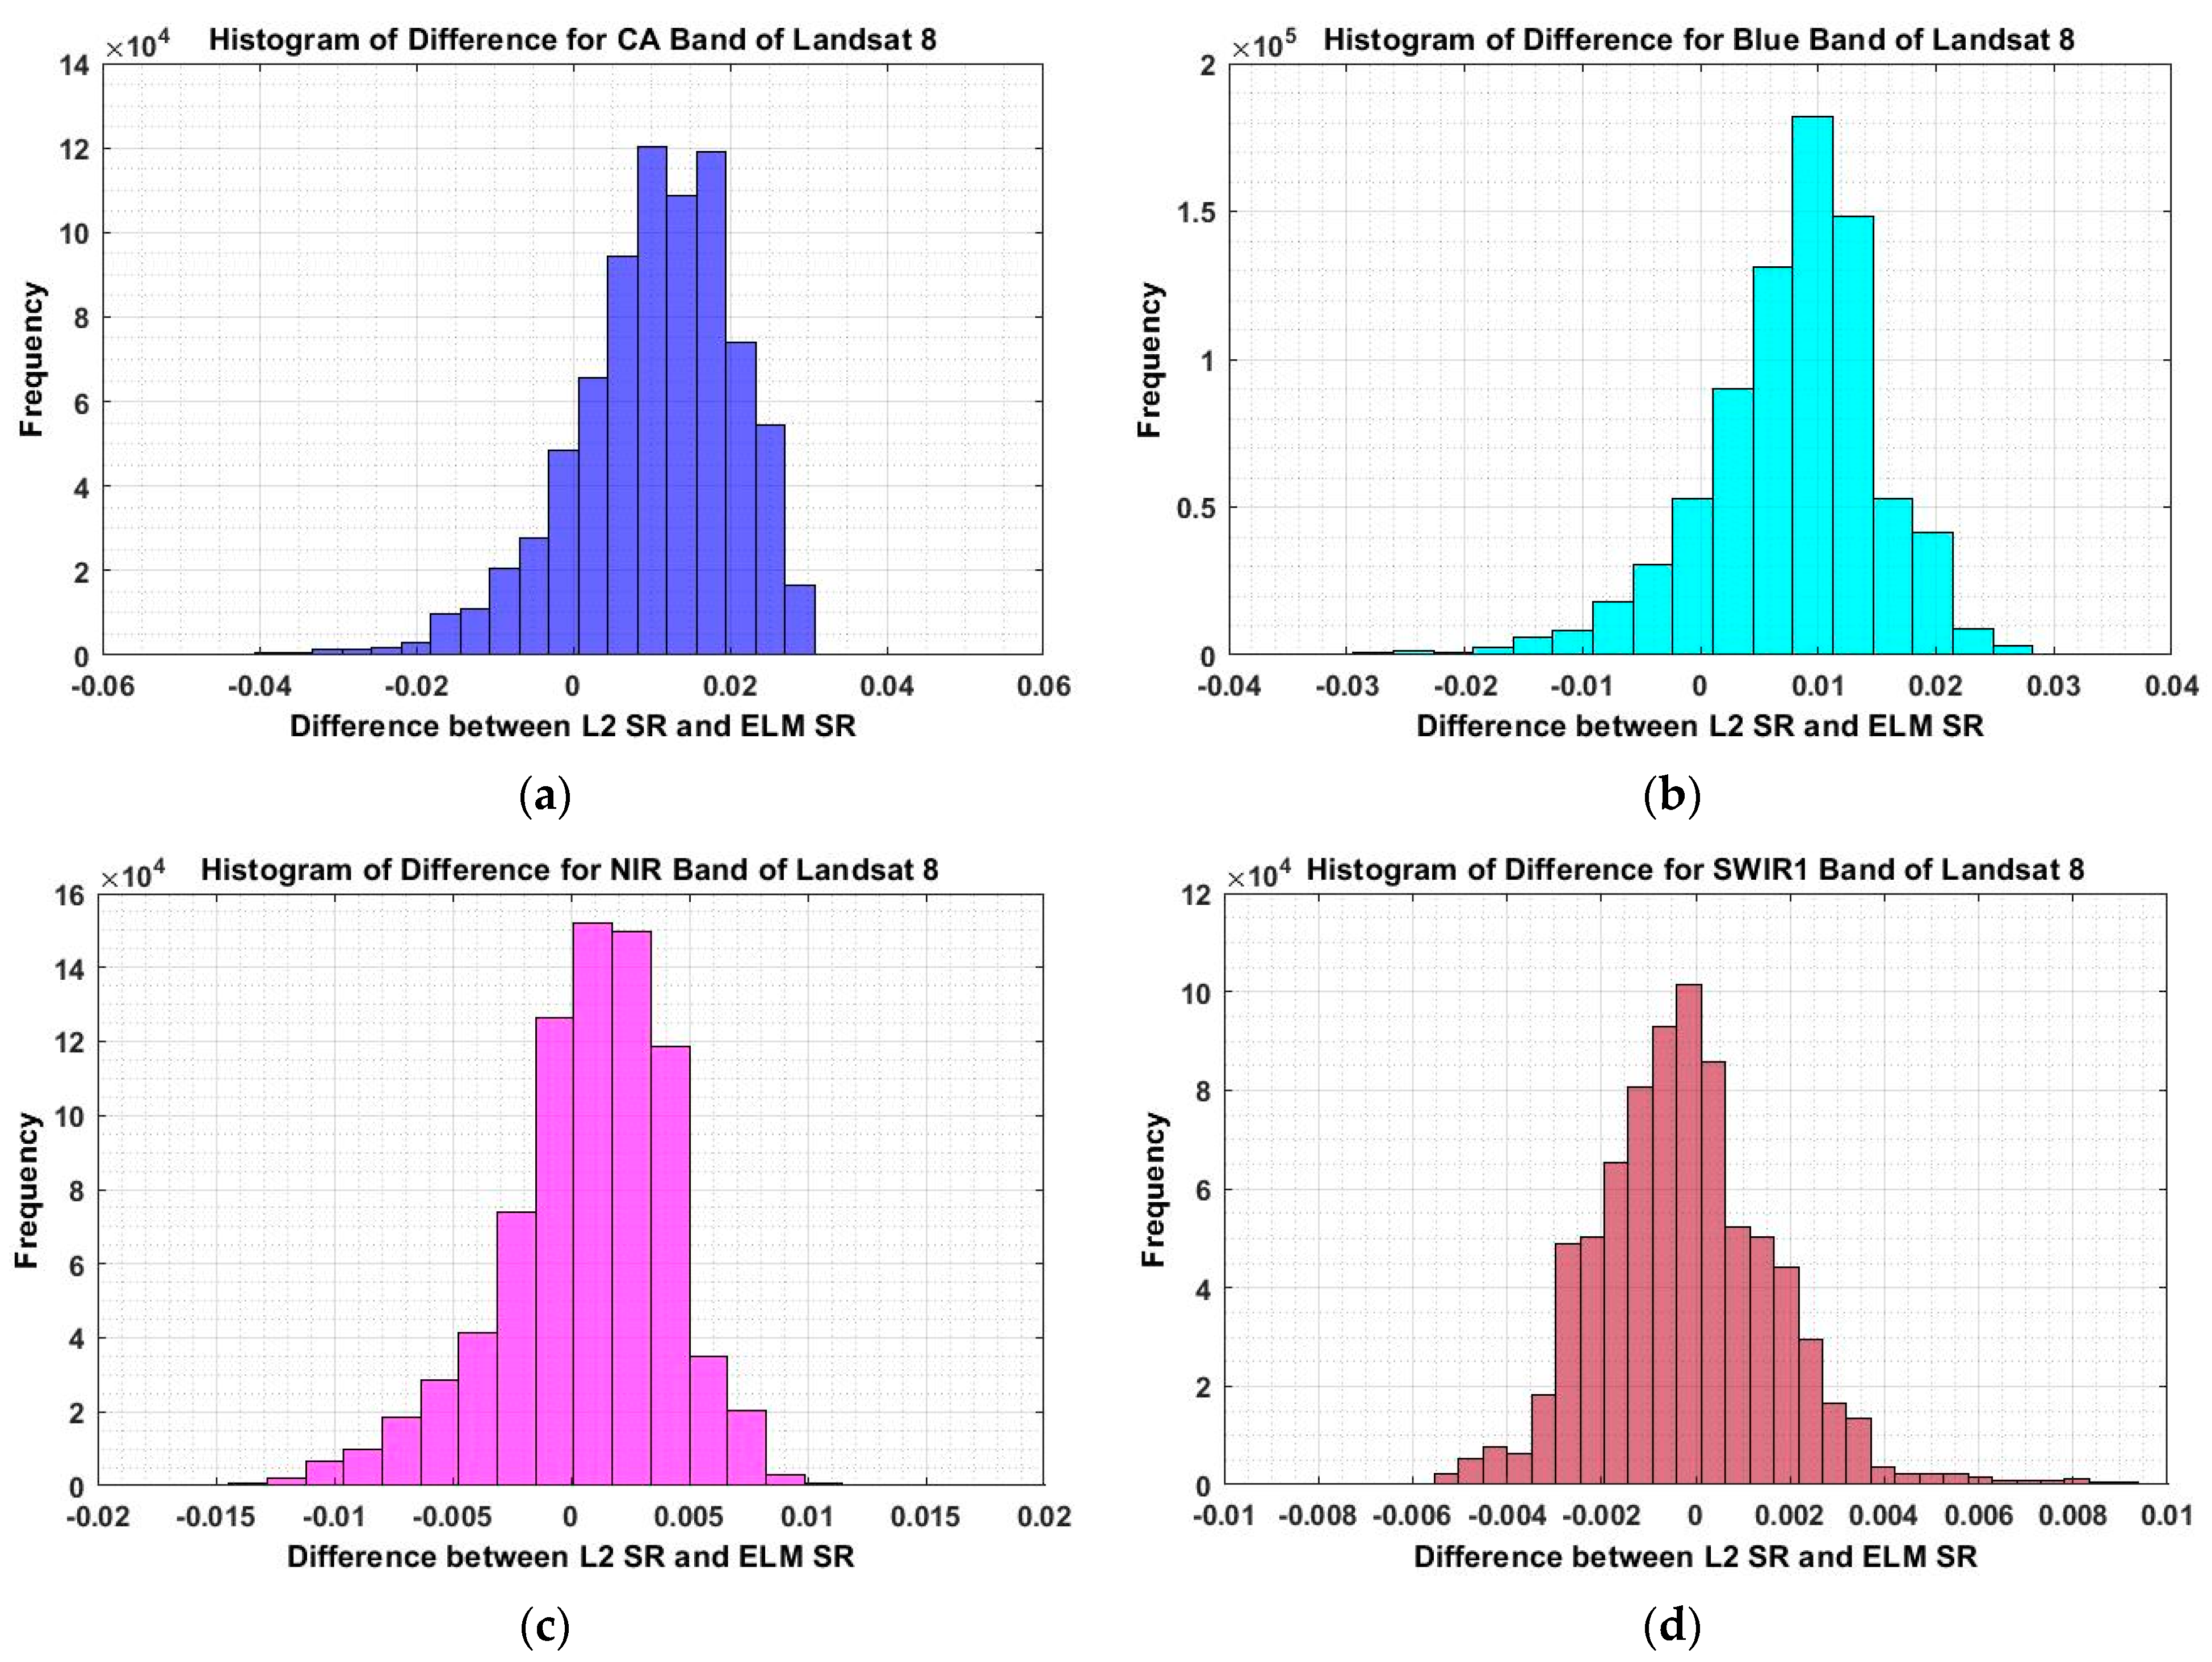
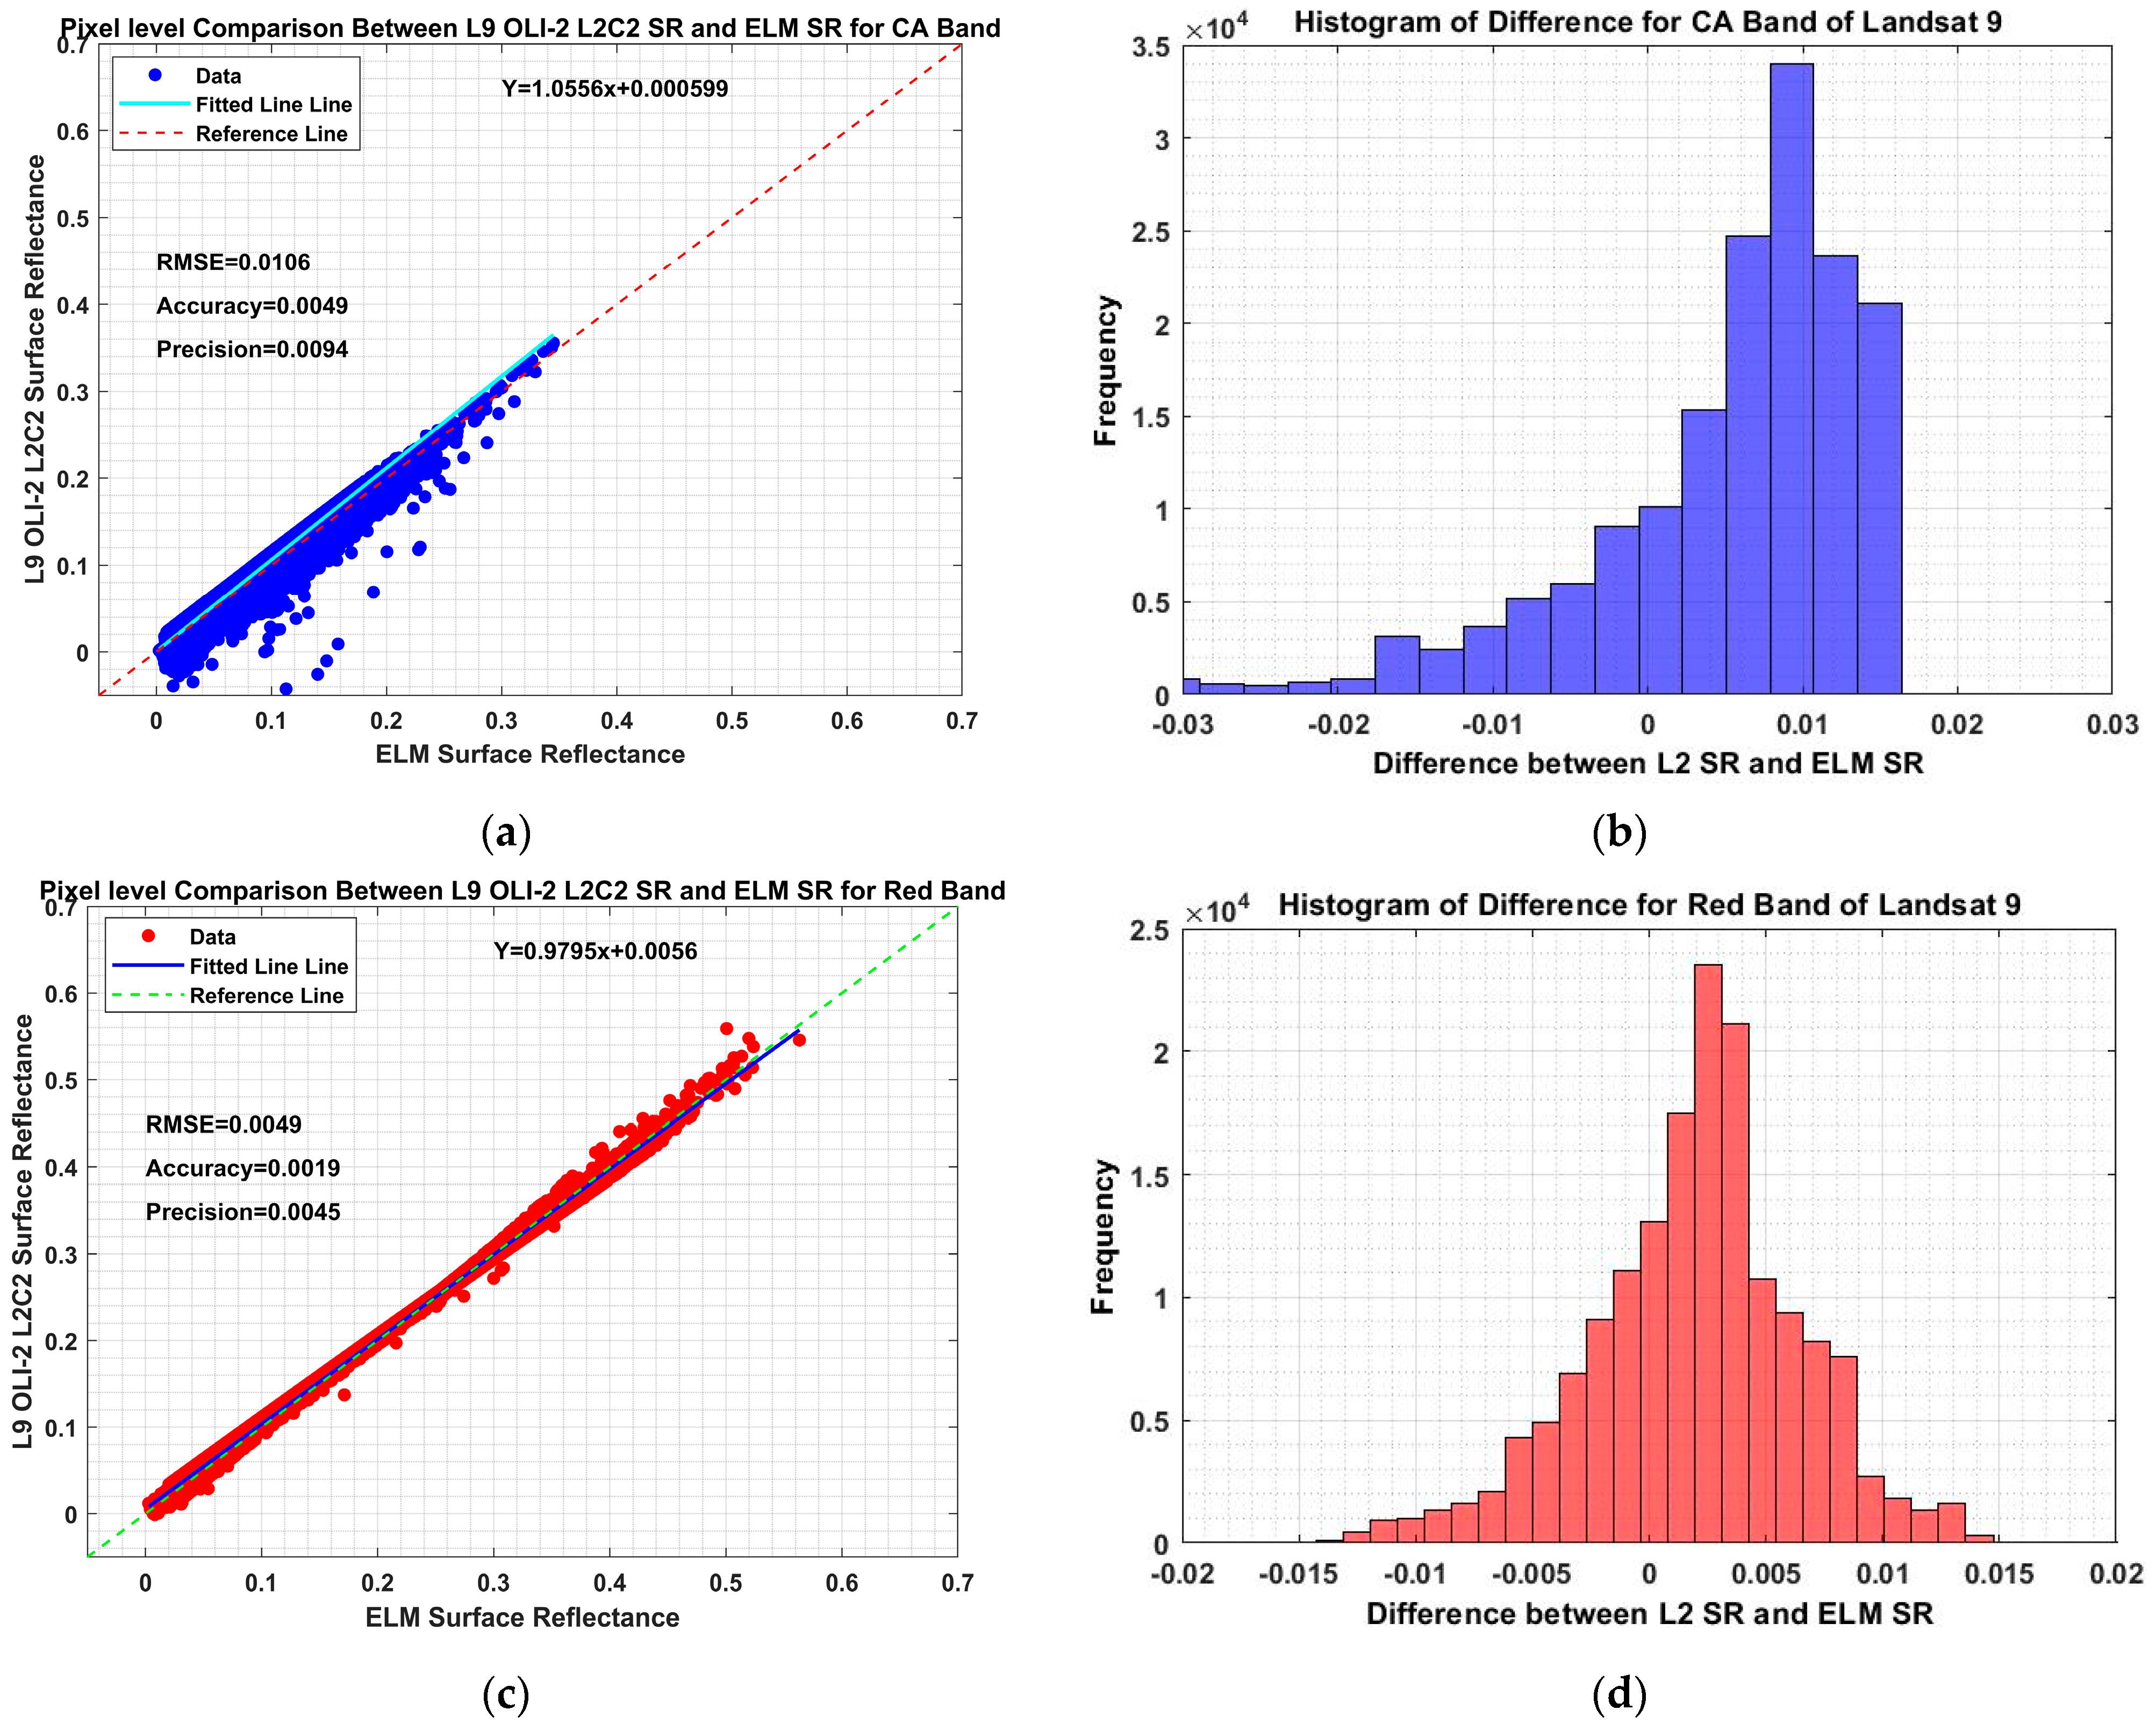
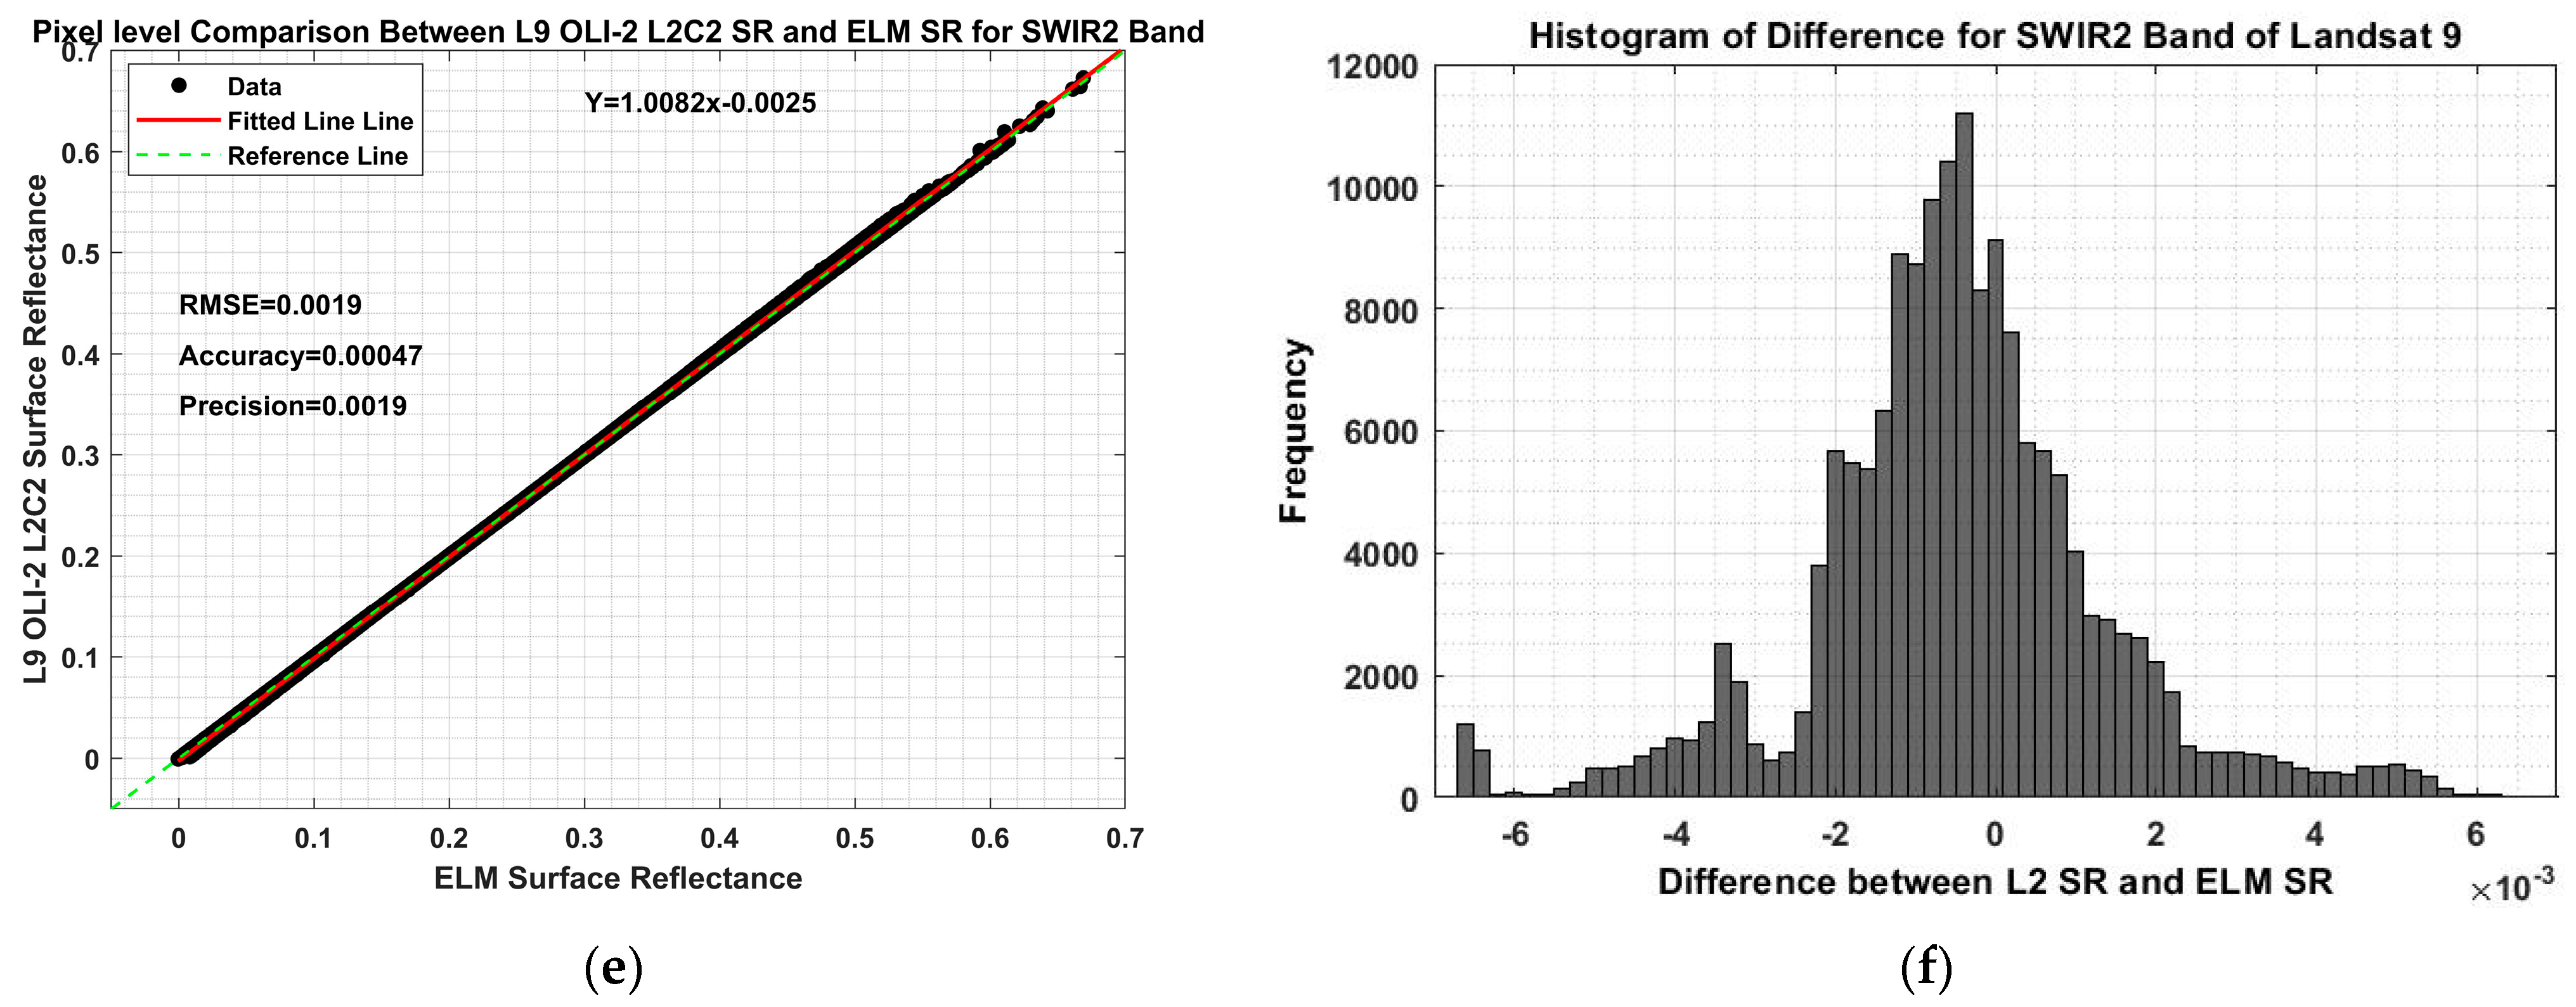
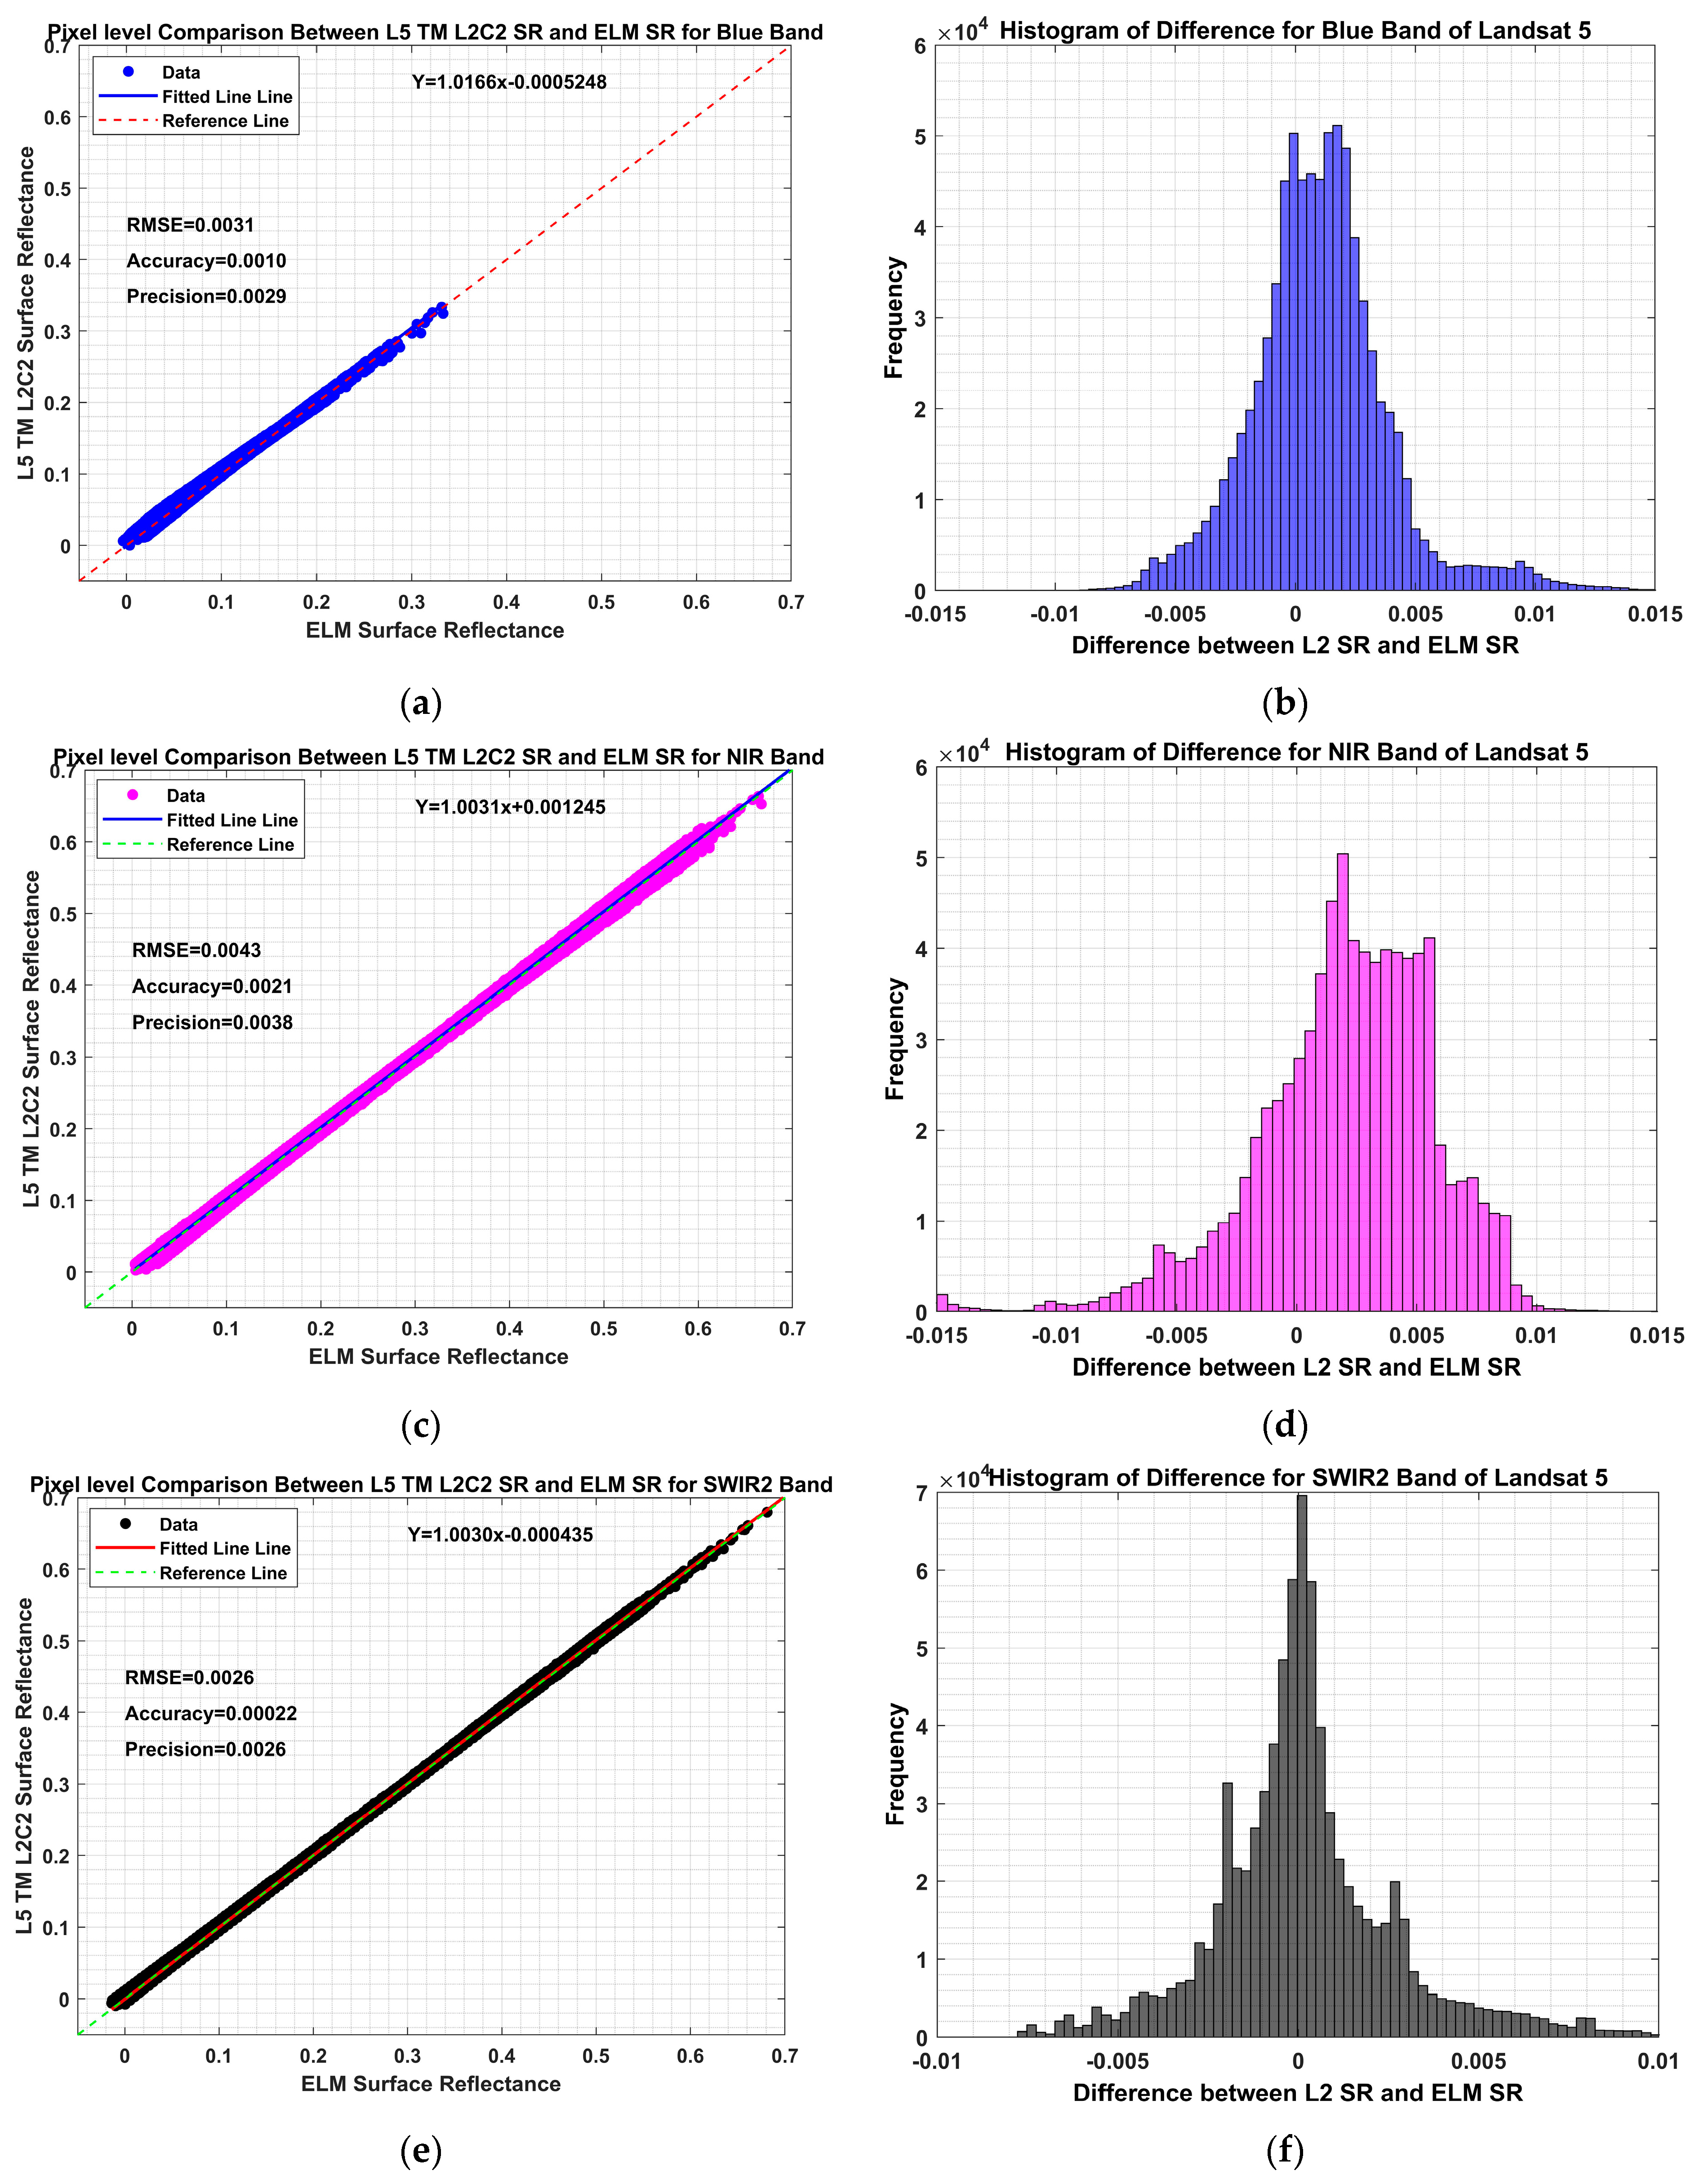
- Firstly, Root Mean Square Error (RMSE) was computed using Equation (13) between the ELM SR and respective SR products. The RMSE metric tells us how far apart the ELM SR values are on average from the L2 SR values in a dataset. The lower the model’s RMSE, the better it fits a dataset.
- Secondly, accuracy and precision were calculated to see the absolute difference and variation between both products. Accuracy describes the method of average deviation between the ELM SR and SR products, using Equation (14). Precision describes the variation found in the respective band while measuring the same target repeatedly by the model using Equation (15).
4. Results
4.1. Evaluation of Absolute Surface Reflectance Model—Algodones Dunes
4.2. Evaluation of Absolute Surface Reflectance Model—Salton Sea
4.3. Validation & Evaluation Results of Different Sensors SR Products
4.3.1. Landsat 8 OLI SR Validation and Evaluation Results
4.3.2. Landsat 9 OLI-2 SR Validation and Evaluation Results
4.3.3. Landsat 5 TM SR Validation and Evaluation Results
4.4. Uncertainty Results
5. Conclusions
Author Contributions
Funding
Data Availability Statement
Acknowledgments
Conflicts of Interest
References
- Nazeer, M.; Ilori, C.O.; Bilal, M.; Nichol, J.E.; Wu, W.; Qiu, Z.; Gayene, B.K. Evaluation of atmospheric correction methods for low to high resolutions satellite remote sensing data. Atmos. Res. 2021, 249, 105308. [Google Scholar] [CrossRef]
- Feng, M.; Huang, C.; Channan, S.; Vermote, E.F.; Masek, J.G.; Townshend, J.R. Quality assessment of Landsat surface reflectance products using MODIS data. Comput. Geosci. 2012, 38, 9–22. [Google Scholar] [CrossRef]
- Wang, Y.; Liu, L.; Hu, Y.; Li, D.; Li, Z. Development and validation of the Landsat-8 surface reflectance products using a MODIS-based per-pixel atmospheric correction method. Int. J. Remote Sens. 2016, 37, 1291–1314. [Google Scholar] [CrossRef]
- Nazeer, M.; Nichol, J.E.; Yung, Y.-K. Evaluation of atmospheric correction models and Landsat surface reflectance product in an urban coastal environment. Int. J. Remote Sens. 2014, 35, 6271–6291. [Google Scholar] [CrossRef]
- Claverie, M.; Vermote, E.F.; Franch, B.; Masek, J.G. Evaluation of the Landsat-5 TM and Landsat-7 ETM+ surface reflectance products. Remote Sens. Environ. 2015, 169, 390–403. [Google Scholar] [CrossRef]
- Masek, J.G.; Vermote, E.F.; Saleous, N.E.; Wolfe, R.; Hall, F.G.; Huemmrich, K.F.; Gao, F.; Kutler, J.; Lim, T.-K. A Landsat surface reflectance dataset for North America, 1990–2000. IEEE Geosci. Remote Sens. Lett. 2006, 3, 68–72. [Google Scholar] [CrossRef]
- Badawi, M.; Helder, D.; Leigh, L.; Jing, X. Methods for earth-observing satellite surface reflectance validation. Remote Sens. 2019, 11, 1543. [Google Scholar] [CrossRef]
- Teixeira Pinto, C.; Jing, X.; Leigh, L. Evaluation analysis of Landsat level-1 and level-2 data products using in situ measurements. Remote Sens. 2020, 12, 2597. [Google Scholar] [CrossRef]
- Ben-Dor, E.; Kruse, F.; Lefkoff, A.; Banin, A. Comparison of three calibration techniques for utilization of GER 63-channel aircraft scanner data of Makhtesh Ramon, Negev, Israel. Photogramm. Eng. Remote Sens. 1994, 60, 1339–1354. [Google Scholar]
- Chavez, P.S. Image-based atmospheric corrections-revisited and improved. Photogramm. Eng. Remote Sens. 1996, 62, 1025–1035. [Google Scholar]
- Vermote, E.F.; Tanré, D.; Deuze, J.L.; Herman, M.; Morcette, J.-J. Second simulation of the satellite signal in the solar spectrum, 6S: An overview. IEEE Trans. Geosci. Remote Sens. 1997, 35, 675–686. [Google Scholar] [CrossRef]
- Kneizys, F.X. Users Guide to LOWTRAN 7; Air Force Geophysics Laboratory, United States Air Force: Hanscom AFB, MA, USA, 1988. [Google Scholar]
- Berk, A.; Bernstein, L.; Anderson, G.; Acharya, P.; Robertson, D.; Chetwynd, J.; Adler-Golden, S. MODTRAN cloud and multiple scattering upgrades with application to AVIRIS. Remote Sens. Environ. 1998, 65, 367–375. [Google Scholar] [CrossRef]
- Matthew, M.W.; Adler-Golden, S.M.; Berk, A.; Felde, G.; Anderson, G.P.; Gorodetzky, D.; Paswaters, S.; Shippert, M. Atmospheric correction of spectral imagery: Evaluation of the FLAASH algorithm with AVIRIS data. In Proceedings of the Applied Imagery Pattern Recognition Workshop, 2002. Proceedings, Washington, DC, USA, 16–18 October 2002; pp. 157–163. [Google Scholar]
- Green, R.O. Retrieval of reflectance from calibrated radiance imagery measured by the Airborne Visible/Infrared Imaging Spectrometer (AVIRIS) for lithological mapping of Clark Mountains, California. In Proceedings of the Annual JPL Airborne Visible/Infrared Imaging Spectrometer (AVIRIS) Workshop, Clark Mountains, CA, USA, 1–5 June 1990; pp. 54–90. [Google Scholar]
- Farrand, W.H.; Singer, R.B.; Merenyi, E. Retrieval of apparent surface reflectance from AVIRIS data: A comparison of empirical line, radiative transfer, and spectral mixture methods. Remote Sens. Environ. 1994, 47, 311–321. [Google Scholar] [CrossRef]
- Roberts, D.; Yamaguchi, Y.; Lyon, R. Comparison of various techniques for calibration of AIS data. NASA STI/Recon Tech. Rep. N 1986, 87, 21–30. [Google Scholar]
- Dwyer, J.L.; Kruse, F.A.; Lefkoff, A.B. Effects of empirical versus model-based reflectance calibration on automated analysis of imaging spectrometer data: A case study from the Drum Mountains, Utah. Photogramm. Eng. Remote Sens. 1995, 61, 1247–1254. [Google Scholar]
- Teillet, P.; Slater, P.; Ding, Y.; Santer, R.; Jackson, R.; Moran, M. Three methods for the absolute calibration of the NOAA AVHRR sensors in-flight. Remote Sens. Environ. 1990, 31, 105–120. [Google Scholar] [CrossRef]
- Ben-Dor, E.; Kindel, B.; Goetz, A. Quality assessment of several methods to recover surface reflectance using synthetic imaging spectroscopy data. Remote Sens. Environ. 2004, 90, 389–404. [Google Scholar] [CrossRef]
- Smith, G.M.; Milton, E.J. The use of the empirical line method to calibrate remotely sensed data to reflectance. Int. J. Remote Sens. 1999, 20, 2653–2662. [Google Scholar] [CrossRef]
- Perry, E.; Warner, T.; Foote, P. Comparison of atmospheric modelling versus empirical line fitting for mosaicking HYDICE imagery. Int. J. Remote Sens. 2000, 21, 799–803. [Google Scholar] [CrossRef]
- USGS. EarthExplorer. Available online: https://earthexplorer.usgs.gov/ (accessed on 4 August 2022).
- AVIRIS. Airborne Visible Infrared Imaging Spectrometer. Available online: https://aviris.jpl.nasa.gov/documents/workshop_biblios.html (accessed on 9 July 2022).
- Missions, S. Landsat 9 (USGS, NASA). 2022. Available online: https://www.eoportal.org/satellite-missions/landsat-9#summary (accessed on 13 March 2023).
- Gross, G.; Helder, D.; Begeman, C.; Leigh, L.; Kaewmanee, M.; Shah, R. Initial Cross-Calibration of Landsat 8 and Landsat 9 Using the simultaneous underfly event. Remote Sens. 2022, 14, 2418. [Google Scholar] [CrossRef]
- Acharya, T.D.; Yang, I. Exploring landsat 8. Int. J. IT Eng. Appl. Sci. Res. 2015, 4, 4–10. [Google Scholar]
- DUGUAY, C.; LEDREW, E. Estimating surface reflectance and albedo from Landsat-5 Thematic Mapper over rugged terrain. Photogramm. Eng. Remote Sens. 1992, 58, 551–558. [Google Scholar]
- Danner, M.; Locherer, M.; Hank, T.; Richter, K. Spectral Sampling with the ASD FIELDSPEC 4. 2015. Available online: https://gfzpublic.gfz-potsdam.de/rest/items/item_1388298/component/file_1388299/content (accessed on 13 March 2023).
- McCorkel, J.; Bachmann, C.M.; Coburn, C.; Gerace, A.D.; Leigh, L.; Czapla-Myers, J.S.; Helder, D.L.; Cook, B.D. Overview of the 2015 Algodones Sand Dunes field campaign to support sensor intercalibration. J. Appl. Remote Sens. 2017, 12, 012003. [Google Scholar] [CrossRef]
- Johnson, H.; Green, R. AVIRIS User’s Guide; JPL: Pasadena, CA, USA, 1995. Available online: https://dataverse.jpl.nasa.gov/dataset.xhtml?persistentId=hdl:2014/33639 (accessed on 13 March 2023).
- Kaewmanee, M. Pseudo Invariant Calibration Sites: PICS Evolution; Utah State University: Logan, UT, USA, 2018; Available online: https://digitalcommons.usu.edu/cgi/viewcontent.cgi?article=1296&context=calcon (accessed on 13 March 2023).
- Lee, Z.P.; Du, K.; Voss, K.J.; Zibordi, G.; Lubac, B.; Arnone, R.; Weidemann, A. An inherent-optical-property-centered approach to correct the angular effects in water-leaving radiance. Appl. Opt. 2011, 50, 3155–3167. [Google Scholar] [CrossRef] [PubMed]
- Pope, R.M.; Fry, E.S. Absorption spectrum (380–700 nm) of pure water. II. Integrating cavity measurements. Appl. Opt. 1997, 36, 8710–8723. [Google Scholar] [CrossRef]
- Chen, S.; Zhang, T. Evaluation of a QAA-based algorithm using MODIS land bands data for retrieval of IOPs in the Eastern China Seas. Opt. Express 2015, 23, 13953–13971. [Google Scholar] [CrossRef] [PubMed]
- Jerlov, N.; Fukuda, M. Radiance distribution in the upper layers of the sea. Tellus 1960, 12, 348–355. [Google Scholar] [CrossRef]
- Albert, A.; Mobley, C.D. An analytical model for subsurface irradiance and remote sensing reflectance in deep and shallow case-2 waters. Opt. Express 2003, 11, 2873–2890. [Google Scholar] [CrossRef]
- Roy, D.P.; Ju, J.; Kline, K.; Scaramuzza, P.L.; Kovalskyy, V.; Hansen, M.; Loveland, T.R.; Vermote, E.; Zhang, C. Web-enabled Landsat Data (WELD): Landsat ETM+ composited mosaics of the conterminous United States. Remote Sens. Environ. 2010, 114, 35–49. [Google Scholar] [CrossRef]
- Khakurel, P.; Leigh, L.; Kaewmanee, M.; Pinto, C.T. Extended Pseudo Invariant Calibration Site-Based Trend-to-Trend Cross-Calibration of Optical Satellite Sensors. Remote Sens. 2021, 13, 1545. [Google Scholar] [CrossRef]
- Chander, G.; Mishra, N.; Helder, D.L.; Aaron, D.B.; Angal, A.; Choi, T.; Xiong, X.; Doelling, D.R. Applications of spectral band adjustment factors (SBAF) for cross-calibration. IEEE Trans. Geosci. Remote Sens. 2012, 51, 1267–1281. [Google Scholar] [CrossRef]
- Shah, R.; Leigh, L.; Kaewmanee, M.; Pinto, C.T. Validation of Expanded Trend-to-Trend Cross-Calibration Technique and Its Application to Global Scale. Remote Sens. 2022, 14, 6216. [Google Scholar] [CrossRef]
- Ferrier, G.; Trahair, N. Evaluation of apparent surface reflectance estimation methodologies. Int. J. Remote Sens. 1995, 16, 2291–2297. [Google Scholar] [CrossRef]
- Baugh, W.; Groeneveld, D. Empirical proof of the empirical line. Int. J. Remote Sens. 2008, 29, 665–672. [Google Scholar] [CrossRef]
- Babu, K.; Mathur, A.; Thompson, D.R.; Green, R.O.; Patel, P.N.; Prajapati, R.; Bue, B.D.; Geier, S.; Eastwood, M.L.; Helmlinger, M.C. An empirical comparison of calibration and validation methodologies for airborne imaging spectroscopy. Curr. Sci. 2019, 116, 1101. [Google Scholar] [CrossRef]
- Green, R.O.; Eastwood, M.L.; Sarture, C.M.; Chrien, T.G.; Aronsson, M.; Chippendale, B.J.; Faust, J.A.; Pavri, B.E.; Chovit, C.J.; Solis, M. Imaging spectroscopy and the airborne visible/infrared imaging spectrometer (AVIRIS). Remote Sens. Environ. 1998, 65, 227–248. [Google Scholar] [CrossRef]
- Barsi, J.A.; Alhammoud, B.; Czapla-Myers, J.; Gascon, F.; Haque, M.O.; Kaewmanee, M.; Leigh, L.; Markham, B.L. Sentinel-2A MSI and Landsat-8 OLI radiometric cross comparison over desert sites. Eur. J. Remote Sens. 2018, 51, 822–837. [Google Scholar] [CrossRef]
- Helder, D.; Doelling, D.; Bhatt, R.; Choi, T.; Barsi, J. Calibrating Geosynchronous and Polar Orbiting Satellites: Sharing Best Practices. Remote Sens. 2020, 12, 2786. [Google Scholar] [CrossRef]
- Khadka, N.; Teixeira Pinto, C.; Leigh, L. Detection of change points in pseudo-invariant calibration sites time series using multi-sensor satellite imagery. Remote Sens. 2021, 13, 2079. [Google Scholar] [CrossRef]
- Doxani, G.; Vermote, E.; Roger, J.-C.; Gascon, F.; Adriaensen, S.; Frantz, D.; Hagolle, O.; Hollstein, A.; Kirches, G.; Li, F. Atmospheric correction inter-comparison exercise. Remote Sens. 2018, 10, 352. [Google Scholar] [CrossRef]
- Morfitt, R.; Barsi, J.; Levy, R.; Markham, B.; Micijevic, E.; Ong, L.; Scaramuzza, P.; Vanderwerff, K. Landsat-8 Operational Land Imager (OLI) radiometric performance on-orbit. Remote Sens. 2015, 7, 2208–2237. [Google Scholar] [CrossRef]
- Maiersperger, T.; Scaramuzza, P.; Leigh, L.; Shrestha, S.; Gallo, K.; Jenkerson, C.B.; Dwyer, J.L. Characterizing LEDAPS surface reflectance products by comparisons with AERONET, field spectrometer, and MODIS data. Remote Sens. Environ. 2013, 136, 1–13. [Google Scholar] [CrossRef]
- Masek, J.; Vermote, E.; Saleous, N.; Wolfe, R.; Hall, F.; Huemmrich, K.; Gao, F.; Kutler, J.; Lim, T. LEDAPS Landsat Calibration, Reflectance, Atmospheric Correction Preprocessing Code; ORNL DAAC: Oak Ridge, TN, USA, 2012. [Google Scholar]


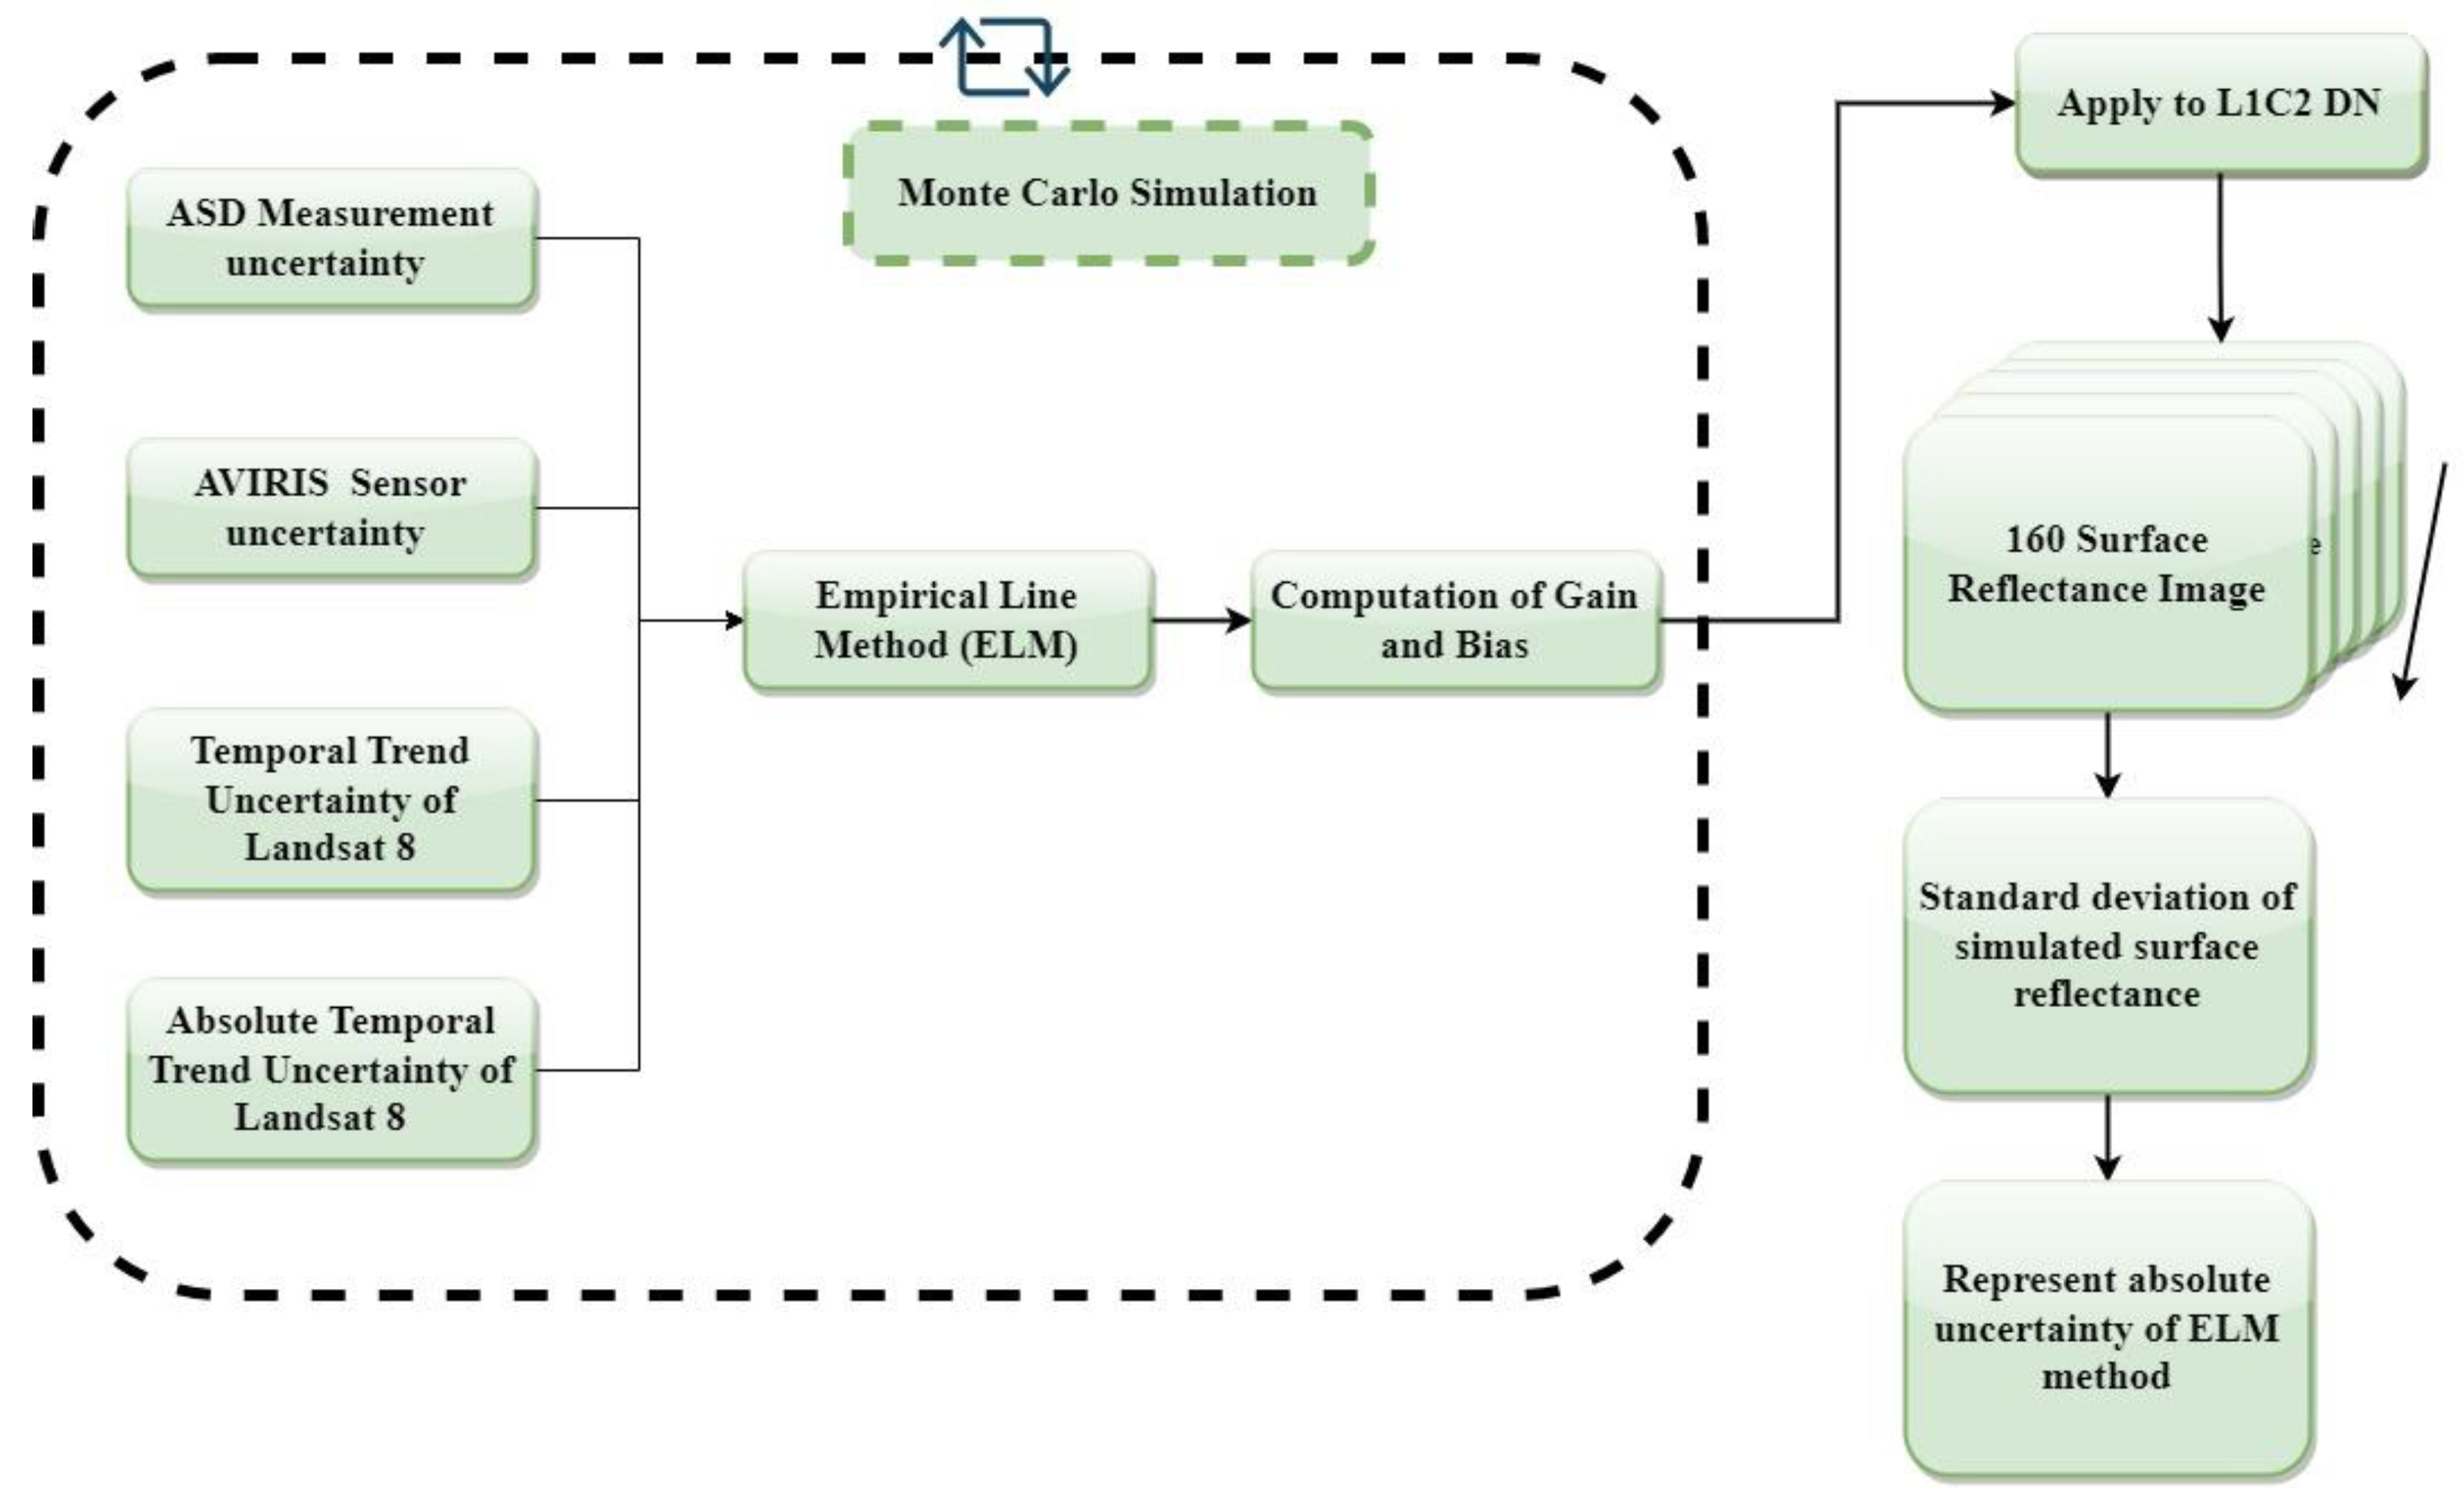

| Input Parameters of Model | Bands | Uncertainty | References |
|---|---|---|---|
| ASD Measurements | Coastal Aerosol | 3.54% | [30] |
| Blue | 3.85% | ||
| Green | 3.82% | ||
| Red | 3.99% | ||
| NIR | 4.22% | ||
| SWIR1 | 4.42% | ||
| SWIR2 | 4.08% | ||
| AVIRIS Measurements | CA~SWIR2 | 8.6% | [44,45] |
| Temporal Trend Uncertainty of Landsat 8 Sensor | CA~SWIR1 | <1% | [47,48] |
| SWIR2 | 1.8% | ||
| Absolute Temporal Trend Uncertainty of Landsat 8 sensor | CA~SWIR2 | 2% | [46] |
| Bands | Accuracy | Precision | RMSE |
|---|---|---|---|
| Coastal Aerosol (443 nm) | 0.0104 | 0.0105 | 0.0148 |
| Blue (482 nm) | 0.0078 | 0.0076 | 0.0109 |
| Green (561.4 nm) | 0.0038 | 0.0036 | 0.0052 |
| Red (654.6 nm) | 0.0041 | 0.0057 | 0.0070 |
| NIR (864.7 nm) | 6.48 × 10⁻⁴ (~0) | 0.0036 | 0.0037 |
| SWIR1 (1608.9 nm) | −2.28 × 10⁻⁴ (~0) | 0.0019 | 0.0019 |
| SWIR2 (2200.7 nm) | 2.31 × 10⁻⁴ (~0) | 0.0019 | 0.0019 |
| Bands | Accuracy | Precision | RMSE |
|---|---|---|---|
| Coastal Aerosol (443 nm) | 0.0049 | 0.0094 | 0.0106 |
| Blue (482 nm) | 0.0049 | 0.0075 | 0.0089 |
| Green (561.4 nm) | 0.0038 | 0.0041 | 0.0056 |
| Red (654.6 nm) | 0.0019 | 0.0045 | 0.0049 |
| NIR (864.7 nm) | 1.56 × 10⁻⁴ (~0) | 0.0040 | 0.0040 |
| SWIR1 (1608.9 nm) | 4.80 × 10⁻⁴ (~0) | 0.0024 | 0.0025 |
| SWIR2 (2200.7 nm) | −4.73 × 10⁻⁴ (~0) | 0.0019 | 0.0019 |
| Bands | Accuracy | Precision | RMSE |
|---|---|---|---|
| Blue (482 nm) | 0.0010 | 0.0029 | 0.0031 |
| Green (561.4 nm) | 0.0012 | 0.0026 | 0.0028 |
| Red (654.6 nm) | 0.0012 | 0.0044 | 0.0045 |
| NIR (864.7 nm) | 0.0021 | 0.0038 | 0.0043 |
| SWIR1 (1608.9 nm) | 9.95 × 10⁻⁴ (~0) | 0.0030 | 0.0032 |
| SWIR2 (2200.7 nm) | 2.23 × 10⁻⁴ (~0) | 0.0026 | 0.0026 |
Disclaimer/Publisher’s Note: The statements, opinions and data contained in all publications are solely those of the individual author(s) and contributor(s) and not of MDPI and/or the editor(s). MDPI and/or the editor(s) disclaim responsibility for any injury to people or property resulting from any ideas, methods, instructions or products referred to in the content. |
© 2023 by the authors. Licensee MDPI, Basel, Switzerland. This article is an open access article distributed under the terms and conditions of the Creative Commons Attribution (CC BY) license (https://creativecommons.org/licenses/by/4.0/).
Share and Cite
K C, M.; Leigh, L.; Pinto, C.T.; Kaewmanee, M. Method of Validating Satellite Surface Reflectance Product Using Empirical Line Method. Remote Sens. 2023, 15, 2240. https://doi.org/10.3390/rs15092240
K C M, Leigh L, Pinto CT, Kaewmanee M. Method of Validating Satellite Surface Reflectance Product Using Empirical Line Method. Remote Sensing. 2023; 15(9):2240. https://doi.org/10.3390/rs15092240
Chicago/Turabian StyleK C, Meghraj, Larry Leigh, Cibele Teixeira Pinto, and Morakot Kaewmanee. 2023. "Method of Validating Satellite Surface Reflectance Product Using Empirical Line Method" Remote Sensing 15, no. 9: 2240. https://doi.org/10.3390/rs15092240
APA StyleK C, M., Leigh, L., Pinto, C. T., & Kaewmanee, M. (2023). Method of Validating Satellite Surface Reflectance Product Using Empirical Line Method. Remote Sensing, 15(9), 2240. https://doi.org/10.3390/rs15092240


