Technical Note

Stain Detection Based on Unmanned Aerial Vehicle Hyperspectral Photovoltaic Module

1
China Southern Power Grid Energy Efficiency and Clean Energy Co., Ltd., Guangzhou 510663, China
2
School of Information Science and Technology, Dalian Maritime University, Dalian 116026, China
3
Guangdong Testing Institute of Product Quality Supervision, Guangzhou 510670, China
*
Author to whom correspondence should be addressed.
Remote Sens. 2024, 16(1), 153; https://doi.org/10.3390/rs16010153
Submission received: 16 October 2023 / Revised: 21 December 2023 / Accepted: 23 December 2023 / Published: 29 December 2023
(This article belongs to the Special Issue New Methods and Approaches in Airborne Hyperspectral Data Processing)

Abstract

:
Solar power generation has great development potential as an abundant and clean energy source. However, many factors affect the efficiency of the photovoltaic (PV) module; among these factors, outdoor PV modules are inevitably affected by stains, thus reducing the power generation efficiency of the PV panel. This paper proposes a framework for PV module stain detection based on UAV hyperspectral images (HSIs). The framework consists of two stain detection methods: constrained energy minimization (CEM)-based and orthogonal subspace projection (OSP)-based stain detection methods. Firstly, the contaminated PV modules are analyzed and processed to enhance the data’s analytical capability. Secondly, based on the known spectral signature of the PV module, stain detection methods are proposed, including CEM-based stain detection and OSP-based stain detection for PV modules. The experimental results on real data illustrate that, in comparison with contrasting methods, the proposed method achieves stain detection results that closely align with known stain percentages. Additionally, it exhibits a fitting curve similar to the more maturely developed electroluminescence-based methods currently in use.

1. Introduction

At present, people’s demand for energy is increasing, and the problem of energy shortage follows. Seeking green and new energy for sustainable development has become a key issue for all countries. Solar energy, as a clean energy source, has garnered significant research attention [1]. In 2022, the energy prices surged due to the impact of the Ukrainian–Russian war, leading countries to pay greater attention to renewable energy. Consequently, the photovoltaic market is experiencing a boom [2]. Global photovoltaic (PV) module demand reached 280 W in 2022, exhibiting a staggering growth rate of 56.5% compared with 2021 [3]. Distributed PV power generation has become a crucial technology actively promoted by developed countries, and China is also actively promoting the development of distributed PV construction. Since June 2021, the National Energy Administration has organized nationwide initiatives to promote the development of rooftop distributed photovoltaics on a county-wide scale, addressing electricity consumption issues in both rural and industrial areas [4]. It is anticipated that by 2050, the total installed capacity of PVs in China will reach 1300 GW [5]. Concurrently, InfoLink predicts that global demand will further increase by 21.6% to reach 338 GW in 2023, driven by the ongoing energy transition efforts of various countries. PV plans in more and more countries also indicate that solar PV power generation is increasingly assuming a pivotal role in the energy sector. However, factors such as production, daily activities, environmental conditions, and weather can lead to the accumulation of dust on the PV panel, which is inevitable. Therefore, the study of dust and other factors that cause the reduction of PV power generation efficiency has received more and more attention [6]. According to the research findings in [7], the output power of a clean PV module is at least 15% higher than that of a PV module with ash accumulation in the same environment. The output power of a PV module decreases accordingly with the increase in ash accumulation. Additionally, dust on a PV module can result in leakage current and power attenuation, significantly decreasing the solar energy conversion efficiency of the PV module. Wang et al. [8] studied the effect of ash accumulation on the leakage current and attenuation life of the PV module. Jiang et al. [9] conducted laboratory simulations and experiments using solar simulators and test chambers to study the efficiency degradation of a PV module caused by dust deposition under different conditions. This work aims to study the dust accumulation on different types of solar PV modules and the corresponding efficiency degradation. The influence of dust on solar panel efficiency and factors affecting dust deposition on PV panels are summarized in [10]. In [11], three factors affecting the efficiency of PV panels are considered simultaneously: dust, humidity, and air speed; moreover, it is shown that they also interact with each other. In addition, in [12,13], the influence of different types of dust on the efficiency of PV power generation is studied. The above literature, from the perspectives of power generation efficiency and PV lifespan, demonstrates the impact of stains on the efficiency of PV power generation. Furthermore, airborne dust deposition on outdoor PV modules can reduce the transmittance of solar cell glass [14,15]. For example, the study in [16] investigated the fitting formula of dust deposition and the reduction in light transmittance. Kaldellis and Kokala [17] pointed out that the solar radiation intensity significantly influences PV panel output. However, the presence of soil and dirt can lead to a decrease in efficiency of potentially up to 15%. Conversely, the presence of dust, which leads to attenuated solar exposure due to reflection, reduces the efficiency of PV panels. Some studies suggest that the high concentration of airborne dust deposition may reduce the transmittance of battery glass, leading to a significant decrease in solar energy conversion efficiency [18]. These studies aim to investigate the impact of different dust concentrations on power generation efficiency. Nurjanah et al. [19] studied the effect of dust characteristics and deposition density on PV efficiency. The results showed that fine particulate dust has a greater impact on the power generation performance of PV panels than coarse ones. Amr [20] studied the influence of a dust layer on the light beam transmittance of a PV module glass surface in experimental and mathematical ways. The results revealed that as the number of dust particles on the glass sample increased, the reflection at longer wavelengths was much greater than at shorter wavelengths. Similarly, a dust concentration and energy conversion efficiency model was proposed in [21] to evaluate the impact of dust accumulation on PV power generation performance. The impact of dust on the efficiency of a PV module can be analyzed from two perspectives: the diffusion of dust in the atmosphere and the deposition of dust on the surface of the panel. Additionally, electrical characteristics, such as its current–voltage curve and power–voltage curve, vary under different radiation levels. With increased insolation on the PV module surface, more power can be generated, thus improving efficiency [22]. Additionally, the type and particle size of stains are also related to their impact on PV panel power generation. In [23], a comprehensive physical model was proposed to predict the influence of dust deposition on the transmittance of PV modules. The results showed that the effect of deposition increases significantly with the increase in particle concentration and particle size, but decreases with the change in particle transparency. These studies collectively contribute to a comprehensive understanding of how dust affects PV module performance and highlight various factors that can influence efficiency.
The above studies show that the existence of dust accumulation affects the output efficiency of PV modules. It is necessary to study the relationship between dust accumulation and the power generation efficiency of PV modules. On the one hand, it differs from the method of modeling by exploring the relationship between dust accumulation density and module efficiency through simulation experiments. Dust density is often unknown in real scenarios. Additionally, the dust accumulation situation of an outdoor PV module is affected by a variety of natural factors, which may differ from the simulated experimental scenario. On the other hand, existing EL-based stain detection technologies, such as image entropy-based or variance-based methods, achieve satisfactory detection results. However, an inherent limitation is that EL requires a power supply for luminescence, demanding high imaging requirements and offering a limited imaging range. In contrast, UAV remote sensing does not necessitate specific imaging conditions and provides a broader imaging range. Furthermore, hyperspectral imaging technology combines imaging and spectral technologies to capture both the two-dimensional geometric space and one-dimensional spectral information of the target. It is based on narrow-band image data technology and results in continuous and narrow-band data with high spectral resolution, and it finds numerous applications in various detection fields. Several hyperspectral image (HSI)-based detection techniques have been successively proposed [24,25,26], among which the method in [25,26] has been widely reported due to its simplicity and effective detection capability [25,26,27]. Therefore, this study aims to leverage the advantages of hyperspectral remote sensing images, which include a wide imaging range, no constraints on imaging conditions, and high spectral resolution. Simultaneously, it aims to investigate stain detection in PV images under conditions where stain accumulation density and types are unknown, utilizing the effective spectral feature detection capabilities of OSP and CEM. This paper is dedicated to the development of a stain detection method based on UAV remote sensing images, aiming to achieve detection capabilities comparable with EL-based technologies. At the same time, it strives to overcome the limitations of EL-based stain detection methods, facilitating unrestricted detection in large-scale scenarios.
The contributions of this paper are as follows:
(1)
A stain detection framework based on an HSI PV module is proposed to address the challenges posed by various type of stains, large stains, and unknown spectral signatures. The framework consists of two detection methods: constrained energy minimization-based and orthogonal subspace projection-based methods.
(2)
The relationship between the amount of stains accumulated by the spectral module and the power generation efficiency of the PV module is modeled. The results demonstrate that the developed method achieves comparable performance with the electroluminescence (EL) image-based stain detection technology.

2. Methods

The overall process of the proposed method is illustrated in Figure 1. It can be summarized into two main modules: A. removing interference and B. stain detection. In the A. removing interference stage, considerations are given to factors such as gridlines and illumination that may cause spectral distortion affecting the detection of the target spectrum. In the B. stain detection stage, two methods for PV module stain detection are introduced, namely the CEM-based method (B1) and the OSP-based method (B2). Specifically, after acquiring the UAV HSI of the PV, irrelevant interference is removed from the data to be detected. Then, the PV module stain detection method based on HSIs is executed to obtain the detection value and detection result image. Finally, the detection value and percentage of stains are modeled.

2.1. Remove Irrelevant Interference

For outdoor UAV HSIs, the quality of the collected images are affected by environmental illumination, image distortion, sensor instability, and the structure of the PV module itself. As a result, the precision and accuracy of subsequent processing are compromised. Therefore, it is necessary to preprocess the data before processing.

2.1.1. Remove Gridlines

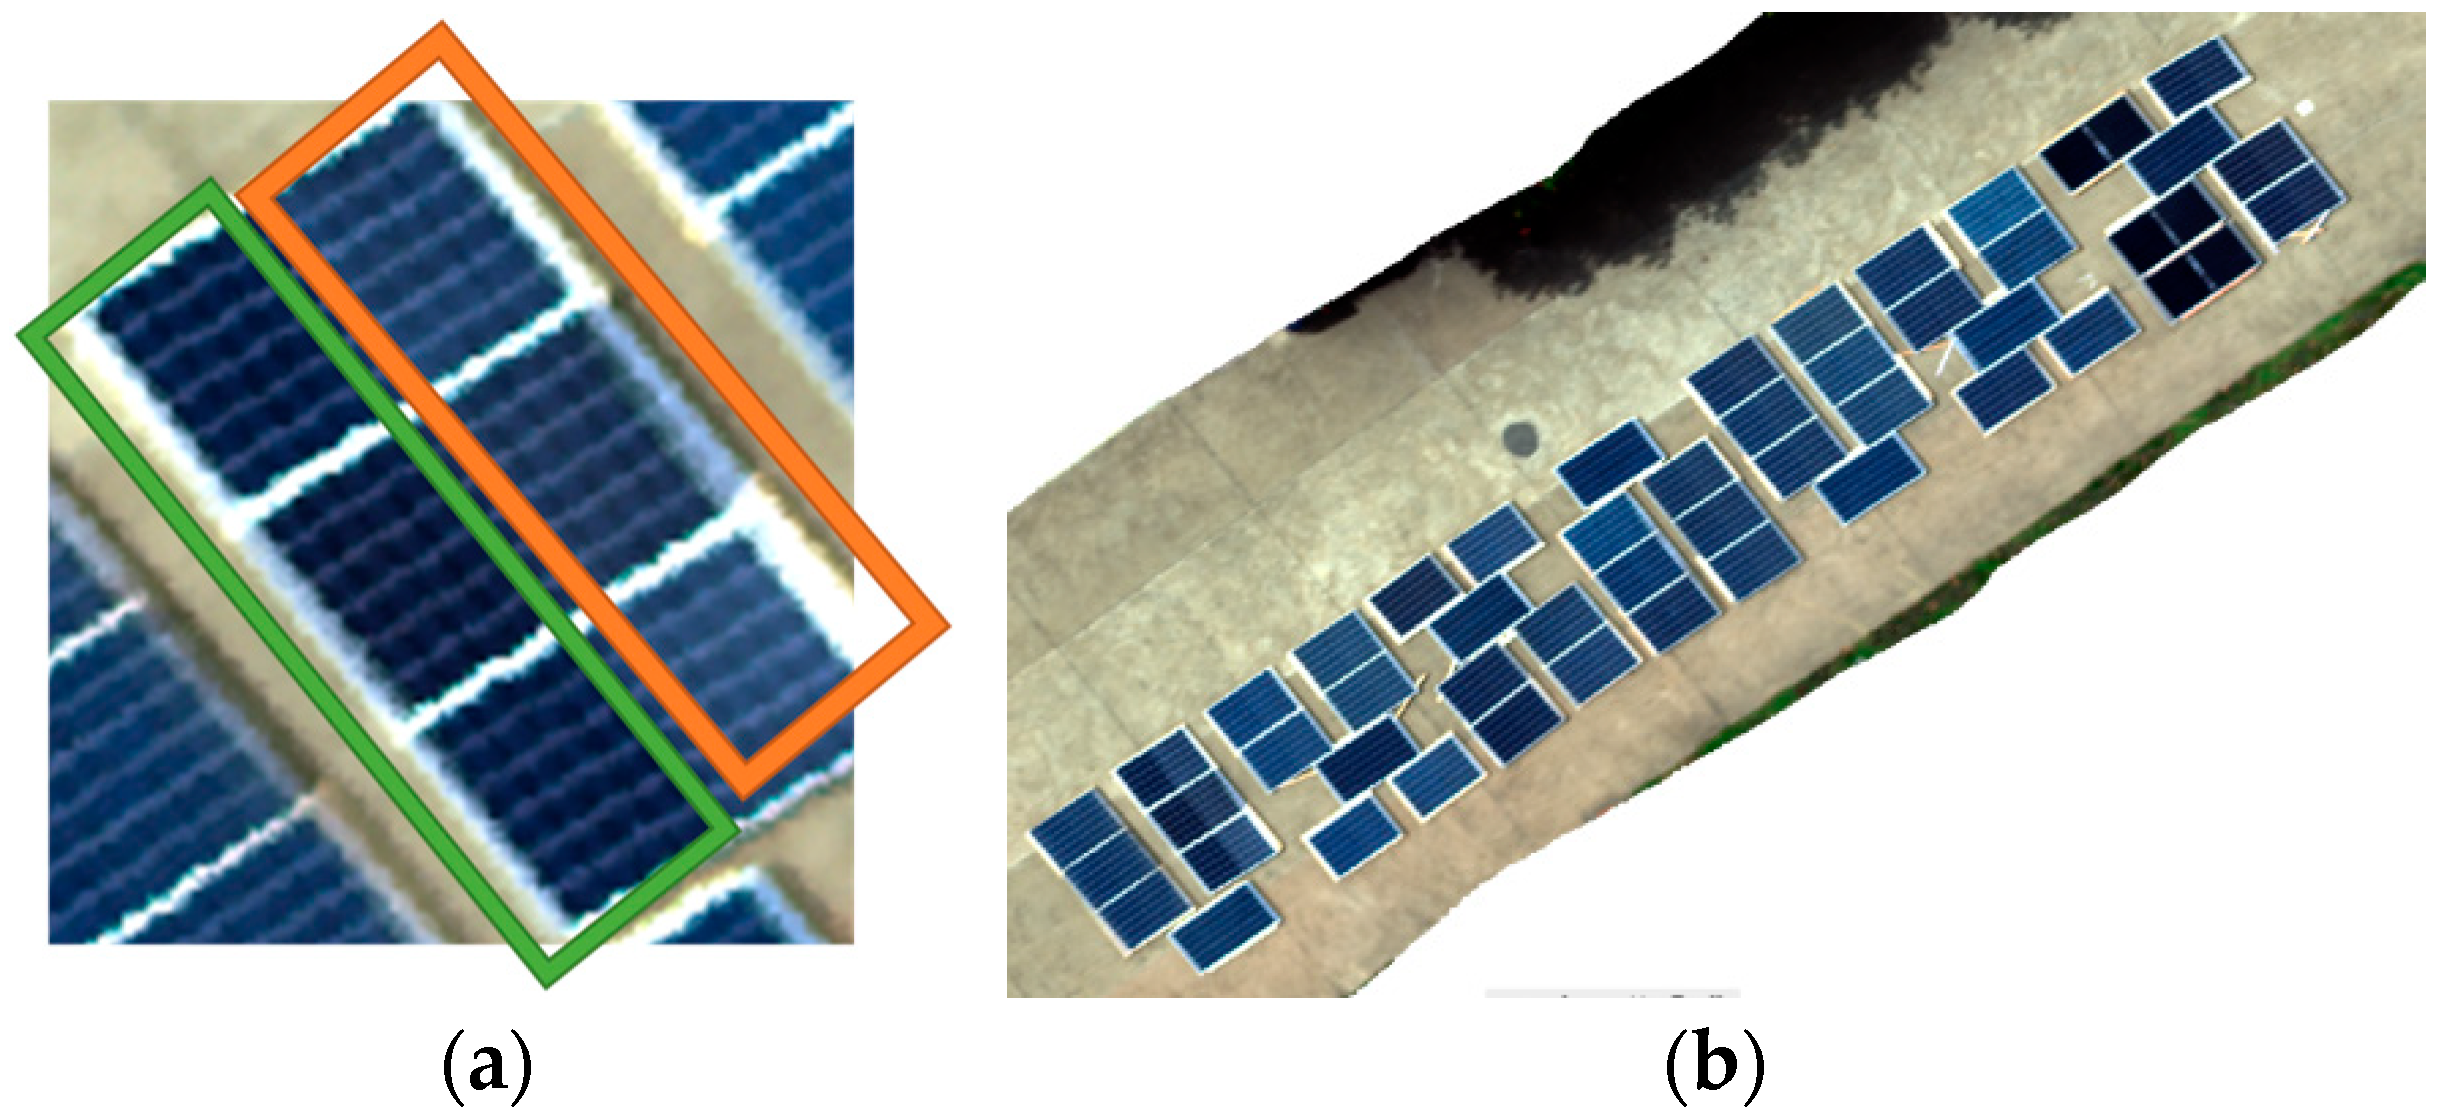
Typically, the UAV-acquired data of PVs will contain a solar panel and gridlines, where the solar panel is usually in the shape of a square or rectangle and is typically made of semiconductor materials (e.g., silicon) that are highly absorbent of solar light, and its surface is dark in color. The gridlines are the conductive lines located on the surface of the solar panels; these lines form a grid-like structure [28] that connects the solar panels and is used to collect and conduct the current generated by the solar panels, and it is usually white or silver. Figure 2 is the experimental setup during the data collection process and the panoramic view of the captured data. The orange boxes indicate the polluted areas, while the green boxes represent the cleaned areas. Due to the structural characteristics of PV modules, gridlines are inevitably present on the surface, as shown by the white lines in Figure 2a. They are made of materials that are different from the PV panel, typically exhibiting brighter pixel values. As a result, direct detection of the PV module can significantly interfere with the effectiveness of the detection algorithm, leading to unsatisfactory stain detection results. Therefore, it is necessary to mitigate this effect before performing the detection.
In this stage, two ways are employed to remove the gridlines of the acquired PV module: (1) a threshold-based cutting method and fabrication mask and (2) physical-based cutting. Firstly, a target image for detection is randomly chosen, and a single-band image is extracted from it. By comparing the pixel intensity values of the gridlines with the PV module in the single-band image, the threshold-based segmentation method is applied to remove the gridlines. A single-band PV module image without gridlines is obtained. Because each band of an HSI corresponds to the reflectance of the same surface within a specific wavelength interval, the spatial structure remains consistent across all bands. However, due to the varying reflectivity in different bands, the pixel intensity differs among bands. Therefore, a fixed threshold cannot be applied uniformly to remove the gridlines in different bands. To achieve a more accurate and efficient gridlines removal, a mask is generated with the single-band PV module obtained after removing the gridlines. Then, the mask image is used to remove the gridlines from the remaining bands. Figure 3 illustrates the visual results before and after gridlines removal.
Although the above method can remove most of the gridlines, it also removes stains with high-intensity values. To address this issue, the consideration of physical-based cutting is further explored for removing the gridlines. Figure 4 illustrates the visualization before and after the physical removal process.

2.1.2. Data Correction

In addition to the effects of gridlines, the spectral quality of outdoor-acquired UAV HSIs can also be affected by factors such as ambient illumination, which in turn affects the precision and accuracy of subsequent processing. Therefore, after removing the gridlines from the HSI PV module, the spectral correction of the PV module is required in the next step. In this paper, the PV module is spectrally corrected based on the reference plate acquired in the HSI PV module acquisition. Figure 5 shows the visualization results of the PV modules with and without correction.

2.2. Method Introduction

Because there are many types of stains (generally including dust (ceramic/mud), metal, oil, and miscellaneous) and the degree of pollution varies, it is difficult to determine the spectrum of pollutants. However, the spectrum of clean PV modules can be obtained in advance. Therefore, two stain detection methods are designed based on the HSI PV module using the spectrum of the clean PV module.

2.2.1. Stain Detection of HSI PV Module Based on CEM

Given a set of observation samples O = { r 1 , r 2 , , r N } , r i = { r i 1 , r i 2 , , r i L } T is the sample vector of 1 × L , L is the number of bands of the HSI, 1 i N , and N is the total number of pixels in each band. Further assume the target endmembers d = { d 1 , d 2 , , d L } T and that the size of d is the same as r. The goal of CEM is to design a filter w obeying the constraint d T w = w T d = 1 . More specifically, y i represents the output of the finite impulse response (FIR) filter generated by the input r i . Thus, y i can be expressed as
y i = l = 1 L w l r i l = ( w ) T r i = r i T w
The average energy output of the filter is given by the following equation:
( 1 N ) i = 1 N y i 2 = ( 1 N ) i = 1 N ( r i T w ) 2 = w T [ ( 1 N ) i = 1 N r i r i T ] w = w T R w
where R = ( 1 / N ) [ i = 1 N r i r i T ] is the autocorrelation sample matrix of the image. CEM can solve the following linearly constrained optimization problem:
min w { w T R w } subject   to   d T w = w T d = 1
The optimal solution for (3) is given as follows:
w C E M = R 1 d d T R 1 d
Use the optimal weights w C E M specified by (4); the filter called CEM was derived in [25], represented by δ C E M ( r ) .
δ C E M ( r ) = ( w C E M ) T r = ( R 1 d d T R 1 d ) T r = d T R 1 r d T R 1 d
Because the spectrum of the stains to be detected is unknown, direct application of CEM for detecting stains in PV modules is not feasible. Fortunately, the spectral curve of the region that is not of interest in the HSI PV module can be obtained. Therefore, to address the issue of the unknown target spectrum d, a stain detection method for the HSI PV module based on CEM is designed in this paper.
After eliminating factors such as gridlines and spectral distortion that affect the detection, it is assumed that the HSI only contains PV modules and stains. Then, by taking the clean PV module spectrum as d, execute δ C E M ( r ) . Then, the following formula can be utilized:
ζ c e m ( r ) = 1 d T R 1 r d T R 1 d
Then, the region of interest can be calculated using the above equation ζ c e m ( r ) .
Although the above methods effectively suppress the background, due to R counting a part of the stain, the above methods have a suppression effect on the stain. To achieve a more accurate detection of unknown stains, this paper further proposes a second scheme by combining OSP on the basis of the above section.

2.2.2. Stain Detection of HSI PV Module Based on OSP

Because the target spectrum d is unknown, after removing the interfering factors in the image, all materials except for the PV module are considered as stains. However, this method is not ideal, and a further improvement of the method is considered. Another way is to treat the PV module as the signal that needs removal, and a space is constructed based on it. The second method is then performed on the orthogonal space of this constructed space.
Given a three-dimensional HSI X = { r i } i = 1 n , r i = ( r i 1 , r i 2 , , r i L ) T , n is the total pixels and L is the total spectral channels. The objective function of RAD [26] is given by
δ RAD ( r ) = r n T R 1 r n
where r n is spectral signature of the current pixel to be detected, R = 1 n i = 1 n r i r i T is autocorrelation matrix of the measured image pixels, and r i is the spectral vector of i pixel. The correlation matrix is obtained according to the spectral correlation of all pixels preceding the current pixel. By considering the PV module as a signal that needs to be removed, it is used to construct a space in which the stains are detected in the orthogonal space. Part of the stain is counted in (7), which is equivalent to suppressing a part of the stains. Therefore, the consideration involves combining OSP to design the second method. Let U = [ m 1 m 2 , , m p 1 ] be the unwanted material spectral signature matrix composed of m 1 , m 2 ,…, m p 1 , then:
α ^ p R O S P ( r ) = r T P U r
Here,
P U = I U U # = I U ( U T U ) 1 U T
where U # is the pseudoinverse of U, and it is obtained by U ( U T U ) 1 U T .

3. Experimental Results and Analysis

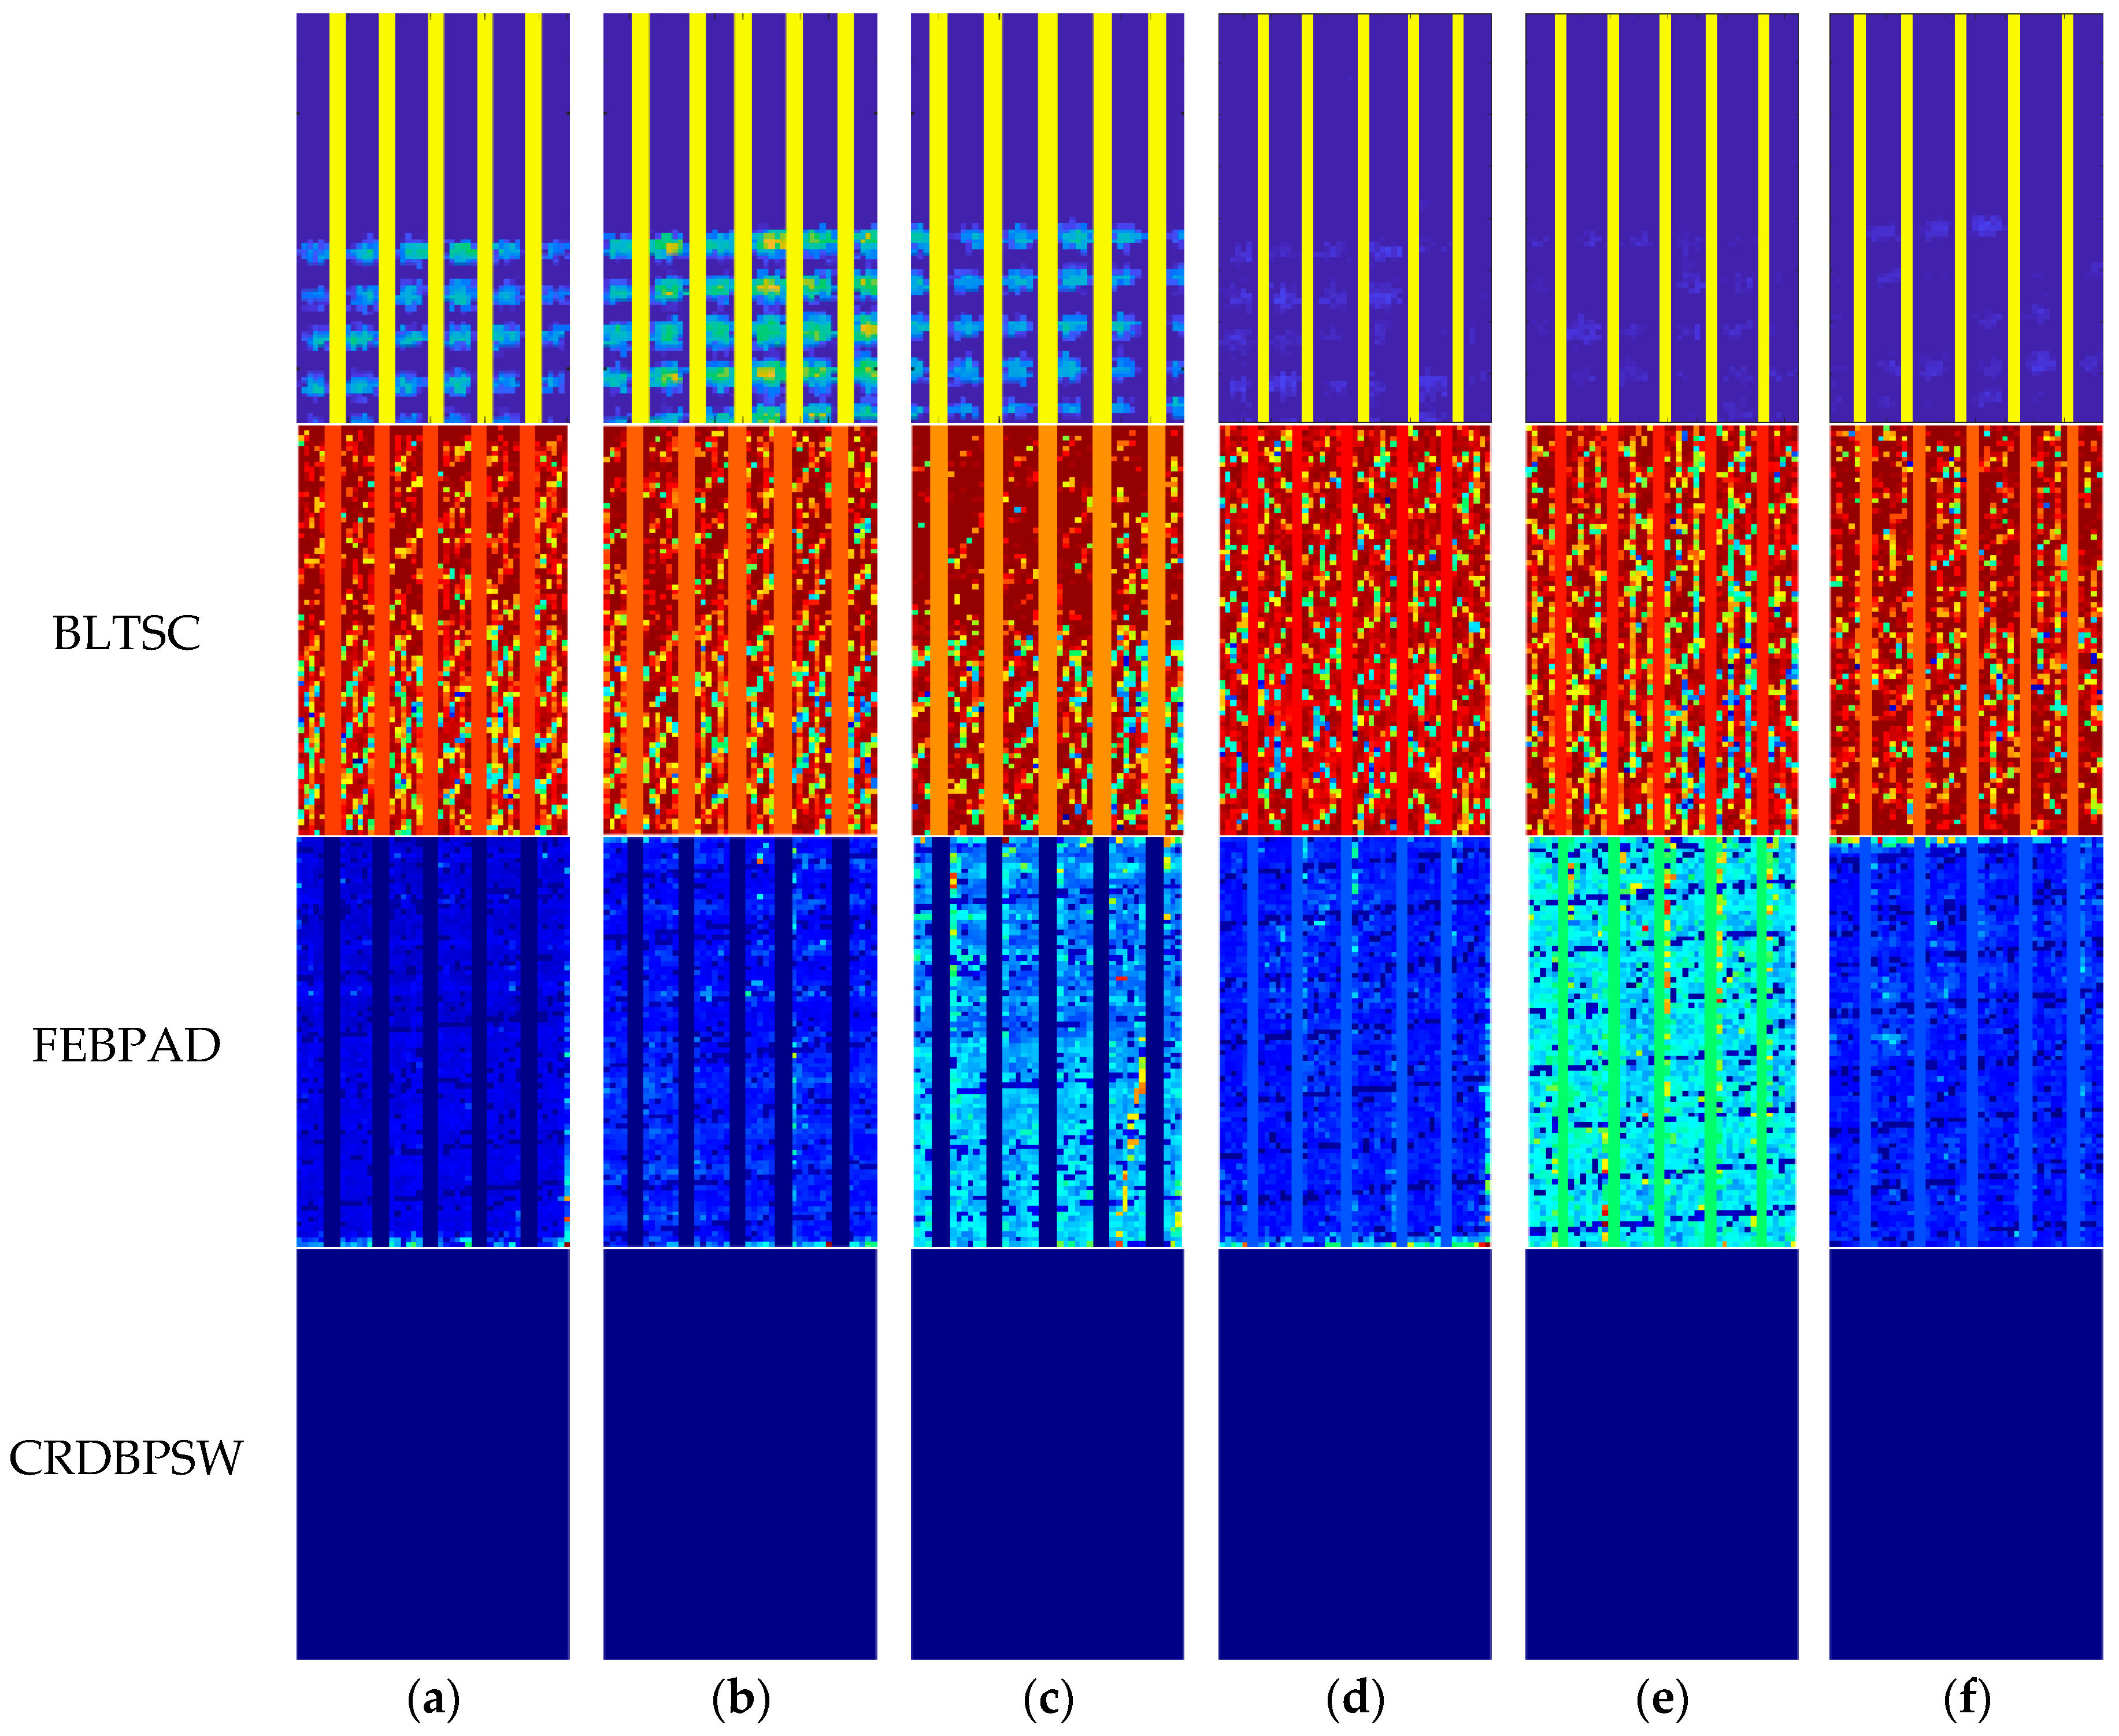
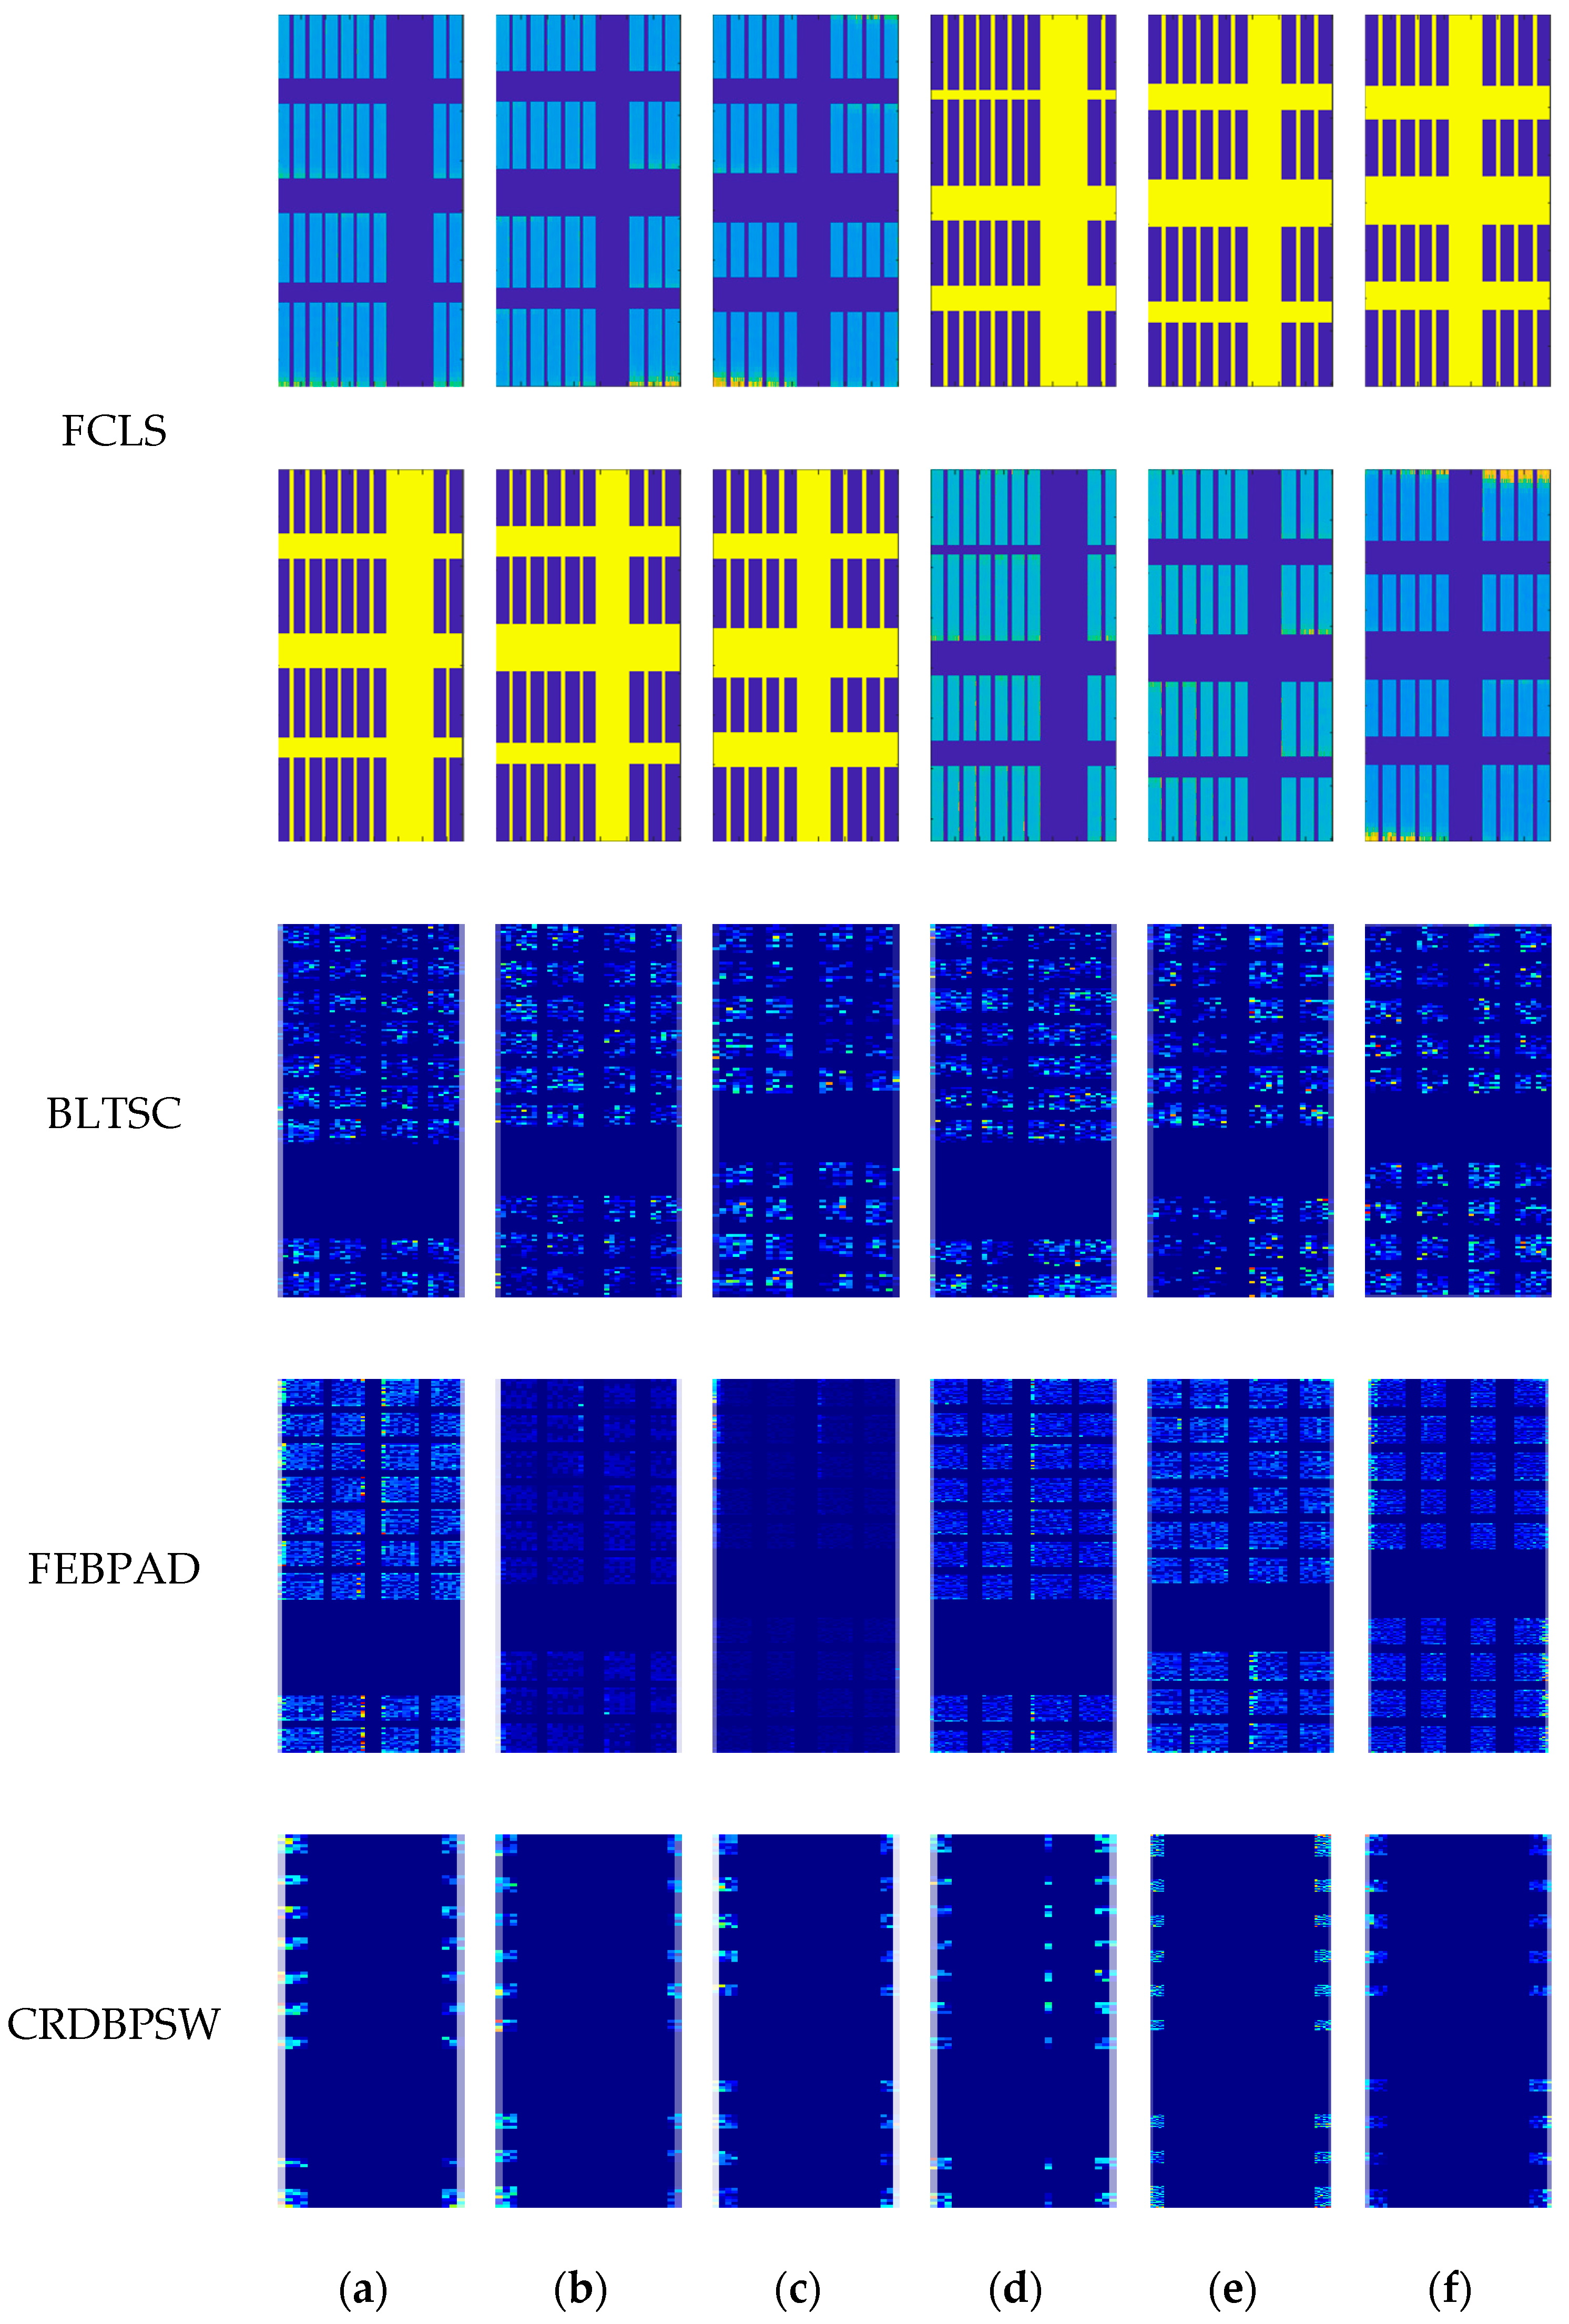
In order to validate the effectiveness of the developed method in detecting stains in PV images, it was applied to multiple UAV aerial HSI PV images, and the detection value (DV) and corresponding percentage of stain (PS) were modeled. At the same time, the proposed detection framework was compared with the unmixing-based method (FCLS) [29], the deep learning-based (DL) method BLTSC [30], and anomaly detection methods (FEBPAD [31] and CRDBPSW [32]) to demonstrate the superiority of the proposed framework. In addition, a comparison was performed with an EL image-based method, which has been maturely developed at present, to further verify the performance of the presented method. For a more intuitive quantitative comparison of the results among different methods, we use bold font and underline to mark the best and second-best values, respectively.
The dataset used in this paper was acquired by the HEADWALL Hyperspec III sensor at heights of 15, 30, and 50 m, with a vertically downward shooting angle. The data size for the first batch is 1640 × 1251 × 270, and for the second batch, it is 8172 × 2684 × 270. As depicted in Figure 2, the focus was on processing the PV panel area during the experiment to minimize interference factors in the data processing.

3.1. Relationship between the Detection Results of Different Methods and Percentage of Stain

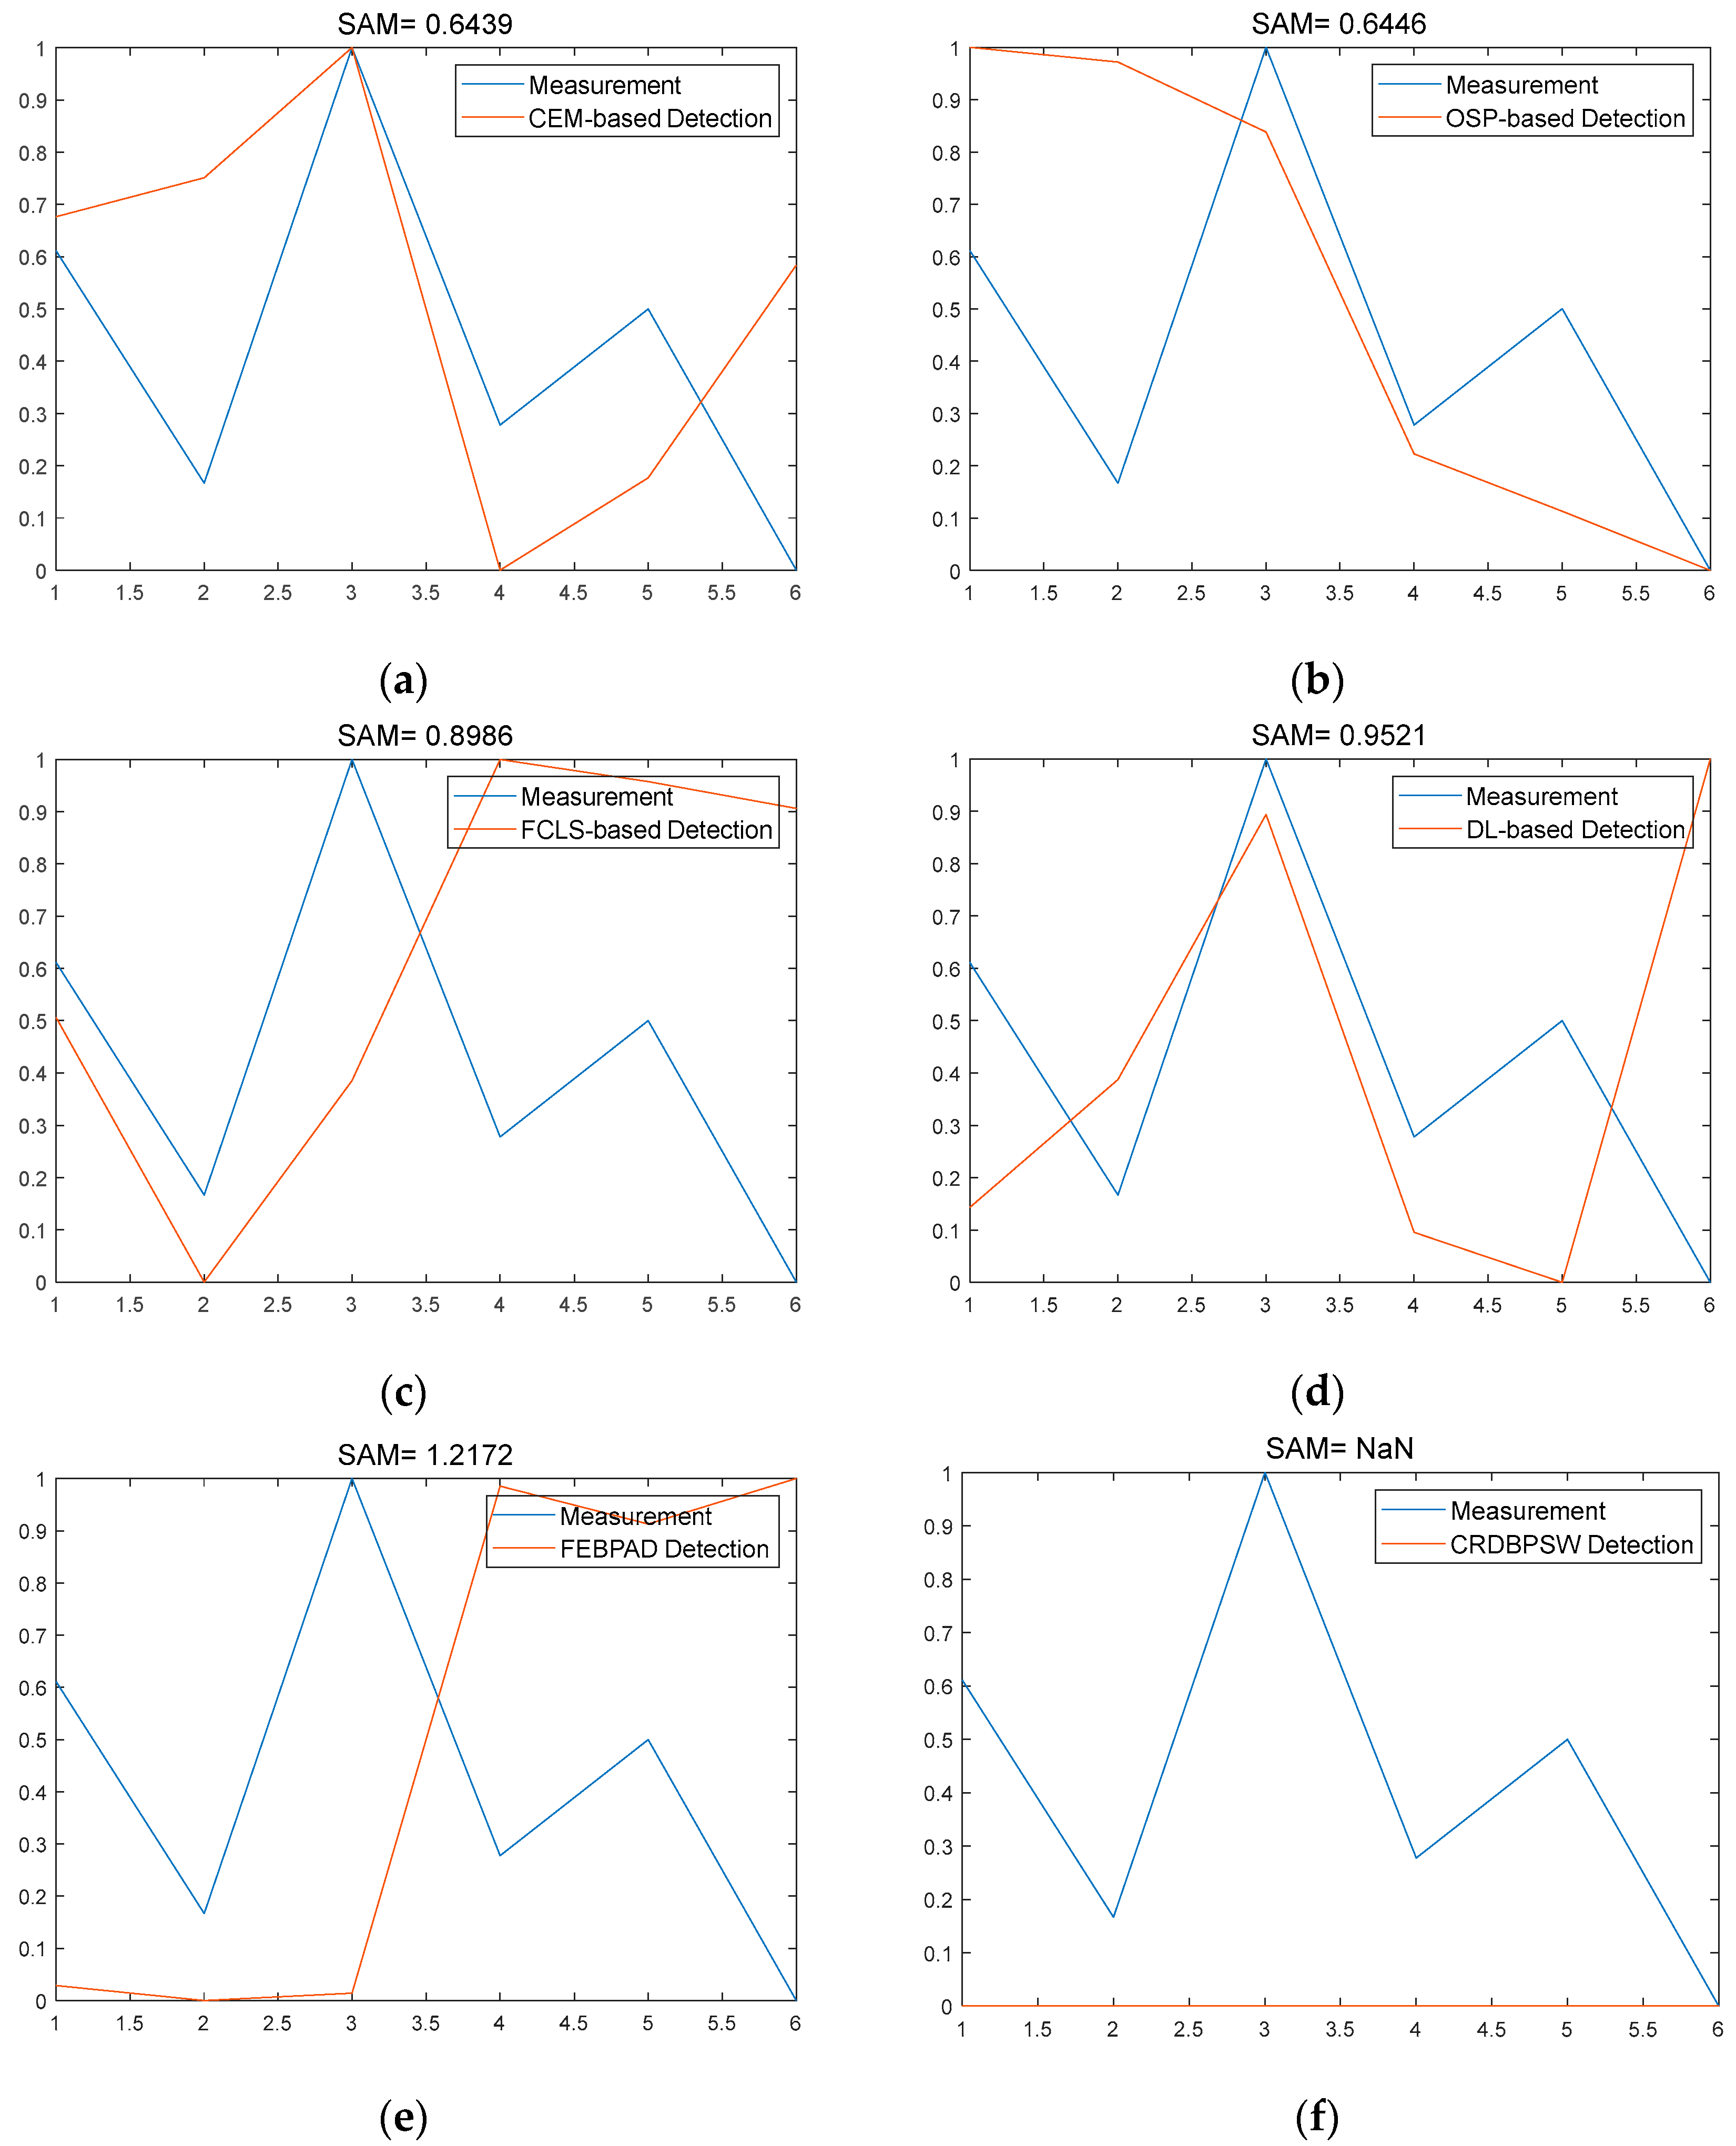
Figure 6 and Figure 7 displays the detection results obtained using different methods. The detection colors corresponding to different values are shown in the color bar in Figure 6. In this bar, colors closer to red indicate detection values closer to one, representing a higher amount of detected stain. Conversely, as colors approach blue, the corresponding detection values get closer to zero, indicating a lower amount of detected stain. Visually, the proposed method exhibits distinguishable visual effects compared with FCLS, BLTSC, EFBPAD, and CRDBPSW. The presented method can effectively detect the areas with and without cleaning the PV module, where the distribution of these areas is visible. Figure 8 presents a curve comparison between the values obtained from different detection results and the corresponding percentage of stains. Additionally, to analyze the relationship between the detection values of different methods and the percentage of stains more effectively, a quantitative approach was adopted using the spectral angle measure (SAM) in Table 1 to calculate the distance between them. Among them, bold values are used to indicate the best results, and underlined values represent the second-best results. A smaller SAM value indicates that the detection results are closer to the stain percentage, indicating better stain detection performance for the corresponding algorithm. From Table 1, it can be observed that CEM exhibits the lowest SAM value, which indicates that it detects best, followed by OSP. This indicates that the stain detection results of the proposed framework demonstrate optimal performance.

3.2. Comparison of EL Image-Based and HSI-Based Experimental Results

In order to validate the superiority of the developed method, the results of the proposed methods and EL image-based methods, which have been developed maturely, are presented in Table 2. EL1 and EL2 are the mean and entropy of the grayscale for the EL image, respectively. Additionally, Figure 9 compares the fitting curves between the stain detection results using the proposed HSI-based method and the EL image-based method. It can be observed that the fitting curve of the detection results using the proposed HSI method follows a similar trend to the EL image-based method, indicating the effectiveness of the proposed HSI-based stain detection model to a certain extent.

4. Discussion

Based on the above experimental results and analysis, it is evident that the proposed method demonstrates a competitive performance. This achievement can be attributed to the proposed method’s comprehensive considerations. Specifically, in addressing the issue of detection being influenced by various interfering factors, the proposed method designs a series of preprocessing steps aimed at mitigating external interferences in detection results. Furthermore, to tackle the challenge posed by the unknown spectral characteristics of the target, two detection methods were designed specifically for unknown spectral d. However, upon closer examination of the SAM curves in Figure 8, it becomes apparent that the proposed method does not consistently align with the trend of stain percentage across all images. For example, in the proposed CEM-based stain detection method illustrated in Figure 8a, the detection trend in the sixth image of Figure 6 deviates from the expected stain percentage trend. Conversely, the proposed OSP-based stain detection method shown in Figure 8b yields improved results, although OSP-based detection falls short in the third and fifth images. This discrepancy suggests that there is still room for enhancement in the proposed method.
A comprehensive analysis of the influencing factors at each step of the proposed method reveals crucial elements contributing to the detection result’s instability. These factors include variations in gridline width caused by different drone flight altitudes during data collection and the instability of light sources due to morning or afternoon data capture. Additionally, during the stain detection stage, the unknown target spectral characteristics of the stain may lead to their suppression. All of these factors could contribute to the instability of detection results.
Finally, the instability observed in the detection results highlights the imperative for future refinements in future work. This will be a focal point for future improvements.

5. Conclusions

In this paper, two algorithms for detecting stains in HSI PV modules based on a UAV acquisition method were designed. Firstly, this paper took into account factors that influence the detection results and designed preprocessing steps such as removing gridlines and performing spectral correction. Secondly, as the pollutants to be detected may consist of a mixture of various types of stains, their spectral curves are also unknown. Therefore, the detection methods were designed to tackle the challenge posed by an unknown target spectrum d. These methods employed a reverse search strategy to identify the targets that require detection. Furthermore, in the proposed OSP-based method, we regarded the PV component as a signal to be removed and searched for the targets in the orthogonal space of the space it constructs, which is also advantageous for the detection task under the unknown target spectrum d. Finally, we modeled the percentage of stains and detected values to evaluate the effect of stain accumulation on power generation performance. The experiment conducted on real outdoor PV module data adds realism and credibility to our findings. One limitation of our proposed methods is that the detection results are susceptible to the influence of gratings with high grayscale values, necessitating the removal of gridlines in advance during the preprocessing step. Therefore, in future work, further exploration will be conducted on stain detection methods that are robust to the impact of gridlines.

Author Contributions

Methodology, L.L., Y.S., P.S., J.Z. and M.S.; Investigation, D.L. and S.D.; Resources, D.L. and S.D.; Data curation, D.L.; Writing—original draft, L.L. and M.C.; Writing—review & editing, L.L. and M.S.; Supervision, D.L.; Funding acquisition, D.L. and S.D. All authors have read and agreed to the published version of the manuscript.

Funding

This research was funded by the Research Project for Guangdong Administration for Market Regulation (Guangdong Intellectual Property Administration), grant number 2021ZZ02.

Data Availability Statement

The data are not publicly available due to project reasons.

Conflicts of Interest

The Author Da Li was employed by the China Southern Power Grid Energy Efficiency and Clean Energy Co., Ltd. The remaining authors declare that the research was conducted in the absence of any commercial or financial relationships that could be construed as a potential conflict of interest. The funders had no role in the design of the study; in the collection, analyses, or interpretation of data; in the writing of the manuscript; or in the decision to publish the results.

References

  1. Zhao, E.; Li, L.; Song, M.; Cao, Y.; Chen, S.; Shang, X.; Li, F.; Dai, S.; Bao, H. Research on image registration algorithm and its application in photovoltaic images. IEEE J. Photovolt. 2020, 10, 595–606. [Google Scholar] [CrossRef]
  2. Ravishankar, R.; AlMahmoud, E.; Habib, A.; de Weck, O.L. Capacity estimation of solar farms using deep learning on high-resolution satellite imagery. Remote Sens. 2023, 15, 210. [Google Scholar] [CrossRef]
  3. SolarBe, News. Overview of the Photovoltaic Industry’s Development in the Past Three Years and Future Trends. Available online: https://news.solarbe.com/202308/23/371119.html (accessed on 23 August 2023).
  4. Xu, X.-B.; Zhang, H.-J.; Bai, J.-B.; Pei, R.H.; Hu, J.Y.; Tan, Z.Y. High-precision segmentation method for distributed photovoltaic buildings based on improved unet. J. Sol. Energy 2023, 44, 82–90. [Google Scholar]
  5. Zhang, Y.; Qin, W.; Wang, L.; Yang, C.; Su, X.; Wu, J. Enhancement of photovoltaic power potential in China from 2010 to 2020: The contribution of air pollution control policies. Remote Sens. 2022, 15, 228. [Google Scholar] [CrossRef]
  6. Jumaboev, S.; Jurakuziev, D.; Lee, M. Photovoltaics plant fault detection using deep learning techniques. Remote Sens. 2022, 14, 3728. [Google Scholar] [CrossRef]
  7. Zhang, F.; Bai, J.B.; Hao, Y.Z.; Zhang, Z.; Jiang, M. Effect of airborne dust deposition on PV module surface on its power generation performance. Power Grid Clean Energy 2012, 28, 5. [Google Scholar]
  8. Wang, P.; Du, W.; Zhang, H.N.; Li, C. Pollution impact on the leakage current and power degradation of photovoltaic modules. Acta Energiae Solaris Sin. 2019, 40, 7. [Google Scholar]
  9. Jiang, H.; Lu, L.; Sun, K. Experimental investigation of the impact of airborne dust deposition on the performance of solar photovoltaic (PV) modules. Atmos. Environ. 2011, 45, 4299–4304. [Google Scholar] [CrossRef]
  10. Zaihidee, F.M.; Mekhilef, S.; Seyedmahmoudian, M.; Horan, B. Dust as an unalterable deteriorative factor affecting PV panel’s efficiency: Why and how. Renew. Sustain. Energy Rev. 2016, 65, 1267–1278. [Google Scholar] [CrossRef]
  11. Mekhilef, S.; Rahman, S.; Kamalisarvestani, M. Effect of dust, humidity and air velocity on efficiency of photovoltaic cells. Renew. Sustain. Energy Rev. 2012, 16, 2920–2925. [Google Scholar] [CrossRef]
  12. Kaldellis, J.K.; Kapsali, M. Simulating the dust effect on the energy performance of photovoltaic generators based on experimental measurements. Energy 2011, 36, 5154–5161. [Google Scholar] [CrossRef]
  13. Kazem, H.A.; Al-Bahri, S.; Al-Badi, S.; Al-Mahkladi, H. Effect of dust on photovoltaic performance. Adv. Mater. Res. 2014, 875–877, 1908–1911. [Google Scholar] [CrossRef]
  14. Wen, W.; Li, S.; Zhou, F.; Li, M.; Xie, Q.; Chen, S. Stain detection method of solar panel based on spot elimination. In Proceedings of the Big Data, Artificial Intelligence and Internet of Things Engineering, Nanchang, China, 26–28 March 2021. [Google Scholar]
  15. Li, T.; Yang, D.; Chen, C.; Zeng, Z.; Huang, G.; Tao, B.; Li, J. A mobile robot design for efficient and large-scale solar panel cleaning. In Proceedings of the IEEE International Conference on Robotics and Biomimetics, Xishuangbanna, China, 5–9 December 2022. [Google Scholar]
  16. Hegazy, A.A. Effect of dust accumulation on solar transmittance through glass covers of plate-type collectors. Renew. Energy 2001, 22, 525–540. [Google Scholar] [CrossRef]
  17. Kaldellis, J.K.; Kokala, A. Quantifying the decrease of the photovoltaic panels’ energy yield due to phenomena of natural air pollution disposal. Energy 2010, 35, 4862–4869. [Google Scholar] [CrossRef]
  18. Mani, M.; Pillai, R.; Lee, M. Impact of dust on solar photovoltaic (PV) performance: Research status, challenges and recommendations. Renew. Sustain. Energy Rev. 2010, 14, 3124–3131. [Google Scholar] [CrossRef]
  19. Nurjanah, S.; Dewi, T. Dusting and Soiling Effect on PV Panel Performance: Case Study Open-pit Mining in South Sumatra. Indonesia. In Proceedings of the International Conference on Electrical and Information Technology, Malang, Indonesia, 14–15 September 2021. [Google Scholar]
  20. Amr, L.; Abdellatif, S.O.; Kirah, K.; Ghali, H.A. Investigating the optical impact of an effective time-dependent dust accumulation layer on the optoelectronic performance of monocrystalline solar cell. In Proceedings of the International Conference on Green Energy, Computing and Sustainable Technology, Miri, Sarawak, Malaysia, 7–9 July 2021. [Google Scholar]
  21. Fan, S.; Wang, X.; Cao, S.; Wang, Y.; Zhang, Y.; Liu, B. A novel model to determine the relationship between dust concentration and energy conversion efficiency of photovoltaic (PV) panels. Energy 2022, 252, 123927. [Google Scholar] [CrossRef]
  22. Rekioua, D.; Matagne, E. Optimization of Photovoltaic Power Systems: Modelization, Simulation and Control; Springer Science & Business Media: Berlin, Germany, 2012. [Google Scholar]
  23. Xingcai, L.; Kun, N. Effectively predict the solar radiation transmittance of dusty photovoltaic panels through Lambert-Beer law. Renew. Energy 2018, 123, 634–638. [Google Scholar] [CrossRef]
  24. Jha, S.S.; Joshi, C.; Nidamanuri, R.R. Target Detection in Hyperspectral Imagery Using Atmospheric-Spectral Modeling and Deep Learning. IEEE Geosci. Remote Sens. Lett. 2022, 19, 1–5. [Google Scholar] [CrossRef]
  25. Chang, C.-I.; Schultz, R.C.; Hobbs, M.C.; Chen, S.Y.; Wang, Y.; Liu, C. Progressive band processing of constrained energy minimization for subpixel detection. IEEE Trans. Geosci. Remote Sens. 2015, 53, 1626–1637. [Google Scholar] [CrossRef]
  26. Harsanyi, J.C.; Chang, C.-I. Hyperspectral image classification and dimensionality reduction: An orthogonal subspace projection approach. IEEE Trans. Geosci. Remote Sens. 1994, 32, 779–785. [Google Scholar] [CrossRef]
  27. Chang, C.-I.; Cao, H.; Chen, S.; Shang, X.; Yu, C.; Song, M. Orthogonal subspace projection-based go-decomposition approach to finding low-rank and sparsity matrices for hyperspectral anomaly detection. IEEE Trans. Geosci. Remote Sens. 2021, 59, 2403–2429. [Google Scholar] [CrossRef]
  28. Song, M.; Li, L.; Chen, S.; Dai, S.; Li, F. Photovoltaic image registration based on feature matching via guided spatial consensus. IEEE J. Photovolt. 2021, 5, 1118–1125. [Google Scholar] [CrossRef]
  29. Heinz, D.; Chang, C.-I. Fully constrained least squares linear mixture analysis for material quantification in hyperspectral imagery. IEEE Trans. Geosci. Remote Sens. 2001, 39, 529–545. [Google Scholar] [CrossRef]
  30. Xie, W.; Zhang, X.; Li, Y.; Wang, K.; Du, Q. Background learning based on target suppression constraint for hyperspectral target detection. IEEE J. Sel. Top. Appl. Earth Obs. Remote Sens. 2020, 13, 5887–5897. [Google Scholar] [CrossRef]
  31. Hou, Z.; Li, W.; Tao, R.; Ma, P.; Shi, W. Collaborative representation with background purification and saliency weight for hyperspectral anomaly detection. Sci. China Inf. Sci. 2022, 65, 112305. [Google Scholar] [CrossRef]
  32. Ma, Y.; Fan, G.; Jin, Q.; Huang, J.; Mei, X.; Ma, J. Hyperspectral anomaly detection via integration of feature extraction and background purification. IEEE Geosci. Remote Sens. Lett. 2021, 18, 1436–1440. [Google Scholar] [CrossRef]
Figure 1. Overall framework chart.
Remotesensing 16 00153 g001
Figure 2. Experimental setup and panoramic view during the data acquisition process. (a) The data collection process. The orange boxes indicate the polluted areas, while the green boxes represent the cleaned areas. (b) Panoramic view of the captured HSI.
Remotesensing 16 00153 g002
Figure 3. Removing gridlines visualization results based on threshold cutting (band 100) (a) without removing gridlines; (b) with removing gridlines.
Remotesensing 16 00153 g003
Figure 4. Removing gridlines visualization results based on physical cutting (band 100) (a) without removing gridlines; (b) with removing gridlines.
Remotesensing 16 00153 g004
Figure 5. PV module visualization results (band 100) (a) without correction and (b) with correction.
Remotesensing 16 00153 g005
Figure 6. Detection results of different methods. (af) PV panels are contaminated by different stains such as dust (ceramic), metal, etc.
Remotesensing 16 00153 g006aRemotesensing 16 00153 g006b
Figure 7. Detection results of different methods. (af) PV panels are contaminated by different stains such as dust (ceramic), metal, etc.
Remotesensing 16 00153 g007aRemotesensing 16 00153 g007b
Figure 8. Compare the DV of different methods and PS curves for Figure 6. (a) CEM-based. (b) OSP-based. (c) FCLS-based. (d) DL-based. (e) FEBPDA. (f) CRDBPSW.
Remotesensing 16 00153 g008
Figure 9. Detection relationship and fitting curve comparison between HSI-based and EL-based methods. (a) CEM-based. (b) OSP-based. (c) EL1. (d) EL2.
Remotesensing 16 00153 g009
Table 1. The SAM between the DV and PS of different methods.
CEMOSPFCLSDLFEBPADCRDBPSW
SAM0.64390.64460.89860.95211.2172NaN
Table 2. DVs of different methods.
PS (%)3.93.14.63.33.72.8
CEM-based3.07093.15943.45362.27142.48032.9618
OSP-based0.06020.05950.05620.04100.03830.0355
EL12.95003.55007.85002.53004.33005.5500
EL20.56000.57000.64000.05000.24000.2400
Disclaimer/Publisher’s Note: The statements, opinions and data contained in all publications are solely those of the individual author(s) and contributor(s) and not of MDPI and/or the editor(s). MDPI and/or the editor(s) disclaim responsibility for any injury to people or property resulting from any ideas, methods, instructions or products referred to in the content.