
Design and Implementation of K-Band Electromagnetic Wave Rain Gauge System


Abstract
:
1. Introduction
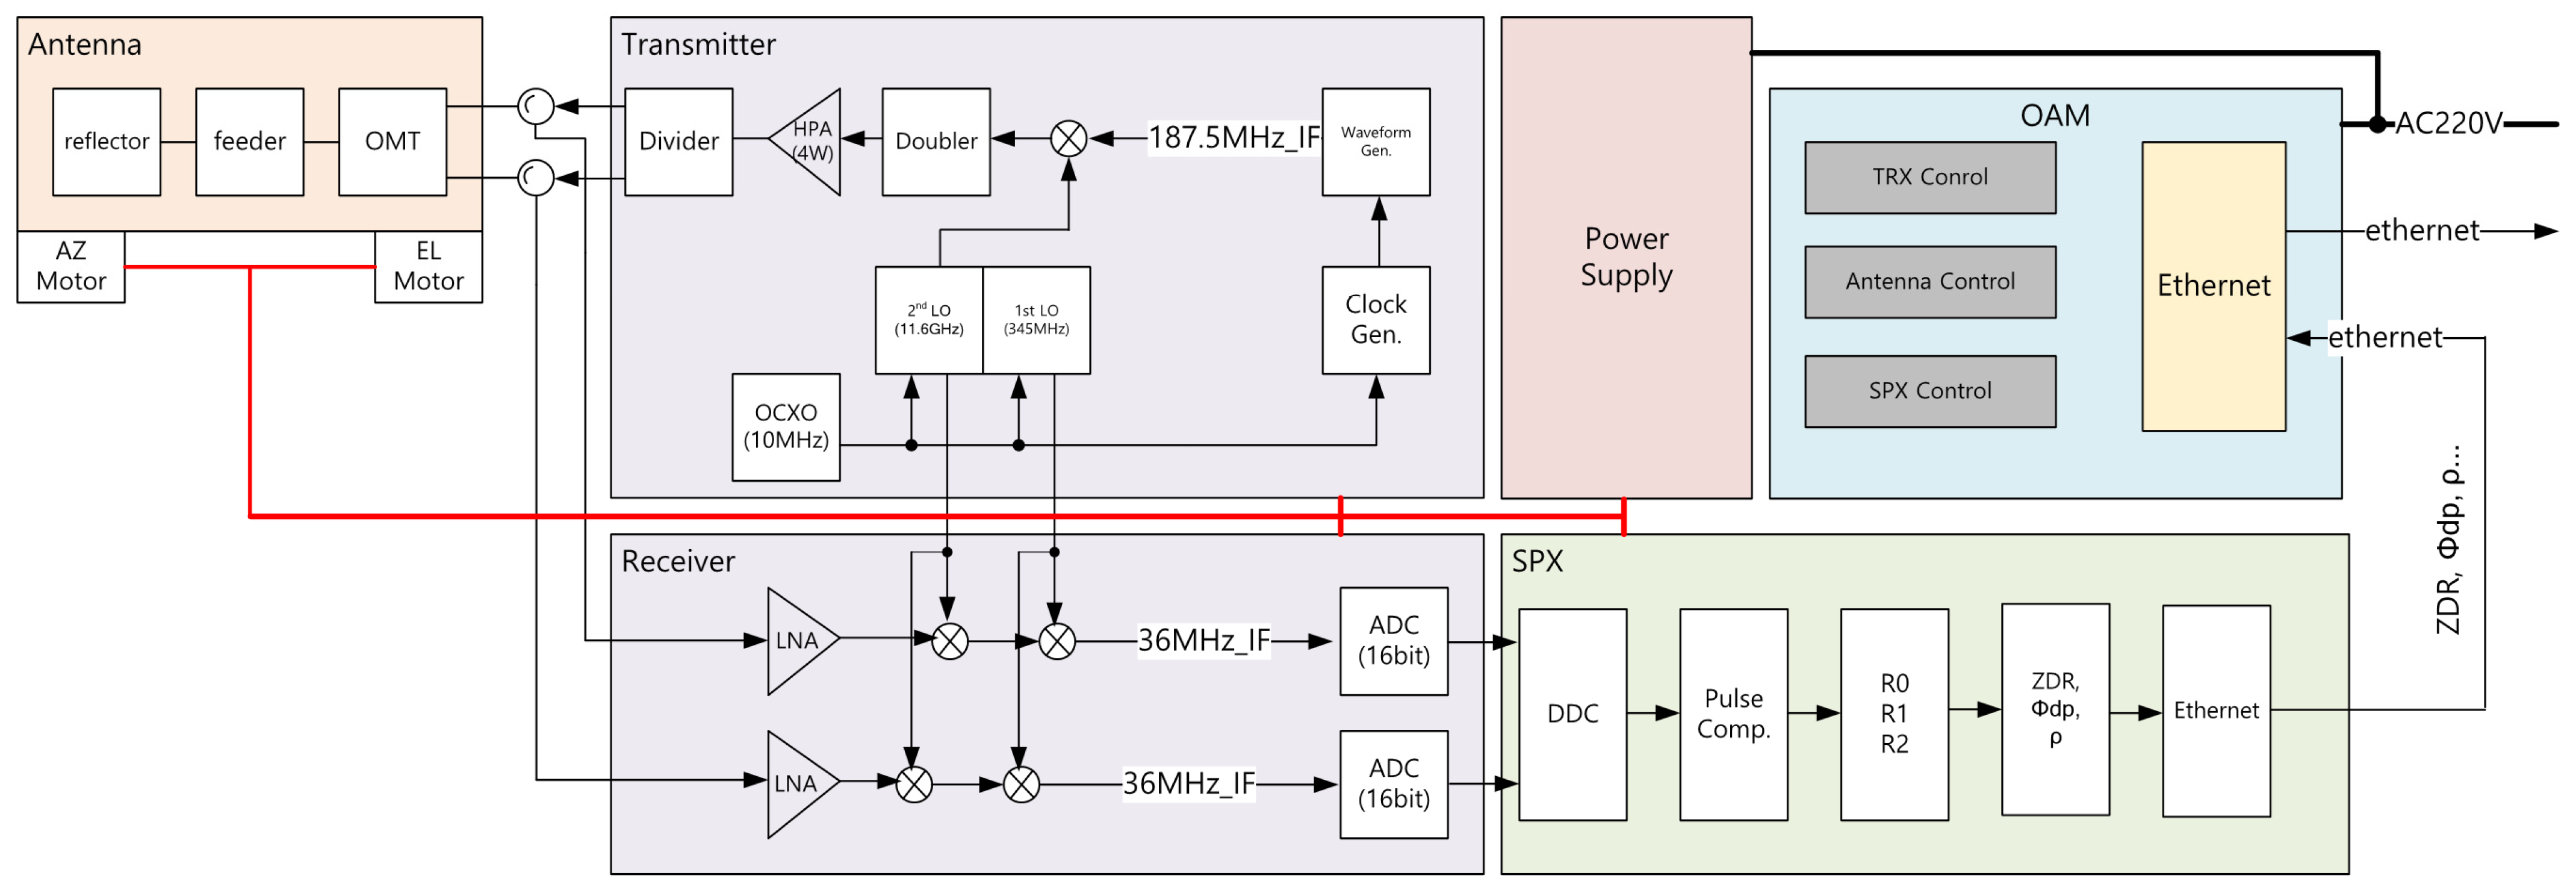
2. EWRG System Design and Implementation
2.1. Transceiver
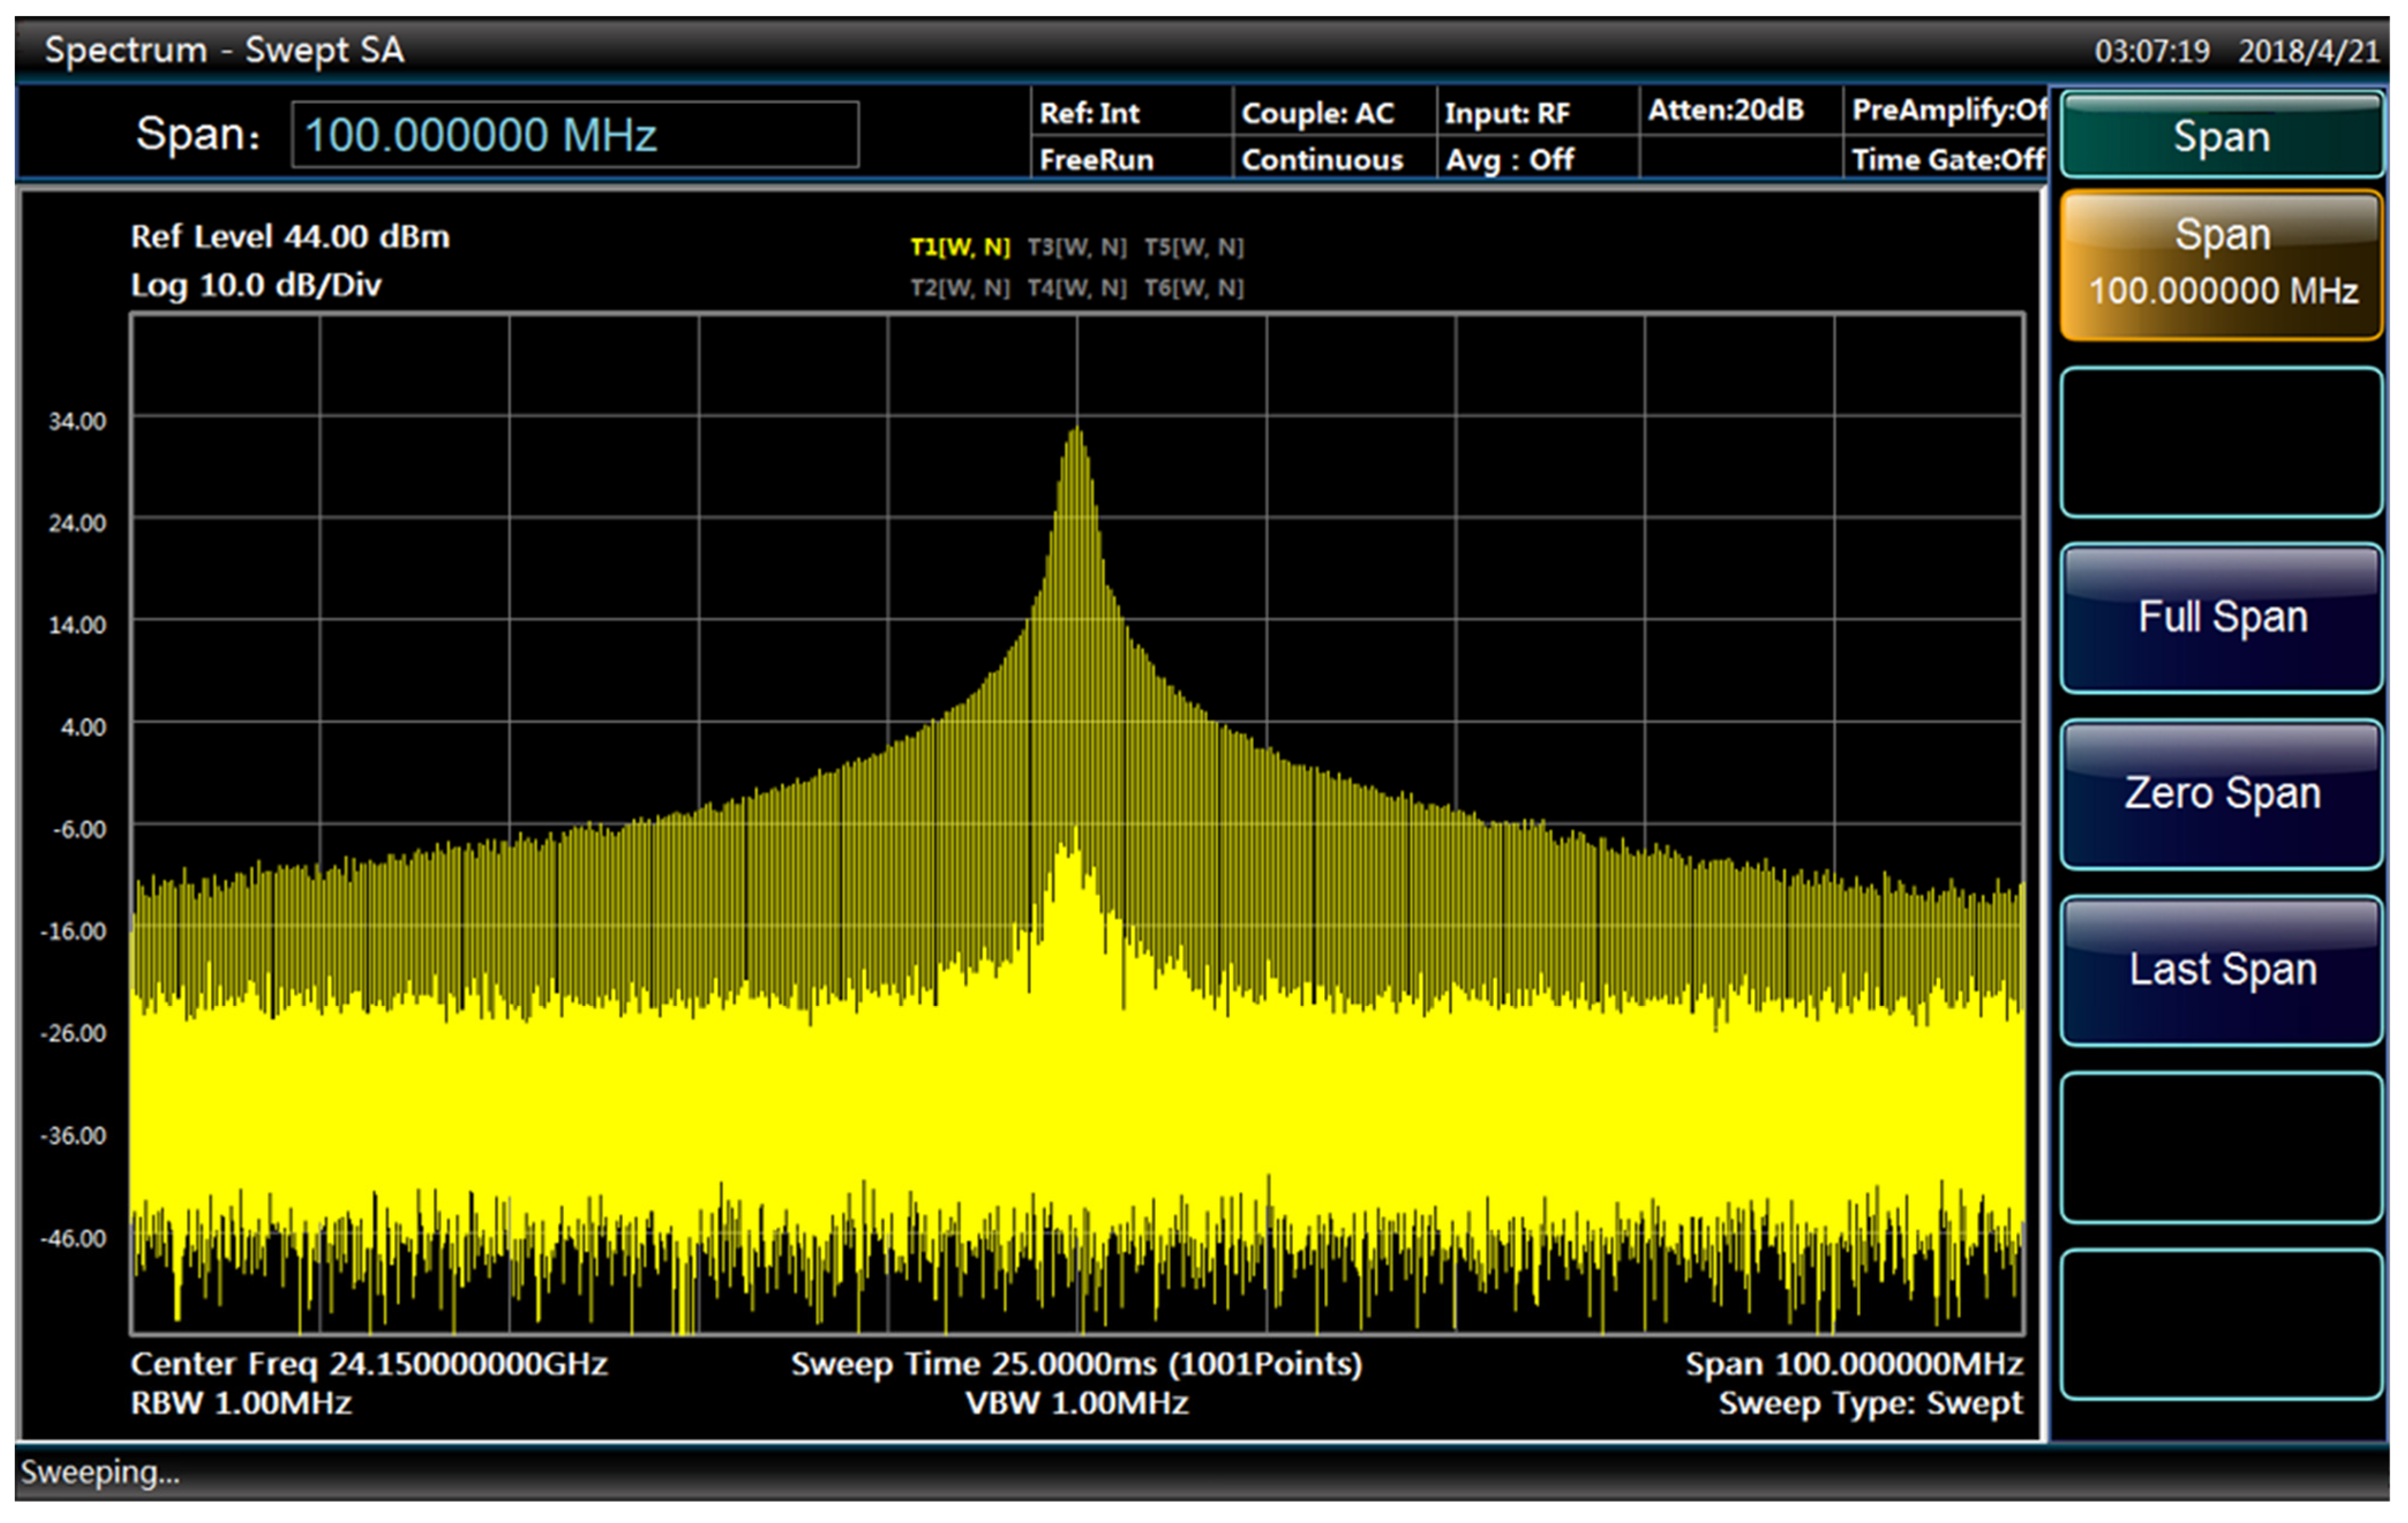
2.1.1. LFM Waveform
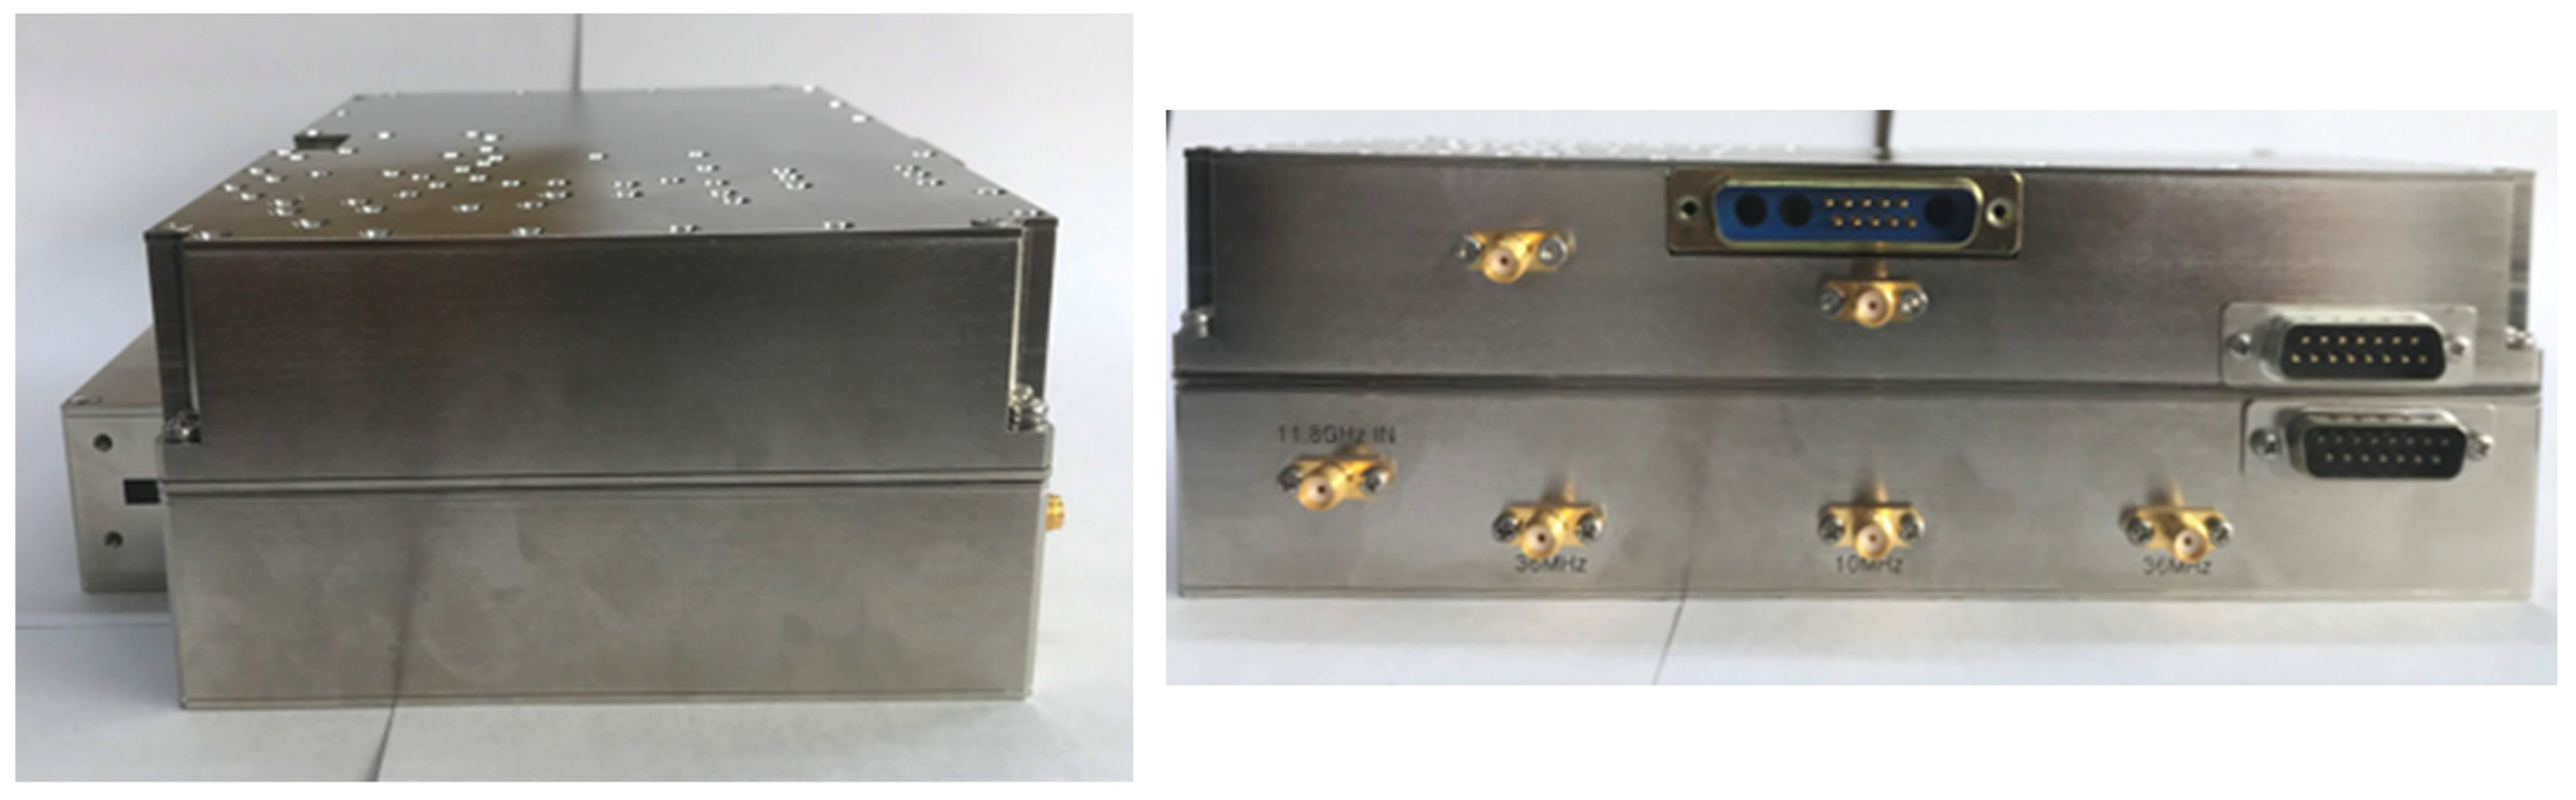
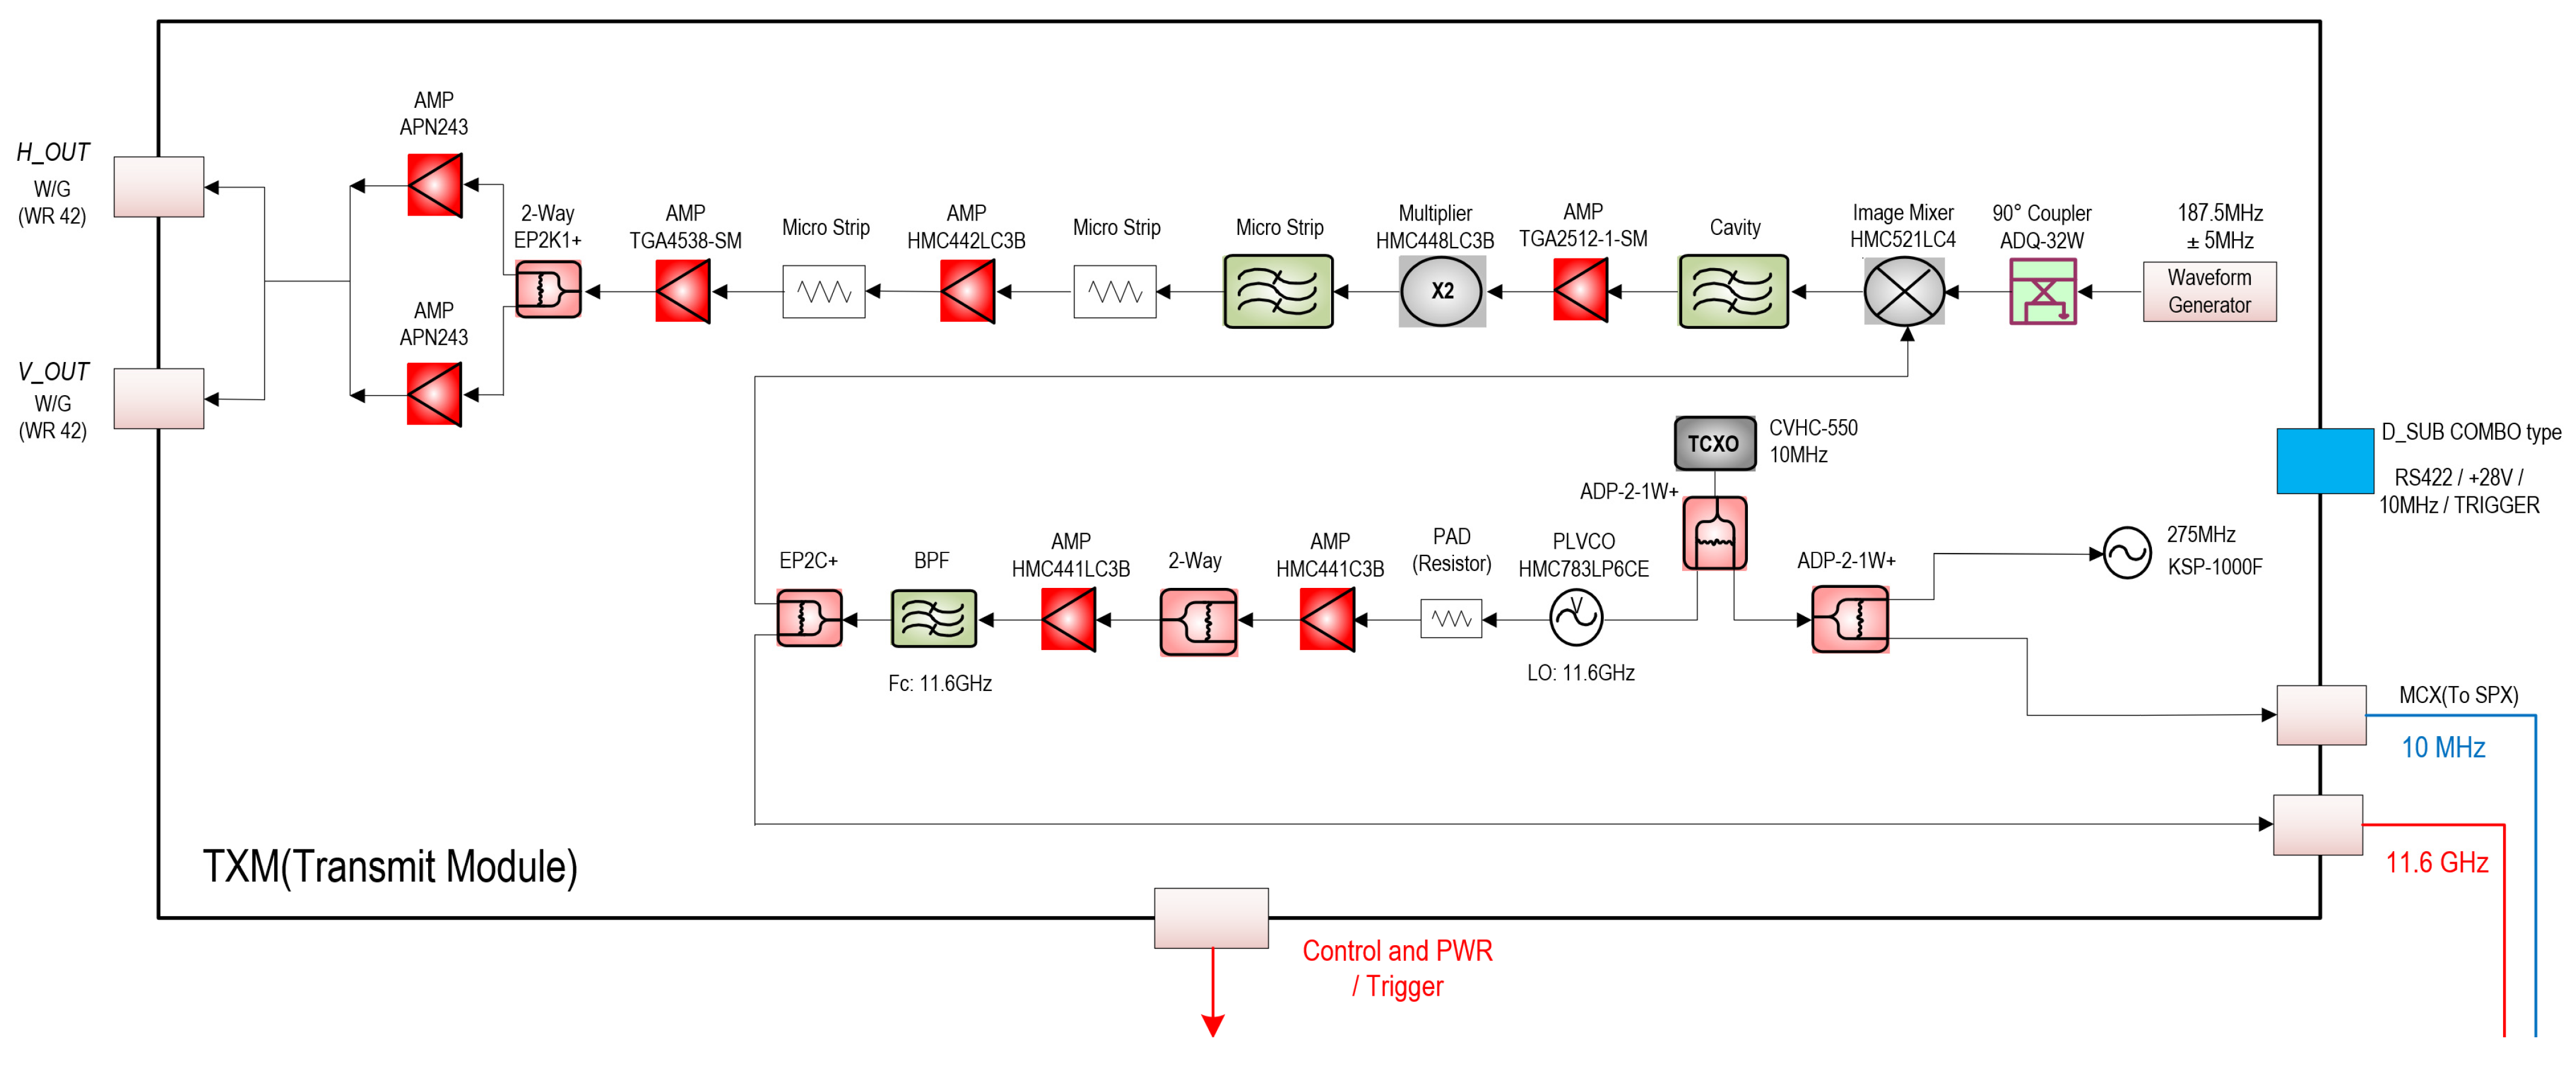
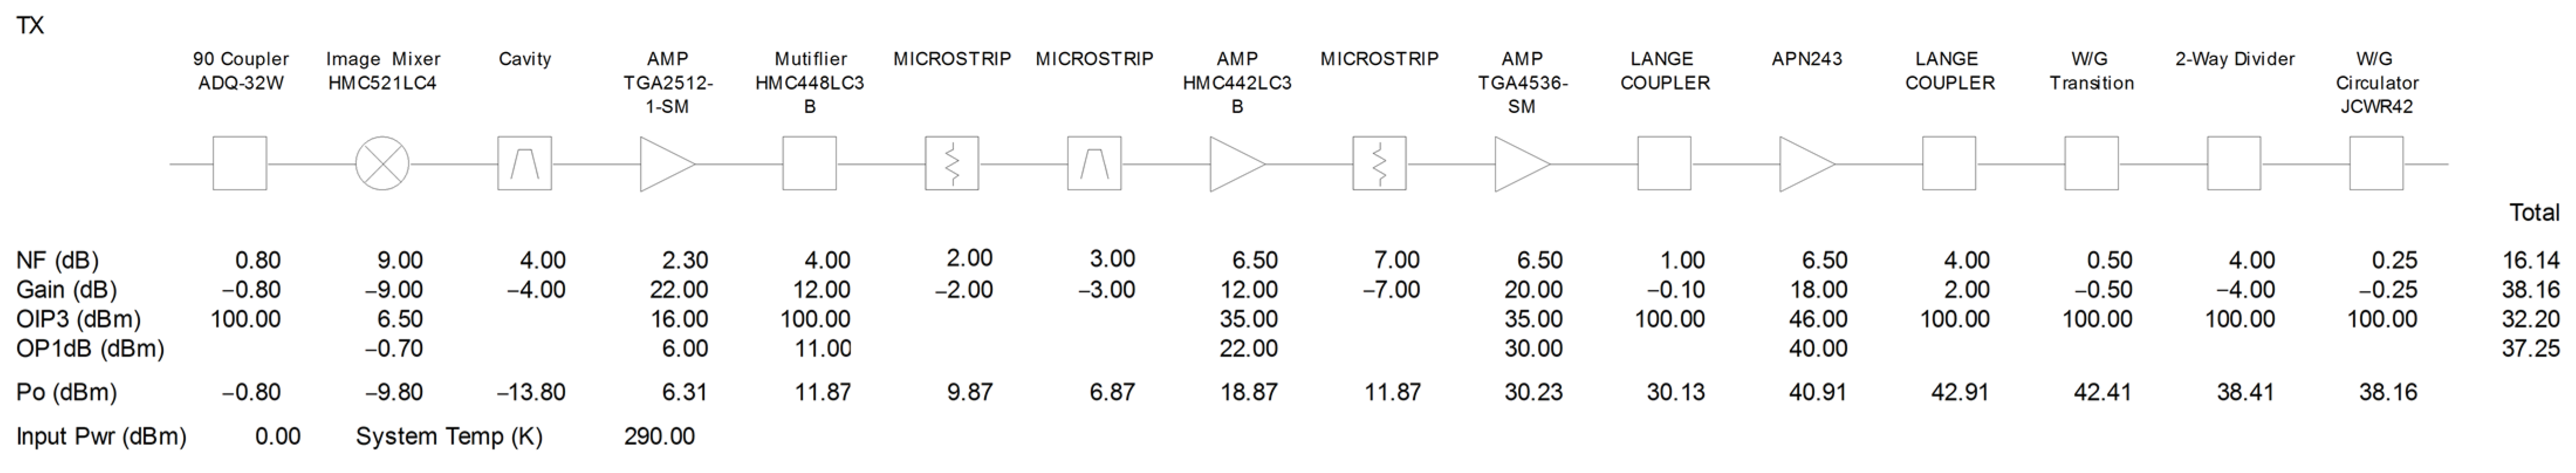
2.1.2. Transmitter
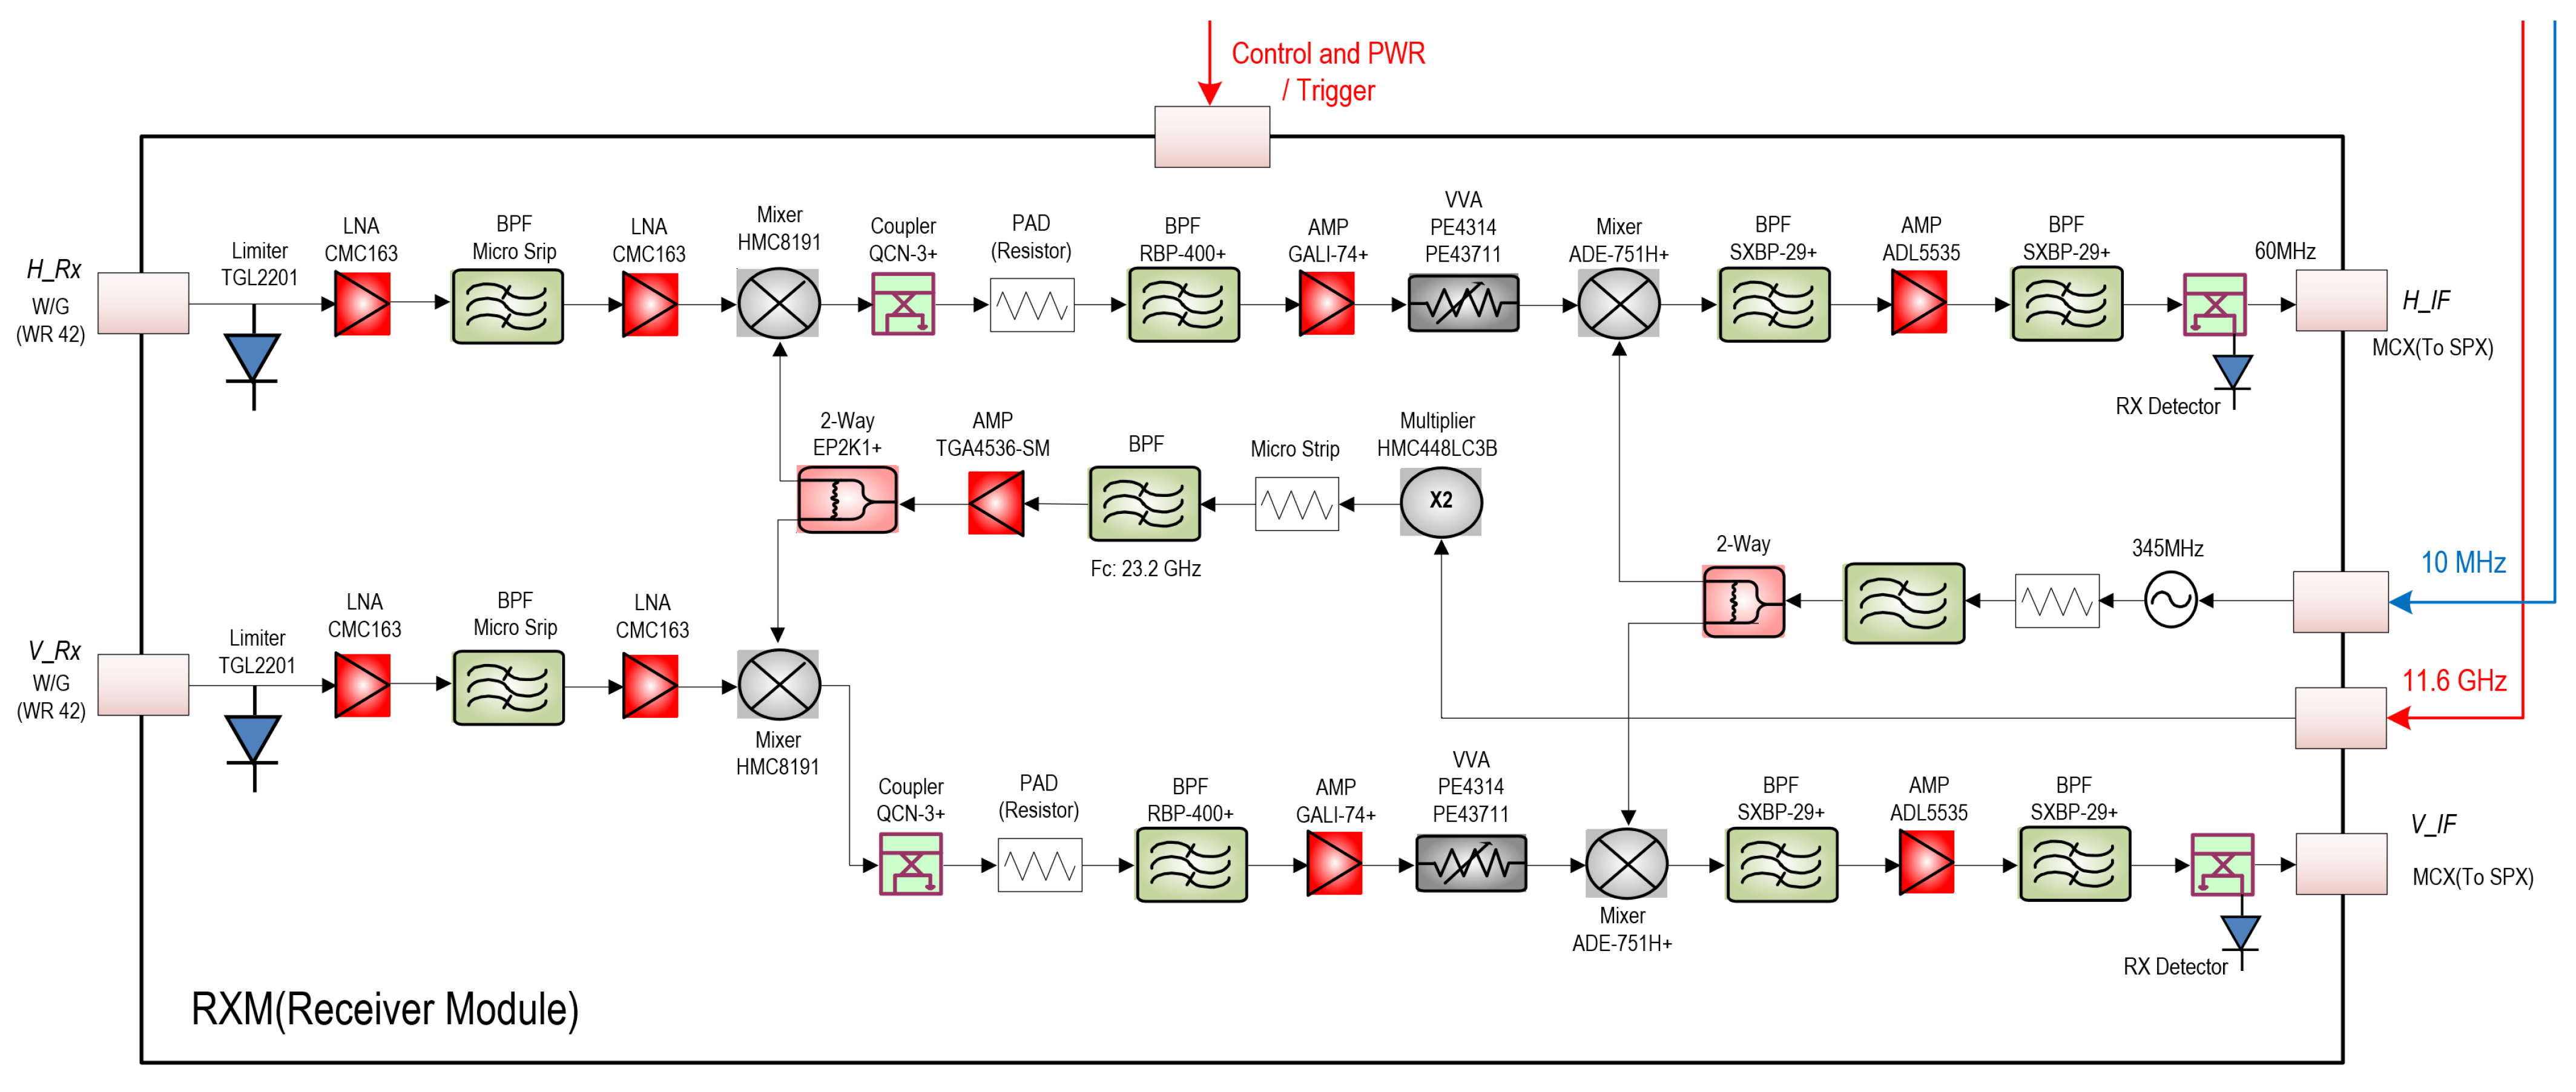
2.1.3. Receiver
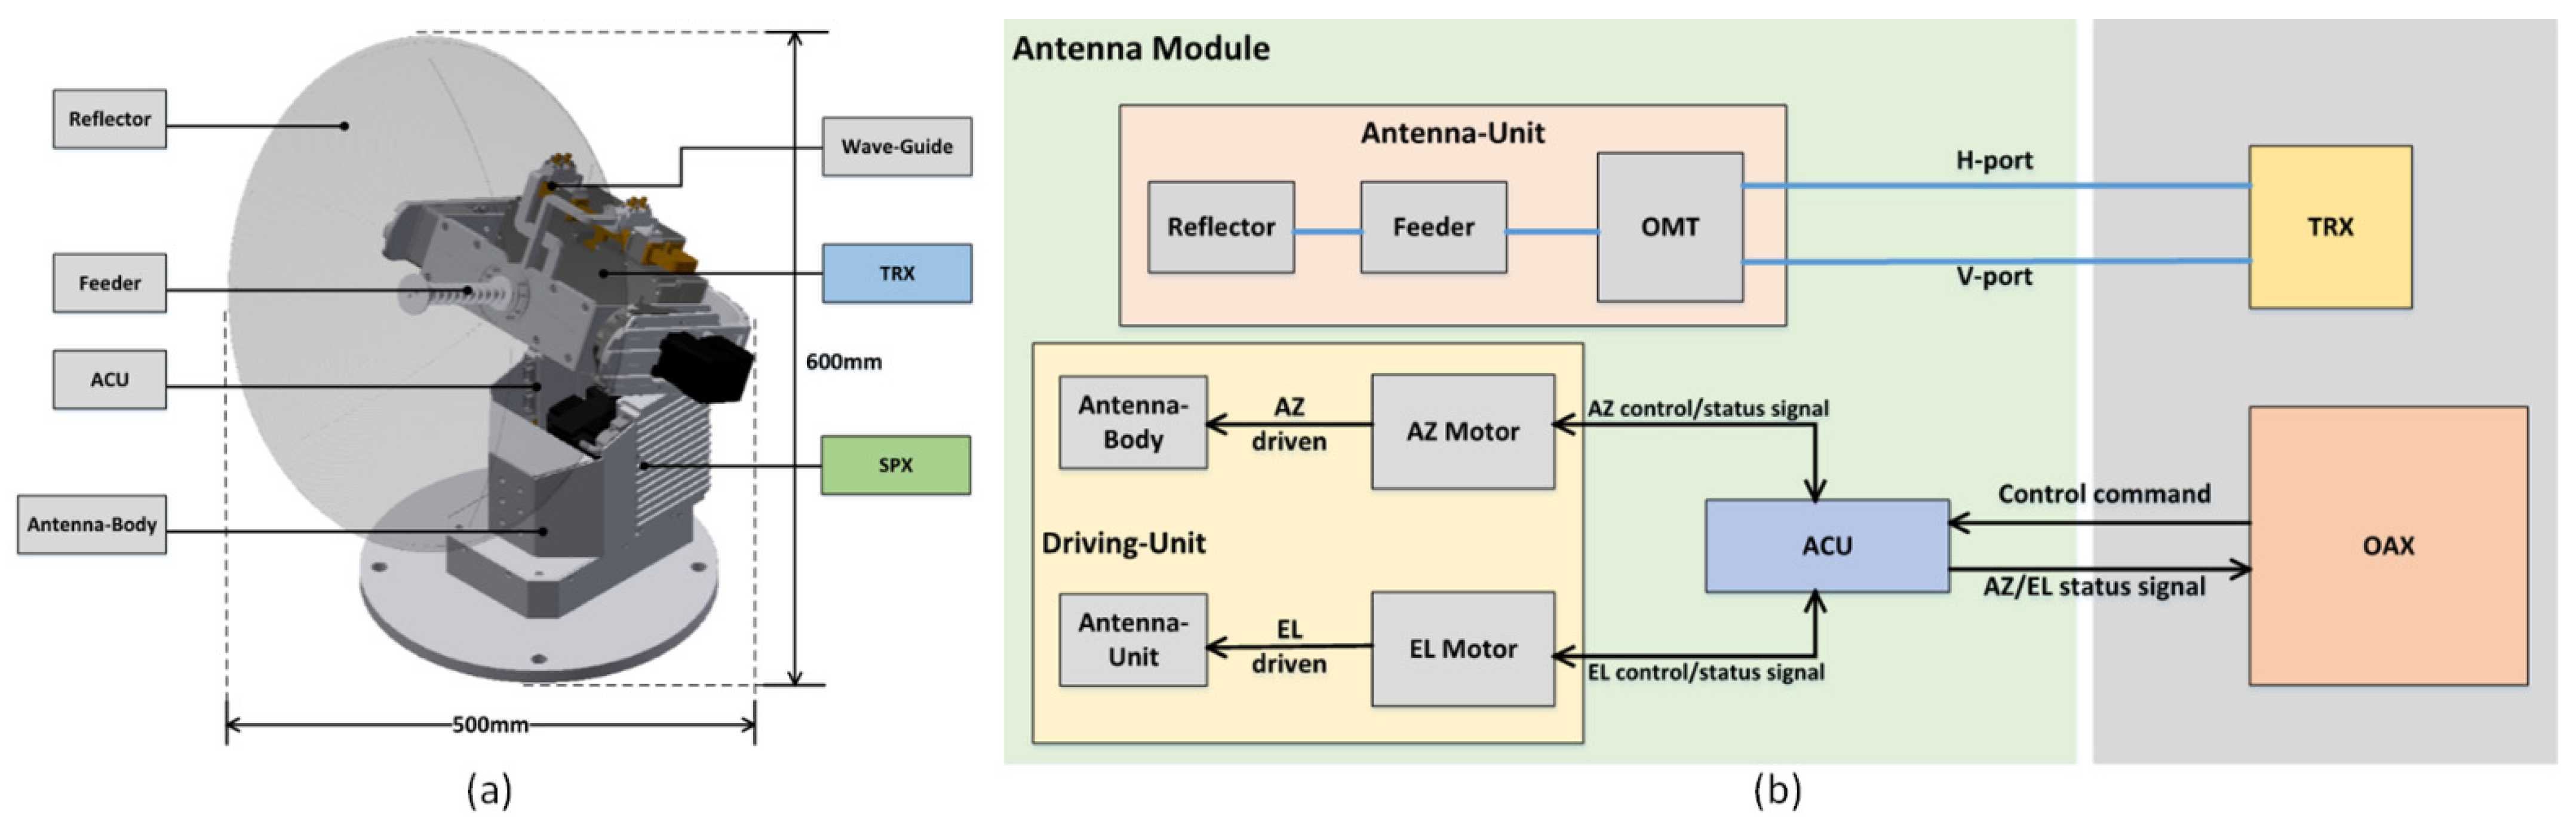
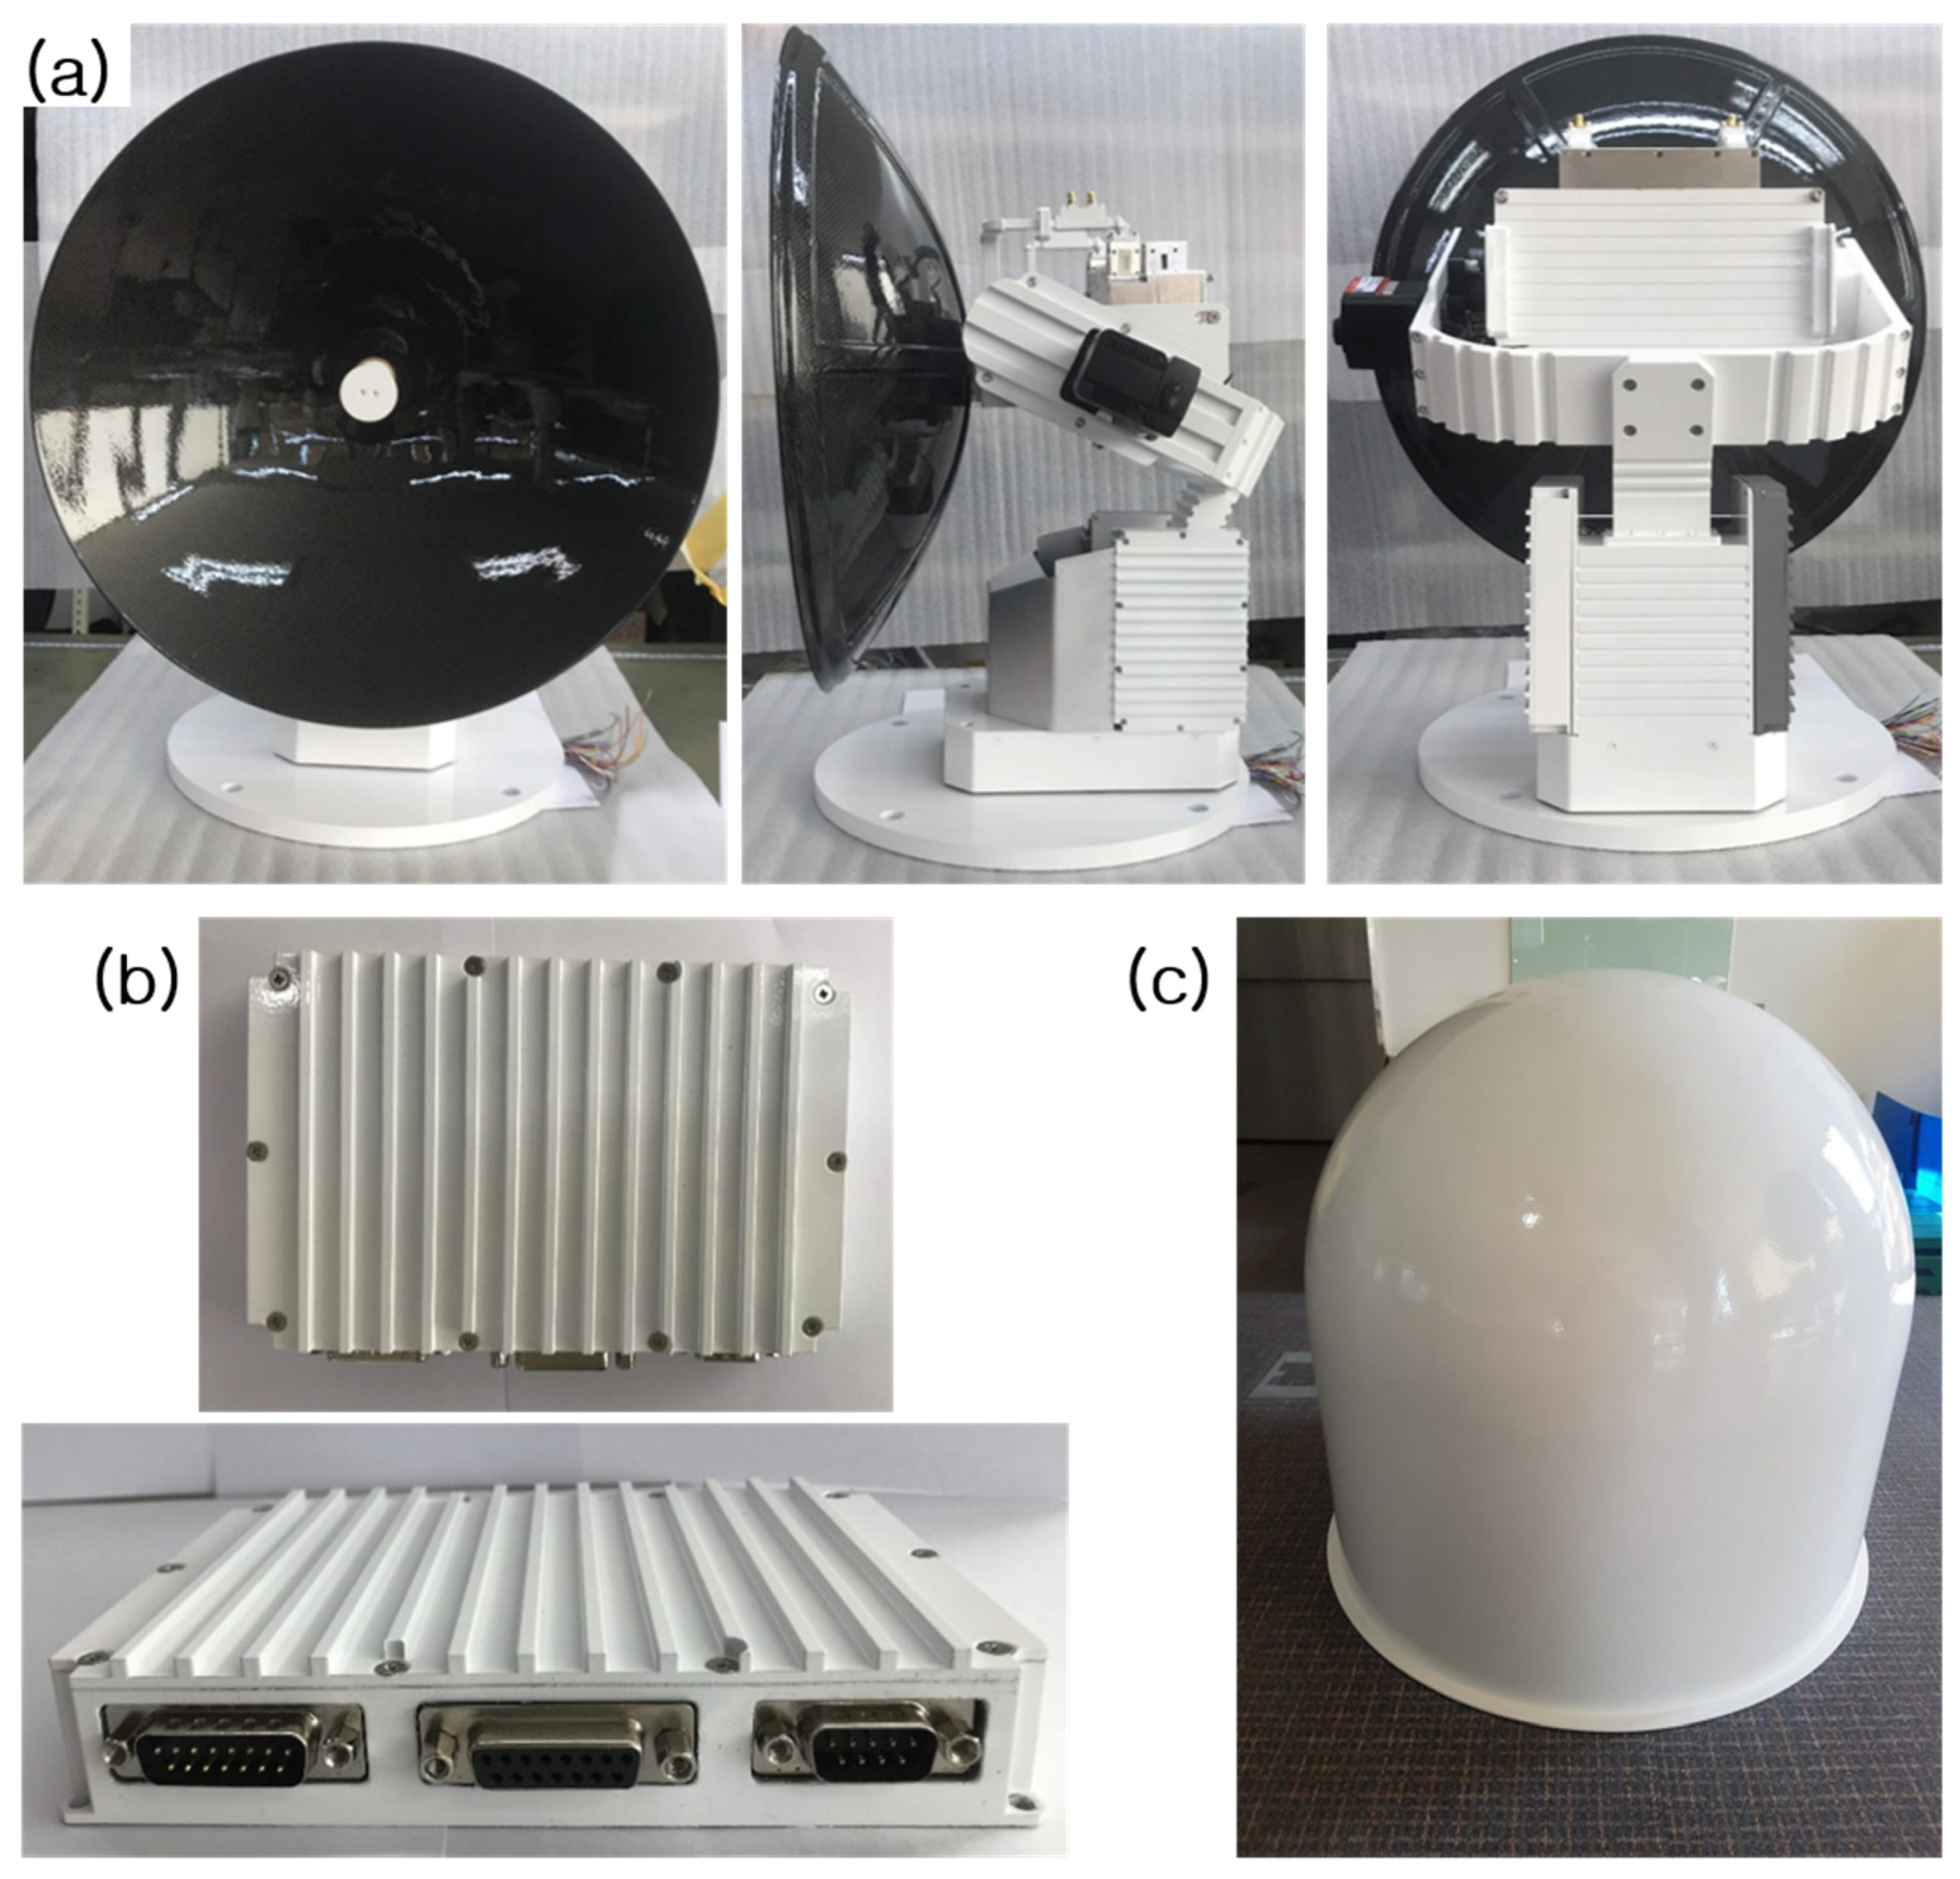
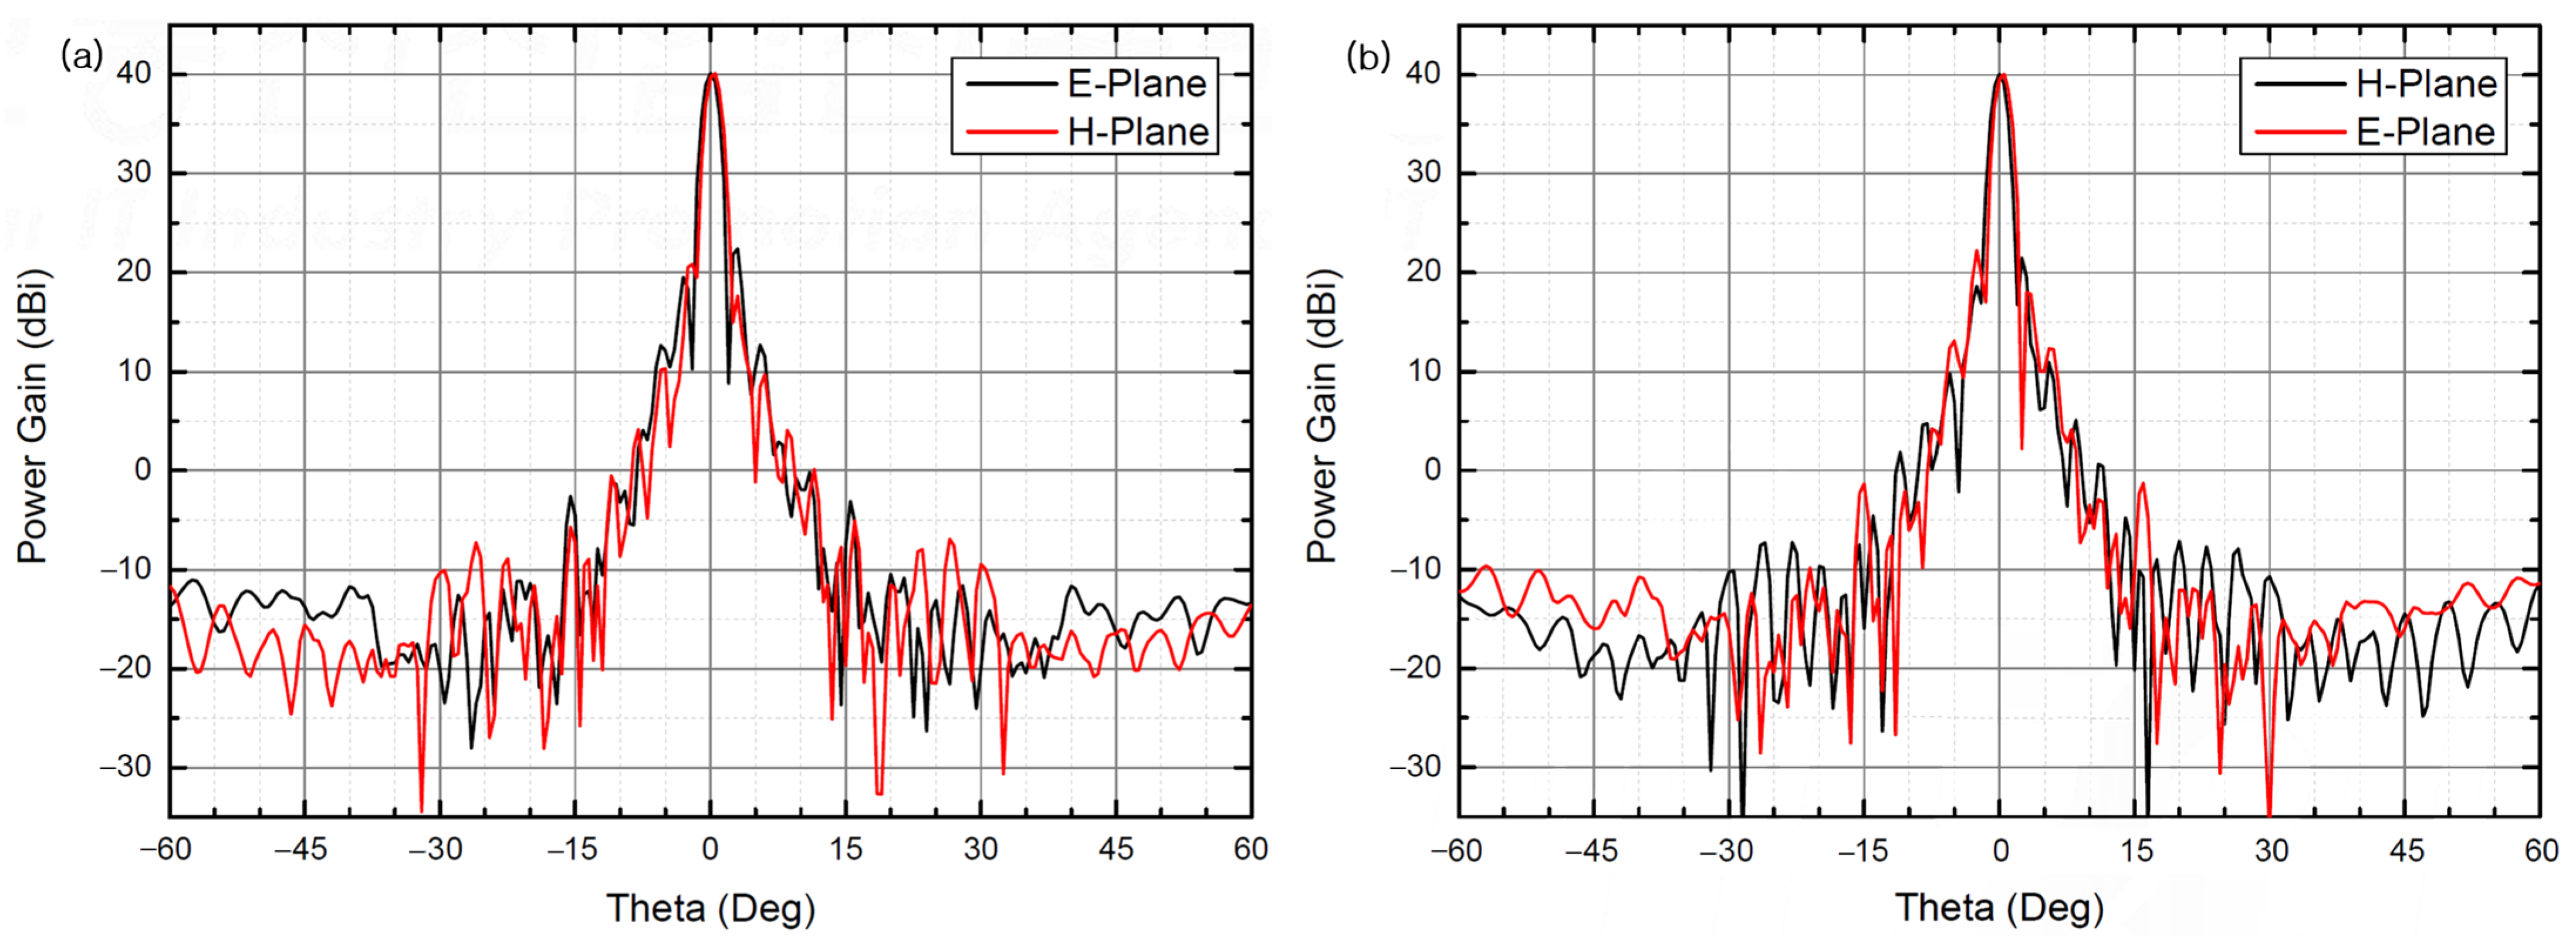
2.2. Antenna and Radome
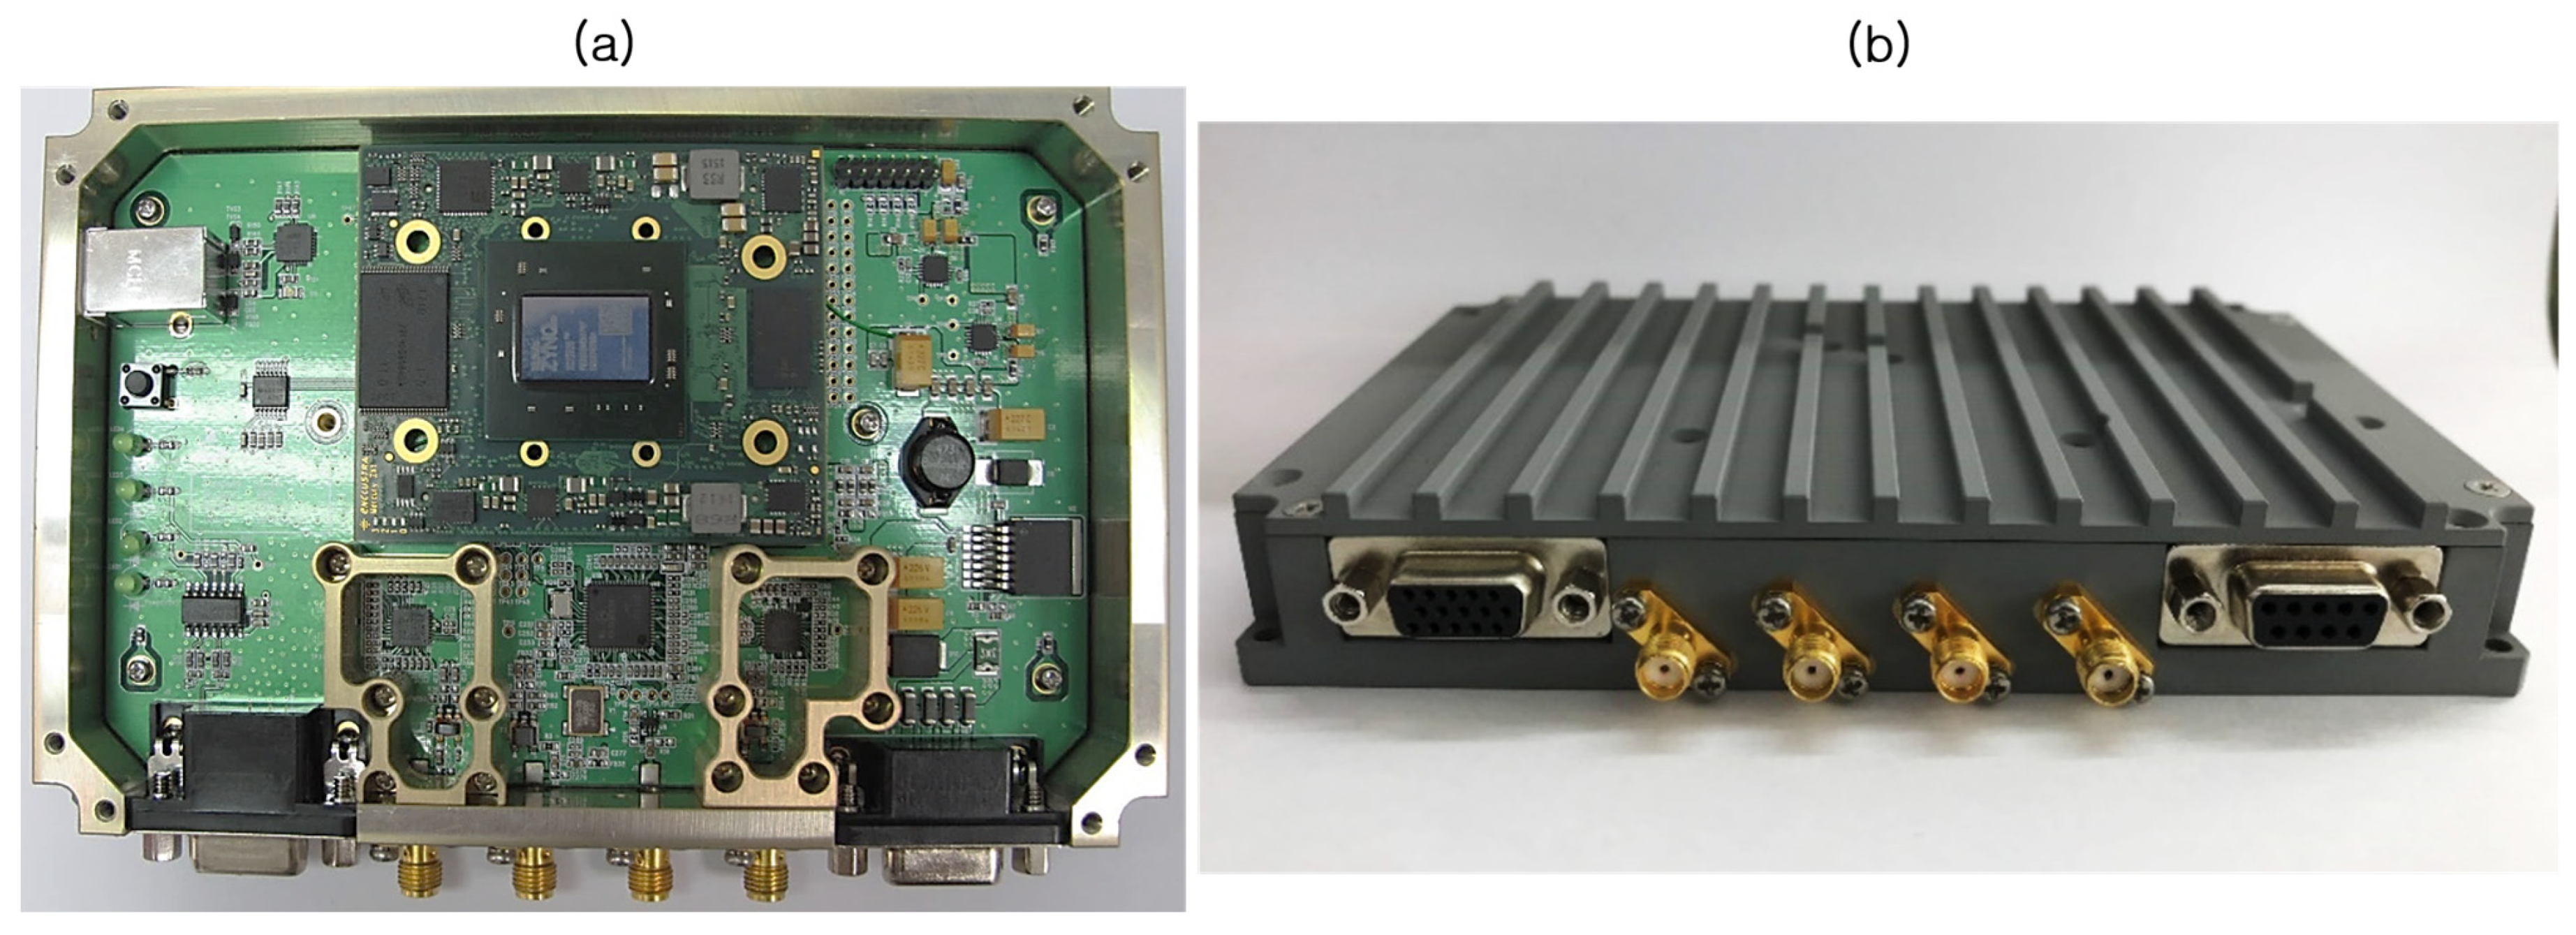
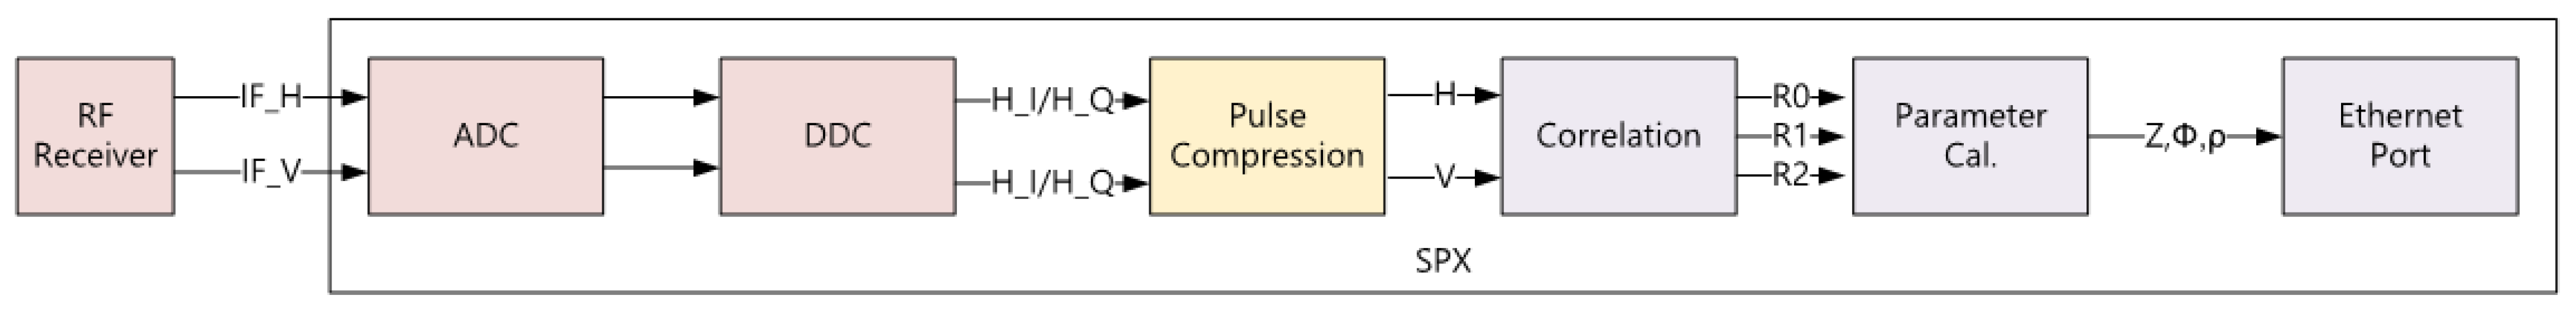
3. EWRG Signal Processor
3.1. Signal Processing Procedure
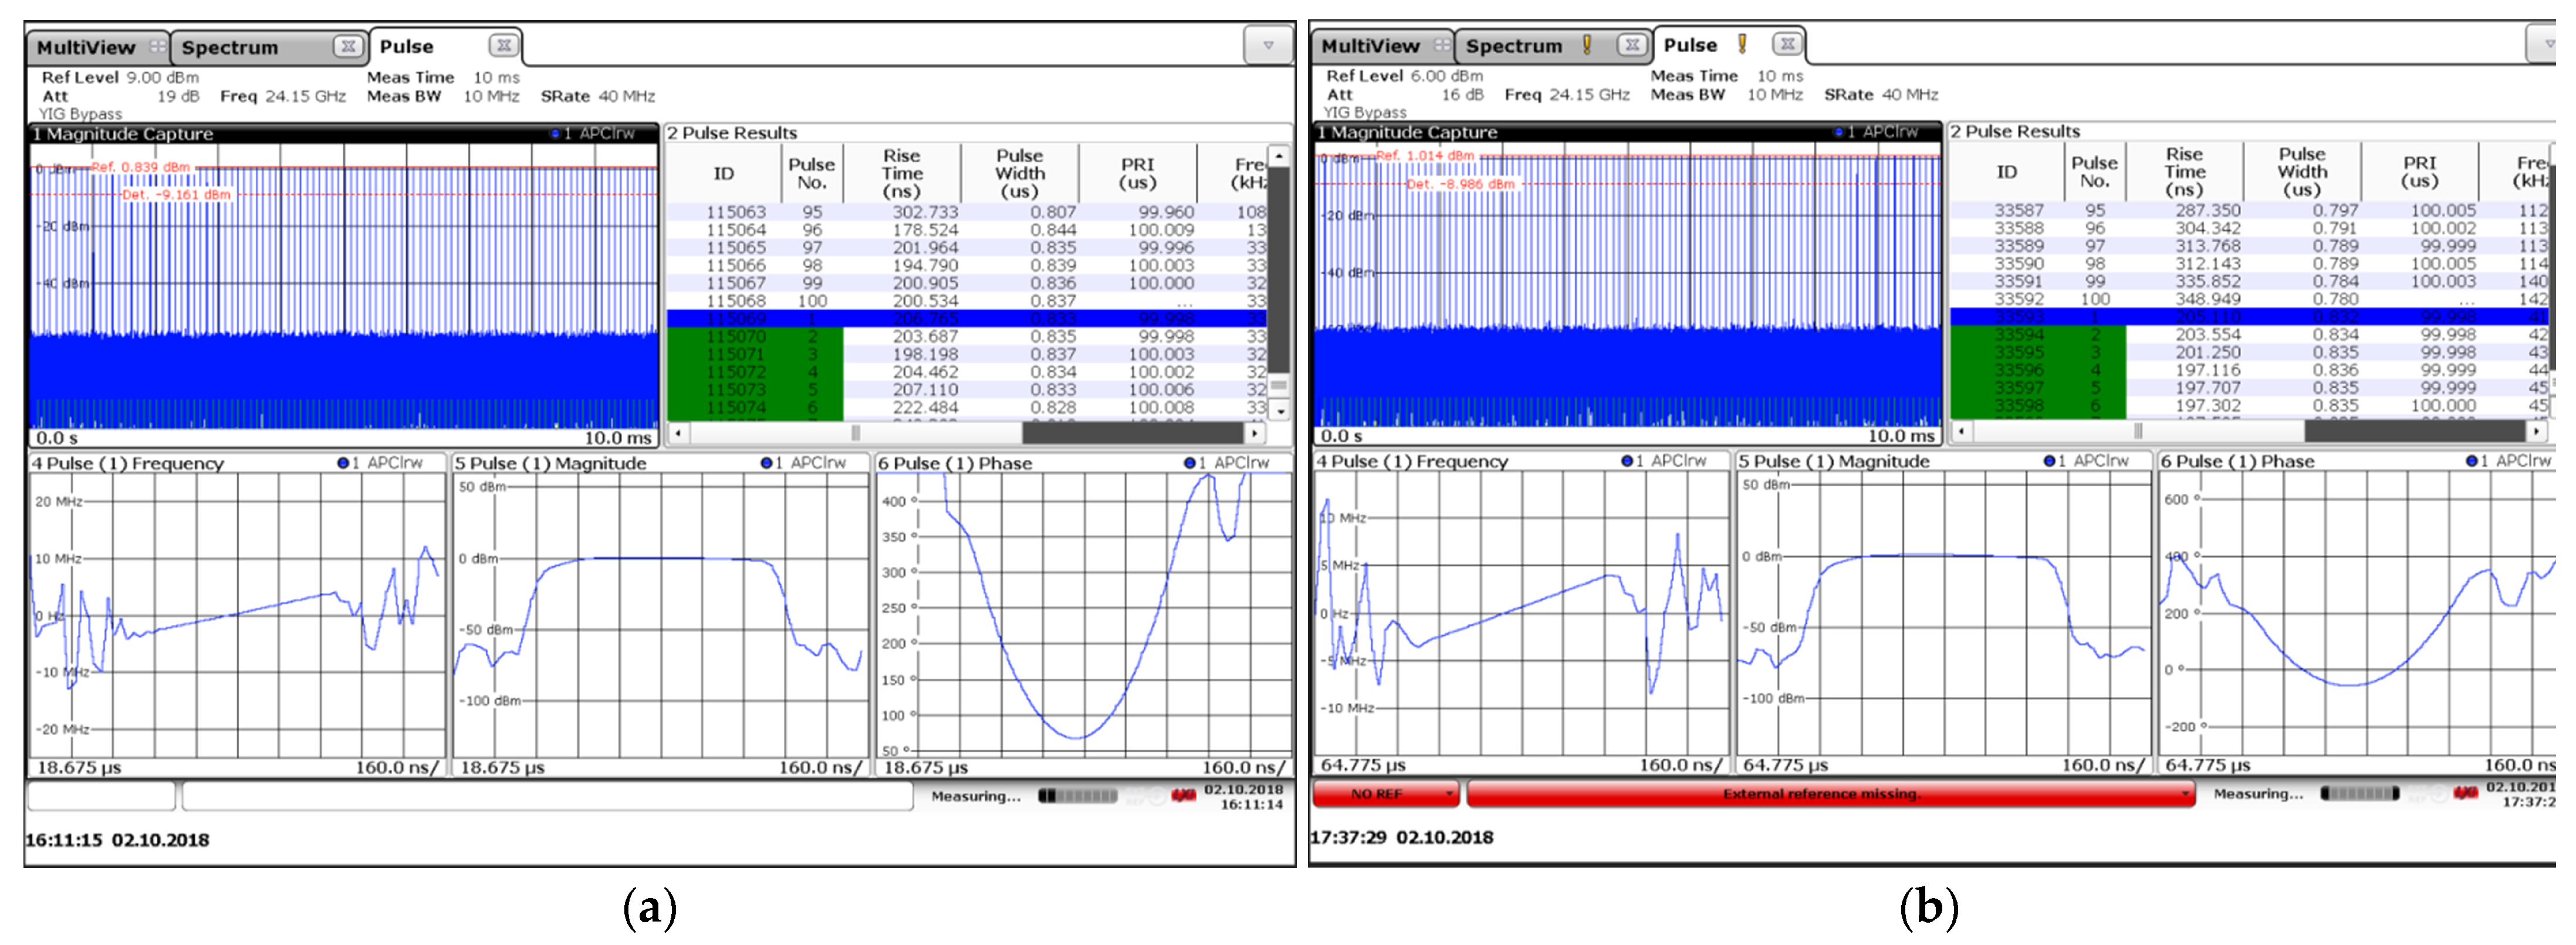
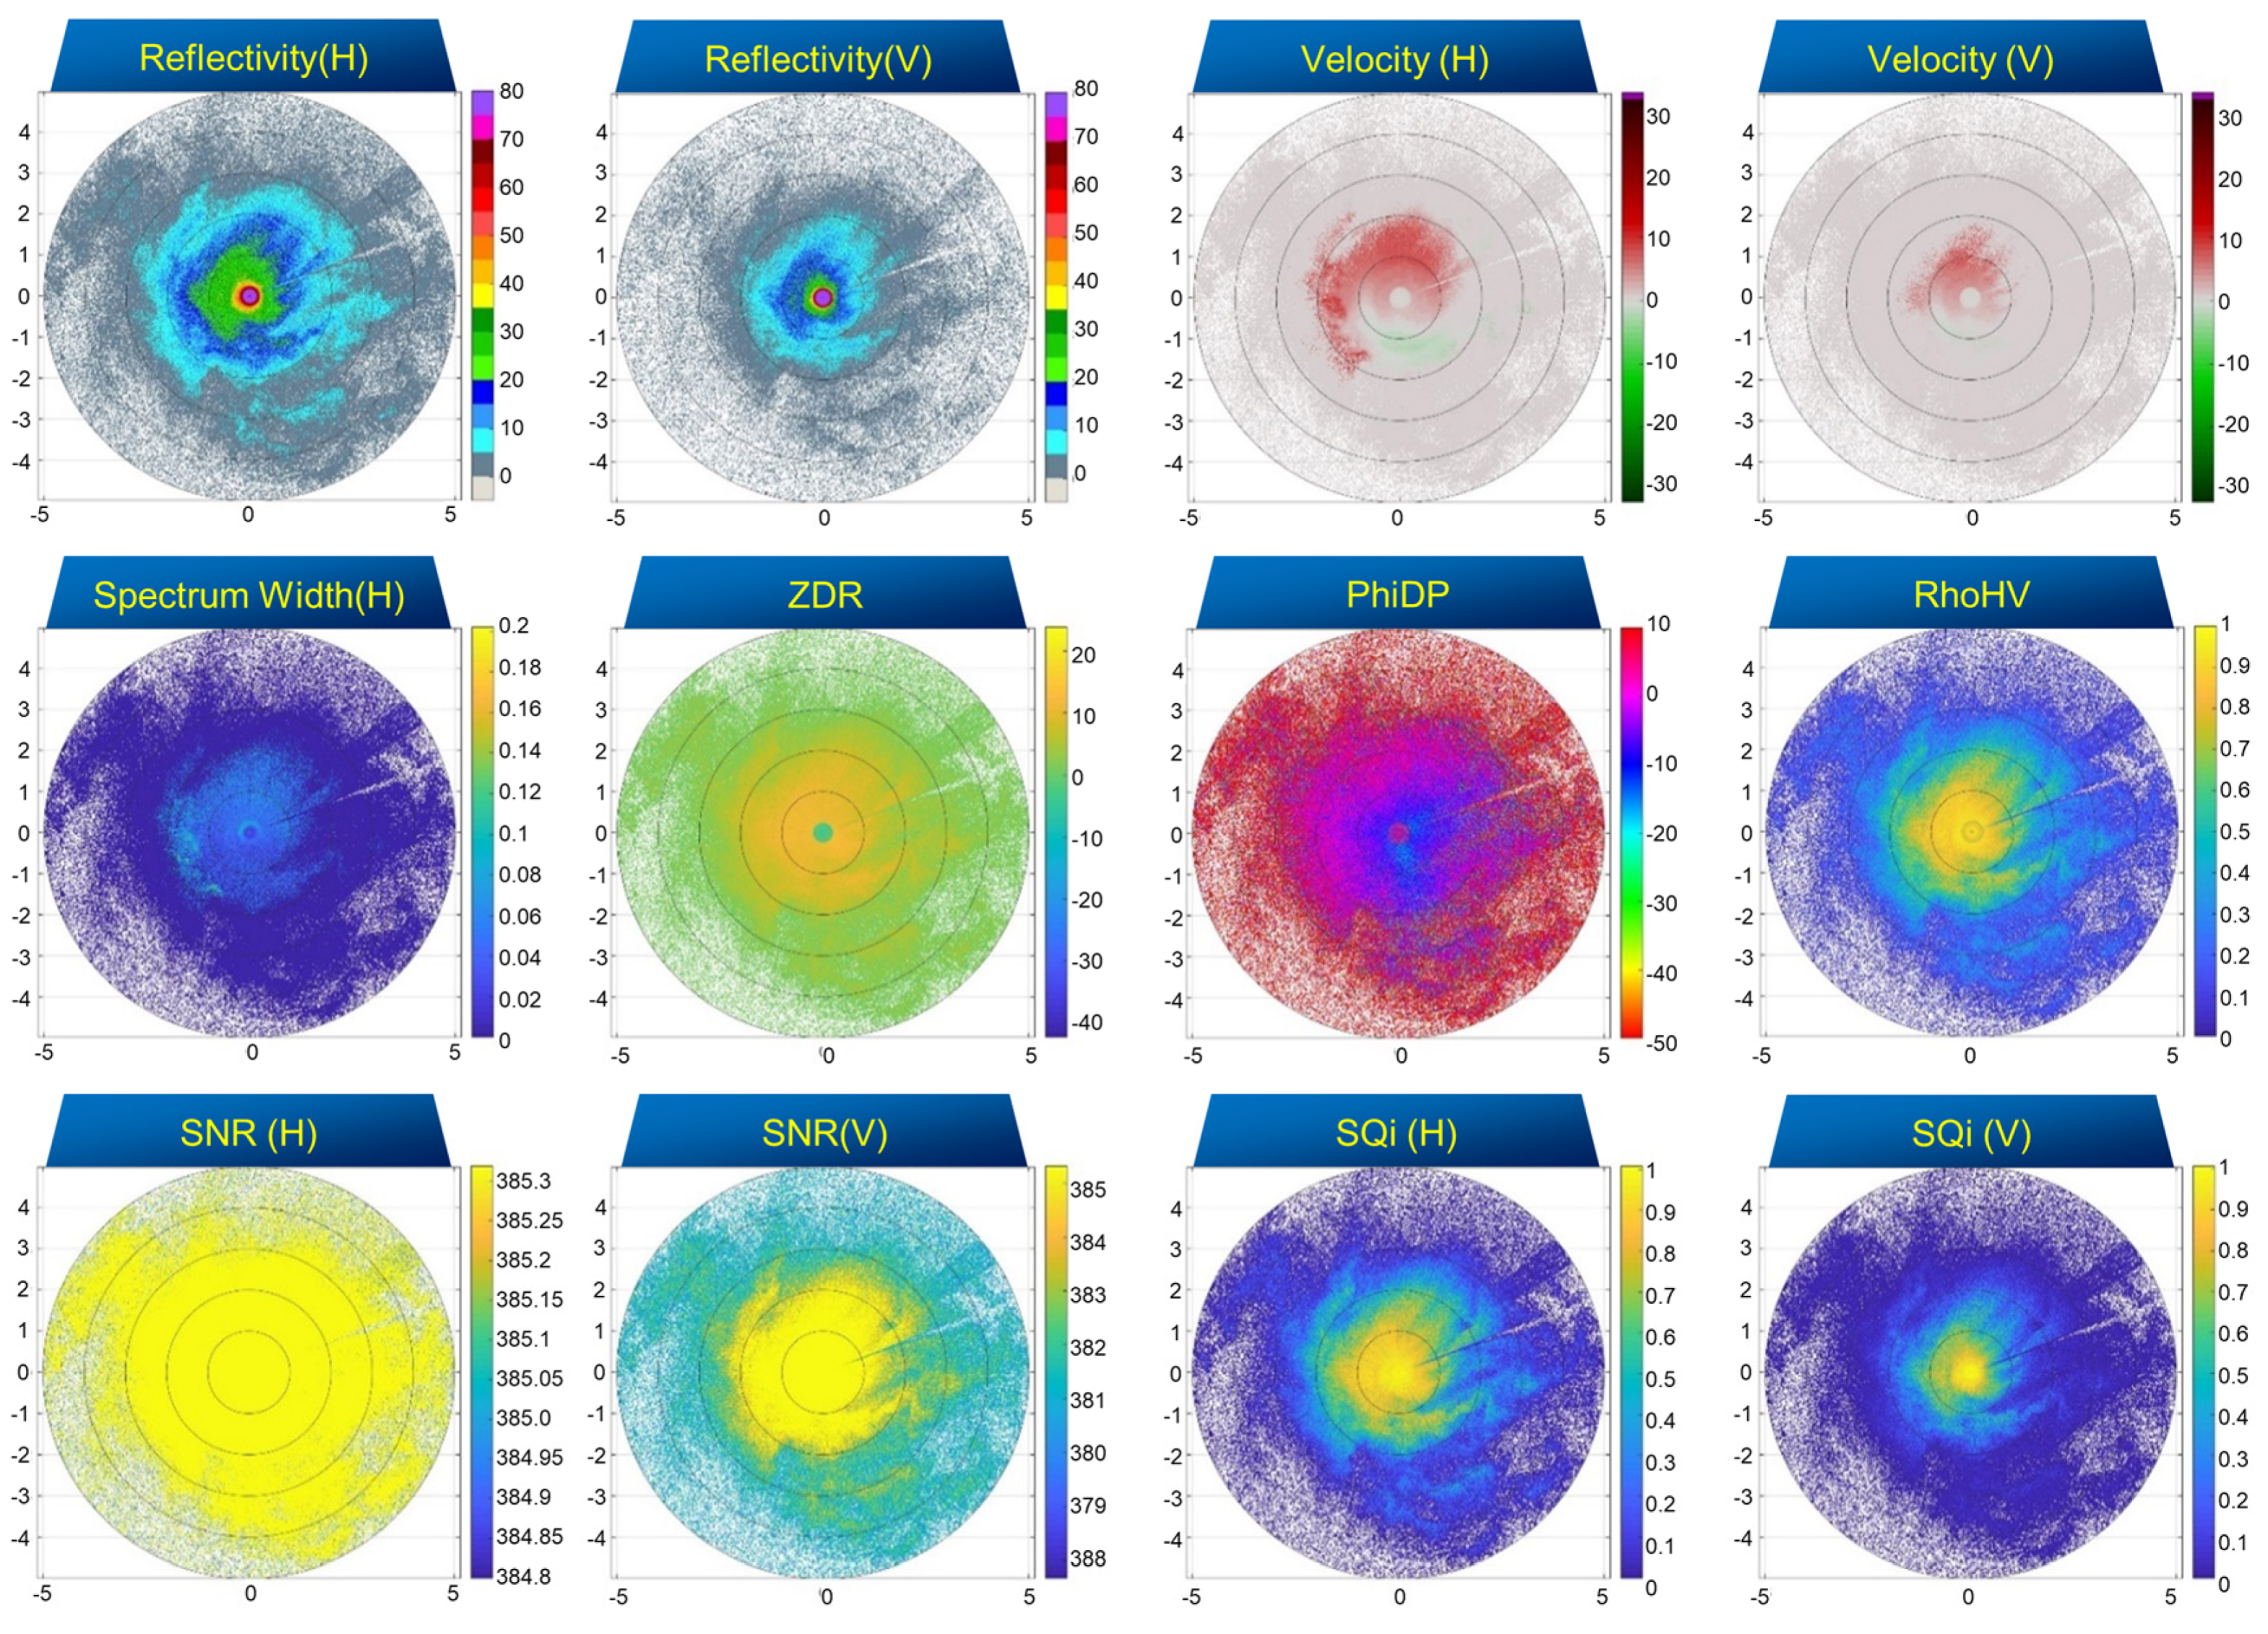
3.2. Preliminary Performance Evaluation
4. Summary and Conclusions
Author Contributions
Funding
Data Availability Statement
Conflicts of Interest
References
- Sandsborg, J. Local rainfall variations over small, flat, cultivated areas. Tellus 1969, 21, 673–684. [Google Scholar] [CrossRef]
- Jackson, I.J. Tropical rainfall variations over a small area. J. Hydrol. 1969, 8, 99–110. [Google Scholar] [CrossRef]
- Sevruk, B. Adjustment of tipping-bucket precipitation gauge. Atmos. Res. 1996, 42, 237–246. [Google Scholar] [CrossRef]
- Groisman, P.Y.; Legates, D.R. The accuracy of United States precipitation data. Bull. Am. Meteorol. Soc. 1994, 75, 215–227. [Google Scholar] [CrossRef]
- Soren, T. Weather Radar Rainfall Data in Urban Hydrology. Hydrol. Earth Syst. Sci. 2017, 21, 1359–1380. [Google Scholar]
- Hunter, S.M. WSR-88D Radar rainfall estimation: Capabilities, limitations and potential improvements. Natl. Weather Dig. 1996, 20, 26–36. [Google Scholar]
- Jang, B.J.; Kim, W.; Lim, S.; Choi, J.H. Analysis of Rainfall Cases and Their Observed Signal from Prototype of Electromagnetic Wave Rain Gauge. Inst. Electron. Inf. Eng. Conf. 2018, 41, 492–493. [Google Scholar]
- Peters, G.; Fischer, B.; Andersson, T. Rain observations with a vertically looking Micro Rain Radar (MRR). Boreal Environ. Res. 2002, 7, 353–362. [Google Scholar]
- Choi, J.H.; Lee, B.K.; Park, H.S.; Park, J.M.; Lim, S. Design of FPGA-based Signal Processing of EWRG for Localized Heavy Rainfall Observation. J. Korea Inst. Inf. Commun. Eng. 2020, 24, 1215–1223. [Google Scholar]
- Chong, M.K.; Na, H.G. A Development of the X-Band 63 Watt Pulsed SSPA for Radar. J. Electromagn. Eng. Sci. 2011, 22, 380–388. [Google Scholar]
- Frank, G. Status and Future Strategy for Advanced High Power Microwave Sources for Accelerators. In Proceedings of the 9th International Particle Accelerator Conference, Vancouver, BC, Canada, 29 April–4 May 2018. [Google Scholar]
- Kang, D.M.; Min, B.G.; Lee, J.M.; Yoon, H.S.; Kim, S.I.; Ahn, H.K.; Kim, D.Y.; Kim, H.C.; Lim, J.W.; Nam, E.S. 0.25 μm AlGaN/GaN HEMT Devices and 9 GHz Power Amplifier. J. Electromagn. Eng. Sci. 2016, 27, 76–79. [Google Scholar] [CrossRef]
- Kwon, G.W.; Koh, J.H. Modified LFM Signal in Radar Application. In Proceedings of the KICS Summer Conference, Jeju, Korea, 19–21 June 2013; pp. 762–763. [Google Scholar]
- Yoon, J.H.; Yoo, S.O.; Lee, D.J.; Ye, S.H. LFM Radar Implemented in SDR Architecture. J. Electromagn. Eng. Sci. 2018, 29, 308–315. [Google Scholar] [CrossRef]
- Ha, C.H.; Kwon, B.J.; Lee, M.G. Radar Signal Processor Design Using FPGA. J. KIMS Technol. 2017, 20, 482–490. [Google Scholar]
- Richards, M.A.; Scheer, J.A.; Holm, W.A. Principles of Modern Radar: Basic Principles; SciTech Publishing: Edition, NJ, USA, 2010. [Google Scholar]
- Rawat, C.D.; Sarate, A.D. High resolution low power radar pulse compression techniques. Int. J. Adv. Res. Electr. Electron. Instrum. Eng. 2014, 3, 8928–8935. [Google Scholar]
- Kumar, A.; Nidhi. Radar pulse compression technique for linear frequency modulated pulses. Int. J. Eng. Tech. Res. 2015, 3, 33–35. [Google Scholar]
- Tsukamoto, N.; Yamauchi, H.; Okumura, H.; Umehara, A.; Kajiwara, Y. JMA’s C-band dual-polarization Doppler weather radars with SSPAs. In Proceedings of the WMO Technical Conference on Meteorological and Environmental Instruments and Methods of Observation 2016, Madrid, Spain, 27–30 September 2016. [Google Scholar]
- Choi, J.H.; Lim, S.H.; Park, H.S.; Lee, B.K. Design and Implementation K-Band EWRG Transceiver for High-Resolution Rainfall Observation. J. Korea Inst. Inf. Commun. Eng. 2020, 24, 646–654. [Google Scholar]
- Doviak, R.; Zrnic, D.S. Doppler Radar and Weather Observations, 2nd ed.; Academic Press: San Diego, CA, USA, 1993. [Google Scholar]
- Choi, J.; Yoo, C.; Lim, S.; Han, M.; Lee, B. Quality Control Algorithm of Rainfall Radar Image for Uncertainty of Rainfall. J. Korea Multimed. Soc. 2017, 21, 1874–1889. [Google Scholar]


| Specification | |
|---|---|
| Operating frequency (GHz) | 24.15 |
| Transmission power (W) | 4 (horizontal/vertical) |
| Polarization | Simultaneous dual polarization (H/V) |
| Antenna shape | Parabolic reflector type |
| Antenna diameter (cm) | 50 (carbon) |
| Beam width (deg.) | 1.6 (H/V) |
| Gain (dBi) | above 40 |
| Driving range (deg.) | Azimuth: 0~360; Elevation: −2~+92 |
| Driving speed (RPM) | Azimuth: 6; Elevation: 2 |
| Signal form | I/Q demodulation |
| Effective observation range (m) | 150~3000 |
| Waveform | LFM Pulse |
| Pulse width (μs) | 0.2, 1 |
| PRF (KHz) | 10 |
| Distance resolution (m) | 30 |
| Minimum Detectable Signal (dBm) | −90 |
| ADC resolution (bit) | 14 |
Disclaimer/Publisher’s Note: The statements, opinions and data contained in all publications are solely those of the individual author(s) and contributor(s) and not of MDPI and/or the editor(s). MDPI and/or the editor(s) disclaim responsibility for any injury to people or property resulting from any ideas, methods, instructions or products referred to in the content. |
© 2023 by the authors. Licensee MDPI, Basel, Switzerland. This article is an open access article distributed under the terms and conditions of the Creative Commons Attribution (CC BY) license (https://creativecommons.org/licenses/by/4.0/).
Share and Cite
Choi, J.; Lim, S. Design and Implementation of K-Band Electromagnetic Wave Rain Gauge System. Remote Sens. 2024, 16, 6. https://doi.org/10.3390/rs16010006
Choi J, Lim S. Design and Implementation of K-Band Electromagnetic Wave Rain Gauge System. Remote Sensing. 2024; 16(1):6. https://doi.org/10.3390/rs16010006
Chicago/Turabian StyleChoi, Jeongho, and Sanghun Lim. 2024. "Design and Implementation of K-Band Electromagnetic Wave Rain Gauge System" Remote Sensing 16, no. 1: 6. https://doi.org/10.3390/rs16010006