Author Contributions
Conceptualization, methodology, writing, funding acquisition, and supervision, G.Z. and R.Z.; software, validation, and data curation, R.Z., Y.Z., B.L. and G.Z. All authors have read and agreed to the published version of the manuscript.
Figure 1.
Visual results of day → night translation. DualGAN is trained with cycle-consistency loss. It can be seen that the proposed BnGLGAN successfully simulates night scenes while preserving textures in the input, e.g., see differences over the light areas between results and ground truth (GT). In contrast, the results of DualGAN contain less textures.
Figure 2.
Example of a comparison between our model and a traditional network for solving the mode collapse problem. (a) The generation mode of GAN, (b) the generation mode of ours, (c) local optimal solution of GAN, (d) multiple suboptimal solutions of our model. The red curve represents the probability density function of the generated data, and the blue curve represents the probability density function of the training data.
Figure 3.
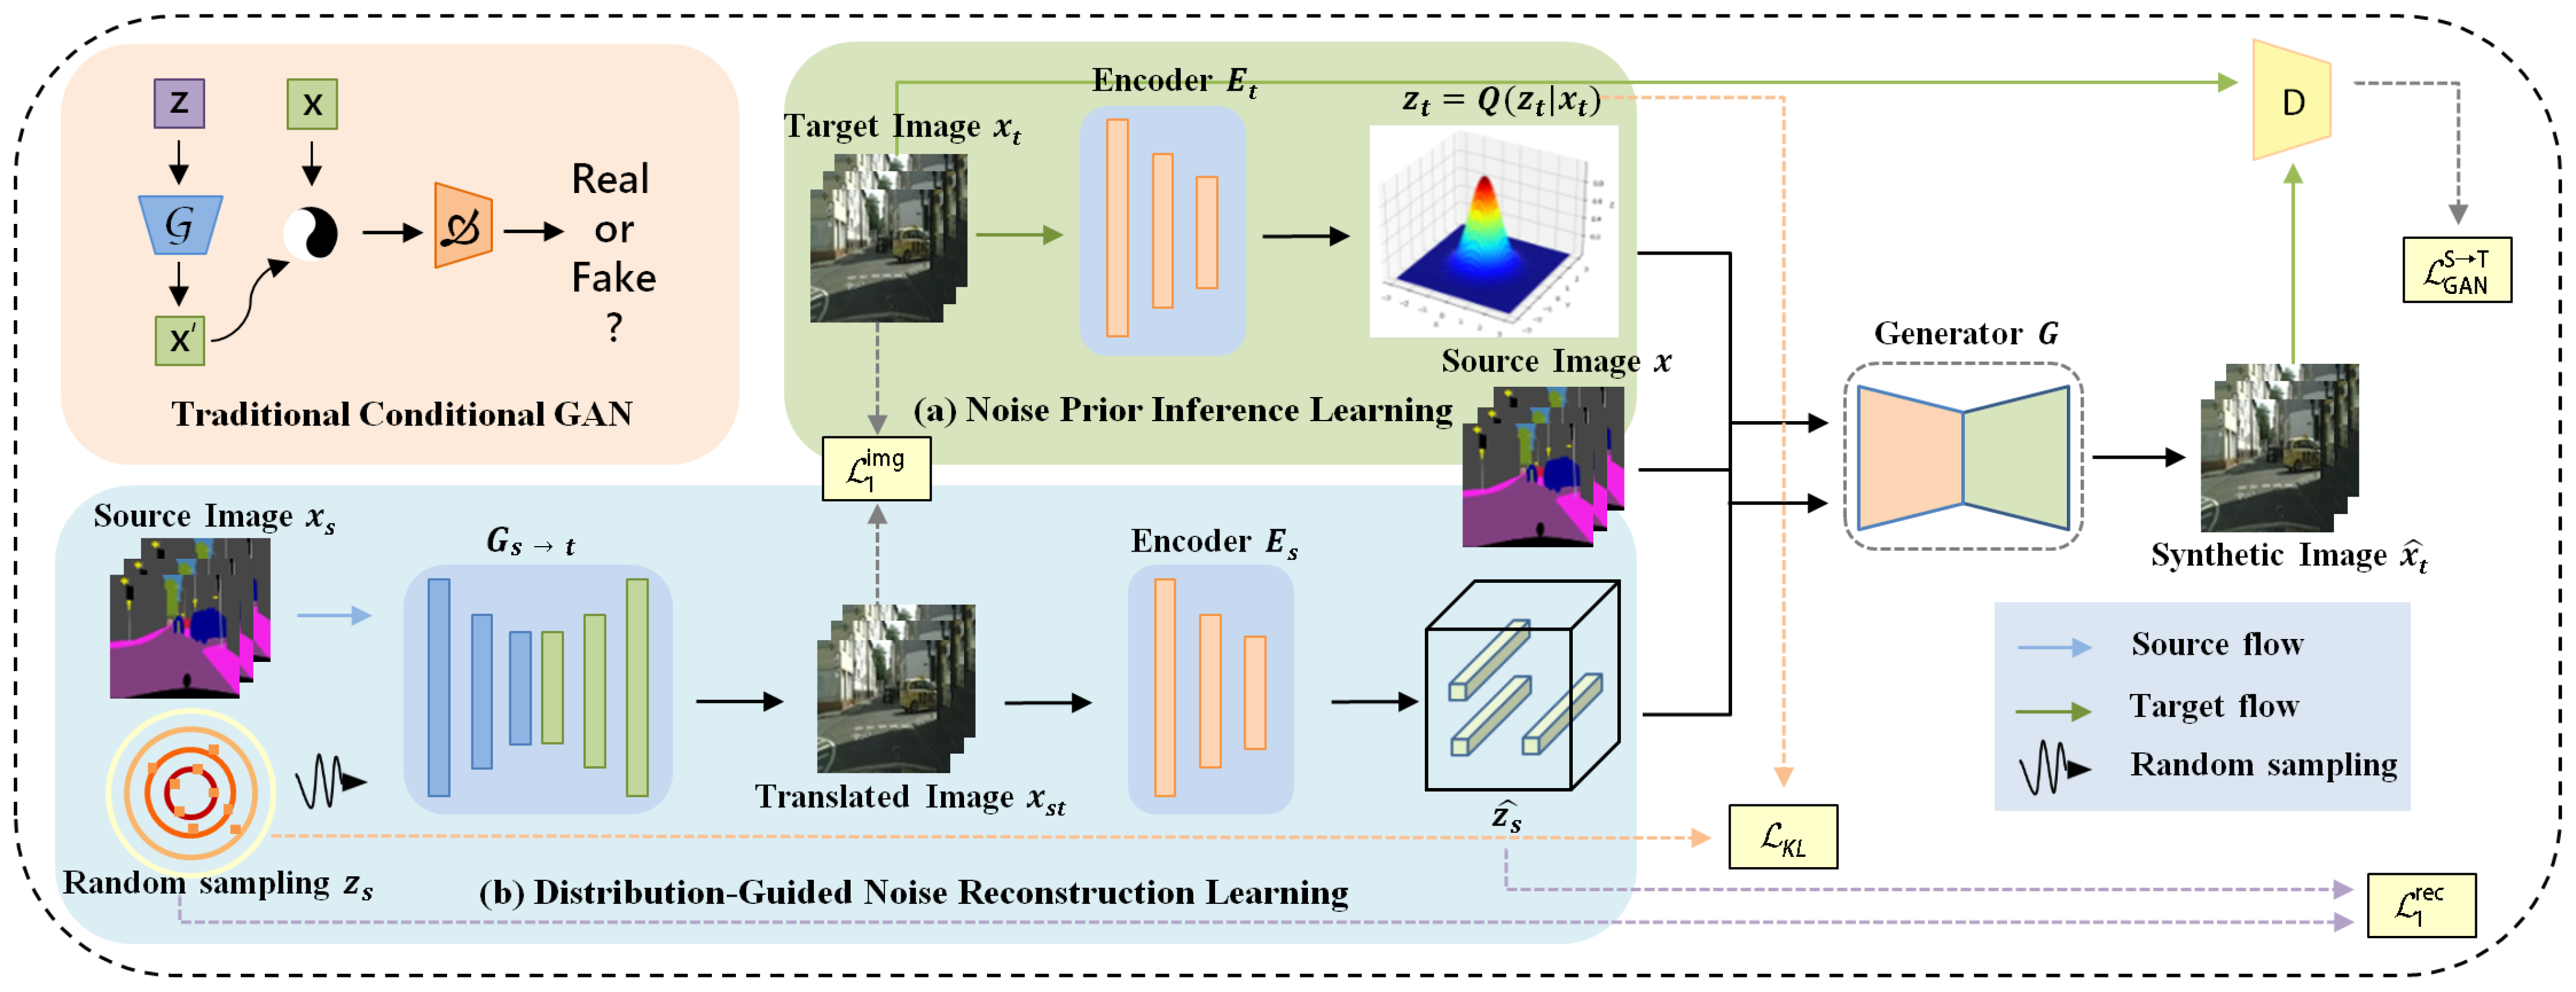
Overall architecture of BnGLGAN. (a) The latent variable is inferred from the target domain image , the inferred variable is used to guide the generation of the conditional GAN, (b) the randomly sampled noise is reconstructed to contain source distribution information, and is also fed into the generator G. The blue, red, and irregular polyline arrows indicates the source data flow, target data flow, and random sampling, respectively. The dashed lines indicate different kinds of losses.
Figure 3.
Overall architecture of BnGLGAN. (a) The latent variable is inferred from the target domain image , the inferred variable is used to guide the generation of the conditional GAN, (b) the randomly sampled noise is reconstructed to contain source distribution information, and is also fed into the generator G. The blue, red, and irregular polyline arrows indicates the source data flow, target data flow, and random sampling, respectively. The dashed lines indicate different kinds of losses.
Figure 4.
Structure of (a) variational autoencoder and (b) conditional variational autoencoder.
Figure 4.
Structure of (a) variational autoencoder and (b) conditional variational autoencoder.
Figure 5.
Some annotated legends of the Cityscapes dataset are presented.
Figure 5.
Some annotated legends of the Cityscapes dataset are presented.
Figure 6.
Visual results comparison with several state-of-the-art methods on three benchmark datasets. In the edge-to-shoes and edge-to-handbag translation tasks, this paper uses bidirectional translation for comparison.
Figure 6.
Visual results comparison with several state-of-the-art methods on three benchmark datasets. In the edge-to-shoes and edge-to-handbag translation tasks, this paper uses bidirectional translation for comparison.
Figure 7.
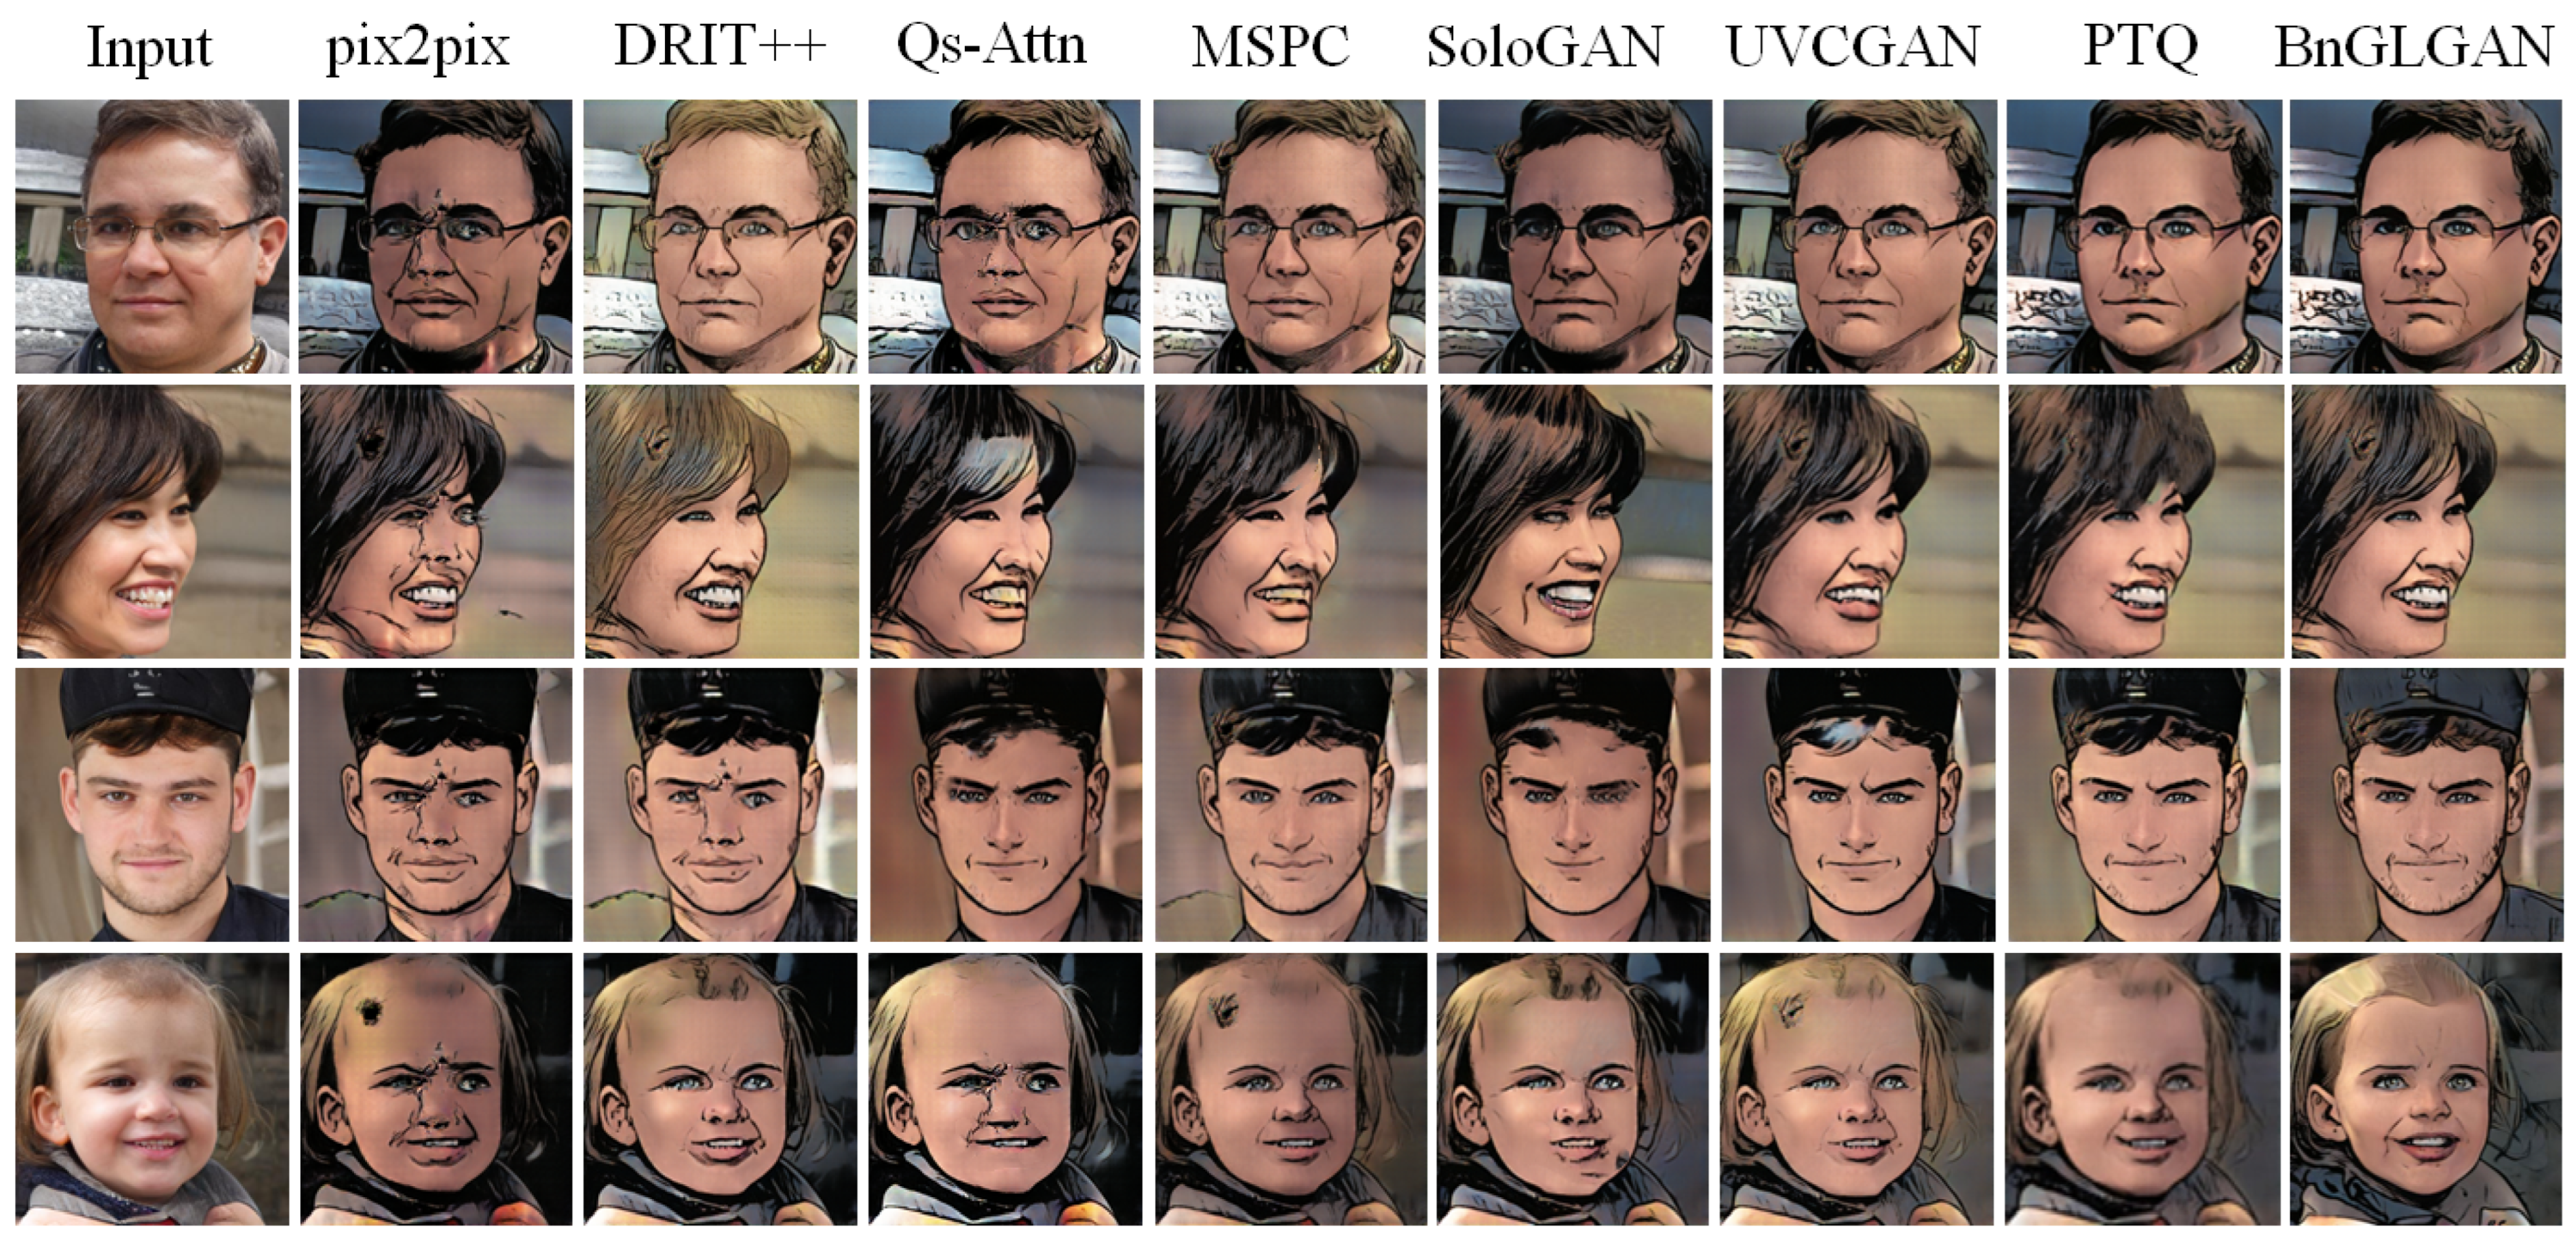
Visual comparison of results of several state-of-the-art methods on facial datasets.
Figure 7.
Visual comparison of results of several state-of-the-art methods on facial datasets.
Figure 8.
Qualitative comparison of results with other image translation methods. The yellow box shows details of the images recovered by each method. it can be seen that the details generated by BnGLGAN are the most accurate.
Figure 8.
Qualitative comparison of results with other image translation methods. The yellow box shows details of the images recovered by each method. it can be seen that the details generated by BnGLGAN are the most accurate.
Figure 9.
Image translation of each method on the night2day dataset. The first two lines show bidirectional image translation, and the last two lines show image translation of other styles of images.
Figure 9.
Image translation of each method on the night2day dataset. The first two lines show bidirectional image translation, and the last two lines show image translation of other styles of images.
Figure 10.
Results of various methods in Maps → Satellite translation task on Google Maps dataset.
Figure 10.
Results of various methods in Maps → Satellite translation task on Google Maps dataset.
Figure 11.
Visualization of different I2IT translation tasks using learned attention maps. Each example shows a ground truth image (left) and the corresponding attention map (right).
Figure 11.
Visualization of different I2IT translation tasks using learned attention maps. Each example shows a ground truth image (left) and the corresponding attention map (right).
Figure 12.
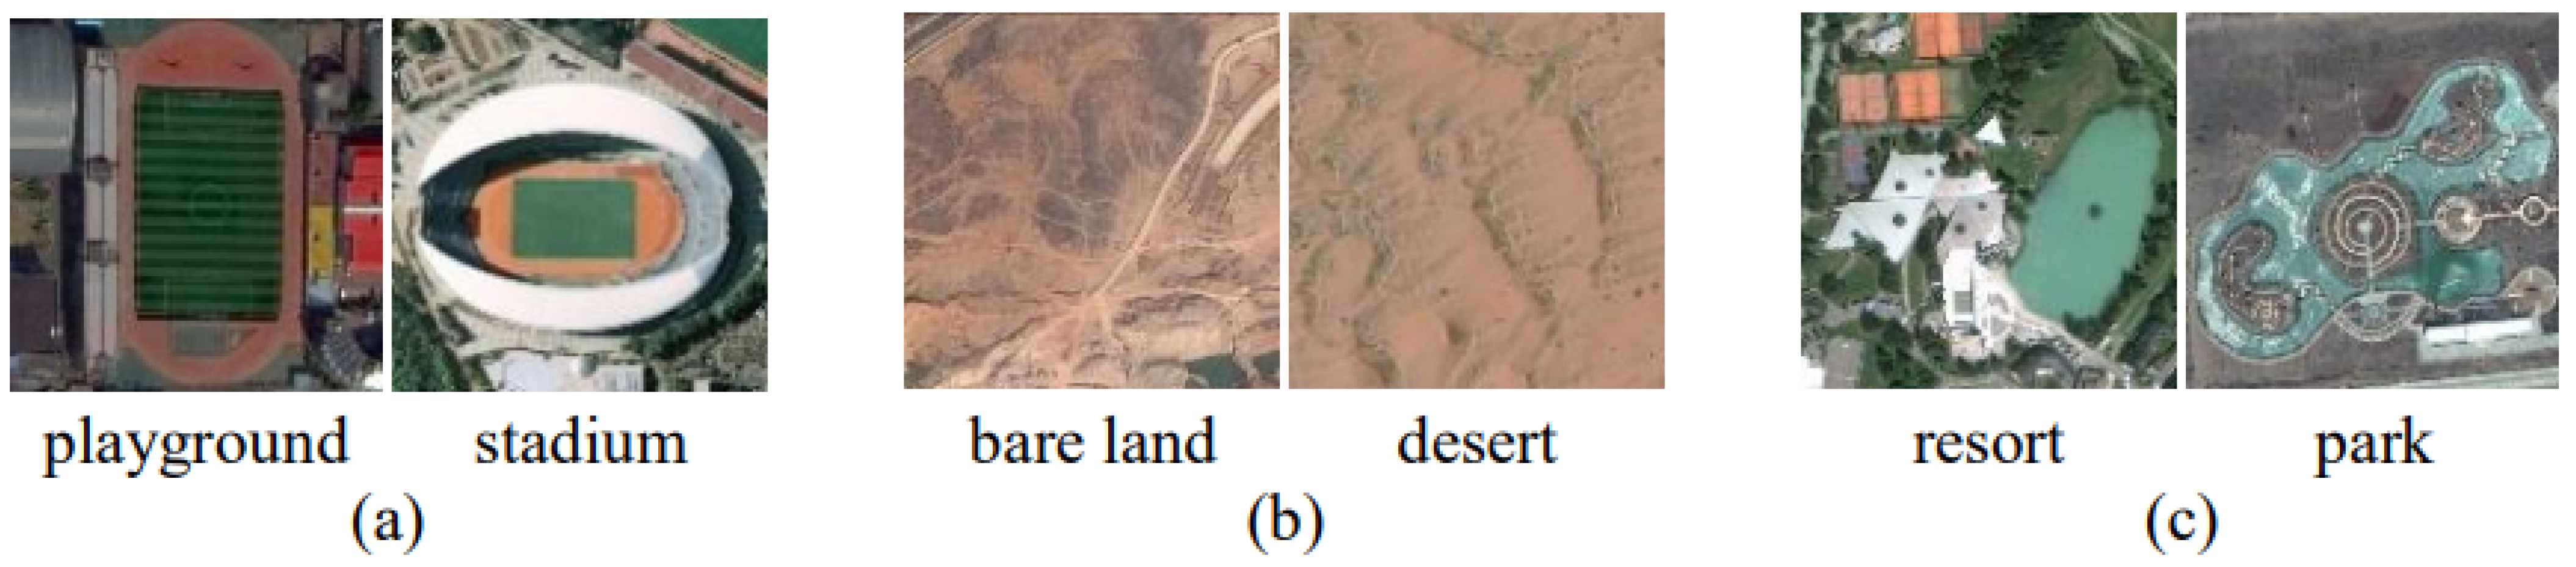
Large intra-class diversity: (a), images of the same setting in multiple dimensions; (b), different styles of buildings in the same setting; (c), diverse imaging conditions of the same setting.
Figure 12.
Large intra-class diversity: (a), images of the same setting in multiple dimensions; (b), different styles of buildings in the same setting; (c), diverse imaging conditions of the same setting.
Figure 13.
Small inter-class distance: (a), similar objects between different scenes; (b), similar grain between different settings; (c), similar structural distributions between different settings.
Figure 13.
Small inter-class distance: (a), similar objects between different scenes; (b), similar grain between different settings; (c), similar structural distributions between different settings.
Table 1.
Details of datasets and settings used in the experiment.
Table 1.
Details of datasets and settings used in the experiment.
| | Cityscapes | Face2comics | CMP Facades | Google Maps | Night2day | Shoes | Handbag |
|---|
| # total images (image pairs) | 3475 | 20,000 | 506 | 2194 | 20,110 | 50,025 | 138,767 |
| # training images (image pairs) | 2975 | 15,000 | 400 | 1096 | 17,823 | 49,825 | 13,8567 |
| # testing images (image pairs) | 500 | 5000 | 106 | 1098 | 2287 | 200 | 200 |
| image crop size | 1024 × 1024 | 512 × 512 | 256 × 256 | 600 × 600 | 256 × 256 | 256 × 256 | 256 × 256 |
| # training epochs | 300 | 400 | 400 | 400 | 200 | 60 | 60 |
Table 2.
Quantitative performance in image-to-image translation tasks on Cityscapes. The lower the FID and LPIPS, the better the effect.
Table 2.
Quantitative performance in image-to-image translation tasks on Cityscapes. The lower the FID and LPIPS, the better the effect.
| Method | FID ↓ | Per-Class Acc. | MIoU | PSNR | SSIM | LPIPS ↓ |
|---|
| pix2pix [1] | 61.2 | 25.5 | 8.41 | 15.193 | 0.279 | 0.379 |
| DRIT++ [32] | 57.4 | 25.7 | 11.60 | 15.230 | 0.287 | 0.384 |
| LSCA [50] | 45.5 | 29.1 | 27.33 | 15.565 | 0.369 | 0.325 |
| MSPC [51] | 39.1 | 29.6 | 33.67 | 15.831 | 0.425 | 0.397 |
| Qs-Attn [52] | 48.8 | 32.6 | 37.45 | 16.235 | 0.401 | 0.334 |
| UVCGAN [53] | 54.7 | 33.0 | 40.16 | 16.333 | 0.524 | 0.351 |
| PTQ [55] | 37.6 | 34.2 | 41.47 | 16.739 | 0.532 | 0.322 |
| BnGLGAN (512 × 512) | 35.9 | 35.6 | 42.60 | 16.839 | 0.547 | 0.319 |
| BnGLGAN (1024 × 1024) | 36.3 | 35.6 | 44.30 | 16.843 | 0.550 | 0.321 |
Table 3.
Comparison of the time consumption (in seconds) of different models at different resolutions (512 × 512, 1024 × 1024). Each result is the average of 50 tests.
Table 3.
Comparison of the time consumption (in seconds) of different models at different resolutions (512 × 512, 1024 × 1024). Each result is the average of 50 tests.
| Method | 512 × 512 | 1024 × 1024 | MOS | B |
|---|
| cycleGAN | 0.325 | 0.562 | 2.295 | 1.6 GB |
| pix2pix | 0.293 | 0.485 | 2.331 | 1.6 GB |
| DRIT++ | 0.336 | 0.512 | 2.372 | 1.6 GB |
| LSCA | 0.301 | 0.499 | 2.462 | 1.8 GB |
| BnGLGAN | 0.287 | 0.431 | 2.657 | 1.6 GB |
Table 4.
Quantitative performance in image-to-image translation task on three edge datasets. The lower the FID and LPIPS, the better the effect.
Table 4.
Quantitative performance in image-to-image translation task on three edge datasets. The lower the FID and LPIPS, the better the effect.
| Method | Face2comics | Edges2shoes | Edges2handbag |
|---|
| FID↓ | SSIM | LPIPS↓ | FID↓ | SSIM | LPIPS↓ | FID↓ | SSIM | LPIPS↓ |
|---|
| pix2pix [1] | 49.96 | 0.298 | 0.282 | 66.69 | 0.625 | 0.598 | 43.02 | 0.736 | 0.286 |
| DRIT++ [32] | 28.87 | 0.287 | 0.285 | 53.37 | 0.692 | 0.498 | 43.67 | 0.688 | 0.411 |
| Qs-Attn [52] | 31.28 | 0.283 | 0.247 | 47.10 | - | 0.244 | 37.30 | 0.682 | - |
| MSPC [51] | - | 0.360 | - | 34.60 | 0.682 | 0.240 | - | 0.741 | - |
| SoloGAN [56] | - | 0.450 | - | 37.94 | 0.691 | 0.234 | 33.20 | 0.771 | 0.265 |
| UVCGAN [53] | 32.40 | 0.536 | 0.217 | - | 0.684 | 0.246 | 35.94 | - | 0.244 |
| PTQ [55] | 30.94 | 0.584 | 0.210 | 25.36 | 0.732 | 0.231 | 29.67 | 0.801 | 0.254 |
| BnGLGAN (Ours) | 27.39 | 0.586 | 0.205 | 21.07 | 0.782 | 0.228 | 28.35 | 0.793 | 0.182 |
Table 5.
Quantitative performance in various image-to-image translation tasks. The lower the FID and LPIPS, the better the effect.
Table 5.
Quantitative performance in various image-to-image translation tasks. The lower the FID and LPIPS, the better the effect.
| Method | Facades | Google Maps | Night2day |
|---|
| FID↓ | SSIM | LPIPS↓ | FID↓ | SSIM | LPIPS↓ | FID↓ | SSIM | LPIPS↓ |
|---|
| pix2pix [1] | 96.1 | 0.365 | 0.438 | 140.1 | 0.177 | 0.321 | 121.2 | 0.441 | 0.433 |
| CHAN [57] | 93.7 | 0.387 | 0.422 | 131.5 | 0.187 | 0.287 | 117.9 | 0.558 | 0.303 |
| Qs-Attn [52] | 90.2 | 0.417 | 0.399 | 129.7 | 0.191 | 0.309 | 99.9 | - | 0.287 |
| SISM [54] | 91.7 | 0.422 | 0.401 | 110.4 | 0.196 | 0.294 | - | 0.668 | - |
| MSPC [51] | 87.3 | 0.501 | 0.384 | 104.3 | 0.203 | 0.311 | 91.2 | 0.654 | 0.246 |
| LSCA [50] | 88.0 | 0.434 | 0.359 | 99.8 | 0.212 | 0.283 | - | 0.659 | - |
| UVCGAN [53] | 85.3 | 0.459 | 0.344 | 101.1 | 0.216 | 0.297 | 89.8 | 0.701 | 0.223 |
| BnGLGAN (Ours) | 81.2 | 0.488 | 0.335 | 91.2 | 0.233 | 0.298 | 85.5 | 0.670 | 0.214 |
Table 6.
Ablation study on the modules of our proposed method on Cityscapes dataset.
Table 6.
Ablation study on the modules of our proposed method on Cityscapes dataset.
| Method | FID ↓ | SSIM | LPIPS ↓ |
|---|
| Baseline | 39.0 | 0.478 | 0.336 |
| Baseline + NPIL | 37.6 | 0.514 | 0.329 |
| Baseline + DgNRL | 37.1 | 0.523 | 0.324 |
| Baseline + NPIL + DgNRL (Ours) | 36.3 | 0.550 | 0.321 |


