1. Introduction
As one of the world’s largest carbon stocks, wetlands store more than 30% of the world’s carbon and play an irreplaceable role in the global carbon cycle [
1]. However, wetlands are also some of the most fragile ecosystems. Once damaged, substantial reductions in their biodiversities, ecological services, and carbon sink capabilities occur [
2]. According to the National Wetland Survey Report published by the State Forestry Administration, China’s wetland area decreased by nearly 3.4 million ha from 2003 to 2013 [
3]. Moreover, the average soil organic carbon stocks of wetlands decreased by 8.03% from 2000 to 2020 [
4]. Hence, wetlands are at risk of transforming from carbon sinks into carbon sources [
5]. The risk increases with urbanization, population growth, and the intensification of land use–wetland conservation conflicts.
Consistent with the need to adopt a more scientific approach to the wetland restoration proposed by Bayraktarov et al. [
6] at the United Nations General Assembly, the protection of wetland carbon stocks should have a digital guarantee. That is, protecting wetland carbon reserves through digital technology and information technology. Scientific estimates of carbon stocks can provide a reliable basis for assessing the health of wetland carbon stocks. Carbon stock estimates are usually based on biomass accounting. The sample site inventory [
7] and biomass-based carbon density estimation [
8] models are two widely used models. The sample site inventory method can obtain accurate measurements through field surveys, but its high cost and cumbersome operations limit its applications in large areas [
9]. The carbon density estimation method is cost-effective and can be applied to large areas. However, it may be inaccurate for small-scale area studies because of using a constant carbon density for different types of wetlands [
4].
Due to the rapid development of remote sensing technology and machine learning algorithms, methods based on a combination of field surveys and remote sensing image inversion are more accessible and reliable and have gradually evolved into the mainstream [
10,
11]. For example, Lyu et al. [
12] analyzed field sampling data and MODIS reflectance, built single-factor, multi-factor parameters, and multi-factor non-parametric models, and estimated the above-ground biomass of typical grassland grasslands in Mongolia from 2015 to 2019. Quang et al. [
13] obtained a reasonable prediction of the mangrove biomass in the Red River estuaries of Vietnam by combining field sampling data and Sentinel-2 remote sensing data. Chen et al. [
14] proposed a generative adversarial network with a constrained factor model (GAN-CF) to estimate salt marsh biomass using expanded in situ observations and Sentinel-2 remote sensing data to improve tidal flat biomass estimation accuracy. Zhang et al. [
15] analyzed the correlation between 1201 ground measurement data and 15 vegetation indices generated by MODIS reflectance. They found that grassland aboveground biomass was significantly related to SAVI, NDVI, and OSAVI, summarized the differences between different grasslands, and concluded suitable variables for various biomass inversion models to support research in subdivided grasslands. These combined applications of remote sensing images and field sampling points not only overcome the difficulty of conducting surveys in some specific spaces or times but also make it possible to estimate biomass in large areas.
Biomass estimation traditionally applies regression models, such as Multiple Linear Regression (MLR) [
12], but it is difficult to capture complex nonlinear relationships using these methods [
14]. With the development of computer science and technology, more and more machine learning algorithms that can address this issue are being applied to biomass estimation. The Random Forest (RF) algorithm [
16] is a robust machine learning algorithm that is widely used in predictive biomass estimation studies [
16]. Ma et al. [
17] found that the RF algorithm achieved an excellent performance in feature extraction from airborne LiDAR point cloud data to estimate the forest vegetation biomass. XGBoost [
18], short for eXtreme Gradient Boosting, is another machine learning algorithm known for its high computational speed, efficiency, accuracy, and strong generalization capabilities. Li et al. [
19] estimated the biomass of the mangrove forests in the Shengjin Lake Wetland based on XGBoost and obtained satisfactory results. Carbon stocks can be estimated by combining biomass estimates and the vegetation carbon conversion factor [
20]. The carbon conversion factor refers to the ratio of the conversion of carbon dioxide absorbed by vegetation growth into carbon. This factor measures the vegetation’s absorption of carbon dioxide [
21].
In addition to carbon stock estimation, it is crucial to balance wetland resource protection and urban expansion and to scientifically assess the health of wetland carbon stocks. Various factors may affect wetland carbon stocks. For example, climatic conditions shape the environment of the basic ecological processes in wetlands. Sanders et al. [
22] found that increased rainfall may increase wetland mangrove carbon stocks. Socio-economic activities, such as wetland reclamation, land reclamation, and fishery activities, have seriously disturbed wetland ecological environments and have become one of the factors that contribute to the conversion of wetlands from carbon sinks to carbon sources [
23]. In recent years, with the improvement in environmental awareness, the government has actively adopted environmental management measures, such as the withdrawal of fishing from wetlands and water quality control, which have promoted improvements in wetland ecological environments and thereby increased their carbon storage capacities [
24]. As an important indicator for measuring regional economic development, the per capita GDP has a special relationship with wetland environmental protection, which affects the wetland carbon stock status to a certain extent [
25]. This has a potential impact on wetlands. The growth of per capita GDP indicates rapid economic development in the region, a portion of which comes from the development and utilization of wetlands. Moreover, pressure for increased carbon emissions follows when regional economies develop rapidly.
The abovementioned factors, such as climate conditions, socio-economic activities, and government investigations, among others, directly or indirectly affect the security of wetland carbon stocks [
26]. However, to the best of our knowledge, no comprehensive health assessment for wetland carbon stocks has been proposed. Drawing on the wetland ecological health assessment method [
27] and the green development index [
28], a non-parametric statistical method, Data Envelopment Analysis (DEA) [
29], is available to assess the safety statuses of wetland carbon stocks. The DEA model can obtain an efficiency value that can be used to measure the relative efficiency of each study unit. This efficiency value represents the health status of a developing carbon stock. The efficiency value in the traditional DEA model ranges from 0 to 1, which is limited and not conducive to unit comparison [
30,
31]. Andersen and Petersen [
32] extended the traditional radial measure method and proposed a procedure for ranking efficient units to achieve mutual comparisons. Tone [
33] proposed the Super Slack-Based Measure (Super-SBM) model, which introduces a slack variable that can calculate the degree of efficiency required to achieve optimal values. Then, the model was improved to support unexpected outputs [
34]. The Super-SBM model has received increasing attention as a model for calculating relative efficiency because it considers multiple input–output indicators simultaneously and can guide the optimization of the indicators in each decision-making unit (region) [
35,
36].
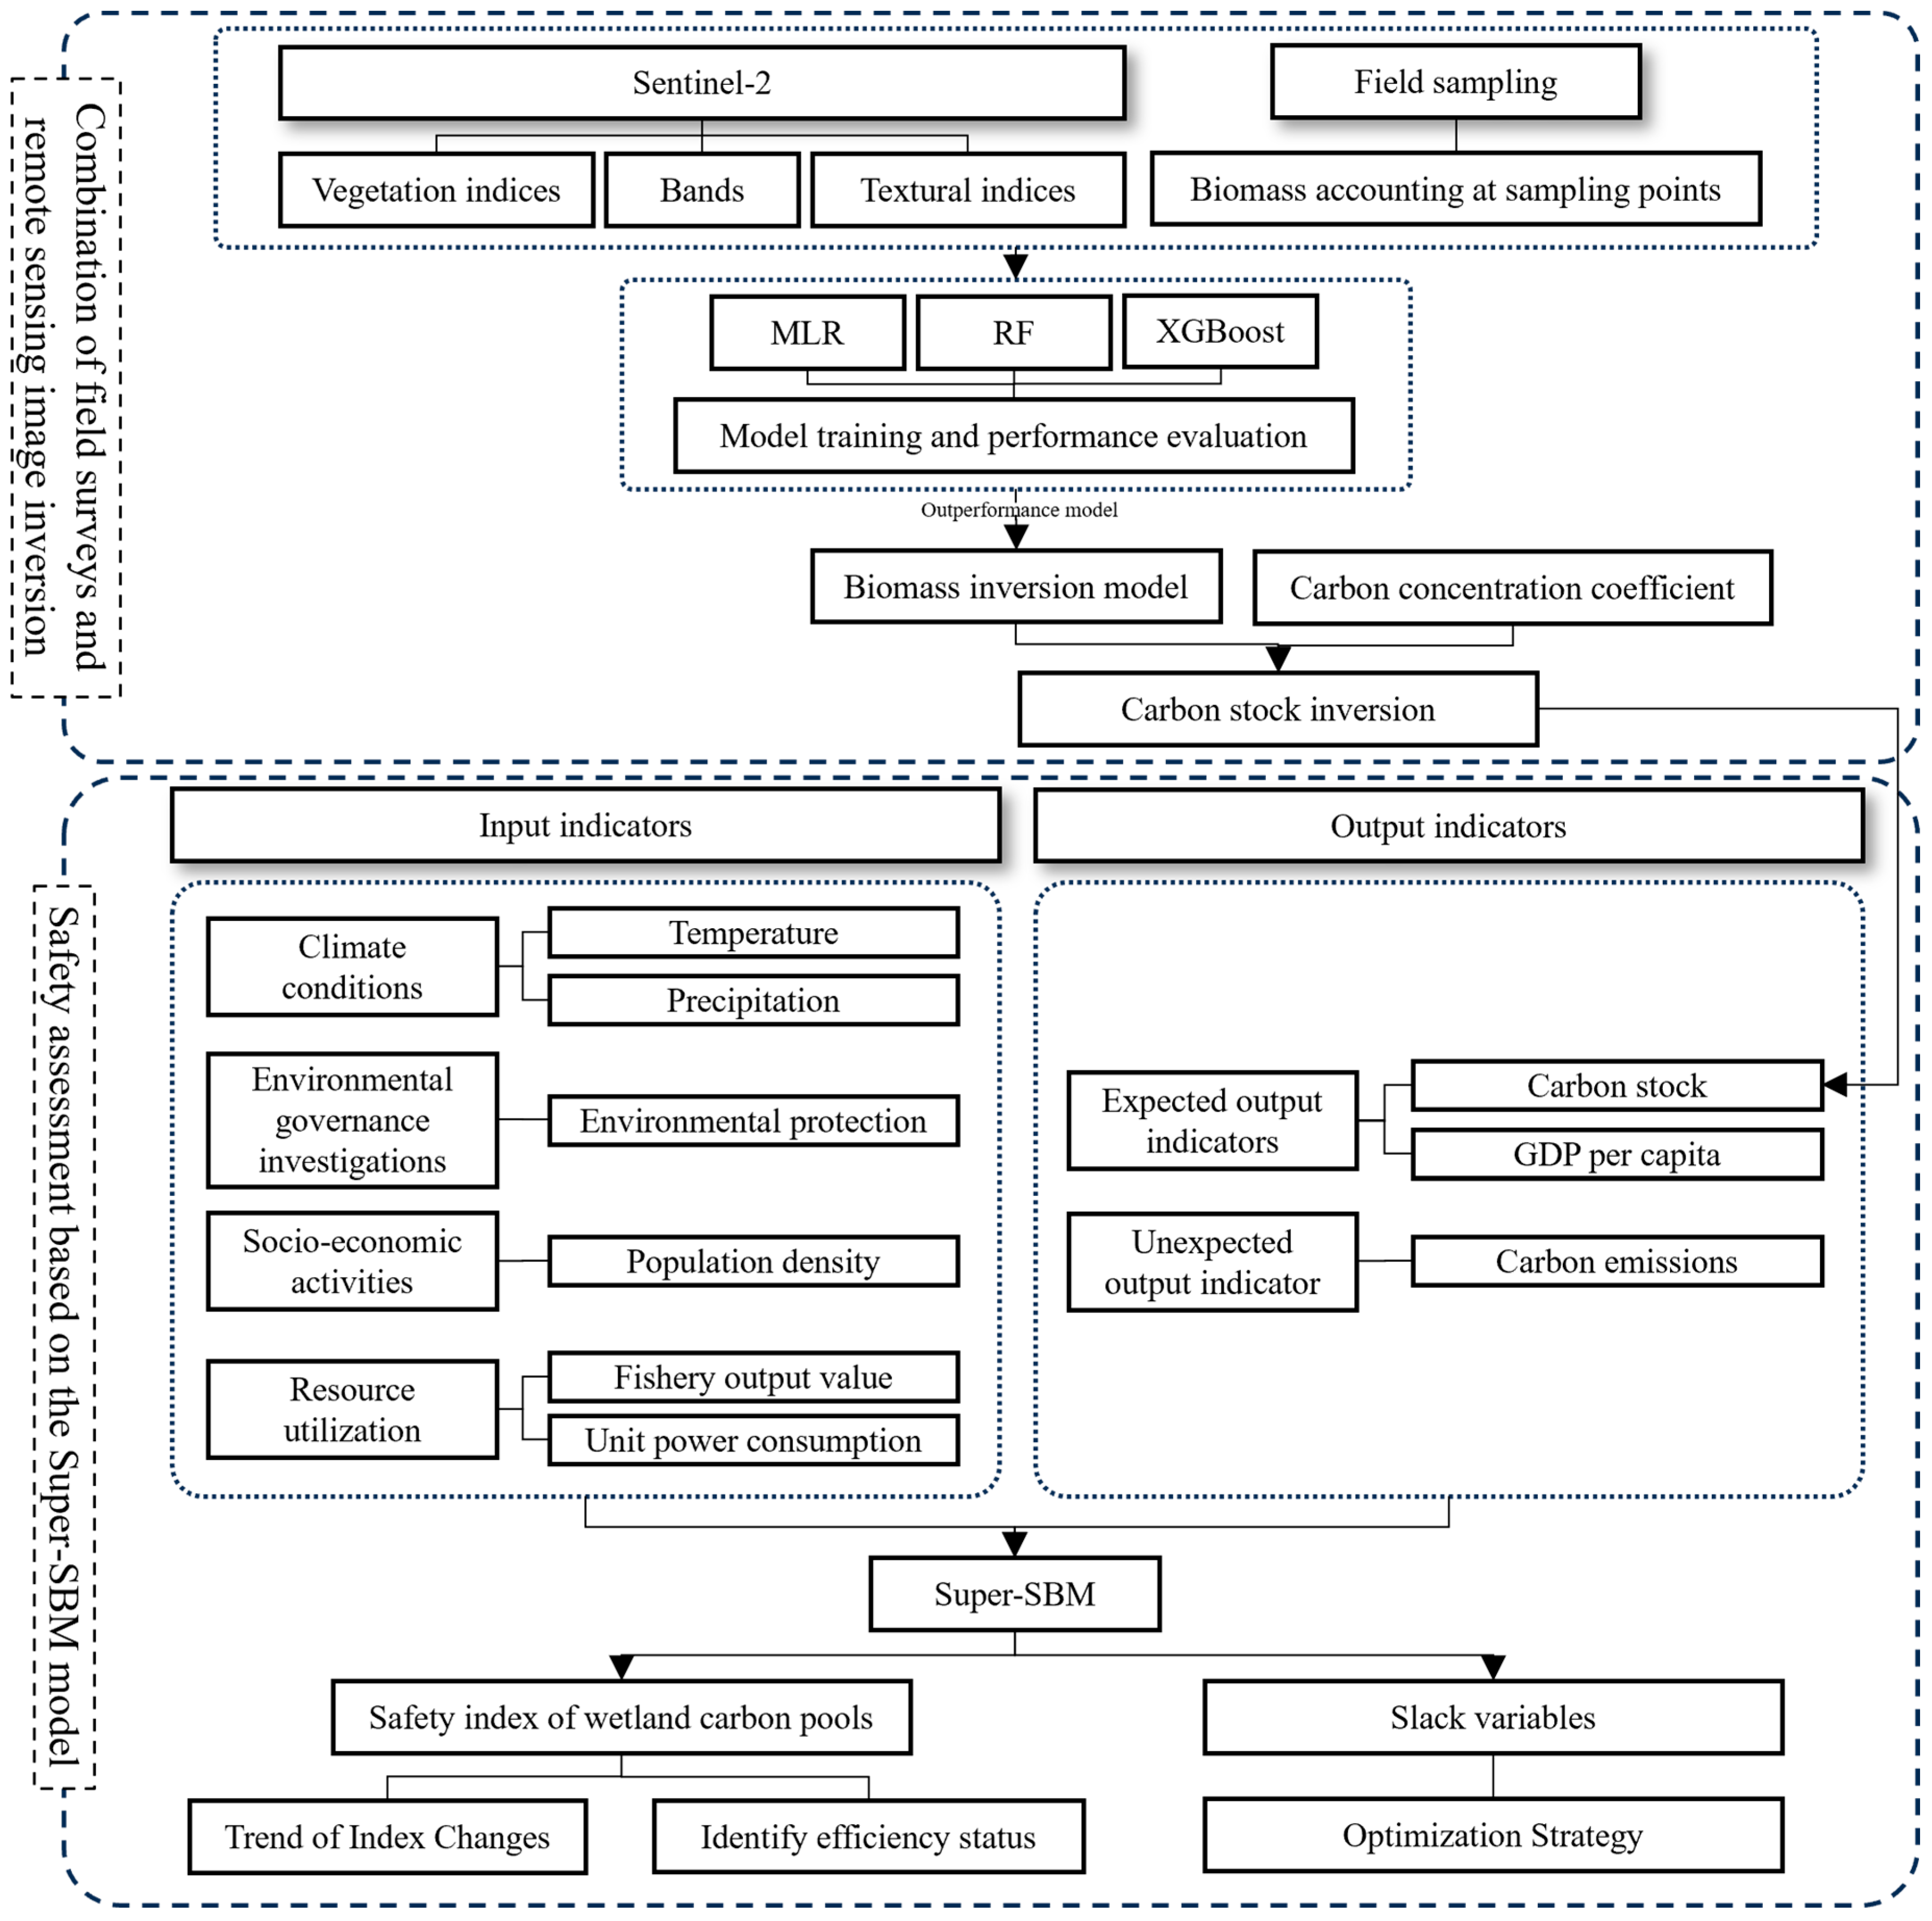
Therefore, in this study, we established a framework for evaluating the safety of wetland carbon stocks based on the Super-SBM model. By integrating factors such as government investigations, climate conditions, socio-economic activities, resource utilization, and carbon emissions, we conducted an empirical analysis in the Quanzhou Bay Estuary Wetland (QBEW), where human–land conflict is prominent, to validate its effectiveness.
4. Discussion
Drawing on the theory of green sustainable development and the concept of ecological security assessment, in this study, we proposed a framework for assessing the ecological security of wetland carbon stocks based on the DEA efficiency model, and we empirically analyzed the wetlands in the estuary of Quanzhou Bay, which achieved results that match the real-world situation.
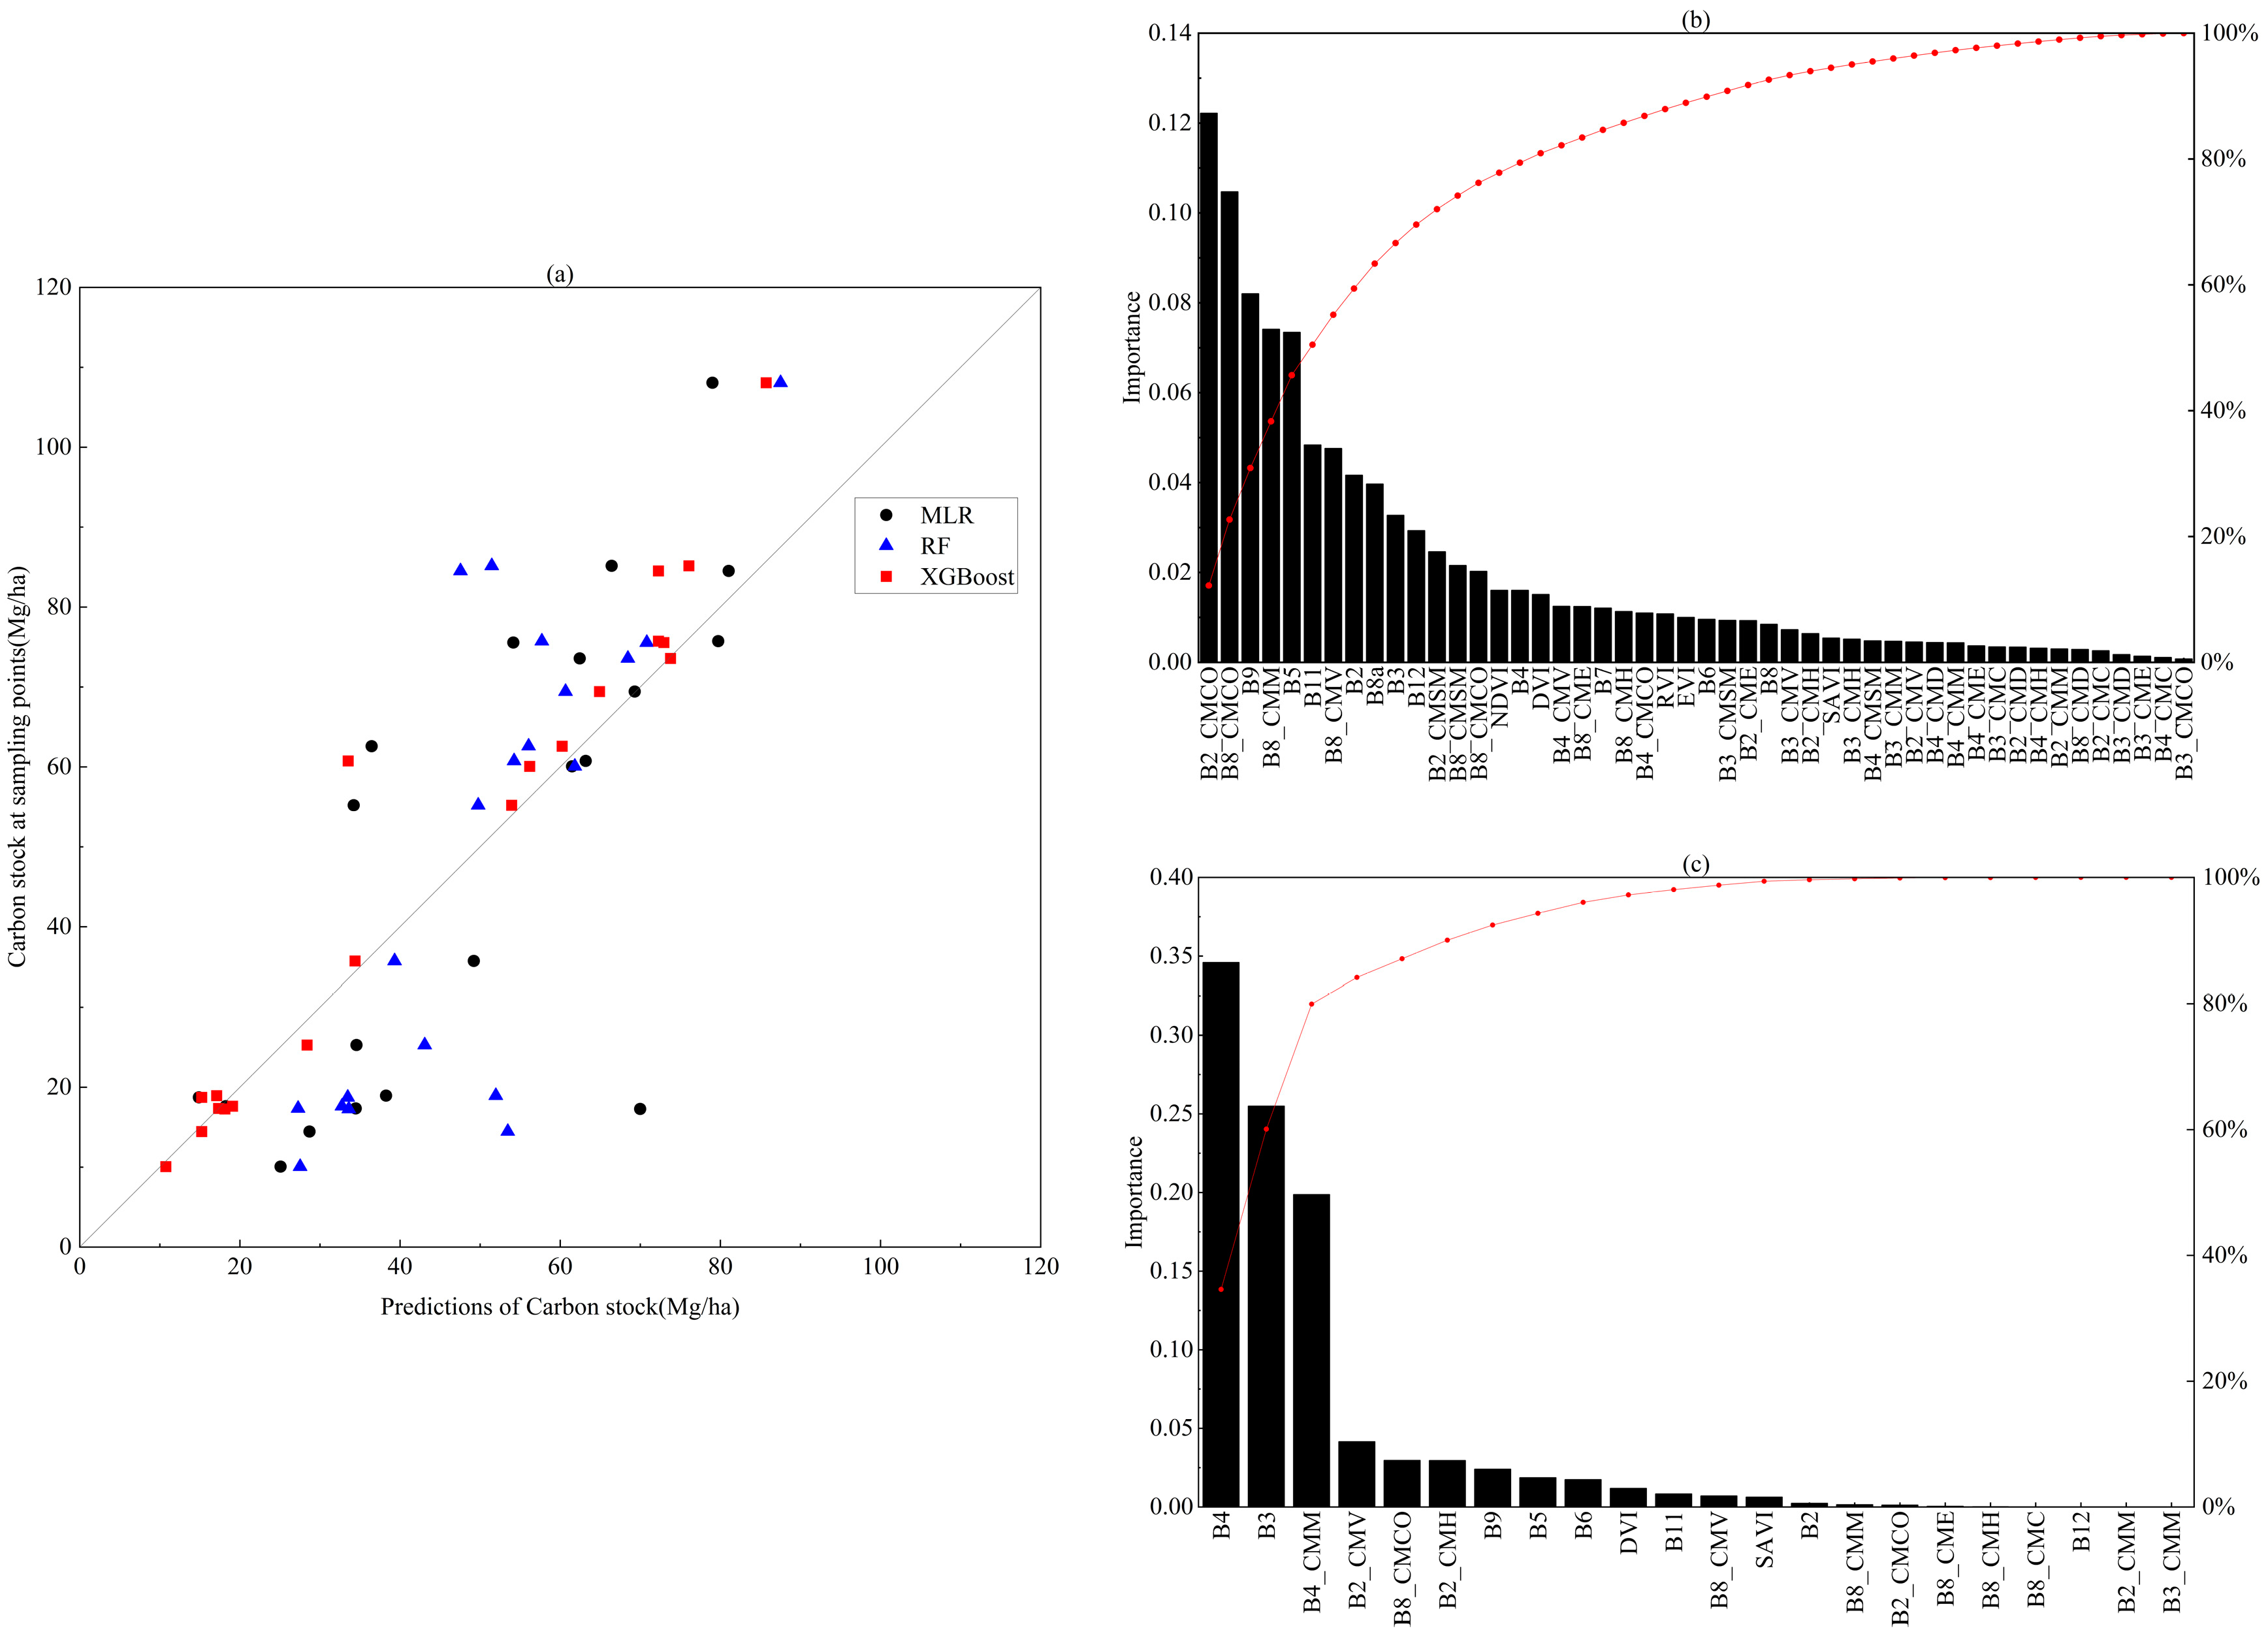
This study combined remote sensing and field sampling data to compare the performance of MLR, RF, and XGBoost models in estimating wetland biomass. The results showed that the XGBoost algorithm was best suited for biomass inversion in QBEW (
Table 5). These results were consistent with the comparisons reported by [
56] and [
57], which indicated that the XGBoost algorithm can extract richer feature information (
Figure 3b). This XGBoost algorithm can use randomness in model fitting that may help find the relationships between independent and dependent variables. Considering the differences between samples and independent variables, especially when dealing with variables such as biomass that change with complex changes and the overall trend is not apparent, better results may be produced. The RF algorithm also outputs good results for biomass inversion but is not as good as XGBoost. As shown in the importance ranking of indicators (
Figure 3c), the RF algorithm extracts limited information on indicators, primarily concentrated in B4, B3, and B4_CMM (co-occurrence measure mean). The RF algorithm may perform well on large data sets and be less suitable for handling this study’s smaller training samples. The MLR model has the worst biomass inversion results, which is expected. This is because the MLR model is a linear model with a limited ability to capture nonlinear relationships. The independent variables (band reflectance, vegetation index, and texture features) may not be independent of each other, resulting in inaccurate model parameter estimates.
In addition to the traditional red and green bands (B3 and B4), the Haralick features and CMM based on B4 also showed their importance (
Figure 3b,c) in biomass estimation. This may indicate that texture features can provide information about the spatial distribution and changes between image pixels [
47], which is beneficial to improving biomass estimation based on optical data [
58]. This finding was consistent with some studies. Tian et al. [
56] considered texture features and obtained better results in mangrove biomass estimates in southern subtropical China. In addition, Zhang et al. [
59] found that the correlation between forest biomass and texture features was significantly related to the CMM (co-occurrence measure mean) features of SWIR1. This may indicate that CMM, which can provide overall image brightness or color features, may also benefit the biomass inversion.
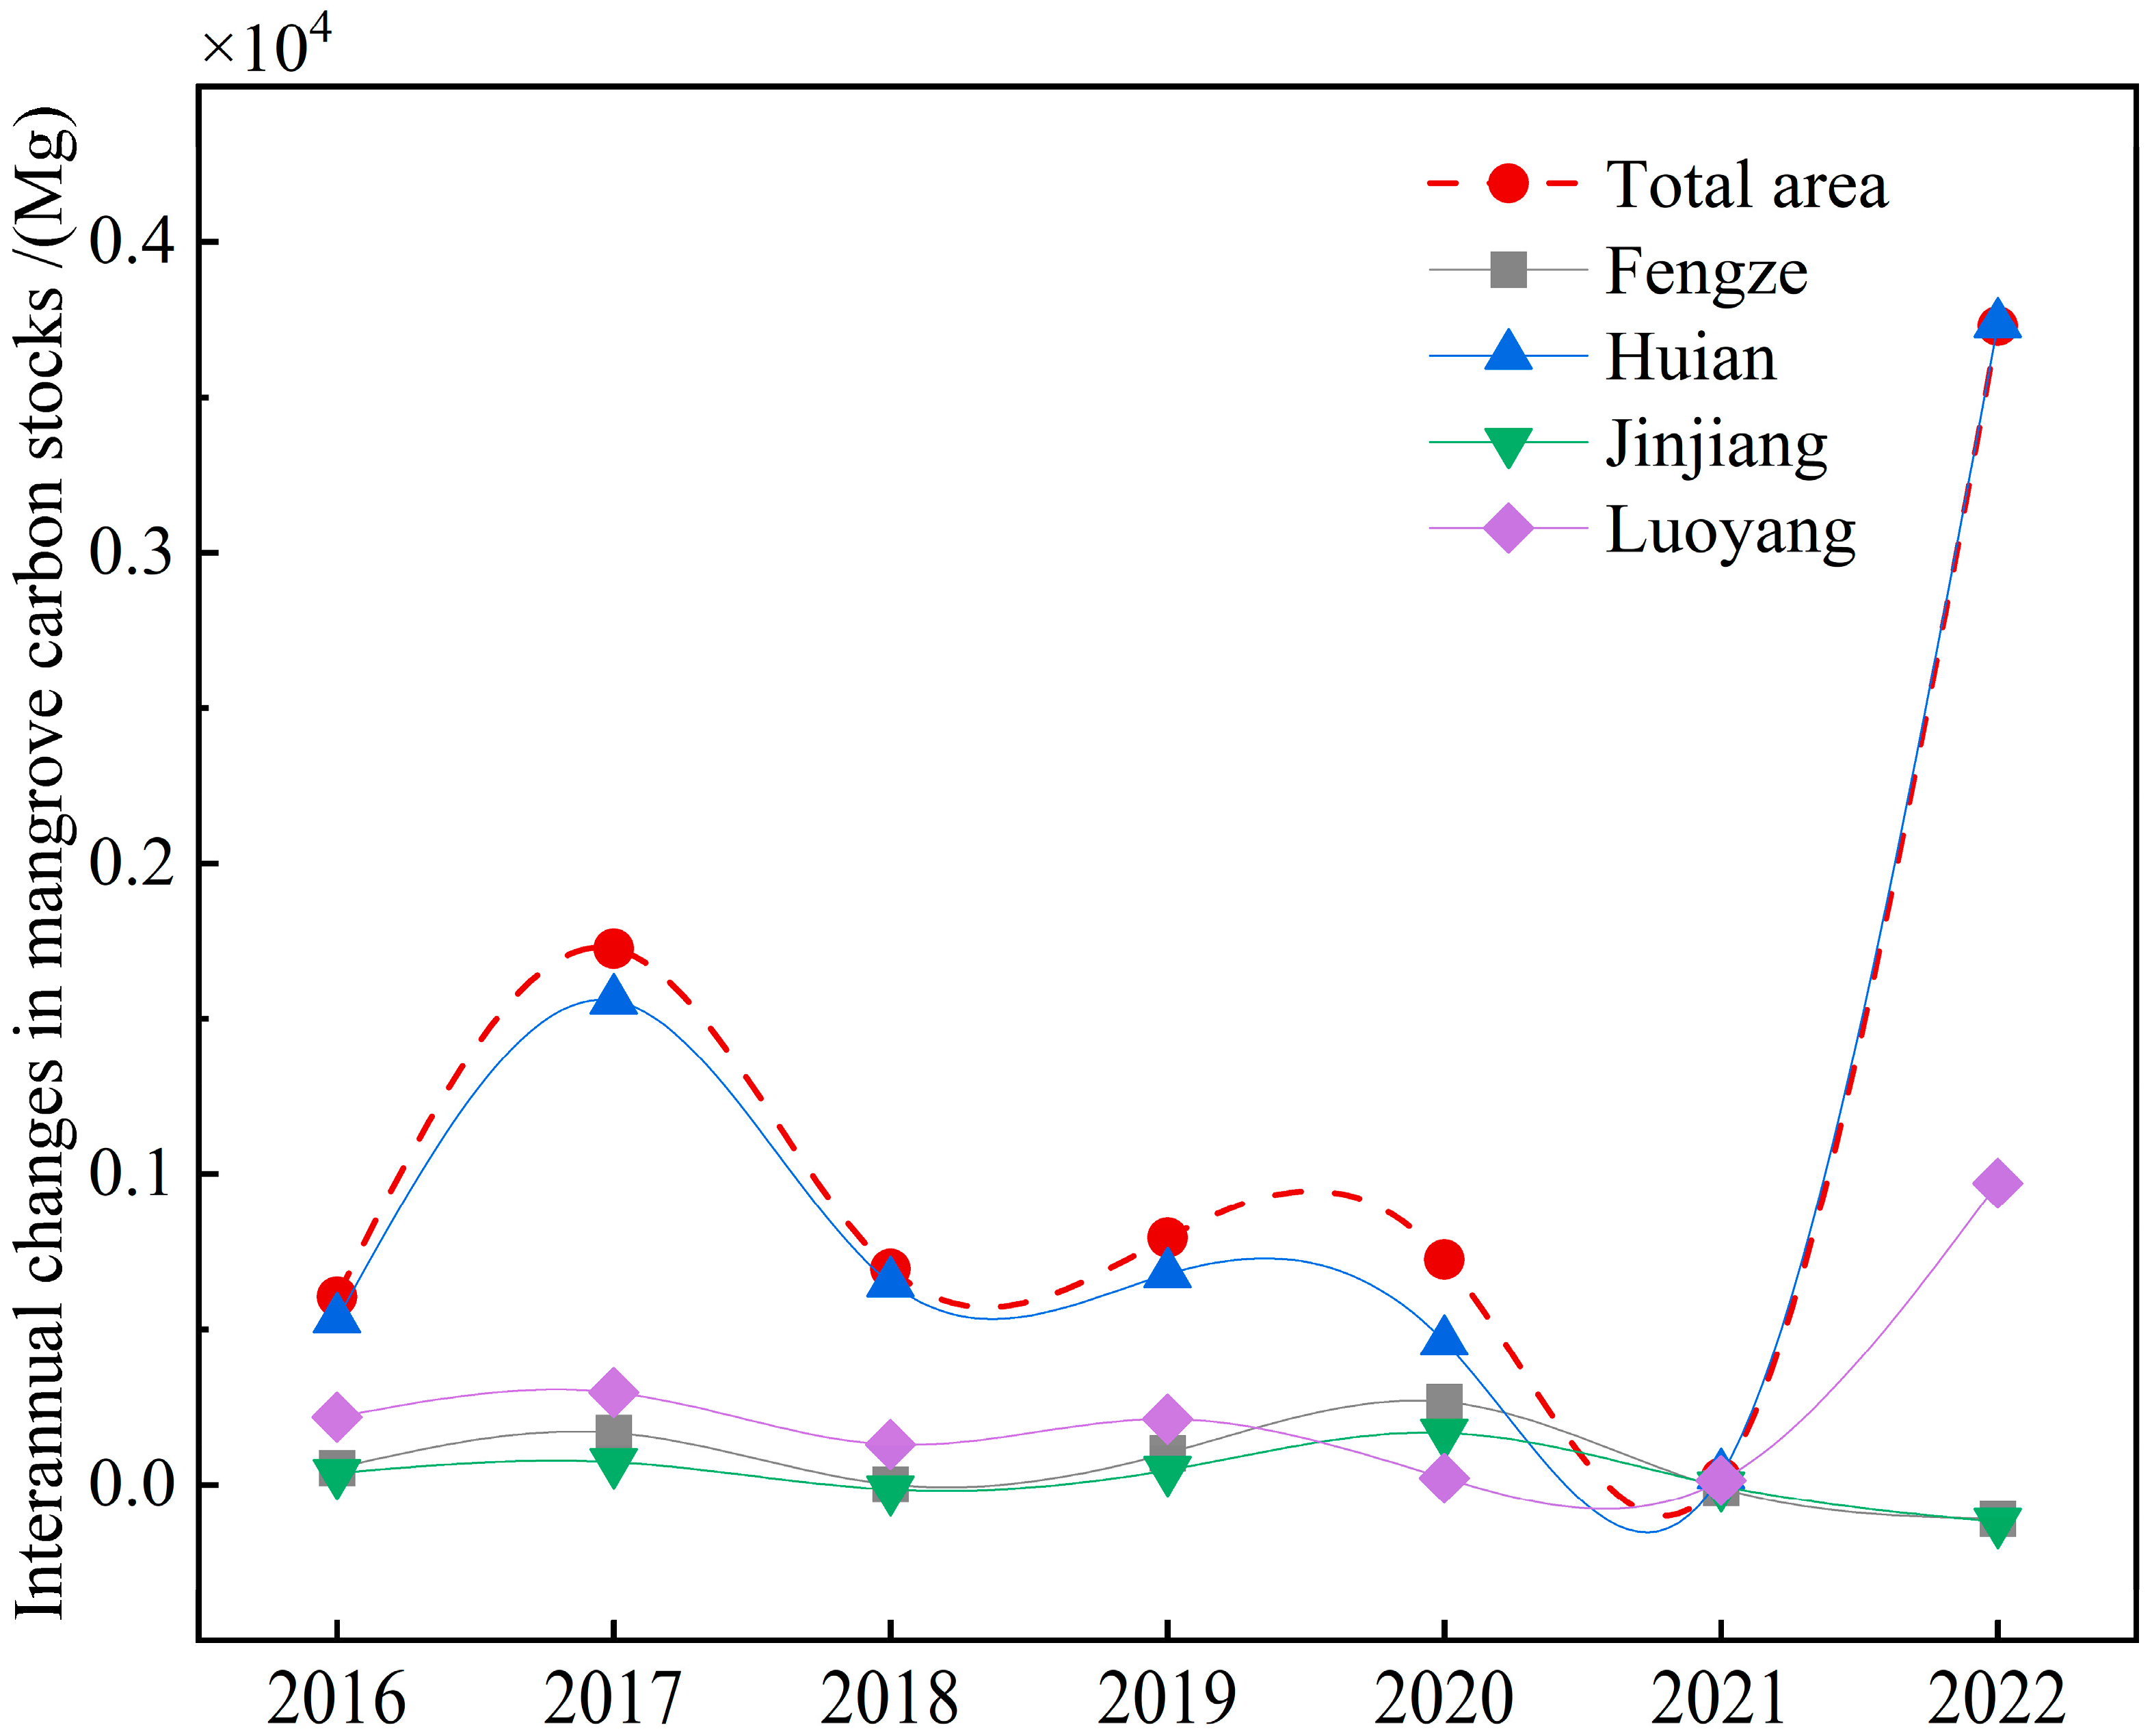
The improvement of carbon stock is closely related to implementing conservation policies. The two peaks occurred in 2017 and 2019, respectively (
Figure 4), which may be closely associated with the local government’s active restoration of wetlands. In 2017, the Quanzhou Municipal Government actively carried out ecological environment quality assessment and construction, promoted the city’s “dual restoration” (environmental and urban restoration) plan, renovated water basins, repaired mountains, and established ecological protection in red line control areas [
60]. In 2019, the city’s “dual restoration” pilot work achieved initial results: the ecological environment was restored, and the environmental quality was significantly improved. The surge in carbon stocks in 2022 (an increase of approximately 3729 Mg) may be essentially the result of implementing the national “Blue Bay” policy. Quanzhou City’s “Blue Bay” comprehensive improvement action project was predicted to be completed by the end of 2022. In the project, 5026 acres of
Spartina alterniflora have been cleared, 2722 acres of mangroves have been planted, 190 acres of original mangroves have been restored, 374 acres of bird habitats have been restored, and two monitoring stations and 6.2 km of coastal ecological transformation have been built. Within the scope of mangrove planting in the Jinjiang Sea area in the southern part of Quanzhou Bay, the environmental restoration effect has gradually emerged, improving the ecological environment of the coastal wetland at the Jinjiang estuary of Quanzhou Bay, and promoting the steady growth of wetland carbon stocks.
The two declines in carbon stocks may be related to biological invasion and engineering construction. The trough values occurred in 2018 and 2021, respectively (
Figure 4). It may be affected by the expansion of
Spartina alterniflora and the construction of cross-sea bridge projects. The expansion of the invasive species
Spartina alterniflora will occupy the growth space of mangroves and affect the growth of mangroves. Li, H. et al. [
61] research shows that the
Spartina alterniflora area in Fujian Province accounted for 13.3%, 14.52%, and 15.1% of the total
Spartina alterniflora area in the country in 2015, 2018, and 2020, respectively. In 2020, the area of
Spartina alterniflora in Fujian Province has expanded, and the Quanzhou Bay area has also been affected by the same impact, with the original natural mangrove resources gradually decreasing [
62]. In 2018, the implementation of the Quanzhou Bay Cross-Sea Bridge was launched. The bridge crossed Quanzhou Bay into Shishi City and Jinjiang City, which impacted the environment of the Quanzhou Bay Estuary Wetland and Tianzhu Mountain Forest Park Water Source Reserve.
The spatial distribution of mangrove carbon stocks is closely related to the growth status of mangroves. The areas with higher mangrove carbon storage in the study area are mainly Luoyang Bridge (A), Yutou Bay (B), and the west of Zeng’an Village (C) (as shown in
Figure 5). The reasons may be as follows: (1) Natural forests will sequester more carbon than plantations. There are a few natural mangroves in Luoyang Bridge (A), the west of Zeng’an Village (C), and Fengze Xunmei (D), while most other areas are planted mangroves. This is consistent with the results of [
63] and [
64]. (2) The government has started replanting mangroves in Luoyang Bridge (A), Yutou Bay (B), the west of Zeng’an Village (C), and other areas since 2000, and has replanted mangroves in Luoyang Bridge (A) and Fengze Xunmei (D). The river channel is dredged to ensure a smooth flow of ebb and flow tides, promote the growth of mangroves in the estuary area, and improve the regional carbon sequestration capacity.
The security status of wetland carbon stocks may be significantly affected by socio-economic activities and resource use conditions. As shown in
Table 7, the security status of Hui’an and Luojiang wetlands has been dramatically improved; in contrast, Jinjiang has more room for improvement in the safety protection and maintenance of wetland carbon pools. The reason may be that most of the mangroves in the study area are distributed in Hui’an and Luoyang, which are less developed. In contrast, the mangrove area in Jinjiang is smaller (almost no mangroves in 2015–2016), but human production activities have not decreased. Its fishery output value accounts for about 40% of the total output value of the study area. Compared with other places, the wetlands under Jinjiang’s jurisdiction are surrounded by residential buildings and are close to the city center, so the ecological security of the wetlands has been slowly improved.
This proposed framework opens a new window for assessing the health statuses of wetland carbon stocks. The safety value of the QBEW significantly increased by about 298.86% from 2015 to 2022, consistent with Quanzhou’s ecological civilization movement. Beyond this, optimization strategies can be drawn out from the generated slack variables. For example, Fengze improved its wetland carbon stock security by increasing its technology investment by approximately CNY 109.48 million in 2022. This result has important reference significance for many other areas that need to ensure the security of their wetland carbon stocks. However, due to the uncertainty of the input–output indicator selection, the efficiency of the safety assessment framework for wetland carbon stocks needs to be further verified.
Biomass estimation based on machine learning algorithms has been widely used and has been proven to improve estimation accuracy, especially for forests [
65] and grasslands [
66]. However, its application to wetlands needs to be strengthened. Hybrid machine learning models [
67] or ensemble stacking approaches [
68] should be able to improve the estimation accuracy. In addition, with the development of unmanned aircraft remote sensing technology, combined with field data samples, it is expected that higher biomass estimation accuracies will be achieved.
Differences in the timing of acquisition of remotely sensed data may affect biomass estimates, but this effect is relatively limited. There are specific seasonal differences in the biomass of mangroves, with spring biomass usually greater than winter biomass. The size of this difference is related to environment, climate, etc. [
69,
70]. The field survey time of this study was March 2023. A baseline for choosing remote sensing images for the inversion is close to the survey month. Some other months are selected for the following reasons: (1) The data in November 2015 were chosen because there was no Sentinel-2 data before June 2015, and the image’s cloud coverage in the study area was the smallest in November. (2) In 2016 and 2019, we used the data in January because of the high cloud coverage in March and April of those years. Using remote sensing images from November or January may result in lower biomass estimates, but this is not expected to be significant. The reason is that there are specific seasonal differences in the biomass of mangroves. The study area has abundant rainfall, is warm and humid, and has a mild climate. The difference in light and temperature between winter and spring is insignificant (the average annual temperature range is about 13.0–20.0 °C), which will not significantly impact biomass estimation.
Because of the limitations in the data availability, the input and output indicators for the Super-SBM-based framework are not comprehensive enough, and the DMUs are based on the county level. The obtainment of highly refined wetland carbon stock assessment results is difficult. Further studies could consider expanding the indicators in this framework and conducting more precise analyses based on a finer scale, such as grid level. For example, wetland carbon emissions include the emissions produced by human activities and those released through wetland biological respiration and organic matter decomposition. Therefore, a more precise efficiency assessment is expected if future studies include the latter carbon emissions as a new output indicator.
The optimization strategies based on slack variables do not consider influencing factors other than inputs and outputs, and the reliability of the results needs to be verified. One possible solution is to employ the Geographically Weighted Regression (GWR) [
71,
72] or Spatiotemporal Weighted Regression (STWR) [
73,
74] models to further explore the spatiotemporal heterogeneity affected by different driving factors after the safety assessments.


 ,
, 

