Article

Radar-Based Precipitation Nowcasting Based on Improved U-Net Model

1
Tianjin International Engineering Institute, Tianjin University, Tianjin 300072, China
2
State Key Laboratory of Hydraulic Engineering Intelligent Construction and Operation, Tianjin University, Tianjin 300350, China
*
Author to whom correspondence should be addressed.
Remote Sens. 2024, 16(10), 1681; https://doi.org/10.3390/rs16101681
Submission received: 3 March 2024 / Revised: 16 April 2024 / Accepted: 2 May 2024 / Published: 9 May 2024
(This article belongs to the Special Issue Remote Sensing in Natural Resource and Water Environment II)

Abstract

:
Rainfall nowcasting is the basis of extreme rainfall monitoring, flood prevention, and water resource scheduling. Based on the structural features of the U-Net model, we proposed the Double Recurrent Residual Attention Gates U-Net (DR2A-UNet) deep-learning model to carry out radar echo extrapolation. The model was trained with mean square error (MSE) and balanced mean square error (BMSE) as loss functions, respectively. The dynamic Z-R relationship was applied for quantitative rainfall estimation. The reference U-Net model, U-Net++, and the ConvLSTM were used as control experiments to carry out radar echo extrapolation. The results showed that the model trained by BMSE had better extrapolation. For 1 h lead time, the rainfall nowcasted by each model could reflect the actual rainfall process. DR2A-UNet performed significantly better than other models for intense rainfall, with a higher extrapolation accuracy for echo intensity and variability processes. At the 2 h lead time, the nowcast accuracy of each model was significantly reduced, but the echo extrapolation and rainfall nowcasting of DR2A-UNet were better.

1. Introduction

In recent years, extreme rainfall has led to frequent flooding as a result of climate change, natural variability, and human activity [1]. Accurate and timely rainfall nowcasting is the key to flood forecasting, which is critical to flood prevention and mitigation efforts [2,3]. Precipitation is typically measured by rain gauges, which have poor temporal and spatial representativeness and struggle to capture the regional variability of rainfall [4], thus affecting the forecasting accuracy of rainfall-runoff models [5]. For rainfall nowcasting based on radar echo extrapolation by tracking the trend of radar echo reflectivity maps, the relationship between radar reflectivity and rainfall intensity is utilized to achieve the rainfall nowcast for the next 0–2 h in localized areas [6]. Coupling the results of rainfall nowcast with hydrological forecasting can extend the runoff forecasting lead time [7]. Because of the high accuracy and timeliness requirements, precipitation nowcasting has emerged as a popular research topic in the hydrometeorology community [8].
Traditional radar echo extrapolation methods include algorithms such as Thunderstorm Identification, Tracking, Analysis, and Nowcasting (TITAN), Storm Cell Identification and Tracking (SCIT), Optical Flow, and so on., but each of them has certain limitations. For example, TITAN suffers from the loss of tracking targets and is not applicable to rapidly changing weather processes, while SCIT is applicable to convective weather but is difficult to forecast complex weather processes. The optical flow method is an operational method for short-range rainfall forecasting, but the accuracy of the echo extrapolation decreases rapidly after 1 h [9,10]. In recent years, machine learning and deep learning have been widely used in many fields; some scholars have introduced them into the field of meteorology to carry out radar echo extrapolation and achieved significant results [11,12,13,14,15,16]. Agrawal et al. [17] converted radar echo extrapolation into an image prediction task by introducing the U-Net model of the Convolutional Neural Network (CNN) for the first time to carry out echo prediction, and the results outperformed the traditional extrapolation methods. According to Hu et al. [18], the main benefits of U-Net are its straightforward structure and adaptability to task requirements, which makes it possible to provide more precise small-scale rainfall nowcasting. Therefore, many scholars have restructured and improved the U-Net model in terms of convolutional blocks, sampling layers, skip connection layers, and attention mechanisms to make it suitable for the echo extrapolation task, and compared it with the traditional echo extrapolation methods and reference models to show the good performance of the optimized model [19,20,21,22,23].
The Z-R relationship has a major impact on the accuracy of nowcasting rainfall, even with the high spatial resolution of radar data [24]. The new generation of Doppler weather radars in China commonly uses Z = 200R1.6 and Z = 300R1.4 to estimate rainfall; however, there are certain practical application limitations that make weather-radar-estimated rainfall unsuitable for direct use in small- and medium-sized watershed flood forecasting. An optimized Z-R relationship based on measured data can give a more accurate rainfall estimation. Alfieri et al. [25] proposed a globally optimal method to continuously adjust the Z-R relationship coefficients in time considering the short calibration windows based on rain gauge data and achieved a better accuracy of rainfall estimation. In order to apply a more representative Z-R relationship to a single rainfall storm, Guo et al. [26] proposed an improved radar rainfall approach based on the reflectivity threshold and the Storm Cell Identification and Tracking (SCIT) algorithm, combined with the reflectivity classification. This approach demonstrated significant benefits in practical applications. Zhang et al. [27] suggested that a more accurate precipitation estimation can be realized by dynamically adjusting the Z-R relationship based on measured data.
Due to the successful application of U-Net in the field of rainfall nowcasting, this paper proposed the Double Recurrent Residual and Attention Gates U-Net (DR2A-Unet) obtained by improving U-Net, to carry out the extrapolation of radar echoes for three typical rainfall processes in the Liulin experimental watershed in 2021 and 2022 for the 1 h and 2 h lead times. The reference U-Net model, U-Net++, and the ConvLSTM were used as control experiments to carry out radar echo extrapolation. The classical Z-R relationships, the optimized Z-R relationships, and the dynamic Z-R relationships were then used to carry out hour-by-hour quantitative precipitation estimation (QPE) with ground truth echoes. The dynamic Z-R relation with the optimal accuracy was used to carry out quantitative rainfall forecasting, in order to evaluate the applicability of the different deep-learning models and loss functions in echo extrapolation and rainfall nowcasting.

2. Study Area and Data

2.1. Study Area

The Liulin experimental watershed in Xingtai City, Hebei Province, China, was selected as the study area. As shown in Figure 1, the outlet of the basin is located at 114°21′E, 37°17′N, and there is a Liulin hydrological station deployed for flow observation, with a total of five rain gauges in the basin. The watershed is high in the west and low in the east, with a watershed area of 57.4 km2, a main channel length of 13.2 km, and a watershed slope of 30.9‰. The flood season is from June to September, and the local area of short ephemeral precipitation occurs frequently.

2.2. Typical Rainfall Data

The rainfall data were obtained from the Hydrological Survey and Research Center of Xingtai City, Hebei Province China. The hourly rainfalls during the flood season were collected at five rain gauges in the basin, namely, Pusaling, Shentou, Renzhuang, Anshang, and Liulin. The typical rainfall processes corresponding to the time period of the radar echoes were filtered out to evaluate the accuracy of the nowcasting. Considering the representativeness of different types and intensity levels of rainfall processes, three rainfall events in 2021 and 2022 were selected for the study. The rainfall processes are shown in Figure 2, and the information is shown in Table 1. The 20210721 rainfall event lasts for 7 h, and the rainfall intensity reaches 25 mm/h at 19:00 and 22:00, while the rainfall intensity at other times is less than 10 mm/h. The rainfall duration of 20211005 and 20221001 are 10 h, and the rainfall intensity of the process is not more than 10 mm/h.

2.3. Radar Echo Dataset

The radar information was obtained from the S-band Z9311 radar station in Shijiazhuang, Hebei Province, China. The radar is located at 114°42′50′′E, 38°21′00′′N, which has a scanning radius of 230 km and is capable of performing nine different elevation scans in a 6 min time step. The Liulin experimental watershed is located within the radar scanning radius of 120 km, which can ensure the quality of the radar scanning data. The radar-based data were coded and converted, clutter suppressed, attenuation revised, feature occlusion revised, and co-ordinates converted to form a reflectance hybrid scanning data map. The processed echograms were cropped to a range of 128 rows and 128 columns around the watershed (113°36′36″E, 37°30′36″N to 114°53′24″E, 36°47′24″N) for model training and testing. The dataset contains 20,000 echo maps generated by volume scans from June 2018 to October 2020. It was divided into a training set and a validation set according to an 8:2 ratio for model training. The radar echo maps corresponding to the three typical rainfall events described in the previous section are used as the test set, and the occurrence time of the three rainfall events was independent of the radar echo time of the training set and the validation set.

3. Methods

3.1. Deep-Learning Models

3.1.1. Control Model

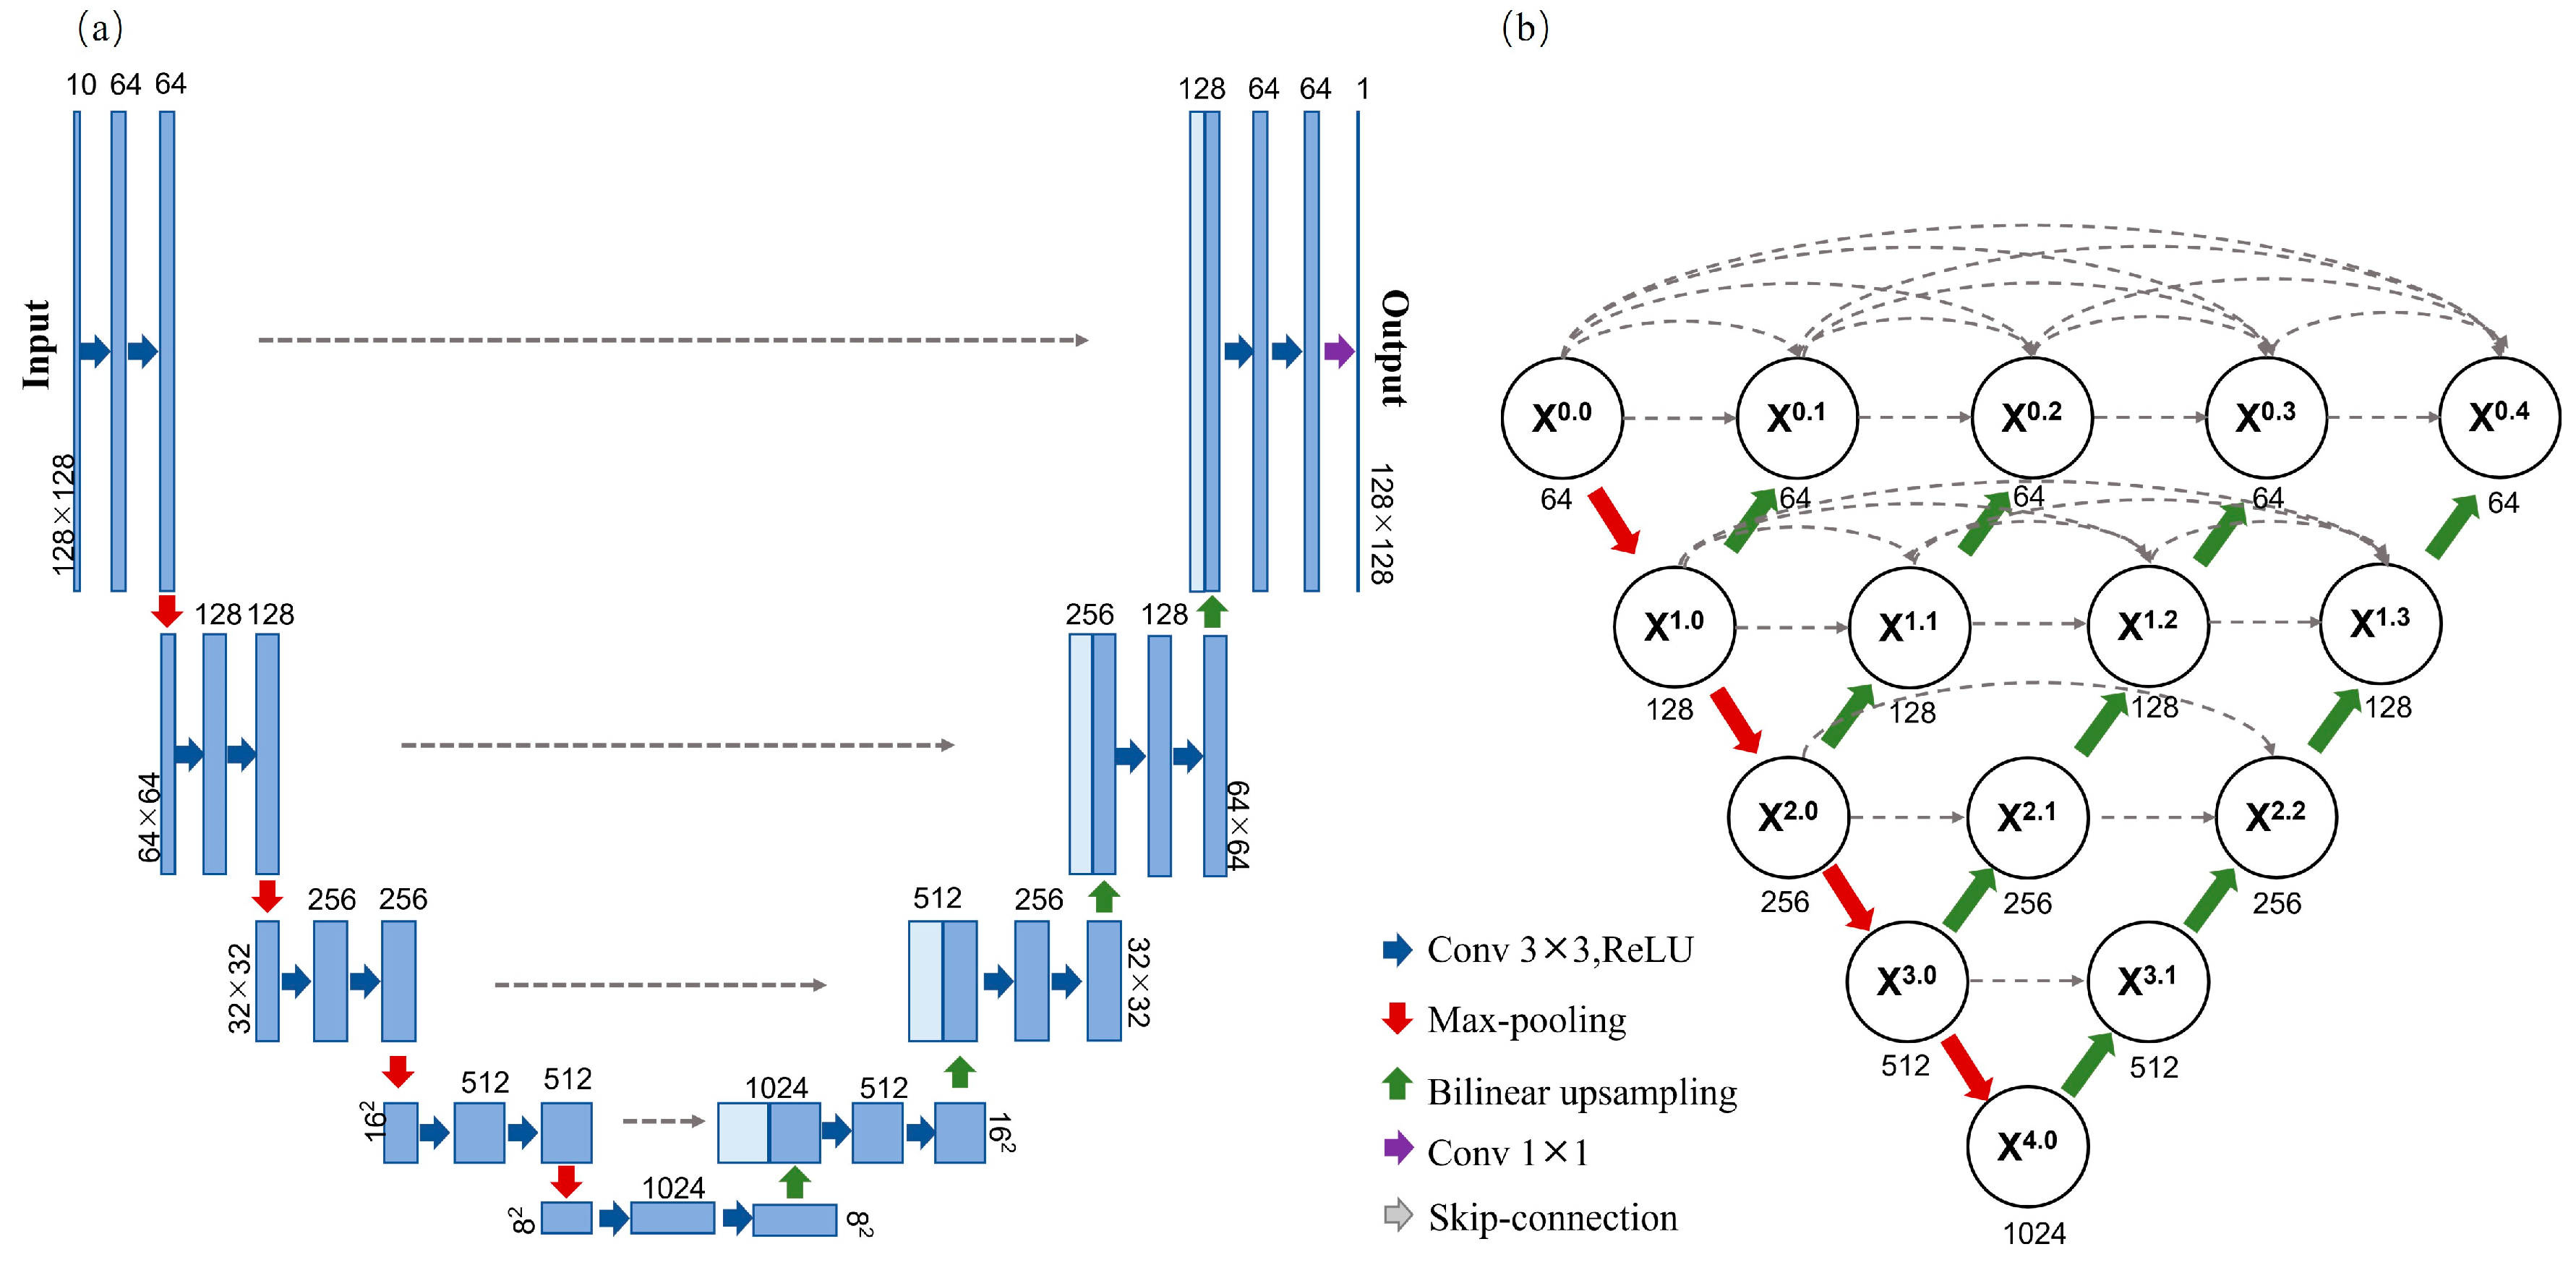
The U-Net model is a convolutional neural network, as shown in Figure 3a. The U-Net network consists of an input layer, a convolutional layer, a pooling layer, an activation function, and an output layer, with an overall U-shaped symmetric structure. The left side is the encoder part for feature element extraction, which applies max-pooling (red arrows) and a double convolution (blue arrows) to reduce the image size and double the number of feature maps, respectively. The encoder realizes image feature extraction and image dimensionality reduction through the convolutional layer and pooling layer. The input echo map with a resolution of 128 × 128 is formed into a preliminary feature layer of [128 × 128 × 64] in the first layer of convolution, a feature layer of [64 × 64 × 64] is obtained after downsampling, and another preliminary feature layer of [64 × 64 × 128] is obtained in the second layer of convolution, and a feature layer of [32 × 32 × 128] is obtained after downsampling, and so on. Finally, five preliminary and effective feature layers are obtained, which are subject to feature fusion in the decoder. The right side is the decoder part for feature element reduction, which realizes feature reduction through upsampling and skip-connected feature fusion, and, finally, outputs the forecast result through the convolutional layer at the end. The bilinear interpolations (green arrows) are used for upsampling operation to double the feature map size, the skip connections (grey arrows) are to enable U-Net to preserve fine-scale information from shallower layers, and the last layer is a 1 × 1 convolution (purple arrow) which outputs a single feature map representing the value predicted by the network. On the basis of U-Net, nested dense skip connections are added to U-Net++, which integrates features at different levels, adds more feature splicing operations than U-Net, and can capture fine-scale features more effectively. The Nested-Unet is depicted in Figure 3b, with each encoder subnetwork being followed by a decoder subnetwork. Fifteen convolutional blocks are present. To implement downsampling and upsampling, each block comprises two convolutional layers and uses max-pooling and bilinear interpolation. Equation (1) is a formal expression of the Nested-Unet:
X i , j = φ ( x i 1 , j ) , j = 0 φ ( [ x i , k ] k = 0 j = 1 , μ ( x i + 1 , j 1 ) ) , j > 0
where φ ( · ) denotes convolution followed by a batch normalization and a ReLU activation function, [·] denotes concatenation and μ ( · ) denotes upsampling, x i , j is the output of node X i , j , i refers to convolutional blocks downwards along the encoder and j depicts the dense convolutional blocks with the skip connections, nodes at level j = 0 receive only one input from the previous layer of the encoder, and nodes at level j > 1 receive j + 1 inputs, of which j inputs are the outputs of the previous j nodes in the same skip pathway, and the last input is the upsampled output from the lower skip pathway.
We treat forecasting as an image-to-image translation problem, where a sequence of n input radar images that start at some point of time 1 and end at time n are provided. Taking the 1 h-lead-time echo extrapolation as an example, 10 radar echo maps are input, 10 radar echo maps are predicted after this time period, and the task of predicting images is realized by rolling the input of echo maps for each time period of a rainfall event.

3.1.2. DR2A-UNet

The Double Recurrent Residual and Attention gates U-Net (DR2A-UNet) is obtained based on the Double U-Net structure improvement, as shown in Figure 4a. Double U-Net [28] network consists of two U-Net networks stacked and combined with each other. The network has two encoder–decoder structures, which improves the image feature extraction ability and feature reduction ability. On this basis, the original convolution block in the network is replaced with residual unit and recurrent convolution (Recurrent Residual; R2) [29], the structure is shown in Figure 4b. The convolution layer of R2 consists of 3 × 3 convolution kernel, Batch Normalization (BN), and Rectified Linear Unit (ReLu). The recurrent residual operations do not increase the number of network parameters; the addition of residual unit can avoid the overfitting phenomenon caused by the network layers being too deep, and, at the same time, avoid the phenomenon of gradient explosion and gradient disappearance. The recurrent convolution makes the model able to better extract the low-level features, which improves the accuracy of the model. In addition, the embedding of the attention gate (shown in Figure 4c) enables it to enhance the extraction of image features while suppressing irrelevant regions, thus ensuring that the network focuses on with the echo image features and improves the accuracy of the decoding results. In the attention gate, input 1 is the feature map before each layer of convolutional skip connection in the coding structure, and input 2 is the feature map before each upsampling in the corresponding decoding structure. Point-by-point addition operation is carried out after the convolution and the attention coefficients are obtained in order to highlight locally important features.

3.1.3. Conv-LSTM

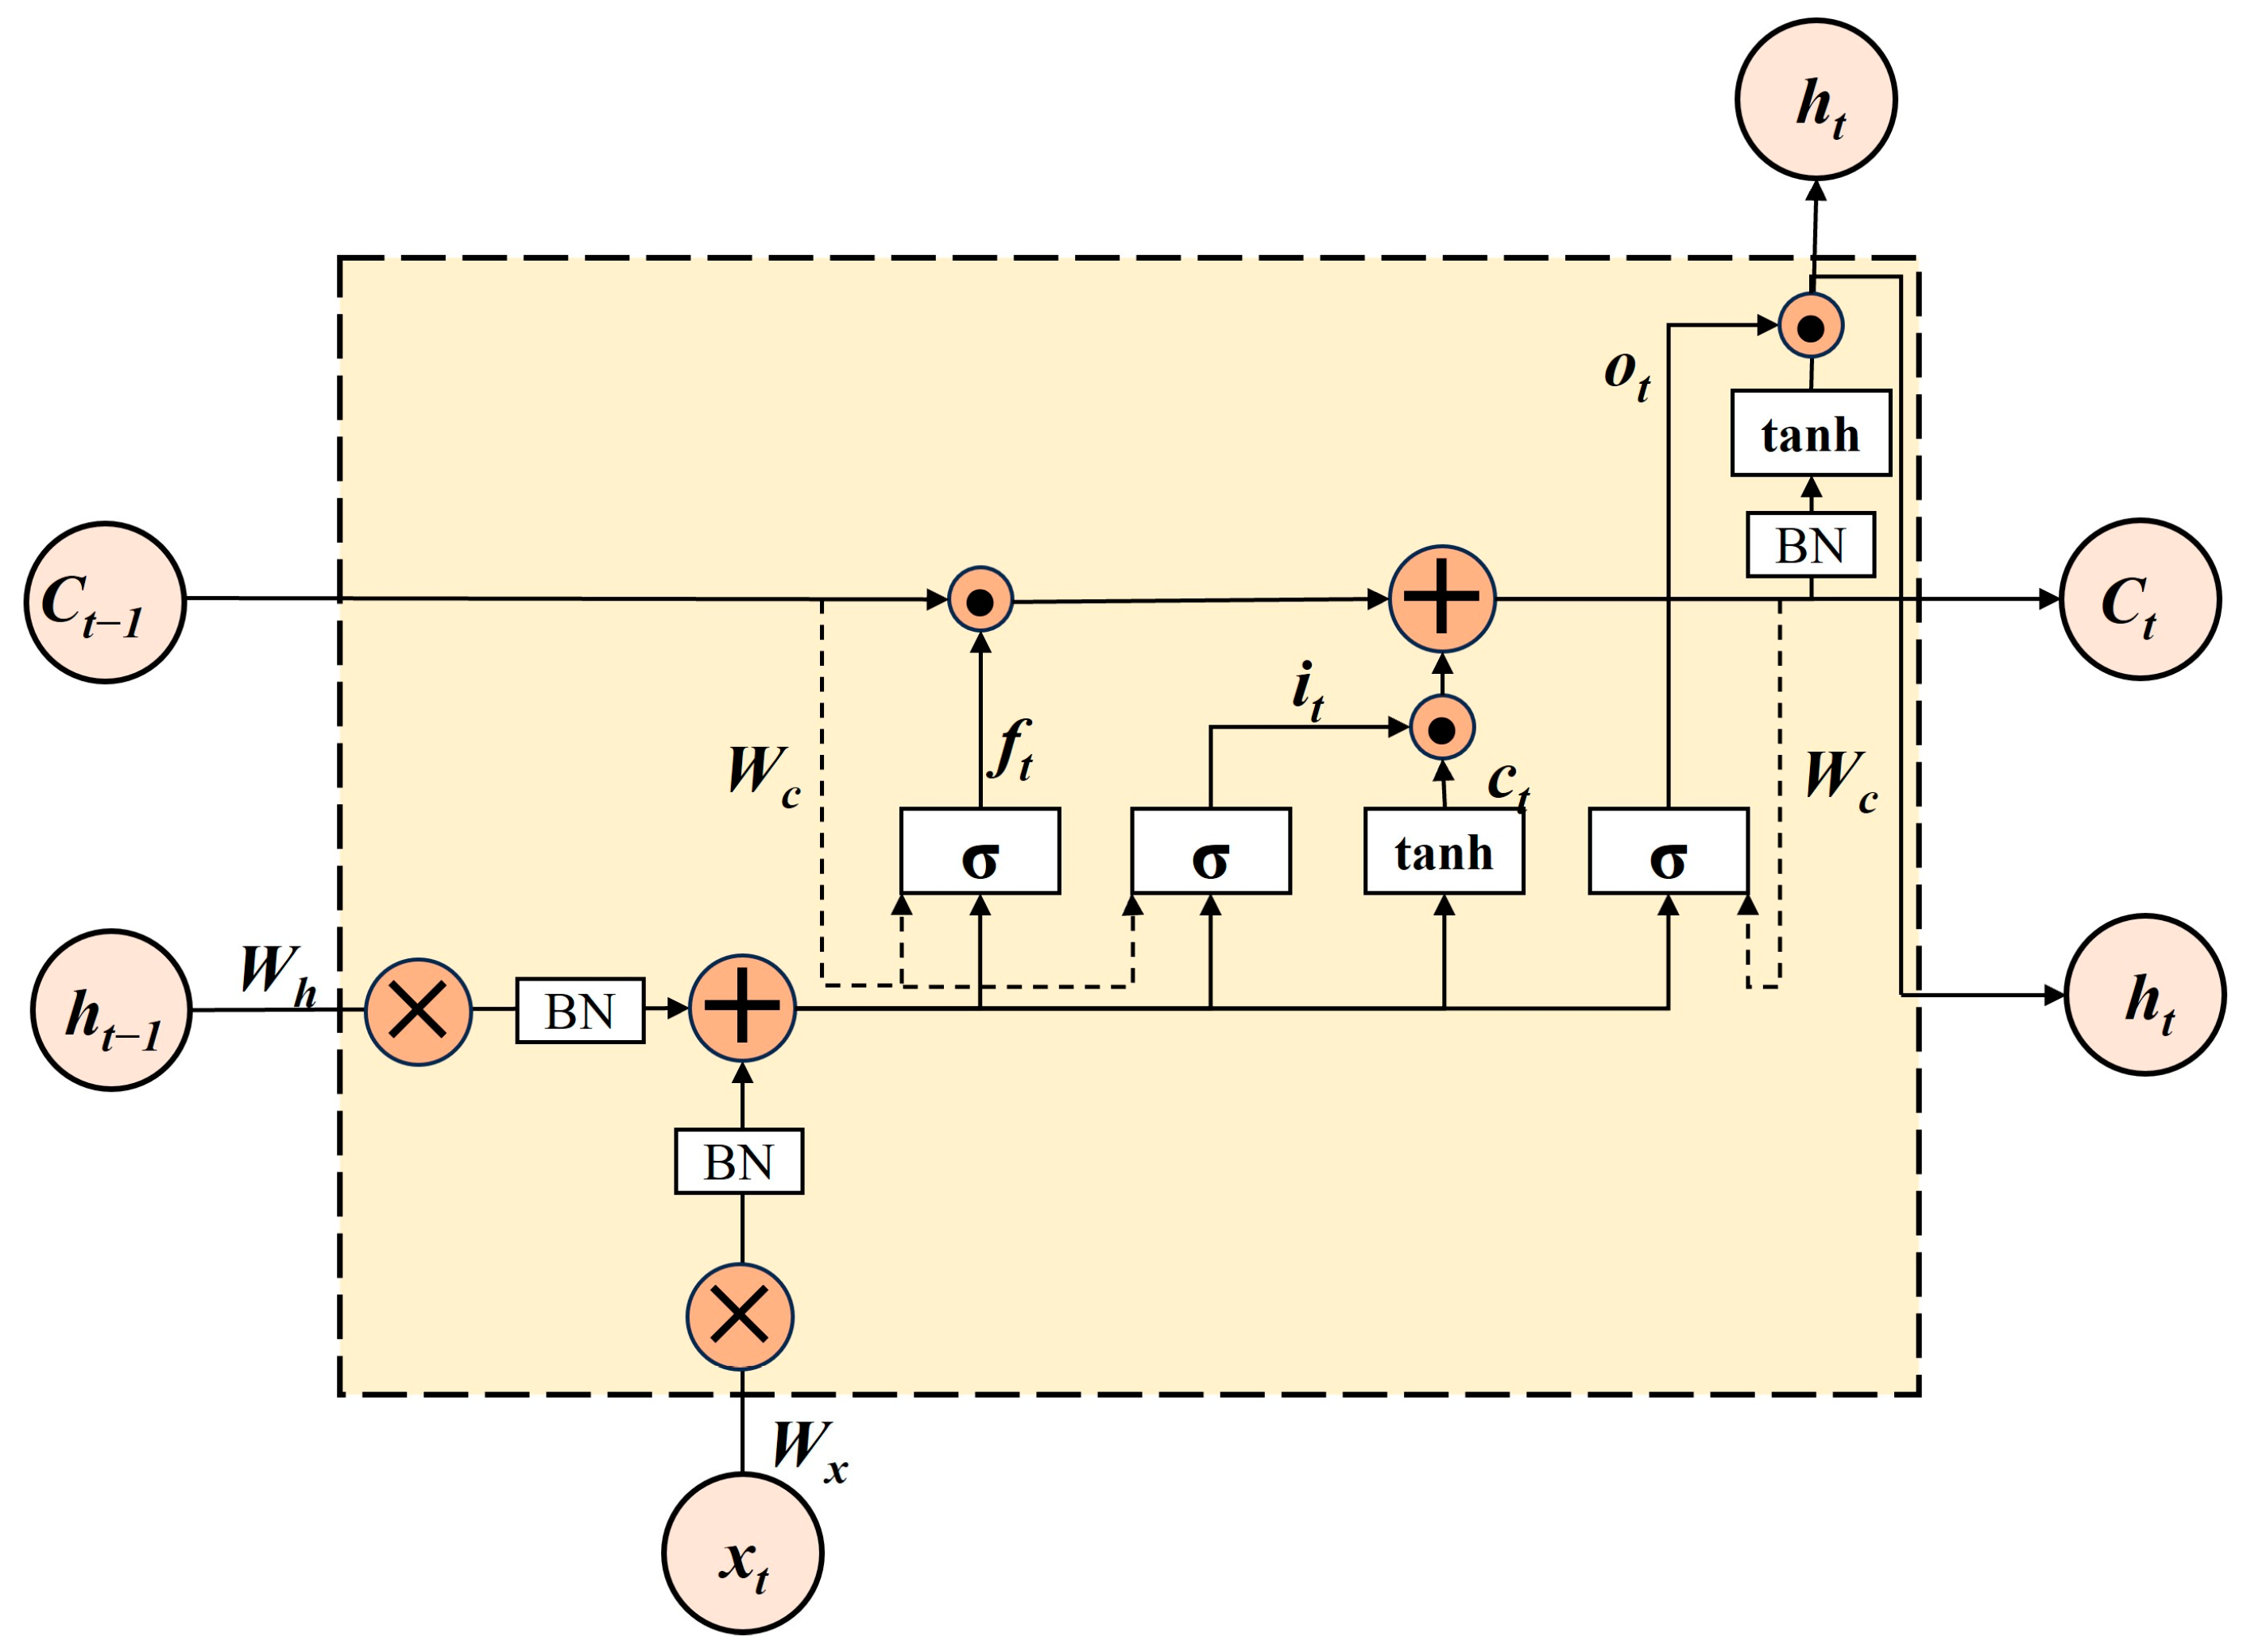
The ConvLSTM model is a combination of convolutional neural networks and long short-term memory model. In this study, ConvLSTM model was used for echo extrapolation as a control test. The unit structure of the ConvLSTM model is shown in Figure 5. The memory cell ct, which serves as an accumulator of state information, is the primary invention of the ConvLSTM, and the model uses forgetting gates (ft), input gates (it), and output gates (ot) to regulate data transfer within the cell. Every gate maintains control over the updating of the cell state and has the ability to selectively retain or delete data passing through it. The hidden state ht, which is propagated to the following unit, is then calculated by multiplying the output gate ot value by the updated cell state after a tanh activation. Equation (2) describes the ConvLSTM neural network. For a detailed structural introduction, see Shi et al. [9]. The model primarily switches from full connections to convolution operations as the internal transfer method for neurons. This allows the model to extract spatial features with great correlation of time dimension. It has been widely used in the application of precipitation nowcasting and other spatiotemporal sequence forecasting.
i t = σ ( W x i x t + W h i h t 1 + W c i c t 1 + b i ) f t = σ ( W x f x t + W h f h t 1 + W c f c t 1 + b f ) c t = f t c t 1 + i t tanh ( W x c x t + W h c h t 1 + b c ) o t = σ ( W x o x t + W h o h t 1 + W c o c t + b o ) h t = o t tanh ( c t )
where ‘°’ denotes the Hadamard product, ‘*’ denotes the convolutional operator, ‘σ’ represents the sigmoid activation function, it denotes the input gates, ft denotes the forgetting gates, ot denotes the output gates, ct denotes the current state of the moment, ct−1 denotes the status of the previous moment, ht denotes the final output, W denotes weight coefficient, and b denotes the corresponding bias coefficient.

3.2. Loss Function

In the echo extrapolation task of deep learning, the commonly used loss function was the mean square error (MSE), but a large number of studies had shown that it tends to cause blurring of the predicted images, making the extrapolation of strong echoes less effective [30,31]. The balanced mean square error (BMSE) could somewhat attenuate the blurring of the prediction images caused by the increase of the forecast lead time [23]. Therefore, in this study, the MSE and BMSE loss functions were used to carry out the model training, respectively, and compare the effects of different loss functions on the prediction. Each loss function is shown in the following Equations (3) and (4). The weight changes with the radar reflectivity value and is designed as Equation (5).
M S E = 1 N i = 1 N i = 1 128 j = 1 128 y n , i , j y ^ n , i , j 2
B M S E = 1 N n = 1 N i = 1 128 j = 1 128 w n , i , j y n , i , j y ^ n , i , j 2
w ( x ) = 1 , 2 , 5 , 10 , 30 , x < 10 10 x < 20 20 x < 30 30 x < 40 40 x
where y n , i , j , y ^ n , i , j are the observed and forecasted echoes at a pixel point, respectively, N is the total number of pixel points in the image, w n , i , j is the weight of the (i,j) th pixel in the n-th image, and x represents the radar reflectivity value.

3.3. Experimental Setup

Based on the Pytorch, 1 h and 2 h-lead-time echo extrapolation was carried out on NVIDIA Geforce RTX 3050. Taking the 1 h-extrapolation dataset as an example, the 10 echo maps of first hour were taken, and the 10 echo maps of second hour were predicted (2 h extrapolation was carried out by taking the first 20 maps, and predicting the second 20 maps). Then, hourly rainfall intensity was forecasted by quantitative rainfall estimation method on a rolling basis; the horizontal resolution of the forecast corresponds to the grid of the radar echogram and is 1 km × 1 km. The Adam optimizer was used for training for a total of 200 rounds; the initial learning rate was set to 0.001. When the loss function did not increase within four rounds, the learning rate was automatically reduced by 10%, and the batch size was set to 4.

3.4. Quantitative Rainfall Estimation

There is a computational relationship of dBZ = 10log(Z) [32] between radar echo intensity and radar reflectivity factor Z. The reflectivity factor (Z) can be realized by Z = ARb for the calculation of rainfall intensity (R). The optimization method uses the error discriminant function (CTF2) to determine the error between the estimated rainfall and the actual rainfall, as in Equation (6). The coefficients of the Z-R relationship are adjusted to minimize CTF2 to determine the optimal coefficients. Based on the optimization method, the dynamic Z-R relationship adjusts the hourly relationship coefficients for rainfall estimation. Specifically, the range of parameter A is 16~1200, divided by 20 intervals, and the range of parameter b is 1~2.87, divided by 0.05 intervals. The CTF2 corresponding to each set of parameters is calculated by using the radar reflectivity data of the previous hour and the actual rainfall data to obtain a set of optimal parameters for the rainfall estimation in this time period.
In this study, the dynamic Z-R relationship method and the fitting of historical data to obtain Z = 125R1.12 for the optimized method, as well as the classical Z = 300R1.4 for the 20210721 event, and Z = 200R1.6 for the 20211005 and 20221001 events were used to carry out quantitative rainfall estimation of the ground truth radar echo maps to evaluate the error of each method. Finally, a dynamic Z-R relationship with high estimation accuracy was used to nowcast rainfall.
C T F 2 = min i = 1 ( ( R i G i ) 2 + R i G i )
where Ri is the calculated precipitation and Gi is the measured precipitation.

3.5. Evaluation Metrics

The binary evaluation indices of probability of detection (POD), false alarm rate (FAR), critical success index (CSI), and F1 score were used for the evaluation of the radar echo extrapolation accuracy as in Equations (7)–(10). The ranges of POD, FAR, CSI, and F1 are 0–1, the optimal value of POD, CSI, and F1 is 1, and that of FAR is 0.
P O D = T P T P + F N
F A R = F P T P + F P
C S I = T P T P + F P + F N
F 1 = 2 × T P 2 × T P + F P + F N
where TP is the number of grid points where both the observed and predicted radar reflectivity are greater than the threshold; FP is the number of grid points where the observed reflectivity is lower than the threshold, whereas the predicted reflectivity is greater than the threshold; and FN is the number of grid points where the observed value is greater than the threshold, whereas the predicted reflectivity is lower than the threshold.
The correlation coefficient (CC), mean bias, and average relative root mean square error σ were used to evaluate the rainfall nowcast accuracy and correlation, as shown in Equations (11)–(13). In addition, the correlation scatter plots of hourly nowcasted rainfall and measured rainfall at the rain gauges were plotted. The correlation between nowcasted rainfall and measured rainfall was evaluated by calculating the fitted linear equations; σ represents the dispersion of the radar precipitation nowcasting data and the measured precipitation data, the smaller σ represents the better fit between the two; CC represents the linear correlation between the nowcasted and measured values; and mean bias indicates the magnitude of error in the radar rainfall nowcasting compared to the actual precipitation measured at the rain gauges. Bias greater than 0 indicates that the nowcasted results are larger than the measured results; bias smaller than 0 indicates that the nowcasted results are smaller than the measured results; and the closer the value of bias is to 0, the smaller the difference is.
C C = i = 1 N ( y i y i ¯ ) ( p i p i ¯ ) i = 1 N ( y i y i ¯ ) 2 i = 1 N ( p i p i ¯ ) 2
B i a s = 1 N i = 1 N ( y i p i )
σ = 1 N i = 1 N ( y i p i ) 2 1 2 / p ¯
where yi represents the forecasted rainfall, pi represents the measured rainfall, and N represents the total number of samples.

4. Results

4.1. Echo Extrapolation Results of Different Deep-Learning Methods

In this study, 20 dBZ (corresponding rainfall intensity is 0.5 mm/h) and 30 dBZ (corresponding rainfall intensity is 5 mm/h) [15] were used as thresholds to evaluate the method of nowcasting precipitation at different intensities. The 0/1 matrix was calculated for analyzing whether the reflectivity level exceeds the defined threshold. Table 2 shows the evaluation metrics of the 1 h lead time results of each deep-learning model for different intensity echo thresholds. All deep-learning models outperform the prediction of 20 dBZ threshold echoes when compared to the prediction of 30 dBZ threshold echoes, as it was shown in Han et al. [19]. The results predicted using the BMSE loss function achieved an improvement in POD, CSI, and F1 scores over those predicted by the MSE loss function, which suggested that the model trained using the BMSE has a higher accuracy for echo extrapolation. Compared to the reference U-Net model, the UNet++, DR2A-UNet demonstrates an improved accuracy of echo extrapolation. For the 20210721 rainfall event, the echoes extrapolated by DR2A-UNet using the BMSE loss function with 20 dBZ and 30 dBZ thresholds outperformed the other models in all evaluation metrics, and showed a significant improvement over the U-Net model, with POD and CSI reaching 0.86, 0.47 and 0.71, 0.31, respectively. U-Net++ with BMSE had higher CSI and F1 scores and a smaller FAR for the 20221001 event with less intense rainfall, but DR2A-UNet had a higher POD of 0.77 for that event. DR2A-UNet also achieved the best extrapolation results for the 20211005 rainfall events with smaller rainfall intensities. Since most of the echoes for the 20211005 and 20221001 rainfall events were smaller than 30 dBZ, and the change of the echo process was relatively slow, the use of the BMSE loss function still failed to comprehensively solve the homogenization problem of the predicted echoes, which lead to insignificant differences in the prediction effects of different models. The extrapolation accuracy of the U-NET model was close to that of the Conv-LSTM model, and all the evaluation indices of the extrapolated echoes of the DR2A-UNet model are significantly improved compared with those of the Conv-LSTM model. The results show that DR2A-UNet improved the accuracy of echo extrapolation compared with the commonly used RNN model.
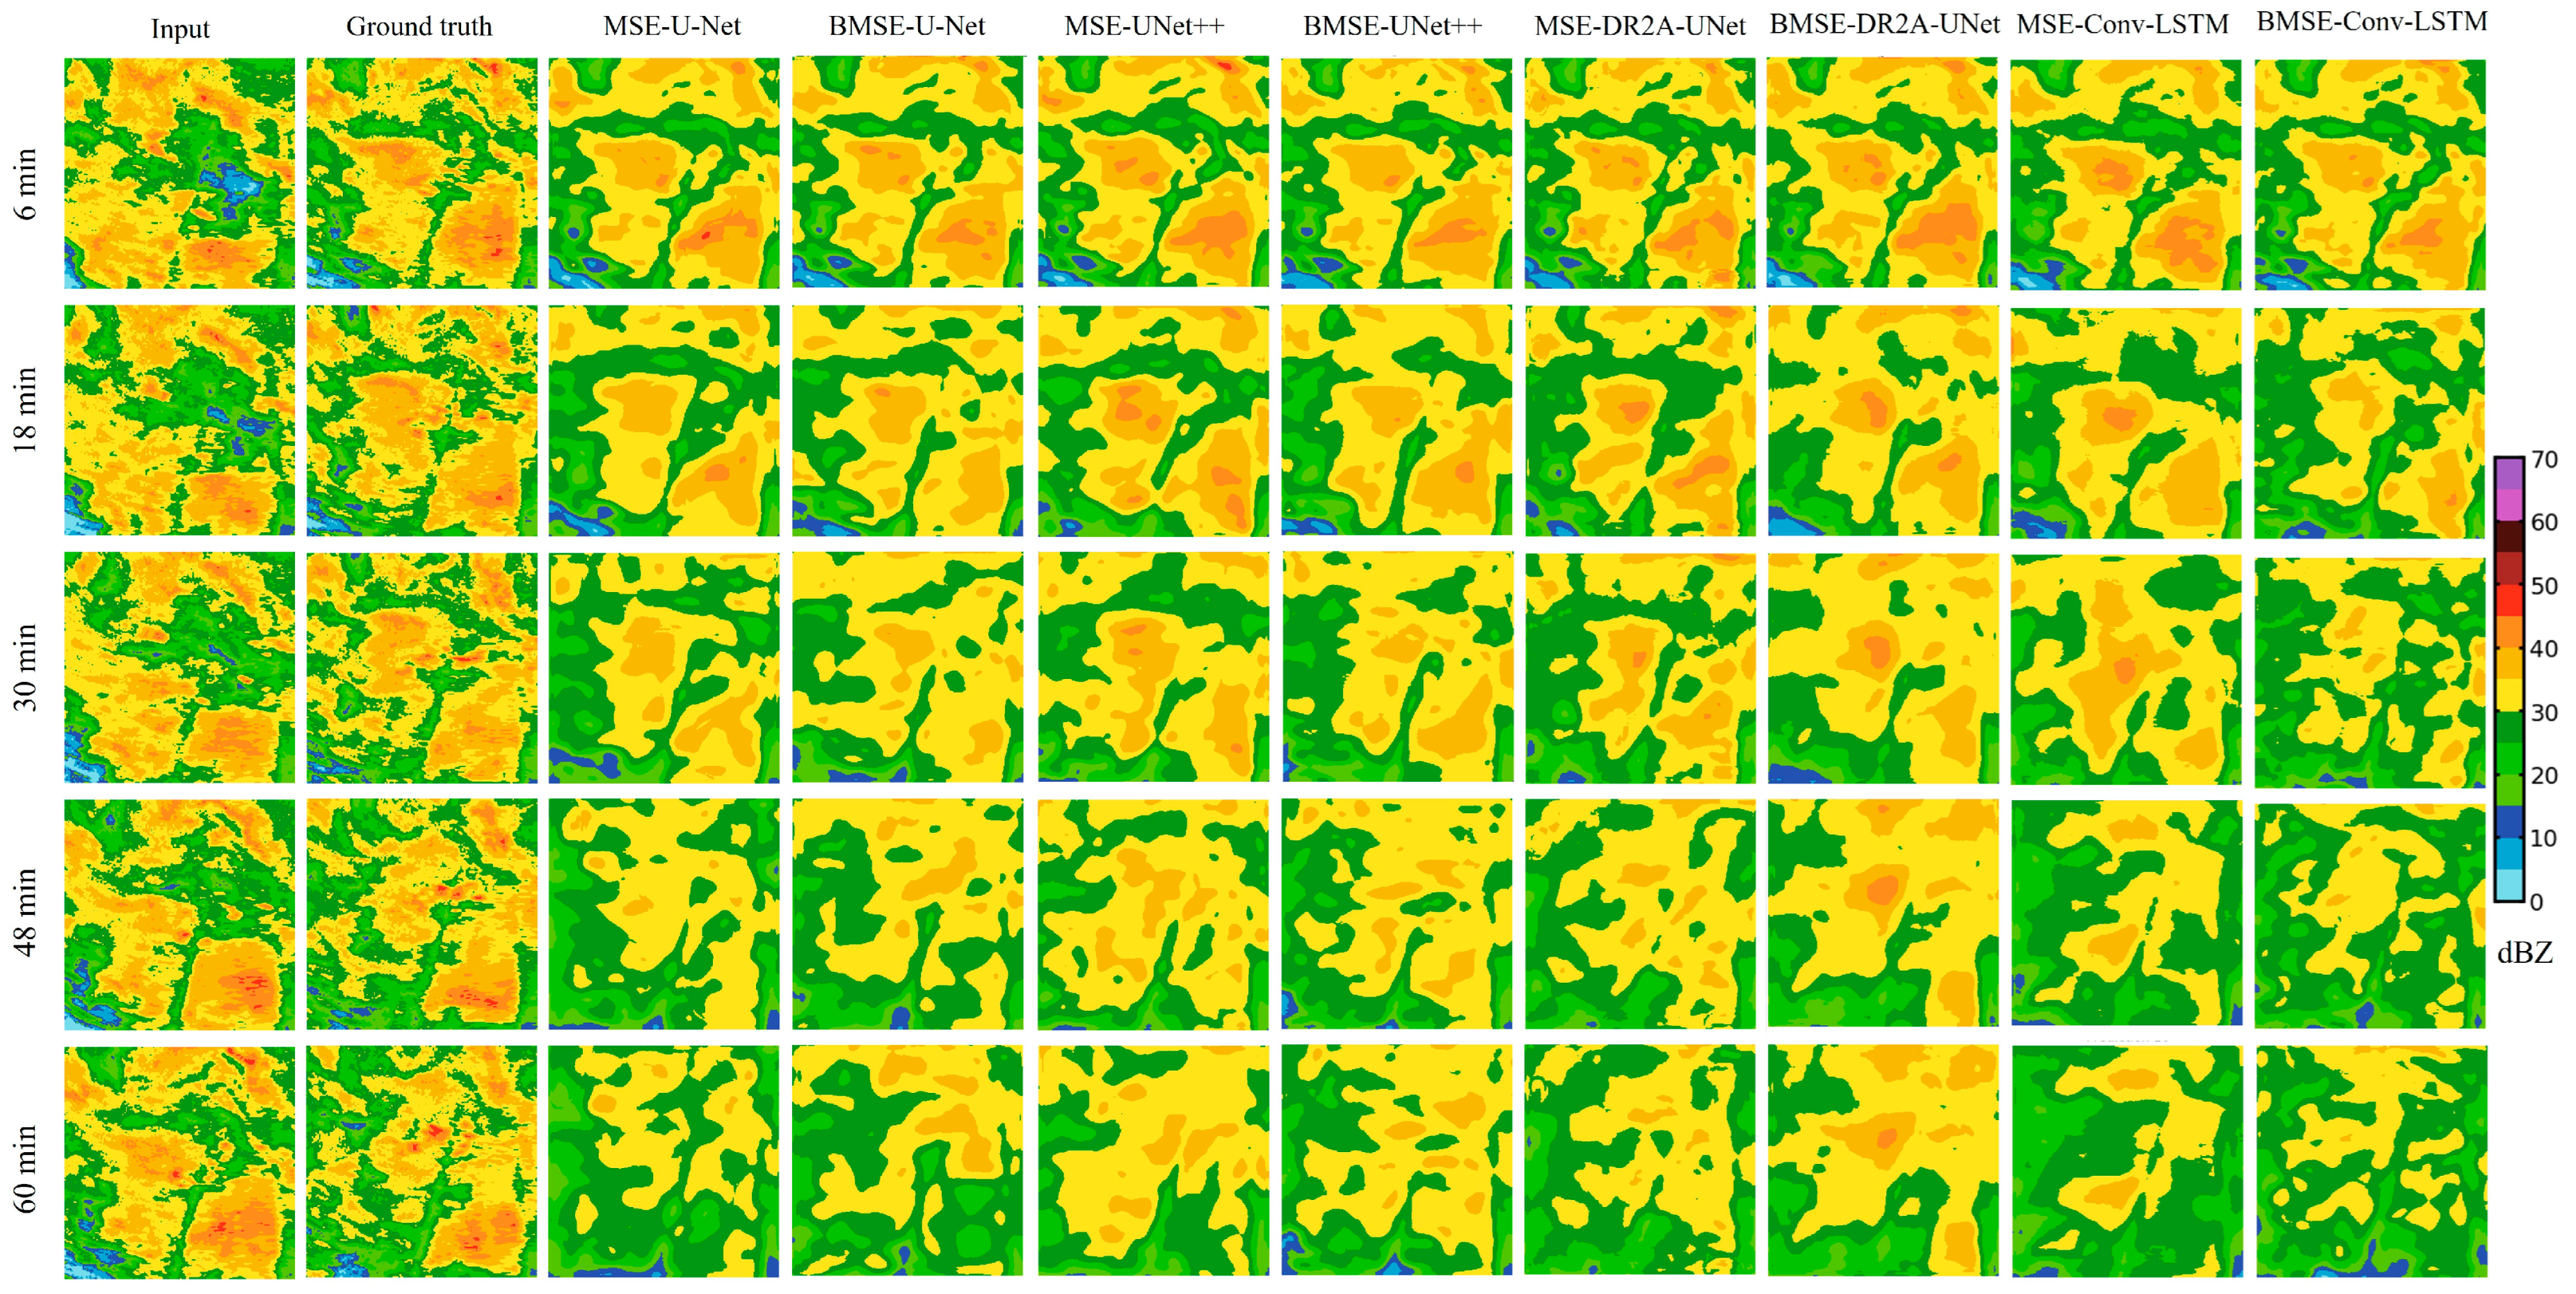
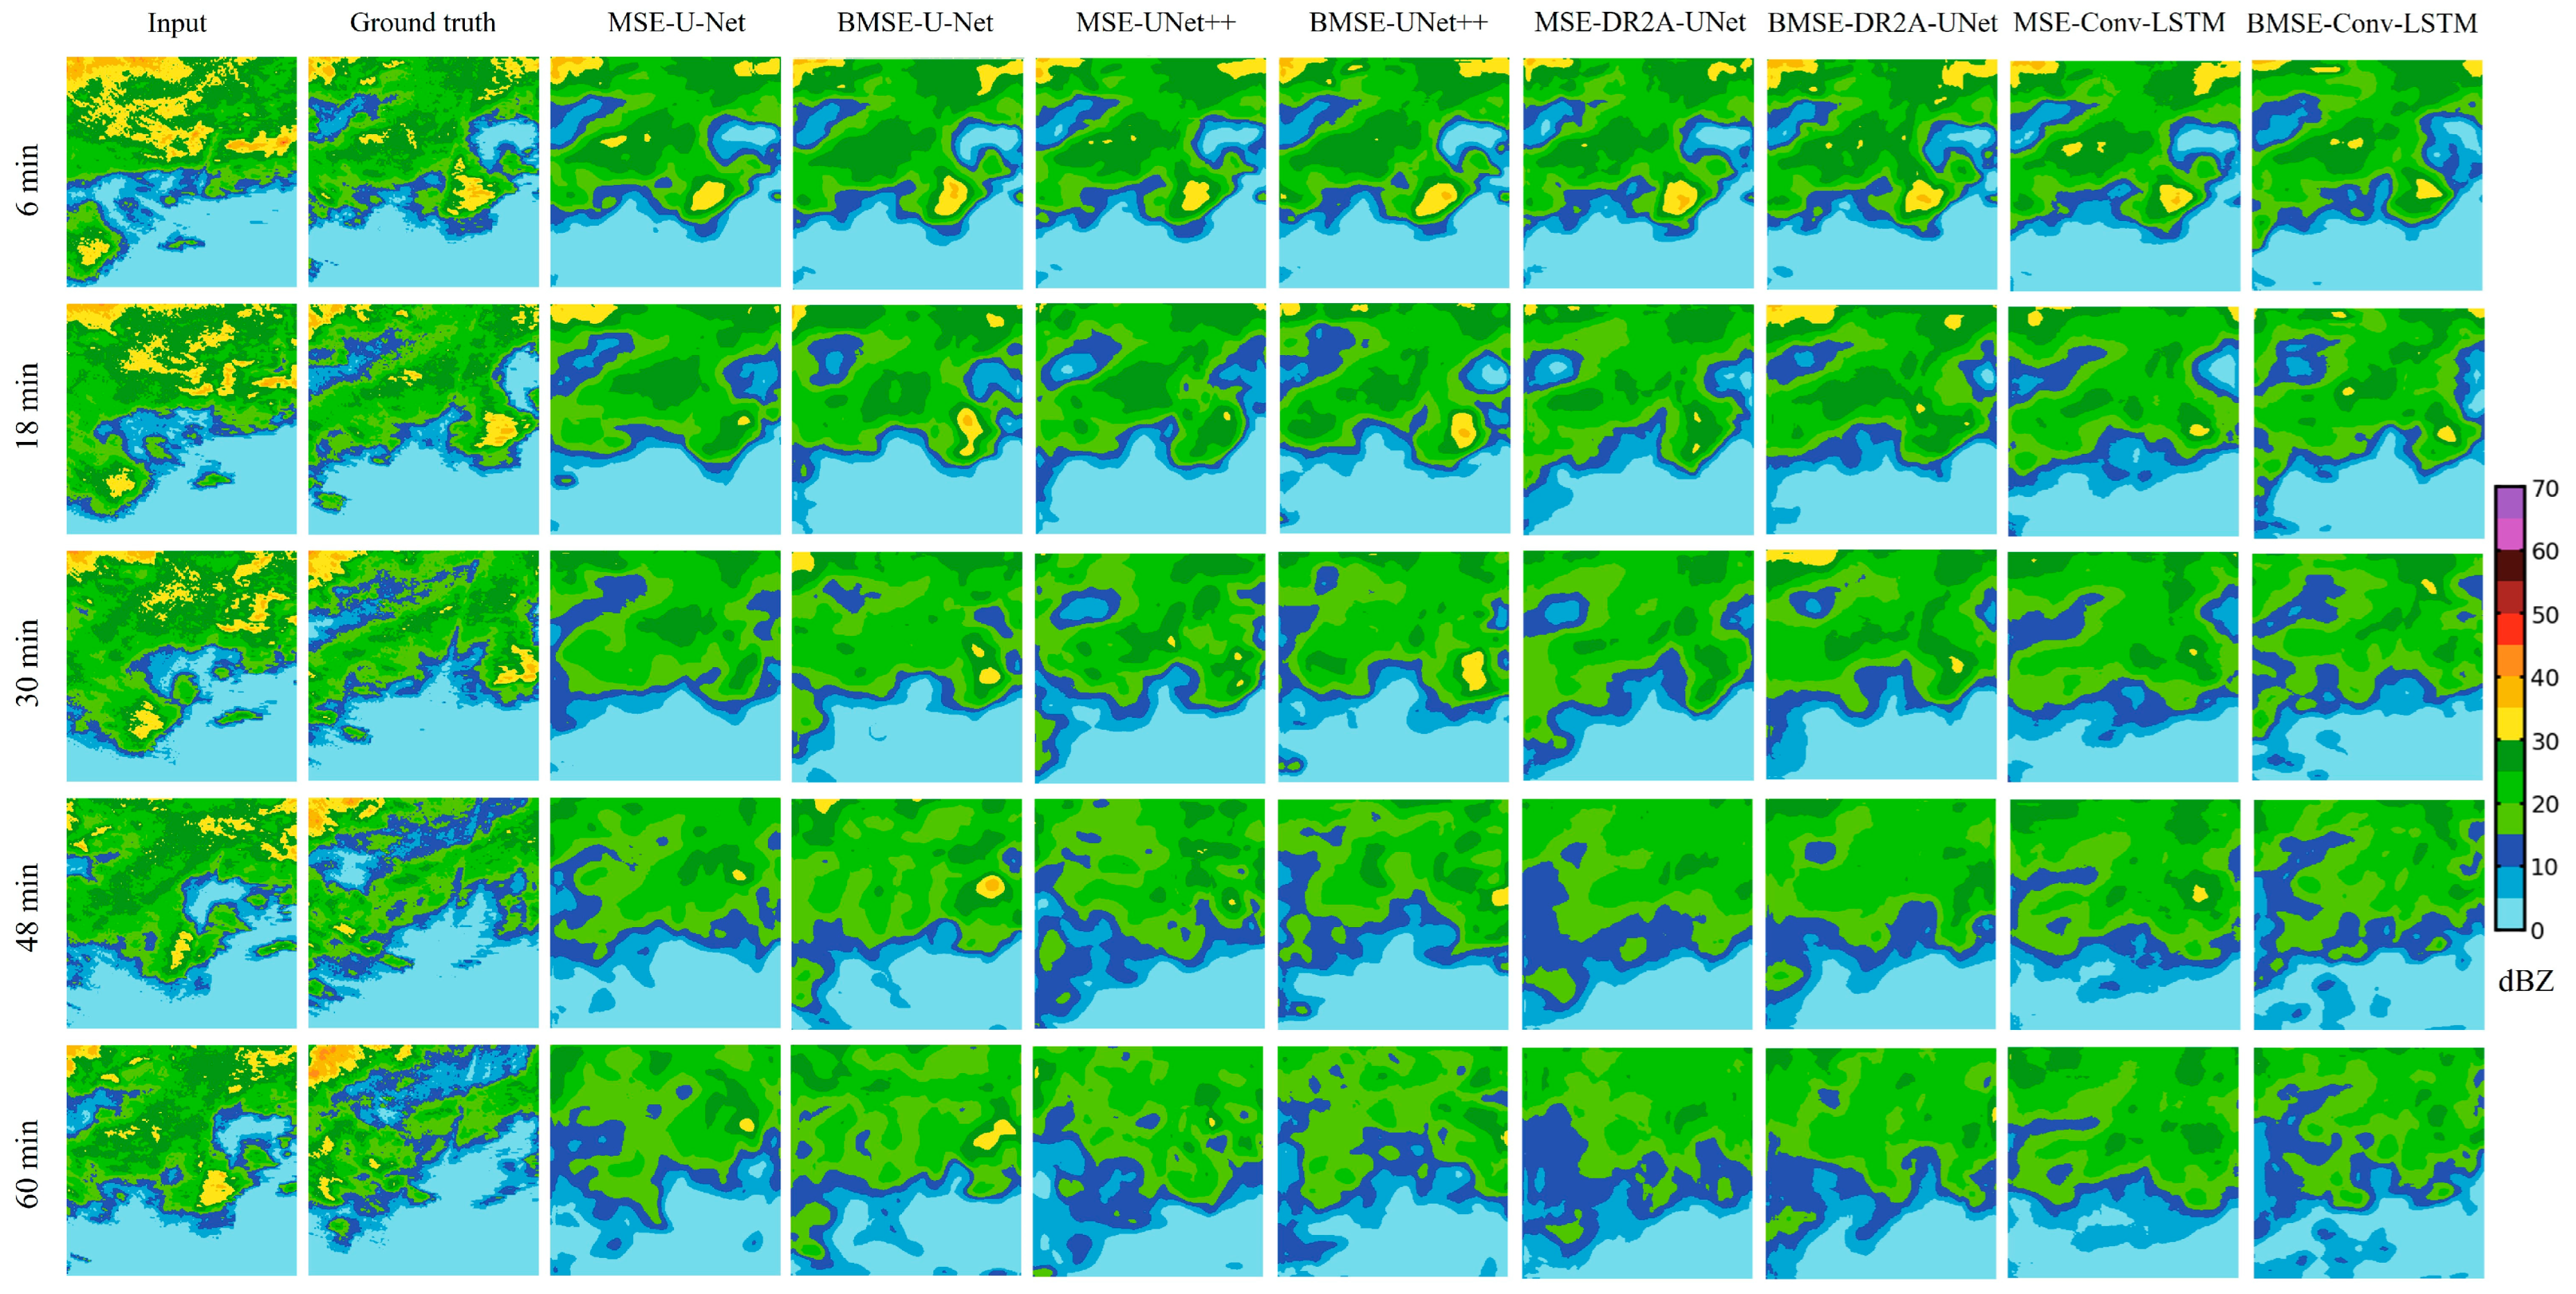
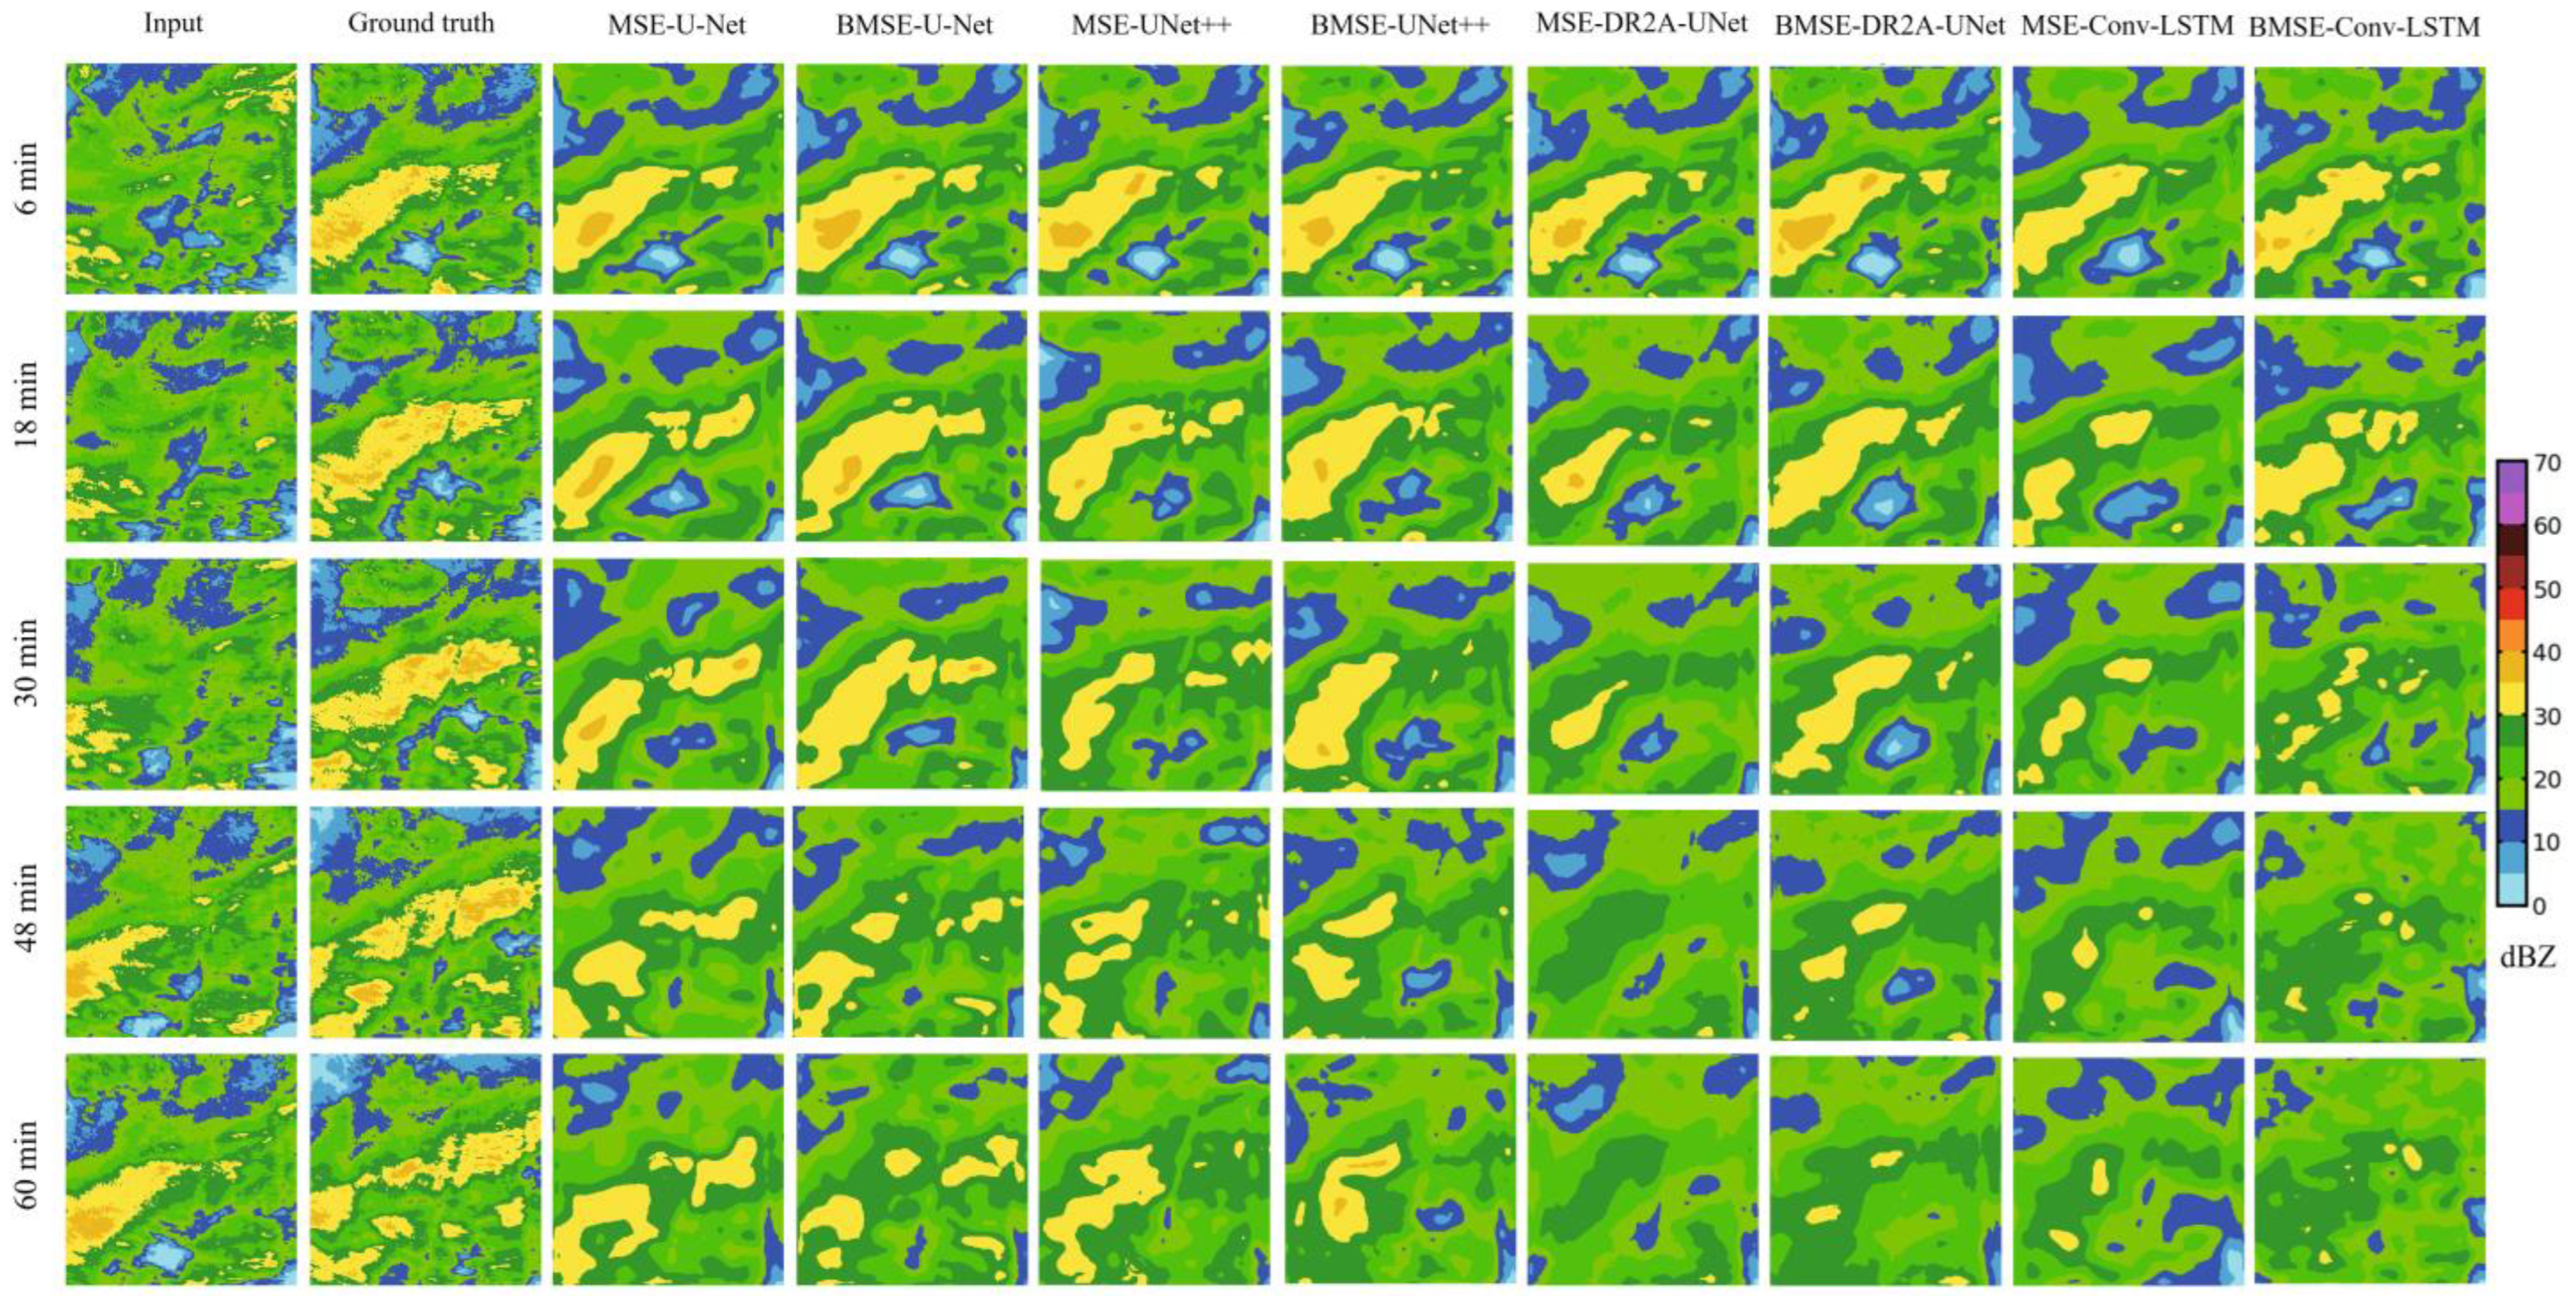
In order to visually compare the extrapolation effect of each model, the 6~60 min prediction effect of a typical echo process was selected for individual case analysis. Figure 6 showed the predicted echoes from 21:00 21 July 2021 to 22:00 21 July 2021, dominated by an echo reflectivity greater than 30 dBZ, with more dramatic local variations. The deep-learning models could predict the details of the echoes and the location of the high-intensity echoes more accurately within a 30 min lead time, but, with the continuation of time, each model showed different degrees of prediction accuracy degradation, and could not accurately predict the formation of the strong echoes above 40 dBZ. The echoes predicted by the model using the MSE loss function had an obvious homogenization tendency, and the contours of the strong echoes were quite different from the actual ones. However, DR2A-UNet with BMSE could predict the formation of localized strong echoes in the image at 60 min, and the location and intensity were closer to the actual. The echo strengths of the 20211005 and 20221001 events were concentrated below 30 dBZ, and the strong echoes developed from west to east. As shown in Figure 7 and Figure 8, in these two rainfall cases, echoes above 30 dBZ appeared only in localized locations in the images. The model using the MSE loss function was unable to accurately predict the changes of the local strong echoes. The model using the BMSE underestimated the strong echoes to a certain extent, but was able to vaguely predict the locations and contours of the strong echoes. The effective prediction time of all the models for the two rainfalls was limited to 30 min.
Overall, the model using the BMSE loss function could predict the formation and development of echoes more accurately, but there was an underestimation and homogenization of strong echoes. Compared with the reference U-Net model and ConvLSTM model, DR2A-Unet can improve the accuracy of echo extrapolation. The extrapolated echo accuracy of the models decreased significantly as the lead time increased, due to the inherent flaws of the deep-learning algorithms that make it inevitable that we will lose more feature information at longer lead times. In addition, the homogenization of the image echoes brought about by the loss function averaging image error also led to a weaker prediction of the echoes, and, therefore, a large amount of detail was lost.

4.2. Echo Extrapolation Results of Different Lead Times

The model with the BMSE loss function had a significantly better 1 h-lead-time echo extrapolation accuracy than the model with the MSE loss function, so the 2 h-lead-time model was trained with the BMSE loss function in order to evaluate the applicability of different deep-learning approaches with a longer lead time, with the evaluation metrics shown in Table 3. The POD, CSI, and F1 scores of the extrapolation results for the 2 h-lead-time model were about 20% lower than those of the 1 h-lead-time extrapolation results, and there was a higher FAR, indicating that the error of the echo extrapolation increased with the lengthening of the lead time. DR2A-UNet achieved relatively good results in the echo extrapolation for the 20210721 rainfall event, but, in the 20211005 and 20221001 event, the difference in the extrapolation accuracy of each model was not significant. Overall, the 2 h-lead-time echo extrapolation was worse than the 1 h-lead-time one, and the extrapolation of DR2A-UNet was better.

4.3. Accuracy Evaluation of Quantitative Rainfall Estimation

The classical Z-R relationship, the optimized Z-R relationship, and the dynamically optimized Z-R relationship were used to carry out the quantitative rainfall estimation of the actual radar echoes for the three rainfall events and correlate them with the measured rainfall from the rain gauge. The evaluation metrics, as shown in Table 4, showed that the rainfall estimated using the dynamically optimized Z-R relationship had a much smaller error from the actual one and had the highest correlation coefficients of 0.41 and 0.65 for the 20211005 and 20221001 rainfall events, respectively, which demonstrated the superiority of the method in quantitative rainfall estimation. The optimized Z-R relationship improved the correlation coefficients of the nowcasted rainfall to some extent over the classical Z-R relationship, but it still suffered from the larger estimation of rainfall errors overall, and the bias in the calculation of the total rainfall was also larger. Figure 9 shows the scatter distribution of the estimated and measured rainfall. In the 20210721 rainfall event, the rainfall estimated by the classical Z-R relationship was generally located below the 1:1 line, indicating that there was a general underestimation of rainfall by the method, while the rainfall estimated by the optimal Z-R relationship was generally overestimated, with most of the points above the 1:1 line, and the dynamic Z-R relationship could result in the estimated rainfall to be more uniformly distributed in the area around the 1:1 line. All three methods had an underestimation of rainfall in the estimation of the 20211005 and 20221001 rainfall events, with most of the points below the 1:1 line, which also led to smaller correlation coefficients for the estimated rainfall, due to the generally weaker echo intensities of these two rainfall events and the smaller rainfall intensity; however, the use of the dynamic Z-R relationship resulted in a lower underestimation of rainfall and a more accurate estimation. Therefore, the dynamic Z-R relationship was used in the subsequent calculations to realize the rainfall nowcasting.

4.4. Evaluation of Rainfall Nowcasting Accuracy

The evaluation indices of rainfall nowcast accuracy are shown in Table 5. In the 1 h-lead-time rainfall nowcasting, DR2A-UNet had a better nowcasting accuracy for the 20210721 event with a correlation coefficient of 0.42 and had the smallest σ and bias of 1.04 and 0.80, respectively, and a correlation coefficient of 0.73 for the less intense 20211005 event, which was the highest value among all the models. This result is related to the better echo extrapolation accuracy of DR2A-UNet, whose POD, CSI, and F1 scores for echo maps from the 20210721 and 20211005 events are all greater than other control models at the 20 dBZ threshold. However, for the 20221001 rainfall event, the nowcast rainfall by DR2A-UNet was slightly worse than that of the U-Net++ model, and there was a large nowcast bias in rainfall totals. Overall, the CC of 20210721 and 20221001 rainfall events by different models did not exceed 0.5, which was caused by outliers in the nowcasted rainfall. The main reason was that the dynamic Z-R relationship will inevitably overestimate strong rainfall and underestimate weak rainfall in quantitative rainfall estimation. In addition, systematic errors in the radar data, the homogenization of echoes generated by deep-learning algorithms, and false alarms in extrapolated echoes will lead to outliers [33]. The 20210721 event has a long rainfall duration and drastic changes in the rainfall process, and the FAR of the echo extrapolation is about 0.5 for the threshold of 30 dbz, resulting in a forecast error for heavy rainfall. Due to the short duration and low intensity of the 20221001 event, the time-scale error has a greater impact on the relevance of the forecast rainfall. In the 2 h-lead-time rainfall nowcasting, DR2A-UNet achieved a good nowcast rainfall correlation and small forecast errors for all three rainfall events, but there were also large nowcast rainfall total deviations. U-Net++ achieved better nowcasts of rainfall totals, but the nowcast rainfall correlation was slightly smaller than that of the DR2A-UNet model and had a larger error. The U-Net nowcasts were the worst of all the models. Overall, rainfall nowcasts for the 2 h lead time were worse than those for the 1 h lead time.
Figure 10 shows the nowcast rainfall process of each model. The maximum rainfall intensity could be captured for the 1 h-lead-time rainfall nowcasting. There were some differences in the hour-by-hour rainfall nowcasting results of different deep-learning models, and DR2A-UNet nowcasted smaller rainfall anomalies and the maximum hourly rainfall was closer to the actual, which was the reason why the nowcasted rainfall had a better correlation and smaller error. For the 20210721 rainfall event, the forecasted maximum rainfall intensity and its occurrence time are consistent with the actual rainfall, but there is a 1 h time lag for the heavy rainfall occurring at 19:00. For the 20211005 and 20221001 rainfall events, of which the duration and intensity are small, the forecasted maximum rainfall intensity is consistent with the actual results, and the occurrence time of the maximum rain intensity of 20211005 event could be accurately forecasted. However, there is a large time lag for the forecasted peak rainfall intensity of the 20221001 event. The main reason is the systematic error of the dynamic Z-R relationship algorithm, which calculates the error discriminant function based on the actual rainfall of the previous time period to obtain the quantitative precipitation estimation parameter for the current time period, which leads to the underestimation of the strong rainfall and overestimation of the weak rainfall for rainfall events with drastic changes in the process, generating outliers [26]. There was a rainfall process bias between the nowcasted rainfall and the actual rainfall for the 2-h lead time, and a large time error between the occurrence of the nowcasted rainfall peak and the actual. The underestimation of the rainfall in each lead time was also more significant, which was consistent with the larger FAR. The models also had a large discrepancy in the nowcast of the hourly rainfall, which led to the correlation coefficients of the 2 h-lead-time rainfall generally being smaller.
Overall, the maximum rainfall intensity could be nowcasted for a 1 h lead time. For both the 20210721 and 20211005 events, the change process of rainfall can be predicted, but, due to the systematic error of the quantitative precipitation estimation method, there are outliers in some periods. For the 20221001 event, due to the low rainfall intensity and short duration, there are large anomalies in the forecasted rainfall. DR2A-UNet forecasted the rainfall peak more accurately with fewer outliers compared to U-Net and U-Net++, and the forecasted maximum rainfall intensity is closer to the actual. The nowcasted rainfall for the 2 h lead time had a large error, and it was more difficult to reflect the actual rainfall process.

5. Discussion

The main innovation of this study was the rapid and effective realization of echo extrapolation and rainfall nowcasting utilizing the Double Recurrent Residual and Attention gates U-Net (DR2A-UNet) and QPE approach. However, it was difficult to produce reliable nowcasts with a long lead time and heavy rainfall with short duration. This conclusion was consistent with Liu et al. [15], who employed a deep-learning strategy and obtained successful outcomes only for short periods of rainfall forecasting.
With the continuation of the extrapolation duration, the accuracy of the echo extrapolation decreases significantly and there is a clear trend of homogenization for strong echoes. The reason for this can be attributed to the fact that deep learning uses a single MSE loss function, causing more feature information to be lost. Tian et al. [31] also pointed out that the MSE loss function is usually unable to simulate radar echo intensities with multimodal and skewed distributions. Since the ratio of reflectivity intensities in radar images is usually unbalanced, some balancing loss functions have been used in many studies when training deep-learning models to extrapolate radar images, giving more weight to strong echoes to avoid echo homogenization [9]. This study follows this idea and uses the BMSE loss function to train a deep-learning model, which leads to some improvement in the homogenization phenomenon. Han et al. [30] used a combined BMSE and BCELoss loss function. Yin et al. [34] carried out radar echo extrapolation using a combined MSE and SSIM loss function, which outperformed the extrapolation with a single loss function. Therefore, in future research, a combined loss function can be used to improve the model accuracy.
Heavy rainfall nowcasts based purely on the radar are judged to be insufficiently precise due to the intermittent nature of fine-scale rainfall [35], complex spatiotemporal variability in rainfall [36], shortcomings in nowcasting algorithms [37], and systematic errors in quantitative rainfall estimation methods [38]. Effective rainfall nowcasting is strongly tied to the ability of raw radar data to capture real rainfall. Therefore, the accuracy can be improved in future research by improving the quantitative rainfall estimation method and correcting the forecasted rainfall bias. According to Tang et al. [39], by taking into account the impact of the complex topography at small spatial scales, a combination of multi-source remote sensing products and deep learning may lead to greater advancements in flood forecasting for natural watersheds. Shehu et al. [35] improved the precision of QPF on a 5 min time scale and 1 km2 geographical scale by combining radar and rain gauge observations for rainfall nowcasting. Bouget et al. [40] combined radar wind and rainfall images to forecast rainfall and produce more accurate predictions than utilizing only radar images. Notwithstanding the simplicity on the aforementioned research of regional spatial variability, the concepts and techniques can serve as a guide for the later implementation of more precise rainfall and flood forecasting with longer forecasting periods. Kou et al. [41] proposed an adaptive rainfall algorithm based on logistic regression model; Na and Yoo [33] proposed a post-processing rainfall nowcasting bias correction method for the real-time correction of nowcasted rainfall and achieved better results in practical applications.
In further research, we will verify the applicability of the deep-learning methods used in this paper through a large number of case studies, and expect to apply the deep-learning technique used in this paper to fine-spatial- and temporal-scale watershed hydrology applications. We will also try to use measured rainfall data to correct radar data and assimilate radial winds to perform rainfall forecasting, with the aim of improving the nowcasting accuracy. An attempt will be taken to fuse forecasts to extend the rainfall forecasting period in order to achieve a higher accuracy and longer-lead-time flood forecasting.

6. Conclusions

This study proposed the Double Recurrent Residual and Attention gates U-Net (DR2A-Unet) to perform radar echo extrapolation in the Liulin experimental watershed for the 1 h and 2 h lead times, respectively, using the MSE and BMSE loss functions. The dynamic Z-R relationship was applied to nowcast the hour-by-hour rainfall, and the results were compared with the U-Net and U-Net++ models. The main conclusions were obtained by analyzing the effects of echo extrapolation and rainfall nowcasting.
(1)
For the 1 h-lead-time echo extrapolation, the model with the BMSE loss function had significantly better echo extrapolation than the model with the MSE loss function, which can more accurately predicted the development of the echoes. The echo extrapolation results by DR2A-UNet had some improvement compared with the U-Net and U-Net++ models, which was especially significant in the echo extrapolation of the strong rainfall process. For the echoes of weak rainfall intensities, the difference of the nowcasted results by different models was not significant. With the continuation of the lead time, the prediction accuracy of the models decreased significantly and there was a clear homogenization trend for the strong echoes. DR2A-UNet was better than the reference model in extrapolating the process and intensity of the echo changes. At the 2 h lead time, the evaluation index of the extrapolation accuracy decreases by about 20% compared with the 1 h lead time, and the extrapolation effect of DR2A-UNet is better.
(2)
The rainfall estimated using the dynamic Z-R relationship had the highest accuracy and correlation with the actual rainfall. The rainfall estimated using the optimized Z-R relationship had the second highest accuracy, and the classical Z-R relationship had the worst accuracy, so it was more appropriate to use the dynamic Z-R relationship to estimate rainfall. In the 1 h lead time, all deep-learning models were able to nowcast the rainfall process. DR2A-UNet achieved a higher accuracy and correlation for all types of rainfall, which was consistent with the results of the echo extrapolation. There were more outliers in the U-Net and U-Net++ nowcasted rainfall, which was related to the larger FAR in the echo extrapolation. The accuracy of the nowcasted rainfall for the 2 h lead time by each model was worse, and it was difficult to nowcast the actual rainfall process.

Author Contributions

Y.T.: software, methodology, and writing—original draft. T.Z.: conceptualization, and supervision. L.L.: resources, and writing—reviewing and editing. J.L.: data curation, and visualization. All authors have read and agreed to the published version of the manuscript.

Funding

This research is supported by the National Key Research and Development Program of China (No. 2023YFC3006501), and the National Natural Science Foundation of China (No. 52279022, 52079086).

Data Availability Statement

The data are available from the corresponding author upon request.

Acknowledgments

The authors wish to express their gratitude to Remote Sensing, as well as to the anonymous reviewers who helped to improve this paper through their thorough review.

Conflicts of Interest

The authors declare no conflicts of interest.

References

  1. Luo, P.; Yan, P.; Wang, X.; Wu, Y.; Lyu, J.; He, B.; Duan, W.; Wang, S.; Zha, X. Historical and comparative overview of sponge campus construction and future challenges. Sci. Total Environ. 2023, 907, 167477. [Google Scholar] [CrossRef]
  2. Zhang, Y.; Long, M.; Chen, K.; Xing, L.; Jin, R.; Michael, J.; Wang, J. Skilful nowcasting of extreme precipitation with NowcastNet. Nature 2023, 619, 526–532. [Google Scholar] [CrossRef]
  3. Wang, S.; Zhang, K.; Chao, L.; Chen, G.; Xia, Y.; Zhang, C. Investigating the Feasibility of Using Satellite Rainfall for the Integrated Prediction of Flood and Landslide Hazards over Shaanxi Province in Northwest China. Remote Sens. 2023, 15, 2457. [Google Scholar] [CrossRef]
  4. Imhoff, R.O.; Brauer, C.C.; van Heeringen, K.J.; Uijlenhoet, R.; Weerts, A.H. Large-sample evaluation of radar rainfall nowcasting for flood early warning. Water Resour. Res. 2022, 58, e2021WR031591. [Google Scholar] [CrossRef]
  5. Cao, Y.; Chen, L.; Zhang, D.; Ma, L.; Shan, H. Hybrid Weighting Loss for Precipitation Nowcasting from Radar Images. In Proceedings of the ICASSP 2022—2022 IEEE International Conference on Acoustics, Speech and Signal Processing (ICASSP), Singapore, 22–27 May 2022; pp. 3738–3742. [Google Scholar]
  6. Gong, A.; Li, R.; Pan, B.; Chen, H.; Ni, G.; Chen, M. Enhancing spatial variability representation of radar nowcasting with generative adversarial networks. Remote Sens. 2023, 15, 3306. [Google Scholar] [CrossRef]
  7. Imhoff, R.O.; De Cruz, L.; Dewettinck, W.; Brauer, C.C.; Uijlenhoet, R.; van Heeringen, K.J.; Weerts, A.H. Scale-dependent blending of ensemble rainfall nowcasts and numerical weather prediction in the open-source pysteps library. Q. J. R. Meteorol. Soc. 2023, 149, 1335–1364. [Google Scholar] [CrossRef]
  8. Ehsani, M.R.; Behrangi, A. A comparison of correction factors for the systematic gauge-measurement errors to improve the global land precipitation estimate. J. Hydrol. 2022, 610, 127884. [Google Scholar] [CrossRef]
  9. Shi, X.; Chen, Z.; Wang, H.; Yeung, D.Y.; Wong, W.K.; Woo, W.C. Convolutional LSTM network: A machine learning approach for precipitation nowcasting. In Proceedings of the 29th Annual Conference on Neural Information Processing Systems, NIPS 2015, Montreal, QC, Canada, 7–12 December 2015; pp. 802–810. [Google Scholar]
  10. Weisman, M.L.; Davis, C.; Wang, W.; Manning, K.W.; Klemp, J.B. Experiences with 0–36-h explicit convective forecasts with the WRF-ARW model. Weather Forecast. 2008, 23, 407–437. [Google Scholar] [CrossRef]
  11. Liu, L.; Chen, M.; Luo, P.; Duan, W.; Hu, M. Quantitative Model Construction for Sustainable Security Patterns in Social–Ecological Links Using Remote Sensing and Machine Learning. Remote Sens. 2023, 15, 3837. [Google Scholar] [CrossRef]
  12. Zhu, W.; Cao, Z.; Luo, P.; Tang, Z.; Zhang, Y.; Hu, M.; He, B. Urban Flood-Related Remote Sensing: Research Trends, Gaps and Opportunities. Remote Sens. 2022, 14, 5505. [Google Scholar] [CrossRef]
  13. Luo, C.; Li, X.; Wen, Y.; Ye, Y.; Zhang, X. A novel LSTM model with interaction dual attention for radar echo extrapolation. Remote Sens. 2021, 13, 164. [Google Scholar] [CrossRef]
  14. Zhu, W.; Zha, X.; Luo, P.; Wang, S.; Cao, Z.; Lyu, J.; Zhou, M.; He, B. A quantitative analysis of research trends in flood hazard assessment. Stoch. Environ. Res. Risk Assess. 2023, 37, 413–428. [Google Scholar] [CrossRef]
  15. Liu, J.; Xu, L.; Chen, N. A spatiotemporal deep learning model ST-LSTM-SA for hourly rainfall forecasting using radar echo images. J. Hydrol. 2022, 609, 127748. [Google Scholar] [CrossRef]
  16. Huang, Q.; Chen, S.; Tan, J. TSRC: A Deep Learning Model for Precipitation Short-Term Forecasting over China Using Radar Echo Data. Remote Sens. 2022, 15, 142. [Google Scholar] [CrossRef]
  17. Agrawal, S.; Barrington, L.; Bromberg, C.; Burge, J.; Gazen, C.; Hickey, J. Machine learning for precipitation nowcasting from radar images. arXiv 2019, arXiv:1912.12132. [Google Scholar]
  18. Hu, Y.; Chen, L.; Wang, Z.B.; Pan, X.; Li, H. Towards a More Realistic and Detailed Deep-Learning-Based Radar Echo Extrapolation Method. Remote Sens. 2022, 14, 24. [Google Scholar] [CrossRef]
  19. Han, L.; Zhao, Y.; Chen, H.; Chandrasekar, V. Advancing radar nowcasting through deep transfer learning. IEEE Trans. Geosci. Remote Sens. 2021, 60, 4100609. [Google Scholar] [CrossRef]
  20. Xu, L.; Niu, D.; Zhang, T.; Chen, P.; Chen, X.; Li, Y. Two-Stage UA-GAN for Precipitation Nowcasting. Remote Sens. 2022, 14, 5948. [Google Scholar] [CrossRef]
  21. Yao, J.; Xu, F.; Qian, Z.; Cai, Z. A Forecast-Refinement Neural Network Based on DyConvGRU and U-Net for Radar Echo Extrapolation. IEEE Access 2023, 11, 53249–53261. [Google Scholar] [CrossRef]
  22. Fernández, J.G.; Mehrkanoon, S. Broad-UNet: Multi-scale feature learning for nowcasting tasks. Neural Netw. 2021, 144, 419–427. [Google Scholar] [CrossRef]
  23. Zeng, Q.; Li, H.; Zhang, T.; He, J.; Zhang, F.; Wang, H.; Shen, B. Prediction of Radar Echo Space-Time Sequence Based on Improving TrajGRU Deep-Learning Model. Remote Sens. 2022, 14, 5042. [Google Scholar] [CrossRef]
  24. Neuper, M.; Ehret, U. Quantitative precipitation estimation with weather radar using a data- and information-based approach. Hydrol. Earth Syst. Sci. 2019, 23, 3711–3733. [Google Scholar] [CrossRef]
  25. Alfieri, L.; Claps, P.; Laio, F. Time-dependent Z-R relationships for estimating rainfall fields from radar measurements. Nat. Hazard. Earth Syst. Sci. 2010, 10, 149–158. [Google Scholar] [CrossRef]
  26. Gou, Y.B.; Chen, H.N.; Chandrasekar, V. A dynamic approach to quantitative precipitation estimation using multiradar multigauge network. IEEE. Trans. Geosci. Remote Sens. 2020, 58, 6376–6390. [Google Scholar] [CrossRef]
  27. Zhang, C.J.; Wang, H.Y.; Zeng, J.; Ma, L.; Guan, L. Short-term dynamic radar quantitative precipitation estimation based on wavelet transform and support vector machine. J. Meteorol. Res. 2020, 34, 228–241. [Google Scholar] [CrossRef]
  28. Jha, D.; Riegler, M.A.; Johansen, D.; Halvorsen, P.; Johansen, H.D. Doubleu-net: A deep convolutional neural network for medical image segmentation. In Proceedings of the 2020 IEEE 33rd International Symposium on Computer-Based Medical Systems (CBMS), Rochester, MN, USA, 28–30 July 2020; pp. 558–564. [Google Scholar]
  29. Alom, M.Z.; Yakopcic, C.; Taha, T.M.; Asari, V.K. Nuclei segmentation with recurrent residual convolutional neural networks based U-Net (R2U-Net). In Proceedings of the NAECON 2018-IEEE National Aerospace and Electronics Conference, Dayton, OH, USA, 23–26 July 2018; pp. 228–233. [Google Scholar]
  30. Han, L.; Liang, H.; Chen, H.; Zhang, W.; Ge, Y. Convective precipitation nowcasting using U-Net model. IEEE. Trans. Geosci. Remote Sens. 2022, 60, 4103508. [Google Scholar] [CrossRef]
  31. Tian, L.; Li, X.; Ye, Y.; Xie, P.; Li, Y. A generative adversarial gated recurrent unit model for precipitation nowcasting. IEEE Geosci. Remote Sens. Lett. 2020, 17, 601–605. [Google Scholar] [CrossRef]
  32. Atlas, D.; Rosenfeld, D.; Wolff, D.B. Climatologically tuned reflectivity-rain rate relations and links to area-time integrals. J. Appl. Meteorol. 1990, 29, 1120–1135. [Google Scholar] [CrossRef]
  33. Na, W.Y.; Yoo, C. Real-time bias correction of rainfall nowcasts using biward tracking method. J. Hydrol. 2023, 622, 129642. [Google Scholar] [CrossRef]
  34. Yin, J.; Gao, Z.; Han, W. Application of a Radar Echo Extrapolation-Based Deep Learning Method in Strong Convection Nowcasting. Earth Space Sci. 2021, 8, e2020EA001621. [Google Scholar] [CrossRef]
  35. Shehu, B.; Haberlandt, U. Relevance of merging radar and rainfall gauge data for rainfall nowcasting in urban hydrology. J. Hydrol. 2021, 594, 125931. [Google Scholar] [CrossRef]
  36. Cristiano, E.; ten Veldhuis, M.-C.; van de Giesen, N. Spatial and temporal variability of rainfall and their effects on hydrological response in urban areas—A review. Hydrol. Earth Syst. Sci. 2017, 21, 3859–3878. [Google Scholar] [CrossRef]
  37. Foresti, L.; Sideris, I.V.; Nerini, D.; Beusch, L.; Germann, U. Using a 10-year radar archive for nowcasting precipitation growth and decay: A probabilistic machine learning approach. Weather Forecast. 2019, 34, 1547–1569. [Google Scholar] [CrossRef]
  38. Moreno, H.A.; Vivoni, E.R.; Gochis, D.J. Limits to flood forecasting in the Colorado Front Range for two summer convection periods using radar nowcasting and a distributed hydrologic model. J. Hydrometeorl. 2013, 14, 1075–1097. [Google Scholar] [CrossRef]
  39. Tang, X.; Yin, Z.; Qin, G.; Guo, L.; Li, H. Integration of Satellite Precipitation Data and Deep Learning for Improving Flash Flood Simulation in a Poor-Gauged Mountainous Catchment. Remote Sens. 2021, 13, 5083. [Google Scholar] [CrossRef]
  40. Bouget, V.; Brajard, J.; Charantonis, A.; Filoche, A. Fusion of Rain Radar Images and Wind Forecasts in a Deep Learning Model Applied to Rain Nowcasting. Remote Sens. 2021, 13, 246. [Google Scholar] [CrossRef]
  41. Kou, L.; Tang, J.; Wang, Z.; Jiang, Y.; Chu, Z. An adaptive rainfall estimation algorithm for dual-polarization radar. IEEE. Geosci. Remote Sens. Lett. 2022, 19, 1004805. [Google Scholar] [CrossRef]
Figure 1. Liulin experimental watershed location and Z9311 radar range: (a) Liulin experimental watershed; and (b) radar scanning range.
Remotesensing 16 01681 g001
Figure 2. Three rainfall processes in 2021 and 2022. (a) 20210721 rainfall event; (b) 20211005 rainfall event; (c) 20221001 rainfall event.
Remotesensing 16 01681 g002
Figure 3. Structure of U-Net and U-Net++. (a) The structure of U-Net. (b) The structure of U-Net++.
Remotesensing 16 01681 g003
Figure 4. Structure of DR2A-UNet, Recurrent Residual, and attention gate. (a) The structure of DR2A-UNet. (b) Recurrent Residual convolution. (c) Attention gate.
Remotesensing 16 01681 g004
Figure 5. Architecture of the ConvLSTM neural network.
Remotesensing 16 01681 g005
Figure 6. A case of echo extrapolation from 21:00 to 22:00 on 21 July 2021.
Remotesensing 16 01681 g006
Figure 7. A case of echo extrapolation from 21:00 to 22:00 on 5 October 2021.
Remotesensing 16 01681 g007
Figure 8. A case of echo extrapolation from 12:00 to 13:00 on 1 October 2022.
Remotesensing 16 01681 g008
Figure 9. Correlation analysis of nowcasted and measured rainfall. (a) 20210721 rainfall event; (b) 20211005 rainfall event; (c) 20221001 rainfall event.
Remotesensing 16 01681 g009
Figure 10. Comparison of nowcasted and measured rainfall process. (a) 1 h lead time rainfall for 20210721 event; (b) 2 h lead time rainfall for 20210721 event; (c) 1 h lead time rainfall for 20211005 event; (d) 2 h lead time rainfall for 20211005 event; (e) 1 h lead time rainfall for 20221001 event; (f) 2 h lead time rainfall for 20221001 event.
Remotesensing 16 01681 g010
Table 1. Information about typical rainfall events.
EventStart TimeEnd TimeTotal Rainfall/mmMaximum Rainfall Intensity/(mm/h)
2021072121 July. T18:0021 July. T24:0073.126.7
202110055 October. T20:006 October. T05:0042.78.2
202210011 October. T10:001 October. T19:0040.28.6
Table 2. Evaluation index value of 1 h-lead-time echo extrapolation results.
EventLoss FunctionModelPODFARCSIF1
dBZ > 20/> 30dBZ > 20/> 30dBZ > 20/> 30dBZ > 20/> 30
20210721MSEU-Net0.62/0.250.24/0.540.55/0.190.62/0.24
U-Net++0.75/0.330.22/0.580.62/0.250.67/0.26
DR2A-UNet0.76/0.410.20/0.550.65/0.280.71/0.35
Conv-LSTM0.63/0.180.30/0.640.51/0.220.56/0.28
BMSEU-Net0.70/0.310.18/0.480.65/0.290.70/0.33
U-Net++0.85/0.390.17/0.480.69/0.280.75/0.31
DR2A-UNet0.86/0.470.16/0.470.71/0.310.77/0.36
Conv-LSTM0.64/0.210.25/0.620.52/0.180.57/0.24
20211005MSEU-Net0.45/0.240.56/0.760.19/0.090.31/0.10
U-Net++0.52/0.300.51/0.730.21/0.110.35/0.14
DR2A-UNet0.49/0.280.53/0.790.25/0.080.34/0.12
Conv-LSTM0.41/0.080.56/0.930.17/0.020.21/0.03
BMSEU-Net0.50/0.320.57/0.720.28/0.100.29/0.10
U-Net++0.53/0.360.52/0.710.24/0.100.36/0.13
DR2A-UNet0.59/0.350.53/0.730.32/0.120.38/0.13
Conv-LSTM0.52/0.130.59/0.900.26/0.020.30/0.03
20221001MSEU-Net0.53/0.200.34/0.690.40/0.100.45/0.13
U-Net++0.59/0.210.34/0.630.41/0.140.47/0.16
DR2A-UNet0.61/0.250.33/0.610.43/0.150.48/0.20
Conv-LSTM0.50/0.180.46/0.770.39/0.070.42/0.11
BMSEU-Net0.66/0.260.39/0.710.42/0.120.47/0.15
U-Net++0.73/0.320.34/0.670.52/0.140.56/0.19
DR2A-UNet0.77/0.360.36/0.690.48/0.130.52/0.17
Conv-LSTM0.53/0.200.43/0.790.36/0.100.40/0.14
Table 3. Evaluation index value of 2 h-lead-time echo extrapolation results.
EventModelPODFARCSIF1
dBZ > 20/> 30dBZ > 20/> 30dBZ > 20/> 30dBZ > 20/> 30
20210721U-Net0.62/0.280.26/0.550.54/0.230.59/0.28
U-Net++0.73/0.360.29/0.540.52/0.220.57/0.26
DR2A-UNet0.79/0.350.25/0.520.59/0.260.66/0.24
20211005U-Net0.41/0.260.68/0.880.22/0.060.25/0.08
U-Net++0.47/0.280.66/0.820.23/0.080.29/0.11
DR2A-UNet0.46/0.270.64/0.790.27/0.100.31/0.11
20221001U-Net0.50/0.170.48/0.770.32/0.080.35/0.06
U-Net++0.43/0.180.50/0.820.26/0.060.28/0.05
DR2A-UNet0.55/0.170.46/0.750.35/0.090.37/0.11
Table 4. Accuracy evaluation of quantitative rainfall estimation methods.
EventZ-R Relationshipσ/mmCCBias/mm
20210721Classical1.030.51−5.29
Optimized1.160.636.25
Dynamic0.980.521.95
20211005Classical1.01−0.66−3.38
Optimized0.97−0.61−2.63
Dynamic0.590.41−0.65
20221001Classical1.010.19−2.91
Optimized0.900.33−1.81
Dynamic0.860.65−0.42
Table 5. Evaluation index of rainfall nowcasting.
EventModelσ(1 h/2 h)/mmCC (1 h/2 h)Bias (1 h/2 h)/mm
20210721U-Net1.24/1.060.36/0.301.64/−2.93
U-Net++1.18/1.110.37/0.211.76/−1.53
DR2A-UNet1.04/1.110.42/0.320.80/−2.21
20211005U-Net0.58/0.770.71/0.41−1.98/−2.54
U-Net++0.72/0.780.49/0.44−2.33/−1.42
DR2A-UNet0.59/0.670.73/0.58−2.10/−2.26
20221001U-Net0.88/0.910.37/0.18−1.27/−1.95
U-Net++1.01/0.920.42/0.32−0.70/−1.08
DR2A-UNet0.85/0.860.41/0.40−1.12/−1.39
Disclaimer/Publisher’s Note: The statements, opinions and data contained in all publications are solely those of the individual author(s) and contributor(s) and not of MDPI and/or the editor(s). MDPI and/or the editor(s) disclaim responsibility for any injury to people or property resulting from any ideas, methods, instructions or products referred to in the content.