Abstract
The BeiDou Navigation Satellite System (BDS) has developed rapidly, and the combination of BDS Phase II (BDS-2) and BDS Phase III (BDS-3) has attracted wide attention. It is found that there are code ISBs between BDS-2 and BDS-3, which may have a certain impact on the BDS-2 and BDS-3 combined positioning. This paper focuses on the performance of BDS-2/BDS-3 combined B1I single-frequency pseudorange positioning and investigates the positioning performance with and without code ISBs correction for different types of receivers, include geodetic GNSS receivers and low-cost receivers. The results show the following: (1) For geodetic GNSS receivers, the code ISBs of each receiver is about −0.3 m to −0.8 m, and the position deviation is reduced by 7% after correcting code ISBs. The code ISBs in the baseline with homogeneous receivers has a little influence on the positioning result, which can be ignored. The code ISBs in the baseline with heterogeneous receivers is about −0.5 m, and the position deviation is reduced by 4% after correcting code ISBs. (2) The code ISBs in the low-cost receivers are significantly larger than those in the geodetic GNSS receivers, and the impact on the positioning performance of the low-cost receivers is significantly greater than that on the geodetic GNSS receivers. After correcting the code ISBs, the position deviation of low-cost receivers can be reduced by around 12% for both undifferenced and differenced modes. (3) For low-cost receivers, correcting the code ISBs can increase the number of epochs successfully solved, which effectively improves the low-cost navigation and positioning performance. (4) The carrier-phase-smoothing method can effectively reduce the distribution dispersion of code ISBs and make the estimation of ISBs more accurate. The STD values of estimated code ISBs in geodetic GNSS receivers are reduced by about 40% after carrier-phase smoothing, while the corresponding values are reduced by about 7% in low-cost receivers due to their poor carrier-phase observation quality.
1. Introduction
Due to the differences in signal structure and system structure of different satellite systems, the satellite signals of different systems will produce signal delay at the satellite end and the receiver end, which is called an inter-system bias (ISB). This bias is an error caused by the related processes inside the GNSS (Global Navigation Satellite System) receiver, and it appears both in the pseudorange and carrier phase observations []. When positioning with multiple systems, ISBs will affect the performance of multi-system combined positioning if they are not corrected in time.
Many scholars have carried out research on ISBs, analyzing the influence of ISBs on positioning accuracy and ambiguity resolution under a multi-system combined positioning mode, and proposed various processing methods [,]. An ISB calculation method for Global Positioning System (GPS) and Galileo precision positioning was proposed by Paziewski et al. []. After correcting the ISBs, the positioning accuracy and ambiguity fixing success rate were significantly improved. Deng et al. [] studied multi-system tightly coupled Precise Point Positioning (PPP) and found that there may be large phase ISBs when using overlapping frequencies. Li et al. [] and Liu et al. [] showed that the ISB results obtained by using the products of different analysis centers and the ISB estimation model were different, but the diurnal variation characteristics were similar. Mi et al. [] proposed a single-difference calculation method for estimating ISBs between overlapping and non-overlapping frequencies. The variation pattern of ISBs under different ionospheric models was analyzed using this method. After correcting ISBs, the differential positioning accuracy and the ambiguity resolution success rate were improved by 20~35% and 25~60%, respectively []. Jiang et al. [] established an ISB short-term prediction model of BDS/GPS integrated system by using the Kalman filter piecewise parameter estimation method. The predicted value calculated by this model can be used as a priori information to correct the ISBs, and the positioning accuracy and convergence speed after correction are significantly improved. The differential inter-system biases (DISBs) were estimated by Tang et al. [] using a combination of the Kalman filter and the particle filter. After correcting the DISBs, the accuracy of the fixed solution can be improved by 10~20% at most. Some scholars have proposed a differential positioning model of a combined GPS/BDS system considering ISBs and found that the DISBs changed stably within a few days. For homogeneous receivers, code DISBs and phase DISBs are very stable and close to 0 m. For heterogeneous receivers, the code DISBs are obvious, which has a certain influence on the positioning accuracy. Zeng et al. [] analyzed the GPS/BDS code ISB stability of different types of receivers. The results show that the ISBs’ consistency of homogeneous receivers is strong, while there are significant differences in ISBs between heterogeneous receivers. The code ISBs are stable in a day, which can reach a maximum of 1516ns. Considering the relatively stable characteristics of ISBs in the short term, Angrisano et al. [] used ISBs obtained under the epochs with sufficient visible satellites as known parameters and introduced them into the epochs with fewer visible satellites for correction. This method reduced the number of unknown parameters in the observation model and realized the positioning of a combined GPS/GLONASS system in the case of a small number of satellites. Pan et al. studied the ISB characteristics in a combined GPS/GLONASS/Galileo/BDS-2/BDS-3 system using the low-cost u-blox receiver and Xiaomi Mi8 smartphone. After correcting the ISBs, the SPP positioning accuracy and data availability of multi-system combination can be improved [].
The BDS-3 was fully completed in July 2020, and joined the BDS-2 system in providing global high-precision positioning, navigation and timing services []. With the rapid development of BDS, combined BDS-2 and BDS-3 positioning technology has also been widely studied. There are ISBs between the BDS-2 and BDS-3 systems because of the different signal structure and system architecture. The positioning performance will be affected if the ISBs are not properly handled in combined BDS-2/BDS-3 positioning. Jiao et al. [] compared the broadcast ephemeris of BDS-2 and BDS-3 and concluded that a datum inconsistency of the satellite clocks and the hardware delays of the code observations result in ISBs for the receivers. An improved combined model was proposed where both the loose combined mode and tightly combined mode are applied by Deng et al. [] for BDS-2/BDS-3, which achieved near 100% ambiguity success rate and also reduced the time to first fix. Mi et al. [] estimated the BDS-2/BDS-3 ISBs between the B1I/B3I signals of identical receiver type and found that the ISBs were nearly zero. Further research [] found that the phase ISBs on the overlapping frequencies of BDS-2/BDS-3 were nearly zero, and the phase observations could be directly combined. The code ISBs of B1I and B2b/B2I between BDS-2 and BDS-3 could not be ignored, but the code ISBs of B3I were almost zero, which enabled the interoperability of BDS-2 and BDS-3. Liu et al. [] also found that the DISBs are close to zero for the baselines with the homogeneous or heterogeneous receivers. Therefore, when using B1I/B3I signals for relative positioning, BDS-2 and BDS-3 can be regarded as a system without considering DISBs. Furthermore, the impact of ISBs on the positioning of low earth orbit satellites using the BDS-2/BDS-3 system demonstrated that ISBs correction can effectively enhance the orbit accuracy.
Since there is no ambiguity, cycle slip and other problems in the pseudorange, the pseudorange positioning model is simple, and it is widely used in shipping, vehicle navigation, automatic driving and other fields. For multi-system pseudorange positioning, the effect of code ISBs between systems also needs to be considered. In multi-system pseudorange single point positioning (SPP) and differential positioning, the receiver clock errors of different systems are usually distinguished, and the code ISBs are absorbed in receiver clock errors. Zhang et al. [] used the above strategy to realize combined GPS/GLONASS/Galileo/BDS-2/BDS-3 SPP positioning. Some studies compared the pseudorange differential positioning performance between BDS-2 and GPS, and the corresponding results showed that BDS-2 can achieve sub-meter-level positioning accuracy comparable to GPS [,]. However, the pseudorange is easily affected by multipath effects, observation noise and so on. In the pseudorange positioning, the carrier-phase-smoothing method is usually used to reduce the observation noise, so as to improve the pseudorange positioning accuracy. The Hatch filter [] is a common algorithm for carrier-phase-smoothing. Cui et al. [] used the Hatch filter to smooth the pseudorange observations according to the sliding window piecewise smoothing method. The BDS/GPS carrier-phase-smoothed pseudorange differential positioning accuracy obtained by the experiment can reach within 0.5 m. Tang et al. [] carried out BDS B1I, B3I and B1I/B3I dual-frequency pseudorange SPP using a carrier-phase-smoothed pseudorange. The results show that compared with the original pseudorange SPP, the positioning accuracy of the carrier-phase-smoothed pseudorange SPP is improved in the E, N and U directions. Most of the BDS pseudorange-positioning-related research focuses on the combined positioning of BDS and other systems. Although there are studies on the ISB processing method in combined BDS-2/BDS-3 positioning, most of them focus on the carrier-phase-based positioning mode. And most of the studies use the geodetic GNSS receiver s, but there are few studies on the characteristics of ISBs in low-cost receiving equipment. The original BDS-2/BDS-3 pseudorange and carrier-phase-smoothed pseudorange positioning with or without considering ISBs is analyzed in detail in our study.
The aim of this paper is to investigate the effect of ISBs on combined BDS-2/BDS-3 pseudorange positioning. The basic principles of pseudorange SPP and differential positioning considering the code ISBs between BDS-2 and BDS-3 were introduced first, followed by the principle of carrier-phase-smoothed pseudoranges based on the Hatch filter. Then, we collected the BDS-2 and BDS-3 observation data using the geodetic GNSS receivers from the stations in Shanghai and Wuhan, China; the data were collected using a low-cost receiver u-blox M8T in Qingdao, China. By calculating the un-differential and differential code ISBs, we analyzed the variation characteristics of code ISBs and their impact on positioning accuracy. Furthermore, carrier-phase-smoothed pseudoranges are adopted to analyze the relationship between the positioning accuracy and the code ISBs after carrier-phase smoothing. In addition, the influence of code ISBs on positioning performance in a geodetic GNSS receiver and low-cost receiver is compared. Since the low-cost receiver can only collect B1I single-frequency data, this article only studies the code ISBs in the B1I frequency.
2. Mathematical Models and Methods
2.1. Pseudorange SPP Model Considering Code ISBs
The B1I single frequency original pseudorange observation equation can be expressed as
where is the pseudorange observable, is the geometric distance between the receiver and the satellite, denotes the speed of light in vacuum, and are the clock error of receiver and satellite respectively, is the orbital error, and are the ionospheric and tropospheric delay, respectively, and is the unmodeled errors such as multipath, noise, etc.
For combined BDS-2 and BDS-3 pseudorange SPP, the code ISBs between BDS-2 and BDS-3 also need to be considered. The observation equations of BDS-2 and BDS-3 can be described as follows:
where the superscript denotes the BDS-2 system and denotes the BDS-3 system. represents the code ISBs between BDS-2 and BDS-3. The linearized pseudorange observation equation is expressed as
where the symbols , and are the unit vector on the line-of-sight from the receiver to the satellite. The coordinate correction components , and , and the relative receiver clock error need to be solved.
The pseudorange residuals, i.e., OMC (Observed Minus Computed) of BDS-2 and BDS-3 are calculated as follows:
Furthermore, the error equation of combined BDS-2 and BDS-3 pseudorange SPP can be expressed as
where, and are the number of satellites of BDS-2 and BDS-3 systems, respectively, and the unknown parameters , and are solved by weighted least squares [].
The satellites are weighted based on their elevation angles, and the variance of the pseudorange observables for each satellite is given by
where denotes the observation variance of satellite and denotes the elevation angle of this satellite. When using pseudorange observations, . Typically, a = 0.03m and []. Furthermore, the weight matrix of the pseudorange observation equation can be written as
Suppose that the a priori standard deviation , and the weight ratio between BDS-2 and BDS-3 systems is 1:1.
2.2. Pseudorange Differential Positioning Model Considering Code ISBs
The B1I single frequency original pseudorange observation equations of the base and the roving station are given by
where the subscripts and denote the base station and the roving station, respectively.
In the combined BDS-2 and BDS-3 pseudorange differential positioning, the code ISBs between the two systems also need to be considered. The pseudorange observation equations for the base and the roving stations can be expressed as
The pseudorange corrections of the base station can be computed using the following formula:
The base station sends the pseudorange corrections to the roving station, which applies them to the pseudorange observables, obtaining the corrected pseudorange observables, as follows:
Provided that the distance between the base station and the roving station is relatively short, the orbital error, the ionospheric delay error and the tropospheric delay error at the base station and the roving station are approximately equal. Since the multipath error can be reduced by the choke ring antenna of reference station, and the observation noise is small, only a small part of it will be retained in differential positioning. Therefore, the corresponding terms of the above Equations (19) and (20) can be removed and the equation becomes
Let , ; then, Equations (21) and (22) can be simplified to
The linearized corrected pseudorange observation equation for the BDS-2 and BDS-3 can be expressed as
where , and are the unit vector on the line-of-sight from the roving station receiver to satellite. The pseudorange residuals of BDS-2 and BDS-3 of the roving station can be further calculated by
The error equation of BDS-2 and BDS-3 combined pseudorange differential positioning can be expressed as
where and are the number of satellites for BDS-2 and BDS-3 systems, respectively, the coordinates of the roving station, the relative receiver clock error and the relative ISBs can be obtained by using the least squares method. The weighting strategy is the same as in Section 2.1, which is based on the elevation angles.
2.3. The Principle of Carrier-Phase Smoothing
Carrier-phase smoothing is a method of improving the accuracy of pseudorange observables by smoothing them with high-precision carrier-phase observables. The most commonly used smoothing method is Hatch filter []. The original pseudorange and carrier-phase observation equations at the epoch can be written as
where and are the original pseudorange and carrier-phase observables, respectively, both in units of meter. is all the terms that are independent of frequency, is the corresponding wavelength, is the integer ambiguity and is the ionospheric delay.
For single-frequency observations, the ionospheric variation between adjacent epochs is hard to ascertain. Typically, a sliding window is applied to restrict it in Hatch filter, and the ionospheric variation within the window is assumed to be negligible. Hence, the carrier-phase-smoothed pseudorange observation can be expressed as
where is the smoothed pseudorange and is the epoch number in the filter. To ensure the smoothed effect, the sliding window is generally set to 100 s []. The original observable of the initial epoch is usually the same as the initial smoothed pseudorange.
Assume that the standard deviations of pseudorange and carrier-phase observables are and [], respectively, and the pseudorange and carrier-phase observables are uncorrelated []. According to the error propagation law, the variance of the smoothed pseudorange observable at the epoch can be expressed as
Under the assumption of white noise process, the accuracy of the smoothed pseudorange will gradually increase with the smoothing time according to Equation (33).
3. Experiment and Result Analysis
3.1. Experimental Data and Data Processing Strategies
3.1.1. Geodetic GNSS Receiver Data Preparation
We collected BDS-2 and BDS-3 observation data from five stations in Wuhan and Shanghai, China. Stations WHUB and ROV1 are located in Wuhan, China, and stations SH11, SH01 and SH04 are located in Shanghai, China. Distribution of the tested stations and the data information are shown in Figure 1 and Table 1, respectively. The PRIDE PPP-AR software 3.0 [] was employed to obtain the precise coordinates of the base and the roving stations, which will be treated as the reference true values.
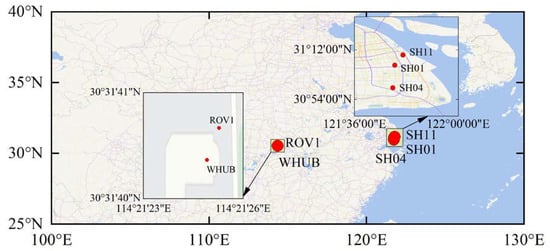
Figure 1.
Distribution of the GNSS stations.

Table 1.
Information of the GNSS stations in the experiment.
3.1.2. Low-Cost Receiver u-Blox M8T Preparation
In order to study the characteristics of code ISBs in low-cost receivers, this paper used low-cost receiver u-blox M8T collect data for about 1 h; the sampling interval was 1 s. The data acquisition device was set as shown in Figure 2. The u-blox M8T receiver with an active antenna was connected to a laptop through the Universal Serial Bus (USB) socket to collect the GNSS data. A geodetic GNSS receiver was selected as the base station, which was under simultaneous observation, and the u-blox M8T receiver was used to form a short baseline for pseudorange differential positioning experiment. The location information of the low-cost receiver had been obtained in advance.
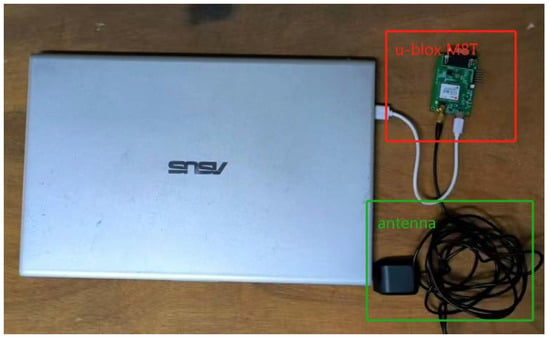
Figure 2.
u-blox M8T receiver device.
3.1.3. Pseudorange Positioning Experiment Processing Strategies
Based on the mathematical model of pseudorange positioning introduced in Section 2 and the above experimental strategy, we calculated and analyzed the changes of undifferenced code ISBs (UD-Code ISBs) and differential code ISBs (Diff-Code ISBs) in one day through pseudorange single point positioning experiments and pseudorange differential positioning experiments, respectively. In order to reduce the influence of observation noise on code ISB estimation, the carrier-phase smoothing was performed on the pseudorange observables with a 100 s sliding window, and the changes of the code ISBs before and after the carrier-phase smoothing were compared. Then, we corrected the code ISBs in pseudorange positioning with the code ISB time series. Pseudorange SPP and differential positioning were carried out to analyze the change of position deviations before and after correcting the code ISBs, and to explore the influence of code ISBs on positioning results. Finally, the accuracy of carrier-phase-smoothed pseudorange positioning was counted to analyze the influence of code ISBs on carrier-phase-smoothed pseudorange positioning. Then, the same strategy was used to analyze the characteristics of code ISBs in the u-blox M8T receiver and its influence on positioning results. The processing strategy is shown in Table 2.

Table 2.
GNSS Data Processing Strategy.
The mean and the standard deviation (STD) values of code ISBs were computed to discuss their variation pattern; the position deviations between the positioning results and the true values were calculated as well. To analyze the impact of code ISBs on positioning accuracy, the changes of the root mean square (RMS) errors of horizontal and vertical position deviations before and after code ISBs correction were calculated.
3.2. Pseudorange Positioning Analysis of Geodetic GNSS Receiver
3.2.1. Data Availability Analysis of Geodetic GNSS Receiver
Table 3 shows the data availability of the geodetic GNSS receivers at satellite elevation angles of 10°. It can be seen from the table that due to the high quality of the data received by the geodetic GNSS receivers, the data availability of each station is 100%.

Table 3.
Statistics of data availability rate under satellite elevation angles at 10°.
3.2.2. Analysis of Code ISB Characterization
- (1)
- Un-differential code ISBs
Figure 3 shows the time series of the UD-Code ISBs at each station between BDS-2 and BDS-3. It can be seen that the receivers of each station have non-zero code ISBs, which are stably distributed between −1 m and 0 m. The stations in Shanghai used homogeneous receivers; their fluctuation of the code ISB distribution is very similar. The code ISB distribution of the stations in Wuhan with heterogeneous receivers are significantly different from the stations in Shanghai. From the figure, we can see that the code ISBs of the three stations in Shanghai have large fluctuations from 6 h to 10 h, which corresponds to the time when the local afternoon sunshine is strong. The code ISB sequence of the ROV1 station is smoother than that of other stations, which is related to the better data-receiving environment and better data-receiving quality of the ROV1 station. Zhang et al. [] found that the receiver hardware delay biases are related to the hardware temperature, and the hardware temperature is related to the local temperature within one day. Therefore, the temperature variation has a certain influence on the daily stability of the code ISBs, which may cause the abnormal fluctuations of the code ISBs of the Shanghai receiver.
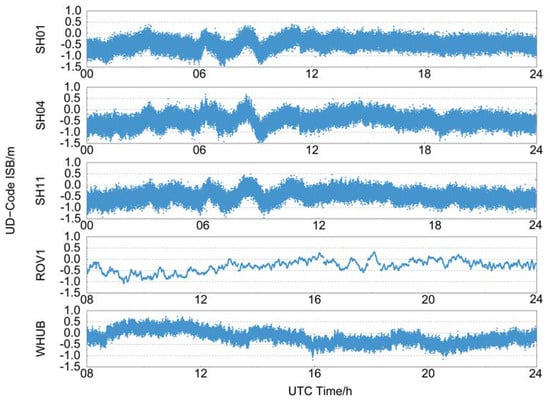
Figure 3.
Time series of B1I UD-code ISBs estimated between BDS-3 and BDS-2 in different stations.
Figure 4 describes the mean and STD values of the UD-Code ISBs in each station. The mean values are within a few meters, which proves the existence of BDS-2/BDS-3 UD-Code ISBs. The STD of the code ISBs in each station is basically between 0.2 m and 0.3 m, which indicates that the code ISBs are relatively stable throughout the day. The code ISBs of the Shanghai stations shown in the figure are significantly larger than that of the Wuhan station, which is caused by their heterogeneous receivers. Although the receivers in Shanghai are homogeneous, the code ISBs in each receiver are not necessarily the same. Moreover, due to the different environment of the receivers, the observation noise and other errors will also affect the accuracy of the code ISB estimation.
- (2)
- Differential code ISBs
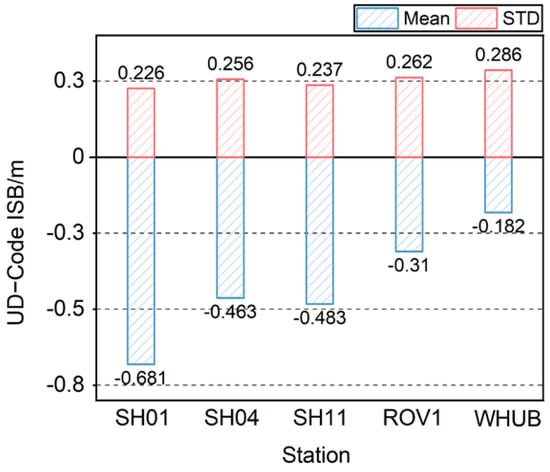
Figure 4.
Mean and STD values of UD-code ISBs for each station.
Table 4 gives a summary of the three baselines we selected, including the length of each baseline and the receiver type of the base and the rover stations.

Table 4.
Basic information of baselines.
Figure 5 shows the time series of Diff-Code ISBs between BDS-2 and BDS-3 of each baseline. The code ISBs for each baseline are roughly distributed between −1 m and 0 m and change stably around the mean values within a day. Among them, the baselines in Shanghai use two identical receivers, and their code ISB distributions are close to mean values, with strong consistency. The baseline in Wuhan uses heterogeneous receivers, and its code ISB distribution differs significantly from that of the baselines in Shanghai, with noticeable non-zero biases.
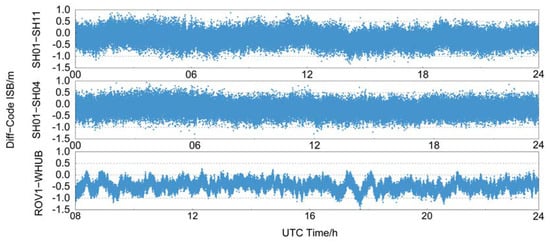
Figure 5.
Time series of B1I Diff-code ISBs estimated between BDS-2 and BDS-3 for different baselines.
In Figure 6, the mean and STD values of Diff-Code ISBs in different baselines are presented. The figure shows that the mean values of code ISBs in the SH01-SH11 and SH01-SH04 baselines are about −0.2 m, while the mean values of code ISBs in ROV1-WHUB baseline is about −0.475 m. The STD values of the code ISBs for all baselines are about 0.2 m, which indicates that the dispersion degree of code ISBs distribution for each baseline is similar.
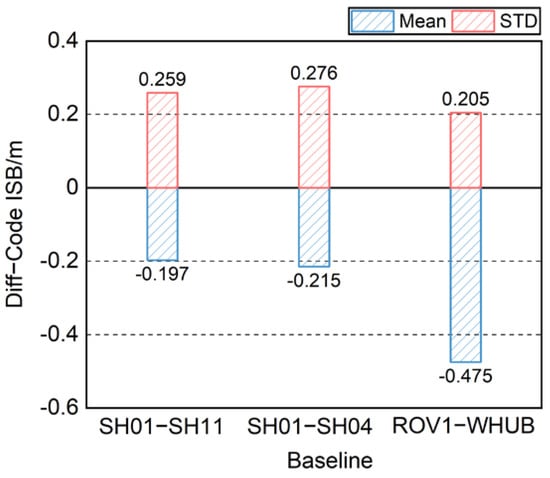
Figure 6.
Mean and STD values of UD-code ISBs for each baseline.
There is a large difference in the mean values of the code ISBs between the Shanghai and Wuhan baselines, which is due to the fact that the code ISBs are related to the type of receiver. The baselines in Shanghai use homogeneous receivers, and their Diff-Code ISBs are smaller, while the baseline in Wuhan uses heterogeneous receivers, and its Diff-Code ISBs are larger. Compared with the UD-Code ISBs in Figure 3, the code ISBs of the baselines in Shanghai are significantly smaller than their UD-Code ISBs after differencing, while the code ISBs of the baseline in Wuhan become larger after differencing.
- (3)
- Code ISBs before and after carrier-phase smoothing
Figure 7 describes the change of mean values and the distribution of code ISBs before and after carrier-phase smoothing for each station and baseline. It is shown that the mean values of code ISBs are basically unchanged after carrier-phase smoothing. For UD-Code ISBs, the STD values of code ISBs for each station in Shanghai decrease by 25~35% after carrier-phase smoothing, and the corresponding STD values of the stations in Wuhan decrease by about 10%. The absolute values of the maximum and minimum of the code ISBs at each station in Shanghai reduced significantly, while they are almost unchanged for stations in Wuhan. For Diff-Code ISBs, the STD values of the SH01-SH04 and SH01-SH11 baselines decrease by more than 50% after carrier-phase smoothing, and the STD value of ROV1-WHUB baseline decreases by 20.49%. After carrier-phase smoothing, the absolute values of maximum and minimum of the code ISBs of the baselines in Shanghai are greatly reduced, while the change of those in the baseline of Wuhan is smaller. Carrier-phase smoothing significantly reduced the dispersion of the distribution of code ISBs. This may because the calculated code ISBs contain pseudorange observation noise, while carrier-phase smoothing filters part of them, making the code ISBs more accurate.
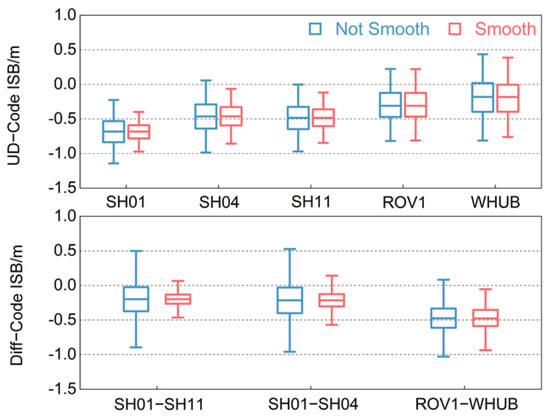
Figure 7.
Comparison diagram of code ISBs in the geodetic GNSS receivers distribution before and after carrier-phase smoothing.
3.2.3. Impact of Code ISBs on Pseudorange Positioning
- (1)
- Pseudorange SPP
The position deviations in the north (N), east (E) and up (U) directions of the pseudorange SPP are shown in Figure 8. It can be found that the position deviations in horizontal components of each station are roughly distributed between 0 m and 4 m; the position deviations in vertical components are mostly around 2 m. The positioning results fluctuate greatly from 6 h to 10 h. After correcting the code ISBs, the position deviations in the horizontal and vertical components of each station have a slight degree of reduction. The 6~10 h positioning results in the figure fluctuate greatly, and the ISB at the same time in Figure 3 also has similar fluctuations. At this time, it is in the period of strong ionospheric activity in Shanghai, which may cause the large fluctuations in the positioning results of each station and the positioning results to be unstable.
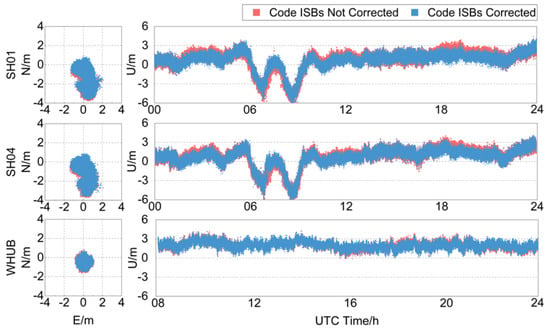
Figure 8.
Time series of pseudorange SPP position deviations before and after correcting the UD-Code ISBs in the geodetic GNSS receivers.
Figure 9 shows the changes in the RMS and STD values of the position deviations for each station before and after correcting the UD-Code ISBs. After correcting the code ISBs, the RMS values of position deviations for each station in Shanghai decreased by 5% to 10% in the horizontal and vertical components, respectively, and the STD values also decreased by 3% to 6%. For the ROV1 station in Wuhan, the RMS values of position deviations decreased by 5.39% and 2.18% in the horizontal and vertical components, respectively, and the STDs also decreased by about 5%. For the WHUB station, the RMS values of position deviations only decreased by 0.32% and 0.48% in the horizontal and vertical components, respectively, and the changes of the STD values were also less than 1%, which can be considered as the positioning results not having changed.
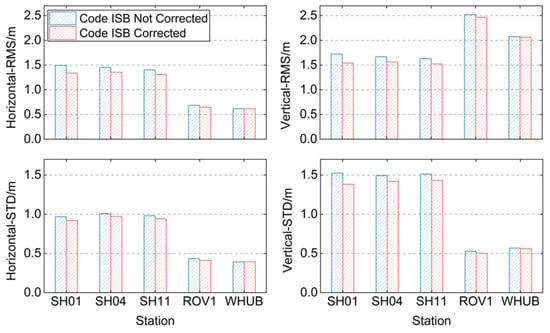
Figure 9.
RMS and STD values of position deviations of the pseudorange SPP before and after correcting the UD-Code ISBs.
The different degree of accuracy variation among different stations may be related to their ISBs’ magnitude. According to the statistical results of Figure 3, the code ISBs of ROV1 station in Wuhan are about −0.310 m and the mean value of the code ISBs of each station in Shanghai is between −0.5~−0.7 m, which is significantly larger than the ROV1 station, so the degree of the positioning results change is also larger than that of the station in Wuhan. The code ISBs calculated by the WHUB station is about −0.182 m, while the positioning results are hardly affected. Therefore, when the code ISBs calculated in this paper are within the range of ±0.2 m, it can be considered that the code ISBs have no significant effect on the positioning.
- (2)
- Pseudorange Differential Positioning
Figure 10 compares the distribution of pseudorange differential positioning position deviations before and after correcting the Diff-Code ISBs for each baseline. The figure illustrates that the position deviations of each baseline are basically within the range of ±1 m in the horizontal component, and the position deviations are basically within the range of ±1.5 m in the vertical component. After correcting the code ISBs, the position deviation distribution of the SH01-SH11 and SH01-SH04 baselines do not change significantly compared with the code ISBs not corrected, while the position deviation distribution of the ROV1-WHUB baseline slightly decreased. Compared with the SPP results in Figure 7, since the ionospheric delay is basically eliminated when the short baseline is differenced, the fluctuation of the positioning results in the Shanghai baseline becomes gentler.
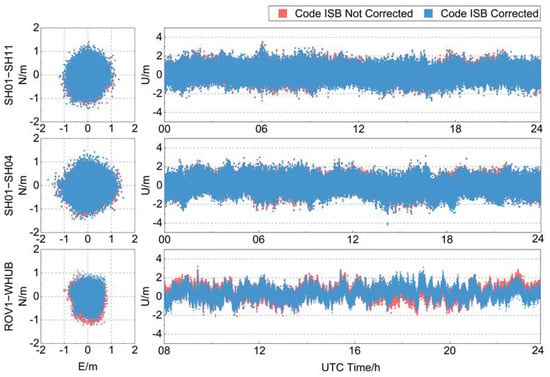
Figure 10.
Time series of pseudorange differential positioning position deviations before and after correcting the Diff-Code ISBs in the geodetic GNSS receivers.
Figure 11 shows the changes of the positioning accuracy for each baseline before and after correcting the Diff-Code ISBs. After correcting the code ISBs, the RMS and STD values of position deviations in the Shanghai baseline varied less than 1% in the horizontal and vertical components, which can be considered as the positioning results being unchanged. For the ROV1-WHUB baseline, the RMS and STD values of position deviations decreased by 3% to 4% and 3% to 5% in the horizontal and vertical components, respectively.
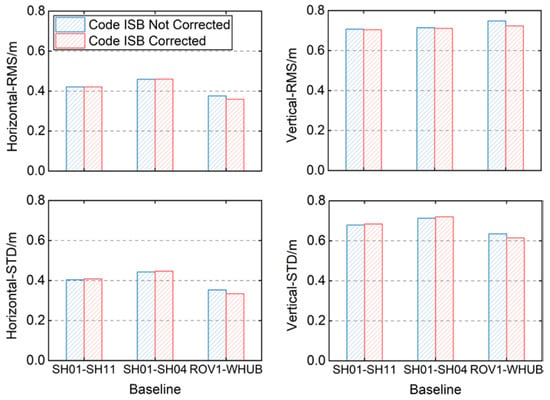
Figure 11.
RMS and STD values of pseudorange differential positioning position deviations before and after correcting the Diff-Code ISBs.
The SH01-SH11 and the SH01-SH04 baselines are equipped with homogeneous receivers, and the average code ISB is about −0.2 m. The ROV1-WHUB baseline, which has heterogeneous receivers, has a code ISB of about −0.475 m. Therefore, the code ISBs for the baselines with homogeneous receivers have no obvious effect on the positioning results and can be ignored. However, when the baseline is equipped with the heterogeneous receivers, the code ISBs will reduce the positioning accuracy, which could not be ignored when the BDS-2 and BDS-3 systems were combined for positioning.
3.2.4. Impact of Code ISBs on Carrier-Phase-Smoothed Pseudorange Positioning
- (1)
- Carrier-Phase-Smoothed Pseudorange SPP
The time series of carrier-phase-smoothed pseudorange SPP position deviations for each baseline before and after correcting UD-Code ISBs are illustrated in Figure 12. It is shown that the distribution of the position deviation series is more compact compared with that before carrier-phase smoothing. After correcting the code ISBs, the position deviations of each station are closer to 0 m than those before ISB correcting.
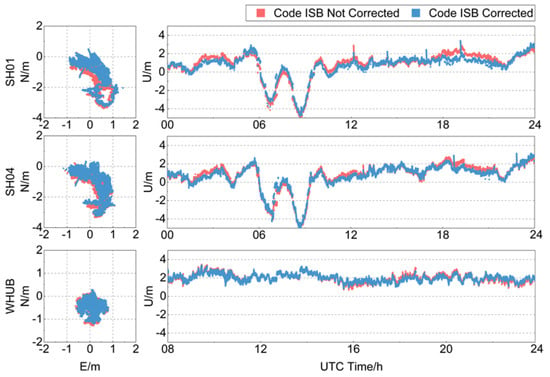
Figure 12.
Time series of the position deviations of carrier-phase-smoothed pseudorange SPP before and after correcting the UD-Code ISBs in the geodetic GNSS receivers.
Figure 13 shows the RMS and STD values of the carrier-phase-smoothed pseudorange SPP position deviations of each station before and after correcting the UD-Code ISBs. After correcting the code ISBs, the RMS values of position deviations for each station in Shanghai decreased by 6% to 11% in the horizontal and vertical components, respectively, and the STDs also decreased by 3% to 6%. For the ROV1 station in Wuhan, the RMS values of position deviations decreased by 5.13% and 2.14% in the horizontal and vertical components, respectively, and the STD values also decreased by about 5% to 6%. For the WHUB station, the RMS values of position deviations only decreased by 0.3% and 0.6% in the horizontal and vertical components, respectively, and the changes of the STD values were also less than 0.1%, which can taken as the positioning result not changing. In Figure 6, it can be seen that the mean values of the code ISBs of each station were almost the same before and after carrier-phase smoothing.
- (2)
- Carrier-phase-smoothed pseudorange differential positioning
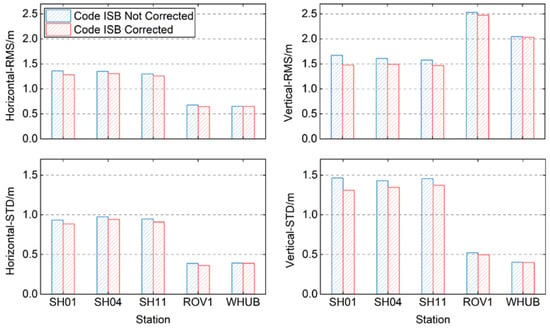
Figure 13.
RMS and STD values of the position deviations of carrier-phase-smoothed pseudorange SPP before and after correcting the UD-Code ISBs.
In Figure 14, the time series of carrier-phase-smoothed pseudorange differential positioning position deviations for each baseline before and after correcting the Diff-Code ISBs are illustrated. From this figure, we can see that the position deviation in the horizontal component of each baseline after carrier-phase smoothing is basically distributed within ±0.5 m, and the vertical component deviation is basically distributed within ±1 m. Among them, the SH01-SH11 and SH01-SH04 baselines are equipped with homogeneous receivers, and the change of positioning results is not obvious after the code ISBs are corrected. The ROV1-WHUB baseline is equipped with heterogeneous receivers, and the distribution of the position deviations slightly decreased after correcting the code ISBs.
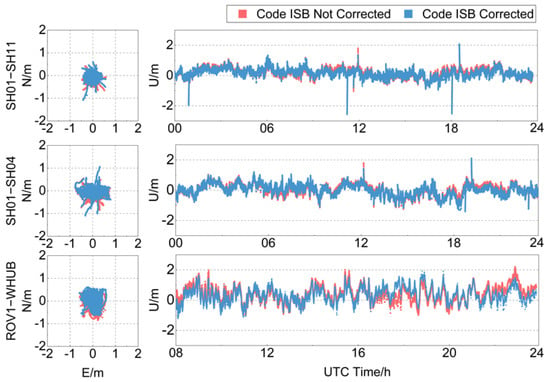
Figure 14.
Time series of the position deviation variations of carrier-phase-smoothed pseudorange differential positioning before and after correcting the Diff-Code ISBs in the geodetic GNSS receivers.
Figure 15 shows the changes of the carrier-phase-smoothed pseudorange differential positioning accuracy for each baseline before and after correcting the Diff-Code ISBs. After correcting the code ISBs, the RMS and STD values of position deviations for the baselines in Shanghai changed less than 1% in both horizontal and vertical components. The RMS values of the position deviations of the ROV1-WHUB baseline decreased by 6.77% and 5.13% in the horizontal and vertical components, respectively, and the STD values of each direction also decreased by 3% to 6%. According to the statistical results of Figure 6, the mean values of the code ISBs for SH01-SH11 and SH01-SH04 baseline remained at −0.2 m after carrier-phase smoothing, and the mean value of the code ISBs of the ROV1-WHUB baseline remained at −0.475 m. The mean values of the code ISBs did not change after carrier-phase smoothing, so the effect of the code ISBs on the positioning results was similar to that without carrier-phase smoothing.
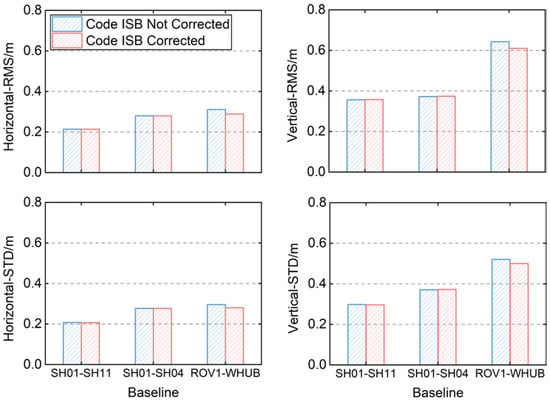
Figure 15.
RMS and STD values of the position deviations of carrier-phase-smoothed pseudorange differential positioning before and after Diff-Code ISBs correction.
3.3. Pseudorange Positioning Analysis of Low-Cost Receiver
3.3.1. Data Availability Analysis of Low-Cost Receiver
Table 5 shows the availability of data at different satellite elevation angles. According to the table, when the satellite elevation angle is set to 10°, the data availability rate is only 45.18~49.28%. When the satellite elevation angle is set to 30~50°, the data availability rate is also low due to the small number of observable satellites. Therefore, in the low-cost pseudorange positioning experiment in this paper, the satellite elevation angle is set to 20°. At this time, the data availability rate is higher, and the code ISB has the most significant impact on the pseudorange positioning results. Due to the unstable data quality of the u-blox M8T receiver, the positioning results in the later stage of data collection are poor, which cannot effectively reflect the influence of code ISBs on the positioning results. Therefore, the pseudorange differential experiment only retains the positioning results of some epochs.

Table 5.
Statistics of data availability rate under different satellite elevation angles.
3.3.2. Analysis of Code ISB Characterization in Low-Cost Receiver
- (1)
- Un-Differential Code ISBs
Figure 16 shows the time series of the UD-Code ISBs of the low-cost u-blox receiver between BDS-2 and BDS-3. It can be seen from the diagram that there are still non-zero UD-Code ISBs in the low-cost receiver, basically distributed between ±2 m. The stability of code ISBs in the low-cost receiver is worse than that of the geodetic GNSS receiver, and the distribution fluctuation can reach 4 m. The STD value of the code ISB in the geodetic GNSS receiver is basically 0.2~0.3 m, while in the low-cost receiver it is 0.765 m. The code ISBs in the low-cost u-blox receiver are significantly larger than those in the geodetic GNSS receiver. The mean value of the UD-code ISB in the low-cost receiver is −0.741 m, while that of the UD-code ISB in the geodetic GNSS receiver is −0.681~−0.182 m. During the calculation process, the number of BDS-2 satellites is about 7 to 9, while the number of BDS-3 satellites is only 3 to 4. When the number of BDS-3 satellites is small, the estimated value of ISBs may deviate from the true value [], resulting in a large fluctuation of UD-Code ISB.
- (2)
- Differential code ISBs
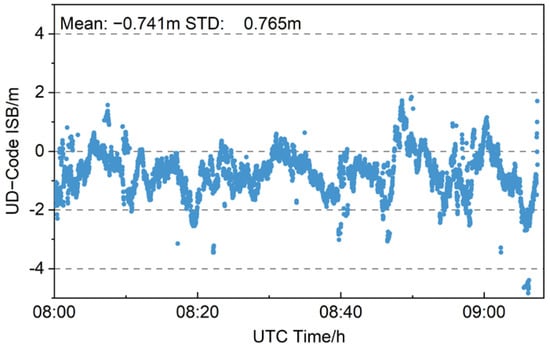
Figure 16.
Time series of B1I UD-code ISBs estimated between BDS-3 and BDS-2 in low-cost u-blox receiver.
Figure 17 shows the time series of Diff-Code ISBs between BDS-2 and BDS-3 of the baseline with the low-cost u-blox receiver. It can be seen from the figure that the Diff-Code ISB distribution in the u-blox receiver is more obvious than that in the geodetic GNSS receiver, which is basically distributed within ±2 m. The Diff-Code ISBs are unstable in short time, and there is a fluctuation of about 4 m. Among them, the STD of the code ISBs in the baseline composed of the geodetic GNSS receiver is about 0.2 m, while the STD of the code ISBs in the baseline with the low-cost u-blox receiver is 0.627 m, indicating that the code ISB distribution in the low-cost u-blox receiver is more discrete. In pseudorange differential positioning, the number of BDS-3 satellites is only 3 to 4, so the Diff-Code ISBs may also deviate from the true value, resulting in the unstable distribution of code ISBs.
- (3)
- Code ISBs before and after carrier-phase smoothing
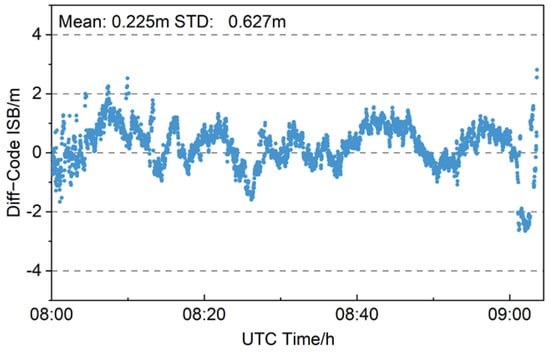
Figure 17.
Time series of B1I Diff-code ISBs estimated between BDS-3 and BDS-2 in low-cost u-blox receiver.
Figure 18 describes the change of mean values and the distribution of code ISBs before and after carrier-phase smoothing for the u-blox receiver and baseline. It can be seen from the figure that the distribution range of UD-Code ISBs and Diff-Code ISBs has a certain degree of change before and after carrier-phase smoothing. For the UD-Code ISB, the distribution range of code ISBs after smoothing is reduced to a lesser extent. The STD value decreased from 0.765 m to 0.733 m, reduced by 4.18%. For Diff-Code ISB, the distribution range of code ISBs is greatly reduced. The STD value decreased from 0.627 m to 0.569 m, a decrease of 9.25%.
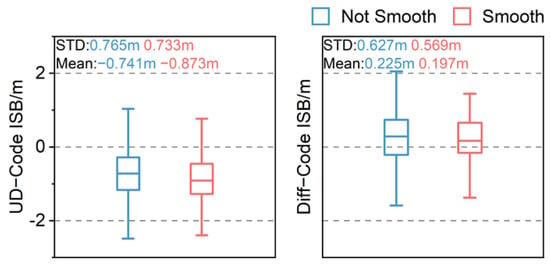
Figure 18.
Comparison diagram of code ISBs in the low-cost receiver distribution before and after carrier-phase smoothing.
After carrier-phase smoothing, the mean values of the UD-Code ISB and Diff-Code ISB both have changed. The mean value of UD-Code ISBs becomes larger after carrier-phase smoothing, and the mean value of Diff-Code ISBs decreases slightly after smoothing, while that of the geodetic GNSS receivers is basically unchanged before and after smoothing. Compared with the geodetic GNSS receivers, the data quality of the low-cost u-blox receiver is poor, and the code ISBs estimated is not accurate. Therefore, in the low-cost u-blox receiver, there are no same characteristics as the code ISBs in the geodetic GNSS receivers.
3.3.3. Impact of Code ISBs on Pseudorange Positioning
- (1)
- Pseudorange SPP
The position deviations in the north (N), east (E) and up (U) directions of the pseudorange SPP are shown in Figure 19. The position deviation of the pseudorange SPP position deviations of the u-blox receiver in the horizontal components is roughly distributed within ±2 m, and the position deviation in vertical components is roughly distributed within ±10 m. The pseudorange SPP position deviation distribution of the low-cost receiver fluctuates greatly, which is related to the unstable data quality of the u-blox receiver. After correcting the code ISBs, the position deviation in the horizontal and vertical components is reduced. The RMS values of the position deviation in the horizontal components of the u-blox receiver is reduced by 7.21%, and the STD values are reduced by 1.67%. The RMS values of the position deviation in vertical components is reduced by 12.83%, but the STD values increased by 6.64%. In vertical components, there is a phenomenon that the positioning deviation, after correcting the ISB, is larger than that when the ISB is not corrected at 9 h. There may be errors which are not processed at that time, resulting in a larger positioning deviation, so the degree of dispersion of the positioning deviation will also increase. The code ISBs in the low-cost receiver are significantly larger than the that in the geodetic GNSS receivers. Therefore, after correcting the code ISBs, the reduction of the pseudorange SPP position deviation of the low-cost receiver is more obvious.
- (2)
- Pseudorange Differential Positioning
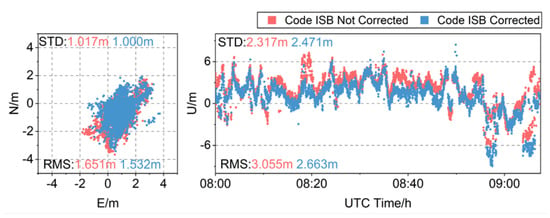
Figure 19.
Time series of pseudorange SPP position deviations before and after correcting the UD-Code ISBs in the low-cost receiver.
Figure 20 compares the distribution of pseudorange differential positioning position deviations before and after correcting the Diff-Code ISBs for the baseline with the low-cost u-blox receiver. It can be seen from the figure that the position deviation in the horizontal components is basically distributed within ±2 m, and the position deviation in the vertical components is basically distributed within −6~3 m. The position deviation distribution fluctuates greatly. After correcting the code ISBs, the position deviation distribution in the horizontal and vertical directions are significantly reduced. The RMS of the position deviations in the horizontal components is reduced by 10.08%, and the STD values are reduced by 1.58%. The RMS of the position deviation in the vertical components is reduced by 10.41%, and the STD values are reduced by 2.40%. The baseline with the u-blox receiver is equipped with heterogeneous receivers; compared with the geodetic GNSS receivers, the code ISBs in the low-cost receiver have a more obvious effect on the positioning results. Therefore, the influence of code ISBs cannot be ignored in the low-cost combined BDS-2 and BDS-3 system navigation and positioning.
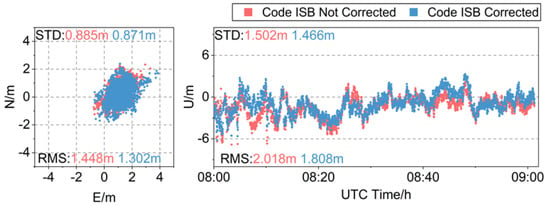
Figure 20.
Time series of pseudorange differential positioning position deviations before and after correcting the Diff-Code ISBs in the low-cost receiver.
3.3.4. Impact of Code ISBs on Carrier-Phase-Smoothed Pseudorange Positioning
- (1)
- Carrier-phase-smoothed pseudorange SPP
The time series of carrier-phase-smoothed pseudorange SPP position deviations for each station before and after correcting UD-Code ISBs is illustrated in Figure 21. It can be seen from the figure that the distribution of the position deviation after carrier-phase- smoothing is more concentrated. The position deviations in the horizontal components are basically distributed around 0~2 m, and the position deviations in the vertical components are basically distributed within ± 6m. After correcting the code ISBs, the position deviations in each direction are closer to 0 m. The RMS values of the position deviations in the horizontal components are reduced by 10% after correcting the code ISBs in the low-cost u-blox receiver, and the STD value is reduced by 1.95%. The RMS value of the position deviations in the vertical components are reduced by 13.94%, but the STD value increased by 5.05%. Compared with the unsmoothed position deviation, the influence of code ISBs on positioning accuracy becomes larger. This may be because the mean value of the code ISBs becomes larger after carrier-phase smoothing and the effect of improving the positioning accuracy after correcting the code ISBs will be more obvious.
- (2)
- Carrier-phase-smoothed pseudorange differential positioning
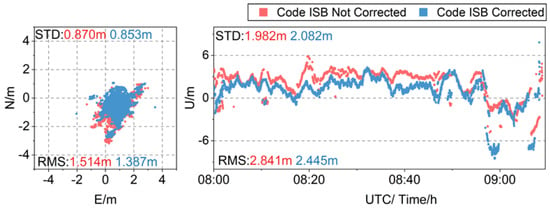
Figure 21.
Time series of the position deviations of carrier-phase-smoothed pseudorange SPP before and after correcting the UD-Code ISBs.
In Figure 22, the time series of carrier-phase-smoothed pseudorange differential positioning position deviations for the baseline with the low-cost u-blox receiver before and after correcting the Diff-Code ISBs is illustrated. It can be seen from the figure that the position deviations in the horizontal components after carrier-phase smoothing are basically distributed between −1~2 m, and the position deviations in the vertical components are between −6~1 m. Compared with the position deviation before carrier-phase smoothing, the distribution range is significantly reduced and the distribution is more concentrated. After correcting the code ISBs, the position deviations in each direction are closer to 0 m. Among them, the RMS value of the position deviations in the horizontal components are reduced by 5.43%, and the STD value is reduced by 2.25%. The RMS value of the position deviations in the vertical components are reduced by 4.85%, and the STD value is reduced by 1.42%. Compared with the unsmoothed position deviation, the influence of the code ISBs is smaller. This may be due to the decrease of the mean value of the code ISBs after carrier-phase smoothing, with the influence on the positioning results becoming smaller.
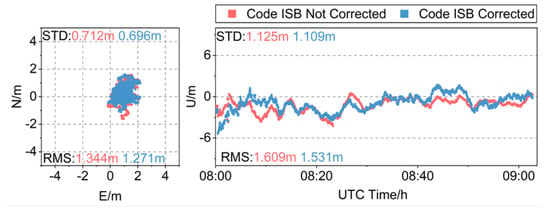
Figure 22.
Time series of the position deviation variations of carrier-phase-smoothed pseudorange differential positioning before and after correcting the Diff-Code ISBs.
4. Discussion
The influence of code ISBs on pseudorange positioning is related to the magnitude of code ISBs, and the magnitude of code ISBs is further related to the type of receiver. In high precision geodetic GNSS receivers, the code ISB is stable within a day. The code ISBs in the receivers of the Shanghai stations are significantly larger than those of the Wuhan stations, and their influence on the pseudorange positioning of the Shanghai stations is also significantly greater than those of the Wuhan stations. The code ISB in the WHUB station is about −0.2 m, which is smaller than that in other stations. This may be due to the fact that the data quality received by the receiver of the WHUB station is better than that of other stations, so the code ISBs are small and have little effect on the positioning result. In the baseline with homogeneous receivers, the code ISBs are small, which has little effect on the positioning results. In the baselines with heterogeneous receivers, the code ISBs are larger, which has an obvious impact on the positioning results. At this time, the code ISBs in this receiver can be ignored. When using the low-cost u-blox receiver for positioning, the code ISBs are significantly larger than the code ISBs in the geodetic GNSS receivers, and the code ISBs have a more obvious effect on the positioning accuracy in the low-cost u-blox receiver.
The carrier-phase smoothing method can effectively improve pseudorange positioning accuracy. The comparison of Figure 7, Figure 9, Figure 11 and Figure 13 shows that the positioning errors of each station and baseline have different degrees of decline after carrier-phase smoothing. In Table 6, some results of pseudorange positioning before and after smoothing are counted. The position deviations are reduced by about 50% after carrier-phase smoothing in the Shanghai baseline, which may be because the receivers in Shanghai are located in residential areas and the observation noise is large. In correspondence, the position deviation is reduced by about 20% in the Wuhan baseline, which may be attributed to the small observation noise of the Wuhan receivers, which are located in a quiet area on the roof. The position deviations of the positioning results of the u-blox receiver are also significantly reduced after carrier-phase smoothing. It can be seen that in low-cost navigation and positioning, the carrier-phase smoothing method can effectively improve the accuracy of pseudorange positioning.

Table 6.
Statistics of partial results of pseudorange positioning before and after smoothing.
Carrier-phase smoothing can reduce the dispersion of the code ISB distribution. In the geodetic GNSS receivers with large noise, the STD value of the undifferential code ISBs are reduced by about 30% after smoothing, and the STDs value of the differential code ISB are reduced by more than 50%. For the stations with less noise, it is reduced by 10% and 20.49%, respectively. In the low-cost receiver, due to the unstable data quality of the receiver, the code ISBs still have a large fluctuation. After smoothing, the STD values of the undifferenced code ISBs are only reduced by 4.18%, and the STD values of the differential code ISBs are reduced by 9.25%.
Before carrier-phase smoothing, the position deviations of the pseudorange SPP of the Shanghai stations are reduced by about 5.4% averagely after correcting the code ISBs, and the position deviations of differential positioning for the ROV1-WHUB baseline is reduced by about 3.4%. However, after carrier-phase smoothing, the corresponding position deviations of the Shanghai stations and the ROV1-WHUB baseline are respectively reduced by about 6.6% and 6.0% after correcting the code ISBs. Therefore, it can be inferred that the influence of code ISBs should be considered for the positioning mode with high observation accuracy. The influence of code ISBs on the positioning accuracy of the ROV1 station after carrier-phase smoothing is almost the same as that before carrier-phase smoothing. This may be because the observation noise of the ROV1 station is small and the accuracy of pseudorange observations is high, so the influence of code ISBs on the positioning accuracy before and after carrier-phase smoothing is almost unchanged in the ROV1 station. In the low-cost u-blox receiver positioning, the undifferenced code ISBs after carrier-phase smoothing become larger, so the influence of them after carrier-phase smoothing on the positioning accuracy is increased from 7.21% and 12.83% to 10% and 13.94%. The differential code ISBs decrease after carrier-phase smoothing, and the influence of the code ISBs on the positioning position deviations in the horizontal and vertical component are reduced from 10.08% and 10.41% to 5.43% and 4.85%.
In other studies of ISBs in combined BDS-2 and BDS-3 positioning [], it is found that the code ISBs in the B3I frequency were at the millimeter level and it can be assumed that there were no code ISBs in the B3I frequency. Therefore, the code ISBs in the B3I frequency were not further investigated in this paper.
5. Conclusions
In this work, we investigate the variation characteristics of code ISBs in geodetic GNSS receivers and low-cost receivers, and their impact on pseudorange positioning accuracy. The results show that:
- (1)
- Code ISBs vary among different receivers, but the STDs are close, which shows the code ISB distribution in the homogeneous receivers has strong consistency. The code ISBs in each type of geodetic GNSS receiver are about −0.3 m to −0.8 m. The code ISB in the baseline with homogeneous receivers is reduced to about −0.2 m, while the code ISB in the baseline with heterogeneous receivers is still large, about −0.5 m.
- (2)
- The STD values of code ISBs in the low-cost receiver u-blox M8T are larger than that in geodetic GNSS receivers, which are unstable in a short time. For low-cost receivers, correcting the code ISBs can improve the availability of positioning data at different satellite elevation angles, which can effectively improve the performance of low-cost navigation and positioning.
- (3)
- After correcting the code ISBs, the SPP position deviations of each geodetic GNSS receiver can be reduced by about 7%. For the baseline with homogeneous receivers, the influence of the code ISBs of the B1I frequency on positioning accuracy is less than 1%, which is negligible. For the baselines with heterogeneous receivers, the differential positioning position deviations can be reduced by 4% after correcting the code ISBs.
- (4)
- After correcting the code ISBs, the SPP position deviations of the low-cost receiver u-blox M8T can be reduced by about 11%, and the pseudorange differential positioning position deviations can be reduced by about 12%. Correcting the code ISBs in the low-cost receiver can effectively improve the pseudorange positioning accuracy.
- (5)
- The distribution dispersion of the estimated code ISBs can be reduced after carrier-phase smoothing. For geodetic GNSS receivers, the STD values of undifferential and differential code ISBs are reduced by 30% and 50%, respectively. For low-cost receivers, due to the unstable data quality, the STD values of code ISBs are reduced by 4% to 7%.
- (6)
- For geodetic GNSS receivers, the position deviations of the carrier-phase-smoothed pseudorange SPP and differential positioning with heterogeneous receivers can be reduced by about 9% and 6%, respectively, when correcting the code ISBs. For the low-cost receiver u-blox M8T, the position deviations of the carrier-phase-smoothed pseudorange SPP can be reduced by about 14% after ISB correction, and the differential positioning reduced by about 5%.
It should be noted that the assumed precision of the BDS-2 and BDS-3 pseudorange measurements may not be that realistic. An investigation to obtain the proper stochastic model for combined BDS-2 and BDS-3 positioning will be made.
Author Contributions
Conceptualization, Z.M. and J.C.; formal analysis, Z.M., J.C., Z.L., X.S., Y.X. (Yan Xiang), Y.X. (Yan Xu), C.D. and M.H.; investigation, J.C., Z.L. and X.S.; methodology, Z.M., J.C. and C.D.; software, Z.M.; writing—original draft, Z.M.; writing—review and editing, J.C., Q.L. and Yan Xu. All authors have read and agreed to the published version of the manuscript.
Funding
This work was supported by the Shandong Provincial Natural Science Foundation (Grant No. ZR2021QD131); the Foundation of Shanghai Key Laboratory of Navigation and Location Based Services (Grant No. SKLNLBS2023002); and the National Natural Science Foundation of China (Grant No. 42304036).
Data Availability Statement
The original contributions presented in the study are included in the article, further inquiries can be directed to the corresponding author.
Acknowledgments
We thank the anonymous reviewers for their constructive comments and suggestions.
Conflicts of Interest
Author Mengtang Hui was employed by the company North Information Control Research Academy Group Co., Ltd. Author Qing Li was employed by the company Baidu Era Network Technology (Beijing) Co., Ltd. The remaining authors declare that the research was conducted in the absence of any commercial or financial relationships that could be construed as a potential conflict of interest.
References
- Hegarty, C.; Powers, E.; Foville, B. Accounting for timing biases between GPS, modernized GPS, and Galileo signals. In Proceedings of the 36th Annual Precise Time and Time Interval Meeting, Washington, DC, USA, 7–9 December 2004; pp. 307–317. [Google Scholar]
- Montenbruck, O.; Hauschild, A.; Hessels, U. Characterization of GPS/GIOVE sensor stations in the CONGO network. Gps Solut. 2011, 15, 193–205. [Google Scholar] [CrossRef]
- Odijk, D.; Teunissen, P.J.G. Characterization of between-receiver GPS-Galileo inter-system biases and their effect on mixed ambiguity resolution. Gps Solut. 2013, 17, 521–533. [Google Scholar] [CrossRef]
- Paziewski, J.; Sieradzki, R.; Wielgosz, P. Selected properties of GPS and Galileo-IOV receiver intersystem biases in multi-GNSS data processing. Meas. Sci. Technol. 2015, 26, 95008–95009. [Google Scholar] [CrossRef]
- Deng, C.; Liu, Q.; Zou, X.; Tang, W.; Cui, J.; Wang, Y.; Guo, C. Investigation of Tightly Combined Single-Frequency and Single-Epoch Precise Positioning Using Multi-GNSS Data. Remote Sens. 2020, 12, 285. [Google Scholar] [CrossRef]
- Li, M.; Rovira-Garcia, A.; Nie, W.; Xu, T.; Xu, G. Inter-system biases solution strategies in multi-GNSS kinematic precise point positioning. Gps Solut. 2023, 27, 100. [Google Scholar] [CrossRef]
- Liu, X.; Jiang, W.; Chen, H.; Zhao, W.; Huo, L.; Huang, L.; Chen, Q. An analysis of inter-system biases in BDS/GPS precise point positioning. Gps Solut. 2019, 23, 116. [Google Scholar] [CrossRef]
- Mi, X.; Zhang, B.; Yuan, Y. Multi-GNSS inter-system biases: Estimability analysis and impact on RTK positioning. Gps Solut. 2019, 23, 81. [Google Scholar] [CrossRef]
- Mi, X.; Zhang, B.; Yuan, Y.; Luo, X. Characteristics of GPS, BDS2, BDS3 and Galileo inter-system biases and their influence on RTK positioning. Meas. Sci. Technol. 2020, 31, 15009. [Google Scholar] [CrossRef]
- Jiang, N.; Xu, Y.; Xu, T.; Xu, G.; Sun, C.; Schuh, H. GPS/BDS short-term ISB modelling and prediction. Gps Solut. 2017, 21, 163–175. [Google Scholar] [CrossRef]
- Tang, W.; Liu, Q.; Shen, M.; Deng, C.; Cui, J. BDS/GPS inter-system deviation estimation algorithm and performance analysis. Geod Geodyn. 2019, 39, 1–6. [Google Scholar]
- Zeng, A.; Yang, Y.; Ming, F.; Jing, Y. BDS–GPS inter-system bias of code observation and its preliminary analysis. Gps Solut. 2017, 21, 1573–1581. [Google Scholar] [CrossRef]
- Angrisano, A.; Gaglione, S.; Gioia, C. Performance assessment of GPS/GLONASS single point positioning in an urban environment. Acta Geod. Geophys. 2013, 48, 149–161. [Google Scholar] [CrossRef]
- Pan, L.; Zhang, Z.; Yu, W.; Dai, W. Intersystem Bias in GPS, GLONASS, Galileo, BDS-3, and BDS-2 Integrated SPP: Characteristics and Performance Enhancement as a Priori Constraints. Remote Sens. 2021, 13, 4650. [Google Scholar] [CrossRef]
- Pan, J.; Hu, X.; Zhou, S.; Tang, C.; Guo, R.; Zhu, L.; Tang, G.; Hu, G. Time synchronization of new-generation BDS satellites using inter-satellite link measurements. Adv. Space Res. 2018, 61, 145–153. [Google Scholar] [CrossRef]
- Jiao, G.; Song, S.; Jiao, W. Improving BDS-2 and BDS-3 joint precise point positioning with time delay bias estimation. Meas. Sci. Technol. 2020, 31, 25001. [Google Scholar] [CrossRef]
- Deng, C.; Qi, S.; Tang, W.; Hui, M.; Zou, X.; Wang, Y.; Li, Y.; Guo, C. Model comparison and performance analysis of multi-frequency precise positioning with the joint BDS-2 and BDS-3 system. Adv. Space Res. 2022, 69, 3044–3058. [Google Scholar] [CrossRef]
- Mi, X.; Sheng, C.; El-Mowafy, A.; Zhang, B. Characteristics of receiver-related biases between BDS-3 and BDS-2 for five frequencies including inter-system biases, differential code biases, and differential phase biases. Gps Solut. 2021, 25, 113. [Google Scholar] [CrossRef]
- Liu, W.; Wu, M.; Zhang, X.; Wang, W.; Ke, W.; Zhu, Z. Single-epoch RTK performance assessment of tightly combined BDS-2 and newly complete BDS-3. Satell. Navig. 2021, 2, 6. [Google Scholar] [CrossRef]
- Zhang, Z.; Pan, L. Current performance of open position service with almost fully deployed multi-GNSS constellations: GPS, GLONASS, Galileo, BDS-2, and BDS-3. Adv. Space Res. 2022, 69, 1994–2019. [Google Scholar] [CrossRef]
- Liu, H.; Shu, B.; Xu, L.; Qian, C.; Zhang, R.; Zhang, M. Accounting for Inter-System Bias in DGNSS Positioning with GPS/GLONASS/BDS/Galileo. J. Navig. 2017, 70, 686–698. [Google Scholar] [CrossRef]
- Kang, C. A Differential Dynamic Positioning Algorithm Based on GPS/Beidou. Procedia Eng. 2016, 137, 590–598. [Google Scholar] [CrossRef]
- Meng, F.; Li, S. BDS triple-frequency carrier phase combination smoothing pseudo-range algorithm. IOP conference series. Mater. Sci. Eng. 2020, 780, 32044. [Google Scholar]
- Cui, J.; Yan, R.; Deng, C.; Tang, W.; Zou, X.; Shen, M.; Liu, Q.; Wang, Y.; Li, Y. GPS + BDS Network Real-Time Differential Positioning Using a Position Domain Estimation Method. Remote Sens. 2019, 11, 1480. [Google Scholar] [CrossRef]
- Tang, W.; Cui, J.; Hui, M.; Deng, C. Performance Analysis for BDS Phase-smoothed Pseudorange Differential Positioning. J. Navig. 2016, 69, 1011–1023. [Google Scholar] [CrossRef]
- Teunissen, P.J.G.; Amiri-Simkooei, A.R. Least-squares variance component estimation. J. Geodesy. 2008, 82, 65–82. [Google Scholar] [CrossRef]
- King, R.W.; Bock, Y. Documentation for the GAMIT GPS Analysis Software; Massachusetts Institute of Technology: Cambridge, MA, USA, 1999. [Google Scholar]
- Hatch, R.R. The Synergism of GPS Code and Carrier Measurements. Int. Geod. Symp. Satell. Doppler Position. 1982, 2, 1213–1231. [Google Scholar]
- Swider, R.; Kaser KBra, R. Recent Developments in the LAAS Program. In Proceedings of the Position Location and Navigation Symposium IEEE 1998, Palm Springs, CA, USA, 20–23 April 1998; pp. 441–470. [Google Scholar]
- Bona, P. Precision, Cross Correlation, and Time Correlation of GPS Phase and Code Ob-servations. Gps Solut. 2000, 4, 3–13. [Google Scholar] [CrossRef]
- Geng, J.; Chen, X.; Pan, Y.; Mao, S.; Li, C.; Zhou, J.; Zhang, K. PRIDE PPP-AR: An open-source software for GPS PPP ambiguity resolution. Gps Solut. 2019, 23, 91. [Google Scholar] [CrossRef]
- Klobuchar, J.A. Ionospheric time delay algorithm for single frequency GPS users. IEEE Trans. Aerosp. Electron. Syst. 1987, 23, 325–331. [Google Scholar] [CrossRef]
- Saastamoinen, J. Atmospheric Correction for the Troposphere and Stratosphere in Radio Ranging Satellites. In Geophysical Monograph Series; American Geophysical Union: Washington, DC, USA, 1972; Volume 15, pp. 247–251. [Google Scholar]
- Zhang, B.; Teunissen, P.J.G. Characterization of multi-GNSS between-receiver differential code biases using zero and short baselines. Sci. Bull. 2015, 60, 1840–1849. [Google Scholar] [CrossRef]
- Pan, L.; Zhang, X.; Liu, J.; Li, X.; Li, X. Performance Evaluation of Single-frequency Precise Point Positioning with GPS, GLONASS, BeiDou and Galileo. J. Navig. 2017, 70, 465–482. [Google Scholar] [CrossRef]
Disclaimer/Publisher’s Note: The statements, opinions and data contained in all publications are solely those of the individual author(s) and contributor(s) and not of MDPI and/or the editor(s). MDPI and/or the editor(s) disclaim responsibility for any injury to people or property resulting from any ideas, methods, instructions or products referred to in the content. |
© 2024 by the authors. Licensee MDPI, Basel, Switzerland. This article is an open access article distributed under the terms and conditions of the Creative Commons Attribution (CC BY) license (https://creativecommons.org/licenses/by/4.0/).