Communication

Fault Kinematics of the 2023 Mw 6.0 Jishishan Earthquake, China, Characterized by Interferometric Synthetic Aperture Radar Observations

1
State Key Laboratory of Earthquake Dynamics, Institute of Geology, China Earthquake Administration, Beijing 100029, China
2
Seismological Bureau of Gansu Province, Lanzhou 730000, China
3
Faculty of Geomatics, Lanzhou Jiaotong University, Lanzhou 730700, China
*
Author to whom correspondence should be addressed.
Remote Sens. 2024, 16(10), 1746; https://doi.org/10.3390/rs16101746
Submission received: 21 March 2024 / Revised: 1 May 2024 / Accepted: 8 May 2024 / Published: 15 May 2024
(This article belongs to the Special Issue Monitoring Geohazard from Synthetic Aperture Radar Interferometry)

Abstract

:
Characterizing the coseismic slip behaviors of earthquakes could offer a better understanding of regional crustal deformation and future seismic potential assessments. On 18 December 2023, an Mw 6.0 earthquake occurred on the Lajishan–Jishishan fault system (LJFS) in the northeastern Tibetan Plateau, causing serious damage and casualties. The seismogenic fault hosting this earthquake is not well constrained, as no surface rupture was identified in the field. To address this issue, in this study, we use Interferometric Synthetic Aperture Radar (InSAR) data to investigate the coseismic surface deformation of this earthquake and invert both ascending and descending line-of-sight observations to probe the seismogenic fault and its slip characteristics. The InSAR observations show up to ~6 cm surface uplift caused by the Jishishan earthquake, which is consistent with the thrust-dominated focal mechanism. A Bayesian-based dislocation modeling indicates that two fault models, with eastern and western dip orientations, could reasonably fit the InSAR observations. By calculating the coseismic Coulomb failure stress changes (∆CFS) induced by both fault models, we find that the east-dipping fault scenario could reasonably explain the aftershock distributions under the framework of stress triggering, while the west-dipping fault scenario produced a negative ∆CFS in the region of dense aftershocks. Integrating regional geological structures, we suggest that the seismogenic fault of the Jishishan earthquake, which strikes NNE with a dip of 56° to the east, may be either the Jishishan western margin fault or a secondary buried branch. The optimal finite-fault slip modeling shows that the coseismic slip was dominated by reverse slip and confined to a depth range between ~5 and 15 km. The released seismic moment is 1.61 × 10¹⁸ N·m, which is equivalent to an Mw 6.07 earthquake. While the Jishishan earthquake ruptured a fault segment of approximately 20 km, it only released a small part of the seismic moment that was accumulated along the 220 km long Lajishan–Jishishan fault system. The remaining segments of the Lajishan–Jishishan fault system still have the capability to generate moderate-to-large earthquakes in the future.

1. Introduction

A coseismic slip directly delineates the focal mechanism of earthquakes, the spatial complexity of strain release, and the segmentation of rupture, thereby playing an important role in understanding the seismotectonic aspects of crustal faults [1,2]. Seismological and geodetic observations over the past few decades have yielded extensive datasets, including seismic wave records and surface displacements, which are widely used to invert the finite-fault slips of moderate-to-large (M > 6.5) earthquakes [3], thus advancing our understanding of the kinematic behavior of faults. However, mapping the coseismic faulting behaviors of medium–small earthquakes is often challenging, which arises from their limited magnitudes, resulting in a low signal-to-noise ratio in observational data, and from the fact that the rupture of these earthquakes often does not reach the surface, leading to significant uncertainty in characterizing their seismogenic faults. With the rapid development of space geodesy, particularly Interferometric Synthetic Aperture Radar (InSAR), mapping the surface deformation caused by medium–small earthquakes and inverting their slip characteristics have become important methods for studying buried slipping earthquakes [4]. The 2023 Mw 6.0 Jishishan earthquake, which occurred on the Lajishan–Jishishan fault system (LJFS) in northeastern Tibet, serves as a notable example of such cases.
The LJFS, located in the northeastern margin of the Tibetan Plateau, consists of two arcuate compressional–reverse fault zones protruding to the northeast [5,6]. Since the neotectonic movement and plateau uplift occurred, the LJFS has exhibited a combination of thrusting and strike-slip movement and evolved into the boundary of late Cenozoic basins, i.e., the Xunhua Basin and Linxia Basin (Figure 1) [5,7,8,9,10,11]. The LJFS connects the right-lateral Riyueshan fault to the west and the left-lateral western Qinling fault to the south [5,12], forming a tectonic transfer belt in northeastern Tibet with significant crustal deformation. With apparent lateral variations in strikes, the LJFS is divided into the northern and southern segments, which are referred to as the Lajishan fault and the Jishishan fault, respectively. According to the historical earthquake catalog, more than 20 M > 5 moderate earthquakes have occurred in this region [5], but they all occurred before modern instrumental records; hence, the seismogenic structure in this region remains to be revealed through earthquakes.
On 18 December 2023, an Mw 6.0 earthquake struck Jishishan County in Gansu Province, northwest China. The hypocenter of this earthquake, reported by the China Earthquake Network Center (CENC), was located at 35.70°N, 102.79°E, with a depth of 10 km. The focal mechanism of the earthquake is dominated by thrust faulting [14]. This earthquake resulted in landslides and building collapses, causing serious damage and casualties. Field surveys were carried out immediately after the earthquake. However, no obvious surface rupture was identified in the field, suggesting a buried slip of this earthquake. According to the focal mechanism (Figure 1), the seismogenic fault may be either the EEN- or SSW-dipping plane, which potentially correspond to JSS-WF and JSS-EF, respectively [9,15]. It is also plausible that a blind fault is responsible for the coseismic slip. The aftershock distribution may provide clues to characterize the seismogenic fault; however, most of the relocated aftershocks were clustered around the epicenter, with only a few extending along the NNW direction for approximately 20 km, offering a potential orientation but not sufficiently accurate information to delineate the seismogenic fault (Figure 1). Consequently, whether the seismogenic fault of the Jishishan earthquake is the surficial identified faults (JSS-WF or JSS-EF) or a blind fault remains unclear. Additional observational evidence is needed to resolve this issue. In addition to the above-mentioned scientific issue, as the largest event that occurred on the LJSF in nearly one century, the 2023 Mw 6.0 Jishishan earthquake provides a rare opportunity to investigate the seismogenic structures of this region.
Here, in this study, we use InSAR data to investigate the coseismic deformation and the seismogenic fault of the 2023 Jishishan earthquake. In the following, we first introduce the InSAR data and processing. Then, we explore the optimal geometric parameters of the seismogenic fault using a Bayesian-based dislocation model. Subsequently, we conduct finite-fault slip modeling of the earthquake and calculate the coseismic Coulomb stress changes (∆CFS). Integrating coseismic deformation, aftershocks, ∆CFS, and regional geological structures, we finally discuss the most plausible seismogenic fault of the Jishishan earthquake.

2. InSAR Data and Processing

We used Sentinel-1A images from the ascending track 128 and descending track 135 (Figure 1), freely provided by the European Space Agency, to extract the surface displacement induced by the 2023 Mw 6.0 Jishishan earthquake. The TOPS module within the InSAR Scientific Computing Environment (ISCE) software (Version 2.3) [16] was utilized to process the interferograms. The precise orbit data and the spectral diversity approach were applied to refine the accuracy of the coregistration [17]. We generated multi-looking (20 in azimuth and 5 in range) and created a phase adaptive filter for interferograms [18]. The 1 arc-second Shuttle Radar Topography Mission (SRTM) digital elevation model was employed to reduce the contribution of the topographic phase [19]. Finally, we unwrapped the interferometric phase using SNAPHU and masked pixels, with a coherence below 0.3 [20].
Figure 2a,d show the coseismic deformation from unwrapped interferograms for ascending and descending tracks, respectively. The regions that are far from the epicenter exhibit significant atmospheric noise; hence, we employed the Generic Atmospheric Correction Online Service for InSAR (GACOS), which can generate high-spatial-resolution zenith total delay maps for correcting the interferometric phase, to improve the quality of the interferograms [21,22]. Figure 2b,e show the coseismic deformation after atmospheric correction, with most of the atmospheric perturbations in the far field reduced to a negligible level (Figure 2c,f). On both the ascending and descending interferograms, we observed up to ~6 cm of ground motion in the direction of the line of sight (LOS), which corresponds to a ground motion towards the satellite and, hence, an uplift surface deformation. The coseismic surface deformation suggests that the 2023 Jishishan earthquake was dominated by reverse slip, which is consistent with its focal mechanism. Since only two tracks of InSAR images were processed, and given the thrusting focal mechanism of the Jishishan earthquake, deriving three-dimensional (3D) displacements requires either additional observations or strong assumptions such as neglectable north–south displacement. We tried to obtain the pixel offset induced by this earthquake, but we did not obtain high signal-to-noise ratio results due to the small surface deformation. In addition, we adopted the assumption that a neglectable north–south displacement may introduce bias to the resolved 3D displacements. Therefore, we did not resolve the 3D displacements but instead utilized the LOS data for the following finite-fault slip inversions.

3. Fault Geometry Exploration

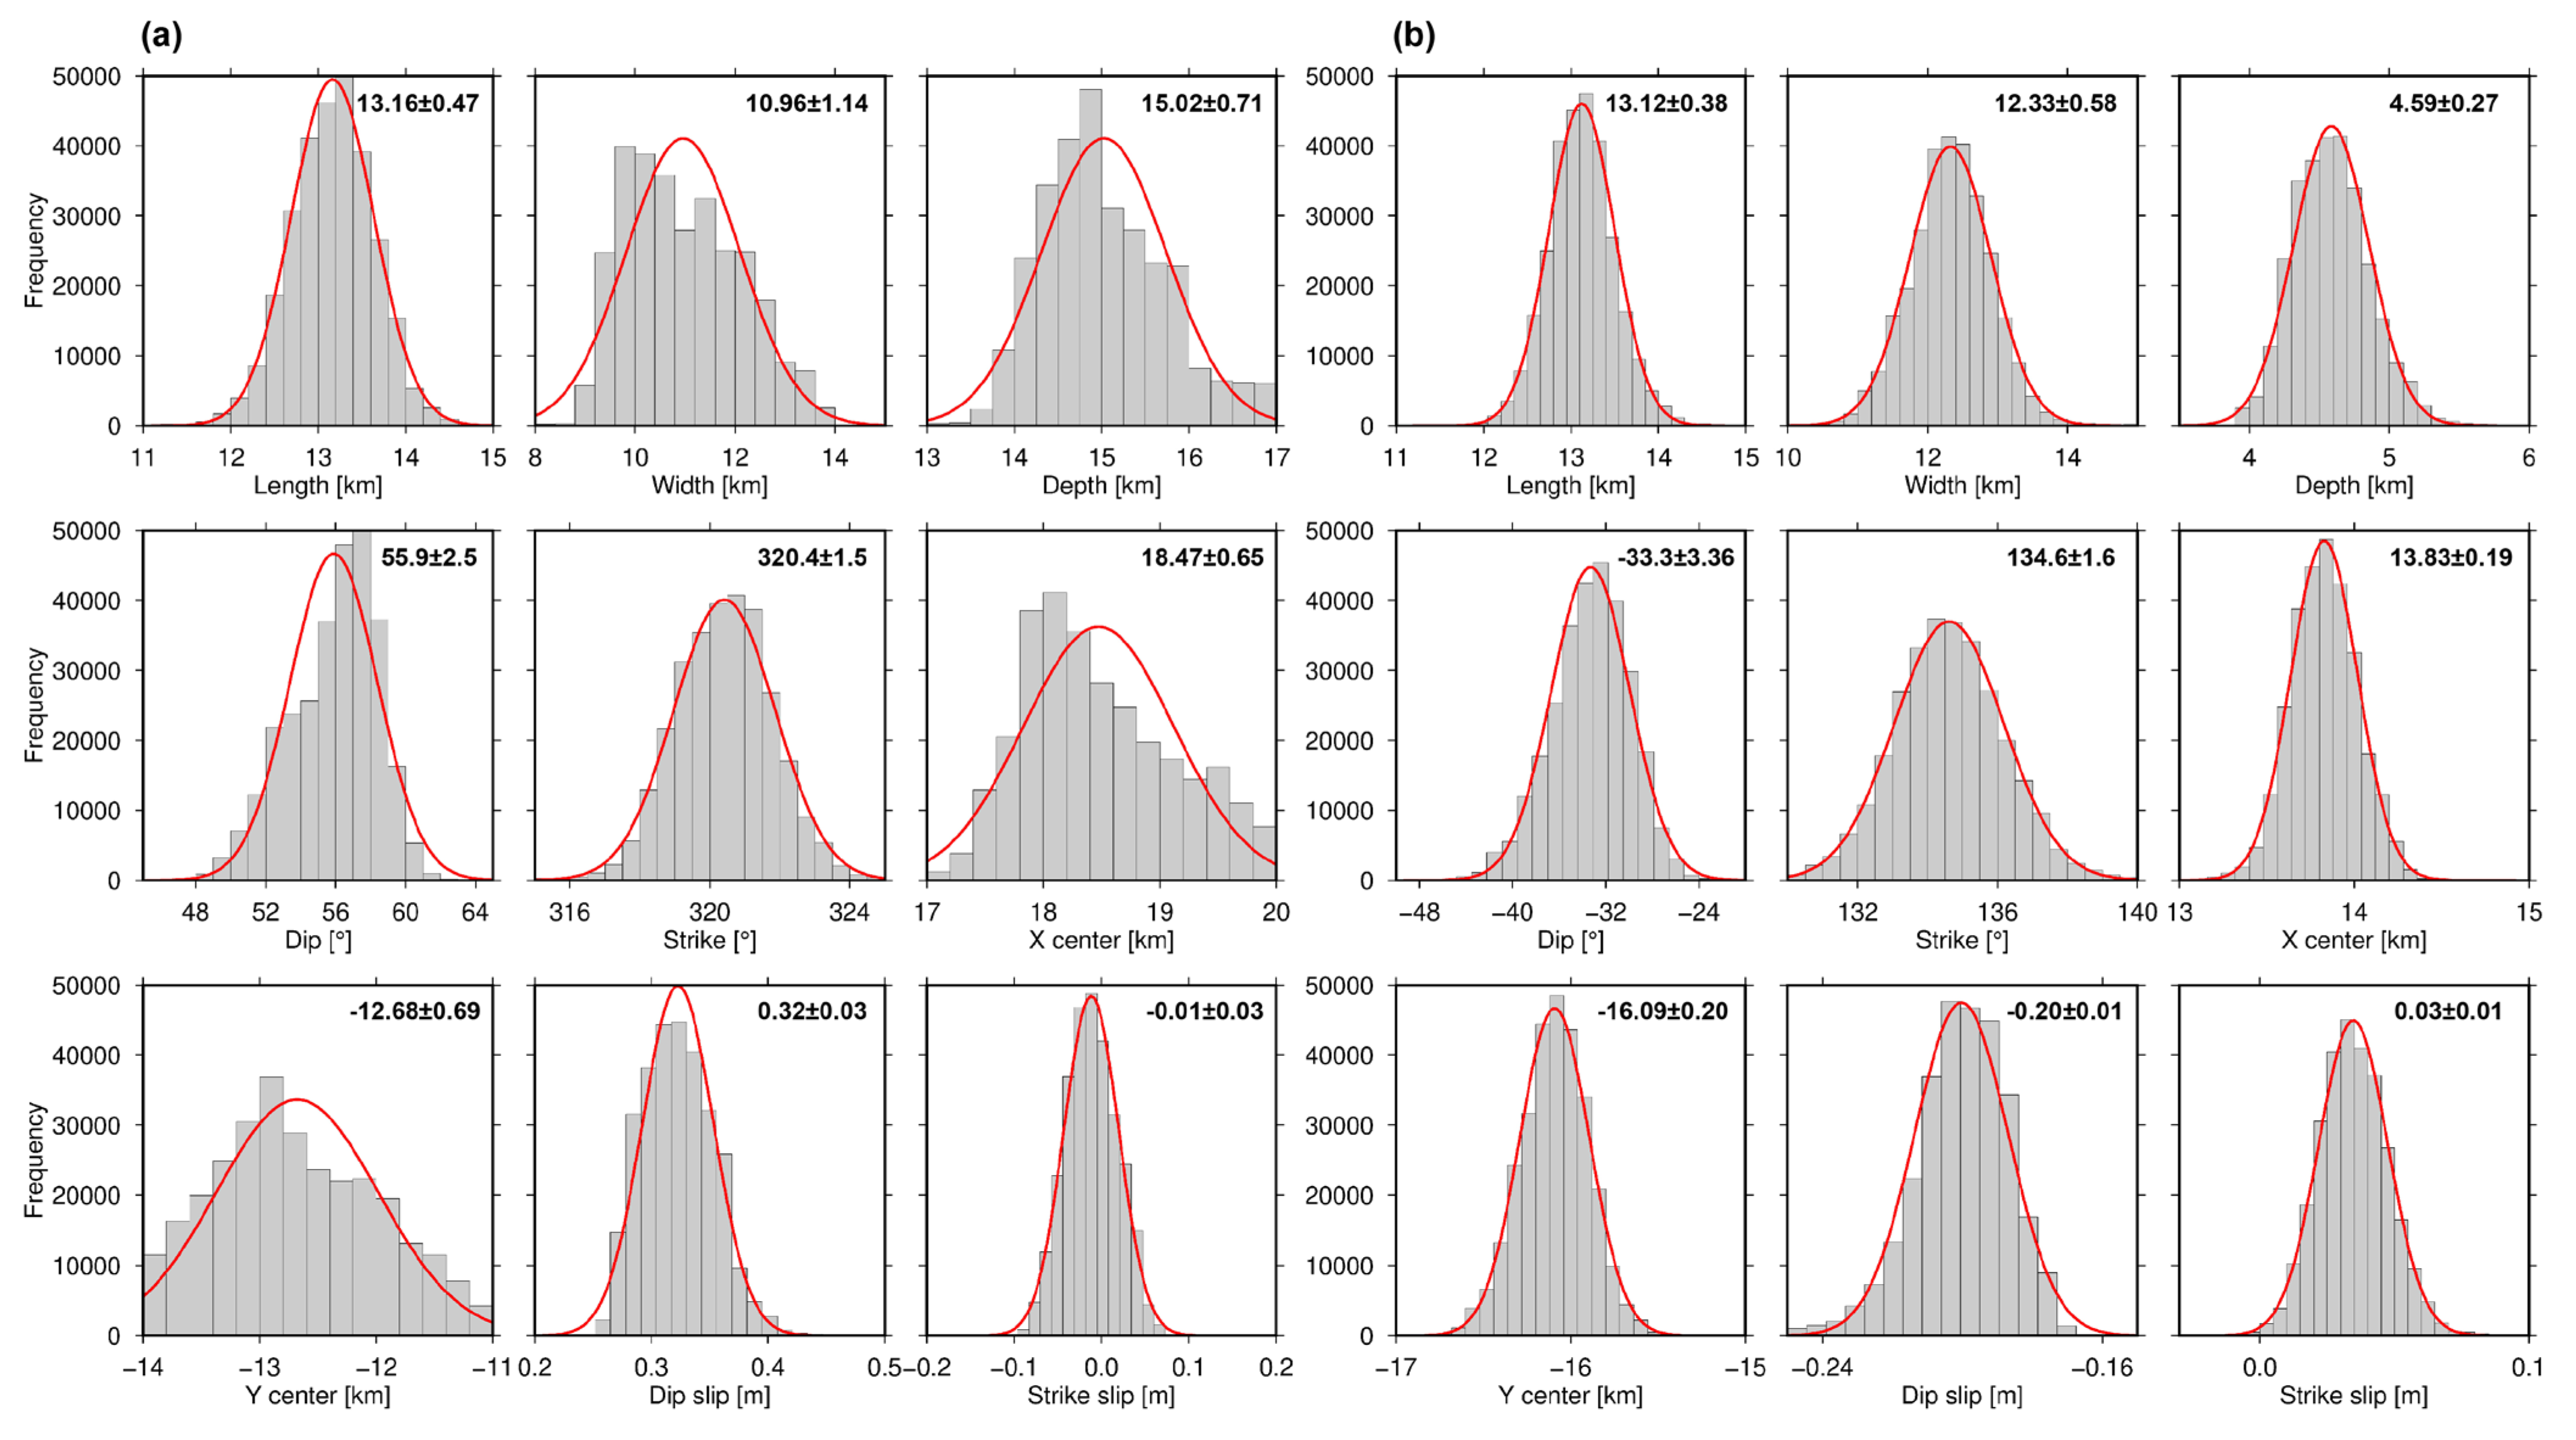
No surface ruptures were identified in the field, and the aftershocks could not characterize the seismogenic fault [23]. Given this, searching for the optimal geometrical fault parameters using non-linear inversion, integrated with the distribution of aftershocks and local geological structures, provides a plausible way to probe seismogenic structures [24,25,26,27]. To do so, we employed a non-linear inversion algorithm, implemented in the Geodetic Bayesian Inversion Software (GBIS, Version 1.1) [28], to build the maximum posterior probabilities of fault parameters (i.e., length, depth, width, strike, dip, position, and slip). The algorithm allows for the characterization of the posterior probability density functions of source model parameters through the Markov chain Monte Carlo method (MCMC). In the inversion, a rectangular fault with uniform slip, embedded in a homogeneous elastic half-space, is utilized, with a Poisson’s ratio of 0.25 [29]. Because no additional information is available for the seismogenic fault, we did not impose tight constraints on these parameters. A total of 3 × 10 5 samples were generated for each parameter, of which the first 5% were removed to mitigate the effects of initial values and the autocorrelation in the MCMC process [30]. To account for the possibility of east dipping and west dipping of the seismogenic fault, we employed both scenarios for the inversion.
The parameter settings and the optimal solutions are provided in Table 1. The posterior probability distributions of these fault parameters are shown in Figure 3. Both scenarios yield pure thrust slip for the Jishishan earthquake, which is consistent with its focal mechanism. In addition, compared to the west-dipping fault that dips at 33.3° and has a slip amplitude of 0.2 m, the east-dipping fault exhibits a higher dipping angle (55.9°) and larger slip (0.32 m). In the following, we utilize both fault geometries for the finite-fault slip inversion and ∆CFS calculation.

4. Finite-Fault Slip Modeling

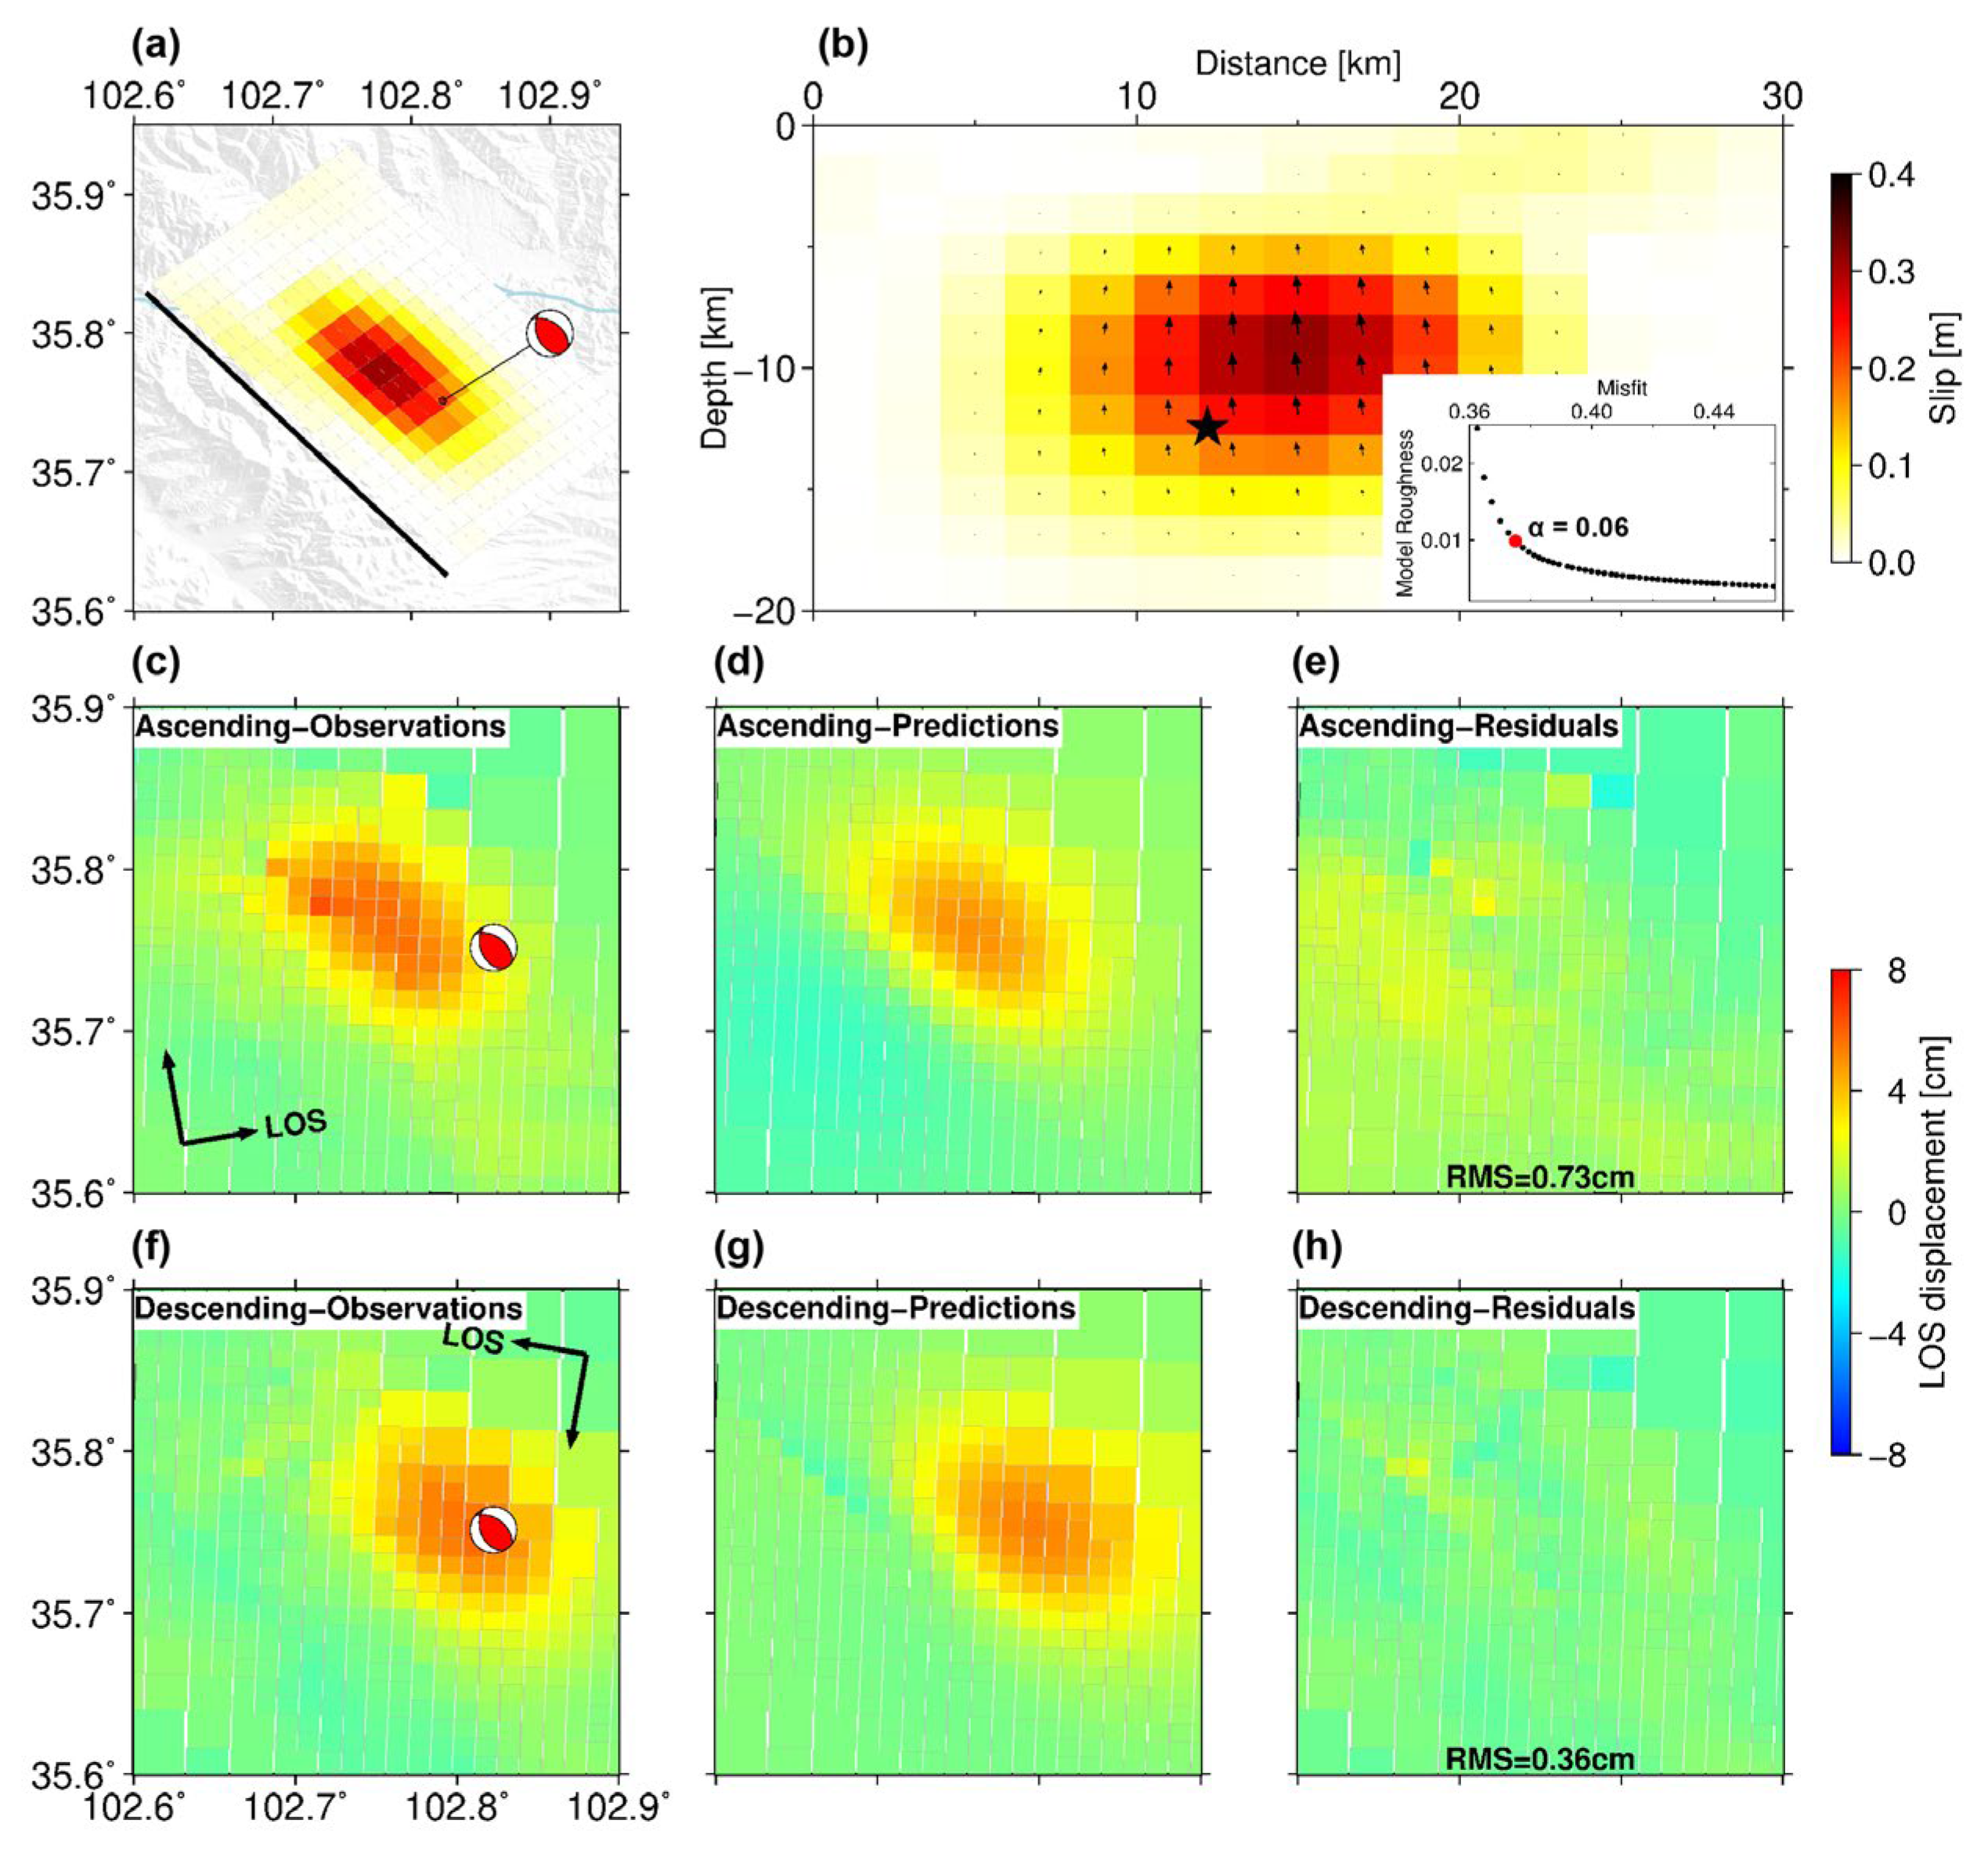
Based on the fault geometries that were resolved in Section 3, we inverted the LOS observations for the coseismic fault slip distributions of the Jishishan earthquake. We employed a constrained least-squares algorithm, implemented in the Steepest Descent Method (SDM) [31], to conduct the inversion. This method has been widely applied to invert coseismic and aseismic slips [32,33,34]. To sufficiently accommodate the entire coseismic slip zone, we extended the upper boundary of the seismogenic fault to the surface and extended the fault plane to 30 km in length and width. The fault plane was discretized to 2 × 2 km patches along the strike and dip, resulting in 225 patches in total.
We downsampled the InSAR pixels for ascending and descending tracks using a quadtree approach while maximizing the resolution on the fault plane [35]. Here, the quadtree approach uses a deformation gradient threshold to divide the window into different sizes [36], which results in dense pixels in the region of large coseismic deformation and parse pixels in the far field. To account for the potential uncertainty of the fault trace, we excluded InSAR data points within 1 km of the fault.
For the east-dipping fault scenario, we adopted a smoothing factor of 0.06 based on the L-curve between the InSAR data misfit and model roughness, aiming to avoid unrealistic variations in the slip between adjacent patches. The finite-fault slip model indicates a pure thrust motion for the Jishishan earthquake (Figure 4). The coseismic slip is concentrated at a depth range between ~5 and 15 km, with a maximum slip of 0.31 m. The root-mean-square (RMS) values for the residuals of both ascending and descending observations are less than 1 cm (Figure 4e,h). Assuming a shear modulus of 30 GPa, the released seismic moment is 1.61 × 10¹⁸ N·m, which is equivalent to an Mw 6.07 earthquake. For the west-dipping fault scenario, the finite-fault slip model suggests that this earthquake is dominated by thrust slip with a slight right-lateral slip (Figure 5). The maximum slip of 0.25 m at a depth of ~7 km is smaller than that of the east-dipping scenario. The seismic moment (1.55 × 10¹⁸ N·m) corresponds to an Mw 6.06 earthquake. It is apparent that both fault models could reasonably explain the surface observations. To determine the most plausible seismogenic fault, we calculated ∆CFS using both slip models and compared them with aftershock distributions.

5. Discussion

Identifying the geometric structure of seismogenic faults contributes to a better understanding of regional tectonics. Coseismic geodetic data, however, may suffer from ambiguity when determining seismogenic faults, especially for buried thrusting earthquakes [37]. In our case here, we identified two fault models to explain the coseismic slip of the 2023 Jishishan earthquake, both of which could reasonably fit the InSAR observations (Figure 4 and Figure 5). Therefore, a comprehensive analysis is needed to determine the most plausible fault plane for the Jishishan earthquake.
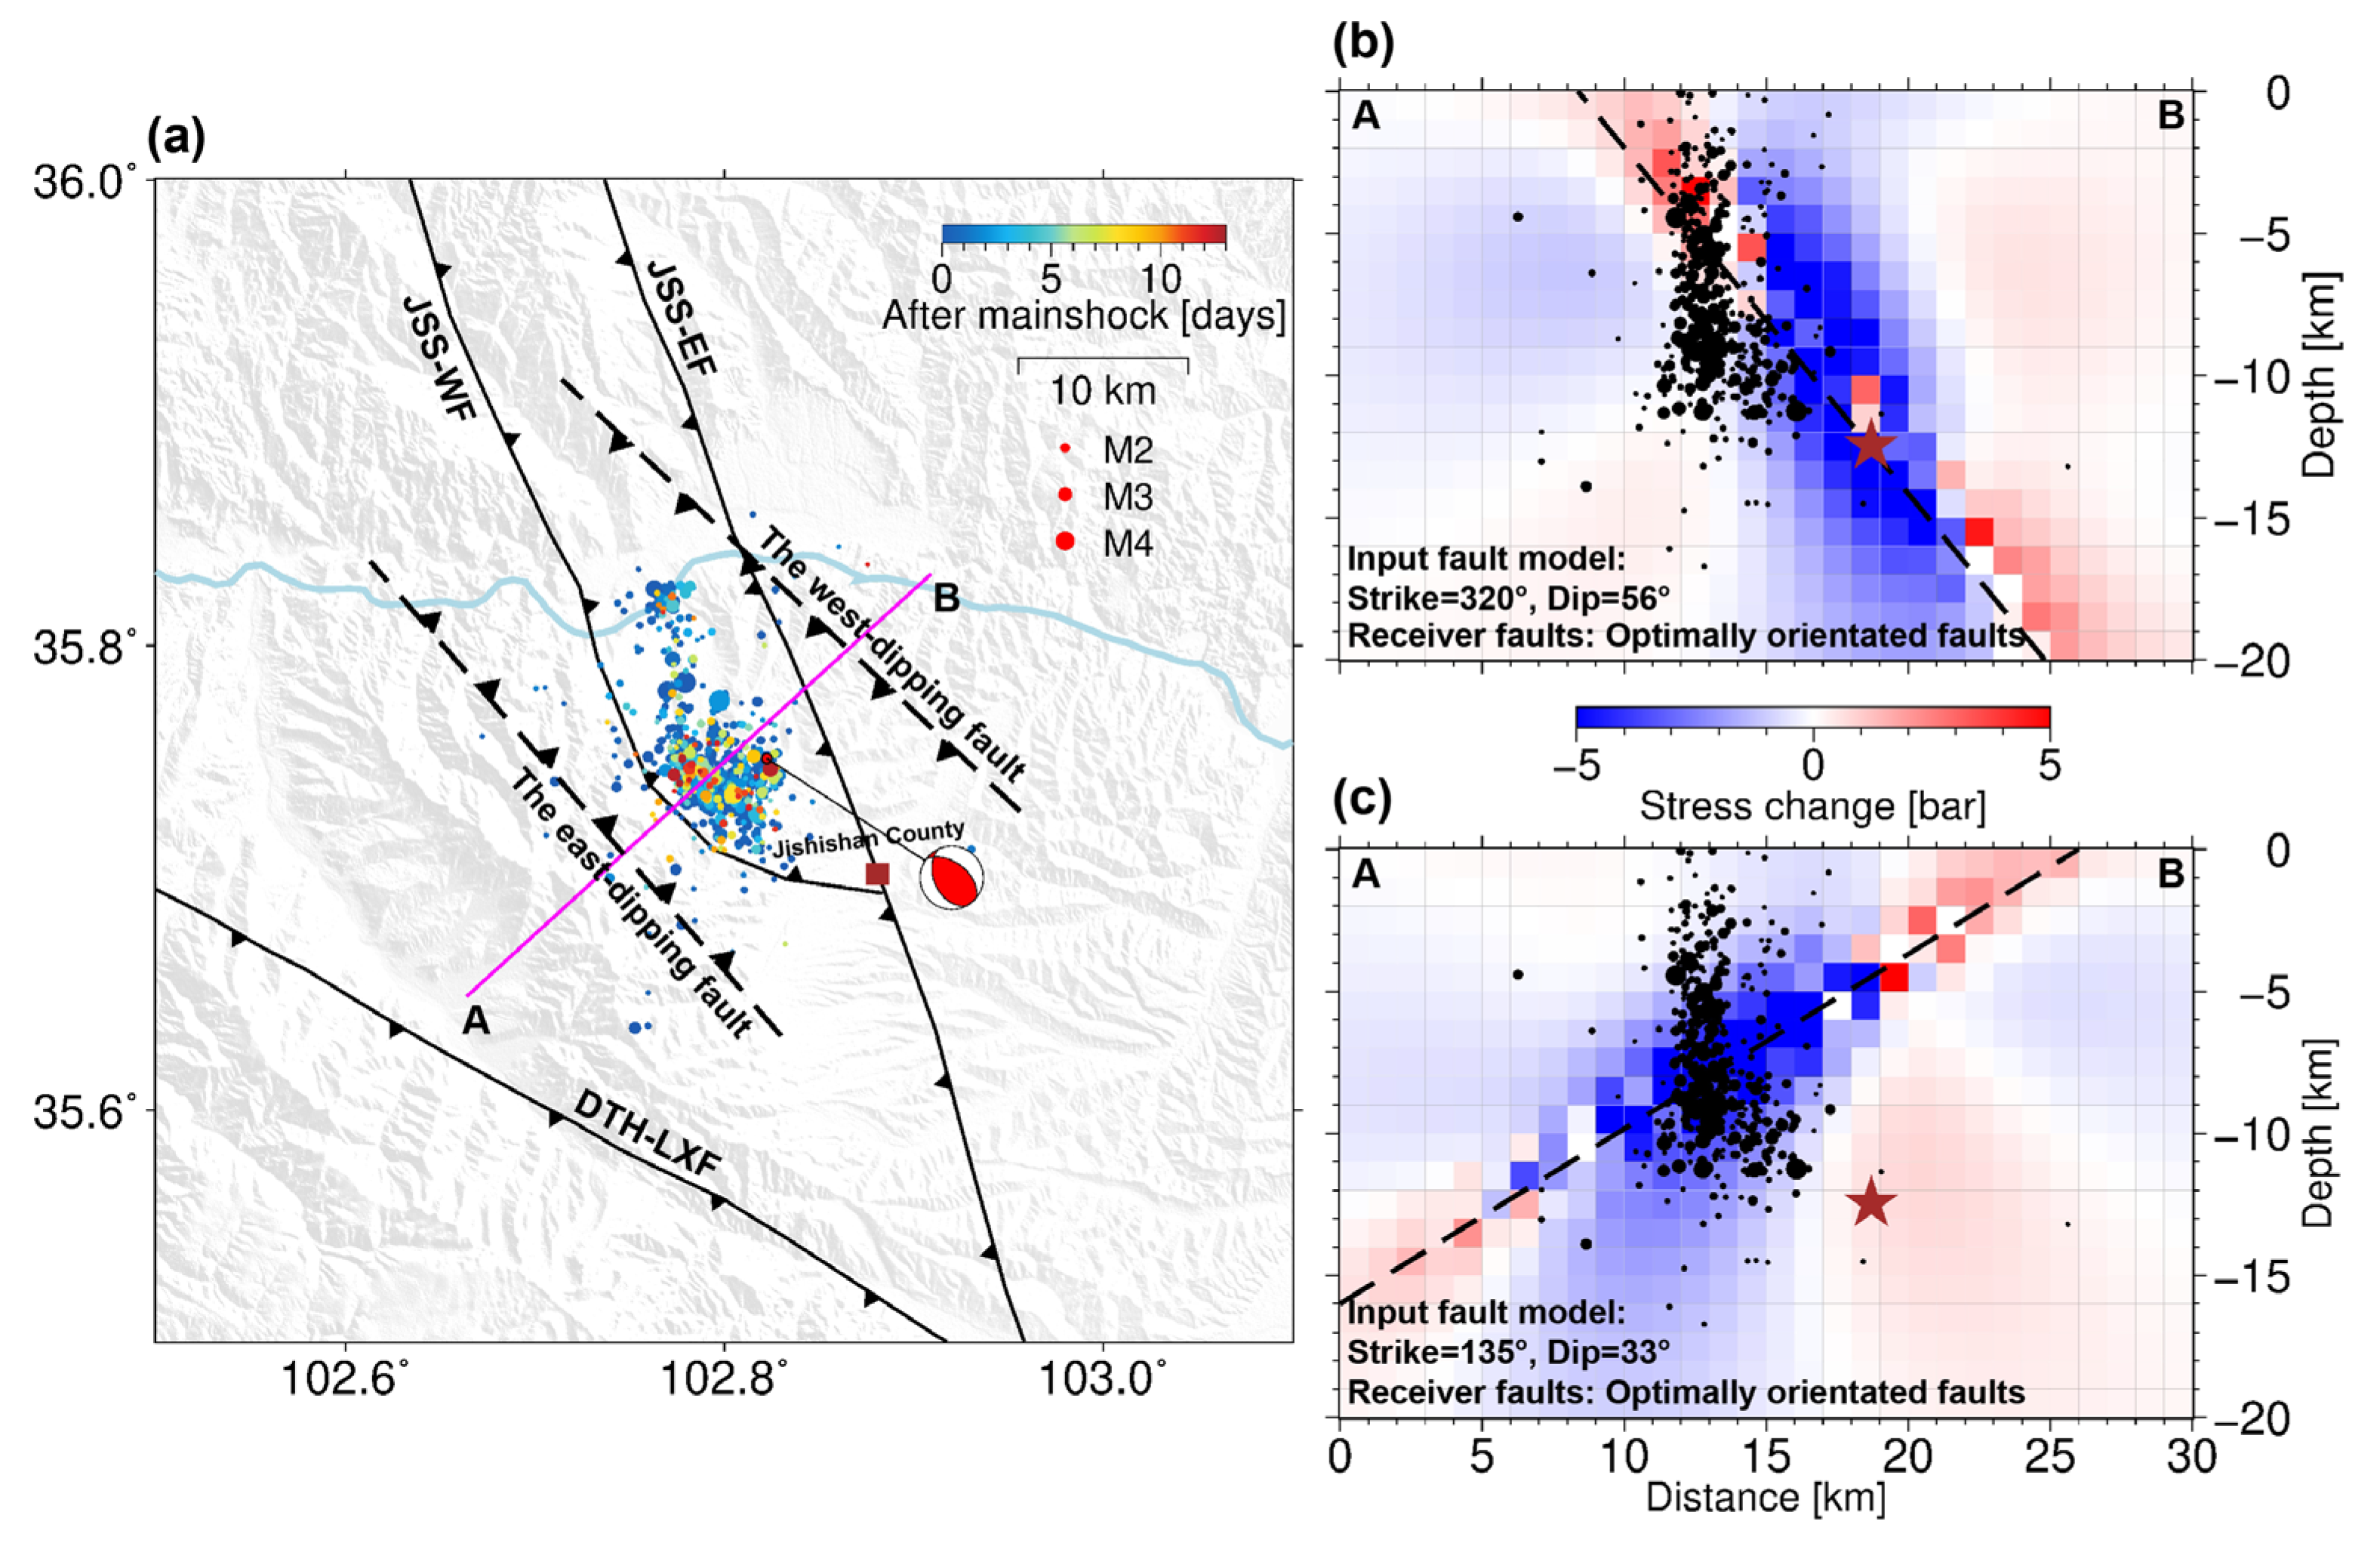
A coseismic slip could generate ∆CFS on the seismogenic fault and its surroundings, which may trigger aftershocks. Hence, checking the correlation between the ∆CFS and aftershock distributions provides a plausible way to probe the seismogenic fault, on the basis that the majority of aftershocks are triggered by coseismic Coulomb failure stress loading [38,39,40,41,42,43]. Following this criterion, we used the Coulomb 3.3 software to calculate the ∆CFS in the depth range of 0 to 20 km, utilizing both the east- and west-dipping slip models as input. Referencing previous studies [29,38,44,45], we employed a homogeneous crust with a Poisson’s ratio and friction coefficient of 0.25 and 0.4, respectively. Relocated aftershocks in the two weeks following the mainshock were collected, as shown in Figure 6a. Since no aftershocks with a magnitude larger than 5 had occurred, we considered that the ∆CFS was dominated by the mainshock.
Figure 6b shows the ∆CFS as a function of depth along the AB profile, where the east-dipping fault slip model is utilized as the input. To avoid the impacts of an arbitrary fault geometry on the distribution of ∆CFS, the optimally orientated faults were set as the receiver faults. It is apparent that most of the aftershocks, which are selected within 2 km of the profile, are scattered within the positive ∆CFS lobe, suggesting triggering effects. At the hypocentral depth, the ∆CFS is negative, indicating that the stress in this region has been sufficiently released, which is also supported by the fact that few aftershocks occurred in this region. However, in the west-dipping fault scenario, where the west-dipping fault slip model was utilized as the input, the majority of aftershocks are located in the region of negative ∆CFS (Figure 6c), which seems implausible unless an additional mechanism is involved to explain the distribution of aftershocks [39,40,46].
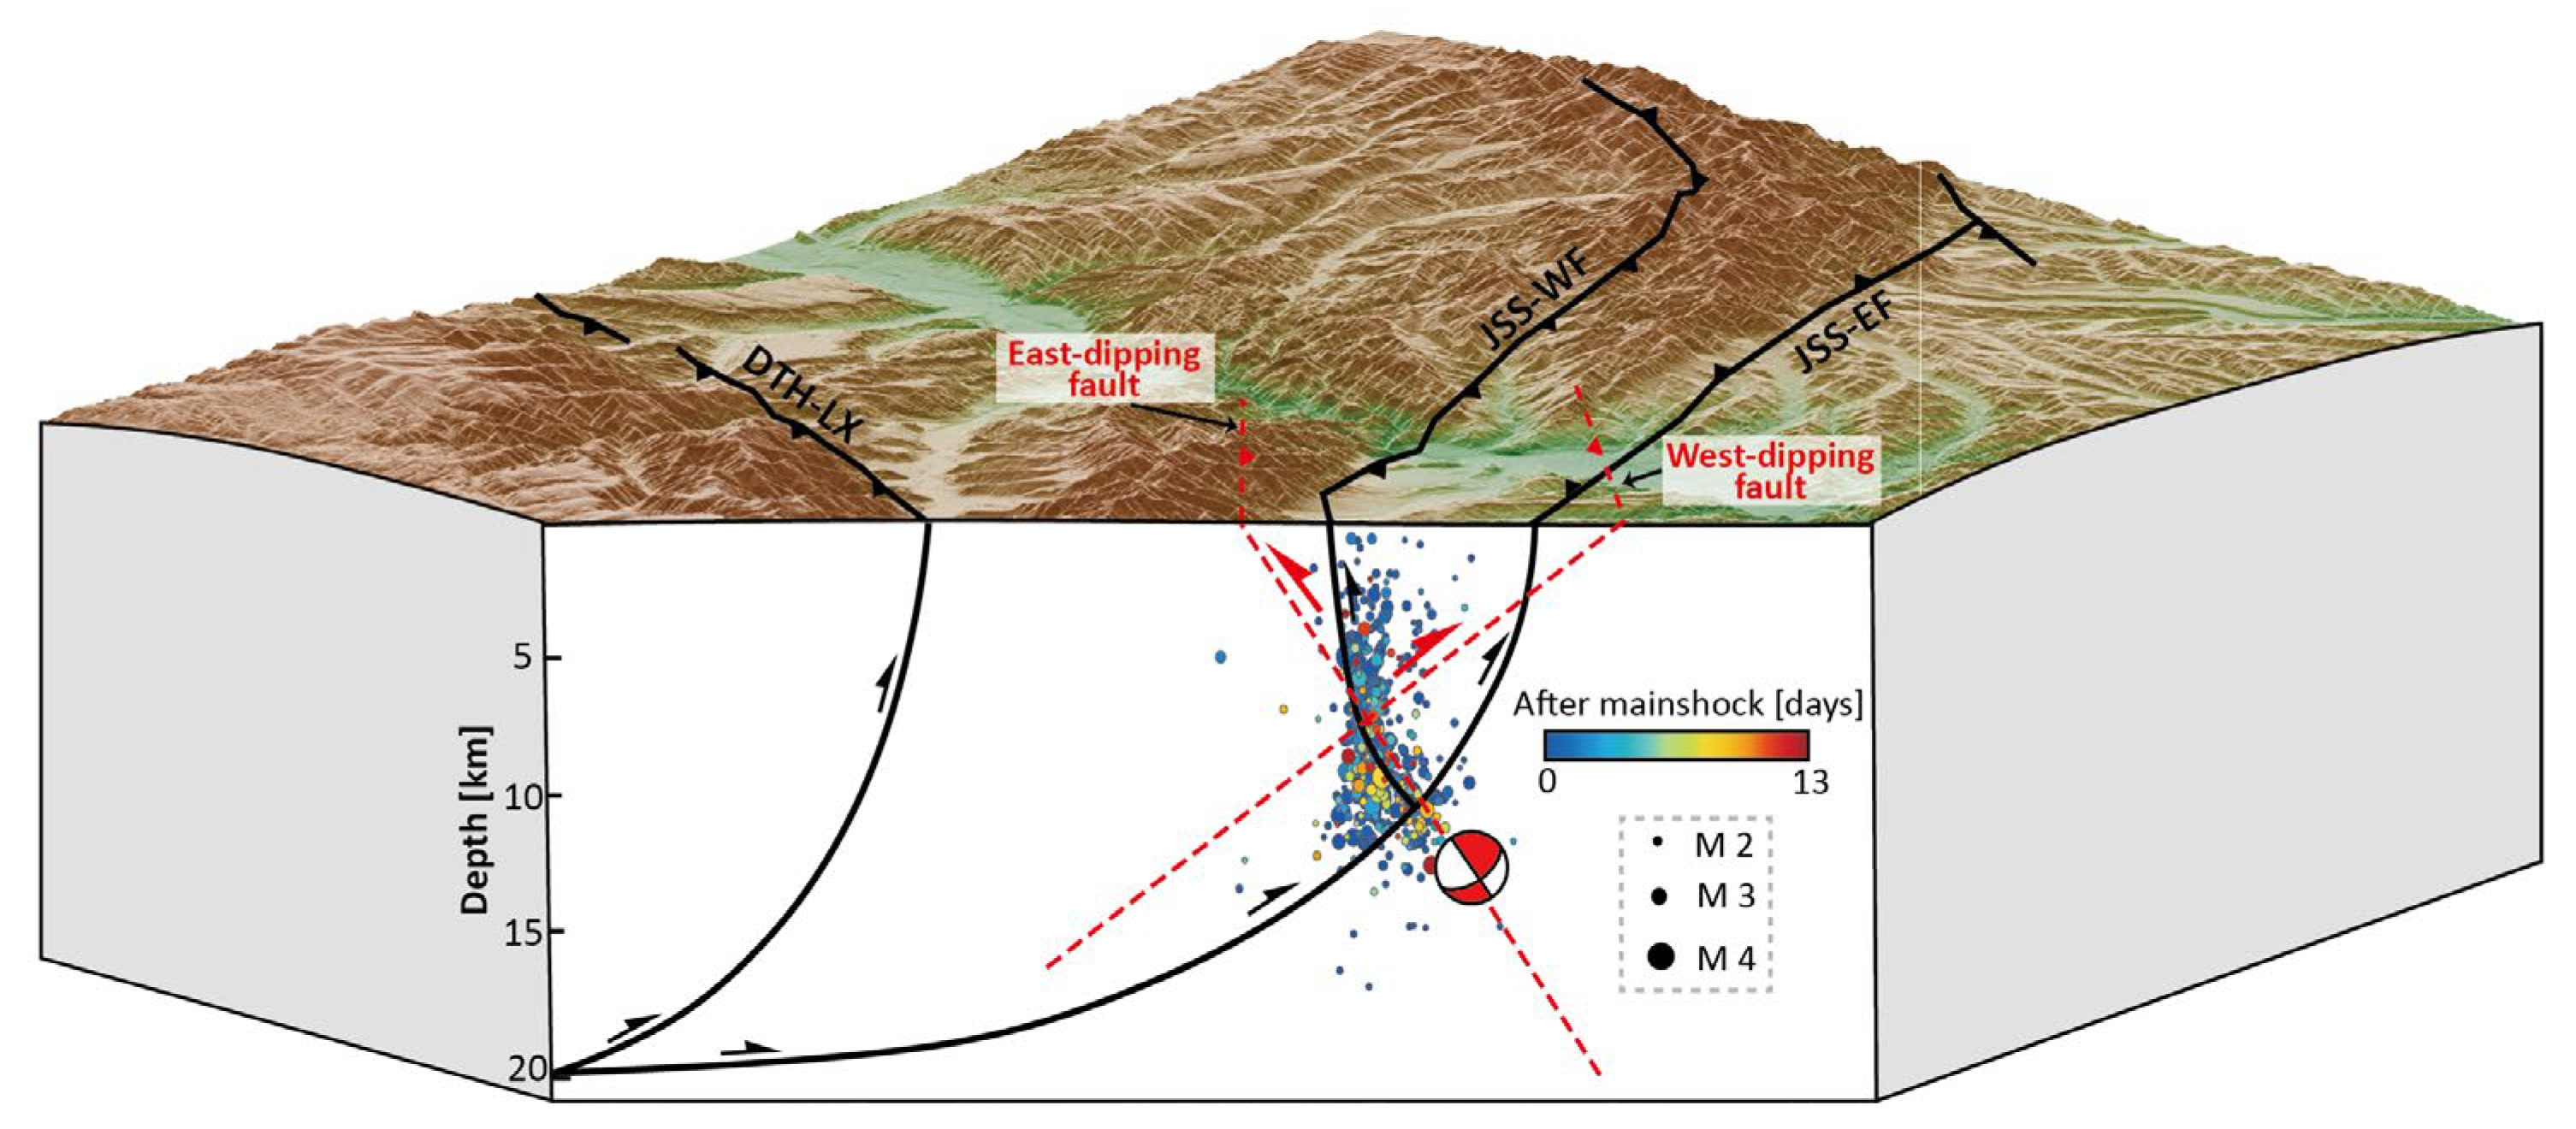
In addition to the comparison between the aftershocks and ∆CFS, we provide additional evidence to examine the seismogenic fault from the perspective of the regional geological structure. The 2023 Jishishan earthquake occurred near the Jishishan fault, which is divided into eastern and western branches, with different fault slip rates, and potentially includes secondary buried faults [12,15]. The JSS-EF dips southwestward at ~60°, presenting as a linear steep cliff in the surface [15,47]. Projecting the 33° westward-dipping fault plane that was resolved in this study onto the cross-fault profile, inconsistence is apparent among this fault plane and the JSS-EF (Figure 7). In contrast, the JSS-WF dips northeastward at ~50–70°, which is overlayed by Quaternary loose deposits and exhibits predominantly reverse faulting characteristics [5,15]. Projecting the ~56° eastward-dipping fault constrained by InSAR onto the same fault-crossing profile shown in Figure 7, it seems that this fault plane could match the JSS-WF at depth. Integrating the above observation that ∆CFS induced by the east-dipping fault better explains the distribution of aftershocks, we suggest that the seismogenic fault of the 2023 Jishishan earthquake might be the JSS-WF. Nevertheless, it is also possible that a secondary branch of the JSS-WF was responsible for the Jishishan earthquake. Detailed geophysical observations in the future may help to better determine the fault structures at depth.
The 2023 Jishishan earthquake has crucial implications regarding the seismic potential around the LJFS region. The most apparent feature of the finite-fault slip model is that the seismic slip is concentrated at a depth of 5–15 km, leaving the shallow crust unruptured. While it is possible that the shallow part of the fault exhibits a velocity-strengthening property, the possibility that the upper-most 5 km fault plane ruptures in the future cannot be ruled out. This is what we observed in the 2008–2009 Qaidam earthquake sequence [48]. In addition, since JSS-WF and JSS-EW form a flower-shaped structure, the seismic potential along the main structure, i.e., JSS-EF, should not be overlooked. Furthermore, geodetic observations indicate that the LJFS not only exhibits a slip rate of ~1.2 mm/yr but also experiences apparent uplifting at a rate of ~1.7 mm/yr [12,49], suggesting that the fault system is active and accumulating the necessary elastic strain for earthquakes. Compared with the whole LJFS, which spans about 220 km, the 2023 Jishishan earthquake only released a small part of the accumulated strain, as only a 20 km long fault section ruptured during this earthquake. Hence, the remaining segments might still have the capability to generate moderate-to-large earthquakes. In summary, the seismic potential along the LJFS requires intense attention, which is crucial for its surrounding densely populated towns and areas such as Jishishan County.

6. Conclusions

In this study, we investigate the coseismic surface deformation and the seismogenic fault of the 2023 Mw 6.0 Jishishan earthquake, which occurred in the northeastern Tibetan Plateau, using InSAR data. Both ascending and descending line-of-sight observations show up to ~6 cm surface uplift caused by the Jishishan earthquake, which is consistent with the thrust-dominated focal mechanism.
We determine that two fault models, with eastern and western dip orientations, could reasonably fit the InSAR observations using a Bayesian-based dislocation model. By calculating the ∆CFS induced by both fault models, we find that the east-dipping fault case could reasonably explain the aftershock distributions under the framework of stress triggering, while the west-dipping fault case cannot. Integrating regional geological structures, we suggest that the seismogenic fault of the Jishishan earthquake, which strikes NNE with a dip of 56° to the east, was either the Jishishan western margin fault or a secondary buried branch.
Based on the optimal fault model, the coseismic slip was dominated by reverse slip and confined to a depth range between ~5 and 15 km. The released seismic moment was 1.61 × 10¹⁸ N·m, which is equivalent to an Mw 6.07 earthquake. While the Jishishan earthquake ruptured a fault segment extending approximately 20 km, it released only a small part of the energy accumulated along the 220 km long Lajishan–Jishishan fault system. The remaining segments of the LJFS still have the capability to generate moderate-to-large earthquakes in the future.

Author Contributions

All the authors participated in editing and reviewing the manuscript. Conceptualization, X.H., Y.L. and X.S.; methodology, X.H. and Y.L.; validation, X.H., Y.L., X.S., M.Z., X.W. and Z.G.; formal analysis, X.H. and Y.L.; data curation, X.H., Y.L. and M.Z.; writing—original draft preparation, X.H.; writing—review and editing, X.H., Y.L., X.S. and Z.G.; visualization, X.H.; supervision, X.S.; project administration, X.S.; funding acquisition, X.S. and Y.L. All authors have read and agreed to the published version of the manuscript.

Funding

This research was jointly funded by the National Natural Science Foundation of China (grant number 42374005, U2139202), the Basic Scientific Funding of the Institute of Geology, China Earthquake Administration (Grant No. IGCEA2120), and the National Key Research and Development Project of China (grant number 2019YFC1509205).

Data Availability Statement

The focal mechanism of the 2023 Mw 6.0 Jishishan earthquake was accessed from www.cea-igp.ac.cn/kydt/280418.html (accessed on 19 December 2023). The relocated aftershocks of the 2023 Mw 6.0 Jishishan earthquake were provided by the Seismological Bureau of Gansu Province. The black focal mechanisms were obtained from the USGS (https://earthquake.usgs.gov/earthquakes/; accessed on 1 February 2024). The Sentinel-1 images were freely available through the Alaska Satellite Facility (https://www.asf.alaska.edu/#/; accessed on 1 February 2024). The GACOS software was freely accessed from http://www.gacos.net (accessed on 1 February 2024). The Coulomb 3.3 software was available at http://www.temblor.net/coulomb (accessed on 20 February 2024). The InSAR data used in the inversions can be accessed by contacting the corresponding author.

Acknowledgments

The authors are grateful to Chenglong Li for helpful discussions. The comments from the Editor and four anonymous reviewers are appreciated, which greatly improved the quality of the paper. All figures in this paper were generated using the Generic Mapping Tools software [50].

Conflicts of Interest

The authors declare no conflicts of interest.

References

  1. Avouac, J.P. From geodetic imaging of seismic and aseismic fault slip to dynamic modeling of the seismic cycle. Annu. Rev. Earth Planet. Sci. 2015, 43, 233–271. [Google Scholar] [CrossRef]
  2. Li, Y.; Shan, X.; Gao, Z.; Qu, C. Interseismic Coupling–Based Stochastic Slip Modeling of the 1920 M s 8.5 Haiyuan Earthquake. Seismol. Res. Lett. 2024, 95, 870–878. [Google Scholar] [CrossRef]
  3. Funning, J.G.; Garcia, A. A systematic study of earthquake detectability using Sentinel-1 Interferometric Wide-Swath data. Geophys. J. Int. 2019, 216, 332–349. [Google Scholar] [CrossRef]
  4. Gong, W.; Zhao, D.; Zhu, C.; Zhang, Y.; Li, C.; Zhang, G.; Shan, X. A new method for InSAR stratified tropospheric delay correction facilitating refinement of coseismic displacement fields of small-to-moderate earthquakes. Remote Sens. 2022, 14, 1425. [Google Scholar] [CrossRef]
  5. Yuan, D.; Zhang, P.; Lei, Z.; Liu, B.; Liu, X. A preliminary study on the new activity features of the Lajishan mountain fault zone in Qinhai Province. Earthq. Res. China 2005, 21, 93–102. (In Chinese) [Google Scholar] [CrossRef]
  6. Lease, R.O.; Burbank, D.W.; Clark, M.K.; Farley, K.A.; Zheng, D.; Zhang, H. Middle Miocene reorganization of deformation along the northeastern Tibetan Plateau. Geology 2011, 39, 359–362. [Google Scholar] [CrossRef]
  7. Zhang, P.; Zheng, D.; Yin, G.; Yuan, D.; Zhang, G.; Li, C.; Wang, Z. Discussion on late Cenozoic growth and rise of northeastern margin of the Tibetan Plateau. Quat. Sci. 2006, 26, 5–13. (In Chinese) [Google Scholar]
  8. Zheng, D.; Zhang, P.; Wan, J.; Yuan, D.; Li, D.; Wang, J.; Yin, J.; Li, C.; Wang, Z. Tectonic events, climate and conglomerate: Example from Jishishan mountain and Linxia basin. Quat. Sci. 2006, 26, 63–69. (In Chinese) [Google Scholar]
  9. Saylor, J.E.; Jordan, J.C.; Sundell, K.E.; Wang, X.; Wang, S.; Deng, T. Topographic growth of the Jishi Shan and its impact on basin and hydrology evolution, NE Tibetan Plateau. Basin Res. 2018, 30, 544–563. [Google Scholar] [CrossRef]
  10. Wang, X.; Flynn, L.J.; Deng, C. A review of the Cenozoic biostratigraphy, geochronology, and vertebrate paleontology of the Linxia Basin, China, and its implications for the tectonic and environmental evolution of the northeastern margin of the Tibetan Plateau. Palaeogeogr. Palaeoclimatol. Palaeoecol. 2023, 628, 111775. [Google Scholar] [CrossRef]
  11. Yuan, D.; Zhang, P.; Fang, X. Late Cenozoic tectonic deformation of the Linxia Basin, northeastern margin of the Qinghai-Tibet Plateau. Earth Sci. Front. 2007, 14, 243. (In Chinese) [Google Scholar]
  12. Zhuang, W.; Cui, D.; Hao, M.; Song, S.; Li, Z. Geodetic constraints on contemporary three-dimensional crustal deformation in the Laji Shan-Jishi Shan tectonic belt. Geod. Geodyn. 2023, 14, 589–596. [Google Scholar] [CrossRef]
  13. Wang, M.; Shen, Z. Present-day crustal deformation of continental China derived from GPS and its tectonic implications. J. Geophy. Res. Solid Earth 2020, 125, e2019JB018774. [Google Scholar] [CrossRef]
  14. USGS. M 5.9—38 km WNW of Linxia Chengguanzhen, China. 2023. Available online: https://earthquake.usgs.gov/earthquakes/eventpage/us7000ljvg/executive (accessed on 1 March 2024).
  15. Li, Z.; Li, Y.; Tian, Q.; Xia, Y.; Zhang, J. Study on the relationship between paleoseismic on Laji Mountain fault and catastrophic event on Lajiashan site. J. Seismol. Res. 2014, 37, 109–115. (In Chinese) [Google Scholar]
  16. Rosen, P.A.; Gurrola, E.; Sacco, G.F.; Zebker, H. The InSAR Scientific Computing Environment. In Proceedings of the EUSAR 2012 9th European Conference on Synthetic Aperture Radar, Nuremberg, Germany, 23–26 April 2012. [Google Scholar]
  17. Fattahi, H.; Agram, P.; Simons, M. A network-based enhanced spectral diversity approach for TOPS time-series analysis. IEEE Trans. Geosci. Remote Sens. 2016, 55, 777–786. [Google Scholar] [CrossRef]
  18. Goldstein, R.M.; Werner, C.L. Radar interferogram filtering for geophysical applications. Geophys. Res. Lett. 1998, 25, 4035–4038. [Google Scholar] [CrossRef]
  19. Farr, T.G.; Rosen, P.A.; Caro, E.; Crippen, R.; Duren, R.; Hensley, S.; Kobrick, M.; Paller, M.; Rodriguez, E.; Roth, L.; et al. The shuttle radar topography mission. Rev. Geophys. 2007, 45, RG2004. [Google Scholar] [CrossRef]
  20. Chen, C.; Zebker, H. Phase unwrapping for large SAR interferograms: Statistical segmentation and generalized network models. IEEE Trans. Geosci. Remote Sens. 2002, 40, 1709–1719. [Google Scholar] [CrossRef]
  21. Yu, C.; Penna, N.T.; Li, Z. Generation of real-time mode high-resolution water vapor fields from GPS observations. J. Geophys. Res. Atmos. 2017, 122, 2008–2025. [Google Scholar] [CrossRef]
  22. Yu, C.; Li, Z.; Chen, J.; Hu, J. Small Magnitude Co-Seismic Deformation of the 2017 Mw6.4 Nyingchi Earthquake Revealed by InSAR Measurements with Atmospheric Correction. Remote Sens. 2018, 10, 684. [Google Scholar] [CrossRef]
  23. Wang, S.; Xu, G.; Li, S.; Yang, T.; Shi, L.; Zhang, L.; Tang, F.; Fang, L. Analysis of earthquake sequence and seismogenic structure of the 2023 Ms6.2 Jishishan earthquake, Gansu Province, China. Acta Seismol. Sin. 2024, 46, 1–16. [Google Scholar] [CrossRef]
  24. Yang, J.; Xu, C.; Wen, Y.; Xu, G. The July 2020 Mw 6.3 Nima Earthquake, Central Tibet: A Shallow Normal-Faulting Event Rupturing in a Stepover Zone. Seismol. Res. Lett. 2021, 93, 45–55. [Google Scholar] [CrossRef]
  25. Yang, J.; Xu, C.; Wen, Y.; Xu, G. Complex coseismic and postseismic faulting during the 2021 northern Thessaly (Greece) earthquake sequence illuminated by InSAR observations. Geophys. Res. Lett. 2022, 49, e2022GL098545. [Google Scholar] [CrossRef]
  26. Guns, K.; Xu, X.; Bock, Y.; Sandwell, D. GNSS-corrected InSAR displacement time-series spanning the 2019 Ridgecrest, CA earthquakes. Geophys. J. Int. 2022, 230, 1358–1373. [Google Scholar] [CrossRef]
  27. Rimando, J.; Williamson, A.; Mendoza, R.; Hobbs, T. Source Model and Characteristics of the 27 July 2022 Mw7.0 Northwestern Luzon Earthquake, Philippines. Seismica 2022, 1, 1–8. [Google Scholar] [CrossRef]
  28. Bagnardi, M.; Hooper, A. Inversion of surface deformation data for rapid estimates of source parameters and uncertainties: A Bayesian approach. Geochem. Geophys. Geosyst. 2018, 19, 2194–2211. [Google Scholar] [CrossRef]
  29. Okada, Y. Internal deformation due to shear and tensile faults in a half-space. Bull. Seismol. Soc. Am. 1992, 82, 1018–1040. [Google Scholar] [CrossRef]
  30. Minson, S.E.; Simons, M.; Beck, J.L. Bayesian inversion for finite fault earthquake source models I-theory and algorithm. Geophys. J. Int. 2013, 194, 1701–1726. [Google Scholar] [CrossRef]
  31. Wang, R.; Diao, F.; Hoechner, A. SDM-A geodetic inversion code incorporating with layered crust structure and curved fault geometry. In Proceedings of the European Geosciences Union Conference, Vienna, Austria, 7–12 April 2013; EGU General Assembly: Vienna, Austria, 2013. EGU2013-2411-1. [Google Scholar]
  32. Diao, F.; Xiong, X.; Wang, R. Mechanisms of transient postseismic deformation following the 2001 Mw 7.8 Kunlun (China) earthquake. Pure Appl. Geophys. 2011, 168, 767–779. [Google Scholar] [CrossRef]
  33. Hong, S.; Zhou, X.; Zhang, K.; Meng, G.; Dong, Y.; Su, X.; Zhang, L.; Li, S.; Ding, K. Source Model and Stress Disturbance of the 2017 Jiuzhaigou Mw 6.5 Earthquake Constrained by InSAR and GPS Measurements. Remote Sens. 2018, 10, 1400. [Google Scholar] [CrossRef]
  34. Wu, D.; Qu, C.; Zhao, D.; Shan, X.; Chen, H. Slip Models of the 2016 and 2022 Menyuan, China, Earthquakes, Illustrating Regional Tectonic Structures. Remote Sens. 2022, 14, 6317. [Google Scholar] [CrossRef]
  35. Lohman, R.B.; Simons, M. Some thoughts on the use of InSAR data to constrain models of surface deformation: Noise structure and data downsampling. Geochem. Geophys. Geosyst. 2005, 6, Q01007. [Google Scholar] [CrossRef]
  36. Gao, H.; Liao, M.; Feng, G. An Improved Quadtree Sampling Method for InSAR Seismic Deformation Inversion. Remote Sens. 2021, 13, 1678. [Google Scholar] [CrossRef]
  37. Zhang, Y.; Shan, X.; Gong, W.; Zhang, G. The ambiguous fault geometry derived from InSAR measurements of buried thrust earthquakes: A synthetic data based study. Geophys. J. Int. 2021, 225, 1799–1811. [Google Scholar] [CrossRef]
  38. Stein, R.S.; King, G.C.P.; Lin, J. Change in failure stress on the southern San Andreas fault system caused by the 1992 Magnitude = 7.4 Landers earthquake. Science 1992, 258, 1328–1332. [Google Scholar] [CrossRef] [PubMed]
  39. King, G.C.P.; Stein, R.S.; Lin, J. Static stress changes and the triggering of earthquakes. Bull. Seismol. Soc. Am. 1994, 84, 935–953. [Google Scholar] [CrossRef]
  40. Harris, R.A. Introduction to special section: Stress triggers, stress shadows, and implications for seismic hazard. J. Geophys. Res. 1998, 103, 24347–24358. [Google Scholar] [CrossRef]
  41. Felzer, K.R.; Brodsky, E.E. Decay of aftershock density with distance indicates triggering by dynamic stress. Nature 2006, 441, 735–738. [Google Scholar] [CrossRef] [PubMed]
  42. Toda, S.; Lin, J.; Meghraoui, M.; Stein, R.S. 12 May 2008 M = 7.9 Wenchuan, China, earthquake calculated to increase failure stress and seismicity rate on three major fault systems. Geophys. Res. Lett. 2008, 35, 1–6. [Google Scholar] [CrossRef]
  43. Toda, S.; Stein, R.S.; Richards-Dinger, K.; Bozkurt, S. Forecasting the evolution of seismicity in southern California: Animations built on earthquake stress transfer. J. Geophy. Res. 2005, 110, B05S16. [Google Scholar] [CrossRef]
  44. Lin, J.; Stein, R.S. Stress triggering in thrust and subduction earthquakes, and stress interaction between the southern San Andreas and nearby thrust and strike-slip faults. J. Geophy. Res. 2004, 109, B02303. [Google Scholar] [CrossRef]
  45. Tembe, S.; Lockner, D.A.; Solum, J.G.; Morrow, C.A.; Wong, T.; Moore, D.E. Frictional strength of cuttings and core from SAFOD drillhole phases 1 and 2. Geophys. Res. Lett. 2006, 33, 1–5. [Google Scholar] [CrossRef]
  46. Freed, A. Earthquake triggering by static, dynamic, and postseismic stress transfer. Annu. Rev. Earth Planet. Sci. 2005, 33, 335–367. [Google Scholar] [CrossRef]
  47. Lease, R.O.; Burbank, D.W.; Zhang, H.; Liu, J.; Yuan, D. Cenozoic shortening budget for the northeastern edge of the Tibetan Plateau: Is lower crustal flow necessary? Tectonic 2012, 31, TC3011. [Google Scholar] [CrossRef]
  48. Elliott, J.R.; Parsons, B.; Jackson, J.A.; Shan, X.; Sloan, R.A.; Walker, R.T. Depth segmentation of the seismogenic continental crust: The 2008 and 2009 Qaidam earthquakes. J. Geophys. Res. 2011, 38, L06305. [Google Scholar] [CrossRef]
  49. Hao, M.; Wang, Q.; Shen, Z.; Cui, D.; Ji, L.; Li, Y.; Qin, S. Present day crustal vertical movement inferred from precise leveling data in eastern margin of Tibetan Plateau. Tectonophysics 2014, 632, 281–292. [Google Scholar] [CrossRef]
  50. Wessel, P.; Smith, W.H.F.; Scharroo, R.; Luis, J.; Wobbe, F. Generic mapping tools: Improved version released. Eos Trans. AGU 2013, 94, 409–410. [Google Scholar] [CrossRef]
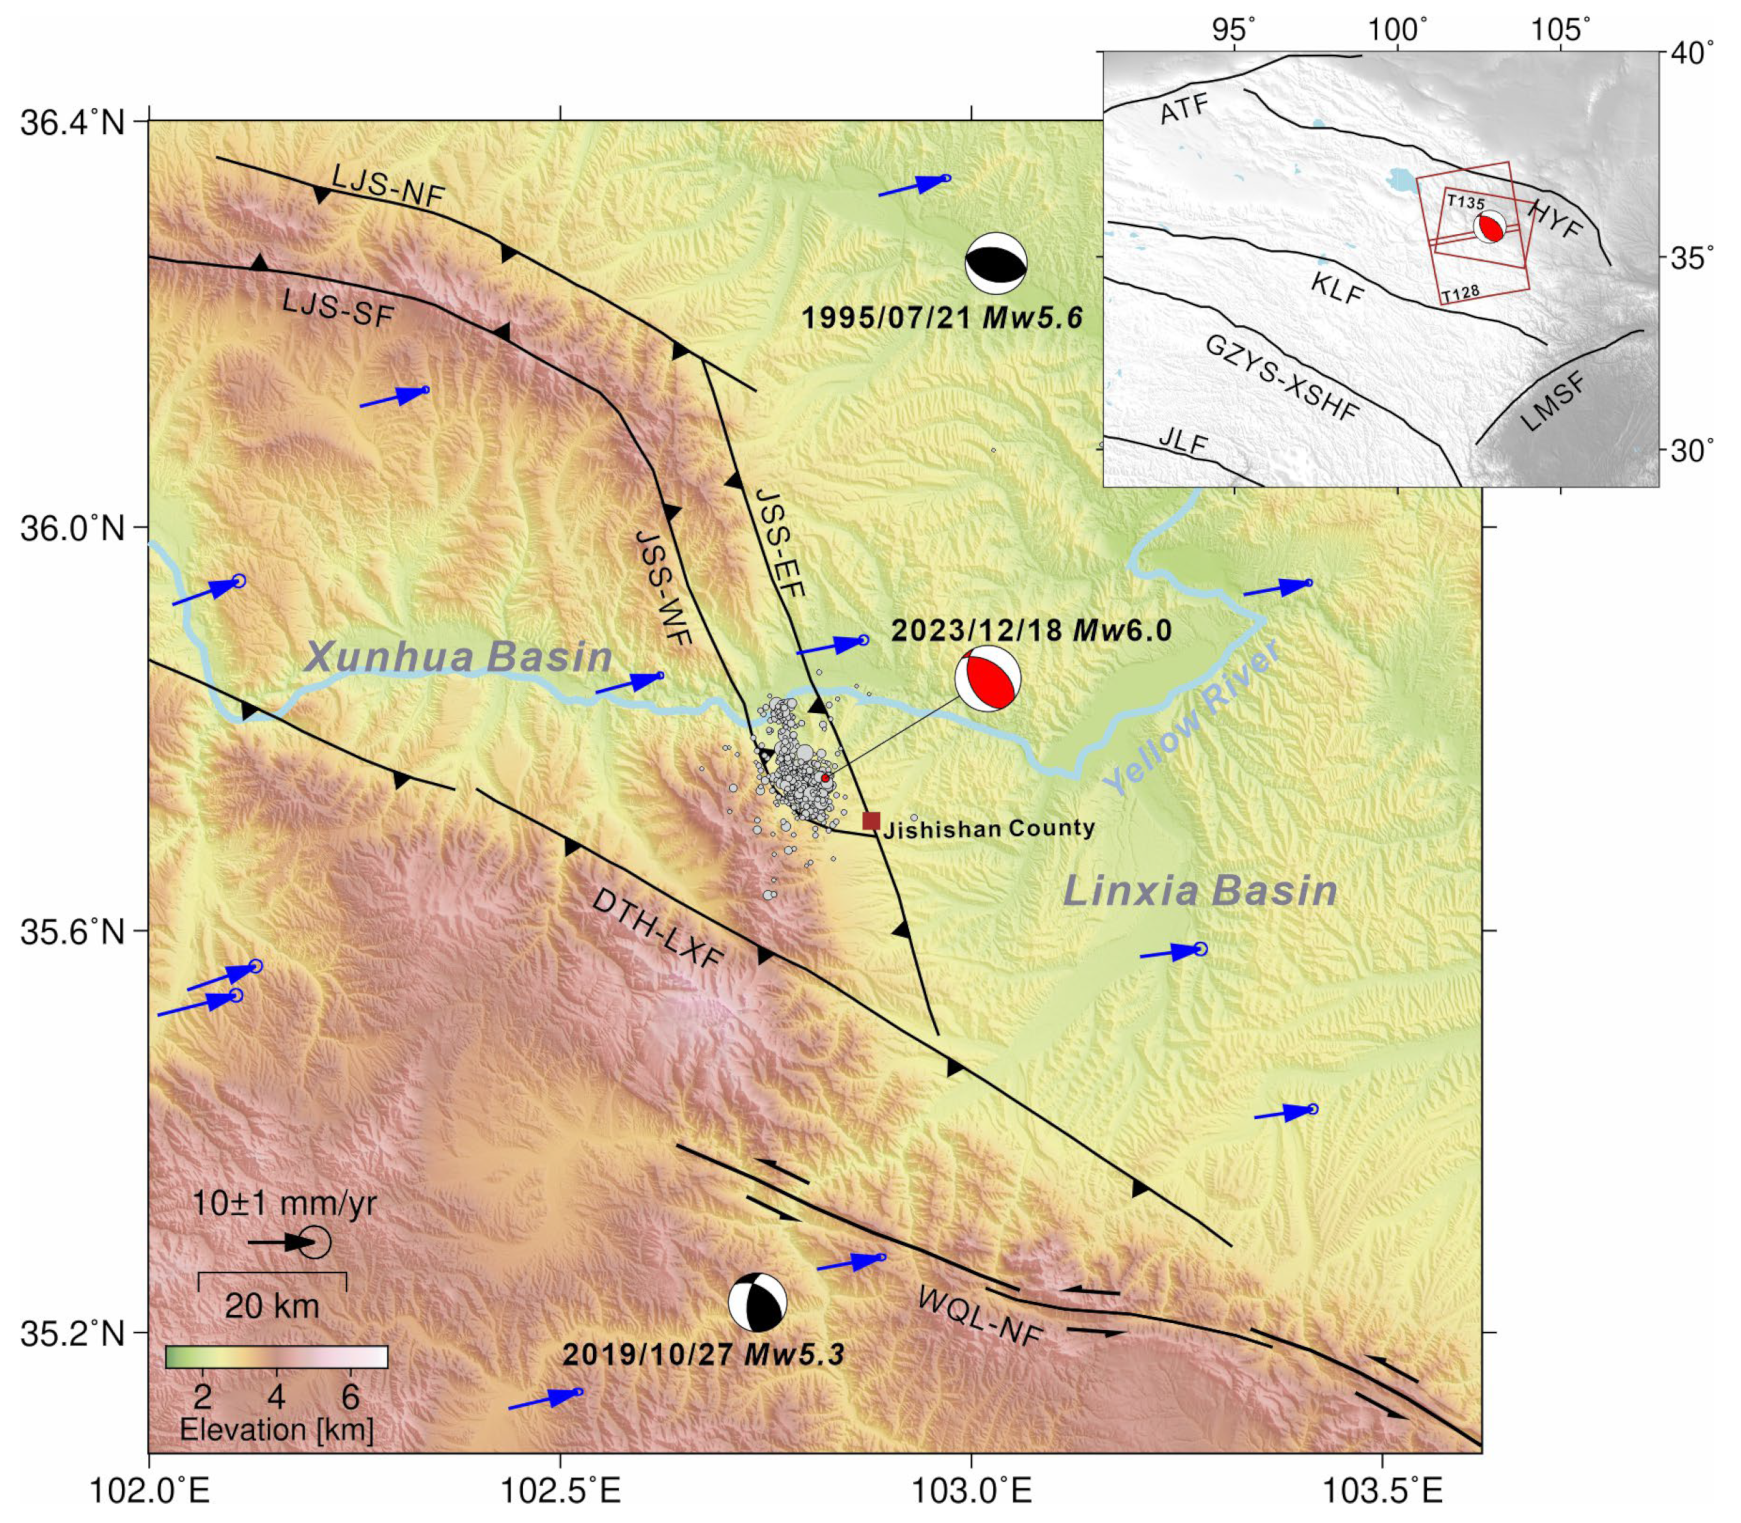
Figure 1. Regional tectonic setting of the Lajishan–Jishishan fault system. Black curves represent mapped active faults. Blue arrows denote interseismic GNSS velocities with respect to the stable Eurasian plate, with error ellipses showing 70% confidence levels [13]. Black focal mechanisms show that major earthquakes have occurred in this region since 1970 (United States Geological Survey). The red focal mechanism corresponds to the 2023 Mw 6.0 Jishishan earthquake. Gray circles show aftershocks within two weeks following the mainshock. The inset shows the location of the study region. Red polygons represent the ground coverage of the Sentinel-1A images from ascending (T128) and descending (T135) tracks. LJS-NF: Lajishan northern margin fault; LJS-SF: Lajishan southern margin fault; JSS-EF: Jishishan eastern margin fault; JSS-WF: Jishishan western margin fault; DTH-LXF: Daotanghe–Linxia fault; WQL-NF: western Qinling northern margin fault. ATF: Altyn Tagh fault; HYF: Haiyuan fault; KLF: Kunlun fault; GZYU-XSHF: Ganziyushu–Xianshuihe fault; JLF: Jiali fault; LMSF: Longmenshan fault.
Remotesensing 16 01746 g001
Figure 2. Coseismic LOS displacements induced by the 2023 Mw 6.0 Jishishan earthquake. (a,d) represent the unwrapped interferograms without atmospheric correction. (b,e) are the unwrapped interferograms after GACOS correction. Positive LOS displacements correspond to ground motion toward the satellite. (c,f) show the comparison of LOS displacements before and after atmospheric correction along the AB profile in (a,d).
Remotesensing 16 01746 g002
Figure 3. The marginal posterior probability distributions of the source parameters for (a) the east-dipping fault model and (b) west-dipping fault model. Red curves in each panel represent the Gaussian function that best fits the parameter samples.
Remotesensing 16 01746 g003
Figure 4. Coseismic slip model for the east-dipping fault model of the 2023 Mw 6.0 Jishishan earthquake. (a) Surface projection of the coseismic slip model of this earthquake. The black line represents the surface trace of the seismogenic fault. (b) Depth projection of the coseismic slip model. Black arrows indicate the slip direction. The black star shows the depth of the mainshock. The inset shows the trade-off curve between the InSAR data misfit and fault model roughness. (ch) Comparison of observations and predictions of LOS displacements for both ascending and descending tracks.
Remotesensing 16 01746 g004
Figure 5. Coseismic slip model for the west-dipping fault model of the 2023 Mw 6.0 Jishishan earthquake. The rest of the caption is the same as in Figure 4.
Remotesensing 16 01746 g005
Figure 6. Coseismic Coulomb failure stress changes (∆CFS) induced by the 2023 Mw 6.0 Jishishan earthquake along a cross-section. (a) Colored circles represent the spatial distribution of aftershocks over time. Dashed lines are the surface traces of the two fault models obtained in this study. Black curves are the active faults. The magenta line denotes the profile. (b) ∆CFS on the east-dipping fault. (c) ∆CFS on the west-dipping fault. Black dots in (b,c) represent the depth projection of the aftershocks. The brown star is the epicenter of the mainshock.
Remotesensing 16 01746 g006
Figure 7. Schematic diagram of the deep structure of regional faults. The red dashed lines show the two fault models resolved by InSAR observations. Colored circles represent the aftershocks. The red focal mechanism corresponds to the 2023 Mw 6.0 Jishishan earthquake.
Remotesensing 16 01746 g007
Table 1. Prior and optimal source parameters for the 2023 Mw 6.0 Jishishan earthquake.
Length/mWidth/mDepth/mDip 1Dip 2Strike/°X Center/mY Center/mStrike Slip/mDip Slip/m
Lower5000500020000−909010,000−20,000−0.5−1.0
Upper20,00020,00020,00090036020,000−10,0000.51.0
Optimal 113,16210,96315,02555.9\320.418,474−12,678−0.010.32
Optimal 213,12312,3264585\−33.3134.613,828−16,0920.03−0.20
X and Y are the horizontal shifts of the mid-point of the top/bottom edge of the mainshock fault plane with respect to the reference point (102.6°E, 35.9°N). 1 indicates the east-dipping fault with a positive dip angle, and the mid-point is located at the bottom edge. 2 indicates the west-dipping fault with a negative dip angle, and the mid-point is located at the top edge.
Disclaimer/Publisher’s Note: The statements, opinions and data contained in all publications are solely those of the individual author(s) and contributor(s) and not of MDPI and/or the editor(s). MDPI and/or the editor(s) disclaim responsibility for any injury to people or property resulting from any ideas, methods, instructions or products referred to in the content.