Abstract
Coral reefs are threatened globally by compounding stressors of accelerating climate change and deteriorating water quality. Water quality plays a central role in coral reef health. Yet, accurately quantifying water quality at large scales meaningful for monitoring impacts on coral health remains a challenge due to the complex optical conditions typical of shallow water coastal systems. Here, we report the performance of 32 remote sensing water quality models for suspended particulate matter and chlorophyll concentrations as well as colored dissolved organic matter absorption, over concentration ranges relevant for reef ecology using airborne imaging spectroscopy and field measurements across 62 stations in nearshore Hawaiian waters. Models were applied to reflectance spectra processed with a suite of approaches to compensate for glint and other above-water impacts on reflectance spectra. Results showed reliable estimation of particulate matter concentrations (RMSE = 2.74 mg L−1) and accurate but imprecise estimation of chlorophyll (RMSE = 0.46 μg L−1) and colored dissolved organic matter (RMSE = 0.03 m−1). Accurately correcting reflectance spectra to minimize sun and sky glint effects significantly improved model performance. Results here suggest a role for both hyperspectral and multispectral platforms and rapid application of simple algorithms can be useful for nearshore water quality monitoring over coral reefs.
1. Introduction
Coral reefs are threatened globally by myriad stressors, ranging from climate change to deteriorating water quality [1]. These stressors are broadly delineated by acute and persistent pressures that often combine to result in coral mortality in non-linear ways [2]. Water quality conditions, in particular, play a central role in coral reef health, but they remain a challenge to quantify at the large scales necessary for conservation and management [3]. Accelerating pressure on coastal ecosystems from the combined influence of climate change and land-based pollution means there is a growing need for large-scale monitoring of coastal water quality to inform management strategies aimed at protecting and restoring coral reefs [4]. Corals are highly sensitive to water quality because differences in light availability, nutrient levels, organic matter, sedimentation regimes, and contaminant loads impair coral function and decrease coral resilience to heat stress [5,6,7]. Large-scale monitoring to detect water quality impairments on reefs and to characterize their magnitude, severity, and frequency will help guide reef restoration and pollution mitigation [8,9,10]. However, our ability to characterize water quality conditions in reef areas remains limited by challenges in applying remote sensing algorithms for water quality to shallow coastal environments [11]. Recent advances in sensor technology, modeling, and data processing have worked towards overcoming persistent challenges in water quality remote sensing such as model ambiguity and glint correction [12,13,14], potentially enabling more reliable water quality mapping in nearshore environments.
Most remote sensing algorithms for water quality are challenged by the optical conditions typical of reef environments [15,16]. These waters are often both physically and optically shallow, with low concentrations of optically active substances minimally influencing water leaving reflectance relative to the substantial influence of the benthic substrate. Whereas even small changes in the magnitude or characteristics of material in the water column can be ecologically meaningful for reef communities, those differences may not necessarily produce reliably distinguishable changes in remotely sensed water leaving reflectance spectra [17,18]. Furthermore, subtle differences in spectra associated with variability in water column conditions may be smaller than the typical uncertainty in reflectance levels of water spectra associated with atmospheric and glint correction techniques [19], making it difficult to evaluate the performance of water quality models per se. Various studies have shown promising results for coastal water quality mapping, but a majority of these evaluations focus on optically deep water, orders of magnitude differences in parameter values, aggregate measures of water clarity, or are primarily concerned with benthic mapping [17,20]. Fewer studies assess the influence of differences across atmospheric and glint correction methods, despite recognizing their importance (e.g., [21]). For models that do achieve performance targets for uncertainty over a wide range of parameter values (e.g., ±35%; [22]), results will have low accuracy over the narrower range of conditions typical of reefs and are therefore unreliable for detecting ecologically meaningful differences in clear shallow waters.
Among the known water quality stressors for reefs, three parameters are represented by optically active substances in the water column used in water quality remote sensing algorithms: suspended particulate matter (SPM), chlorophyll a (Chl), and colored dissolved organic matter (CDOM). SPM concentrations over reefs are typically below 10 mg L−1 [23,24], above which adverse effects occur from reductions in light for photosynthesis as well as physical smothering and disruption of reproductive cycles [25,26]. Although some reefs do persist in or can benefit at times from highly turbid waters [27,28], bleaching and tissue mortality effects can occur in adult corals at levels as low as 3.2 mg L−1 [24]. However, SPM models applied to remotely sensed data from coastal zones report error levels near 50% for waters with SPM concentrations below 50 mg L−1 [29], and little sensitivity to variations below 10 mg L−1 [30,31]. In remote sensing model applications, areas with SPM concentrations below 10 mg L−1 are generally considered clear waters, with moderate turbidity ranging from 10–50 mg L−1 and high turbidity above 50 mg L−1 [29,32].
Chl concentrations in oligotrophic reef waters are generally below ~1 μg L−1 [33], which is much smaller than the typical RMSE for Chl retrieval models in coastal waters (e.g., [34]). Elevated Chl levels on reefs can indicate eutrophication associated with elevated nutrients [35], areas influenced by submarine groundwater discharge [36,37], or shifts in phytoplankton community structure. Global standard ocean color models for Chl are known to perform poorly in coastal regions due to substantial absorption in the water column from non-algal particles and/or CDOM, with some assessments reporting uncertainties greater than 100% for certain models [38,39] or RMSE values greater than 5 µg L−1 [40,41,42]. Performance for global models is typically assessed using Chl measurements spanning several orders of magnitude [43].
CDOM is relatively less studied in reef waters but is known to play an important role in controlling the light environment, especially in blocking harmful UV radiation that can lead to genetic damage in corals [44,45], as well as influencing the bioavailability and fate of contaminants like trace metals and organic pollutants [46]. Due to high levels of CDOM in wastewater, recent studies suggest it can also be an indicator of wastewater effluent in seawater [47,48], which is highly associated with reef decline [6].
Here, we report performance for remote sensing water quality models over concentration ranges relevant to reef ecology and management using airborne imaging spectroscopy in nearshore Hawaiian waters compared to measurements from 62 field stations. We use imaging spectroscopy to test whether existing models designed for heritage multi-spectral approaches can quantify ecologically meaningful variation in water quality conditions over coral reefs in nearshore waters, using a suite of processing approaches applied to correct for glint and other above-water impacts on reflectance spectra. Results here suggest a role for multispectral platforms and the rapid application of simple algorithms can be useful for management and targeted water quality sampling. These results support ongoing work considering improvements in remote sensing of water quality over corals using spectroscopy and benthic classification.
2. Materials and Methods
We conducted a coordinated airborne and field campaign in January 2023 to collect simultaneous measurements of reflected radiance and inherent optical properties at 62 stations throughout nearshore regions of Hawaiʻi. Stations were distributed across three regions of the west Hawaiʻi coastline, one region of the east Hawaiʻi coastline, and one region of the southeastern coast of Maui, in waters ranging in depth between ~1 m and ~60 m. We estimated concentrations of SPM, Chl, and CDOM using 32 water quality models applied to reflectance spectra processed with six combinations of methods for atmospheric and glint correction. Model performance was evaluated by comparing remote sensing model estimates to measured concentrations of SPM (mg L−1), Chl (μg L−1), and CDOM (aCDOM(λ), m−1).
2.1. Imaging Spectroscopy
The primary input to water quality algorithms considered in this study is remote sensing reflectance, Rrs(λ) (sr−1), which we derived from airborne remote sensing data collected with the high-fidelity visible-to-shortwave (VSWIR) imaging spectrometer onboard the Global Airborne Observatory (GAO, formerly CAO, [49]), covering the wavelength range from 347 nm to 2485 nm with 428 channels at a 5 nm interval (FWHM). Data were collected from 2000 m above sea level, which resulted in 2 m spatial resolution spectra, and collected within an average of 3 min difference between airborne and field data collection. Raw data were converted to radiance using laboratory-based sensor calibrations, and then orthorectified and processed to reflectance. Reflectance processing compared two different atmospheric correction approaches: modified Atmospheric REMoval (ATREM) [50,51] and Imaging Spectrometer Optimal FITing (ISOFIT) [52]), with and without three different glint correction approaches: no glint correction, an analytical four-component glint model (4C) [53,54,55,56], and the method proposed by [57]. ATREM uses a sequential approach to first estimate atmospheric properties and then algebraically invert radiance spectra to estimate bottom-of-atmosphere reflectance [51], whereas ISOFIT simultaneously estimates atmospheric and surface properties using a Bayesian fitting procedure [52]. The 4C glint correction model follows the formulation of [53,55] to estimate the radiance reflectance of sky and sunlight reflected by the water surface as the sum of direct downwelling irradiance, diffuse downwelling irradiance due to aerosol scattering, diffuse downwelling irradiance due to Rayleigh scattering, and a fourth component to handle cloud reflections. Our previous research found that reflectance spectra most accurately represented water leaving reflectance using the ISOFIT and 4C correction approach [14], similar to other recent investigations over coastal waters [58,59]. The mean Rrs(λ) spectrum from each station was calculated from all water pixels within a 5 m radius of field-based GPS points collected during fieldwork (~50 pixels), using the Automated Water Extraction Index to identify water pixels [60]. Images were also visually assessed to ensure high-quality match-ups without the influence of clouds, cloud shadows, or boat shadows.
2.2. Water Quality Field Measurements
Water quality conditions were measured at each station (N = 62) using a combination of in situ sensor measurements and laboratory analyses of collected water samples. We measured turbidity, dissolved organic matter fluorescence (fDOM), Chl fluorescence, and salinity in the upper 50 cm of the water column using an EXO1 multiparameter sonde (Yellow Springs Instruments [YSI], Yellow Springs, OH, USA). Water samples were collected for measurement of inherent optical properties following recommended IOCCG protocols [61]. Between 2 and 10 L of water were collected from the upper 50 cm of the water column into triple-rinsed opaque Nalgene bottles or sterile Whirlpaks using either a peristaltic pump or hand collection depending on vessel type. Samples for analysis of dissolved material in filtrate (CDOM) were collected at most stations directly through 0.2 μm polyethersulfone filters into amber glass bottles and stored in the dark at 4 C until analysis. Samples for analysis of particulates (SPM and Chl) were stored on ice and filtered within 12 h of collection onto pre-combusted and weighed glass fiber filters (0.7 μm). Filters for Chl analysis were preserved in liquid nitrogen and stored at −80 C until analysis. CDOM absorption was measured from 240–800 nm at 0.5 nm increments on a Cary 4000 dual beam UV–Vis spectrophotometer (Agilent, Santa Clara, CA, USA) with scattering and temperature correction, outlier detection, and smoothing as described in [62,63]. We used CDOM absorption spectra to calculate exponential slope (Sexp) by fitting an exponential decay function to the interval between 240 and 700 nm as described by [64]. SPM concentrations were measured gravimetrically from oven-dried filter samples using a microbalance. Chl concentrations were measured fluorometrically on a Trilogy fluorometer (Turner Designs, San Jose, CA, USA) after 24 h acetone extraction in the dark at 4 C. Samples were analyzed in triplicate for most stations and parameters, and the mean value was used as the measured station value in analyses.
2.3. Water Quality Models
The spectral signature of Rrs(λ) varies according to the magnitude and composition of optically active constituents in the water column and the reflectance of the benthic substrate where the water is optically shallow. Various modeling approaches relate Rrs(λ) to one or more biogeochemical water quality parameters based on the predictable effects of each parameter on light absorption and scattering in different regions of the spectrum. Models have a range of complexity from relatively simple empirical relationships to analytical inversions of radiative transfer models or semi- and quasi-analytical simplifications of such models. In this study, we assessed 32 openly published models to estimate water quality parameters from Rrs(λ) including 7 SPM models, 14 Chl models, and 11 CDOM models (Table 1). SPM models primarily took the form of single-wavelength relationships, with several models incorporating conditional band-switching or decision trees to use a different wavelength per optical water type [21,29,32] and one model using an empirical two-band ratio [20]. Chl models included two and three-band ratios, pigment concentration, and color-index approaches, including the common blue–green band ratio approach used for open ocean Chl estimation (OC4Me) [65] as described in [66]. CDOM models are based on exponentially declining absorption spectra that peak in the UV range and include empirical and semi-empirical forms of two-band ratios as well as two quasi-analytical approaches to estimate CDOM absorption at a reference wavelength [41,67,68,69]. Whereas the empirical, semi-analytical, and quasi-analytical models were calculated from between one and seven channels, we also tested the performance of one analytical model designed for optically shallow water, using the full wavelength range between 400 and 900 nm. This model is based on the shallow water model in [70] and was applied using a custom spectral library of benthic reflectance and regionally informed parameter values, as described in [69] and in the Appendix. Simultaneous estimates of SPM, Chl, and CDOM were calculated from model inversion using least squares fitting. Bio-optical model parameters were fixed except for concentrations of one phytoplankton class, concentrations of the two classes of particulate matter, aCDOM(443), water column depth, and fractions of each of the six benthic classes; SPM was calculated as the sum of phytoplankton concentrations plus both classes of particulate matter. Parameter values and model equations are provided in the Appendix. All models were applied using our bio_optics python package [71]. Empirical models were applied in their published form with original model coefficients, as well as with re-calibrated model coefficients when the underlying model form had a significant relationship using our field measurements. We also calculated apparent visible wavelength [72], the quality control QWIP score [73], and two optical water type classifications [32,74] to help assess conditions affecting model performance.

Table 1.
An overview of the water quality models that were evaluated in this study. Model Chl 1 was applied using three versions of calibration coefficients (from [75], the recalibration presented in [34], and a recalibration for this study). Models CDOM 1 and 2 were applied using the original sets of sets of calibration coefficients from [69] as well as recalibrations for this study. Model CDOM 4 [76] was applied using three sets of calibration coefficients corresponding to θz of 0°, 30°, and 60°.
2.4. Performance Evaluation
Model performance was evaluated by calculating a suite of error metrics quantifying the differences between modeled and field-measured water quality parameters, and then comparing metrics as well as the distributions of model residuals among water quality models and reflectance processing levels. Error metrics included root mean squared error (RMSE, Equation (1)), coefficient of determination (R2; Equation (2) [85]), mean absolute error (MAE, Equation (3)), bias (Equation (4)), and percent wins, which was computed from pair-wise comparisons of model residuals as described in [86].
The lowest RMSE values were used to identify the best performing SPM and Chl models. CDOM models were evaluated against measured absorption at each model’s reference wavelength, which varied between 355 nm and 443 nm. Since models estimating absorption at longer wavelengths will have lower RMSE, model rankings for CDOM absorption were based on highest R2 so that performance metrics were comparable among models. We also assessed qualitative model accuracy for determining whether water quality conditions fall above or below thresholds that may be of ecological concern. Classification accuracy is reported as the average of sensitivity (true positive rate) and specificity (true negative rate), where values falling above each threshold were assigned to the positive class. For SPM, we used a threshold of 3.2 mg L−1 based on the concentration at which adult corals experience adverse effects [24]. For Chl, we selected 0.5 μg L−1 based on the 10% exceedance threshold for dry embayments and coastal waters according to Hawaii Administrative Rules Aquatic Life Criteria (Haw. Code R. § 11-54-6). CDOM can be associated with both beneficial [45] and detrimental [44,46] effects on reefs depending on its source and timing; in lieu of a well-established threshold for ecological concern, we used the 75% quantile of our field measurements to identify relatively high levels, which was 0.7 m−1 for aCDOM(440). We also visually assessed performance after applying models to orthorectified reflectance images masked to water pixels identified with the AWEI [60].
3. Results
3.1. Field Conditions
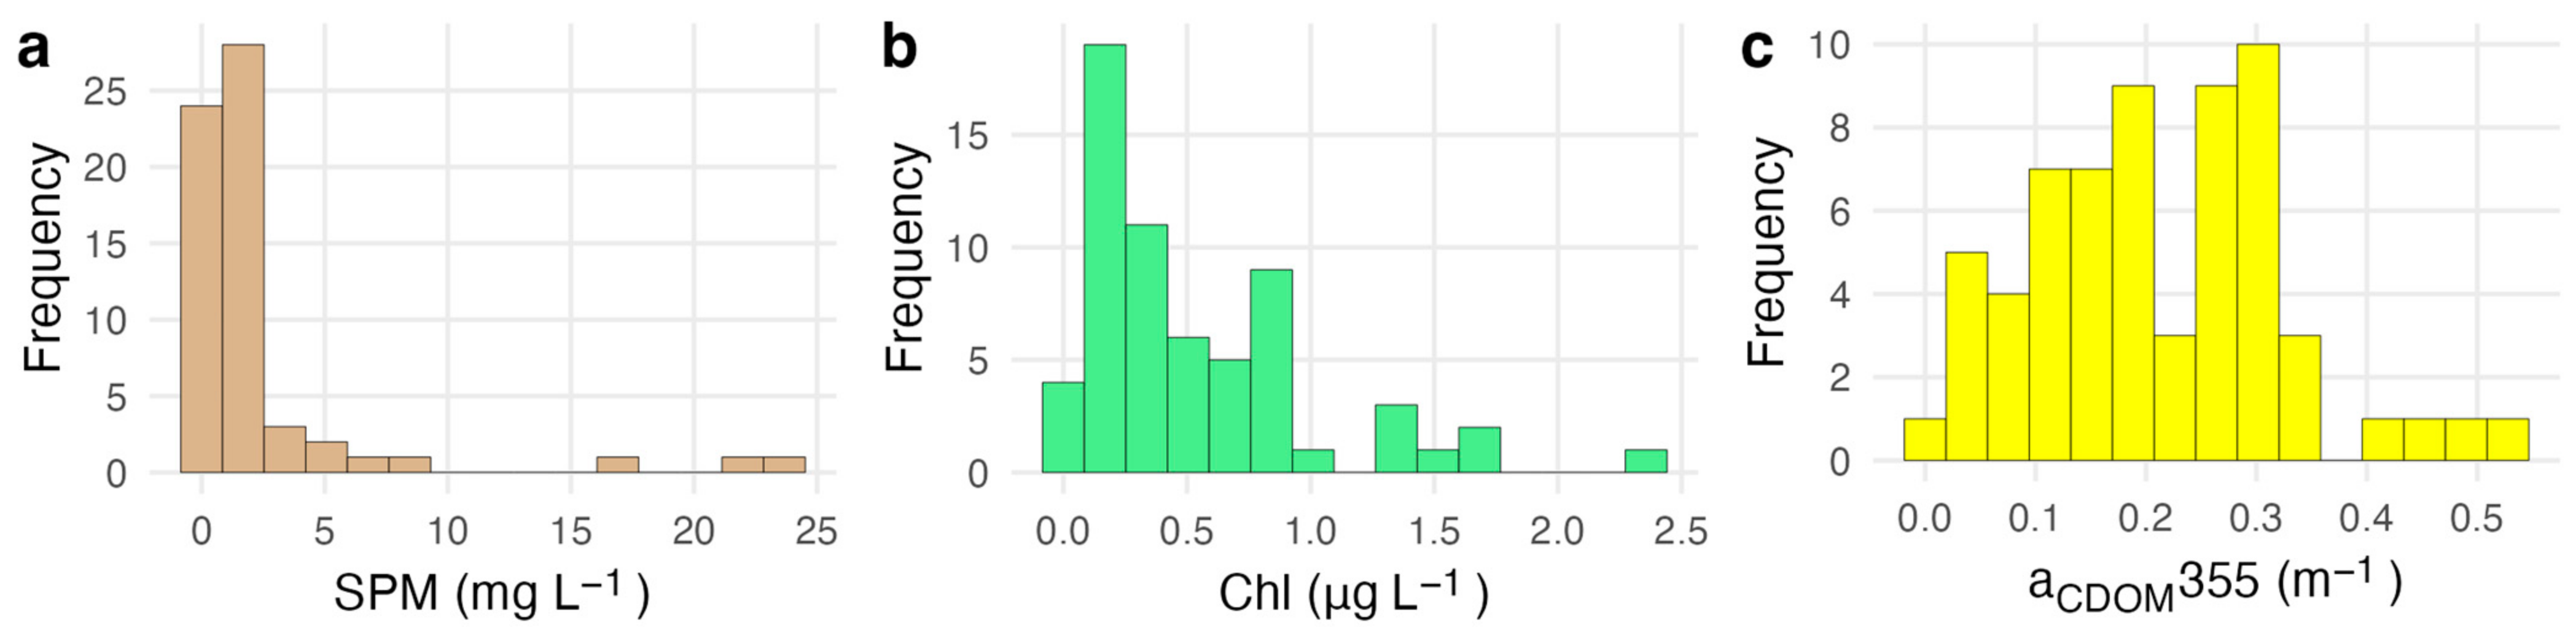
Measured water quality conditions were typical of oligotrophic reef waters at most stations (Figure 1, Table 2). SPM concentrations ranged from 0.2 mg L−1 to 23.9 mg L−1 with a mean of 2.44 ± 4.62 mg L−1. Chl concentrations ranged from 0.06 µg L−1 to 2.42 µg L−1 with a mean of 0.54 ± 0.48 µg L−1. Measurements of aCDOM(443) ranged from 0 to 0.13 m−1 with a mean of 0.05 ± 0.03 m−1. Concentrations of Chl, SPM, and aCDOM were all significantly correlated with each other (0.34 < ρ < 0.53, α = 0.05).
Figure 1.
Range of biogeochemical constituents measured from water samples used for model evaluation (N = 62). Panel (a) shows the distribution of SPM concentrations, panel (b) shows the distribution of Chl concentrations, and panel (c) shows the distribution of CDOM absorption.
Table 2.
Average, standard deviation (SD), and range of water quality conditions measured across 62 stations.
Field measurements collected with the EXO1 sonde were strongly related to laboratory-measured concentrations (Figure S1). The slope between turbidity values and SPM concentrations was 0.66, with in situ turbidity values capturing 84% of the variability in SPM concentrations. In situ Chl measurements were also highly representative of lab measurements (R2 = 0.78), and measurements of fDOM were most strongly related to aCDOM at 350 nm (R2 = 0.66).
3.2. SPM Model Performance
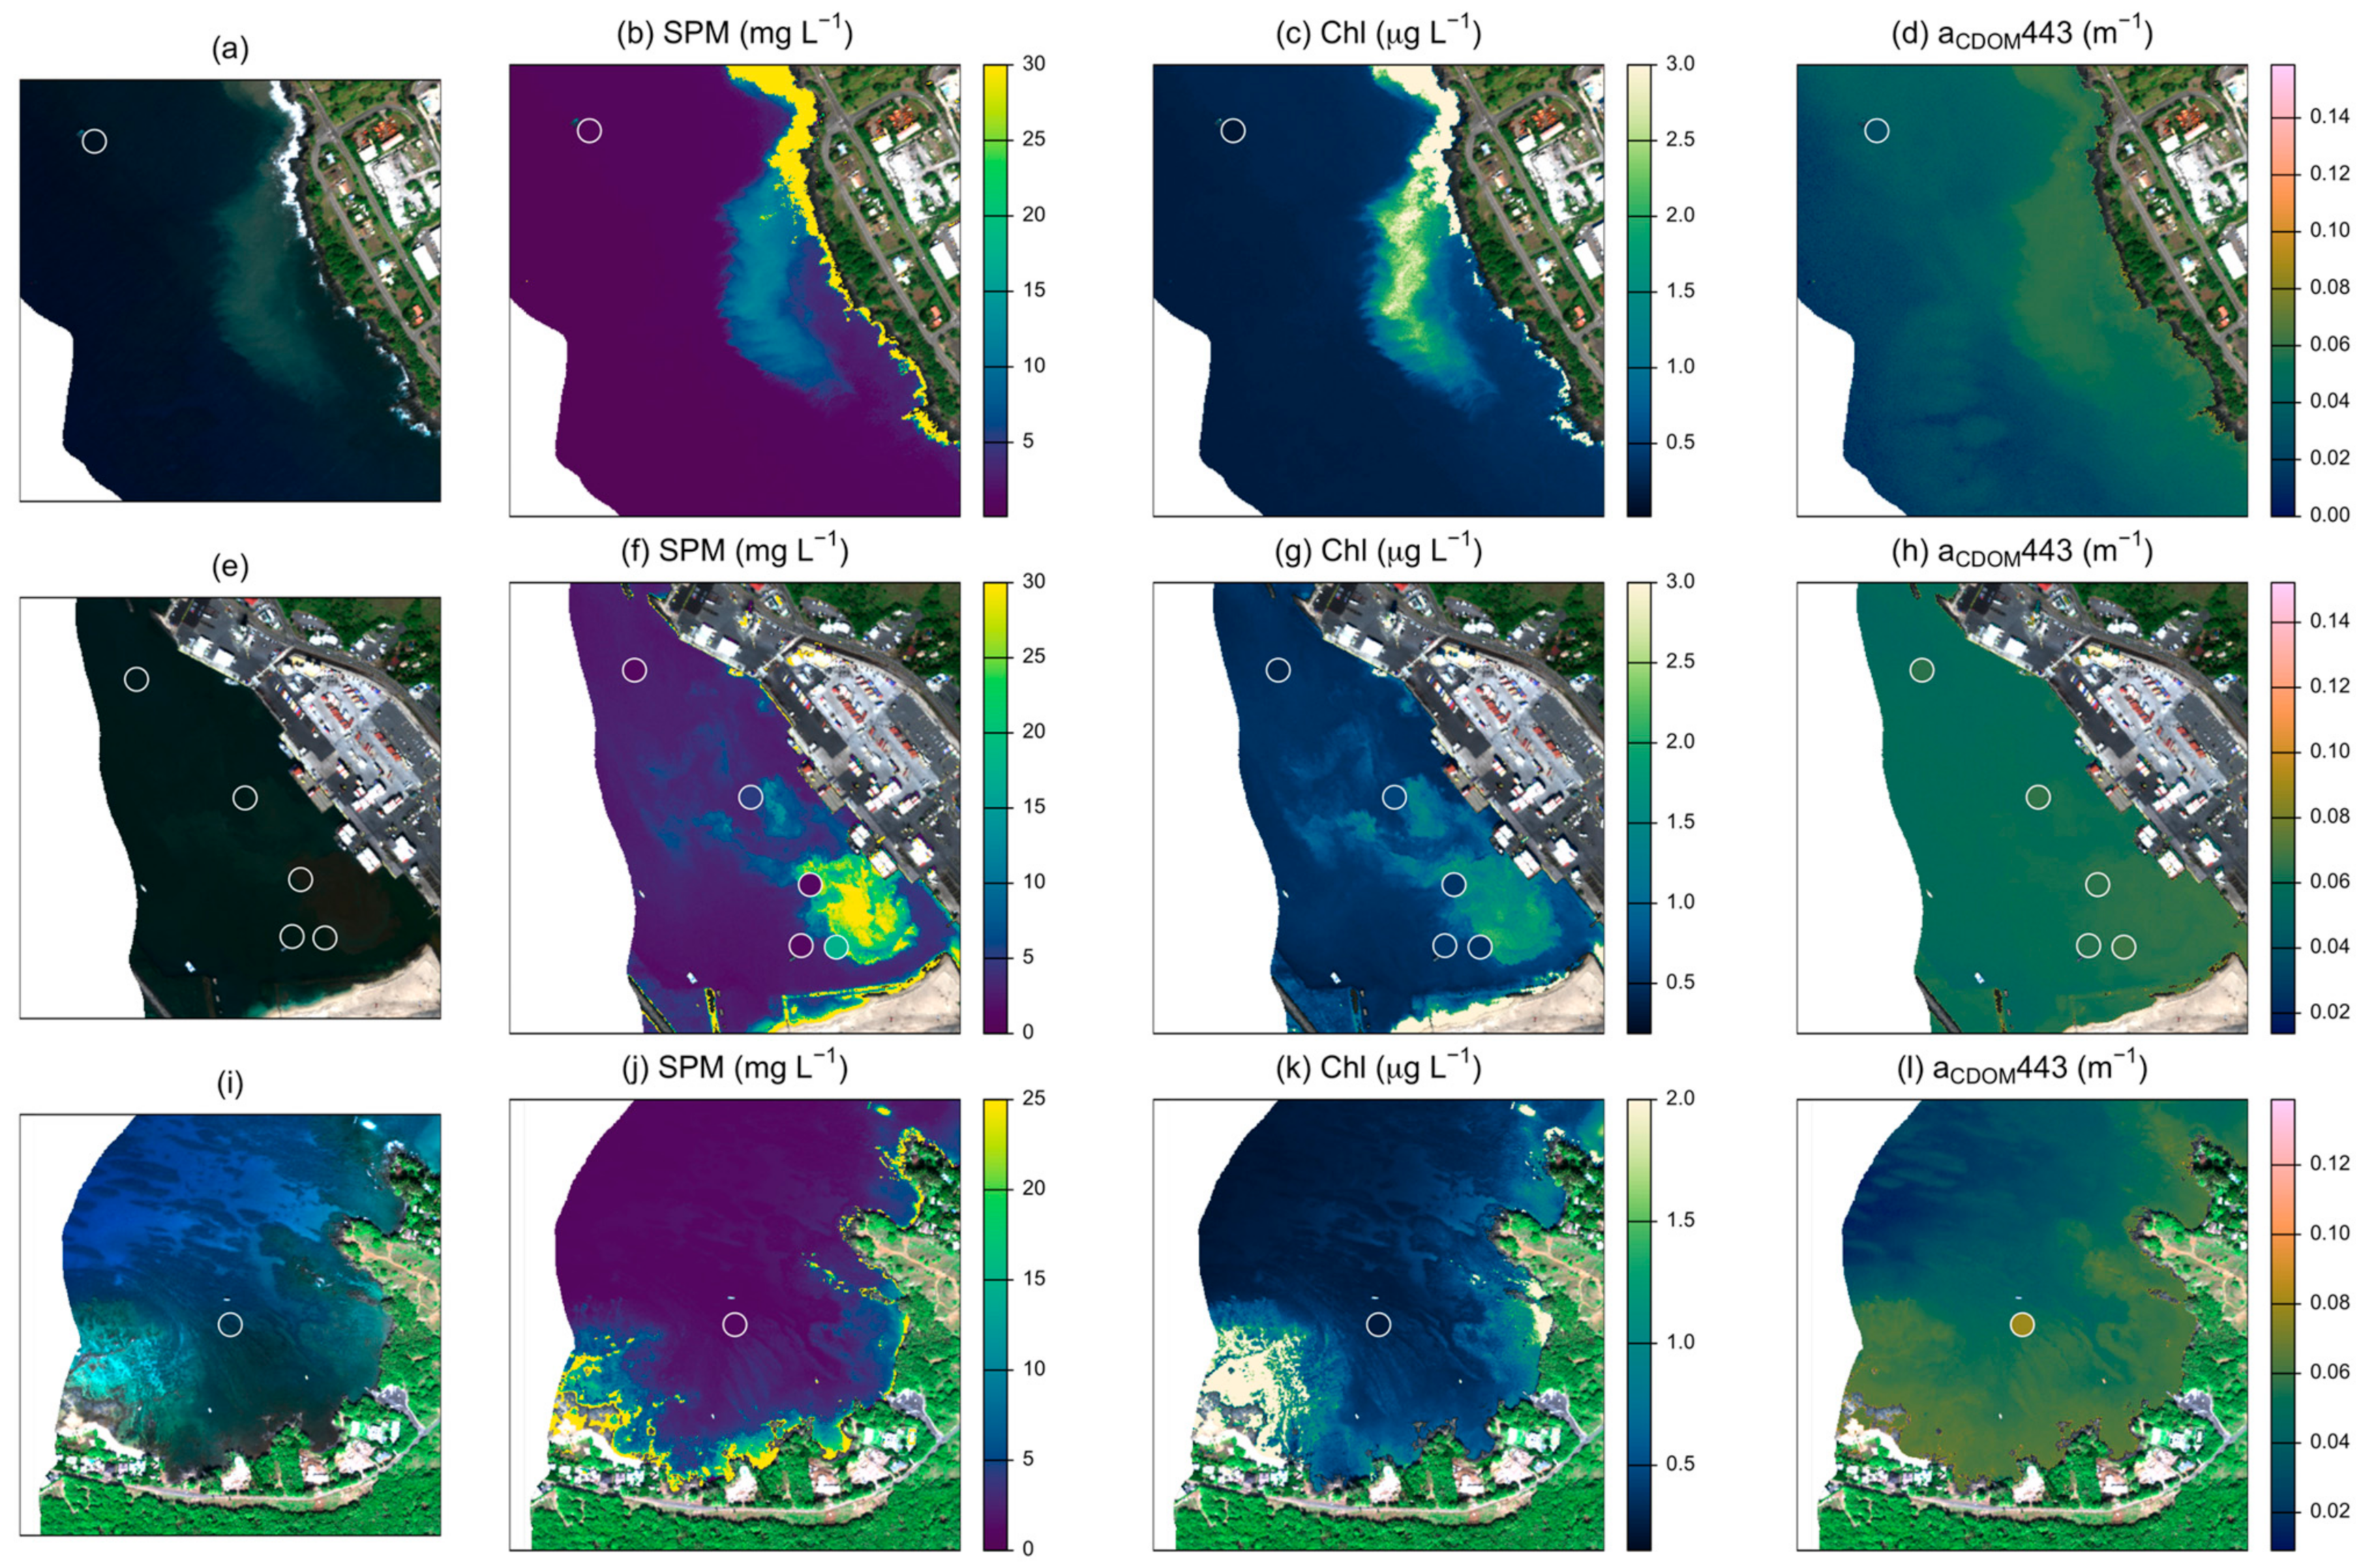
Several models reliably retrieved SPM concentrations with RMSE lower than 5 mg L−1 (Table 3). The best-performing model (SPM 1 [32]) resulted in a RMSE of 2.74 mg L−1 and R2 = 0.76 (Figure 2). However, the model with the highest win percentage (SPM 7; [21]) ranked lowest according to RMSE and R2 (4.49 mg L−1 and 0.39). This model produced the most accurate estimates for stations with SPM less than ~2 mg L −1, but had large positive residuals for stations with higher concentrations, resulting in poor performance over the full data set (Figure S2). SPM concentrations measured above 3.2 mg L−1 at nine of the 62 stations (15%). All models except for two (SPM 2 and SPM 7) had a high level of sensitivity, correctly identifying eight of the nine high SPM stations. The one consistently misclassified station measured slightly above the threshold (3.9 mg L−1). Atmospheric and glint correction approaches strongly affected model performance (Figure 3). Glint correction improved the accuracy of modeled SPM estimates by 70% and reduced bias by more than 90%, with the best performance coming from models applied to spectra processed using the 4C model (Table 4). When applied to imagery, large sediment plumes are clearly distinguishable (Figure 4), however very shallow water at the shoreline (<1 m) and breaking waves also appear as high SPM concentrations.
Table 3.
Model performance on ISOFIT 4C corrected spectra for models with a significant relationship between model estimates and field measurements at α = 0.05. Accuracy refers to the correct classification above or below the selected thresholds for each parameter as described in Section 2.3. For CDOM models, % wins was calculated among models using the same reference wavelength. Results for all tested models are listed in Table S1. ** Indicates recalibrated models.
Figure 2.
Relationship between model estimates and measured values for the best-performing model for each of the three water quality parameters, applied to spectra processed with ISOFIT and 4C. Panel (a) depicts the performance of SPM models, panel (b) depicts the performance of Chl models, and panel (c) depicts the performance of CDOM models. The dashed line indicates a 1:1 relationship. R2 in (a,b) is calculated using log-transformed values.
Figure 3.
Distribution of model residuals for each parameter’s best-performing models using input spectra processed with different atmospheric and glint correction techniques.
Table 4.
Model performance metrics for each parameter’s best-performing model (SPM 1, Chl 1 recalibrated for this study, and CDOM 1 recalibrated for this study) using input spectra processed with different atmospheric (AC) and glint (GC) correction techniques.
Figure 4.
Examples of best-performing models applied to imagery in three nearshore regions. Panels (a,e,i) indicate sampling locations (open circles) on true color imagery. Panels (b,f,j) show estimates from model SPM 1; panels (c,g,k) show estimates from model Chl 1, and panels (d,h,l) show estimates from model CDOM 1. Sampling points in SPM, Chl, and CDOM panels are shaded according to measured values from field samples. Values above the indicated color scale appear as the maximum value for visual clarity.
3.3. Chlorophyll Model Performance
Most of the Chl models performed poorly, except for a re-calibration of Chl 1 model coefficients using our measured field data (Table S1). The re-calibrated Chl 1 model [34] was the only model for which estimated values were significantly correlated with field measurements (p = 0.001); however, this model only achieved a RMSE of 0.46 µg L−1 and R2 = 0.34 (Figure 2). The only other model with a RMSE smaller than 1 µg L−1 was the analytical shallow water model (Chl 12; [71]); however, Chl estimates from this model had a poor relationship to measured values (R2 = 0.05, p = 0.092). Most of the Chl models resulted in RMSE > 10 µg L−1, overestimated Chl concentrations by several orders of magnitude at most if not all stations, and only accurately categorized half of the 24 stations that measured above the 0.5 µg L−1 threshold. The recalibrated Chl 1 model had the highest classification accuracy, at 62%, but had low sensitivity and only correctly categorized 10 out of the 24 high Chl stations. Model residuals were significantly larger at stations that had relatively high levels of Chl, SPM, and CDOM. Glint correction improved model performance, reducing RMSE by 40% or more compared to non-corrected spectra depending on the atmospheric correction approach (Figure 3; Table 4).
3.4. CDOM Model Performance
Most of the CDOM models had a RMSE similar to the range of measured values and low, but significant, correlations between model estimates and measured CDOM (Table 3). The re-calibrated CDOM 1 model (λ0 = 443 nm; [69]) performed best, with a RMSE of 0.08 m−1 and R2 = 0.34 (Figure 3). Applying this model in its original form substantially overestimated aCDOM(443) at nearly all stations. Although the re-calibrated model had a substantially lower RMSE and more evenly distributed residuals, values above ~0.07 m−1 were consistently underestimated (Figure S3). The two quasi-analytical algorithms both had a RMSE larger than 1 m−1 (Table S1). Using the 75% quantile of measured CDOM levels as a classification threshold, most models had a balanced accuracy between 50 and 60% (Table 3). Model CDOM 5 [41] had the highest accuracy (71%). Although the recalibrated model CDOM 1 had high specificity (93%), because it consistently underestimated values for stations with high absorption it only resulted in 50% accuracy. Glint correction resulted in minor improvements but did not affect model performance as much as observed for SPM and Chl models (Figure 3).
4. Discussion
Our findings demonstrate that in nearshore reef environments, ecologically meaningful variations in SPM concentrations can be estimated from remotely sensed water leaving reflectance if reflectance spectra are accurately processed to reduce atmospheric and glint effects. This evaluation, using high-fidelity imaging spectroscopy and a narrow time window for in situ matchup data, supports the findings of previous studies that evaluate the performance of multispectral SPM models based on comparisons to simulated data or a small number of same-day field matchups [32,87]. Results also underscore the necessity of high-quality atmospheric and glint correction techniques in order to accurately quantify water quality parameters from Rrs. In order to overcome limitations associated with uncertainties in atmospheric and glint processing, algorithm development often focuses on spectral regions known to be less prone to errors such as overcorrection of aerosols, or band ratios that will be insensitive to systematic errors [20,75]. However, most common forms of SPM models, including the best-performing model in our evaluation, calculate concentration from a single near-infrared wavelength, making these models particularly sensitive to uncorrected glint artifacts.
Despite not being designed for use in optically shallow waters, empirical Chl and CDOM models [34,69] resulted in the most accurate estimates of these parameters, and outperformed the analytical shallow water model. However, these models required calibration to our field data in order to produce estimates within the correct order of magnitude. Although model estimates were more accurate than expected, they suffered from low precision within the parameter ranges of interest and performed poorly for classification above or below the selected thresholds. Most of the Chl models substantially overestimated concentrations at nearly all stations, as would be expected for coastal waters due to the influence of non-phytoplankton-derived CDOM and SPM [38]. The recalibrated CDOM 1 model underestimated aCDOM(443) when values exceeded ~0.7 m−1, which is likely due to the weakness of the model relationship over the range of our field data (R2 = 0.34, Figure S3).
When applied to images, additional limitations became apparent (Figure 4). Chl estimates appear to be highly sensitive to variations in brightness of the benthic substrate, suggesting variability in the benthic signal is likely overwhelming the spectral influence of variability in water column parameters [17]. The color-index approach underlying this model relies on the assumption of a linear baseline between Rrs(555) and Rrs(670), with only differences in Chl affecting absorption at 443 nm [75] and no accounting for spectral variability in benthic substrate. According to the optical depth threshold suggested in [88], all of the field measurements occurred in optically shallow water (ζE(547) < 20). Of the models considered, only the analytical shallow water model [71] directly incorporates the spectral influence of the benthic substrate. Although we applied this model using regionally-informed parameter settings and a custom benthic spectral library, this model only outperformed the heritage multi-spectral models for a limited number of stations (Table 3). Leveraging fine spectral resolution data through inversion of the shallow water model may help overcome inherent ambiguities in water leaving reflectance to reliably estimate water column properties but will require a more detailed investigation to optimize model performance under these conditions.
We also found that in situ sonde measurements were strongly related to lab-measured water quality parameters, supporting the use of data from portable sensors to serve as reliable proxies and more efficiently collect data for general assessments of aquatic remote sensing models. Although studies have shown turbidity measurements can vary substantially between instruments [89] and calibration methods [90,91], sediment concentrations in rivers are routinely estimated from turbidity sensors with high confidence using instrument and site-specific calibrations with periodic verification [92,93]. A previous investigation of the WET Labs ECO sensor validated its global consistency for in situ fluorometric Chl measurements but identified a systematic overestimation in its factory calibration [94]. The relationship between our field and lab-measured Chl values did not indicate a similar bias; however, a global analysis of potential bias in Chl estimates from the YSI EXO Total Algae sensor has not been conducted. Among the three water quality parameters we investigated, the relationship between field- and lab-measured values was weakest for CDOM. The wavelength at which aCDOM was most highly correlated with fDOM (350 nm) closely aligns with the sensor’s excitation channel (365 ± 5 nm). This design is attuned to characteristics of humic-like fluorophores [95], which only represent a portion of the entire CDOM pool [96]. Leveraging water quality data from optical sensors may help overcome the persistent challenge of gathering high-quality matchup data to validate aquatic remote sensing models in optically shallow coral reef systems, as in situ sensor performance and uncertainty ranges correspond to remote sensing model performance and uncertainty.
Our evaluation of model performance is limited by the range and variability of conditions encountered in the field, as well as the challenge of collecting simultaneous airborne and seaborne measurements. For SPM, the largest residuals between model estimates and field measurements resulted from stations with the highest concentrations, which often also displayed the most dynamic fine-scale heterogeneity in field conditions. In addition to spatio-temporal alignment issues, residual model error could be due to saturation in the relationship between SPM and changes in reflectance, an uneven vertical distribution of particulates in the water column, or optical variability from differences in particulate size, source, and mineralogy which can all play a role in their light attenuation capacity [97]. Saturation effects are unlikely to be the primary limiting factor because the other SPM models that use wavelength switching to overcome saturation effects [21,29] did not perform as well as several of the single band models (Table 3), and the spectral peak shift towards higher wavelengths that motivates band-switching is reported to occur when concentrations are above 50 mg L−1, which is well over the range measured in this study [30]. For CDOM, model performance was relatively insensitive to glint correction approaches, which may be attributed to reliance on a band ratio and the high correlation between the magnitude and shape of CDOM absorption spectra. The recalibrated model underestimated absorption at stations that measured above the median of observations in our data set, producing the largest residuals for stations with the highest measured CDOM absorption. Calibration over a larger range of field conditions would be needed to more completely evaluate the generalizability of this empirical model.
Results here suggest future work should include further analysis of analytical models that can utilize continuous spectra as well as account for differences in benthic reflectance when estimating water quality parameters, such as finding model constraints and initializations that produce reliable retrievals upon inversion. Because the application of models to water-masked imagery also displayed commonly identified artifacts associated with aquatic imagery such as unrealistic model estimates for pixels with breaking waves [98], very shallow water, and cloud shadows, additional operational controls should be developed and standardized in order to produce realistic spatially consistent model estimates over large scales [12]. Improving the representation of optical variability due to sediment composition would also be beneficial for nearshore monitoring because differences in particle size and origin are highly relevant to predicting impacts to reefs from sediment loading [99,100,101]. Overall, the results suggest the rapid application of simple algorithms can be useful for monitoring acute changes in water quality conditions in nearshore reef environments. These findings support ongoing work considering improvements in remote sensing of water quality over corals using spectroscopy and benthic classification.
Supplementary Materials
The following supporting information can be downloaded at https://www.mdpi.com/article/10.3390/rs16111845/s1, Figure S1: Relationship between field and laboratory measurements of water quality parameters; Figure S2: Comparison of SPM 1 and SPM 7 model estimates; Figure S3: CDOM model estimates before and after recalibration; Table S1: Model performance on ISOFIT 4C corrected spectra for all models tested.
Author Contributions
Conceptualization, K.L.H., M.K., B.K.G. and G.P.A.; methodology, K.L.H., M.K., B.K.G. and G.P.A.; formal analysis, K.L.H., M.K., B.K.G., N.R.V. and G.P.A.; investigation, K.L.H., M.K., B.K.G., N.R.V., R.E.M. and G.P.A.; writing—original draft preparation, K.L.H.; writing—review and editing, K.L.H., M.K., B.K.G., N.R.V., R.E.M., J.D. and E.J.; funding acquisition, G.P.A. All authors have read and agreed to the published version of the manuscript.
Funding
This work was supported by a grant to G.P. Asner from https://CarbonMapper.org. The Global Airborne Observatory (GAO) is managed by the Center for Global Discovery and Conservation Science at Arizona State University. The GAO is made possible by support from private foundations, visionary individuals, and Arizona State University.
Data Availability Statement
The software used in this study is a publicly available python package accessible at https://github.com/CMLandOcean/bio_optics (accessed on 1 April 2024).
Acknowledgments
This study would not have been possible without the support of many people. We thank Dominica Harrison, Kelly van Woesik, Kimberly Fuller, and Kevin Tadlock, for their help with field work, boat operations and water sample processing. We appreciate the hard work of the GAO aircraft crew: Joseph Heckler, Devon Woodward, Sheldon Decosse and Bryce Smith. We also thank Crispin Nakoa at the University of Hawaii in Hilo and Kristy Scott, Cole Percola, Tova Callender with the Division of Aquatic Research of the States of Hawaii for their support during the field campaign. We acknowledge Phillip Noel for his contributions to the bio_optics code base and are thankful to Peter Gege for fruitful discussions and the free provision of WASI, Philipp Grötsch for the free provision of his 3C Python implementation, Jet Propulsion Laboratory for the free provision of ISOFIT.
Conflicts of Interest
The authors declare no conflicts of interest.
Appendix
Descriptions of the water quality models listed in Table 1.
SPM 1 was calculated according to the model presented in [32].
SPM 2 was calculated according to the model presented in [20].
SPM 3 was calculated according to the model presented in [77].
SPM 4 was calculated according to the model presented in [30].
SPM 5 was calculated as the sum of particulate and phytoplankton concentrations estimated from inversion of the bio-optical model described in [71] and implemented with the parameter settings listed in Table A1.
SPM 6 was calculated according to the model presented in [29].
SPM 7 was calculated according to the model presented in [21].
Chl 1 was calculated according to the model presented in [34], originally described in [75], and recalibrated for this study using Equation (A32).
Chl 2 was calculated according to the model presented in [41].
Chl 3 was calculated according to the model presented on page 165 of [66].
Chl 4 was calculated according to the three-band model presented in [78].
Chl 5 was calculated according to the two-band model presented in [78].
Chl 6 was calculated according to the model presented in [79].
Chl 7 was calculated according to the model presented in [80].
Chl 8 was calculated according to the model presented in [80].
Chl 9 was calculated according to the model presented in [81].
Chl 10 was calculated according to the model presented in [40].
Chl 11 was calculated according to the model presented in [82].
Chl 12 was calculated as phytoplankton concentrations estimated from inversion of the bio-optical model described in [71] and implemented with the parameter settings listed in Table A1.
CDOM 1 was calculated according to the model presented in [69] and recalibrated for this study using Equation (A48).
CDOM 2 was calculated according to the model presented in presented in [69] and recalibrated for this study using Equation (A50).
CDOM 3 was calculated according to the model presented in [69].
CDOM 4 was calculated according to the model presented in [76].
CDOM 5 was calculated according to the model presented in [41].
CDOM 6 was calculated according to the model presented in [67].
CDOM 7 was calculated from inversion of the bio-optical model described in [71] and implemented with the parameter settings listed in Table A1.
CDOM 8 was calculated according to the model presented in [83].
CDOM 9 was calculated according to the model presented in [84].
The bio-optical model is the shallow water model in [70] as implemented in [55] and fully described in [71]. Model parameters were estimated using least squares fitting with initial ranges and values given in Table A1.
Table A1.
Bio-optical model parameters and settings. For fitted parameters, the start values and range are provided and for fixed parameters the set value is provided. Spectral library files are provided in [71] for specific phytoplankton absorption, water absorption, normalized phytoplankton backscattering coefficients, the temperature gradient of pure water absorption, and the irradiance reflectance of benthic substrates.
| Parameter | Description | Value | Range |
|---|---|---|---|
| C0 | Concentration of phytoplankton type 1 in µg L−1 | 0 | 0–10 |
| CY | Absorption of CDOM at 440 nm in m−1 | 0 | 0–2 |
| CX | Concentration of type 1 non-algal particles in mg L−1 | 0 | 0–25 |
| CMie | Concentration of type 2 non-algal particles in mg L−1 | 0 | 0–25 |
| F0 | Fractional benthic cover of surface with constant reflectance of 1 | 0 | 0–1 |
| F1 | Fractional benthic cover of sand | 0 | 0–1 |
| F2 | Fractional benthic cover of coral | 0 | 0–1 |
| F3 | Fractional benthic cover of crustose coralline algae | 0 | 0–1 |
| F4 | Fractional benthic cover of macroalgae | 0 | 0–1 |
| ZB | Water depth in m | 10 | 0–1 |
| b*b,phy | Specific backscattering coefficient of phytoplankton at 550 nm in m2 mg−1 | 0.001 | - |
| b*b,X | Specific backscattering coefficient of type 1 non-algal particles in m2 g−1 | 0.0086 | - |
| b*b,Mie | Specific backscattering coefficient of type 2 non-algal particles in m2 g−1 | 0.0042 | - |
| a*NAP | Specific absorption coefficient of non-algal particles at 440 nm in m2 g−1 | 0.041 | - |
| S | Exponent of CDOM absorption | 0.014 | - |
| SNAP | Exponent of non-algal particulate absorption | 0.11 | - |
| η | Ångström exponent of type 2 non-algal particulate backscattering | −1 | - |
References
- Hughes, T.P.; Anderson, K.D.; Connolly, S.R.; Heron, S.F.; Kerry, J.T.; Lough, J.M.; Baird, A.H.; Baum, J.K.; Berumen, M.L.; Bridge, T.C.; et al. Spatial and Temporal Patterns of Mass Bleaching of Corals in the Anthropocene. Science 2018, 359, 80–83. [Google Scholar] [CrossRef] [PubMed]
- Fabricius, K.E. Effects of Terrestrial Runoff on the Ecology of Corals and Coral Reefs: Review and Synthesis. Mar. Pollut. Bull. 2005, 50, 125–146. [Google Scholar] [CrossRef] [PubMed]
- Kekuewa, S.A.H.; Courtney, T.A.; Cyronak, T.; Kindeberg, T.; Eyre, B.D.; Stoltenberg, L.; Andersson, A.J. Temporal and Spatial Variabilities of Chemical and Physical Parameters on the Heron Island Coral Reef Platform. Aquat. Geochem. 2021, 27, 241–268. [Google Scholar] [CrossRef]
- Schlaefer, J.A.; Tebbett, S.B.; Bellwood, D.R. The Study of Sediments on Coral Reefs: A Hydrodynamic Perspective. Mar. Pollut. Bull. 2021, 169, 112580. [Google Scholar] [CrossRef] [PubMed]
- Bessell-Browne, P.; Negri, A.P.; Fisher, R.; Clode, P.L.; Jones, R. Cumulative Impacts: Thermally Bleached Corals Have Reduced Capacity to Clear Deposited Sediment. Sci. Rep. 2017, 7, 2716. [Google Scholar] [CrossRef]
- Gove, J.M.; Williams, G.J.; Lecky, J.; Brown, E.; Conklin, E.; Counsell, C.; Davis, G.; Donovan, M.K.; Falinski, K.; Kramer, L.; et al. Coral Reefs Benefit from Reduced Land–Sea Impacts under Ocean Warming. Nature 2023, 621, 536–542. [Google Scholar] [CrossRef]
- Humanes, A.; Ricardo, G.F.; Willis, B.L.; Fabricius, K.E.; Negri, A.P. Cumulative Effects of Suspended Sediments, Organic Nutrients and Temperature Stress on Early Life History Stages of the Coral Acropora Tenuis. Sci. Rep. 2017, 7, 44101. [Google Scholar] [CrossRef]
- Barott, K.L.; Huffmyer, A.S.; Davidson, J.M.; Lenz, E.A.; Matsuda, S.B.; Hancock, J.R.; Innis, T.; Drury, C.; Putnam, H.M.; Gates, R.D. Coral Bleaching Response Is Unaltered Following Acclimatization to Reefs with Distinct Environmental Conditions. Proc. Natl. Acad. Sci. USA 2021, 118, e2025435118. [Google Scholar] [CrossRef]
- Cunning, R.; Silverstein, R.N.; Barnes, B.B.; Baker, A.C. Extensive Coral Mortality and Critical Habitat Loss Following Dredging and Their Association with Remotely-Sensed Sediment Plumes. Mar. Pollut. Bull. 2019, 145, 185–199. [Google Scholar] [CrossRef]
- Foo, S.A.; Asner, G.P. Scaling Up Coral Reef Restoration Using Remote Sensing Technology. Front. Mar. Sci. 2019, 6, 79. [Google Scholar] [CrossRef]
- Zheng, G.; DiGiacomo, P.M. Uncertainties and Applications of Satellite-Derived Coastal Water Quality Products. Prog. Oceanogr. 2017, 159, 45–72. [Google Scholar] [CrossRef]
- Dierssen, H.M.; Ackleson, S.G.; Joyce, K.E.; Hestir, E.L.; Castagna, A.; Lavender, S.; McManus, M.A. Living up to the Hype of Hyperspectral Aquatic Remote Sensing: Science, Resources and Outlook. Front. Environ. Sci. 2021, 9, 649528. [Google Scholar] [CrossRef]
- Giardino, C.; Brando, V.E.; Gege, P.; Pinnel, N.; Hochberg, E.; Knaeps, E.; Reusen, I.; Doerffer, R.; Bresciani, M.; Braga, F.; et al. Imaging Spectrometry of Inland and Coastal Waters: State of the Art, Achievements and Perspectives. Surv. Geophys. 2019, 40, 401–429. [Google Scholar] [CrossRef]
- König, M.; Grunert, B.K.; Hondula, K.; Bohn, N.; Dai, J.; Jamalinia, E.; Vaughn, N.R.; Thompson, D.R.; Asner, G.P. Assessment of Combined Atmospheric and Glint Correction Approaches for Remote Sensing Reflectance Estimation. Remote Sens. Environ. 2024, under review. [Google Scholar]
- Hochberg, E.J.; Peltier, S.A.; Maritorena, S. Trends and Variability in Spectral Diffuse Attenuation of Coral Reef Waters. Coral Reefs 2020, 39, 1377–1389. [Google Scholar] [CrossRef]
- Kutser, T.; Hedley, J.; Giardino, C.; Roelfsema, C.; Brando, V.E. Remote Sensing of Shallow Waters—A 50 Year Retrospective and Future Directions. Remote Sens. Environ. 2020, 240, 111619. [Google Scholar] [CrossRef]
- Bell, T.W.; Okin, G.S.; Cavanaugh, K.C.; Hochberg, E.J. Impact of Water Characteristics on the Discrimination of Benthic Cover in and around Coral Reefs from Imaging Spectrometer Data. Remote Sens. Environ. 2020, 239, 111631. [Google Scholar] [CrossRef]
- Turner, K.J.; Tzortziou, M.; Grunert, B.K.; Goes, J.; Sherman, J. Optical Classification of an Urbanized Estuary Using Hyperspectral Remote Sensing Reflectance. Opt. Express 2022, 30, 41590. [Google Scholar] [CrossRef]
- Mouw, C.B.; Greb, S.; Aurin, D.; DiGiacomo, P.M.; Lee, Z.; Twardowski, M.; Binding, C.; Hu, C.; Ma, R.; Moore, T.; et al. Aquatic Color Radiometry Remote Sensing of Coastal and Inland Waters: Challenges and Recommendations for Future Satellite Missions. Remote Sens. Environ. 2015, 160, 15–30. [Google Scholar] [CrossRef]
- D’Sa, E.J.; Miller, R.L.; McKee, B.A. Suspended Particulate Matter Dynamics in Coastal Waters from Ocean Color: Application to the Northern Gulf of Mexico. Geophys. Res. Lett. 2007, 34, 2007GL031192. [Google Scholar] [CrossRef]
- Novoa, S.; Doxaran, D.; Ody, A.; Vanhellemont, Q.; Lafon, V.; Lubac, B.; Gernez, P. Atmospheric Corrections and Multi-Conditional Algorithm for Multi-Sensor Remote Sensing of Suspended Particulate Matter in Low-to-High Turbidity Levels Coastal Waters. Remote Sens. 2017, 9, 61. [Google Scholar] [CrossRef]
- Hooker, S.; McClain, C.; Mannino, A. NASA Strategic Planning Document: A Comprehensive Plan for the Long-Term Calibra- Tion and Validation of Oceanic Biogeochemical Satellite Data, NASA Special Pub. 2007-214152; National Aeronautics and Space Administration, Goddard Space Flight Center: Greenbelt, MD, USA, 2007. [Google Scholar]
- Rogers, C. Responses of Coral Reefs and Reef Organisms to Sedimentation. Mar. Ecol. Prog. Ser. 1990, 62, 185–202. [Google Scholar] [CrossRef]
- Tuttle, L.J.; Donahue, M.J. Effects of Sediment Exposure on Corals: A Systematic Review of Experimental Studies. Environ. Evid. 2022, 11, 4. [Google Scholar] [CrossRef] [PubMed]
- Ricardo, G.F.; Jones, R.J.; Clode, P.L.; Humanes, A.; Negri, A.P. Suspended Sediments Limit Coral Sperm Availability. Sci. Rep. 2015, 5, 18084. [Google Scholar] [CrossRef] [PubMed]
- Rogers, C.S.; Ramos-Scharrón, C.E. Assessing Effects of Sediment Delivery to Coral Reefs: A Caribbean Watershed Perspective. Front. Mar. Sci. 2022, 8, 773968. [Google Scholar] [CrossRef]
- Carlson, R.R.; Li, J.; Crowder, L.B.; Asner, G.P. Large-Scale Effects of Turbidity on Coral Bleaching in the Hawaiian Islands. Front. Mar. Sci. 2022, 9, 969472. [Google Scholar] [CrossRef]
- Morgan, K.M.; Perry, C.T.; Smithers, S.G.; Johnson, J.A.; Daniell, J.J. Evidence of Extensive Reef Development and High Coral Cover in Nearshore Environments: Implications for Understanding Coral Adaptation in Turbid Settings. Sci. Rep. 2016, 6, 29616. [Google Scholar] [CrossRef]
- Yu, X.; Lee, Z.; Shen, F.; Wang, M.; Wei, J.; Jiang, L.; Shang, Z. An Empirical Algorithm to Seamlessly Retrieve the Concentration of Suspended Particulate Matter from Water Color across Ocean to Turbid River Mouths. Remote Sens. Environ. 2019, 235, 111491. [Google Scholar] [CrossRef]
- Petus, C.; Chust, G.; Gohin, F.; Doxaran, D.; Froidefond, J.-M.; Sagarminaga, Y. Estimating Turbidity and Total Suspended Matter in the Adour River Plume (South Bay of Biscay) Using MODIS 250-m Imagery. Cont. Shelf Res. 2010, 30, 379–392. [Google Scholar] [CrossRef]
- Restrepo, J.D.; Park, E.; Aquino, S.; Latrubesse, E.M. Coral Reefs Chronically Exposed to River Sediment Plumes in the Southwestern Caribbean: Rosario Islands, Colombia. Sci. Total Environ. 2016, 553, 316–329. [Google Scholar] [CrossRef]
- Jiang, D.; Matsushita, B.; Pahlevan, N.; Gurlin, D.; Lehmann, M.K.; Fichot, C.G.; Schalles, J.; Loisel, H.; Binding, C.; Zhang, Y.; et al. Remotely Estimating Total Suspended Solids Concentration in Clear to Extremely Turbid Waters Using a Novel Semi-Analytical Method. Remote Sens. Environ. 2021, 258, 112386. [Google Scholar] [CrossRef]
- Bell, P.R.F. Eutrophication and Coral Reefs—Some Examples in the Great Barrier Reef Lagoon. Water Res. 1992, 26, 553–568. [Google Scholar] [CrossRef]
- Hu, C.; Feng, L.; Lee, Z.; Franz, B.A.; Bailey, S.W.; Werdell, P.J.; Proctor, C.W. Improving Satellite Global Chlorophyll a Data Products Through Algorithm Refinement and Data Recovery. J. Geophys. Res. Oceans 2019, 124, 1524–1543. [Google Scholar] [CrossRef]
- De’ath, G.; Fabricius, K. Water Quality as a Regional Driver of Coral Biodiversity and Macroalgae on the Great Barrier Reef. Ecol. Appl. 2010, 20, 840–850. [Google Scholar] [CrossRef] [PubMed]
- Adolf, J.E.; Burns, J.; Walker, J.K.; Gamiao, S. Near Shore Distributions of Phytoplankton and Bacteria in Relation to Submarine Groundwater Discharge-Fed Fishponds, Kona Coast, Hawai‘i, USA. Estuar. Coast. Shelf Sci. 2019, 219, 341–353. [Google Scholar] [CrossRef]
- Johnson, E.E.; Wiegner, T.N. Surface Water Metabolism Potential in Groundwater-Fed Coastal Waters of Hawaii Island, USA. Estuaries Coasts 2014, 37, 712–723. [Google Scholar] [CrossRef]
- Blondeau-Patissier, D.; Gower, J.F.R.; Dekker, A.G.; Phinn, S.R.; Brando, V.E. A Review of Ocean Color Remote Sensing Methods and Statistical Techniques for the Detection, Mapping and Analysis of Phytoplankton Blooms in Coastal and Open Oceans. Prog. Oceanogr. 2014, 123, 123–144. [Google Scholar] [CrossRef]
- Moore, T.S.; Campbell, J.W.; Dowell, M.D. A Class-Based Approach to Characterizing and Mapping the Uncertainty of the MODIS Ocean Chlorophyll Product. Remote Sens. Environ. 2009, 113, 2424–2430. [Google Scholar] [CrossRef]
- Gitelson, A.A.; Dall’Olmo, G.; Moses, W.; Rundquist, D.C.; Barrow, T.; Fisher, T.R.; Gurlin, D.; Holz, J. A Simple Semi-Analytical Model for Remote Estimation of Chlorophyll-a in Turbid Waters: Validation. Remote Sens. Environ. 2008, 112, 3582–3593. [Google Scholar] [CrossRef]
- Keith, D.J.; Schaeffer, B.A.; Lunetta, R.S.; Gould, R.W.; Rocha, K.; Cobb, D.J. Remote Sensing of Selected Water-Quality Indicators with the Hyperspectral Imager for the Coastal Ocean (HICO) Sensor. Int. J. Remote Sens. 2014, 35, 2927–2962. [Google Scholar] [CrossRef]
- Ruddick, K.G.; Gons, H.J.; Rijkeboer, M.; Tilstone, G. Optical Remote Sensing of Chlorophyll a in Case 2 Waters by Use of an Adaptive Two-Band Algorithm with Optimal Error Properties. Appl. Opt. 2001, 40, 3575. [Google Scholar] [CrossRef] [PubMed]
- Neil, C.; Spyrakos, E.; Hunter, P.D.; Tyler, A.N. A Global Approach for Chlorophyll-a Retrieval across Optically Complex Inland Waters Based on Optical Water Types. Remote Sens. Environ. 2019, 229, 159–178. [Google Scholar] [CrossRef]
- Russell, B.J.; Dierssen, H.M.; Hochberg, E.J. Water Column Optical Properties of Pacific Coral Reefs Across Geomorphic Zones and in Comparison to Offshore Waters. Remote Sens. 2019, 11, 1757. [Google Scholar] [CrossRef]
- Zepp, R.G.; Shank, G.C.; Stabenau, E.; Patterson, K.W.; Cyterski, M.; Fisher, W.; Bartels, E.; Anderson, S.L. Spatial and Temporal Variability of Solar Ultraviolet Exposure of Coral Assemblages in the Florida Keys: Importance of Colored Dissolved Organic Matter. Limnol. Oceanogr. 2008, 53, 1909–1922. [Google Scholar] [CrossRef]
- Barber-Lluch, E.; Nieto-Cid, M.; Santos-Echeandía, J.; Sánchez-Marín, P. Effect of Dissolved Organic Matter on Copper Bioavailability to a Coastal Dinoflagellate at Environmentally Relevant Concentrations. Sci. Total Environ. 2023, 901, 165989. [Google Scholar] [CrossRef] [PubMed]
- Harringmeyer, J.P.; Kaiser, K.; Thompson, D.R.; Gierach, M.M.; Cash, C.L.; Fichot, C.G. Detection and Sourcing of CDOM in Urban Coastal Waters With UV-Visible Imaging Spectroscopy. Front. Environ. Sci. 2021, 9, 647966. [Google Scholar] [CrossRef]
- Nezlin, N.P.; Beegan, C.; Feit, A.; Gully, J.R.; Latker, A.; McLaughlin, K.; Mengel, M.J.; Robertson, G.L.; Steele, A.; Weisberg, S.B. Colored Dissolved Organic Matter (CDOM) as a Tracer of Effluent Plumes in the Coastal Ocean. Reg. Stud. Mar. Sci. 2020, 35, 101163. [Google Scholar] [CrossRef]
- Asner, G.P.; Knapp, D.E.; Boardman, J.; Green, R.O.; Kennedy-Bowdoin, T.; Eastwood, M.; Martin, R.E.; Anderson, C.; Field, C.B. Carnegie Airborne Observatory-2: Increasing Science Data Dimensionality via High-Fidelity Multi-Sensor Fusion. Remote Sens. Environ. 2012, 124, 454–465. [Google Scholar] [CrossRef]
- Gao, B.-C.; Heidebrecht, K.B.; Goetz, A.F.H. Derivation of Scaled Surface Reflectances from AVIRIS Data. Remote Sens. Environ. 1993, 44, 165–178. [Google Scholar] [CrossRef]
- Thompson, D.R.; Hochberg, E.J.; Asner, G.P.; Green, R.O.; Knapp, D.E.; Gao, B.-C.; Garcia, R.; Gierach, M.; Lee, Z.; Maritorena, S.; et al. Airborne Mapping of Benthic Reflectance Spectra with Bayesian Linear Mixtures. Remote Sens. Environ. 2017, 200, 18–30. [Google Scholar] [CrossRef]
- Thompson, D.R.; Natraj, V.; Green, R.O.; Helmlinger, M.C.; Gao, B.-C.; Eastwood, M.L. Optimal Estimation for Imaging Spectrometer Atmospheric Correction. Remote Sens. Environ. 2018, 216, 355–373. [Google Scholar] [CrossRef]
- Gege, P. Analytic Model for the Direct and Diffuse Components of Downwelling Spectral Irradiance in Water. Appl. Opt. 2012, 51, 1407. [Google Scholar] [CrossRef]
- Gege, P.; Grötsch, P. A Spectral Model for Correcting Sunglint and Skyglint. Proc. Ocean Opt. XXIII 2016, 2016, 1–10. [Google Scholar]
- Göritz, A.; Berger, S.; Gege, P.; Grossart, H.-P.; Nejstgaard, J.; Riedel, S.; Röttgers, R.; Utschig, C. Retrieval of Water Constituents from Hyperspectral In-Situ Measurements under Variable Cloud Cover—A Case Study at Lake Stechlin (Germany). Remote Sens. 2018, 10, 181. [Google Scholar] [CrossRef]
- Groetsch, P.M.M.; Gege, P.; Simis, S.G.H.; Eleveld, M.A.; Peters, S.W.M. Validation of a Spectral Correction Procedure for Sun and Sky Reflections in Above-Water Reflectance Measurements. Opt. Express 2017, 25, A742. [Google Scholar] [CrossRef]
- Gao, B.-C.; Li, R.-R. Correction of Sunglint Effects in High Spatial Resolution Hyperspectral Imagery Using SWIR or NIR Bands and Taking Account of Spectral Variation of Refractive Index of Water. Adv. Environ. Eng. Res. 2021, 2, 3. [Google Scholar] [CrossRef]
- Thompson, D.R.; Cawse-Nicholson, K.; Erickson, Z.; Fichot, C.G.; Frankenberg, C.; Gao, B.-C.; Gierach, M.M.; Green, R.O.; Jensen, D.; Natraj, V.; et al. A Unified Approach to Estimate Land and Water Reflectances with Uncertainties for Coastal Imaging Spectroscopy. Remote Sens. Environ. 2019, 231, 111198. [Google Scholar] [CrossRef]
- Greenberg, E.; Thompson, D.R.; Jensen, D.; Townsend, P.A.; Queally, N.; Chlus, A.; Fichot, C.G.; Harringmeyer, J.P.; Simard, M. An Improved Scheme for Correcting Remote Spectral Surface Reflectance Simultaneously for Terrestrial BRDF and Water-Surface Sunglint in Coastal Environments. J. Geophys. Res. Biogeosciences 2022, 127, e2021JG006712. [Google Scholar] [CrossRef]
- Feyisa, G.L.; Meilby, H.; Fensholt, R.; Proud, S.R. Automated Water Extraction Index: A New Technique for Surface Water Mapping Using Landsat Imagery. Remote Sens. Environ. 2014, 140, 23–35. [Google Scholar] [CrossRef]
- Mannino, A.; Novak, M.G.; Nelson, N.; Belz, M.; Berthon, J.F.; Blough, N.; Boss, E.; Bricaud, A.; Chaves, J.; Del Castillo, C.; et al. Measurement Protocol of Absorption by Chromophoric Dissolved Organic Matter (CDOM) and Other Dissolved Materials; IOCCG Ocean Optics and Biogeochemistry Protocols for Satellite Ocean Colour Sensor Validation; IOCCG: Dartmouth, NS, Canada, 2019; Available online: https://ioccg.org/wp-content/uploads/2019/10/cdom_abs_protocol_public_draft-19oct-2019-sm.pdf (accessed on 15 December 2022).
- Grunert, B.K.; Mouw, C.B.; Ciochetto, A.B. Characterizing CDOM Spectral Variability Across Diverse Regions and Spectral Ranges. Glob. Biogeochem. Cycles 2018, 32, 57–77. [Google Scholar] [CrossRef]
- Loiselle, S.A.; Bracchini, L.; Dattilo, A.M.; Ricci, M.; Tognazzi, A.; Cózar, A.; Rossi, C. The Optical Characterization of Chromophoric Dissolved Organic Matter Using Wavelength Distribution of Absorption Spectral Slopes. Limnol. Oceanogr. 2009, 54, 590–597. [Google Scholar] [CrossRef]
- Helms, J.R.; Stubbins, A.; Ritchie, J.D.; Minor, E.C.; Kieber, D.J.; Mopper, K. Absorption Spectral Slopes and Slope Ratios as Indicators of Molecular Weight, Source, and Photobleaching of Chromophoric Dissolved Organic Matter. Limnol. Oceanogr. 2008, 53, 955–969. [Google Scholar] [CrossRef]
- O’Reilly, J.E.; Maritorena, S.; Mitchell, B.G.; Siegel, D.A.; Carder, K.L.; Garver, S.A.; Kahru, M.; McClain, C. Ocean Color Chlorophyll Algorithms for SeaWiFS. J. Geophys. Res. Oceans 1998, 103, 24937–24953. [Google Scholar] [CrossRef]
- Bio-Optical Modelling and Remote Sensing of Inland Waters; Mishra, D.R., Ogashawara, I., Gitelson, A.A., Eds.; Elsevier: Amsterdam, The Netherlands, 2017; ISBN 978-0-12-804644-9. [Google Scholar]
- Ficek, D.; Zapadka, T.; Dera, J. Remote sensing reflectance of Pomeranian lakes and the Baltic. Oceanologia 2011, 53, 959–970. [Google Scholar] [CrossRef]
- Lee, Z.; Carder, K.L.; Arnone, R.A. Deriving Inherent Optical Properties from Water Color: A Multiband Quasi-Analytical Algorithm for Optically Deep Waters. Appl. Opt. 2002, 41, 5755. [Google Scholar] [CrossRef]
- Mannino, A.; Russ, M.E.; Hooker, S.B. Algorithm Development and Validation for Satellite-derived Distributions of DOC and CDOM in the U.S. Middle Atlantic Bight. J. Geophys. Res. Oceans 2008, 113, 2007JC004493. [Google Scholar] [CrossRef]
- Albert, A.; Mobley, C. An Analytical Model for Subsurface Irradiance and Remote Sensing Reflectance in Deep and Shallow Case-2 Waters. Opt. Express 2003, 11, 2873. [Google Scholar] [CrossRef]
- König, M.; Noel, P.; Hondula, K.L.; Jamalinia, E.; Dai, J.; Vaughn, N.R.; Asner, G.P. bio_optics python package. Available online: https://github.com/CMLandOcean/bio_optics (accessed on 1 January 2023). [CrossRef]
- Vandermeulen, R.A.; Mannino, A.; Craig, S.E.; Werdell, P.J. 150 Shades of Green: Using the Full Spectrum of Remote Sensing Reflectance to Elucidate Color Shifts in the Ocean. Remote Sens. Environ. 2020, 247, 111900. [Google Scholar] [CrossRef]
- Dierssen, H.M.; Vandermeulen, R.A.; Barnes, B.B.; Castagna, A.; Knaeps, E.; Vanhellemont, Q. QWIP: A Quantitative Metric for Quality Control of Aquatic Reflectance Spectral Shape Using the Apparent Visible Wavelength. Front. Remote Sens. 2022, 3, 869611. [Google Scholar] [CrossRef]
- Balasubramanian, S.V.; Pahlevan, N.; Smith, B.; Binding, C.; Schalles, J.; Loisel, H.; Gurlin, D.; Greb, S.; Alikas, K.; Randla, M.; et al. Robust Algorithm for Estimating Total Suspended Solids (TSS) in Inland and Nearshore Coastal Waters. Remote Sens. Environ. 2020, 246, 111768. [Google Scholar] [CrossRef]
- Hu, C.; Lee, Z.; Franz, B. Chlorophyll a Algorithms for Oligotrophic Oceans: A Novel Approach Based on Three-band Reflectance Difference. J. Geophys. Res. Oceans 2012, 117, 2011JC007395. [Google Scholar] [CrossRef]
- Loisel, H.; Vantrepotte, V.; Dessailly, D.; Mériaux, X. Assessment of the Colored Dissolved Organic Matter in Coastal Waters from Ocean Color Remote Sensing. Opt. Express 2014, 22, 13109. [Google Scholar] [CrossRef] [PubMed]
- Miller, R.L.; McKee, B.A. Using MODIS Terra 250 m Imagery to Map Concentrations of Total Suspended Matter in Coastal Waters. Remote Sens. Environ. 2004, 93, 259–266. [Google Scholar] [CrossRef]
- Moses, W.J.; Gitelson, A.A.; Berdnikov, S.; Povazhnyy, V. Satellite Estimation of Chlorophyll-a Concentration Using the Red and NIR Bands of MERIS—The Azov Sea Case Study. IEEE Geosci. Remote Sens. Lett. 2009, 6, 845–849. [Google Scholar] [CrossRef]
- Li, J.; Knapp, D.E.; Schill, S.R.; Roelfsema, C.; Phinn, S.; Silman, M.; Mascaro, J.; Asner, G.P. Adaptive Bathymetry Estimation for Shallow Coastal Waters Using Planet Dove Satellites. Remote Sens. Environ. 2019, 232, 111302. [Google Scholar] [CrossRef]
- Gurlin, D.; Gitelson, A.A.; Moses, W.J. Remote Estimation of Chl-a Concentration in Turbid Productive Waters—Return to a Simple Two-Band NIR-Red Model? Remote Sens. Environ. 2011, 115, 3479–3490. [Google Scholar] [CrossRef]
- Potes, M.; Rodrigues, G.; Penha, A.M.; Novais, M.H.; Costa, M.J.; Salgado, R.; Morais, M.M. Use of Sentinel 2–MSI for Water Quality Monitoring at Alqueva Reservoir, Portugal. Proc. Int. Assoc. Hydrol. Sci. 2018, 380, 73–79. [Google Scholar] [CrossRef]
- Menon, H.B.; Adhikari, A. Remote Sensing of Chlorophyll-A in Case II Waters: A Novel Approach With Improved Accuracy Over Widely Implemented Turbid Water Indices. J. Geophys. Res. Oceans 2018, 123, 8138–8158. [Google Scholar] [CrossRef]
- Lee, Z. Update of the Quasi-Analytical Algorithm (QAA_v6) 2014. Available online: https://www.ioccg.org/groups/Software_OCA/QAA_v6_2014209.pdf (accessed on 1 January 2023).
- Zhu, W.; Yu, Q. Inversion of Chromophoric Dissolved Organic Matter From EO-1 Hyperion Imagery for Turbid Estuarine and Coastal Waters. Geosci. Remote Sens. IEEE Trans. On 2013, 51, 3286–3298. [Google Scholar] [CrossRef]
- Kvålseth, T.O. Cautionary Note about R 2. Am. Stat. 1985, 39, 279–285. [Google Scholar] [CrossRef]
- Seegers, B.N.; Stumpf, R.P.; Schaeffer, B.A.; Loftin, K.A.; Werdell, P.J. Performance Metrics for the Assessment of Satellite Data Products: An Ocean Color Case Study. Opt. Express 2018, 26, 7404. [Google Scholar] [CrossRef] [PubMed]
- Barnes, B.B.; Garcia, R.; Hu, C.; Lee, Z. Multi-Band Spectral Matching Inversion Algorithm to Derive Water Column Properties in Optically Shallow Waters: An Optimization of Parameterization. Remote Sens. Environ. 2018, 204, 424–438. [Google Scholar] [CrossRef]
- McKinna, L.I.W.; Werdell, P.J. Approach for Identifying Optically Shallow Pixels When Processing Ocean-Color Imagery. Opt. Express 2018, 26, A915. [Google Scholar] [CrossRef] [PubMed]
- Rymszewicz, A.; O’Sullivan, J.J.; Bruen, M.; Turner, J.N.; Lawler, D.M.; Conroy, E.; Kelly-Quinn, M. Measurement Differences between Turbidity Instruments, and Their Implications for Suspended Sediment Concentration and Load Calculations: A Sensor Inter-Comparison Study. J. Environ. Manag. 2017, 199, 99–108. [Google Scholar] [CrossRef] [PubMed]
- Merten, G.H.; Capel, P.D.; Minella, J.P.G. Effects of Suspended Sediment Concentration and Grain Size on Three Optical Turbidity Sensors. J. Soils Sediments 2014, 14, 1235–1241. [Google Scholar] [CrossRef]
- Minella, J.P.G.; Merten, G.H.; Reichert, J.M.; Clarke, R.T. Estimating Suspended Sediment Concentrations from Turbidity Measurements and the Calibration Problem. Hydrol. Process. 2008, 22, 1819–1830. [Google Scholar] [CrossRef]
- Rasmussen, P.; Gray, J.; Glysson, G.D.; Ziegler, A. Guidelines and Procedures for Computing Time-Series Suspended-Sediment Concentrations and Loads from In-Stream Turbidity-Sensor and Streamflow Data; Techniques and Methods; U.S. Geological Survey: Reston, VA, USA, 2009; ISBN 978 1-4113-2410-7. [Google Scholar]
- Jastram, J.D.; Zipper, C.E.; Zelazny, L.W.; Hyer, K.E. Increasing Precision of Turbidity-Based Suspended Sediment Concentration and Load Estimates. J. Environ. Qual. 2010, 39, 1306–1316. [Google Scholar] [CrossRef]
- Roesler, C.; Uitz, J.; Claustre, H.; Boss, E.; Xing, X.; Organelli, E.; Briggs, N.; Bricaud, A.; Schmechtig, C.; Poteau, A.; et al. Recommendations for Obtaining Unbiased Chlorophyll Estimates from in Situ Chlorophyll Fluorometers: A Global Analysis of WET Labs ECO Sensors. Limnol. Oceanogr. Methods 2017, 15, 572–585. [Google Scholar] [CrossRef]
- Coble, P.G. Characterization of Marine and Terrestrial DOM in Seawater Using Excitation-Emission Matrix Spectroscopy. Mar. Chem. 1996, 51, 325–346. [Google Scholar] [CrossRef]
- D’Andrilli, J.; Silverman, V.; Buckley, S.; Rosario-Ortiz, F.L. Inferring Ecosystem Function from Dissolved Organic Matter Optical Properties: A Critical Review. Environ. Sci. Technol. 2022, 56, 11146–11161. [Google Scholar] [CrossRef]
- Cussioli, M.C.; Seeger, D.; Pratt, D.R.; Bryan, K.R.; Bischof, K.; De Lange, W.P.; Bornman, J.F.; Pilditch, C.A. Spectral Differences in the Underwater Light Regime Caused by Sediment Types in New Zealand Estuaries: Implications for Seagrass Photosynthesis. Geo-Mar. Lett. 2020, 40, 217–225. [Google Scholar] [CrossRef]
- Dierssen, H.M. Hyperspectral Measurements, Parameterizations, and Atmospheric Correction of Whitecaps and Foam From Visible to Shortwave Infrared for Ocean Color Remote Sensing. Front. Earth Sci. 2019, 7, 14. [Google Scholar] [CrossRef]
- Bahr, K.D.; Rodgers, K.S.; Jokiel, P.L.; Prouty, N.G.; Storlazzi, C.D. Pulse Sediment Event Does Not Impact the Metabolism of a Mixed Coral Reef Community. Ocean Coast. Manag. 2020, 184, 105007. [Google Scholar] [CrossRef]
- Bartley, R.; Speirs, W.J.; Ellis, T.W.; Waters, D.K. A Review of Sediment and Nutrient Concentration Data from Australia for Use in Catchment Water Quality Models. Mar. Pollut. Bull. 2012, 65, 101–116. [Google Scholar] [CrossRef]
- Storlazzi, C.D.; Norris, B.K.; Rosenberger, K.J. The Influence of Grain Size, Grain Color, and Suspended-Sediment Concentration on Light Attenuation: Why Fine-Grained Terrestrial Sediment Is Bad for Coral Reef Ecosystems. Coral Reefs 2015, 34, 967–975. [Google Scholar] [CrossRef]


Disclaimer/Publisher’s Note: The statements, opinions and data contained in all publications are solely those of the individual author(s) and contributor(s) and not of MDPI and/or the editor(s). MDPI and/or the editor(s) disclaim responsibility for any injury to people or property resulting from any ideas, methods, instructions or products referred to in the content. |
© 2024 by the authors. Licensee MDPI, Basel, Switzerland. This article is an open access article distributed under the terms and conditions of the Creative Commons Attribution (CC BY) license (https://creativecommons.org/licenses/by/4.0/).