Article

The Afternoon/Morning Ratio of Tower-Based Solar-Induced Chlorophyll Fluorescence Can Be Used to Monitor Drought in a Chinese Cork Oak Plantation

1
Key Laboratory of Tree Breeding and Cultivation of State Forestry Administration, Research Institute of Forestry, Chinese Academy of Forestry, Beijing 100091, China
2
Collaborative Innovation Center of Sustainable Forestry in Southern China, Nanjing Forestry University, Nanjing 210037, China
3
Henan Xiaolangdi Forest Ecosystem National Observation and Research Station, Jiyuan 454650, China
4
Jiangxi Academy of Forestry, Nanchang 330013, China
5
Research Institute of Subtropical Forestry, Chinese Academy of Forestry, Hangzhou 311400, China
*
Author to whom correspondence should be addressed.
Remote Sens. 2024, 16(11), 1897; https://doi.org/10.3390/rs16111897
Submission received: 15 April 2024 / Revised: 20 May 2024 / Accepted: 21 May 2024 / Published: 24 May 2024

Abstract

:
Monitoring drought stress is crucial for estimating productivity and assessing the health status of forest ecosystems under global climate change. Solar-induced chlorophyll fluorescence (SIF) is mechanistically coupled to photosynthesis and has advantages over greenness-based vegetation indices in detecting drought. In recent years, SIF has commonly been used in monitoring drought stress in crop ecosystems. However, the response of tower-based SIF to drought stress in forest ecosystems remains unclear. In this study, we investigated the potential of tower-based SIF to monitor drought, which was quantified using the plant water stress index (PWSI) in a Chinese cork oak plantation. The results show the negative effect of drought on SIF, and afternoon depression of SIF emission under drought stress was observed. Canopy SIF (F) exhibited a nonlinear relationship with PWSI, while the quantum yield of SIF (ΦF) exhibited a significant linear relationship with PWSI at 687 nm and 760 nm (ΦF687: R2 = 0.90; ΦF760: R2 = 0.85). Incident radiation (PAR) and canopy structure affected the response of SIF to drought stress, with PAR as the main factor causing the nonlinear relationship between F and PWSI. Afternoon depression was described as the afternoon/morning ratio (AMR). AMRF and AMRΦF exhibited a negative linear response to PWSI. AMRF was less affected than F by PAR and canopy structures, and AMRΦF was more physiologically representative than ΦF. Moreover, AMRΦF was sensitive to VPD and REW, and it might be a good indicator of drought. Red SIF was more sensitive to drought than far-red SIF, as the R2 of PWSI with AMRΦF687 (R2 = 0.89) was higher than that with AMRΦF687 (R2 = 0.84). These results highlight the potential of tower-based SIF, especially red SIF, for drought monitoring in a plantation, and consideration of the physiological diurnal variation in SIF under drought stress is crucial for improving the accuracy of drought stress monitoring.

1. Introduction

Forest ecosystems, recognized as major terrestrial ecosystems, constitute the largest land carbon sink and play a crucial role in global carbon cycling and mitigating climate change [1,2]. The frequency and severity of drought are projected to increase with global warming, leading to an accelerated decline in productivity and, in some cases, mortality in forests worldwide [3,4,5,6]. Hence, it is necessary to monitor drought in forests to estimate productivity and assess the health of forest ecosystems.
Satellite remote sensing, providing numerous time-continuous and spatially consistent data products, has increasingly contributed to the monitoring of ecosystem drought over recent decades [7,8]. Vegetation indices (VIs), such as the normalized difference vegetation index (NDVI) and enhanced vegetation index (EVI), have been extensively employed for drought monitoring, capturing alterations in canopy structure and leaf optical properties (e.g., leaf area, pigment, dry matter, and water) [9,10]. However, these indicators face limitations in monitoring short-term drought instances that do not induce substantial changes in canopy structure and leaf optical properties [8,11,12]. Additionally, these indices cannot efficiently detect rapid changes in instantaneous photosynthesis under drought conditions due to their limited sensitivity to photosynthesis [13,14].
Sun-induced chlorophyll fluorescence (SIF), mechanically coupled with photosynthesis, is a promising technique for estimating productivity and monitoring environmental stress [15,16]. SIF is a broad-spectrum signal ranging from 650 nm to 850 nm, exhibiting two emission peaks in the red (about 687 nm) and far-red (about 760 nm) bands [16,17,18]. Plants absorb incident radiation, utilizing part of this for photochemistry and dissipating some as heat through non-photochemical quenching (NPQ). A small fraction of energy, which is not dissipated via photochemistry or NPQ, is emitted as SIF. Therefore, SIF reflects the combined action of PQ and NPQ dynamics [19,20,21]. Drought stress leads to a decrease in photosynthetic rate and an increase in NPQ, making SIF sensitive to drought stress [22]. Previous studies reported a reduction in canopy SIF under drought conditions [7,13,23,24]. Nevertheless, observed canopy SIF (F) results from the strong coupling of incident radiation, canopy structure, and physiological information [25,26]. It has been reported that the reduction in SIF under drought stress depends on two factors: one is the change in physiological status, and the other is changes in non-physiological status such as canopy structure. Wang et al. (2023) [27] indicated that physiological changes in SIF primarily account for the reduction in SIF under drought stress, based on experiments conducted in a sugar beet field. Hwang et al. (2023) [28] also demonstrated, through controlled experiments, that changes in canopy structure, like leaf inclination and the canopy cover of trees under drought stress, result in a reduction in simulated canopy SIF. However, these studies are based on crops or single trees with relatively simple canopy structures, and the impact of canopy structure changes under drought stress on SIF in forest canopies with more complex structures remains unclear.
Incident radiation drives photosynthesis and the emission of fluorescence; it is also a crucial factor influencing the drought response of vegetation [27]. Our expectation of SIF is that it reflects physiological values rather than serving as an indicator of canopy structure or incident radiation [29]. To explore the physiological information in respect of SIF in response to drought, it is essential to exclude interference factors such as radiation and canopy structure. Some reflectance-based physical approaches have been explored to decouple the confounding factors of SIF. The normalization of SIF by absorbed photosynthetically active radiation (APAR) provides more direct physiological information by excluding the impact of incoming radiation, but it is affected by canopy structure [30,31]. Zeng et al. (2019) [32] and Liu et al. (2020) [33] proposed the canopy escape ratio (fesc) in the far-red and red bands based on a spectrally invariant theory to eliminate the impact of canopy structure. These methods can rapidly decouple the radiation, structure, and physiological information of SIF, and obtain the fluorescence light use efficiency (ΦF) that represents the fraction of absorbed energy regulated by PQ and NPQ [21,34]. This enhances our understanding of the physiological information in respect to SIF.
The strong coupling between structural and physiological changes is disrupted during the diurnal cycle because plant stomata respond more rapidly to drought stress than canopy structures. Typically, the initial response of most plants to drought is to partially or completely close stomata in the middle of the day to prevent water loss by reducing or stopping stomatal transpiration [35,36]. Stomata may reopen later in the afternoon when water deficits in the internal tissues of the plant are eliminated via root recruitment and transport [37,38]. The phenomenon of a strong decline in plant photosynthesis in the afternoon is termed afternoon depression because the rate of CO2 exchange for photosynthesis is regulated by stomata [39]. Afternoon depression of photosynthesis reflects the physiological response of vegetation to drought stress. Zhang et al. (2023) [40] derived the afternoon and morning ratio (AMR) from satellite SIF as an indicator of afternoon depression to monitor the development of physiological drought stress in vegetation during the 2020 southwest US drought. However, it remains uncertain whether the AMR of tower-based SIF serves as a reliable indicator of drought in plantation forests.
The two peaks of SIF in the red and far-red bands originate from the contributions of different photosystems. Red SIF mainly corresponds to photosystem II (PSII), which is the primary site of photoreactions in photosynthesis, while the far-red SIF corresponds to most of photosystem I (PSI) and a small part of PSII [18,41]. The fluorescence yield of PSI is generally lower compared to PSII and is less sensitive to incident radiation, PQ, and NPQ [17,42]. Therefore, red SIF containing more information about PSII is considered to be more sensitive to environmental stresses than far-red SIF. Nevertheless, whether red SIF has more potential to monitor drought stress in forest ecosystems than far-red SIF needs to be further explored.
Drought stress is usually characterized by low soil moisture and high atmospheric water demand [43]. The response of vegetation physiological processes to drought stress can be quantified using the plant water stress index (PWSI). This index characterizes the combined effects of soil and atmospheric water deficits on plants, and has been proven to be a promising tool for detecting forest ecosystems [44,45]. In this study, PWSI was computed using evapotranspiration (ET) data observed using the eddy covariance system and potential evapotranspiration (PET) simulated by the Shuttleworth–Wallace (S–W) model to define drought stress in plantations. The effect of drought on SIF was analyzed using measurement data for red SIF (F687) and far-red SIF (F760) data from a tower-based SIF observation system in the growing season of 2020 and 2021. This study mainly answers the following questions: (1) What are the temporal dynamics of SIF under drought stress? (2) Is the afternoon depression (AMR) of SIF a reliable indicator for tracking drought stress in a plantation? (3) Is red SIF more sensitive to drought stress than far-red SIF in forests?

2. Materials and Methods

2.1. Site Description

This study was conducted at Henan Xiaolangdi Forest Ecosystem National Observation and Research Station (35°01′45″N, 112°28′08″E, average altitude: 410 m). The station is located in Jiyuan City, Henan Province, in the middle of the Yellow River Basin, with a warm temperate continental monsoon climate. The average annual precipitation was 662.9 mm in 2020, and an extreme precipitation event occurred in July with an average annual precipitation of 1520.9 mm in 2021. The average temperature in the two years, i.e., 2020 and 2021, was 15.8 °C. In this region, seasonal drought can be detrimental to plant growth, especially in May, June, and September. The soil is mainly brown loam, with a thin layer averaging 30 cm in thickness. The Chinese cork oak plantation is 47 years old and a part of the temperate mixed forest, with the main tree species being arborvitae (Platycladus orientalis), locust (Robinia pseudoacacia), and Chinese cork oak (Quercus variabilis var. variabilis). The EC footprint radius in the prevailing wind direction is approximately 1 km. The area and number of cork oak trees account for more than 90% of the footprint. Detailed information in respect of the study site has been presented by Cheng et al. (2022) [46].

2.2. Measurements

2.2.1. Tower-Based Measurements of Canopy SIF (F)

Canopy SIF observation was undertaken using a fluorescence observation system AutoSIF-1 (Bergsun Inc., Beijing, China) installed on a tower platform 10 m above the canopy. The observation system comprised a high-resolution spectrometer (QE65, Ocean Optics Inc., Dunedin, FL, USA) with a sampling interval of 0.155 nm, spectral resolution of 0.31 nm, SNR of 1000:1, and a spectral range of 650–800 nm. Two fibers were connected to the spectrometer via an electronics switcher; a cosine corrector (CC3–3-UV-S, Ocean Optics Inc., Dunedin, FL, USA) installed at the end of one fiber, and a bare fiber with a field of view (FOV) of 25° were used to measure solar downward radiation and canopy upward reflected radiation, respectively. The measurement mode was set to the “sandwich” mode, where the spectrometer first collects solar radiation, then quickly switches the shutter to measure canopy radiation, and finally switches to measuring solar radiation to minimize measurement errors caused by radiation changes. The integration time before each measurement was optimized according to the light intensity. SIF signals were extracted using the spectral fitting method (SFM), and these were automatically output.

2.2.2. Eddy Covariance Flux and Micrometeorology Factor Measurements

An open-path eddy covariance (OPEC) system was installed at 36 m and used to monitor the CO2 and H2O exchange flux between the canopy and atmosphere. The system was composed of an infrared gas analyzer (LI-7500, Li-Cor Inc., Lincoln, NE, USA) and a 3D sonic anemometer (CSAT3, Campbell Scientific Inc., Logan, UT, USA). The high frequency of 10 Hz raw data were recorded using a datalogger (Li-7550, Li-Cor Inc., Lincoln, NE, USA) and then preprocessed using EddyPro software (v.7.0.8, Li-Cor Inc., Lincoln, NE, USA), following which the GPP and ET were calculated.
The meteorological parameters were measured using an automatic weather station (AWS) mounted on the EC flux tower. The AWS consisted of a meteorological gradient observation system that made continuous measurements of precipitation, air pressure, air temperature (Ta), humidity (RH), photosynthetically active radiation (PAR), soil heat, water flux, etc. The vapor pressure deficit (VPD) was calculated using the RH and Ta data:
VPD = 1 RH 100 × 0.611 × e 17.27   ×   T a 237.3   +   T a
The relative extractable soil water (REW) was calculated based on Granier et al. [47] as the ratio of actual extractable water to maximum extractable water:
REW = θ θ w θ F θ w
where θ is the average soil water content of 0~30 cm (cm3cm−3), θF is the field capacity (0.32 cm3cm−3), and θw is the soil water content at wilting point (0.08 cm3cm−3). A value of 0.5 was used as the threshold for the soil water deficit.

2.2.3. The Fraction of Absorbed Photosynthetically Active Radiation (fPAR) Measurements

The fPAR was measured using four linear photon sensors (RR-9753, RainRoot Inc., Beijing, China) with the spectral range 400–700 nm. One of the sensors was installed 3 m above the canopy of the forest, facing towards the canopy, to measure the PAR reflection of the canopy. The other three sensors were installed at different positions below the canopy, facing upwards, at a distance of 2.5 m from the ground and 50–100 cm from the tree body to measure the photosynthetic effective radiation (PARunder) passing through the canopy. The data were collected using a RR1016 data collector (RainRoot Inc., Beijing, China).
PAR = PAR PAR reflect PAR under
f PAR = APAR PAR

2.3. Calculation and Data Analysis

2.3.1. Calculation of PWSI

The plant water stress index (PWSI) was calculated using the evapotranspiration ratio method [48]:
PWSI = 1 ET PET
where ET was measured using the eddy covariance; and PET is the potential ET and was calculated using the Shuttleworth–Wallace (S–W) model. The details of this method are described in Tong et al. (2009) [44].

2.3.2. Calculation of Canopy Structural and Physiological Components

Canopy SIF (F) can be represented as:
F = PAR × f PAR × Φ F × f esc
where F is the canopy SIF, PAR is the incident radiation, and fPAR is a fraction of the absorbed PAR. ΦF is the SIF quantum yield and represents the physiological components of SIF. fesc is the escape ratio of SIF from the canopy, and fPAR and fesc represent the canopy structural components of SIF. The fesc in the far-red band (fesc_far-red) was calculated based on the method of Zeng et al. (2019) [32]:
f esc far red NIRv f PAR
The fesc of the red SIF (fesc_red) was calculated based on the method of Liu et al. (2020) [33]:
f esc red REDv f PAR
where NIRv is the near-infrared reflectance of vegetation and was calculated using the NDVI and near-infrared reflectance, as in Equation (9). Redv is the red reflectance of vegetation and was calculated using the NDVI and red reflectance, as in Equation (10).
NIRv NDVI × r nir
REDv NDVI 2 × r red
where NDVI was calculated as follows:
NDVI = r nir r red r nir + r red
where rnir and rred are the reflectance of the canopy at 758~762 nm and 685~689 nm, respectively.
Thus, Equation (6) can also be expressed as follows:
Far-red SIF (F760):
F 760 = PAR × f PAR × Φ F 760 × f esc far red PAR × f PAR × Φ F 760 × NIRv f PAR PAR × Φ F 760 × NIRv
Red SIF (F687):
F 687 = PAR × f PAR × Φ F 687 × f esc red PAR × f PAR × Φ F 687 × REDv f PAR PAR × Φ F 687 × REDv
Therefore, the radiative, canopy structure, and physiological components of SIF can be decoupled into PAR, NIRv, or REDv, and ΦF, respectively.
According to Equations (12) and (13), ΦF can be calculated as follows:
Far-red ΦF (ΦF760):
Φ F 760 F PAR × NIRv
Red ΦF (ΦF687):
Φ F 687 F PAR × REDv

2.3.3. Quantification of Afternoon Depression

According to a study by Zhang et al. (2023) [40], afternoon depression can be characterized by the afternoon/morning ratio (AMR):
AMR F = F 14 : 30 17 : 00 ¯ F 8 : 00 11 : 00 ¯
AMR Φ F = Φ F 14 : 30 17 : 00 ¯ Φ F 8 : 00 11 : 00 ¯
where F08:00−11:00 and F14:30−17:00 denote the mean F in the morning (8:00–11:00) and afternoon (14:30–17:00), respectively. ΦF08:00−11:00 and ΦF14:30−17:00 denote the mean ΦF in the morning (8:00–11:00) and afternoon (14:30–17:00), respectively.

2.3.4. Data Quality Control and Analysis

We selected the SIF data from 8:30 to 17:00 on the observation days in the growing season of 2020 and 2021, filtered the occasional outliers due to the rapid changes in micrometeorological conditions in the measurement period, and retained data within μ ± 3σ (μ and σ are mean and standard deviation, respectively). The data were resampled using Python 3.7.6 software to obtain the average values at half-hour and daily scales. We excluded the days of rainfall during this period, and data for a total of 207 days were obtained.
Four sunny days in 2020 (DOY136, DOY138, DOY146, and DOY148) were selected to compare the daily variation in SIF in response to drought stress. PWSI was aggregated using 0.05 steps as PWSIbin: we first divided the PWSI according to the intervals [0.00, 0.05), [0.05, 0.10), [0.10, 0.15), … [0.80, 0.85) and then calculated the average value of each interval as PWSIbin. VPD and REW were aggregated in the same way in steps of 0.5 and 0.05 to obtain VPDbin and REWbin, respectively.

3. Results

3.1. Time Patterns of SIF in Response to Drought

3.1.1. Seasonal Patterns of SIF in Response to Drought

Figure 1 depicts the seasonal pattern of the PWSI, NDVI, canopy SIF (F), radiative (PAR), structural (NIRv and REDv), and physiological (ΦF) components of SIF. Figure 1a shows the apparent seasonal variation in PWSI. The PWSI was higher during the wet and dry season transition period (late spring and early summer), and was higher than 0.60 in mid-April–early-May (DOY107-124) and late-May–early-July (DOY148-170) in 2020, and early-May–early-July (DOY125-189) in 2021. The PWSI was also higher than 0.60 in the autumn of 2020. The NDVI was relatively stable over the study period, remaining at 0.76 to 0.91 in 2020 and 0.82 to 0.92 in 2021 (as in Figure 1b). NDVI showed a slight decrease only at the end of the growing season in 2020 when PWSI was high, and did not show significant seasonal dynamics with PWSI at other times. Both red SIF (F687) and far-red SIF (F760) responded to changes in PWSI as shown in Figure 1c,d. From May to June and September of 2020, the fluctuation trends of F687 and F760 were inversely consistent with the PWSI. Both F687 and F760 were high when PWSI was low, while F687 and F760 were low when PWSI was high. Additionally, from May to June of 2021, F687 and F760 showed a continuous decrease during the period of high and stable PWSI. In summer, from mid-July to August 2020 and from late July to August 2021, PWSI remained at a low level, but F687 and F760 decreased, which may be related to the decline in incident radiation (PAR) during this period (Figure 1e). The results of our correlation analysis show that F687 was significantly negatively correlated with PWSI at daily and half-hour scales, while F760 was significantly negatively correlated on the half-hour scale, as shown in Figure 2a,b.
The lower PAR was observed at the beginning and end of the observation period. In particular, the PAR continued to decline in September 2020, which may also result from the decline in both F687 and F760 during that period. Seasonal variations in the canopy structure parameters, REDv and NIRv, exhibited slight differences. REDv remained stable throughout the growing season, while NIRv displayed a continuous downward trend from the beginning to the end of the growing season (Figure 1f,g). Both REDv and NIRv were affected by drought. The results of the correlation analysis are shown in Figure 2. To further explore the effects of drought on canopy structure, other parameters, such as fPAR, fesc_red, and fesc_far-red, were compared in addition to REDv and NIRv. The results show that the canopy structural parameters associated with red SIF, REDv, and fesc_red were affected by drought at both daily and half-hour timescales, whereas the canopy structural parameters associated with far-red SIF, NIRv, and fesc_far-red were only affected by drought at half-hour timescales. Additionally, we found that NDVI was not correlated with PWSI at the daily timescale and was correlated with PWSI at the half-hour timescale at the 0.05 level (p < 0.05), but with a very low correlation of −0.04.
It was observed that the quantum yield of SIF (ΦF), the physiological component of SIF, was higher in the red band (ΦF687) than in the far-red band (ΦF760) (Figure 1g,h). The seasonal pattern of ΦF was closely associated with PWSI; both ΦF687 and ΦF760 decreased correspondingly with increasing PWSI, while they increased correspondingly with decreasing PWSI. The results of the quantitative analysis show that both ΦF687 and ΦF760 were significantly negatively correlated with PWSI at both daily and half-hour timescales, and the correlation coefficients were higher than those of F687 and F760 (Figure 2a,b). Additionally, the correlation coefficient between ΦF687 and PWSI was higher than that of ΦF760.

3.1.2. Diurnal Patterns of SIF in Response to Drought

Figure 3 illustrates four observed days with closed dates but different PWSI levels to compare the diurnal pattern of SIF in response to drought. The ANOVA results indicate no significant difference in REDv and a slight difference in NIRv among these four days in Figure 3b,c. Under low PWSI levels (DOY136), both F687 and F760 exhibited an increase followed by a decrease from morning to afternoon (Figure 3e,f), and this pattern correlated with PAR (Figure 3d). However, this diurnal pattern was less evident for F687 and F760 at high PWSI levels (DOY148). Additionally, PAR remained nearly constant for the four observation days (Figure 3d), while the intensity of both F687 and F760 decreased at the same time of day with increased PWSI. Significant differences in ΦF were observed among the four observation days. At the same time of day, ΦF687 and ΦF760 mostly decreased with the increase in PWSI (Figure 3g,h).
In the diurnal pattern of F and ΦF in response to drought, we found that F and ΦF decreased more in the afternoon than in the morning and midday with increasing PWSI. Figure 4 shows that the extent of SIF (F and ΦF) decreases in the morning, midday, and afternoon. The differences between the three days with higher PWSI levels (DOY138, DOY146, and DOY148) and DOY136 with a lower PWSI were compared. It was observed that the reduction in F and ΦF in the morning, noon, and afternoon did not differ significantly at DOY 138 compared to DOY136. However, the pronounced reduction in F and ΦF in the afternoon became more evident at DOY146 and DOY148. It was found that the afternoon depression of SIF (F and ΦF) emission under drought stress was aggravated with the increase in drought stress level.

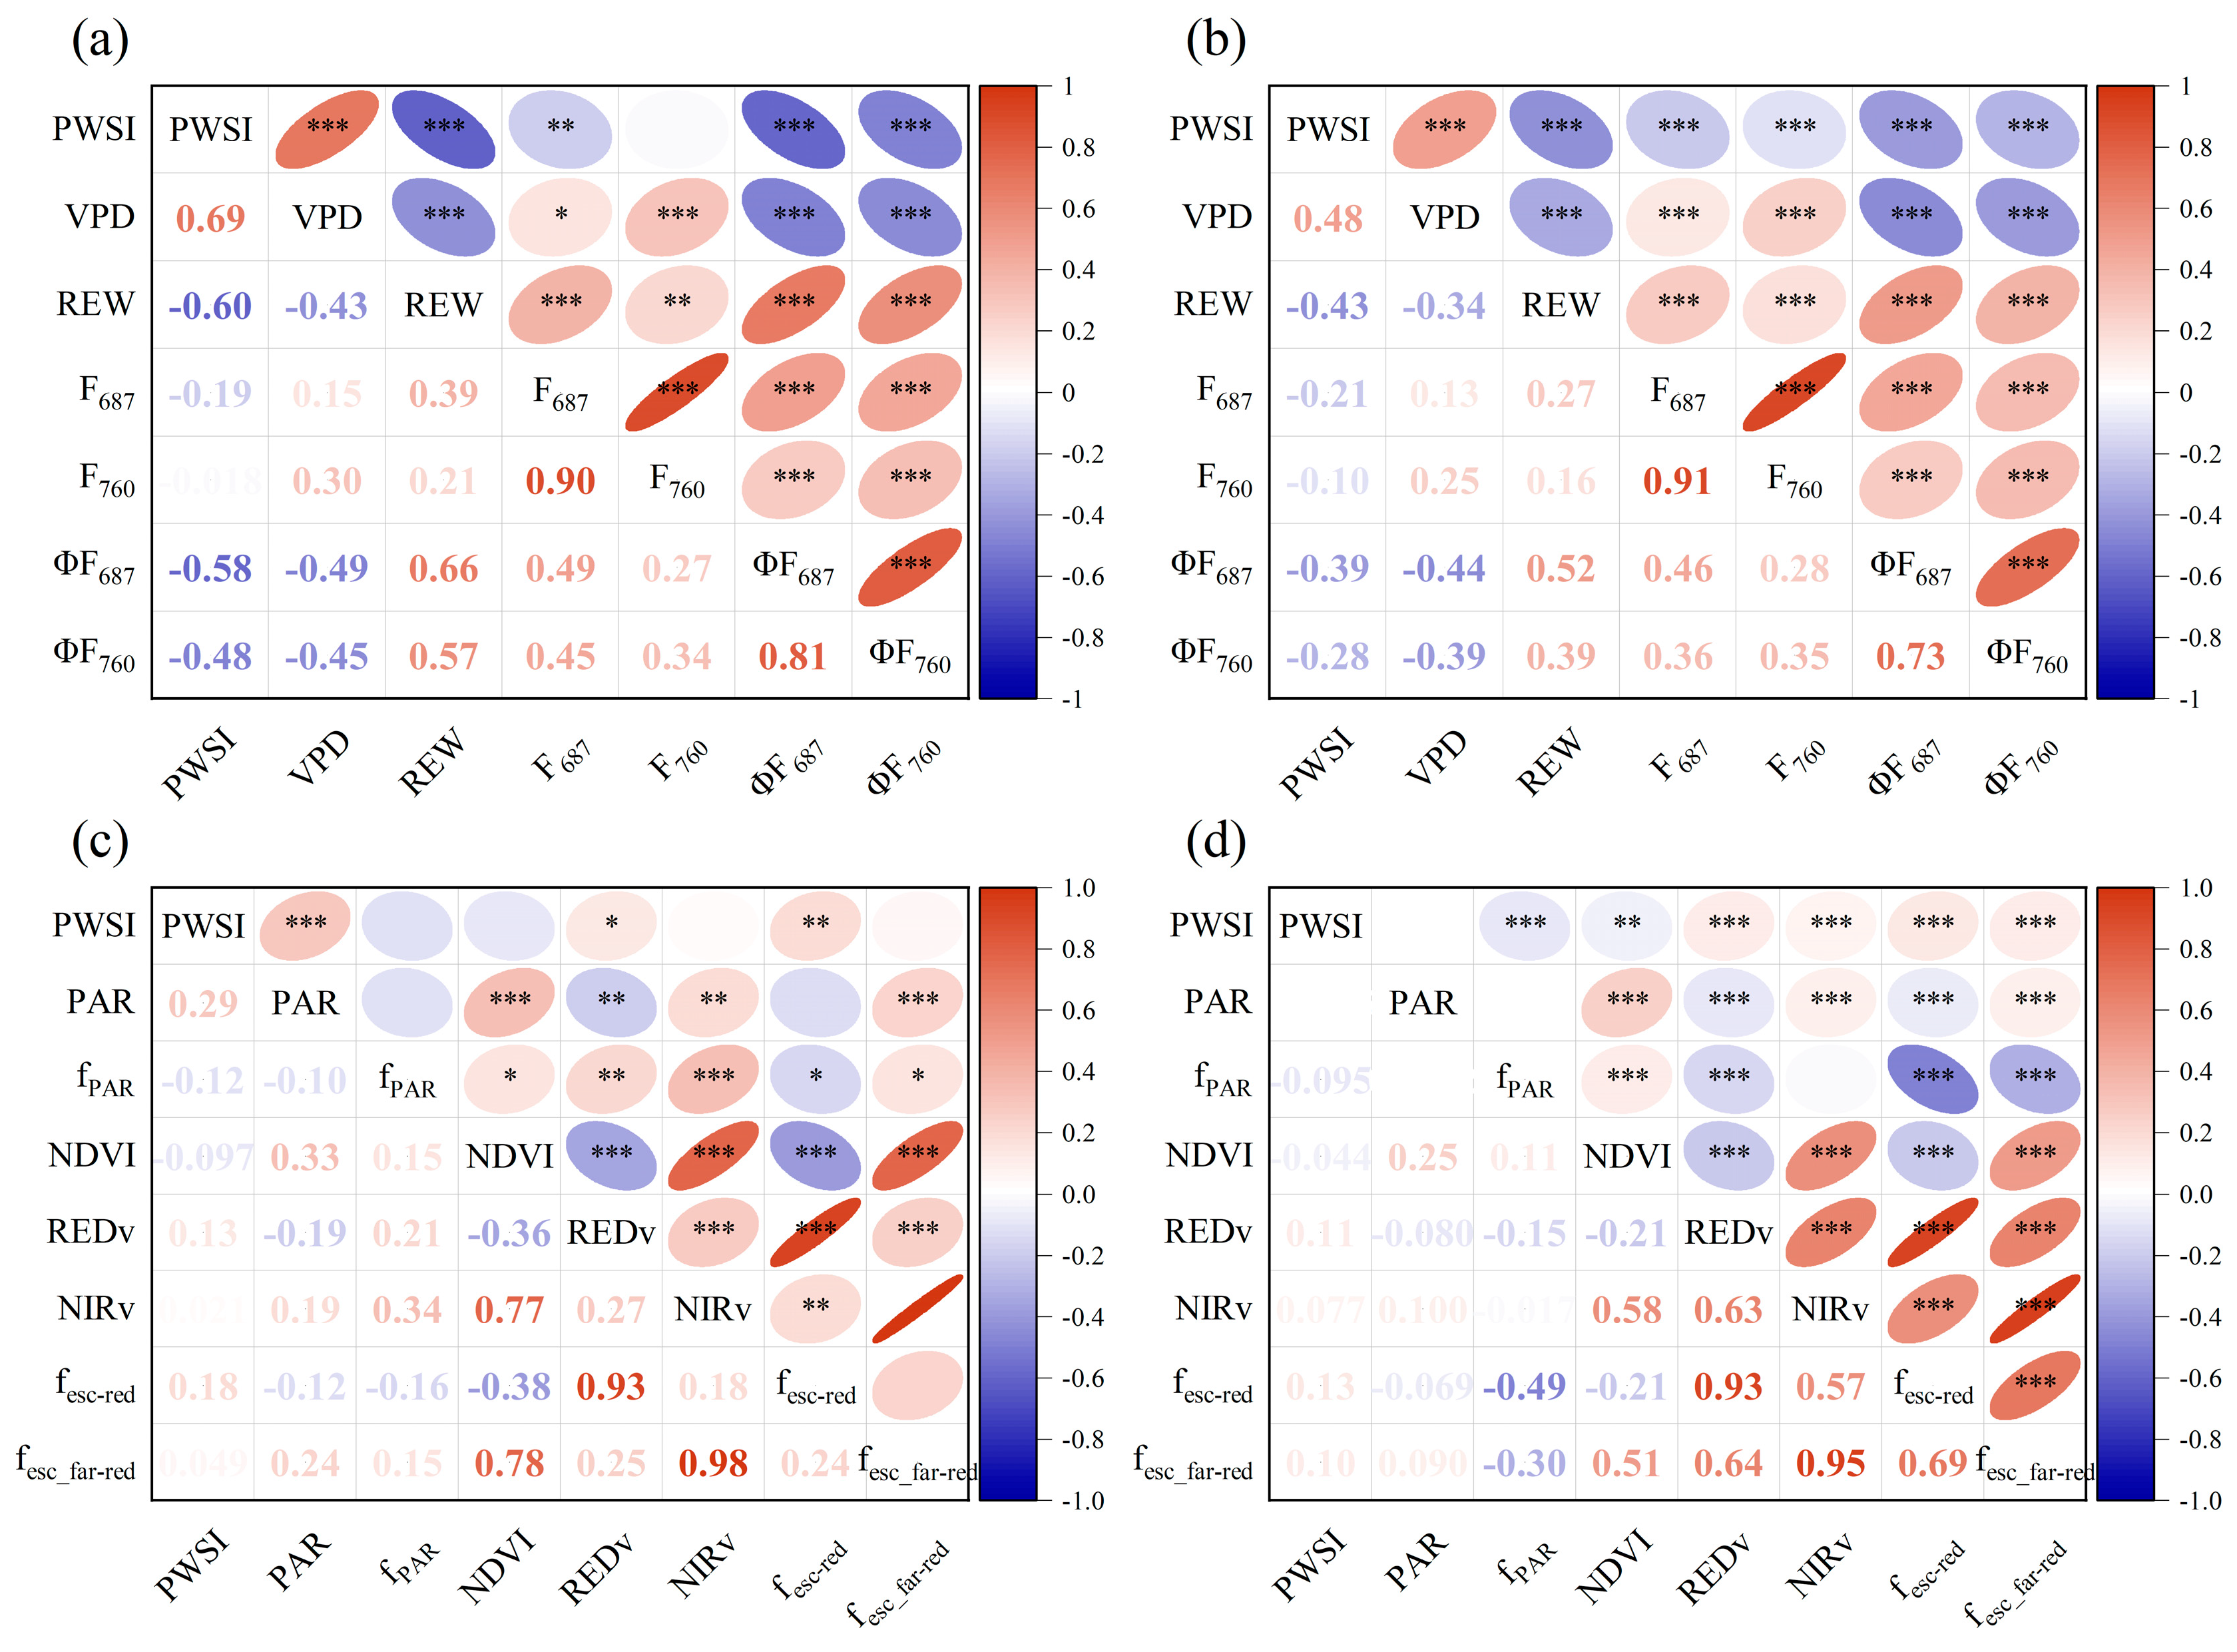
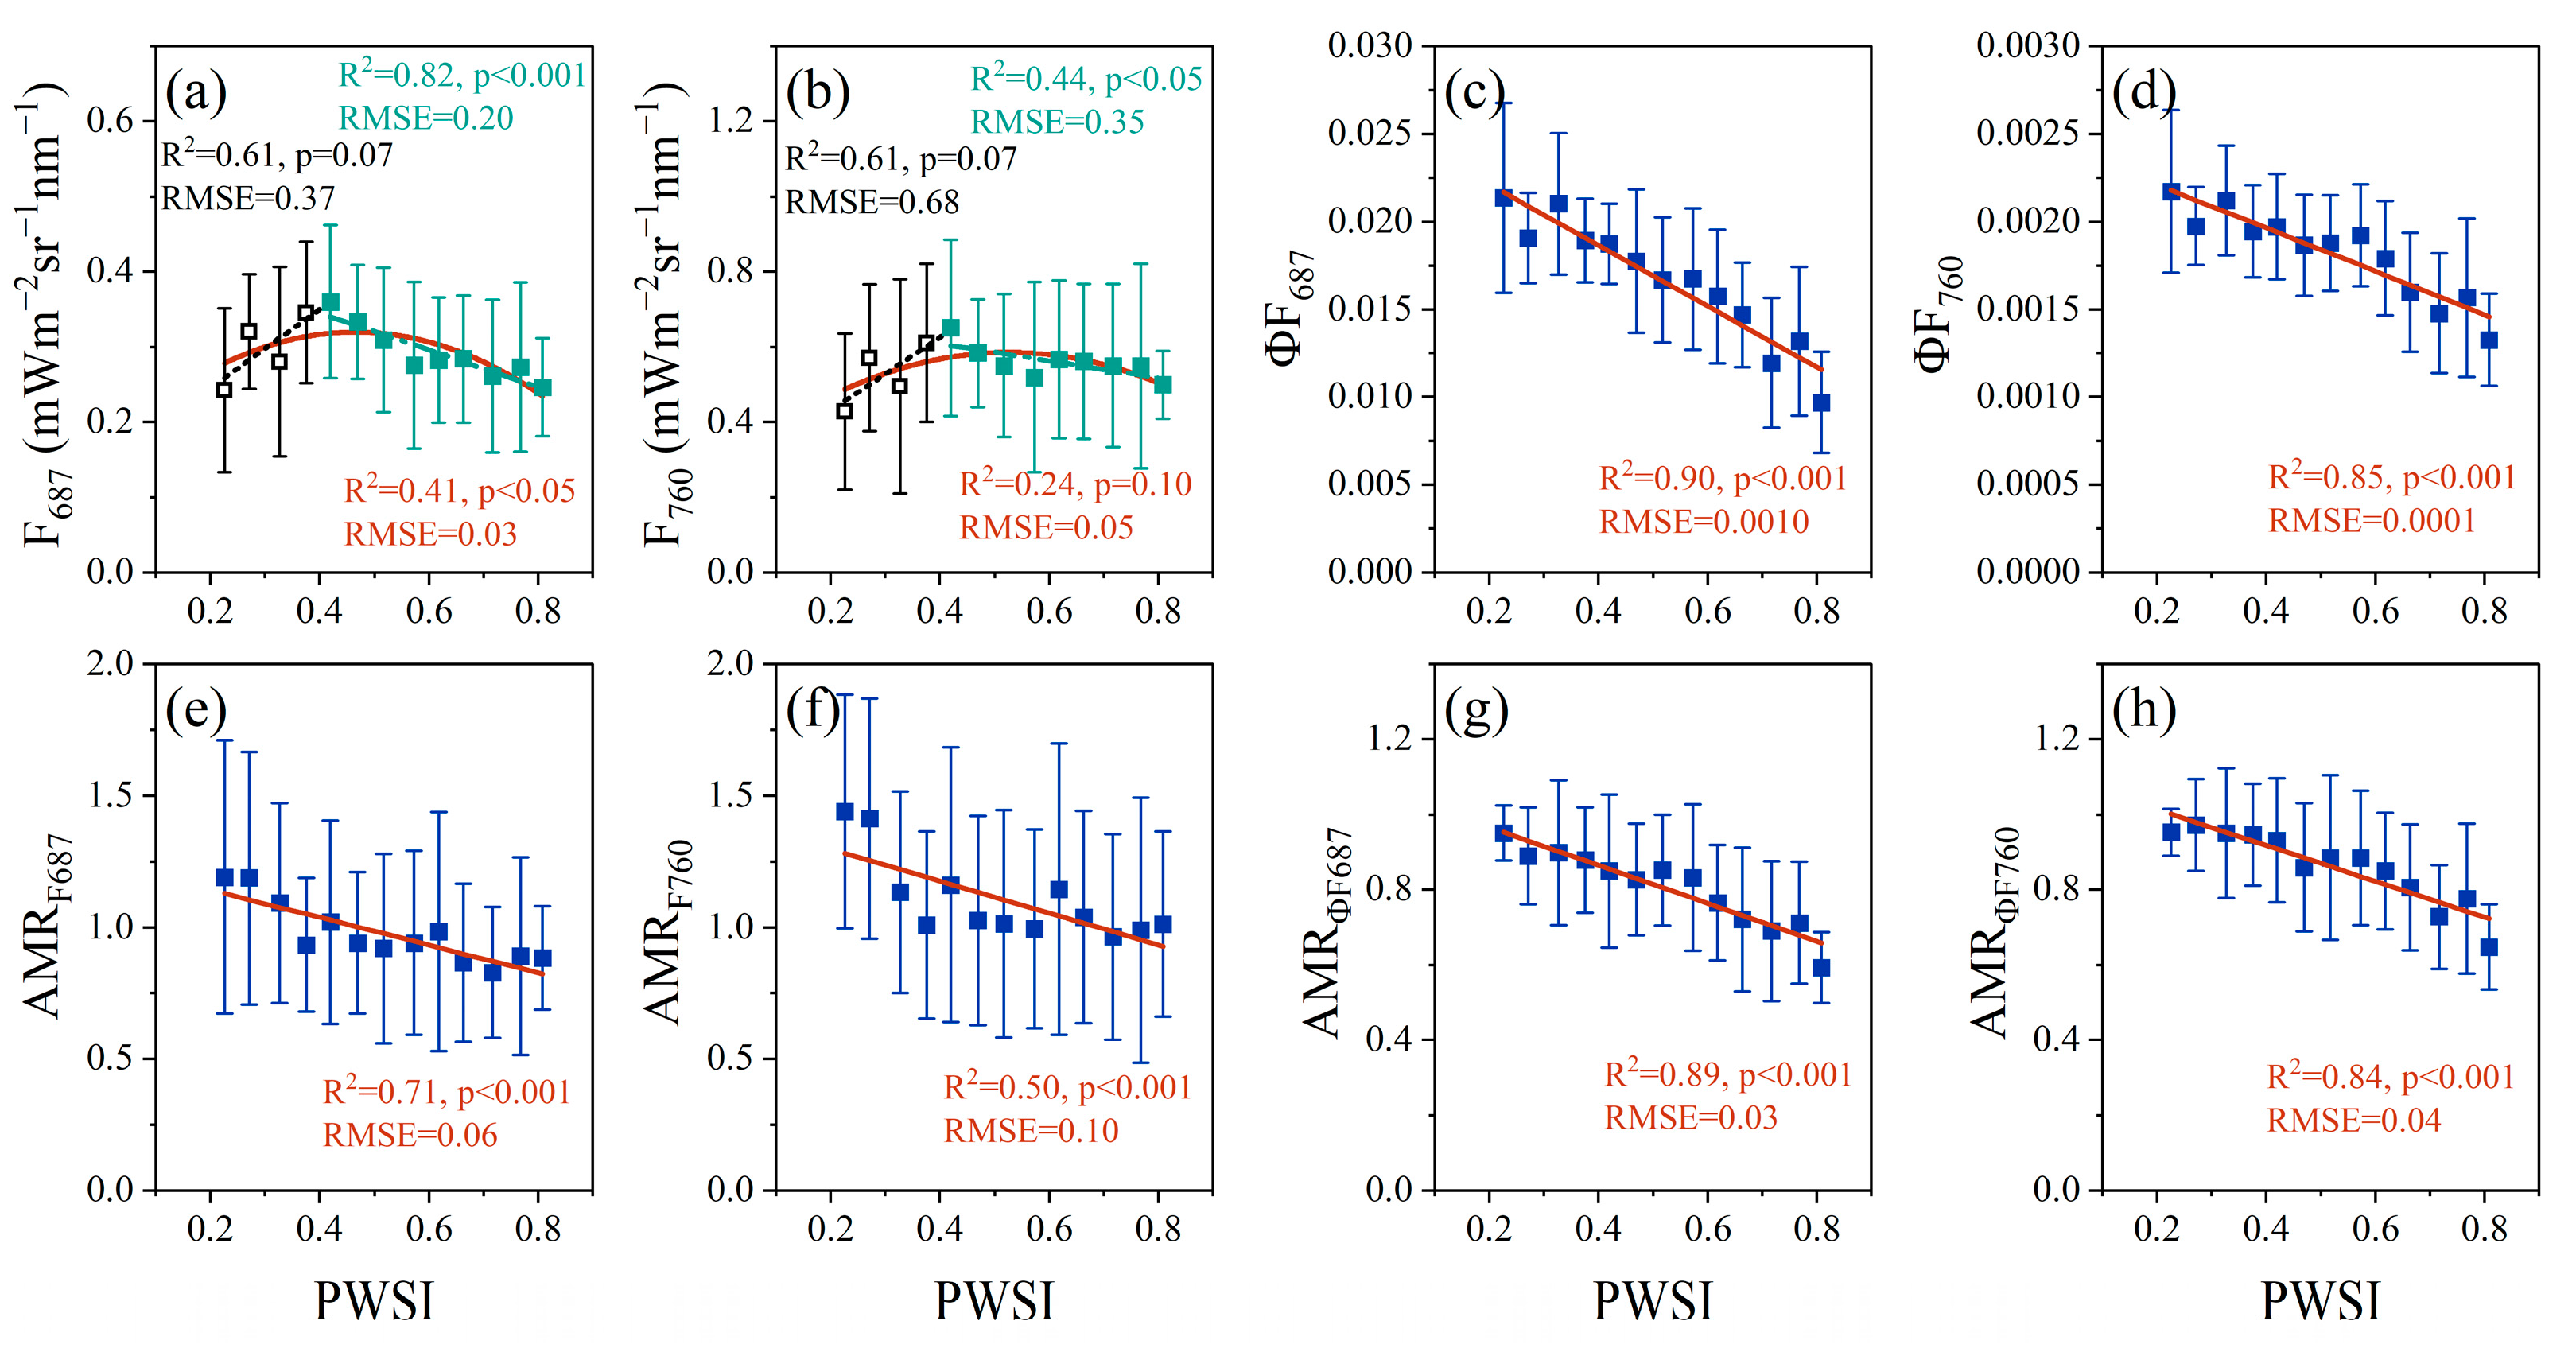
3.2. Relationships between PWSI and F, ΦF, AMRF and AMRΦF

Afternoon depression of SIF is described as the afternoon/morning ratio (AMR) of SIF. Figure 4 depicts the relationships between PWSI and the daily SIF and AMR of SIF. Both F687 and F760 showed a trend of increasing and then decreasing with increasing PWSI, reaching a point at PWSI = 0.42 (Figure 5a,b). When PWSI < 0.42, both F687 and F760 increased with increasing PWSI, but there were no significant linear relationships between F and PWSI. However, when PWSI > 0.42, both F687 and F760 decreased linearly with increasing PWSI. In general, the relationship between F and PWSI was nonlinear. This variation trend of F687 and F760 may be caused by non-physiological factors such as radiation and canopy structure, because the quantum yields of SIF, i.e., ΦF687 and ΦF760, both decreased linearly with increasing PWSI (ΦF687: R2 = 0.90; ΦF760: R2 = 0.85), as shown in Figure 5c,d, indicating that the emission physiology of SIF is sensitive to drought stress.
Both AMRF687 and AMRF760 decreased linearly with increasing PWSI (AMRF687: R2 = 0.71; AMRF760: R2 = 0.50) (Figure 5e,f). The result is consistent with the response of ΦF to PWSI (Figure 4c,d), exhibiting a substantial decrease with increasing PWSI. AMRΦF687 and AMRΦF687 also exhibited significant linear relationships with PWSI (AMRΦF687: R2 = 0.89; AMRΦF687: R2 = 0.84); as shown in Figure 5g,h, the regression coefficient of determination (R2) of AMRΦF was higher than that of AMRF, both in the red and far-red bands.
Differences between red SIF and far-red SIF in response to drought stress were also observed. The sensitivity of red SIF to drought was higher than that of far-red SIF. It was found that there was a higher R2 for F687 and PWSI than that of F760 and PWSI when PWSI > 0.45, and the R2 of the linear relationship between ΦF687 and PWSI was higher than that between ΦF760 and PWSI. Afternoon depression was also stronger for red SIF than for far-red SIF with increasing drought stress levels. AMRF and AMRΦF in the red band had higher R2 values than AMRF and AMRΦF in the far-red band.

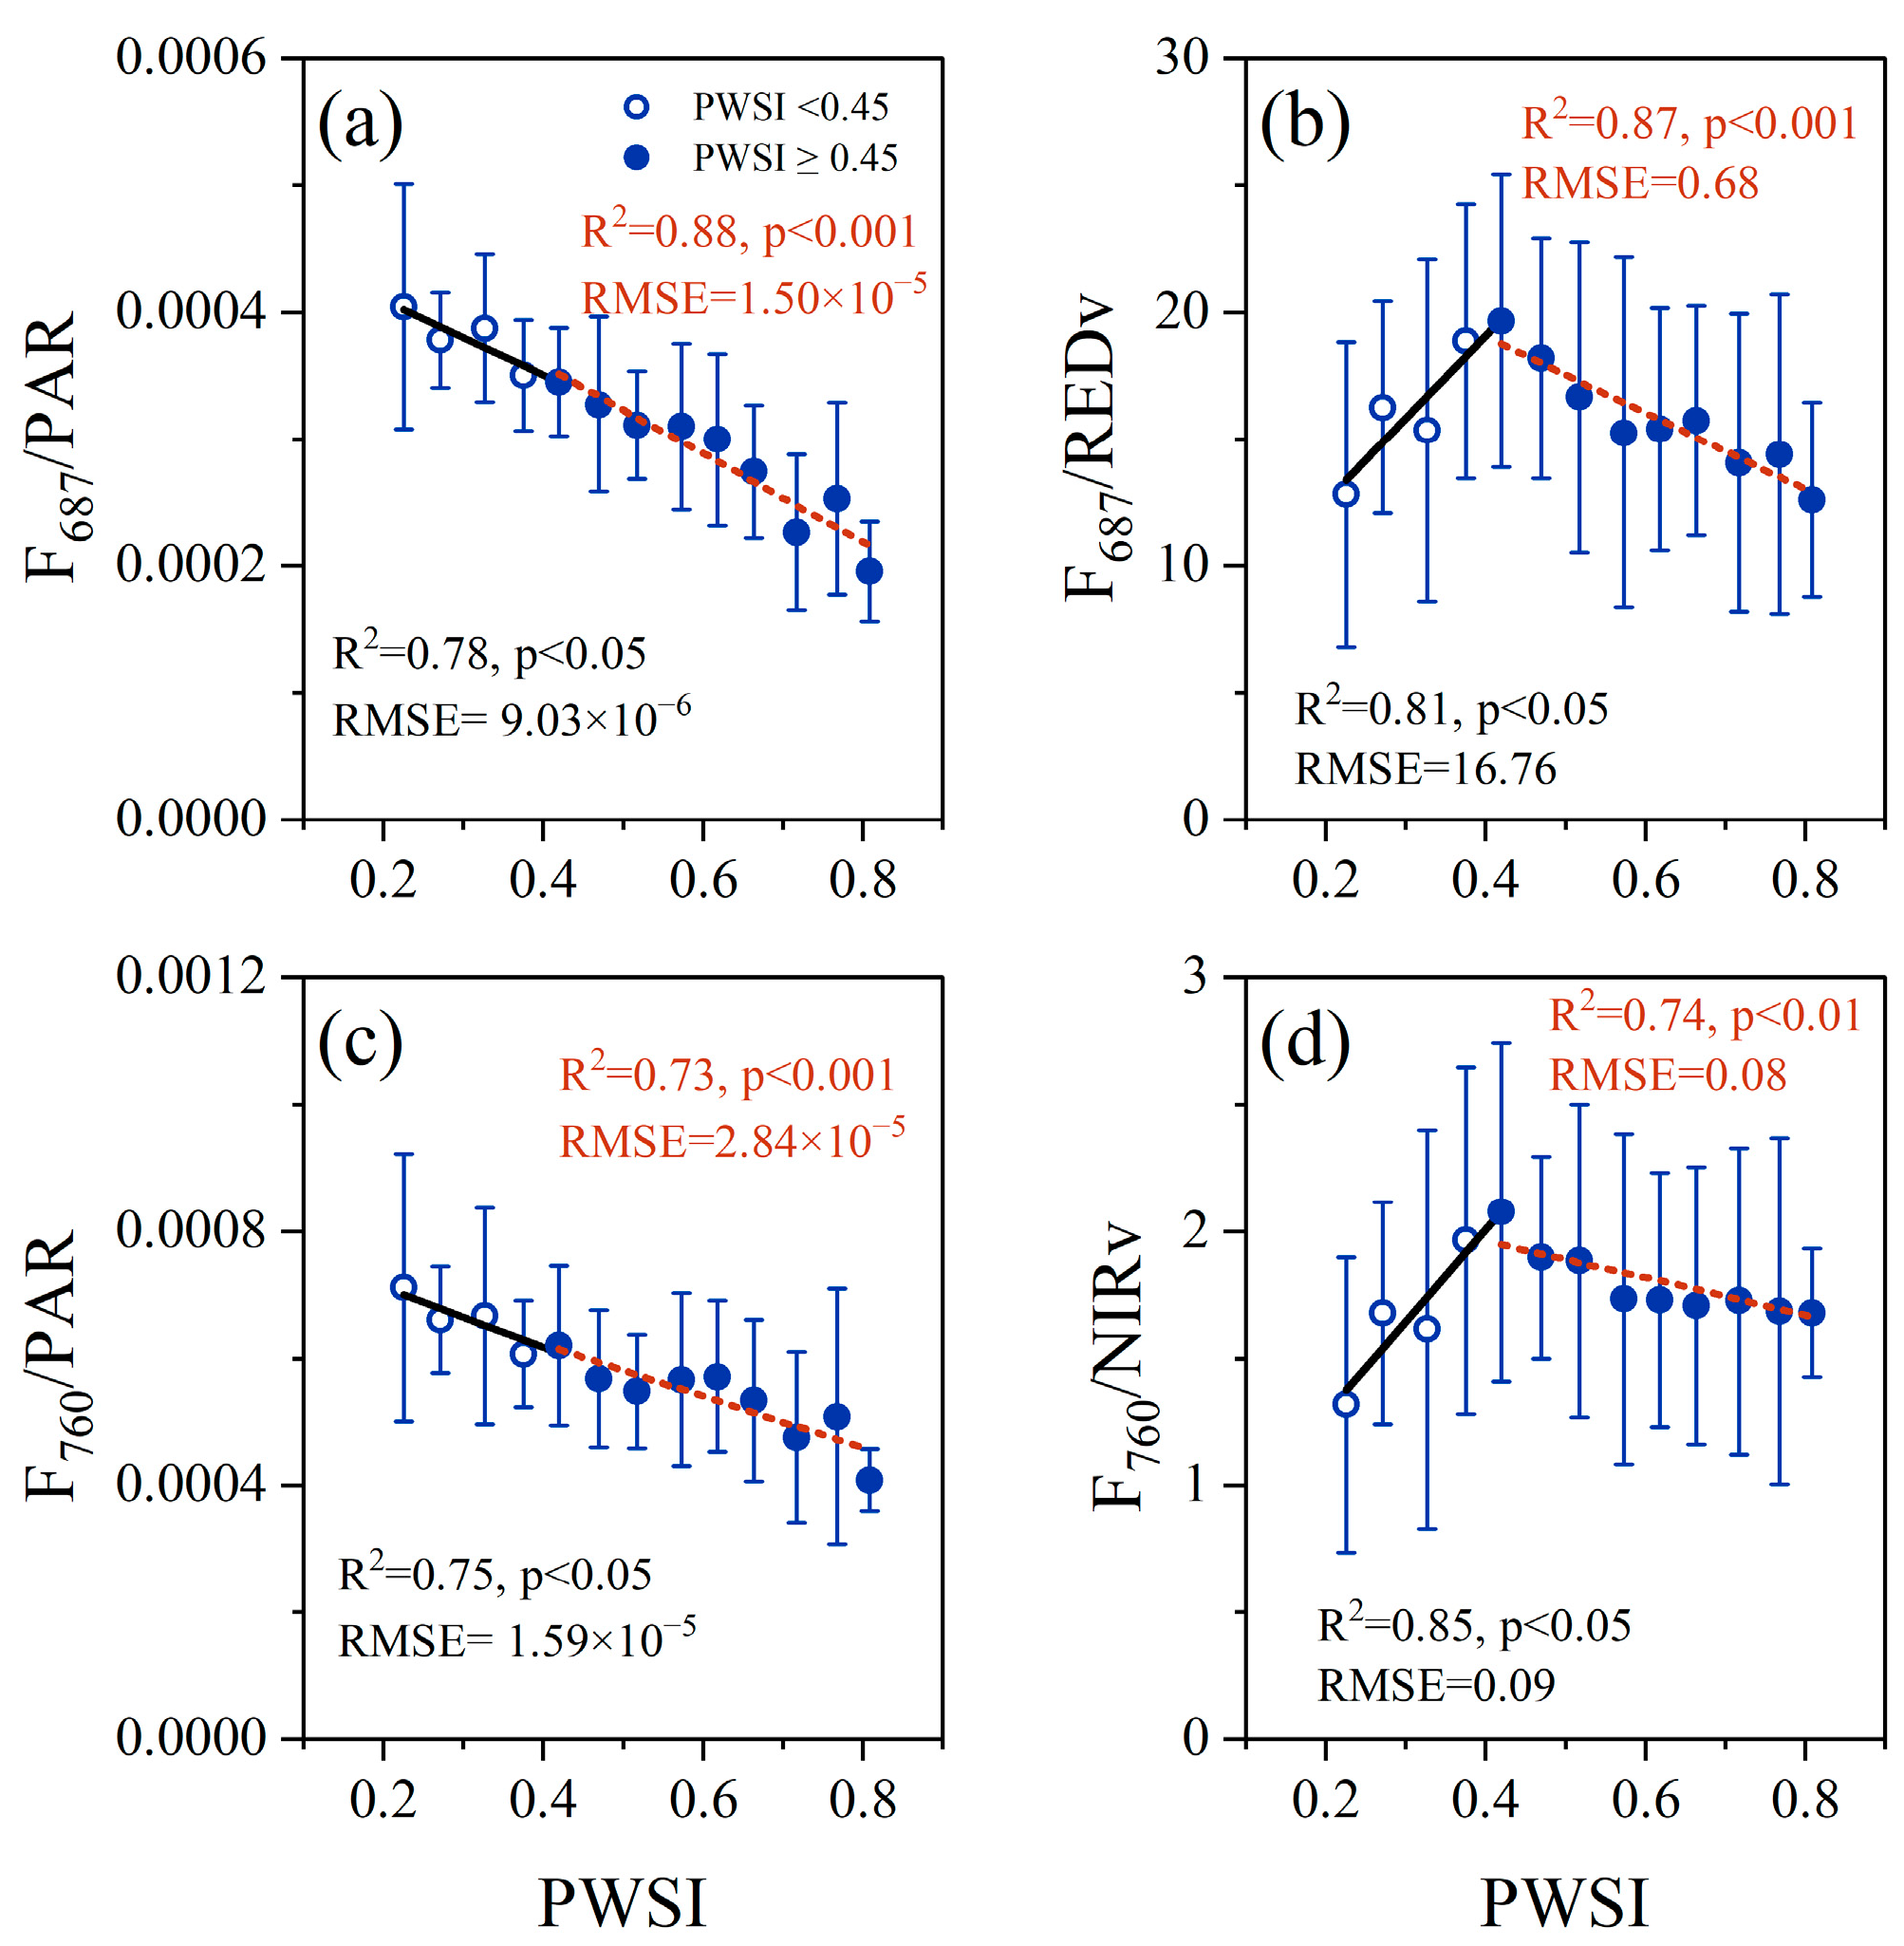
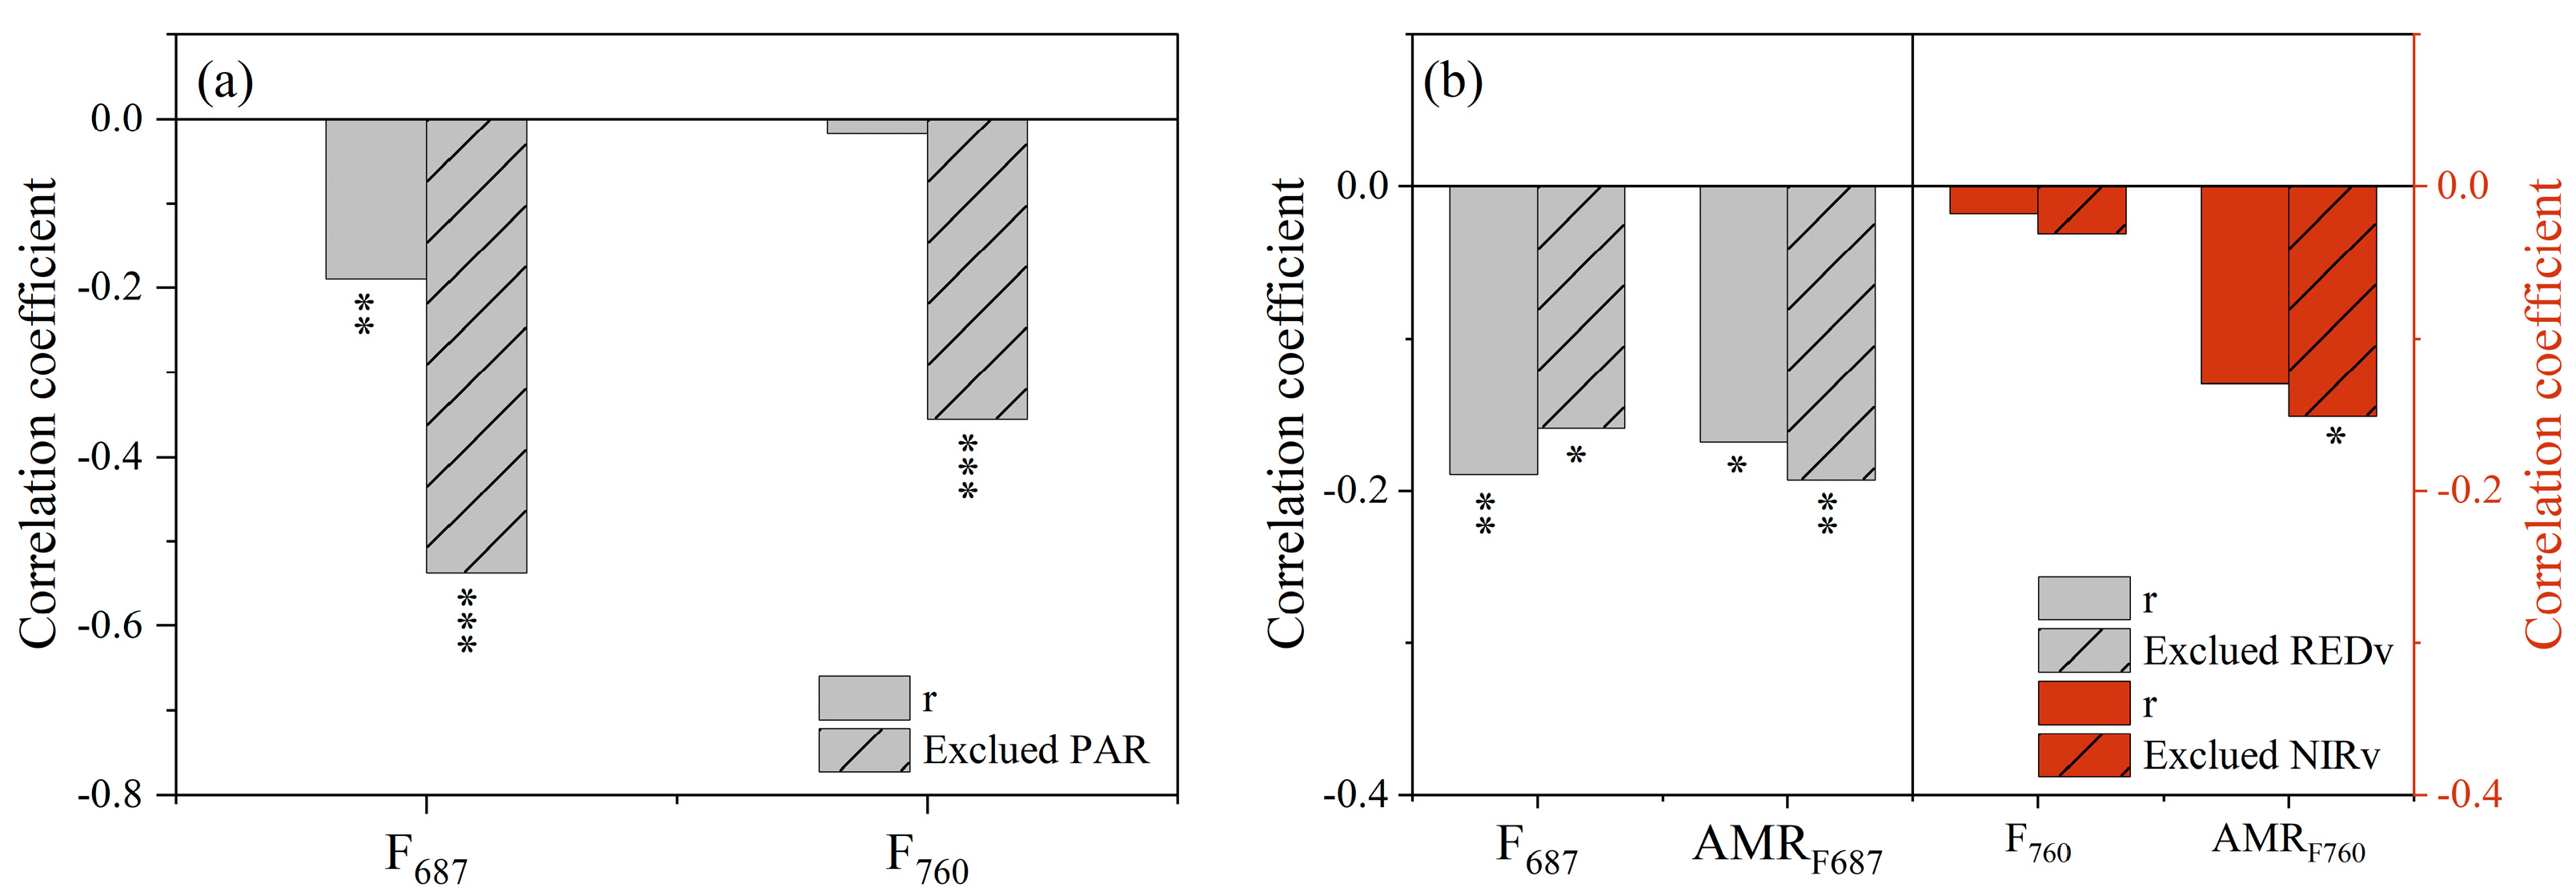
3.3. Effect of Non-Physiologic Factors on the Response of F and AMRF to Drought Stress

Non-physiological factors such as incident radiation (PAR) and canopy structure (REDv or NIRv) were important factors affecting canopy SIF. The correlation coefficients between red SIF (F687) (r = 0.66) and far-red SIF (F760) (r = 0.73) and PAR were more than 0.6, as shown in Figure 6a. Both F687 and F760 were also significantly correlated with canopy structural parameters, with F687 negatively correlated with REDv (r = −0.29) and F760 positively correlated with NIRv (r = 0.47), as shown in Figure 6b. It was found that radiation is an important factor causing the nonlinear response of F to PWSI at the daily scale (Figure 5a,b). Excluding the effect of PAR, both F687/PAR and F760/PAR consistently decreased with increasing PWSI, as shown in Figure 7a,c. Compared with F, when PWSI < 0.42, F687/PAR and F760/PAR showed significant negative linear relationships with PWSI (F687/PAR: R2 = 0.78; F760/PAR: R2 = 0.75). Moreover, when PWSI > 0.42, F687/PAR and F760/PAR (F687/PAR: R2 = 0.88; F760/PAR: R2 = 0.73) were also more sensitive to PWSI than F687 and F760 (F687: R2 = 0.82; F760: R2 = 0.44), respectively. Canopy structure also affected the sensitivity of F to PWSI at the daily scale. When PWSI > 0.42, F687/REDv, which excluded the influence of canopy structure on red SIF, was more sensitive to PWSI (R2 = 0.87) than F687 (Figure 7b). The same was true for the far-red SIF, and the R2 of F760/NIRv with PWSI (R2 = 0.74) was also higher than F760. However, when PWSI < 0.42, F687/REDv and F760/NIRv still increased with increasing PWSI (Figure 7d). The results of partial correlation analysis between F and PWSI show that the correlation coefficient was significantly improved after controlling for PAR. It was found that after controlling for PAR, the correlation coefficients of F687 and F760 with PWSI increased substantially, both at the daily scale (increasing by 0.34 and 0.35, respectively), as shown in Figure 8a. However, after controlling for REDv, the correlation between F687 and PWSI decreased by 0.03. The radiation factor had a more significant effect than the canopy structure factor on the response of F to PWSI. Therefore, we believe that the radiation factor had a more significant effect than the canopy structure factor on the response of F to PWSI.
The AMR of SIF (AMRF) prevented the incident radiation effect and was not affected by PAR, as shown in Figure 6a. The effect of canopy structure on AMRF is shown in Figure 6b. The correlation between REDv and AMRF687 turned from negative in F687 to positive, but the significance level and quantitative relationship decreased (significance level from p < 0.001 to p < 0.05, correlation value from 0.29 to 0.14). Additionally, the correlation coefficient of NIRv and AMRF760 compared to that of NIRv and F760 decreased by 0.11. The results of partial correlation analysis between AMRF and PWSI when controlling for canopy structure show that the correlation coefficients of both AMRF687-PWSI and AMRF760-PWSI were improved after controlling for REDv and NIRv, respectively, as shown in Figure 8b, indicating that canopy structure also contributed to the response of AMRF to PWSI.

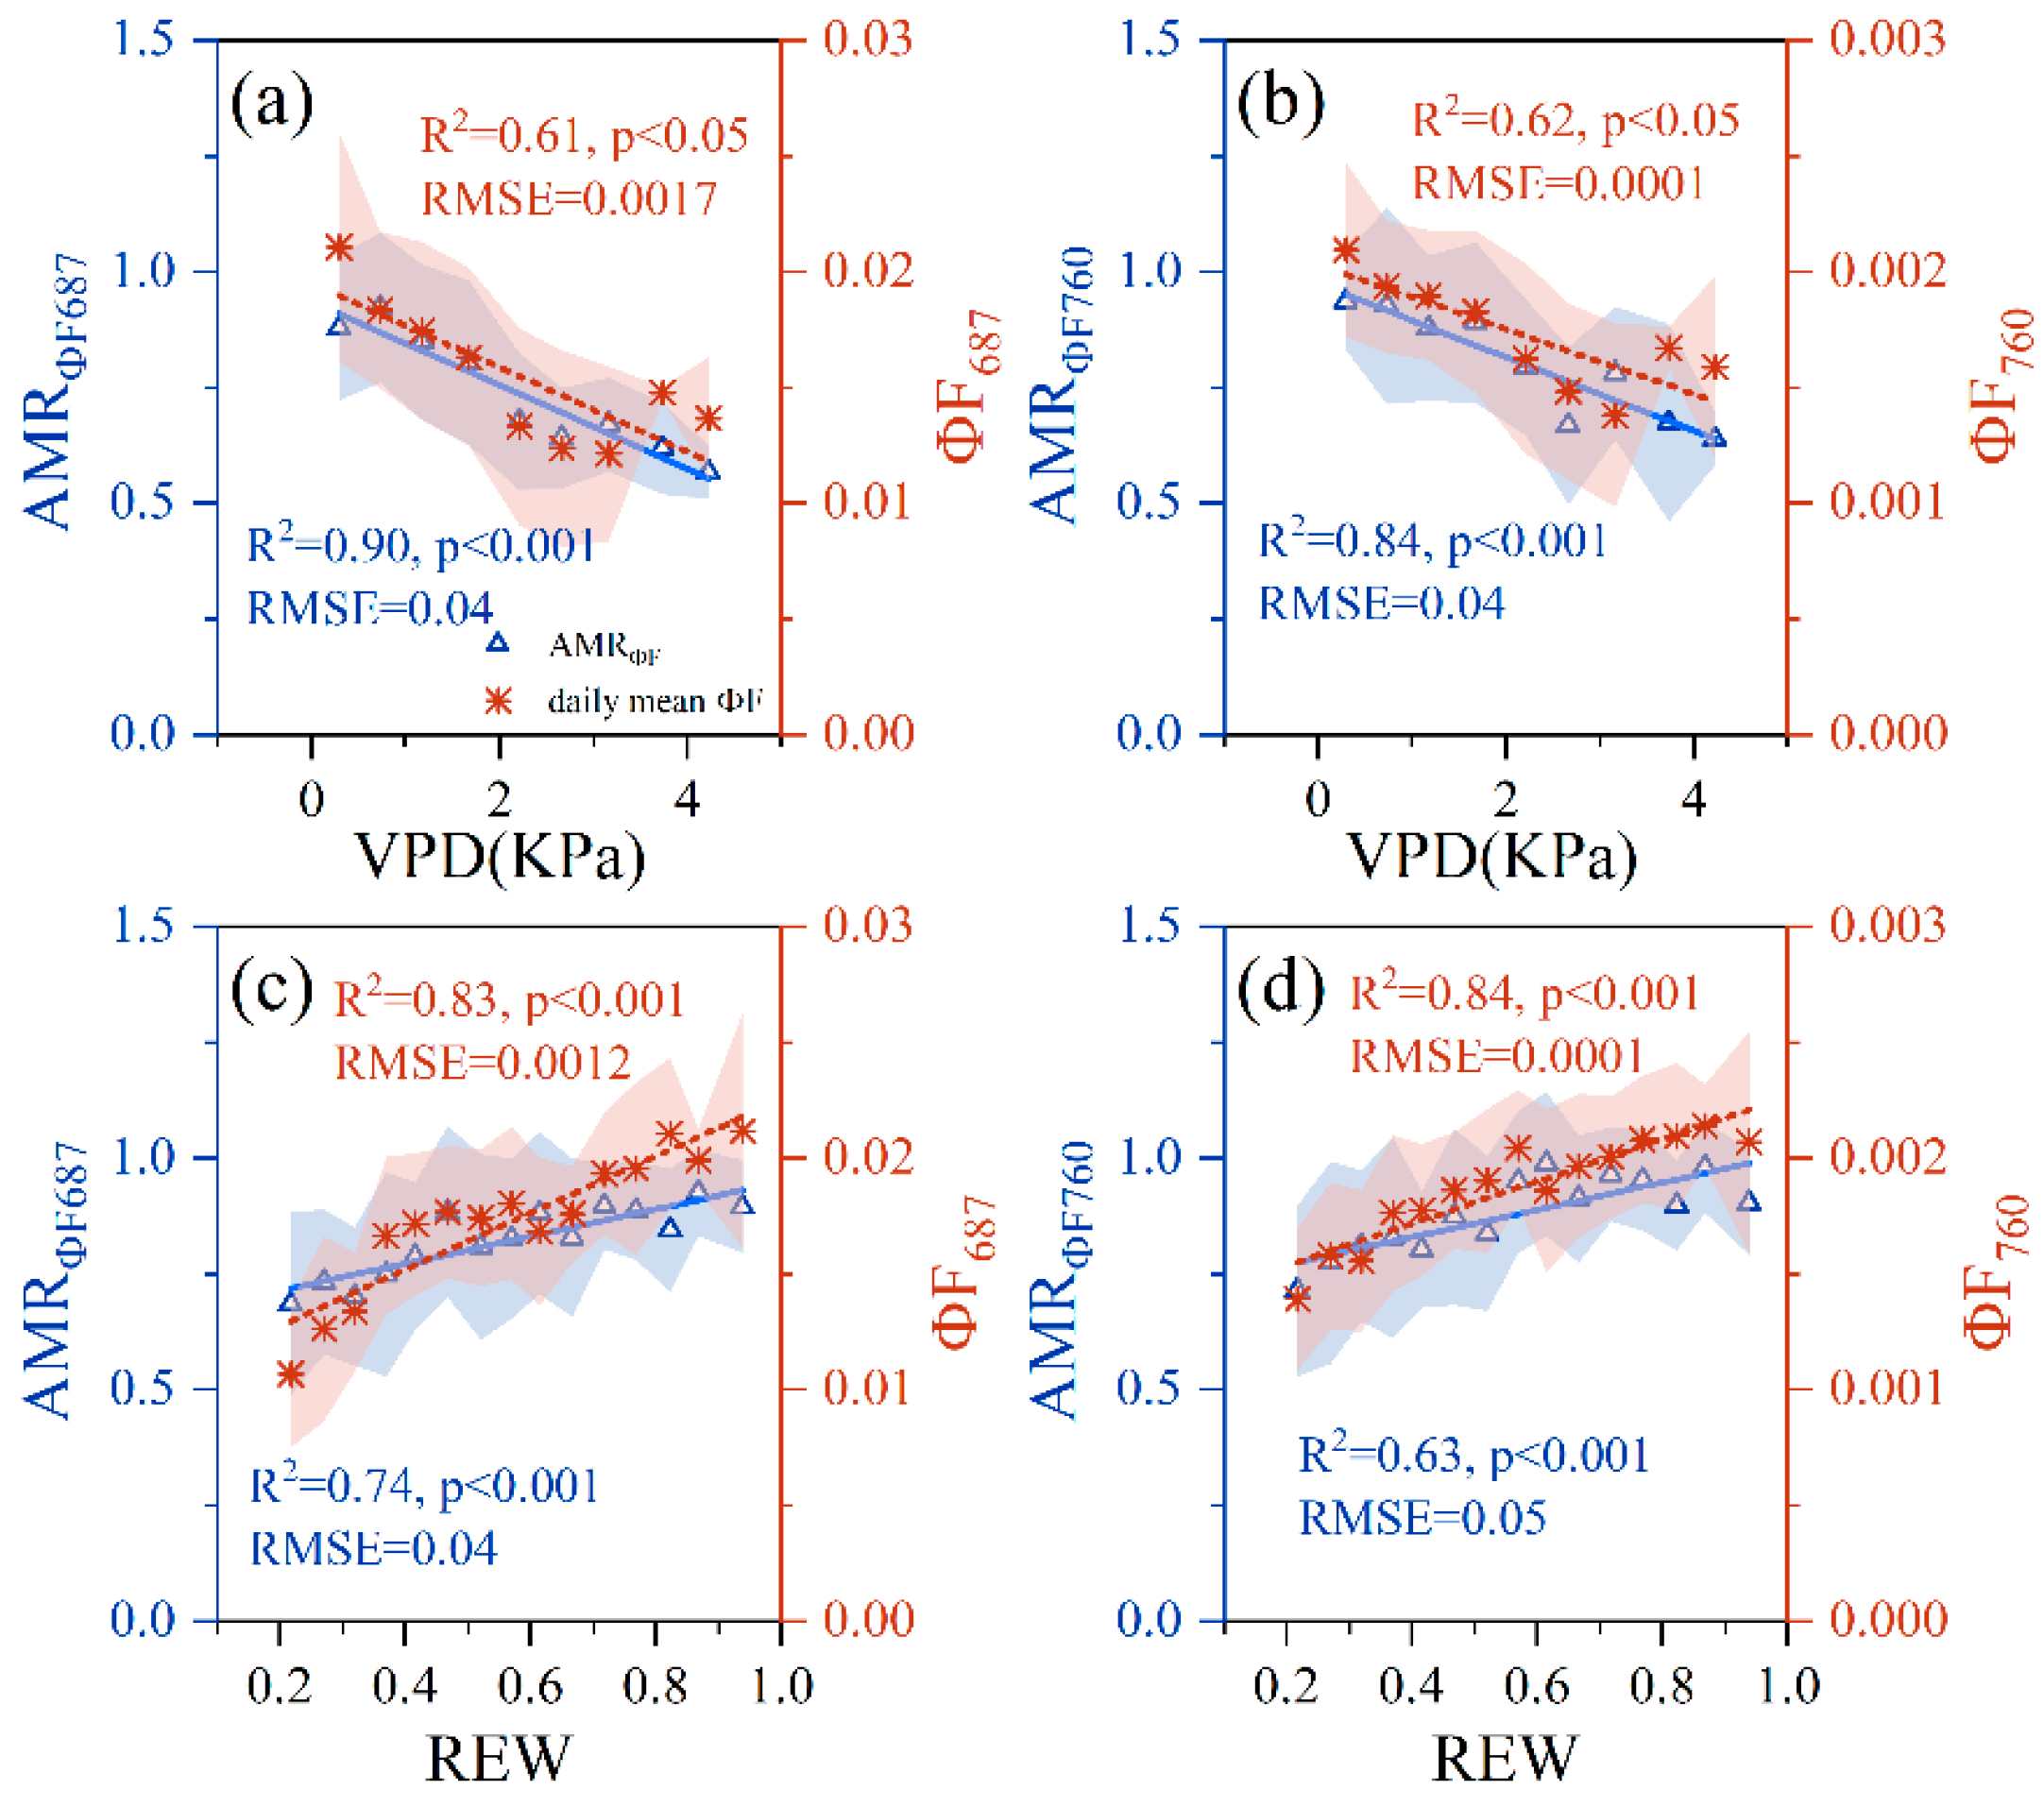
3.4. AMRΦF Can Track the Physiological Response to Drought

As a physiological component of SIF, ΦF was still partially affected by canopy structure (see Table 1). However, the correlation coefficients between AMRΦF and canopy structural parameters were lower than those between ΦF and canopy structural parameters. This indicates that AMRΦF was less affected by canopy structure than ΦF and contained more physiological information in response to drought.
The intense evaporation of atmospheric water (VPD) and the depletion of soil water (REW) are the main factors inducing drought stress. The correlation coefficients between PWSI and VPD and REW were 0.69 and −0.60 on the daily scale, respectively (Figure 2a). Both ΦF and AMRΦF had good negative linear relationships with VPD, as shown in Figure 9a,b. Although ΦF could capture more than 60% of the variation in VPD, AMRΦF could capture more than 84% of the variation in VPD (AMRΦF687: R2 = 0.90; AMRΦF687: R2 = 0.84). AMRΦF in the same band was less sensitive to REW than ΦF, as shown in Figure 9c,d, but AMRΦF still captured more than 63% of the REW variation (AMRΦF687: R2 = 0.74; AMRΦF687: R2 = 0.63). The results indicate that AMRΦF also had good robustness in tracking changes in VPD and REW, and because it contains more physiological information, AMRΦF can track physiological responses to drought stress. Additionally, the results show that the AMRΦF687 was more closely related to both VPD and REW (VPD: R2 = 0.90; REW: R2 = 0.74) than the AMRΦF687 (VPD: R2 = 0.84; REW: R2 = 0.63). Therefore, red AMRΦF is a good indicator for tracking drought stress in plantations.

4. Discussion

Photosynthesis is restricted by both stomatal and non-stomatal responses during drought stress, leading to a decrease in photosynthetic parameters. Plant stomata and metabolism respond to drought stress in an incredibly rapid manner. Plant stomatal responses optimize the amount of carbon gained per unit of water loss almost instantaneously [39]. Evapotranspiration (ET) can well reflect the response of vegetation stomatal behavior to drought stress at the canopy level. In our results, the observed actual evapotranspiration (ET) was lower than the potential evapotranspiration (PET) as shown in Figure S1, which was realistic. The relative difference between ET and PET was observed when PET maintained a relatively stable or high seasonal dynamics and ET exhibited a decreased or lower state, and this difference was most pronounced during the wet and dry season transition period (late spring and early summer). Therefore, PWSI calculated based on ET and PET can well reflect the stomatal behavior of vegetation and was an effective drought indicator of the physiological state of vegetation.

4.1. Physiological and Non-Physiological Effects on SIF Response to Drought

We observed that the seasonal fluctuations in F687 and F760 exhibited an opposite trend compared to PWSI fluctuations in late spring and early summer (Figure 1a,c,d). With the increase in daily drought stress levels, the diurnal patterns of F687 and F760 also changed; that is, lower values at the same time were observed in Figure 2e,f. These results are consistent with Liu et al. [24], who found that drought stress induced SIF emission reduction. Additionally, we noted that the SIF quantum yield (ΦF687 and ΦF760) exhibited strong responses to drought stress on the diurnal cycle when there were no significant differences in canopy structure and radiation (Figure 3). These results align with previous findings indicating that the response of F to drought stress is dominated primarily by physiological effects rather than non-physiological effects [27]. However, the relationship between F and PWSI was not linear, with a cut-off point of 0.42 (Figure 5a,b). Only when the level of drought stress was higher (that is, PWSI was greater than 0.42) did the response of F to PWSI show a linear negative response. ΦF still showed a strong negative linear relationship with PWSI (Figure 5c,d). We propose that variations in non-physiological effects, such as radiation and canopy structure, contribute to the nonlinear response of SIF to PWSI.
Our results demonstrate the close relationship between F and incident radiation (PAR) (Figure 6a). This was due to the fact that PAR drove photosynthesis and SIF was a product of PAR (APAR) absorption by chlorophyll [16,26,49]. The relationship between F and PWSI was almost linear after excluding PAR in our results (Figure 7a,c), and the partial correlation coefficient between F and PWSI controlling for PAR was also significantly improved (Figure 8a). These results demonstrate that PAR was the primary factor interfering with the SIF response to drought. Moreover, drought stress led to a disproportionate response of F to PAR within a diurnal cycle (Figure 3d–f); the increase in R2 of F/PAR-PWSI after excluding disturbances from PAR was greater than the increase after excluding disturbances from canopy structure (F/NIRv or F/REDv) when PWSI > 0.42 (Figure 7).
Earlier studies have reported that the reduction in SIF under drought also depends on the canopy structure [28,50]. Canopy structural parameters such as NIRv or REDv were significantly correlated with F in the red or far-red bands (Figure 6b) because the observed F was a fraction of the total F emitted by chlorophyll escaping from the canopy [32]. Consequently, changes in canopy structure induced by drought stress can also indirectly affect changes in canopy SIF. The short-term drought in this study did not have significant effects on canopy structure, such as leaf area index and clumping index, because parameters like fesc_far-red and NIRv, involved in canopy scattering effects, were not correlated with PWSI on the daily scale (Figure 2c). However, parameters like fesc_red and REDv, involving the red SIF reabsorption effect, responded to drought stress, indicating that drought affected leaf chlorophyll content. Hence, canopy structure makes a non-negligible contribution to the reduction in SIF, particularly red SIF. Additionally, our study utilized reflectance-based spectral index methods to correct for red and far-red canopy effects. Although these methods were initially developed for crops with simple canopies, they have been successfully applied to structurally complex forest canopies in our results. Researchers have developed more accurate SIF decoupling methods based on radiative transfer models, such as SCOPE and DART, but data acquisition using these methods is more complicated.

4.2. Rationale for Afternoon Depression of SIF in Response to Drought

An advantage of ground-based SIF is its higher temporal resolution, allowing for the real-time and fine-grained observation of the complete photosynthetic daily cycle from sunrise to sunset. In the drought response of vegetation, stomatal response is more instantaneous and frequent than the non-stomatal response, especially in short-term seasonal drought monitoring. When suffering from drought stress, plants typically partially or fully close stomata in the middle of the day to reduce or cease stomatal transpiration, preventing water loss. Stomata regulate photosynthesis by controlling CO2 exchange, hence photosynthesis exhibits midday depression [38,39]. Several studies have emphasized the significance of midday depression in photosynthesis. Xu et al. (2018) [51] observed the diurnal pattern of SIF in response to drought and concluded that SIF around midday performed best in monitoring drought. Liu et al. (2023) [52] proposed the noon-to-morning ratio (NMR) of SIF to track the characteristics of SIF response to soil drought. In comparison with simple intra-day time aggregation, the NMR can overcome the limitations of different growth stages and is more physiologically meaningful and reliable. Our results also identified a robust response of SIF to drought at noon, with an even stronger response of SIF in the afternoon. This is because stomata reopen in the afternoon when water deficits in the internal tissues of the plant are eliminated via root recruitment and transport [37]. Stomatal reopening in the afternoon is more sensitive to drought than stomatal closure around midday, and the severity of drought influences the timing and degree of stomatal opening in the afternoon.
Additionally, plant photosynthesis is positively driven by PAR, which was present symmetrically in the afternoon and the morning in our study (Figure 3d). Theoretically, in the absence of stress or under mild stress, the net photosynthetic rate in the afternoon is similar to that in the morning over a diurnal cycle [38]. Our results show that at low levels of stress (DOY136 and DOY138), the diurnal trend of F tends to be symmetrical in the morning and afternoon. Drought stress breaks this symmetry and results in afternoon depression. At higher levels of stress (DOY146 and DOY148), F decreased more in the afternoon than in the morning (Figure 4a,b). This intraday variation in photosynthesis is determined by stomatal behavior. AMR is an indicator of afternoon depression and is applied to drought monitoring [40]. Our results show that AMRF had a strong linear relationship with PWSI (Figure 5e,f). This result was attributed to the fact that afternoon depression of SIF captures photosynthetic changes from a stomatal perspective, and AMR was less affected by canopy structure and radiation interference, as shown in Figure 6. Considering the limitations of the physiological compositional coupling approach, we contend that AMRΦF contains more physiological information than ΦF (Table 1). Although the relationship between AMRΦF and PWSI was slightly less significant than that between the daily average ΦF and PWSI, we still believe that AMRΦF is more sensitive to drought stress than the daily average ΦF, and it is a good indicator of drought stress. Additionally, stomatal opening and closing are regulated by vapor pressure difference (VPD), and high VPD also inhibits the reopening of stomata in the afternoon. As AMR takes into account physiological changes in stomatal response, AMRΦF was more sensitive to VPD than ΦF (Figure 9a,b). Soil moisture content (REW) is an important factor affecting stomatal opening and closing in the afternoon. REW explained more than 63% of the variation in AMRΦF (Figure 9c,d). The results, indicating sensitivity to atmospheric and soil drought, suggest that AMR is robust in detecting drought. Furthermore, our results demonstrate that the afternoon depression of tower-based SIF can be used to capture drought stress in forest ecosystems.
Due to the importance of vegetation indices in drought monitoring, we explored the performance of NDVI in drought monitoring. There was no significant correlation between NDVI and PWSI on the daily timescale, and there was a correlation on the half-hour timescale, but the correlation coefficient was small (Figure 2c,d). Compared with F687 and F760, NDVI showed a significant negative linear relationship with PWSIbin (R2 = 0.24), as shown in Figure S2a, but it was lower than the R2 of ΦF687 and ΦF760 with PWSIbin, and also lower than the R2 of AMRF687 and AMRF760 with PWSIbin. We also calculated the afternoon depression of NDVI, as AMRNDVI, and the results showed that AMRNDVI remained around 1, as shown in Figure S2b, indicating that the diurnal dynamics of NDVI remained basically symmetrical in the morning and afternoon and was not affected by drought stress. The poor sensitivity of NDVI to drought stress in our study may be the result of a combination of the short duration of drought stress in the study area and the high drought tolerance of cork oak trees. The photosynthetic physiological response of canopy to short-term drought stress was faster than that of canopy greenness. Therefore, SIF was more indicative of drought stress than NDVI in a Chinese cork oak plantation.

4.3. Differences of Response to Drought of SIF in the Red and Far-Red Band

The SIF emission at 760 nm (ΦF760) was lower than that at 687 nm (ΦF687), as shown in our results (Figure 1g,h). This difference is attributed to red SIF containing more information about PSII and the fluorescence yield of PSI generally being lower than that of PSII [53,54]. However, the reabsorption and scattering effects in leaves or canopies more strongly impede the escape of red SIF from the canopy than far-red SIF [33]. As a result, the observed red SIF (F687) above the canopy was much lower than the far-red SIF (F760) (Figure 1b,c). In terms of temporal responses to drought stress, there was no significant difference between red SIF and far-red SIF at the seasonal scale. However, the afternoon depression of red SIF was stronger than that of far-red SIF within a diurnal cycle (Figure 4). The linear relationship between ΦF687 and PWSI was stronger than that of ΦF760 in our study, both in terms of daily average (Figure 3c,d) and in terms of AMR (Figure 5g,h). The AMRF in the red band (AMRF687) also exhibited a higher correlation coefficient with PWSI than that in the far-red band (AMRF760) (Figure 5e,f). Our results suggest that red SIF has the potential to provide more information about the physiological state in response to drought than far-red SIF.
However, because red SIF is affected by the chlorophyll reabsorption effect, the reduction in chlorophyll content caused by drought leads to the decrease in red SIF emission on the one hand, and an increase in red SIF due to the reduction in the reabsorption effect on the other hand [55]. These two simultaneous and contradictory effects limit the precision of red SIF for drought monitoring. Exploring a method to decouple this contradictory effect may facilitate the future application of red SIF. Additionally, red and far-red SIF are typically representative of the SIF spectral range (685~850 nm), and F687 and F760 are closely related (r > 0.90, p < 0.001), both in terms of daily averages and AMR (Figure 5). Based on the findings of Jia et al. (2020) [56], the combination of red and far-red SIF could enable more accurate monitoring of nitrogen content at leaf and canopy scales than using a single band. In the future, exploring combined red and far-red SIFs may enable more accurate monitoring of photosynthesis and environmental stress in forest ecosystems.

5. Conclusions

In this study, we observed the negative impact of drought stress on SIF on daily and half-hour scales. Drought resulted in a significant decrease in SIF emission, primarily attributed to the physiology of SIF emission (ΦF). It also led to an increased afternoon depression of SIF in our results. The afternoon/morning ratio (AMR) is a valuable indicator that quantifies afternoon depression and mitigates the effects of radiation and canopy structure compared to simple intraday aggregation. AMRF and AMRΦF exhibit strong linear relationships with PWSI. AMRΦF captures most of the changes in atmospheric moisture content (VPD) and soil water deficit (REW) and appears to be a promising indicator for tracking variations of drought in forests. Therefore, we recommend utilizing temporal variation characteristics of physiological information instead of simple temporal aggregation for drought monitoring. Both red SIF and far-red SIF exhibit sensitivity to drought, with red ΦF being more responsive to PWSI than far-red ΦF. Our results demonstrate a stronger response to drought for AMRF or AMRΦF in the red band compared to that in the far-red band. In conclusion, red SIF shows great potential for drought monitoring, and should be applied to estimate productivity and assess the health status of forests under drought stress in the future.

Supplementary Materials

The following supporting information can be downloaded at: https://www.mdpi.com/article/10.3390/rs16111897/s1, Figure S1: Seasonal variations in 2020 and 2021 for potential evapotranspiration (PET) simulated by the Shuttleworth–Wallace model and evapotranspiration (ET) observed using the eddy covariance system. Gray dots indicate half-hourly observed value, red rings indicate daily averages of 8:00–17:00, and red curves indicate 8-day moving averages. Figure S2: Relationships between PWSI and NDVI. The PWSI of the X-axis is depicted as PWSIbin. The error bars indicate the standard deviation (SD). Red straight lines indicate linear regression.

Author Contributions

Conceptualization, Q.P.; Methodology, M.H. and X.W.; Software, L.L. and W.Y.; Validation, Q.P. and X.C.; Writing—original draft preparation, Q.P.; Writing—review and editing, X.C. and J.Z.; Visualization, Q.P. and J.Z.; Supervision: J.Z., Z.L. and X.G.; Funding acquisition, J.Z. All authors have read and agreed to the published version of the manuscript.

Funding

This research was funded by the Fundamental Research Funds of the Central Public Welfare Scientific Research Institutes (CAFYBB2023PA00102).

Data Availability Statement

The datasets generated during and/or analyzed during the current study are available from the corresponding author on reasonable request.

Acknowledgments

We thank Chunxia He and Yu Zhou from the Chinese Academy of Forestry for contributing to field measurements and data analysis. We thank Chaoyue Wu, Yongbin Huang, and Ning Zheng for helping to run the spectrometer systems and eddy covariance systems.

Conflicts of Interest

The authors declare no conflicts of interest.

References

  1. Lorenz, K.; Lal, R. Carbon Sequestration in Forest Ecosystems; Springer: Berlin/Heidelberg, Germany, 2009. [Google Scholar]
  2. Hui, D.; Deng, Q.; Tian, H.; Luo, Y. Climate Change and Carbon Sequestration in Forest Ecosystems. In Handbook of Climate Change Mitigation and Adaptation; Springer Science + Business Media: New York, NY, USA, 2015; pp. 1–40. [Google Scholar]
  3. Chen, S.; Huang, Y.; Wang, G. Detecting drought-induced GPP spatiotemporal variabilities with sun-induced chlorophyll fluorescence during the 2009/2010 droughts in China. Ecol. Indic. 2021, 121, 107092. [Google Scholar] [CrossRef]
  4. McDowell, N.G.; Allen, C.D. Darcy’s law predicts widespread forest mortality under climate warming. Nat. Clim. Chang. 2015, 5, 669–672. [Google Scholar] [CrossRef]
  5. Pachauri, R.K.; Allen, M.R.; Barros, V.R.; Broome, J.; Cramer, W.; Christ, R.; Church, J.A.; Clarke, L.; Dahe, Q.; Dasgupta, P. Climate Change 2014: Synthesis Report. Contribution of Working Groups I, II and III to the Fifth Assessment Report of the Intergovernmental Panel on Climate Change; Ipcc: Geneva, Switzerland, 2014. [Google Scholar]
  6. Zhang, X.; Li, X.; Manzanedo, R.D.; D’orangeville, L.; Lv, P.; Wang, C.; Xu, C.; Hou, M.; Huang, X.; Rademacher, T.T. High risk of growth cessation of planted larch under extreme drought. Environ. Res. Lett. 2020, 16, 014040. [Google Scholar] [CrossRef]
  7. Wang, S.; Huang, C.; Zhang, L.; Lin, Y.; Cen, Y.; Wu, T. Monitoring and Assessing the 2012 Drought in the Great Plains: Analyzing Satellite-Retrieved Solar-Induced Chlorophyll Fluorescence, Drought Indices, and Gross Primary Production. Remote Sens. 2016, 8, 61. [Google Scholar] [CrossRef]
  8. West, H.; Quinn, N.; Horswell, M. Remote sensing for drought monitoring & impact assessment: Progress, past challenges and future opportunities. Remote Sens. Environ. 2019, 232, 111291. [Google Scholar] [CrossRef]
  9. Atzberger, C. Advances in Remote Sensing of Agriculture: Context Description, Existing Operational Monitoring Systems and Major Information Needs. Remote Sens. 2013, 5, 949–981. [Google Scholar] [CrossRef]
  10. Zhou, L.; Zhou, X.; Zhang, B.; Lu, M.; Luo, Y.; Liu, L.; Li, B. Different responses of soil respiration and its components to nitrogen addition among biomes: A meta-analysis. Glob. Chang. Biol. 2014, 20, 2332–2343. [Google Scholar] [CrossRef] [PubMed]
  11. Meroni, M.; Rossini, M.; Guanter, L.; Alonso, L.; Rascher, U.; Colombo, R.; Moreno, J. Remote sensing of solar-induced chlorophyll fluorescence: Review of methods and applications. Remote Sens. Environ. 2009, 113, 2037–2051. [Google Scholar] [CrossRef]
  12. Lin, J.; Shen, Q.; Wu, J.; Zhao, W.; Liu, L. Assessing the Potential of Downscaled Far Red Solar-Induced Chlorophyll Fluorescence from the Canopy to Leaf Level for Drought Monitoring in Winter Wheat. Remote Sens. 2022, 14, 1357. [Google Scholar] [CrossRef]
  13. Jiao, W.; Chang, Q.; Wang, L. The Sensitivity of Satellite Solar-Induced Chlorophyll Fluorescence to Meteorological Drought. Earth’s Futur. 2019, 7, 558–573. [Google Scholar] [CrossRef]
  14. Yang, P.; van der Tol, C. Linking canopy scattering of far-red sun-induced chlorophyll fluorescence with reflectance. Remote Sens. Environ. 2018, 209, 456–467. [Google Scholar] [CrossRef]
  15. Baker, N.R. Chlorophyll fluorescence: A probe of photosynthesis in vivo. Annu. Rev. Plant Biol. 2008, 59, 89–113. [Google Scholar] [CrossRef]
  16. Porcar-Castell, A.; Tyystjarvi, E.; Atherton, J.; van der Tol, C.; Flexas, J.; Pfuendel, E.E.; Moreno, J.; Frankenberg, C.; Berry, J.A. Linking chlorophyll a fluorescence to photosynthesis for remote sensing applications: Mechanisms and challenges. J. Exp. Bot. 2014, 65, 4065–4095. [Google Scholar] [CrossRef] [PubMed]
  17. Magney, T.S.; Bowling, D.R.; Logan, B.; Grossmann, K.; Stutz, J.; Blanken, P.D.; Burns, S.P.; Cheng, R.; Garcia, M.A.; Köhler, P.; et al. Mechanistic evidence for tracking the seasonality of photosynthesis with solar-induced fluorescence. Proc. Natl. Acad. Sci. USA 2019, 116, 11640–11645. [Google Scholar] [CrossRef]
  18. Buareal, K.; Kato, T.; Morozumi, T.; Ono, K.; Nakashima, N. Red solar-induced chlorophyll fluorescence as a robust proxy for ecosystem-level photosynthesis in a rice field. Agric. For. Meteorol. 2023, 336, 109473. [Google Scholar] [CrossRef]
  19. Guanter, L.; Zhang, Y.; Jung, M.; Joiner, J.; Voigt, M.; Berry, J.A.; Frankenberg, C.; Huete, A.R.; Zarco-Tejada, P.; Lee, J.-E.; et al. Global and time-resolved monitoring of crop photosynthesis with chlorophyll fluorescence. Proc. Natl. Acad. Sci. USA 2014, 111, E1327–E1333. [Google Scholar] [CrossRef]
  20. Frankenberg, C.; O’Dell, C.; Berry, J.; Guanter, L.; Joiner, J.; Köhler, P.; Pollock, R.; Taylor, T.E. Prospects for chlorophyll fluorescence remote sensing from the Orbiting Carbon Observatory-2. Remote Sens. Environ. 2014, 147, 1–12. [Google Scholar] [CrossRef]
  21. Porcar-Castell, A.; Malenovský, Z.; Magney, T.; Van Wittenberghe, S.; Fernández-Marín, B.; Maignan, F.; Zhang, Y.; Maseyk, K.; Atherton, J.; Albert, L.P.; et al. Chlorophyll a fluorescence illuminates a path connecting plant molecular biology to Earth-system science. Nat. Plants 2021, 7, 998–1009. [Google Scholar] [CrossRef]
  22. Zhao, W.; Wu, J.; Shen, Q.; Yang, J.; Han, X. Exploring the Ability of Solar-Induced Chlorophyll Fluorescence for Drought Monitoring Based on an Intelligent Irrigation Control System. Remote Sens. 2022, 14, 6157. [Google Scholar] [CrossRef]
  23. Sun, Y.; Fu, R.; Dickinson, R.; Joiner, J.; Frankenberg, C.; Gu, L.; Xia, Y.; Fernando, N. Drought onset mechanisms revealed by satellite solar-induced chlorophyll fluorescence: Insights from two contrasting extreme events. J. Geophys. Res. Biogeosciences 2015, 120, 2427–2440. [Google Scholar] [CrossRef]
  24. Liu, Y.; Dang, C.; Yue, H.; Lyu, C.; Dang, X. Enhanced drought detection and monitoring using sun-induced chlorophyll fluorescence over Hulun Buir Grassland, China. Sci. Total. Environ. 2021, 770, 145271. [Google Scholar] [CrossRef] [PubMed]
  25. Damm, A.; Guanter, L.; Paul-Limoges, E.; van der Tol, C.; Hueni, A.; Buchmann, N.; Eugster, W.; Ammann, C.; Schaepman, M. Far-red sun-induced chlorophyll fluorescence shows ecosystem-specific relationships to gross primary production: An assessment based on observational and modeling approaches. Remote Sens. Environ. 2015, 166, 91–105. [Google Scholar] [CrossRef]
  26. van der Tol, C.; Berry, J.A.; Campbell, P.K.E.; Rascher, U. Models of fluorescence and photosynthesis for interpreting measurements of solar-induced chlorophyll fluorescence. J. Geophys. Res. Biogeosciences 2014, 119, 2312–2327. [Google Scholar] [CrossRef] [PubMed]
  27. Wang, N.; Yang, P.; Clevers, J.G.P.W.; Wieneke, S.; Kooistra, L. Decoupling physiological and non-physiological responses of sugar beet to water stress from sun-induced chlorophyll fluorescence. Remote Sens. Environ. 2023, 286, 113445. [Google Scholar] [CrossRef]
  28. Hwang, Y.; Kim, J.; Ryu, Y. Canopy structural changes explain reductions in canopy-level solar induced chlorophyll fluorescence in Prunus yedoensis seedlings under a drought stress condition. Remote Sens. Environ. 2023, 296, 113733. [Google Scholar] [CrossRef]
  29. Yang, P.; Liu, X.; Liu, Z.; van der Tol, C.; Liu, L. The roles of radiative, structural and physiological information of sun-induced chlorophyll fluorescence in predicting gross primary production of a corn crop at various temporal scales. Agric. For. Meteorol. 2023, 342, 109720. [Google Scholar] [CrossRef]
  30. Dechant, B.; Ryu, Y.; Badgley, G.; Zeng, Y.; Berry, J.A.; Zhang, Y.; Goulas, Y.; Li, Z.; Zhang, Q.; Kang, M.; et al. Canopy structure explains the relationship between photosynthesis and sun-induced chlorophyll fluorescence in crops. Remote Sens. Environ. 2020, 241, 111733. [Google Scholar] [CrossRef]
  31. Miao, G.; Guan, K.; Yang, X.; Bernacchi, C.J.; Berry, J.A.; DeLucia, E.H.; Wu, J.; Moore, C.E.; Meacham, K.; Cai, Y.; et al. Sun-Induced Chlorophyll Fluorescence, Photosynthesis, and Light Use Efficiency of a Soybean Field from Seasonally Continuous Measurements. J. Geophys. Res. Biogeosciences 2018, 123, 610–623. [Google Scholar] [CrossRef]
  32. Zeng, Y.; Badgley, G.; Dechant, B.; Ryu, Y.; Chen, M.; Berry, J. A practical approach for estimating the escape ratio of near-infrared solar-induced chlorophyll fluorescence. Remote Sens. Environ. 2019, 232, 111209. [Google Scholar] [CrossRef]
  33. Liu, X.; Liu, L.; Hu, J.; Guo, J.; Du, S. Improving the potential of red SIF for estimating GPP by downscaling from the canopy level to the photosystem level. Agric. For. Meteorol. 2019, 281, 107846. [Google Scholar] [CrossRef]
  34. Wieneke, S.; Burkart, A.; Cendrero-Mateo, M.P.; Julitta, T.; Rossini, M.; Schickling, A.; Schmidt, M.; Rascher, U. Linking photosynthesis and sun-induced fluorescence at sub-daily to seasonal scales. Remote Sens. Environ. 2018, 219, 247–258. [Google Scholar] [CrossRef]
  35. Varone, L.; Ribas-Carbo, M.; Cardona, C.; Gallé, A.; Medrano, H.; Gratani, L.; Flexas, J. Stomatal and non-stomatal limitations to photosynthesis in seedlings and saplings of Mediterranean species pre-conditioned and aged in nurseries: Different response to water stress. Environ. Exp. Bot. 2012, 75, 235–247. [Google Scholar] [CrossRef]
  36. Flexas, J.; Medrano, H. Drought-inhibition of photosynthesis in C3 plants: Stomatal and non-stomatal limitations revisited. Ann. Bot. 2002, 89, 183–189. [Google Scholar] [CrossRef]
  37. Lichtenthaler, H.K.; Rinderle, U. The Role of Chlorophyll Fluorescence in The Detection of Stress Conditions in Plants. C R C Crit. Rev. Anal. Chem. 1988, 19, S29–S85. [Google Scholar] [CrossRef]
  38. Olioso, A.; Carlson, T.N.; Brisson, N. Simulation of diurnal transpiration and photosynthesis of a water stressed soybean crop. Agric. For. Meteorol. 1996, 81, 41–59. [Google Scholar] [CrossRef]
  39. Xiao, J.; Fisher, J.B.; Hashimoto, H.; Ichii, K.; Parazoo, N.C. Emerging satellite observations for diurnal cycling of ecosystem processes. Nat. Plants 2021, 7, 877–887. [Google Scholar] [CrossRef] [PubMed]
  40. Zhang, Y.; Fang, J.; Smith, W.K.; Wang, X.; Gentine, P.; Scott, R.L.; Migliavacca, M.; Jeong, S.; Litvak, M.; Zhou, S. Satellite solar-induced chlorophyll fluorescence tracks physiological drought stress development during 2020 southwest US drought. Glob. Chang. Biol. 2023, 29, 3395–3408. [Google Scholar] [CrossRef]
  41. Rossini, M.; Nedbal, L.; Guanter, L.; Ač, A.; Alonso, L.; Burkart, A.; Cogliati, S.; Colombo, R.; Damm, A.; Drusch, M.; et al. Red and far red Sun-induced chlorophyll fluorescence as a measure of plant photosynthesis. Geophys. Res. Lett. 2015, 42, 1632–1639. [Google Scholar] [CrossRef]
  42. Ač, A.; Malenovský, Z.; Olejníčková, J.; Gallé, A.; Rascher, U.; Mohammed, G. Meta-analysis assessing potential of steady-state chlorophyll fluorescence for remote sensing detection of plant water, temperature and nitrogen stress. Remote Sens. Environ. 2015, 168, 420–436. [Google Scholar] [CrossRef]
  43. Liu, L.; Gudmundsson, L.; Hauser, M.; Qin, D.; Li, S.; Seneviratne, S.I. Soil moisture dominates dryness stress on ecosystem production globally. Nat. Commun. 2020, 11, 4892. [Google Scholar] [CrossRef]
  44. Tong, X.; Mu, Y.; Zhang, J.; Meng, P.; Li, J. Water stress controls on carbon flux and water use efficiency in a warm-temperate mixed plantation. J. Hydrol. 2019, 571, 669–678. [Google Scholar] [CrossRef]
  45. Liu, L.; Gao, X.; Ren, C.; Cheng, X.; Zhou, Y.; Huang, H.; Zhang, J.; Ba, Y. Applicability of the crop water stress index based on canopy–air temperature differences for monitoring water status in a cork oak plantation, northern China. Agric. For. Meteorol. 2022, 327, 109226. [Google Scholar] [CrossRef]
  46. Cheng, X.; Hu, M.; Zhou, Y.; Wang, F.; Liu, L.; Wang, Y.; Huang, H.; Zhang, J. The divergence of micrometeorology sensitivity leads to changes in GPP/SIF between cork oak and poplar. Agric. For. Meteorol. 2022, 326, 109189. [Google Scholar] [CrossRef]
  47. Granier, A.; Biron, P.; Lemoine, D. Water balance, transpiration and canopy conductance in two beech stands. Agric. For. Meteorol. 2000, 100, 291–308. [Google Scholar] [CrossRef]
  48. Jackson, R.D.; Idso, S.B.; Reginato, R.J.; Pinter, P.J., Jr. Canopy temperature as a crop water stress indicator. Water Resour. Res. 1981, 17, 1133–1138. [Google Scholar] [CrossRef]
  49. Yang, X.; Tang, J.; Mustard, J.F.; Lee, J.; Rossini, M.; Joiner, J.; Munger, J.W.; Kornfeld, A.; Richardson, A.D. Solar-induced chlorophyll fluorescence that correlates with canopy photosynthesis on diurnal and seasonal scales in a temperate deciduous forest. Geophys. Res. Lett. 2015, 42, 2977–2987. [Google Scholar] [CrossRef]
  50. Xu, S.; Atherton, J.; Riikonen, A.; Zhang, C.; Oivukkamäki, J.; MacArthur, A.; Honkavaara, E.; Hakala, T.; Koivumäki, N.; Liu, Z.; et al. Structural and photosynthetic dynamics mediate the response of SIF to water stress in a potato crop. Remote Sens. Environ. 2021, 263, 112555. [Google Scholar] [CrossRef]
  51. Xu, S.; Liu, Z.; Zhao, L.; Zhao, H.; Ren, S. Diurnal Response of Sun-Induced Fluorescence and PRI to Water Stress in Maize Using a Near-Surface Remote Sensing Platform. Remote Sens. 2018, 10, 1510. [Google Scholar] [CrossRef]
  52. Liu, Z.; He, X.; Yang, P.; Jiang, H.; Xu, S.; Zhao, H.; Ren, S.; Chen, M. Diurnal Pattern of Sun-Induced Chlorophyll Fluorescence as Reliable Indicators of Crop Water Stress. IEEE Geosci. Remote Sens. Lett. 2023, 20, 2503805. [Google Scholar] [CrossRef]
  53. Gitelson, A.A.; Buschmann, C.; Lichtenthaler, H.K. Leaf chlorophyll fluorescence corrected for re-absorption by means of absorption and reflectance measurements. J. Plant Physiol. 1998, 152, 283–296. [Google Scholar] [CrossRef]
  54. Frankenberg, C.; Fisher, J.B.; Worden, J.; Badgley, G.; Saatchi, S.S.; Lee, J.-E.; Toon, G.C.; Butz, A.; Jung, M.; Kuze, A.; et al. New global observations of the terrestrial carbon cycle from GOSAT: Patterns of plant fluorescence with gross primary productivity. Geophys. Res. Lett. 2011, 38. [Google Scholar] [CrossRef]
  55. Xu, S.; Liu, Z.; Han, S.; Chen, Z.; He, X.; Zhao, H.; Ren, S. Exploring the Sensitivity of Solar-Induced Chlorophyll Fluorescence at Different Wavelengths in Response to Drought. Remote Sens. 2023, 15, 1077. [Google Scholar] [CrossRef]
  56. Jia, M.; Colombo, R.; Rossini, M.; Celesti, M.; Zhu, J.; Cogliati, S.; Cheng, T.; Tian, Y.; Zhu, Y.; Cao, W.; et al. Estimation of leaf nitrogen content and photosynthetic nitrogen use efficiency in wheat using sun-induced chlorophyll fluorescence at the leaf and canopy scales. Eur. J. Agron. 2020, 122, 126192. [Google Scholar] [CrossRef]
Figure 1. Seasonal variations in 2020 and 2021 for (a) plant water stress index (PWSI), (b) normalized difference vegetation index (NDVI), (c) canopy solar-induced chlorophyll fluorescence in the red band (F687, mWm−2nm−1sr−1), (d) canopy solar-induced chlorophyll fluorescence in the far-red band (F760, mWm−2nm−1sr−1), (e) photosynthetically active radiation (PAR, umolm−2s−1), (f) red reflectance of the vegetation (Redv), (g) near-infrared reflectance of the vegetation (NIRv), (h) SIF quantum yield in the red band (ΦF687), and (i) SIF quantum yield in the far-red band (ΦF760). Gray dots indicate half-hourly observed value, red rings indicate daily averages of 8:00–17:00, and red curves indicate 8 day moving averages.
Remotesensing 16 01897 g001
Figure 2. Pearson correlation coefficient heatmap. Correlation coefficients of SIF(F) and its quantum yield (ΦF) with PWSI at (a) daily timescales and (b) half-hourly timescales. Correlation coefficients between canopy structural parameters and PWSI at (c) daily timescales and (d) half-hour timescales. *** represents significance levels below 0.001 (p < 0.001), ** represents significance levels below 0.01 (p < 0.01), and * represents significance levels below 0.05 (p < 0.05).
Remotesensing 16 01897 g002
Figure 3. Daily mean PWSI, REDv, and NIRv in (ac), as well as diurnal patterns for PAR, F687, F760, ΦF687, and ΦF760 for the four observation days (DOY136, DOY138, DOY146, and DOY148 in 2020) in (dh). Means followed by the same letter were not significantly different at p ≤ 0.05 according to Tukey’s HSD test in (ac).
Remotesensing 16 01897 g003
Figure 4. Percentage of decline for DOY138, DOY146, and DOY148 relative to DOY136 in the morning, noon, and afternoon for (a) F687, (b) F760, (c) ΦF687, and (d) ΦF760.
Remotesensing 16 01897 g004
Figure 5. Relationships between PWSI and SIF, and afternoon depression (AMR) of SIF. The PWSI of the X-axis is depicted as PWSIbin. The top row shows the daily average, and the bottom row shows AMR. The error bars indicate the standard deviation (SD). Red straight lines indicate linear and nonlinear regression. It should be noted that the black straight dashed line indicates linear regression at PWSI < 0.42; the green straight dotted and dashed line indicates linear regression at PWSI > 0.42 in subfigures (a,b).
Remotesensing 16 01897 g005
Figure 6. Correlation coefficients of F and AMRF with (a) radiation (PAR) and (b) structural (REDv or NIRv) factors. *** represents significance levels below 0.001 (p < 0.001), and * represents significance levels below 0.05 (p < 0.05).
Remotesensing 16 01897 g006
Figure 7. Relationship between PWSI and SIF excluding radiation for (a,c) and canopy structure for (b,d). The error bars indicate the standard deviation (SD). Straight lines indicate linear regression.
Remotesensing 16 01897 g007
Figure 8. Correlation coefficients between PWSI and F, AMRF. Pearson correlation coefficients (r) and partial correlation coefficients exclude PAR for PWSI and F in (a), and Pearson correlation coefficients (r) and partial correlation coefficients exclude canopy structural factors (REDv or NIRv) for PWSI and F, AMRF in (b). Red-filled bars indicate Pearson correlation coefficients, and grey twill-filled bars indicate partial correlation coefficients. *** represents significance levels below 0.001 (p < 0.001), ** represents significance levels below 0.01 (p < 0.01), and * represents significance levels below 0.05 (p < 0.05).
Remotesensing 16 01897 g008
Figure 9. The response of AMRΦF and daily mean ΦF to VPD for (a,b) and to REW for (c,d). The shadows indicate the standard deviation (SD). Straight lines indicate linear regression. Blue shows AMR and red shows ΦF.
Remotesensing 16 01897 g009
Table 1. Correlation coefficients of canopy structure parameters and daily ΦF, AMRΦF. *** represents significance levels below 0.001 (p < 0.001), ** represents significance levels below 0.01 (p < 0.01), and * represents significance levels below 0.05 (p < 0.05).
VariableΦF687ΦF760AMRΦF687AMRΦF687
REDv−0.48 ***/−0.21 **/
NIRv/−0.18 **/−0.06
fPAR−0.12−0.21 **0.040.08
fesc_red−0.45 ***/−0.26 ***/
fesc_far-red/−0.16 */−0.09
Disclaimer/Publisher’s Note: The statements, opinions and data contained in all publications are solely those of the individual author(s) and contributor(s) and not of MDPI and/or the editor(s). MDPI and/or the editor(s) disclaim responsibility for any injury to people or property resulting from any ideas, methods, instructions or products referred to in the content.

