
SDRnet: A Deep Fusion Network for ISAR Ship Target Recognition Based on Feature Separation and Weighted Decision


Abstract
1. Introduction
- We propose a deep feature fusion method based on ISAR image and HRRP data for target recognition. This method can fully exploit feature information about the target, thereby achieving satisfying recognition performance.
- We used a feature separation module based on MK-MMD to effectively exploit shared and private information contained in HRRP data and ISAR images for robust target recognition. The module facilitates thorough consideration of correlation and complementarity between the two modalities to obtain a more robust representation of the target.
- We designed a weighted decision fusion module to fit the feature separation module. We used it to further improve the accuracy and reliability of prediction. We verified the robustness and effectiveness of the proposed method on simulated and measured datasets. Moreover, the proposed method could achieve a higher recognition rate than the traditional fusion methods.
2. Related Works
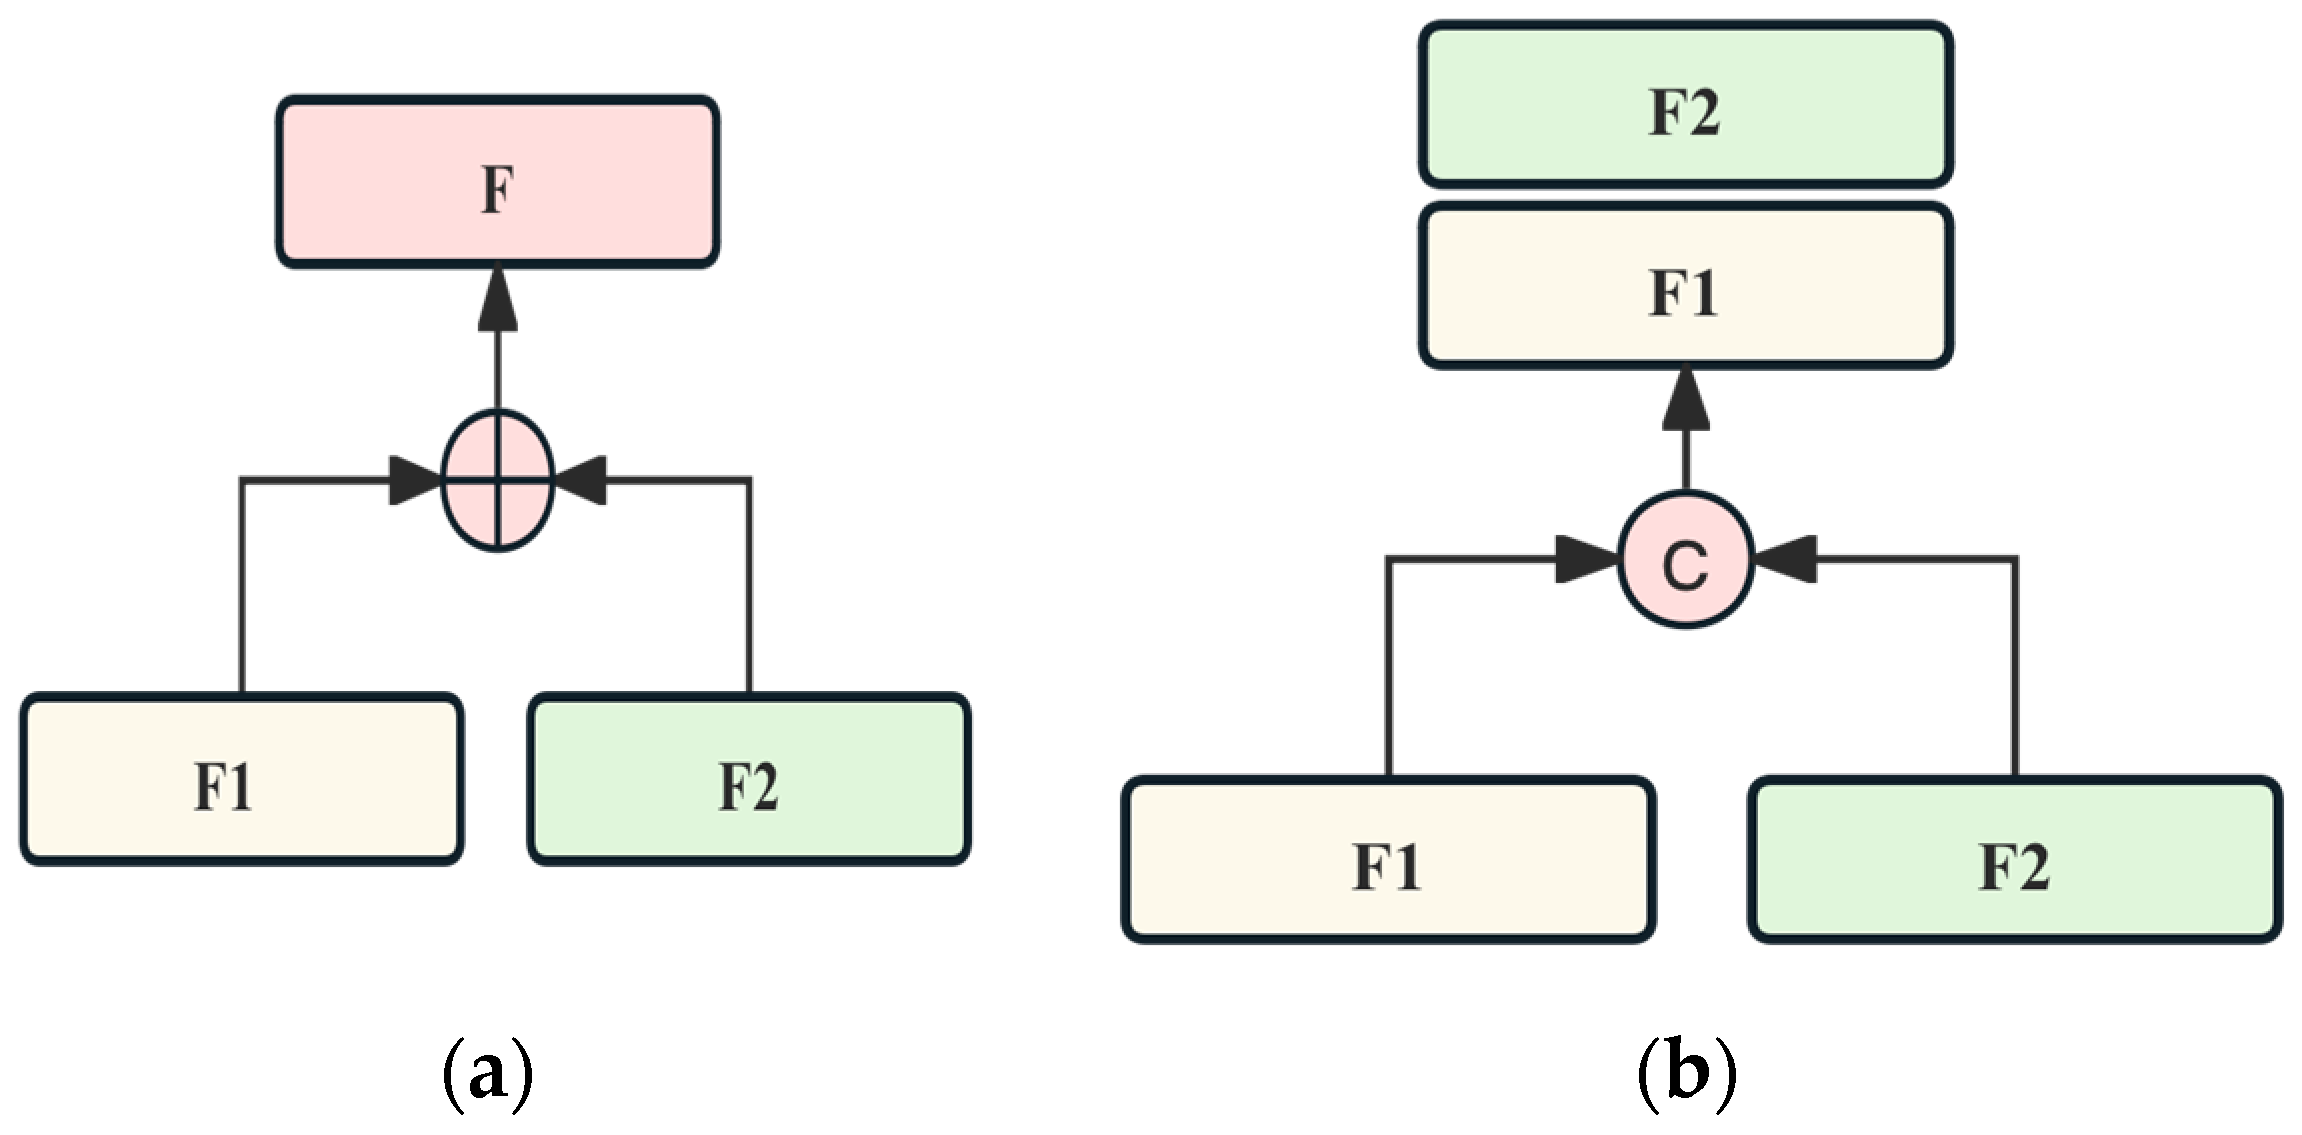
2.1. Information Fusion
2.2. Feature Separation
3. The Proposed Method
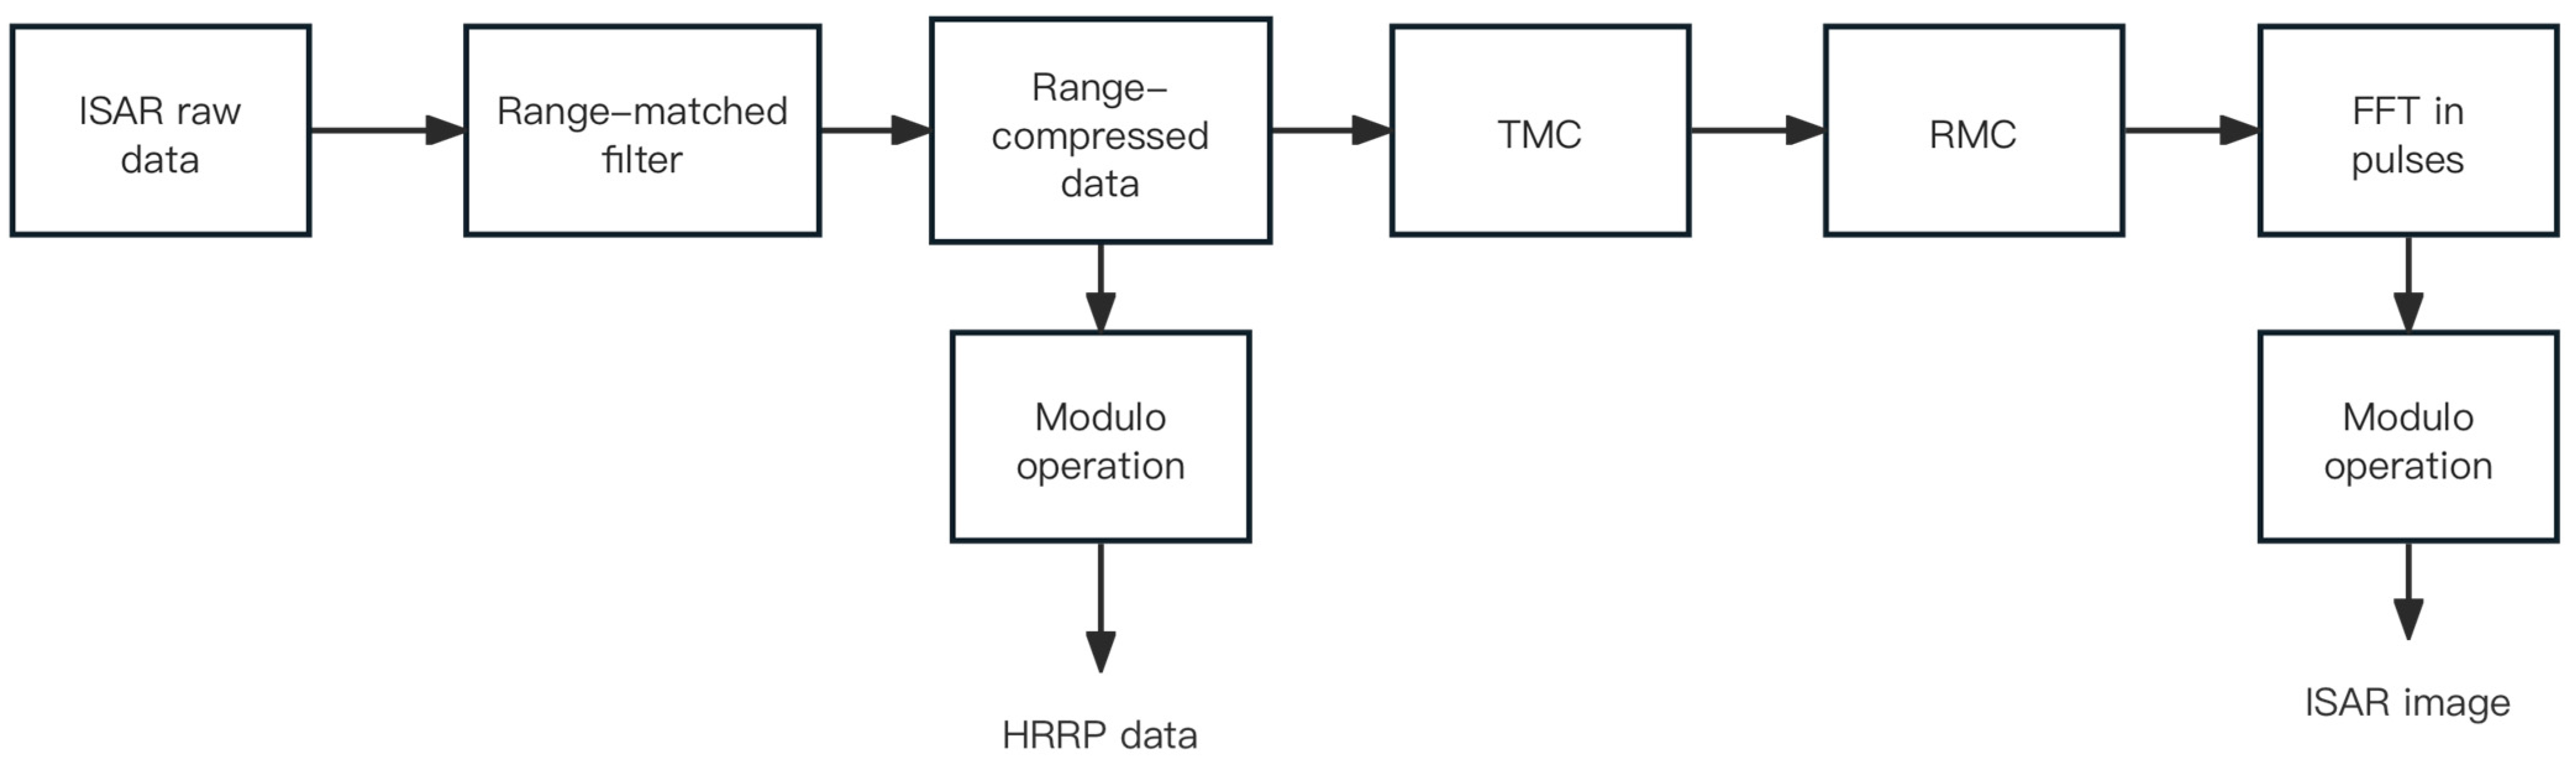
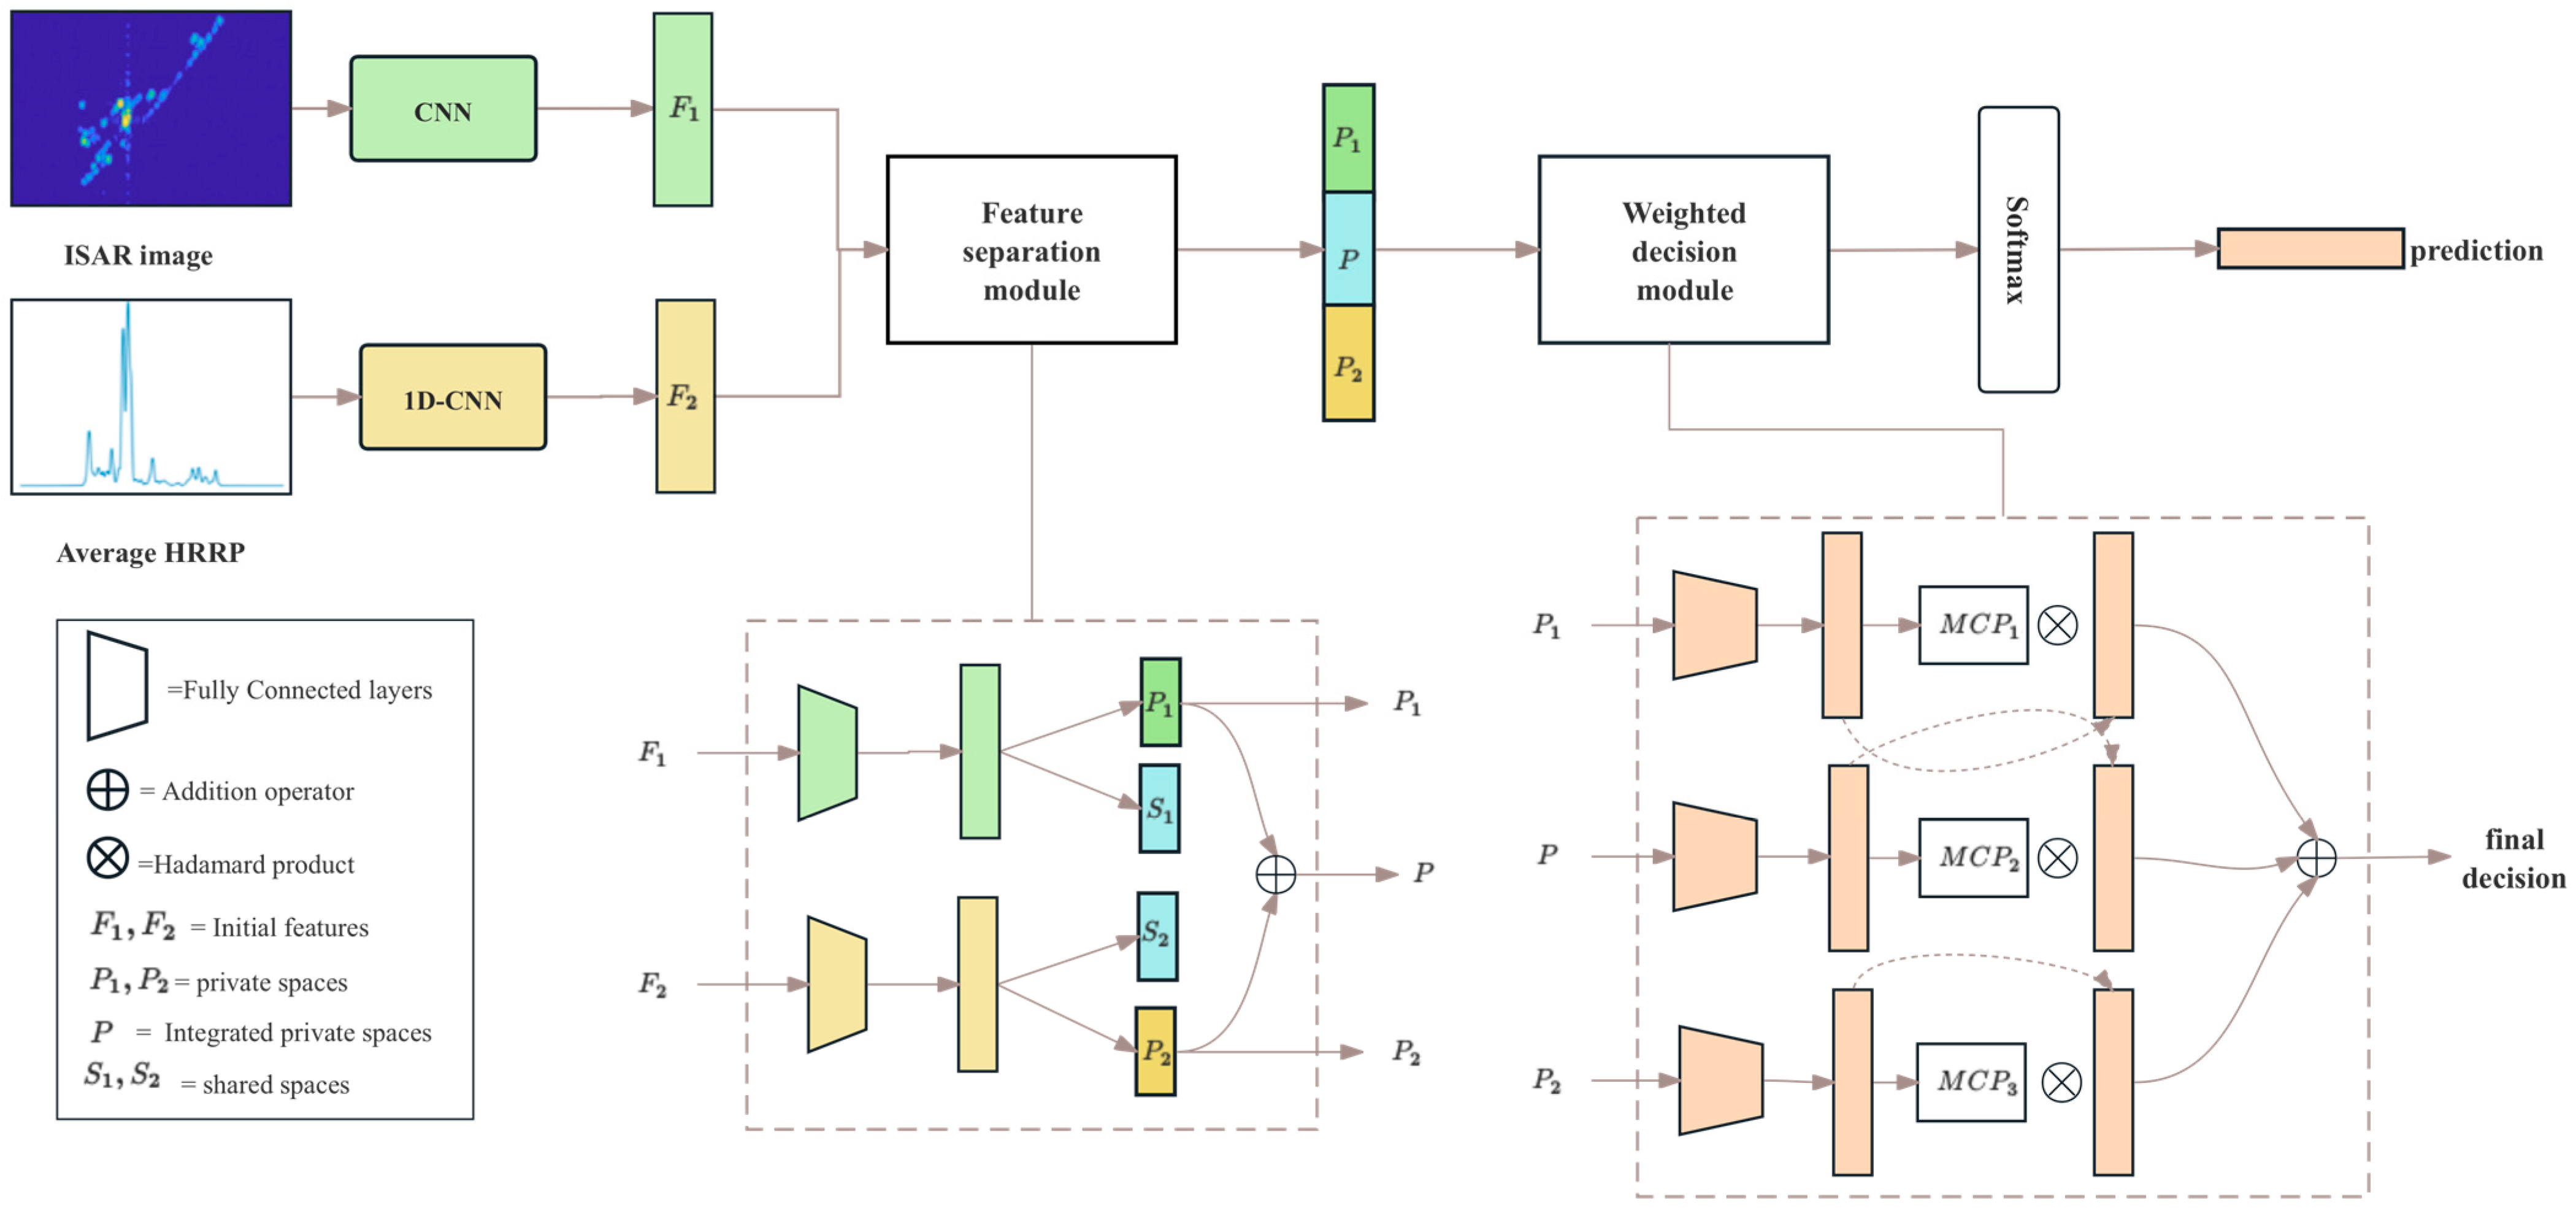
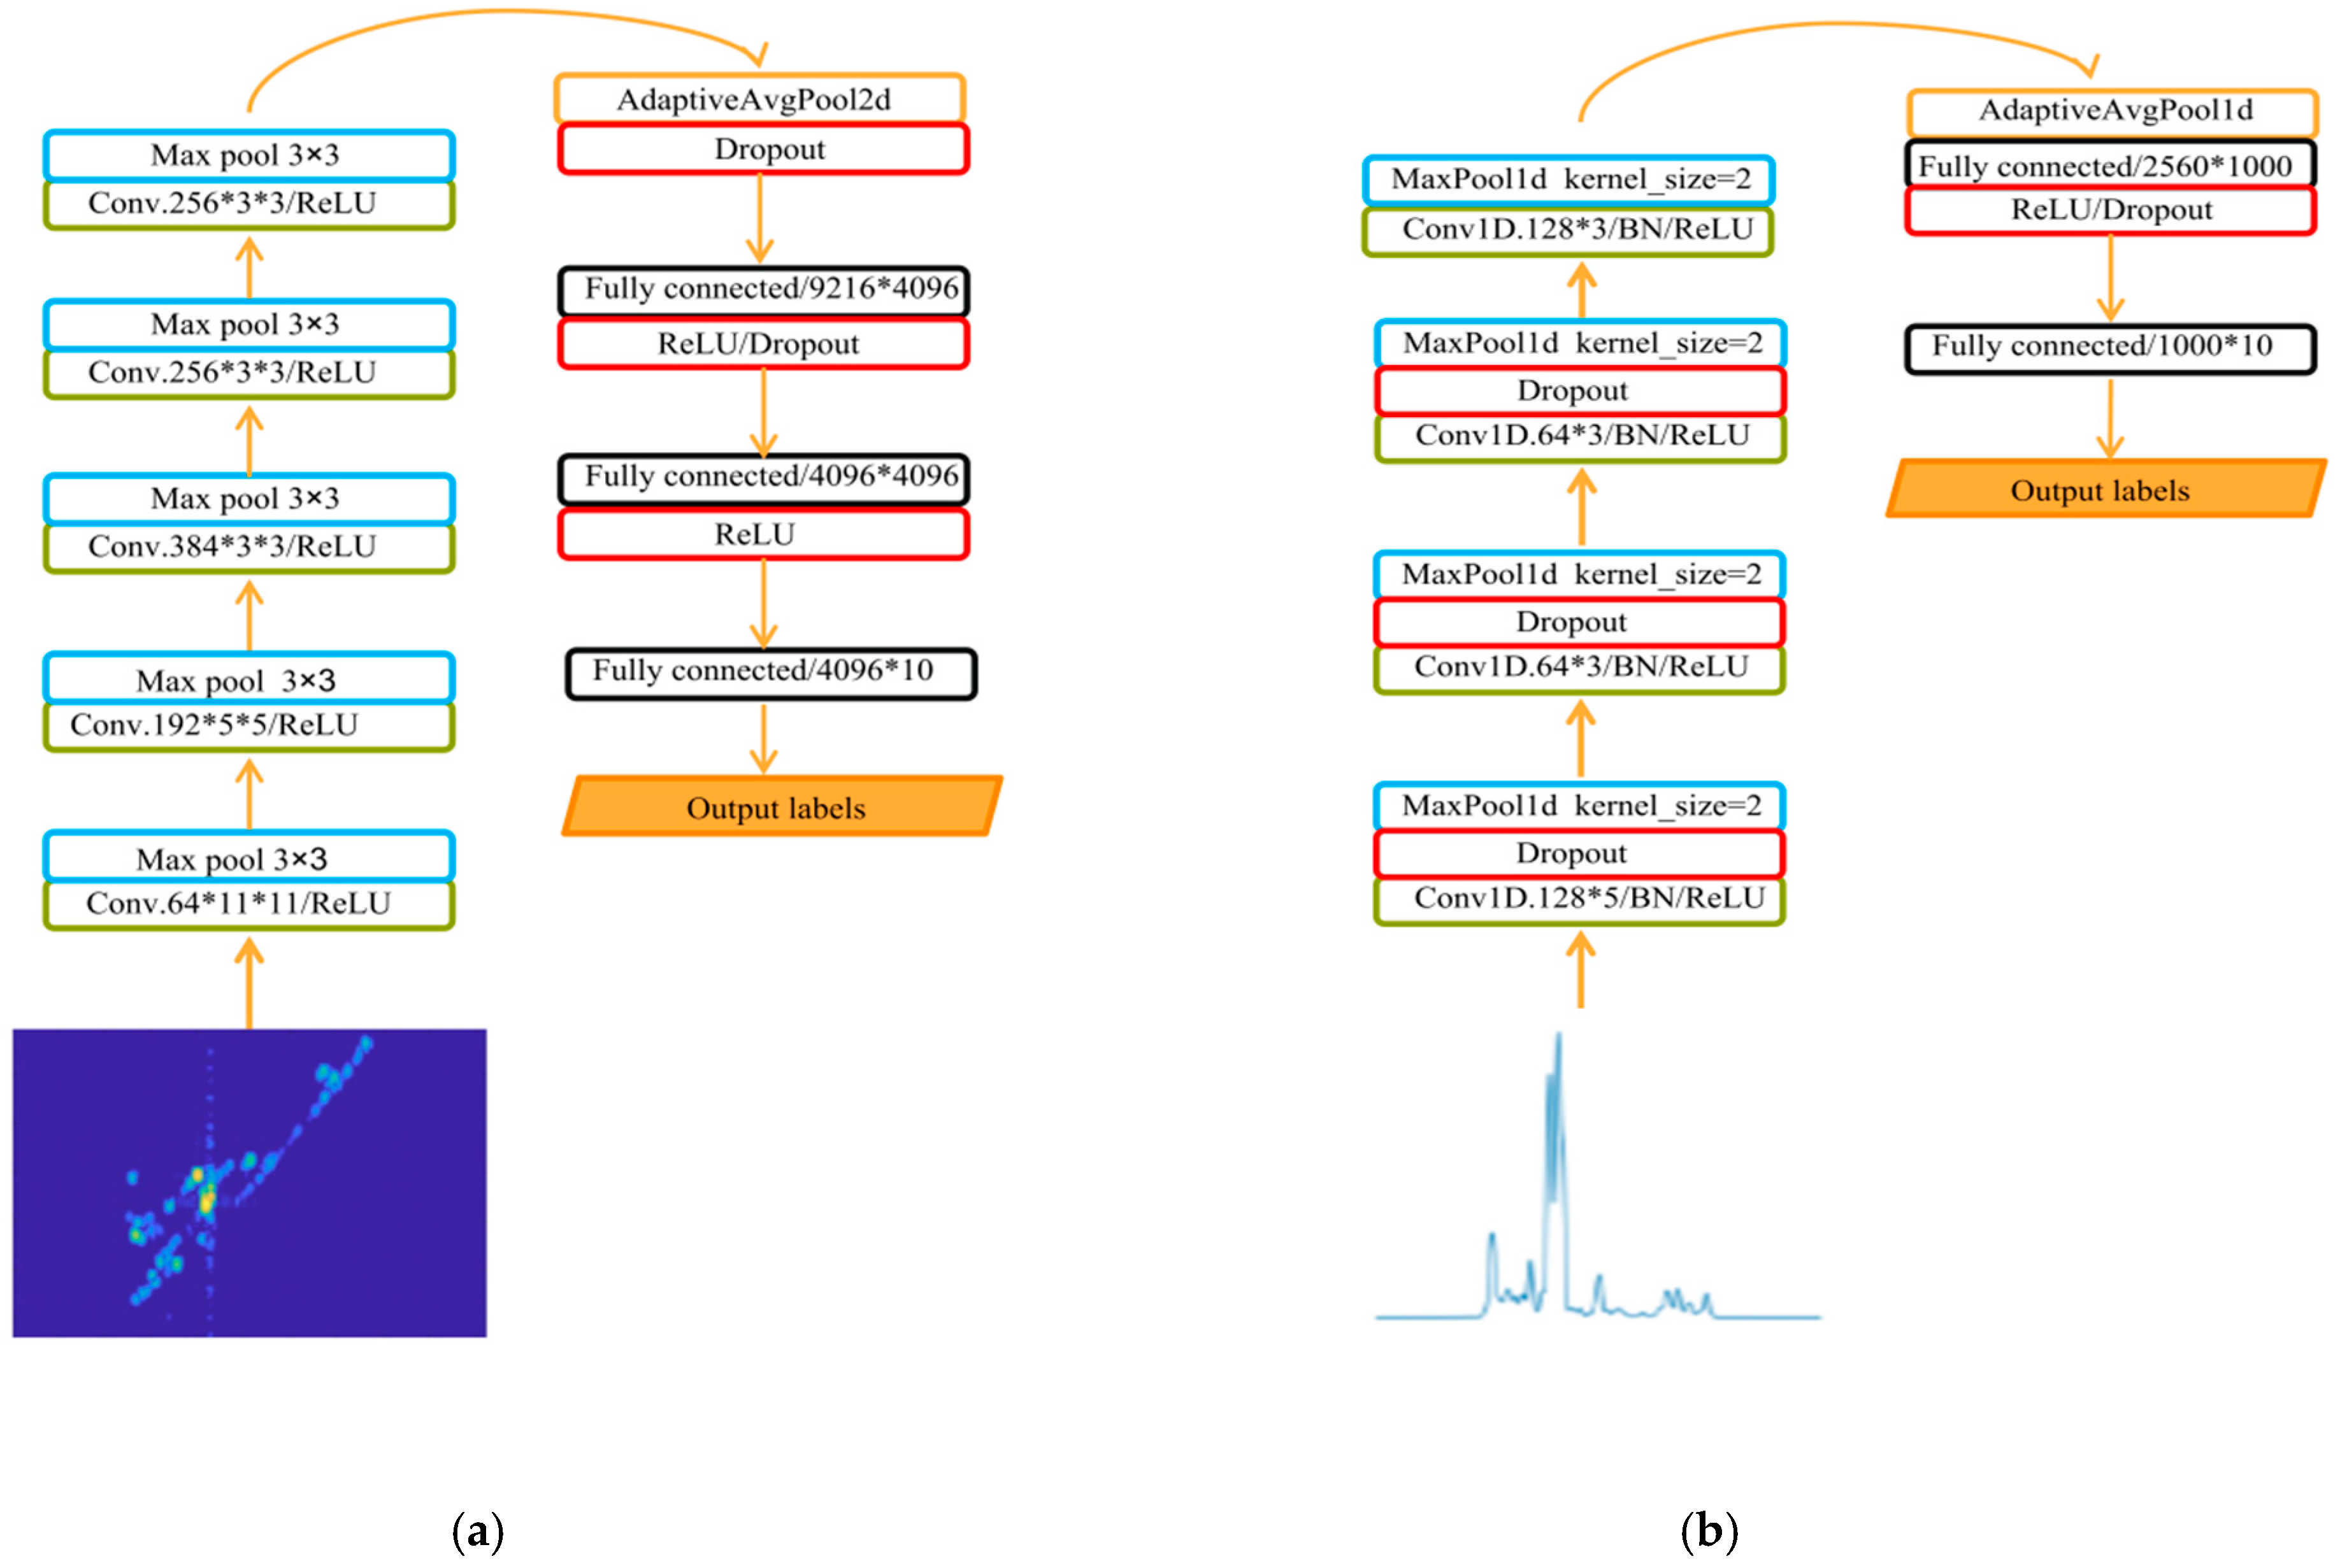
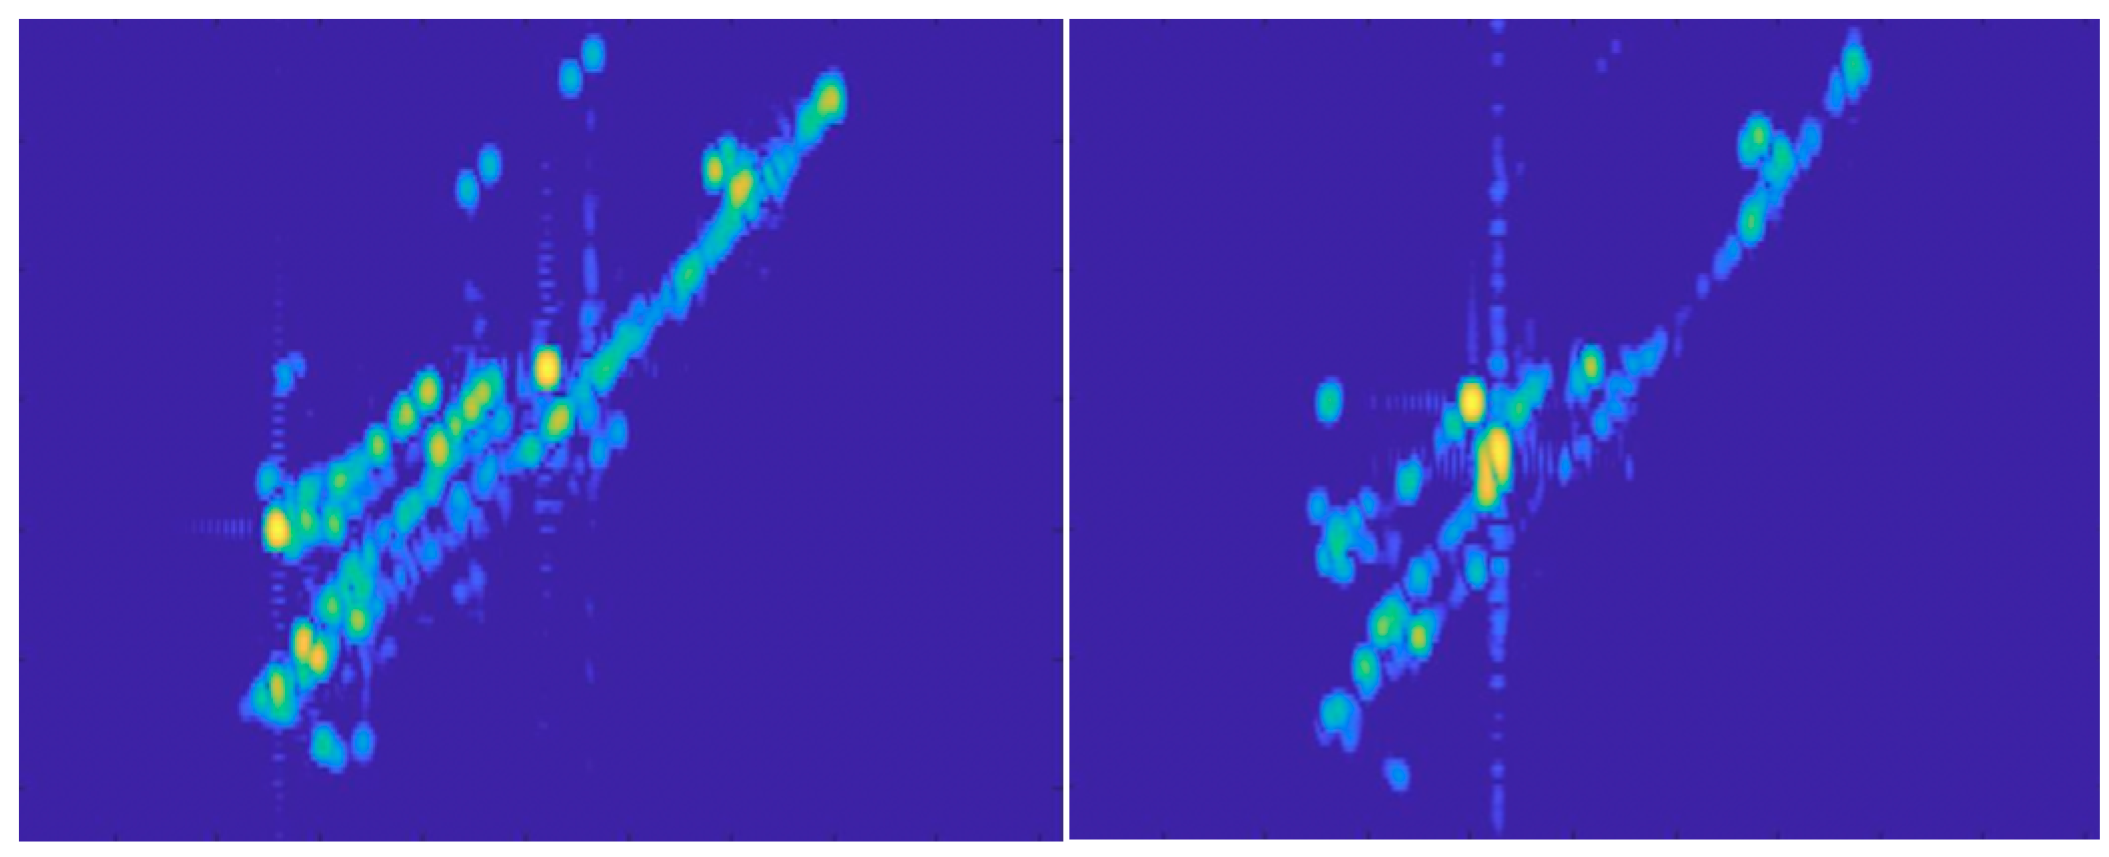
- Initial feature extraction: As shown in Figure 1, during the ISAR imaging process, we can obtain the ISAR image of the target and the corresponding HRRP data simultaneously. For the HRRP data, we use the average HRRP obtained after preprocessing. Then, the ISAR image and the average HRRP are fed into the CNNs shown in Figure 3 for training to obtain their corresponding initial features. These initial features serve as input to the subsequent fusion process.
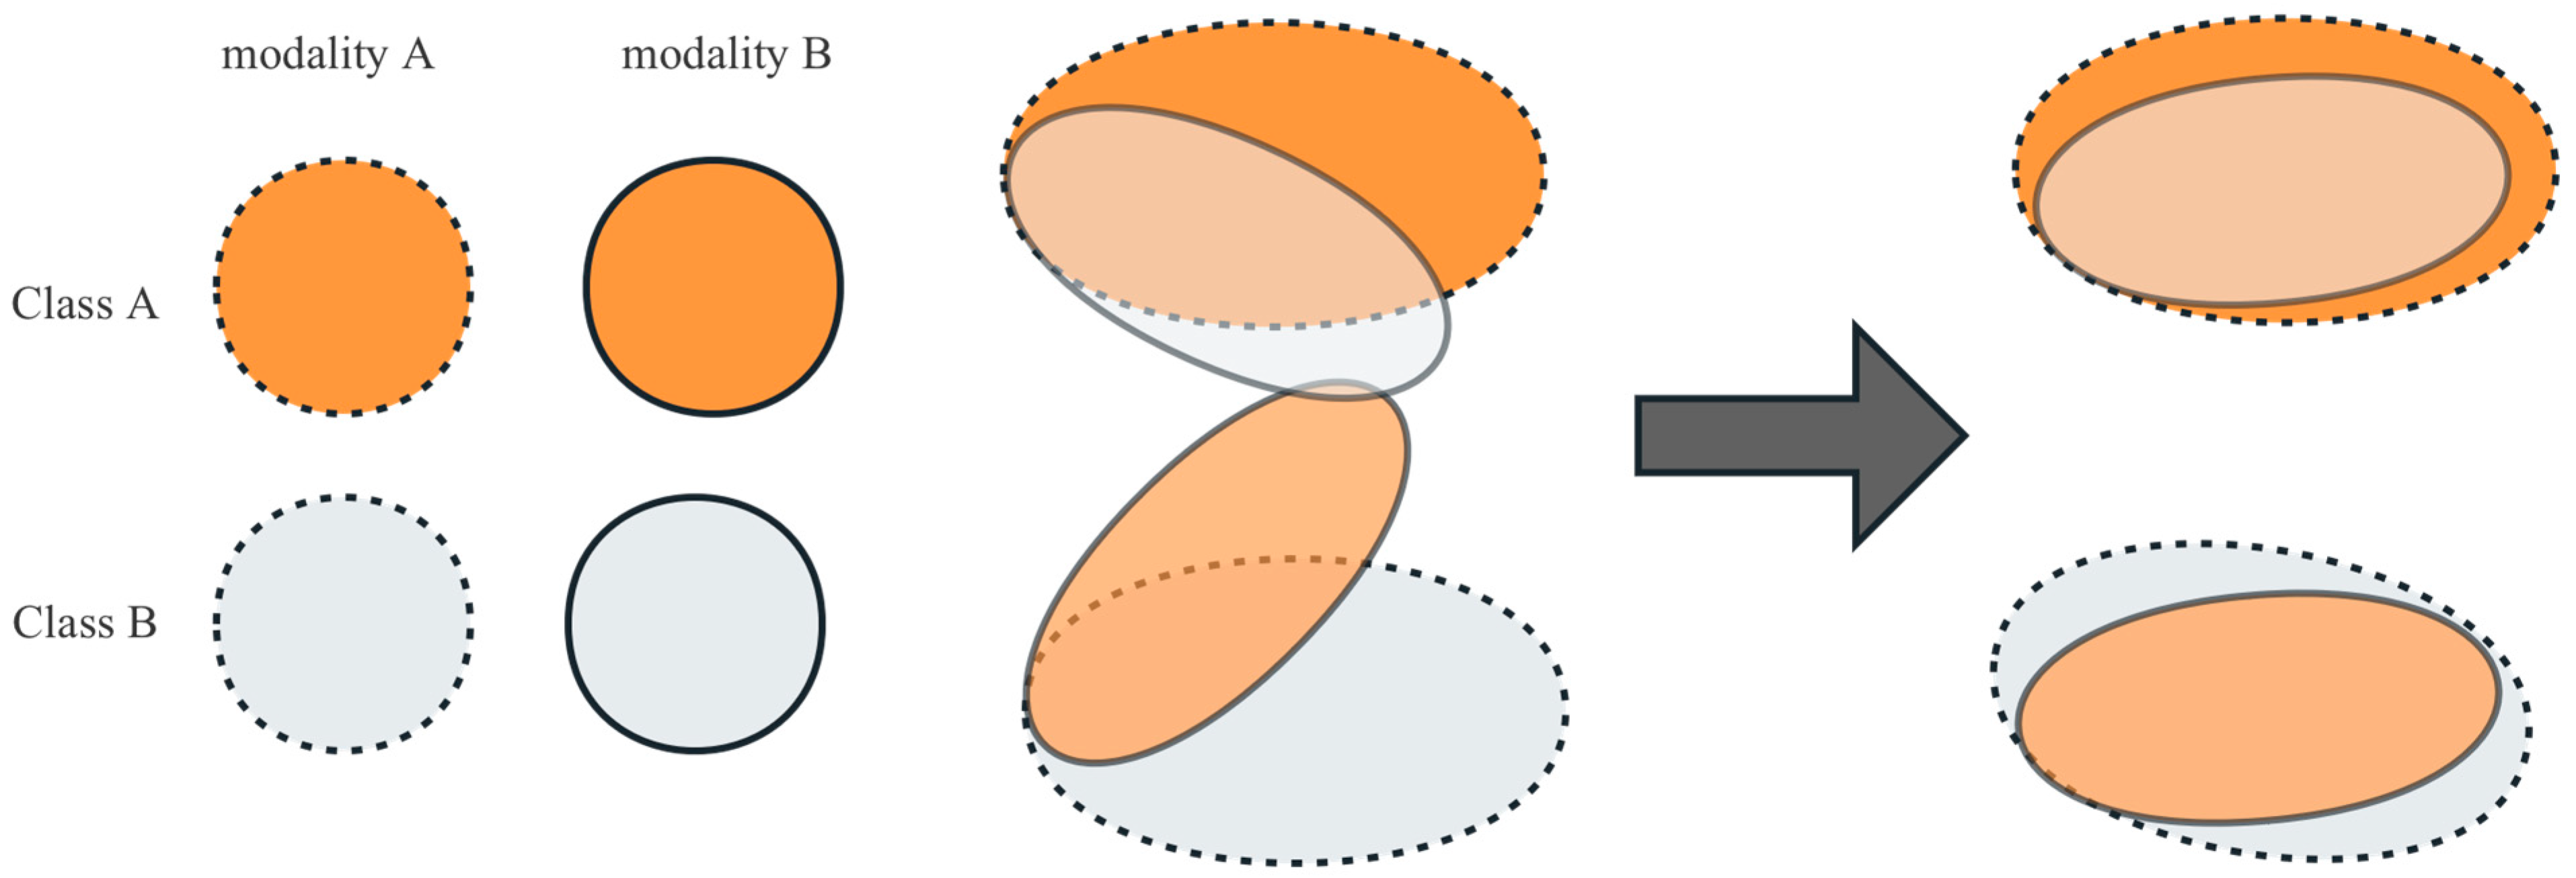
- Feature separation: This section introduces feature separation technology into RATR, aiming to explicitly partition the initial feature space of each modality into shared feature space and private feature space. Private features play a crucial role: when disturbances affect one modality’s private features or critical information is lost, the other modality’s private features can offer valuable support for target differentiation, thereby enhancing the recognition system’s robustness. Moreover, shared features are expected to provide a more abstract common representation of the two modalities, reducing overfitting to specific modes and improving robustness. Shared feature information is obtained by maximizing the similarity between the features of the average HRRP data and ISAR images, while private feature information is derived by maximizing the difference between the two. However, in our task, we found that the acquired shared feature representations may not consistently enhance sample discriminability. Consequently, we decided to forego the shared feature branches and only retain the private feature components to enhance the sample discriminability, making the model more robust and stable.
- Weighted decision fusion: We constructed three sub-classifiers for weighted decision fusion. We used the private features of the two modalities after feature separation and the private features after integration as inputs of these three sub-classifiers, with MCP used to set their weights. The purpose of using this module is to further improve the accuracy and reliability of decision making.
- Finally, the decision vector obtained by integrating the outputs of the three sub-classifiers is fed into a softmax layer to classify the target.
3.1. Initial Feature Extraction
3.2. Feature Separation
3.3. Weighted Decision Fusion
3.4. Overall Loss Function
4. Experiments and Results
4.1. Simulated Data
4.2. Measured Data
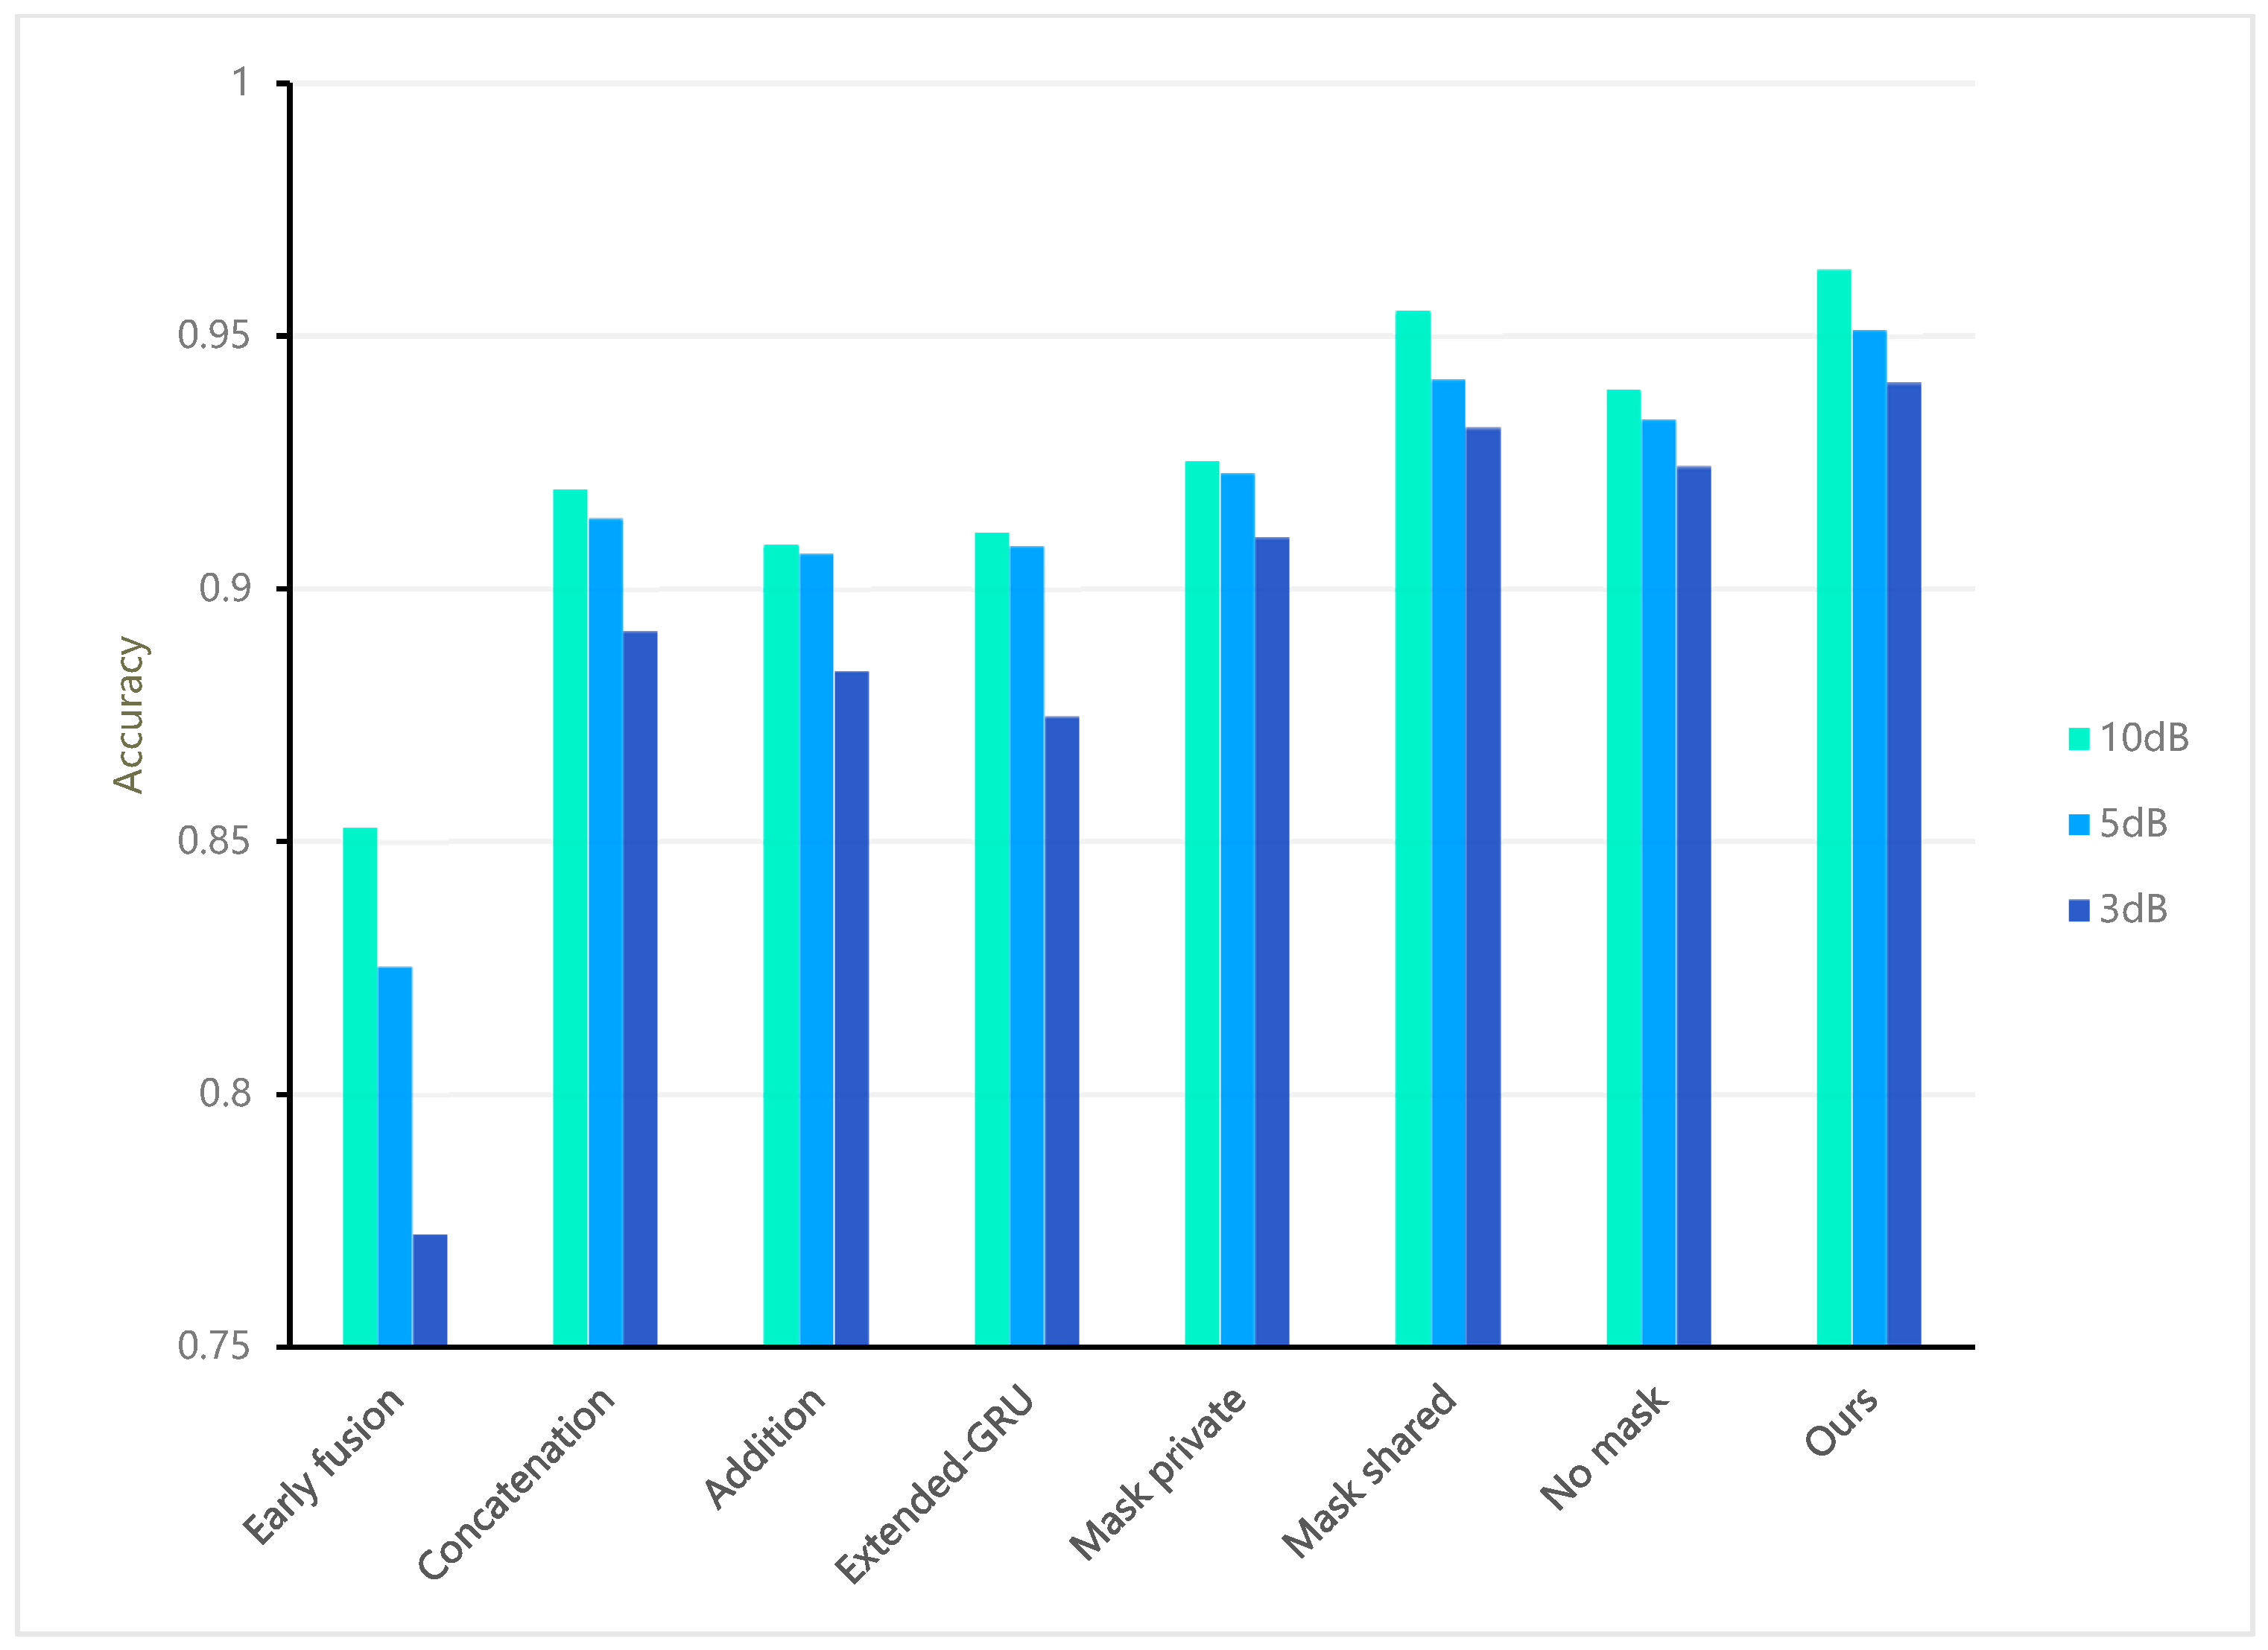
4.3. Ablation Study
5. Discussion
5.1. Comparison
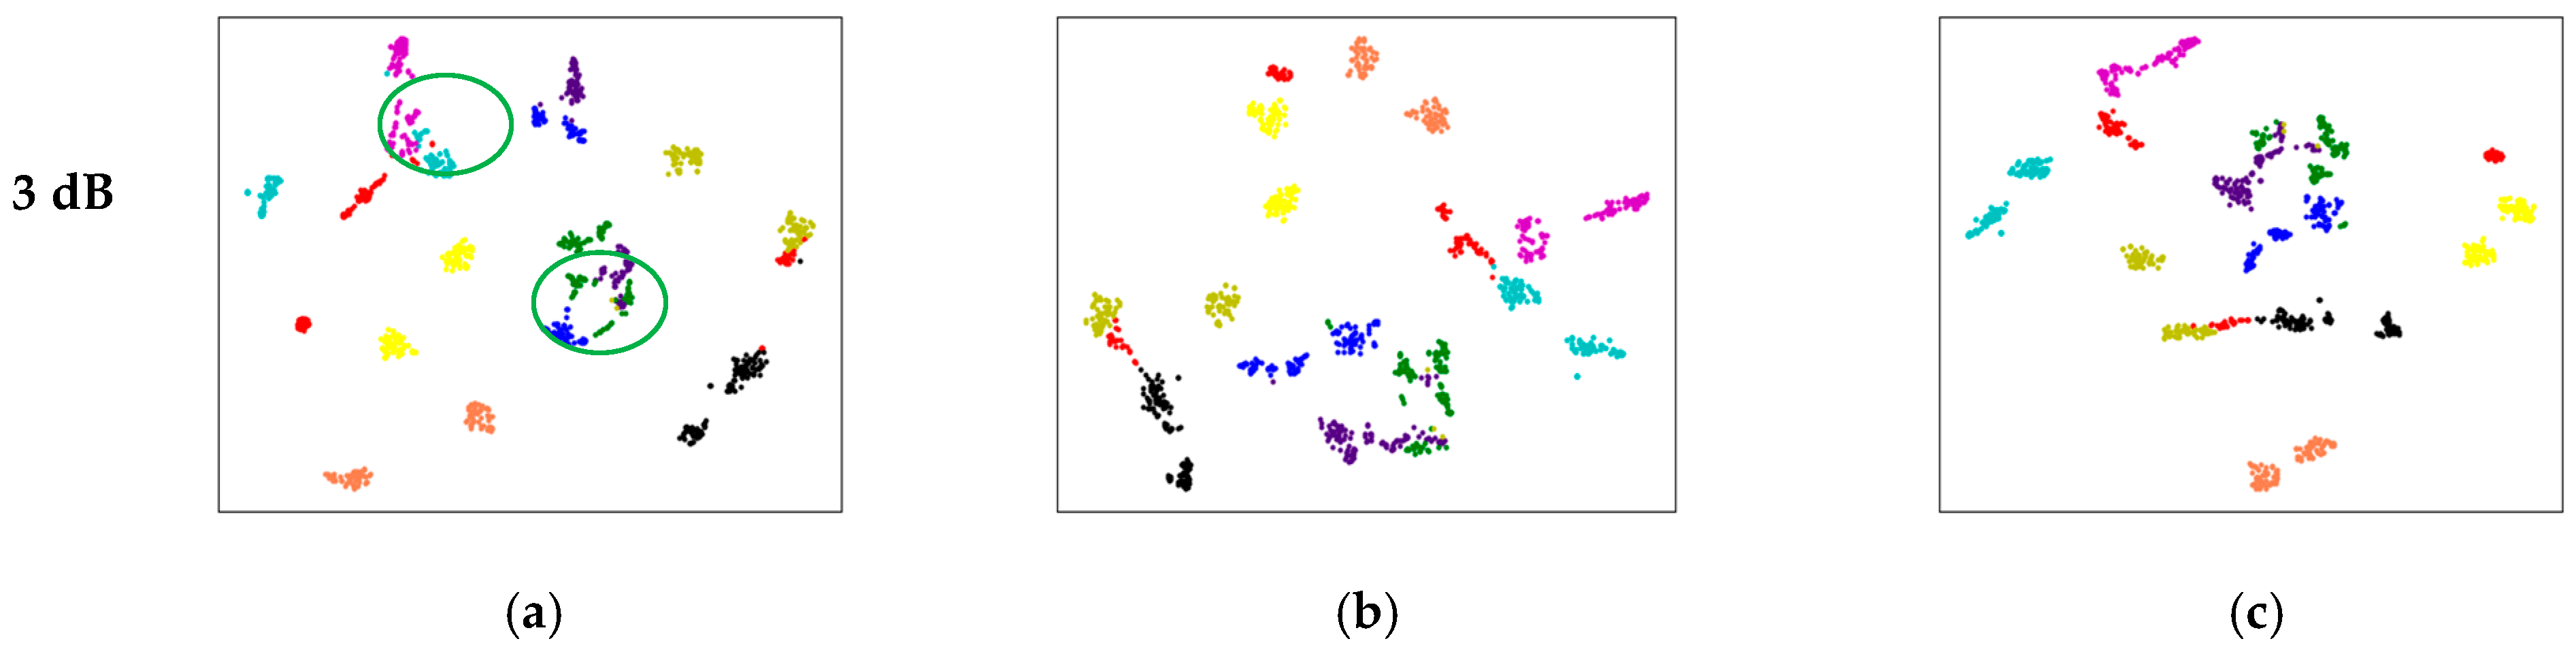
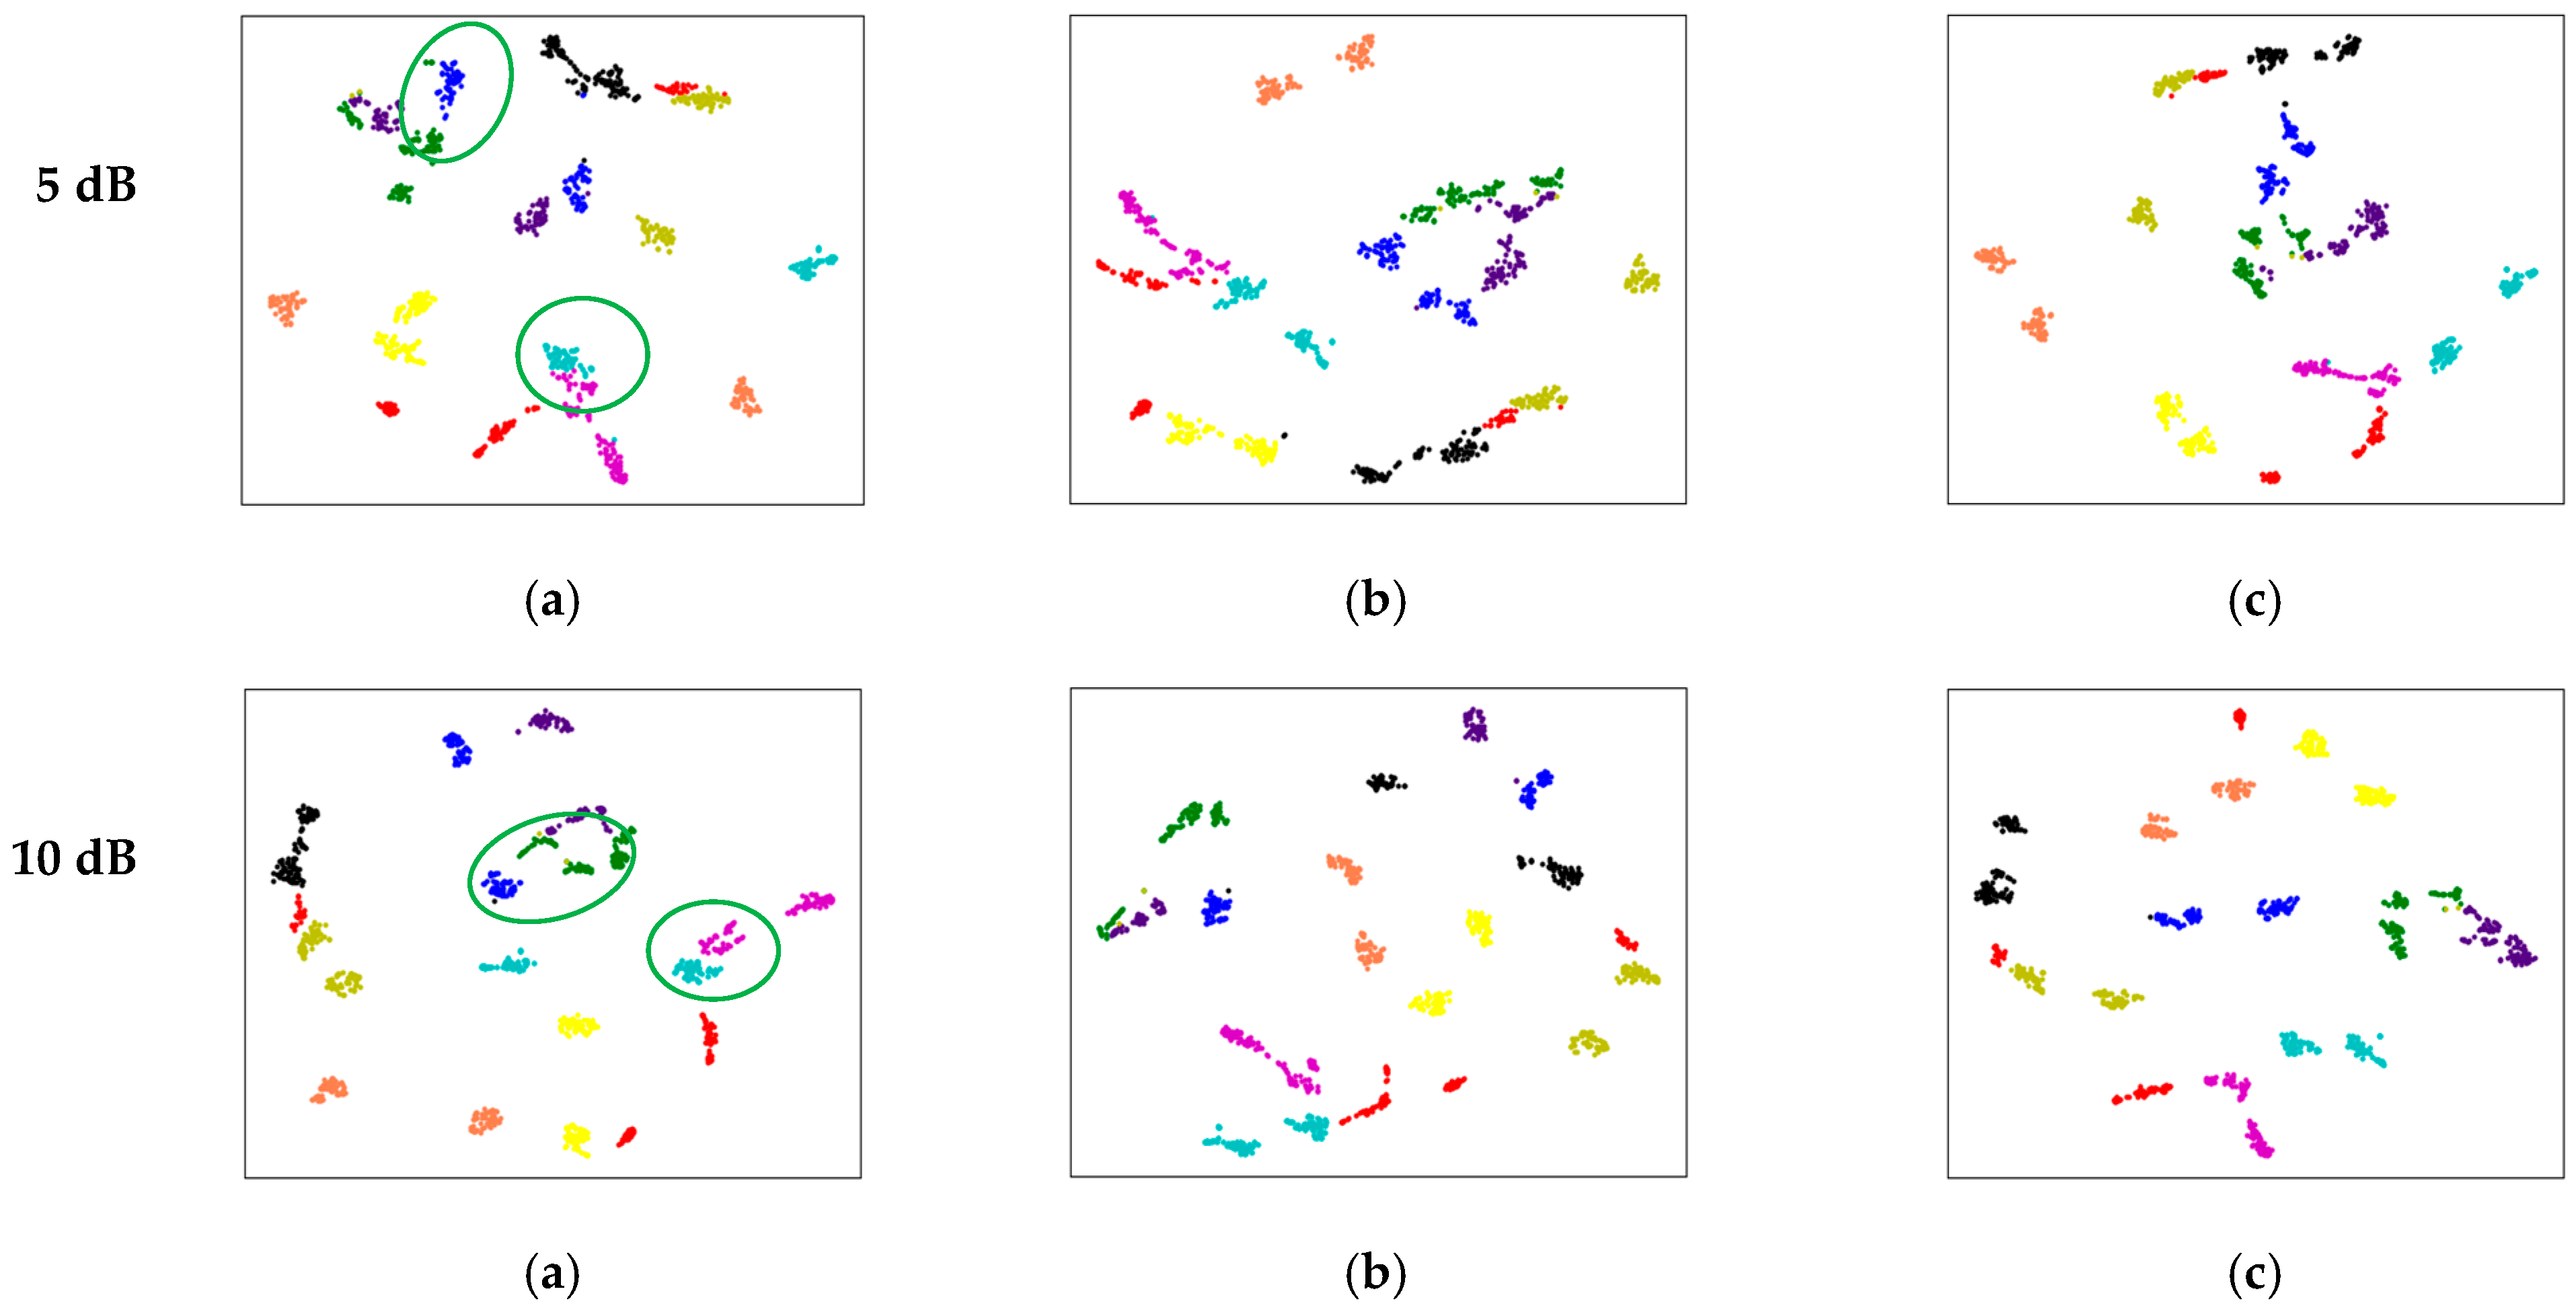
5.2. Feature Ambiguity
5.3. Ablation
5.4. Future Work
6. Conclusions
Author Contributions
Funding
Data Availability Statement
Acknowledgments
Conflicts of Interest
References
- Xue, R.; Bai, X.; Zhou, F. SAISAR-Net: A robust sequential adjustment ISAR image classification network. IEEE Trans. Geosci. Remote Sens. 2021, 60, 1–15. [Google Scholar] [CrossRef]
- Ni, P.; Liu, Y.; Pei, H.; Du, H.; Li, H.; Xu, G. Clisar-net: A deformation-robust isar image classification network using contrastive learning. Remote Sens. 2022, 15, 33. [Google Scholar] [CrossRef]
- Yan, H.; Zhang, Z.; Xiong, G.; Yu, W. Radar HRRP recognition based on sparse denoising autoencoder and multi-layer perceptron deep model. In Proceedings of the 2016 Fourth International Conference on Ubiquitous Positioning, Indoor Navigation and Location Based Services (UPINLBS), Shanghai, China, 2–4 November 2016; pp. 283–288. [Google Scholar]
- Du, C.; Chen, B.; Xu, B.; Guo, D.; Liu, H. Factorized discriminative conditional variational auto-encoder for radar HRRP target recognition. Signal Process. 2019, 158, 176–189. [Google Scholar] [CrossRef]
- Du, L.; Liu, H.; Bao, Z.; Zhang, J. Radar automatic target recognition using complex high-resolution range profiles. IET Radar Sonar Navig. 2007, 1, 18–26. [Google Scholar] [CrossRef]
- Du, L.; Liu, H.; Wang, P.; Feng, B.; Pan, M.; Bao, Z. Noise robust radar HRRP target recognition based on multitask factor analysis with small training data size. IEEE Trans. Signal Process. 2012, 60, 3546–3559. [Google Scholar]
- Xing, M.; Bao, Z.; Pei, B. Properties of high-resolution range profiles. Opt. Eng. 2002, 41, 493–504. [Google Scholar] [CrossRef]
- Pan, M.; Liu, A.; Yu, Y.; Wang, P.; Li, J.; Liu, Y.; Lv, S.; Zhu, H. Radar HRRP target recognition model based on a stacked CNN–Bi-RNN with attention mechanism. IEEE Trans. Geosci. Remote Sens. 2021, 60, 1–14. [Google Scholar] [CrossRef]
- Feng, B.; Chen, B.; Liu, H. Radar HRRP target recognition with deep networks. Pattern Recognit. 2017, 61, 379–393. [Google Scholar] [CrossRef]
- Chen, J.; Du, L.; Guo, G.; Yin, L.; Wei, D. Target-attentional CNN for radar automatic target recognition with HRRP. Signal Process. 2022, 196, 108497. [Google Scholar] [CrossRef]
- Du, L.; Li, L.; Guo, Y.; Wang, Y.; Ren, K.; Chen, J. Two-stream deep fusion network based on VAE and CNN for synthetic aperture radar target recognition. Remote Sens. 2021, 13, 4021. [Google Scholar] [CrossRef]
- Liao, L.; Du, L.; Chen, J. Class factorized complex variational auto-encoder for HRR radar target recognition. Signal Process. 2021, 182, 107932. [Google Scholar] [CrossRef]
- Pan, M.; Jiang, J.; Kong, Q.; Shi, J.; Sheng, Q.; Zhou, T. Radar HRRP target recognition based on t-SNE segmentation and discriminant deep belief network. IEEE Geosci. Remote Sens. Lett. 2017, 14, 1609–1613. [Google Scholar] [CrossRef]
- Chen, J.; Du, L.; Liao, L. Discriminative mixture variational autoencoder for semisupervised classification. IEEE Trans. Cybern. 2020, 52, 3032–3046. [Google Scholar] [CrossRef] [PubMed]
- Wan, J.; Chen, B.; Xu, B.; Liu, H.; Jin, L. Convolutional neural networks for radar HRRP target recognition and rejection. EURASIP J. Adv. Signal Process. 2019, 2019, 5. [Google Scholar] [CrossRef]
- Sathyendra, H.M.; Stephan, B.D. Data fusion analysis for maritime automatic target recognition with designation confidence metrics. In Proceedings of the 2015 IEEE Radar Conference (RadarCon), Arlington, VA, USA, 10–15 May 2015; pp. 0062–0067. [Google Scholar]
- Manno-Kovacs, A.; Giusti, E.; Berizzi, F.; Kovács, L. Automatic target classification in passive ISAR range-crossrange images. In Proceedings of the 2018 IEEE Radar Conference (RadarConf18), Oklahoma, OK, USA, 23–27 April 2018; pp. 0206–0211. [Google Scholar]
- Jarabo-Amores, P.; Giusti, E.; Rosa-Zurera, M.; Bacci, A.; Capria, A.; Mata-Moya, D. Target classification using passive radar ISAR imagery. In Proceedings of the 2017 European Radar Conference (EURAD), Nuremberg, Germany, 11–13 October 2017; pp. 155–158. [Google Scholar]
- Kurowska, A.; Kulpa, J.S.; Giusti, E.; Conti, M. Classification results of ISAR sea targets based on their two features. In Proceedings of the 2017 Signal Processing Symposium (SPSympo), Jachranka, Poland, 12–14 September 2017; pp. 1–6. [Google Scholar]
- Kawahara, T.; Toda, S.; Mikami, A.; Tanabe, M. Automatic ship recognition robust against aspect angle changes and occlusions. In Proceedings of the 2012 IEEE Radar Conference, Atlanta, GA, USA, 7–11 May 2012; pp. 0864–0869. [Google Scholar]
- Bai, X.; Zhou, X.; Zhang, F.; Wang, L.; Xue, R.; Zhou, F. Robust pol-ISAR target recognition based on ST-MC-DCNN. IEEE Trans. Geosci. Remote Sens. 2019, 57, 9912–9927. [Google Scholar] [CrossRef]
- Zhao, W.; Heng, A.; Rosenberg, L.; Nguyen, S.T.; Hamey, L.; Orgun, M. ISAR ship classification using transfer learning. In Proceedings of the 2022 IEEE Radar Conference (RadarConf22), New York, NY, USA, 21–25 March 2022; pp. 1–6. [Google Scholar]
- Lu, W.; Zhang, Y.; Yin, C.; Lin, C.; Xu, C.; Zhang, X. A deformation robust ISAR image satellite target recognition method based on PT-CCNN. IEEE Access 2021, 9, 23432–23453. [Google Scholar] [CrossRef]
- Krizhevsky, A.; Sutskever, I.; Hinton, G.E. Imagenet classification with deep convolutional neural networks. Adv. Neural Inf. Process. Syst. 2012, 25. [Google Scholar] [CrossRef]
- Stiller, C.; Leon, F.P.; Kruse, M. Information fusion for automotive applications–An overview. Inf. Fusion 2011, 12, 244–252. [Google Scholar] [CrossRef]
- Jiang, L.; Yan, L.; Xia, Y.; Guo, Q.; Fu, M.; Lu, K. Asynchronous multirate multisensor data fusion over unreliable measurements with correlated noise. IEEE Trans. Aerosp. Electron. Syst. 2017, 53, 2427–2437. [Google Scholar] [CrossRef]
- Rasti, B.; Ghamisi, P.; Plaza, J.; Plaza, A. Fusion of hyperspectral and LiDAR data using sparse and low-rank component analysis. IEEE Trans. Geosci. Remote Sens. 2017, 55, 6354–6365. [Google Scholar] [CrossRef]
- Bassford, M.; Painter, B. Intelligent bio-environments: Exploring fuzzy logic approaches to the honeybee crisis. In Proceedings of the 2016 12th International Conference on Intelligent Environments (IE), London, UK, 14–16 September 2016; pp. 202–205. [Google Scholar]
- Choi, I.O.; Jung, J.H.; Kim, S.H.; Kim, K.T.; Park, S.H. Classification of targets improved by fusion of the range profile and the inverse synthetic aperture radar image. Prog. Electromagn. Res. 2014, 144, 23–31. [Google Scholar] [CrossRef]
- Wang, L.; Weng, L.; Xia, M.; Liu, J.; Lin, H. Multi-resolution supervision network with an adaptive weighted loss for desert segmentation. Remote Sens. 2021, 13, 2054. [Google Scholar] [CrossRef]
- Guan, R.; Li, Z.; Tu, W.; Wang, J.; Liu, Y.; Li, X.; Tang, C.; Feng, R. Contrastive Multi-view Subspace Clustering of Hyperspectral Images based on Graph Convolutional Networks. IEEE Trans. Geosci. Remote Sens. 2024, 62, 1–14. [Google Scholar]
- Guan, R.; Li, Z.; Li, X.; Tang, C. Pixel-Superpixel Contrastive Learning and Pseudo-Label Correction for Hyperspectral Image Clustering. arXiv 2023, arXiv:2312.09630. [Google Scholar]
- Shang, R.; Zhang, J.; Jiao, L.; Li, Y.; Marturi, N.; Stolkin, R. Multi-scale adaptive feature fusion network for semantic segmentation in remote sensing images. Remote Sens. 2020, 12, 872. [Google Scholar] [CrossRef]
- Guan, R.; Li, Z.; Li, T.; Li, X.; Yang, J.; Chen, W. Classification of heterogeneous mining areas based on rescapsnet and gaofen-5 imagery. Remote Sens. 2022, 14, 3216. [Google Scholar] [CrossRef]
- Chen, J.; He, F.; Zhang, Y.; Sun, G.; Deng, M. SPMF-Net: Weakly supervised building segmentation by combining superpixel pooling and multi-scale feature fusion. Remote Sens. 2020, 12, 1049. [Google Scholar] [CrossRef]
- Liu, J.; Guan, R.; Li, Z.; Zhang, J.; Hu, Y.; Wang, X. Adaptive multi-feature fusion graph convolutional network for hyperspectral image classification. Remote Sens. 2023, 15, 5483. [Google Scholar] [CrossRef]
- Li, X.; Ran, J.; Wen, Y.; Wei, S.; Yang, W. MVFRnet: A Novel High-Accuracy Network for ISAR Air-Target Recognition via Multi-View Fusion. Remote Sens. 2023, 15, 3052. [Google Scholar] [CrossRef]
- Li, R.; Hu, Y.; Li, L.; Guan, R.; Yang, R.; Zhan, J.; Cai, W.; Wang, Y.; Xu, H.; Li, L. SMWE-GFPNNet: A high-precision and robust method for forest fire smoke detection. Knowl.-Based Syst. 2024, 289, 111528. [Google Scholar] [CrossRef]
- Bousmalis, K.; Trigeorgis, G.; Silberman, N.; Krishnan, D.; Erhan, D. Domain separation networks. Adv. Neural Inf. Process. Syst. 2016, 29. [Google Scholar]
- Lee, M.; Pavlovic, V. Private-shared disentangled multimodal vae for learning of latent representations. In Proceedings of the IEEE/CVF Conference on Computer Vision and Pattern Recognition, Nashville, TN, USA, 20–25 June 2021; pp. 1692–1700. [Google Scholar]
- Wu, F.; Jing, X.Y.; Wu, Z.; Ji, Y.; Dong, X.; Luo, X.; Huang, Q.; Wang, R. Modality-specific and shared generative adversarial network for cross-modal retrieval. Pattern Recognit. 2020, 104, 107335. [Google Scholar] [CrossRef]
- Wang, J.; Wang, Z.; Tao, D.; See, S.; Wang, G. Learning common and specific features for RGB-D semantic segmentation with deconvolutional networks. In Proceedings of the Computer Vision–ECCV 2016: 14th European Conference, Amsterdam, The Netherlands, 11–14 October 2016; Proceedings, Part V 14. Springer: Berlin/Heidelberg, Germany, 2016; pp. 664–679. [Google Scholar]
- van Amsterdam, B.; Kadkhodamohammadi, A.; Luengo, I.; Stoyanov, D. Aspnet: Action segmentation with shared-private representation of multiple data sources. In Proceedings of the IEEE/CVF Conference on Computer Vision and Pattern Recognition, Vancouver, BC, Canada, 17–24 June 2023; pp. 2384–2393. [Google Scholar]
- Long, M.; Cao, Y.; Wang, J.; Jordan, M. Learning transferable features with deep adaptation networks. In Proceedings of the International Conference on Machine Learning, Lille, France, 6–11 July 2015; pp. 97–105. [Google Scholar]
- Glodek, M.; Tschechne, S.; Layher, G.; Schels, M.; Brosch, T.; Scherer, S.; Kächele, M.; Schmidt, M.; Neumann, H.; Palm, G.; et al. Multiple classifier systems for the classification of audio-visual emotional states. In Proceedings of the Affective Computing and Intelligent Interaction: Fourth International Conference, ACII 2011, Memphis, TN, USA, 9–12 October 2011; Proceedings, Part II. Springer: Berlin/Heidelberg, Germany, 2011; pp. 359–368. [Google Scholar]
- Jin, X.; Su, F. Aircraft Recognition Using ISAR Image Based on Quadrangle-points Affine Transform. In Proceedings of the 2022 15th International Congress on Image and Signal Processing, BioMedical Engineering and Informatics (CISP-BMEI), Beijing, China, 5–7 November 2022; pp. 1–6. [Google Scholar]
- Jin, X.; Su, F.; Li, H.; Xu, Z.; Deng, J. Automatic ISAR Ship Detection Using Triangle-Points Affine Transform Reconstruction Algorithm. Remote Sens. 2023, 15, 2507. [Google Scholar] [CrossRef]
- Zadeh, A.; Chen, M.; Poria, S.; Cambria, E.; Morency, L.P. Tensor fusion network for multimodal sentiment analysis. arXiv 2017, arXiv:1707.07250. [Google Scholar]
- Liu, Z.; Shen, Y.; Lakshminarasimhan, V.B.; Liang, P.P.; Zadeh, A.; Morency, L.P. Efficient low-rank multimodal fusion with modality-specific factors. arXiv 2018, arXiv:1806.00064. [Google Scholar]


| Parameter | Value |
|---|---|
| Center frequency | 8.075 GHz |
| Bandwidth | 150 MHz |
| PRF | 200 Hz |
| Observation time | 0.32 s |
| Top-View | Side-View | ||||
|---|---|---|---|---|---|
| Target | T1 | T2–T10 | Target | T1 | T2–T10 |
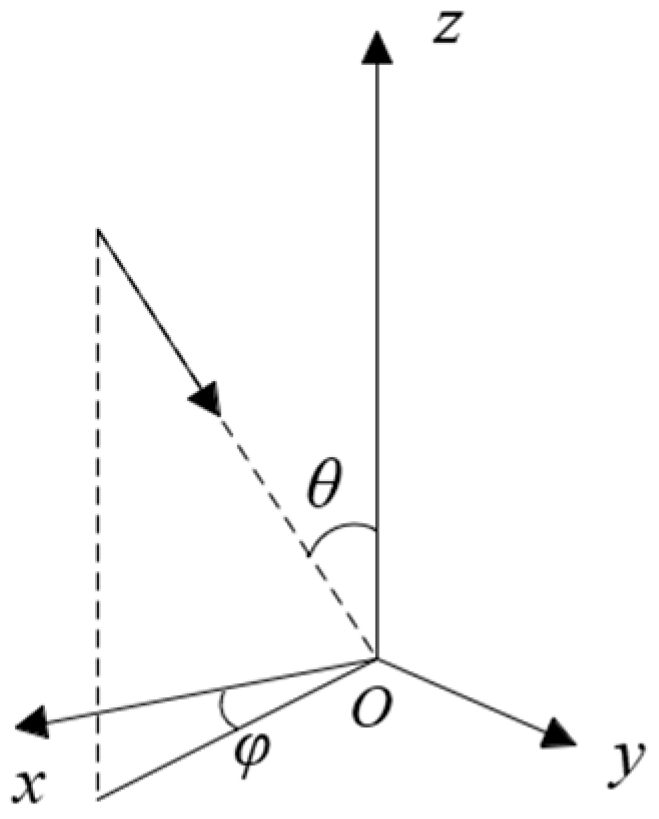
| Pitch angle (θ) | 80°/85° | 80°/85° | Azimuth angle (φ) | 10°/15° | 10°/15° |
| Initial azimuth angle (φ) | 5° | 5° | Initial pitch angle (θ) | 40° | 40° |
| Azimuth motion 1 | 0.04°/s | 0.27°/s | Pitch motion 1 | 0.08°/s | 0.51°/s |
| Azimuth angle interval 1 | 0.02° | 0.132° | Pitch angle interval 1 | 0.04° | 0.240° |
| Azimuth motion 2 | 0.08°/s | 0.54°/s | Pitch motion 2 | 0.16°/s | 1.01°/s |
| Azimuth angle interval 2 | 0.04° | 0.211° | Pitch angle interval 2 | 0.08° | 0.384° |
| Missing_ Aspect15_Pitch85 | Missing_ Aspect15_Pitch80 | Missing_ Aspect10_Pitch85 | Missing_ Aspect10_Pitch80 | Average | |
|---|---|---|---|---|---|
| 3 dB | 91.34% | 97.06% | 91.90% | 96.08% | 94.09% |
| 5 dB | 92.53% | 97.33% | 94.56% | 96.15% | 95.14% |
| 10 dB | 94.45% | 97.61% | 95.67% | 97.53% | 96.32% |
| 3 dB | 5 dB | 10 dB | |
|---|---|---|---|
| Early fusion | 77.24% | 82.53% | 85.28% |
| Concatenation | 89.17% | 91.40% | 91.98% |
| Addition | 88.39% | 90.70% | 90.88% |
| Ex-GRU [11] | 87.48% | 90.85% | 91.13% |
| Mask private | 91.03% | 92.30% | 92.53% |
| Mask shared | 93.20% | 94.15% | 95.51% |
| No mask | 92.43% | 93.36% | 93.95% |
| SDRnet (Ours) | 94.09% | 95.14% | 96.32% |
| 3 dB | 5 dB | 10 dB | |
|---|---|---|---|
| Mask private | 84.31% | 86.63% | 88.92% |
| Mask shared | 89.35% | 90.20% | 93.15% |
| No mask | 87.50% | 87.85% | 89.26% |
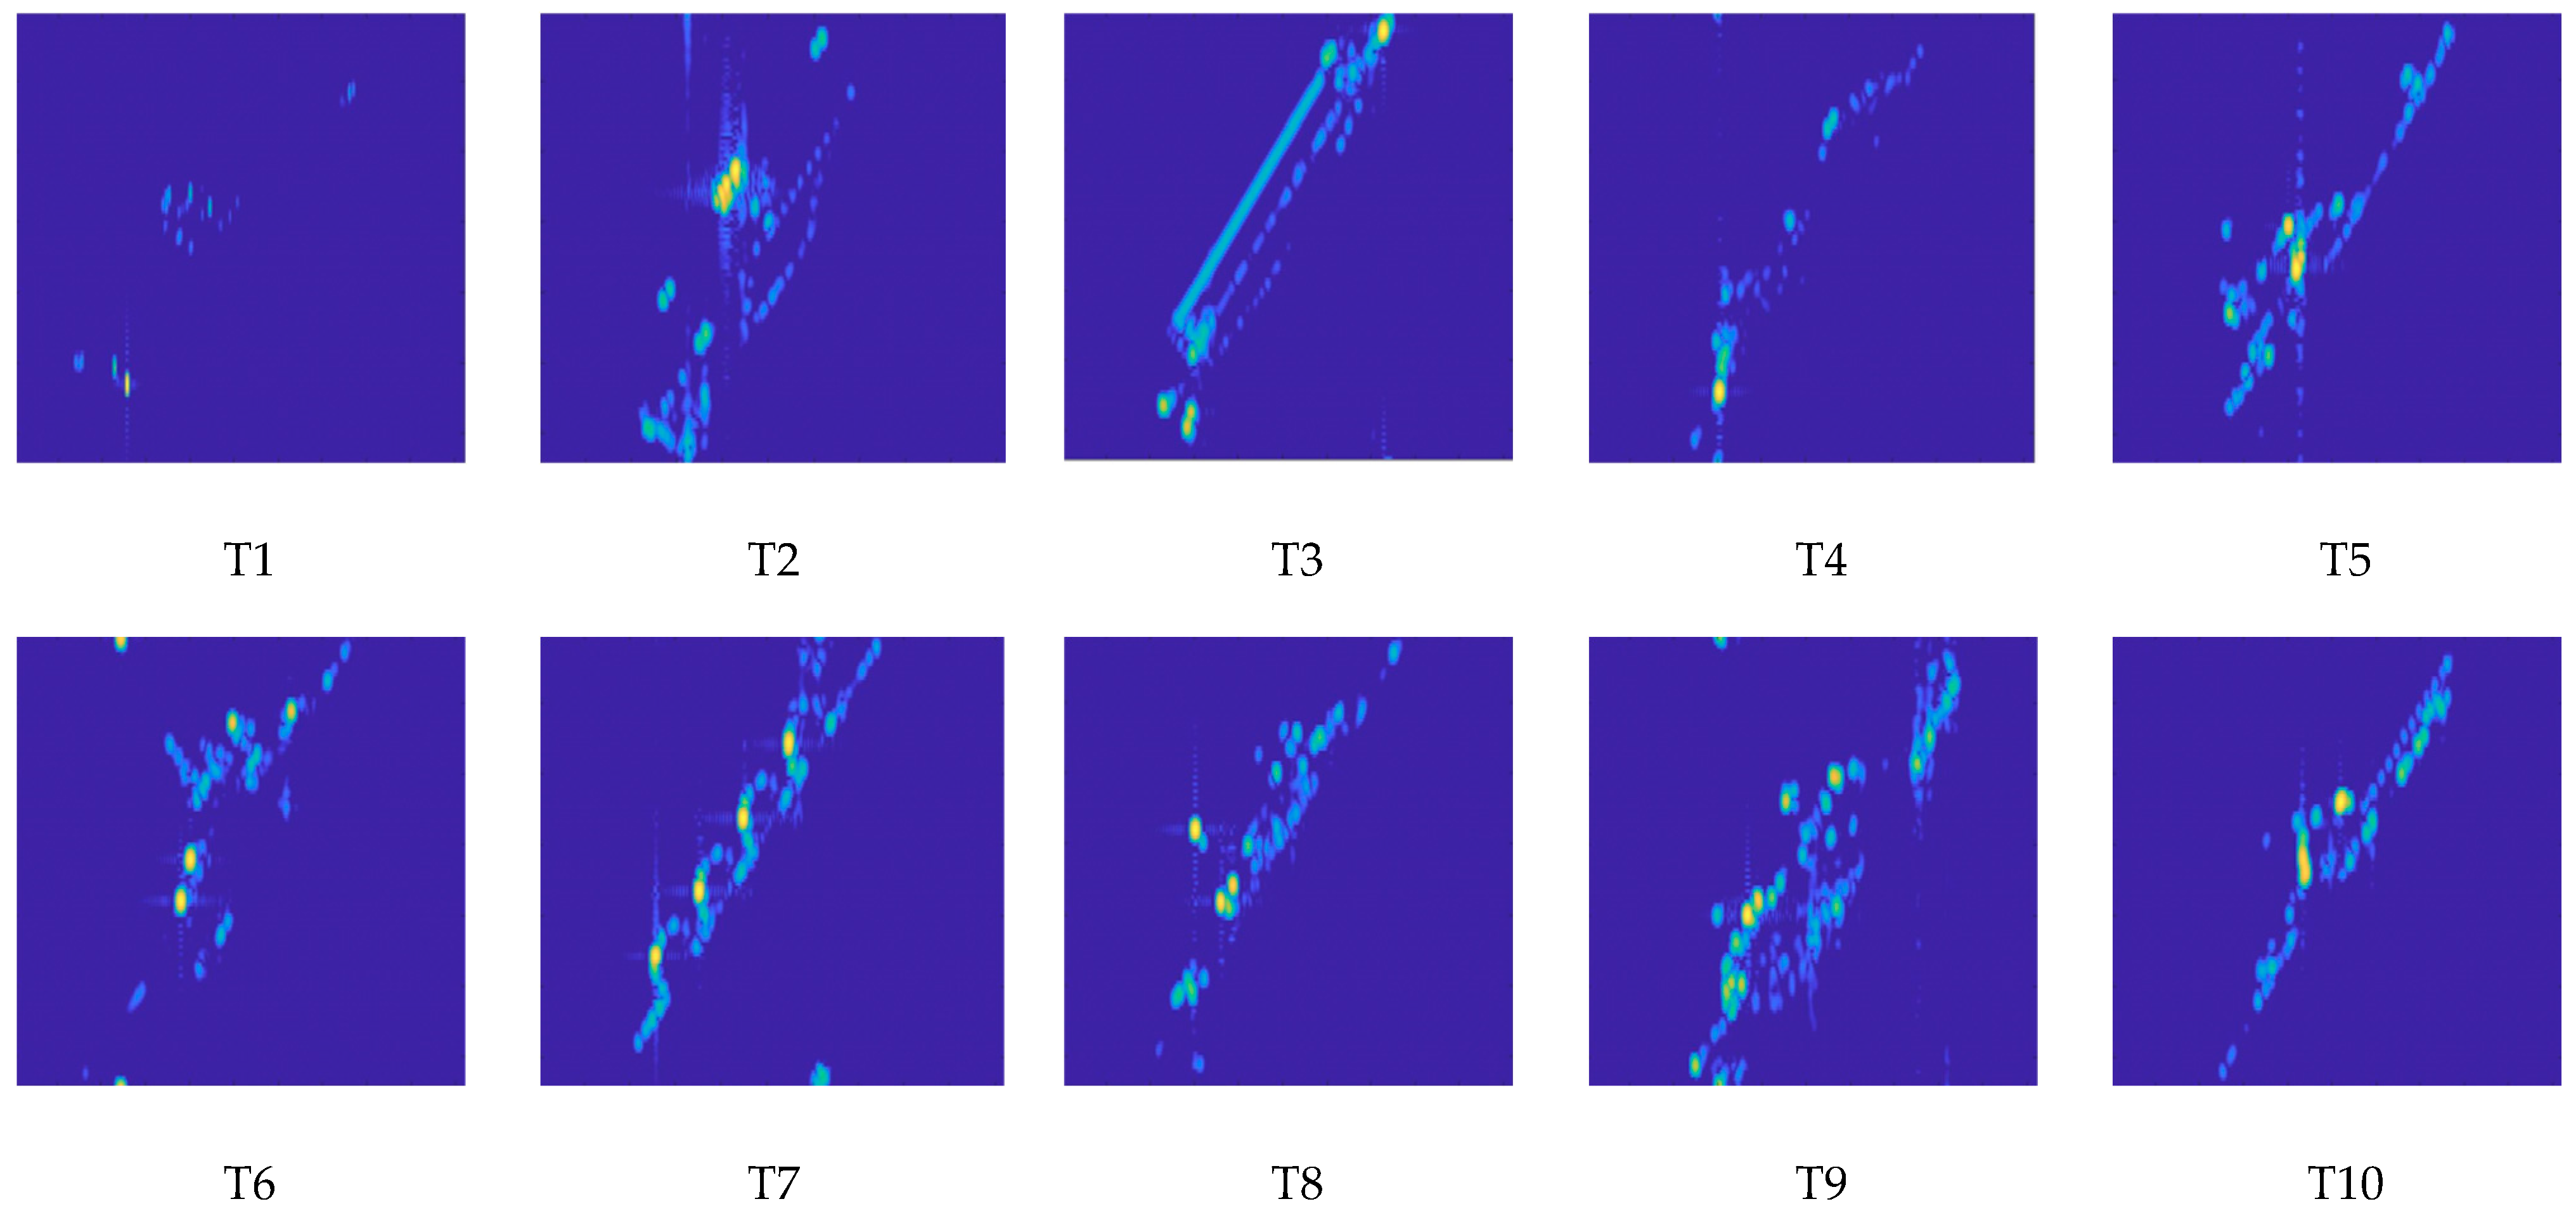
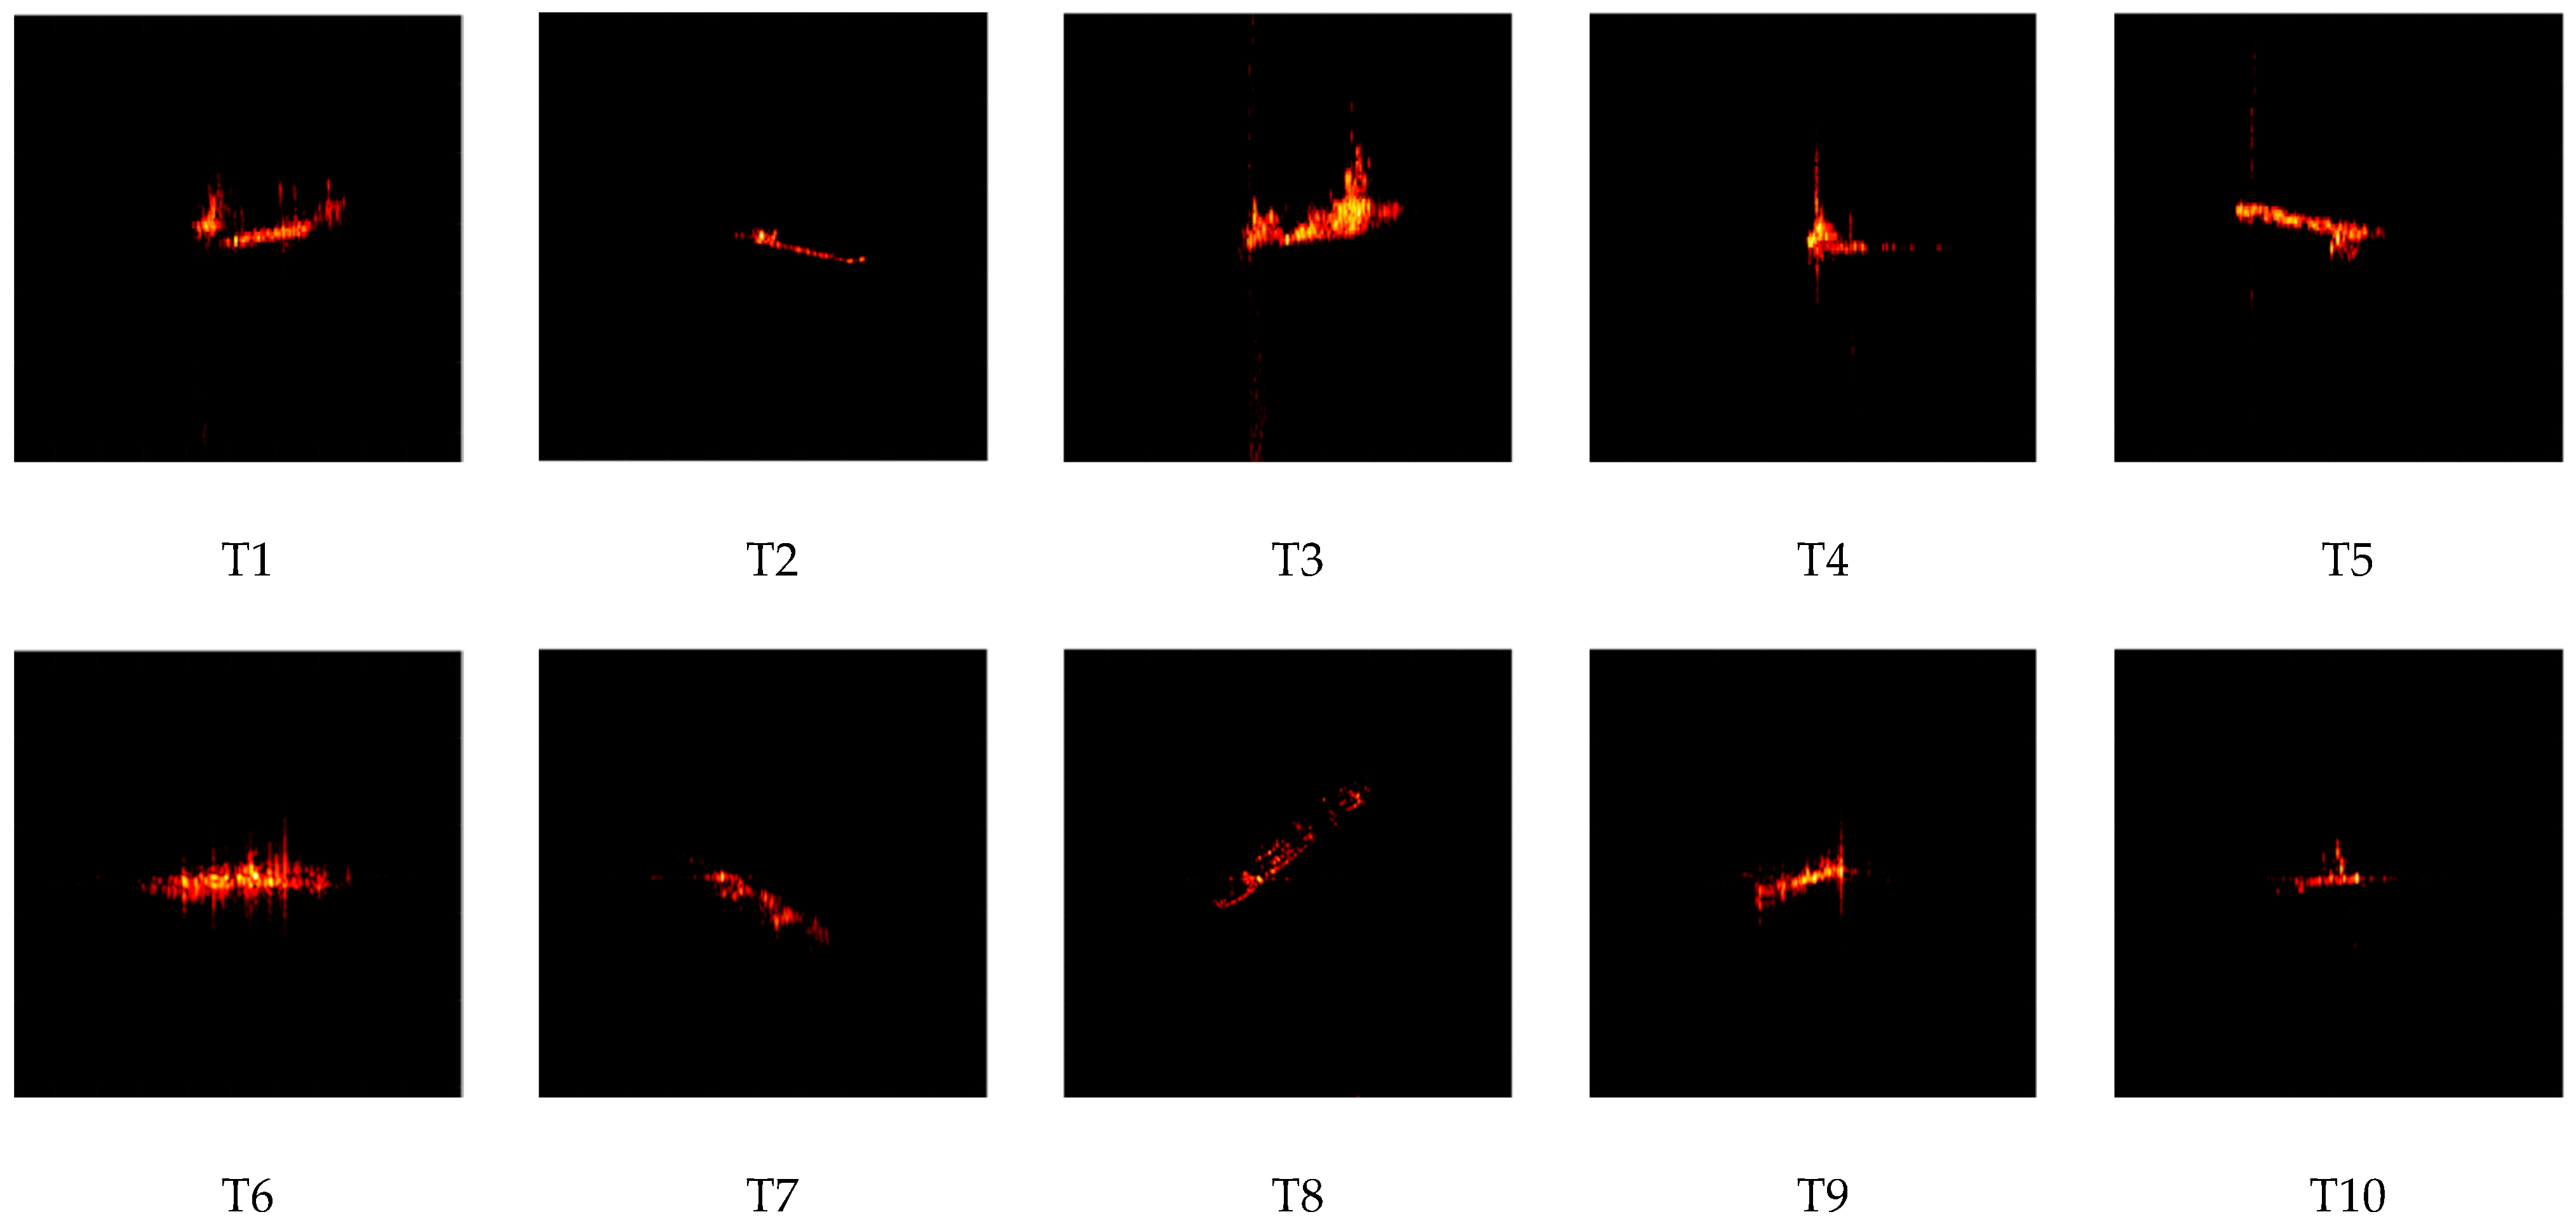
| Dataset | T1 | T2 | T3 | T4 | T5 | T6 | T7 | T8 | T9 | T10 |
|---|---|---|---|---|---|---|---|---|---|---|
| Training Samples | 150 | 91 | 91 | 200 | 127 | 73 | 88 | 49 | 80 | 93 |
| Test Samples | 350 | 90 | 189 | 285 | 222 | 97 | 180 | 50 | 21 | 32 |
| T1 | T2 | T3 | T4 | T5 | T6 | T7 | T8 | T9 | T10 | Accuracy (%) | |
|---|---|---|---|---|---|---|---|---|---|---|---|
| Early fusion | 90.00 | 100 | 95.76 | 99.65 | 87.84 | 100 | 93.88 | 96.00 | 47.62 | 84.38 | 93.40 |
| Concatenation | 82.57 | 100 | 98.94 | 100 | 95.05 | 100 | 91.67 | 100 | 76.19 | 68.75 | 93.14 |
| Addition | 80.29 | 100 | 98.94 | 100 | 94.59 | 100 | 91.67 | 92.00 | 61.90 | 68.75 | 92.08 |
| Ex-GRU [11] | 81.43 | 100 | 96.83 | 100 | 98.20 | 100 | 91.67 | 94.00 | 85.71 | 56.25 | 92.74 |
| Mask private | 85.14 | 97.78 | 100 | 100 | 98.65 | 100 | 91.67 | 84.00 | 66.67 | 78.13 | 93.80 |
| Mask shared | 89.71 | 100 | 100 | 100 | 98.20 | 100 | 91.67 | 94.00 | 66.67 | 65.62 | 94.85 |
| No mask | 87.43 | 100 | 96.30 | 100 | 98.65 | 98.97 | 91.11 | 96.00 | 85.71 | 71.88 | 94.39 |
| SDRnet (ours) | 92.00 | 96.67 | 100 | 100 | 99.55 | 100 | 90.56 | 94.00 | 90.48 | 68.75 | 95.78 |
| Only Image | Only HRRP | Proposed Fusion Method | Accuracy (%) | ||
|---|---|---|---|---|---|
| √ | × | × | 82.48 | ||
| 3 dB | × | √ | × | 83.03 | |
| √ | √ | √ | 94.09 | ||
| √ | × | × | 83.48 | ||
| 5 dB | × | √ | × | 86.23 | Simulated |
| √ | √ | √ | 95.14 | ||
| √ | × | × | 86.33 | ||
| 10 dB | × | √ | × | 87.18 | |
| √ | √ | √ | 96.32 | ||
| √ | × | × | 90.22 | Measured | |
| × | √ | × | 89.12 | ||
| √ | √ | √ | 95.78 |
Disclaimer/Publisher’s Note: The statements, opinions and data contained in all publications are solely those of the individual author(s) and contributor(s) and not of MDPI and/or the editor(s). MDPI and/or the editor(s) disclaim responsibility for any injury to people or property resulting from any ideas, methods, instructions or products referred to in the content. |
© 2024 by the authors. Licensee MDPI, Basel, Switzerland. This article is an open access article distributed under the terms and conditions of the Creative Commons Attribution (CC BY) license (https://creativecommons.org/licenses/by/4.0/).
Share and Cite
Deng, J.; Su, F. SDRnet: A Deep Fusion Network for ISAR Ship Target Recognition Based on Feature Separation and Weighted Decision. Remote Sens. 2024, 16, 1920. https://doi.org/10.3390/rs16111920
Deng J, Su F. SDRnet: A Deep Fusion Network for ISAR Ship Target Recognition Based on Feature Separation and Weighted Decision. Remote Sensing. 2024; 16(11):1920. https://doi.org/10.3390/rs16111920
Chicago/Turabian StyleDeng, Jie, and Fulin Su. 2024. "SDRnet: A Deep Fusion Network for ISAR Ship Target Recognition Based on Feature Separation and Weighted Decision" Remote Sensing 16, no. 11: 1920. https://doi.org/10.3390/rs16111920
APA StyleDeng, J., & Su, F. (2024). SDRnet: A Deep Fusion Network for ISAR Ship Target Recognition Based on Feature Separation and Weighted Decision. Remote Sensing, 16(11), 1920. https://doi.org/10.3390/rs16111920