Article

InSAR- and PCA-Based Inversion Reveals the Surface Deformation and Earthquake Sequence in the Weiyuan-Rongxian Shale Gas Field

1
School of Geosciences and Info-Physics, Central South University, Changsha 410083, China
2
Pacific Geoscience Centre, Geological Survey of Canada, 9860 W. Saanich Road, Sidney, BC V8L 5Y8, Canada
3
School of Earth and Ocean Sciences, The University of Victoria, Victoria, BC V8W 2Y2, Canada
*
Author to whom correspondence should be addressed.
Remote Sens. 2024, 16(11), 1929; https://doi.org/10.3390/rs16111929
Submission received: 17 April 2024 / Revised: 17 May 2024 / Accepted: 18 May 2024 / Published: 27 May 2024

Abstract

:
In recent years, the rapid expansion and development of the shale gas industry in the Sichuan Basin has coincided with a series of unexpected moderate-sized earthquakes. Given that the Sichuan Basin is situated within a stable interior block, the focal mechanism of the 2019 earthquake sequence (ML4.7, ML5.4, and ML5.2) in the Weiyuan-Rongxian area remains a subject of debate. In this study, we propose a joint InSAR- and PCA- based inversion method utilizing the distributed Mogi model to investigate the spatial-temporal characteristics of a gas reservoir and evaluate the induced Coulomb stress change. The surface deformation derived from Sentinel-1 data between 2015 and 2021 was consistent with the spatial distribution of production wells, and it correlated with the temporal changes in reservoir volume associated with the shale gas operating process. The Coulomb stress loading on the regional faults suggests that human activities associated with shale gas operation likely triggered the three moderate earthquakes. Furthermore, our results indicate Coulomb stress loadings of 10 kPa, 15 kPa, 5 kPa, 3 kPa, and 87 kPa on the Dongxingchang fault, Gaoqiao fault, Dayaokou fault, Niujingao fault, and Lijiachang fold, respectively. Consequently, fluid injection and extraction during shale gas development could be contributing to the elevated seismic activity in the Weiyuan-Rongxian area.

1. Introduction

Hydraulic fracturing involves injecting pressurized fluid into a dense rock matrix to increase its permeability and improve the rate of production [1,2]. However, the fractures opened by fluid injection and extraction, along with underground stress changes, can trigger earthquakes through pore pressure disturbance [3], poroelastic stress changes induced by rock matrix volume deformation [4], and aseismic slip [5,6,7]. Therefore, the seismic hazards during shale gas exploitation have always been a critical concern in both industry and scientific community. The Chuannan shale gas field is a key region for shale gas industry in China. Since the initiation of large-scale hydraulic fracturing in 2014, this region has experienced a series of unexpected earthquakes linked to gas development [8]. Among them, three moderate-to-strong earthquakes of ML4.9 on 24 February 2019, ML5.4 on 8 September 2019, and ML5.2 on 18 December 2019 have resulted in fatalities, injuries, and extensive property damage, but the casualty is still a controversy [9].
While the spatiotemporal correlation between seismic events and industrial activities is an indicator for the triggering mechanism [5], the operation loggings and in situ pore pressure measurement in Chuannan are unavailable [10]. Therefore, the debates regarding the triggering mechanism of hydraulic fractures and 2019–2021 earthquake sequence remain [11,12]. In the Weiyuan-Rongxian area, the existing studies utilized Interferometric Synthetic Aperture Radar (InSAR) to monitor earthquake cycle deformation and constrain source mechanisms [9,13,14]; or analyzed time-series deformation qualitatively [15]. The existing geodetic-based inversion to quantify the gas production uses deformation velocity as the input. However, it does not account for the temporal evolution characteristics of fluid distribution [16,17,18,19,20], which further results in the cumulative residual errors across different epochs.
To address the lack of distribution characteristics of underground fluids and the temporal evolution feature of fluid distribution in the existing InSAR-based reservoir parameter inversion method, we propose a joint method to combine principal component analysis (PCA) and distributed Mogi sources based on MT-InSAR. The method first utilizes PCA for post-processing the results of MT-InSAR and decomposes surface deformation in shale gas extraction areas through PCA. Then, we obtain reservoir volume time series changes by recombining the corresponding volume changes of each distributed Mogi source with significance values and time functions. Finally, we conduct a quantitative analysis of fault stress changes based on reservoir volume changes.

2. Study Area

The Weiyuan-Rongxian shale gas field, located in the southwest of the Sichuan Basin, is one of the earliest fields for shale gas exploitation in China. The main shale gas production area is located on the southeast wing of the Weiyuan anticline structure, spanning approximately 229.62 km2 [21]. In 2021, the shale gas output from the Weiyuan-Rongxian shale gas field reached 154 × 108 m3, accounting for about 40% of the annual shale gas production in the Southwestern Sichuan region [22]. The crustal strain rate and historical seismic activity are low in the exploitation area [23,24]. Before 2015, the number of earthquakes with ML > 2.0 per year in the study area was less than ten according to the earthquake catalog of the China Earthquake Networks Center [11].
Extensive fracturing was carried out using horizontal wells and staged hydraulic fracturing techniques after 2015 [25]. With the increasing frequency of hydraulic fracturing, the annual earthquake number significantly increased, and a series of earthquakes with ML > 5 occurred in 2019 (Figure 1). The results from seismic and geodetic data indicated that the main shock of the ML4.9 earthquake occurred at a northwest thrust fault, consistent with the Molin fault [9].
However, due to the absence of mapped faults and different velocity models resulting in different hypocenter depths [11,13], the mechanism and fault of the ML5.4 earthquake are still controversial. The Weiyuan-Rongxian shale gas field provides a new opportunity to evaluate the potential correlation between injected fluids and induced earthquakes through geodetic data. We evaluated reservoir volume changes and seismic hazards based on surface deformation caused by shale gas extraction and hydraulic fracturing.

3. Methods

3.1. InSAR Processing

We used data from the ascending orbit (from 31 March 2015 to 28 April 2021) and descending orbit (21 March 2015 to 30 April 2021) of Sentinel-1 to monitor the surface deformation of the Weiyuan-Rongxian shale gas field. The data processing was performed using the GAMMA software (Version 1.1) for image co-registration and interferogram generation. We generated 148 interferograms for the ascending orbit and 153 interferograms for the descending orbit. The 30 m resolution SRTM DEM and Precise Orbit Determination (POD) were utilized to remove the topographic phase and orbit phase. We extracted the permanent scatterers (PS) using both an amplitude deviation index with a threshold of 0.5 and an average coherence with a threshold of 0.4. A total of 452,000 PS points were retained for the ascending orbit, and 376,000 PS points were retained for the descending orbit. Due to the significant spatiotemporal variation of shale gas extraction operations, the ground deformation is a non-steady state change, which cannot be represented by a simple linear deformation time evolution model. We used StaMPS InSAR software (Version 4.1b) for temporal deformation analysis [26]. This method is suitable for monitoring nonlinear temporal processes without a hypothetical deformation model. StaMPS subtracts the spatially uncorrelated look angle phase, obtained by least squares, from the wrapped phase to make the phase difference between adjacent PS points less than π. Subsequently, it unwraps the remaining interferometric phase. The interferometric phase of each PS point is composed of the line-of-sight deformation d e f , atmospheric error a t m , orbit residual o r b , spatial correlation look angle error c o r r , and noise n o i s e .
i n t = d e f + a t m + o r b + c o r r + n o i s e
Atmospheric error, orbit residual, and look angle error are spatially correlated but temporally uncorrelated, being estimated by filtering the unwrapped phase with a temporal high-pass filter and a spatial low-pass filter to obtain the final estimated deformation [27].
As the Sentinel-1 uses a quasi-polar orbit, it is insensitive to the north–south deformation. Therefore, we conducted deformation decomposition to obtain the vertical and east–west deformations. The incident and azimuth angles of the ascending orbit are 43° and 12°, respectively, while the incident and azimuth angles of the descending orbit are 43° and 347°, respectively. We firstly employed the cubic interpolation on the derived velocity fields and sampled them into a grid with 100 m resolution. Subsequently, we used a pixel-based decomposition according to the azimuth and incident angles [27], as follows:
[ d L O S A d L O S D ] = [ c o s θ A s i n θ A c o s α A c o s θ D s i n θ D c o s α D ] d u d e
where θ A and α A are the incident and azimuth angles of the ascending orbit, respectively. θ D and α D are the incident and azimuth angles of the descending orbit, respectively. d L O S A is the ascending line of sight deformation, d L O S D is the descending line of sight deformation. d u is vertical deformation, and d e is east–west deformation.

3.2. Joint MT-InSAR and the PCA-Based Inversion Method

The time evolution of the volume changes in shale gas reservoir can be inverted from the surface displacement of each epoch individually [26,27]. Such an approach is computationally expensive for large datasets and loses the continuous time evolution of deformation sources. It would produce independent models at each epoch [28,29,30]. To obtain the distribution of underground fluid and evaluate the interaction between fluid injection and fault without injection and production data, we proposed a jointed MT-InSAR and PCA-based inversion method (Figure 2).
Principal component analysis (PCA) is a feature extraction technique based on linear transformation [31]. It orthogonally transforms high-dimensional data into a new low-dimensional space to extract the main information of original features. We applied PCA to the decomposition of deformation time series for spatiotemporal deformation characteristics analysis based on dimension reduction. For a set of InSAR time series X with m data points and n observation epochs of InSAR vertical cumulative deformation, X can be decomposed into a linear combination of multiple PCs, as shown in Equation (3):
X = U S V T
Each of the PCs is associated with a spatial function U that represents the spatial distribution of deformation, a significance value S that represents the importance of the component, and a time function V that describes the temporal behavior of displacement. Previous studies have shown that if the dataset can be modeled as a time-varying linear source model, then the spatial function can also be modeled in the same form [32].
Due to the significant computational burden of applying complex temporal models to the extensive deformation areas discussed in this paper, we considered using a geometric source model that excludes complex parameters such as porosity [33,34,35]. The Mogi model, ellipsoidal model, and Okada model are typical models for simulating surface deformation [36]. Moreover, the Mogi model and ellipsoidal model are used to describe the magnitude and the direction of ground displacements due to changes in volume of a point in a uniform elastic half space, which are commonly used for volcano and reservoir modeling. The Okada model is mostly used for volcanic and seismic events. The Mogi model was used when the dimensions of the displacement range were close to a circle. In contrast, the Ellipsoidal model was chosen when the shape of the influences was elliptical. Due to the complex deformation patterns in shale gas extraction areas, it is difficult to simulate deformation using a single model. Therefore, to obtain the horizontal variation of reservoir volume and minimize the number of model parameters, we applied a hybrid model as the time-varying linear source model [37,38]. We used the distributed Mogi sources with a lateral spacing of 0.5 km at a depth of 3.6 km, which is consistent with the average depth of hydraulic fracturing operations to model the spatial function.
Assuming the reservoir is elastic and homogeneous, the displacement vectors ( u x , u y , u z ) at the surface (x, y, z) can be approximated by a single Mogi source at positions ( x 0 , y 0 , z 0 < 0), and the relationship between the two is shown as follows:
u x u y u z = ( 1 ν ) Δ V π x x 0 / R 3 y y 0 / R 3 z z 0 / R 3
Among them, ν is the Poisson’s ratio, Δ V is the volume change, and R = x x 0 2 + y y 0 2 + z z 0 2 is the distance between the point source and the surface observation point.
Assuming that the reservoir is elastic, matrix L represents the volume changes of Mogi sources, where L i represents the volume change of the Mogi source corresponding to the i-th principal component. The relationship between the spatial function U and the components-related volume changes of Mogi sources L is
U 1 U 2 U i = G 1 0 0 G 2 0 0 0 0 G i L 1 L 2 L i
in which G i represents the Green’s function, correlating the volume changes of Mogi sources to the same principal component with spatial functions, as follows:
G i = G 11 i G 12 i G 21 i G 22 i G 1 k i G 2 k i G j 1 i G j 2 i G j k i
where G j k i = 1 ν π Δ z / R 3 , Δ z is the depth of the reservoir, and R is the distance between the source and the target. After determining Green’s function matrix G, the inversion of deformation can be transformed into a least squares minimization problem. Due to the smoothing effect of the Green’s function, the resolution decreases with increasing depth, leading to instability in inversion. Therefore, in order to avoid oscillations or jumps in the volume results obtained from linear inversion, it is important to devise appropriate regularization schemes to stabilize the process of estimating a solution. We imposed a penalty on the distance between each Mogi source and the shale gas well platform. This penalty function is based on the assumption that volume changes are driven by fluid pressure changes caused by injection, and these changes are maximum near fracturing well platform. Therefore, we minimized the composite quadratic function at the Mogi source by the following objective function:
Q v = U G L T U G L + λ 2 L T D L
where L represents the volume changes of the Mogi sources; U represents the spatial function after principal component analysis; λ represents the roughness smoothing factor; and D is the diagonal penalty matrix, for which the Mogi source far away from the well has a larger value. After that, we recombined Mogi source volume changes with their respective principal values and time functions to estimate Mogi source volume changes at each epoch.

3.3. Coulomb Stress of Faults

After obtaining a temporal reservoir volume change model, we first extended the Fourier domain approach of Steketee to obtain the Green’s function for a radial point source [39]. Then, we convolved the Green’s function of radial point sources in an elastic half-space with the volume changes of distributed Mogi sources (multiplication in the wavenumber domain) to calculate the full 3D stress tensor field surrounding the field [38]. Finally, we calculated the changes in Coulomb stress by solving the local stress tensor on the fault plane.
σ c = τ + μ σ n
τ is the change in shear stress; σ n is the normal stress for a given fault geometry, respectively; and μ is the effective friction coefficient.
For the Rongxian earthquake and two foreshocks, we used the existing fault plane parameterization to obtain the cumulative Coulomb stress changes on the seismic fault plane [9]. For the Weiyuan earthquake and the Zizhong earthquake, we used the fault plane from Lei [8]. At the same time, to distinguish between the actual fault plane and the auxiliary plane, we calculated the Coulomb stress changes on two sets of fault planes separately. For the Zizhong fault, Gaoqiao fault, Niujingao fault, Dayakou fault, Dongxingchang fault, Molinchang fault, Chongtan fault, Huangquepo fault, and Changyan fault in the Weiyuan-Rongxian shale gas field, we used the fault plane parameterization (i.e., strike, dip, and rake angles) from the Sichuan Provincial Regional Geological Report to obtain the cumulative Coulomb stress changes on the fault plane.

4. Result

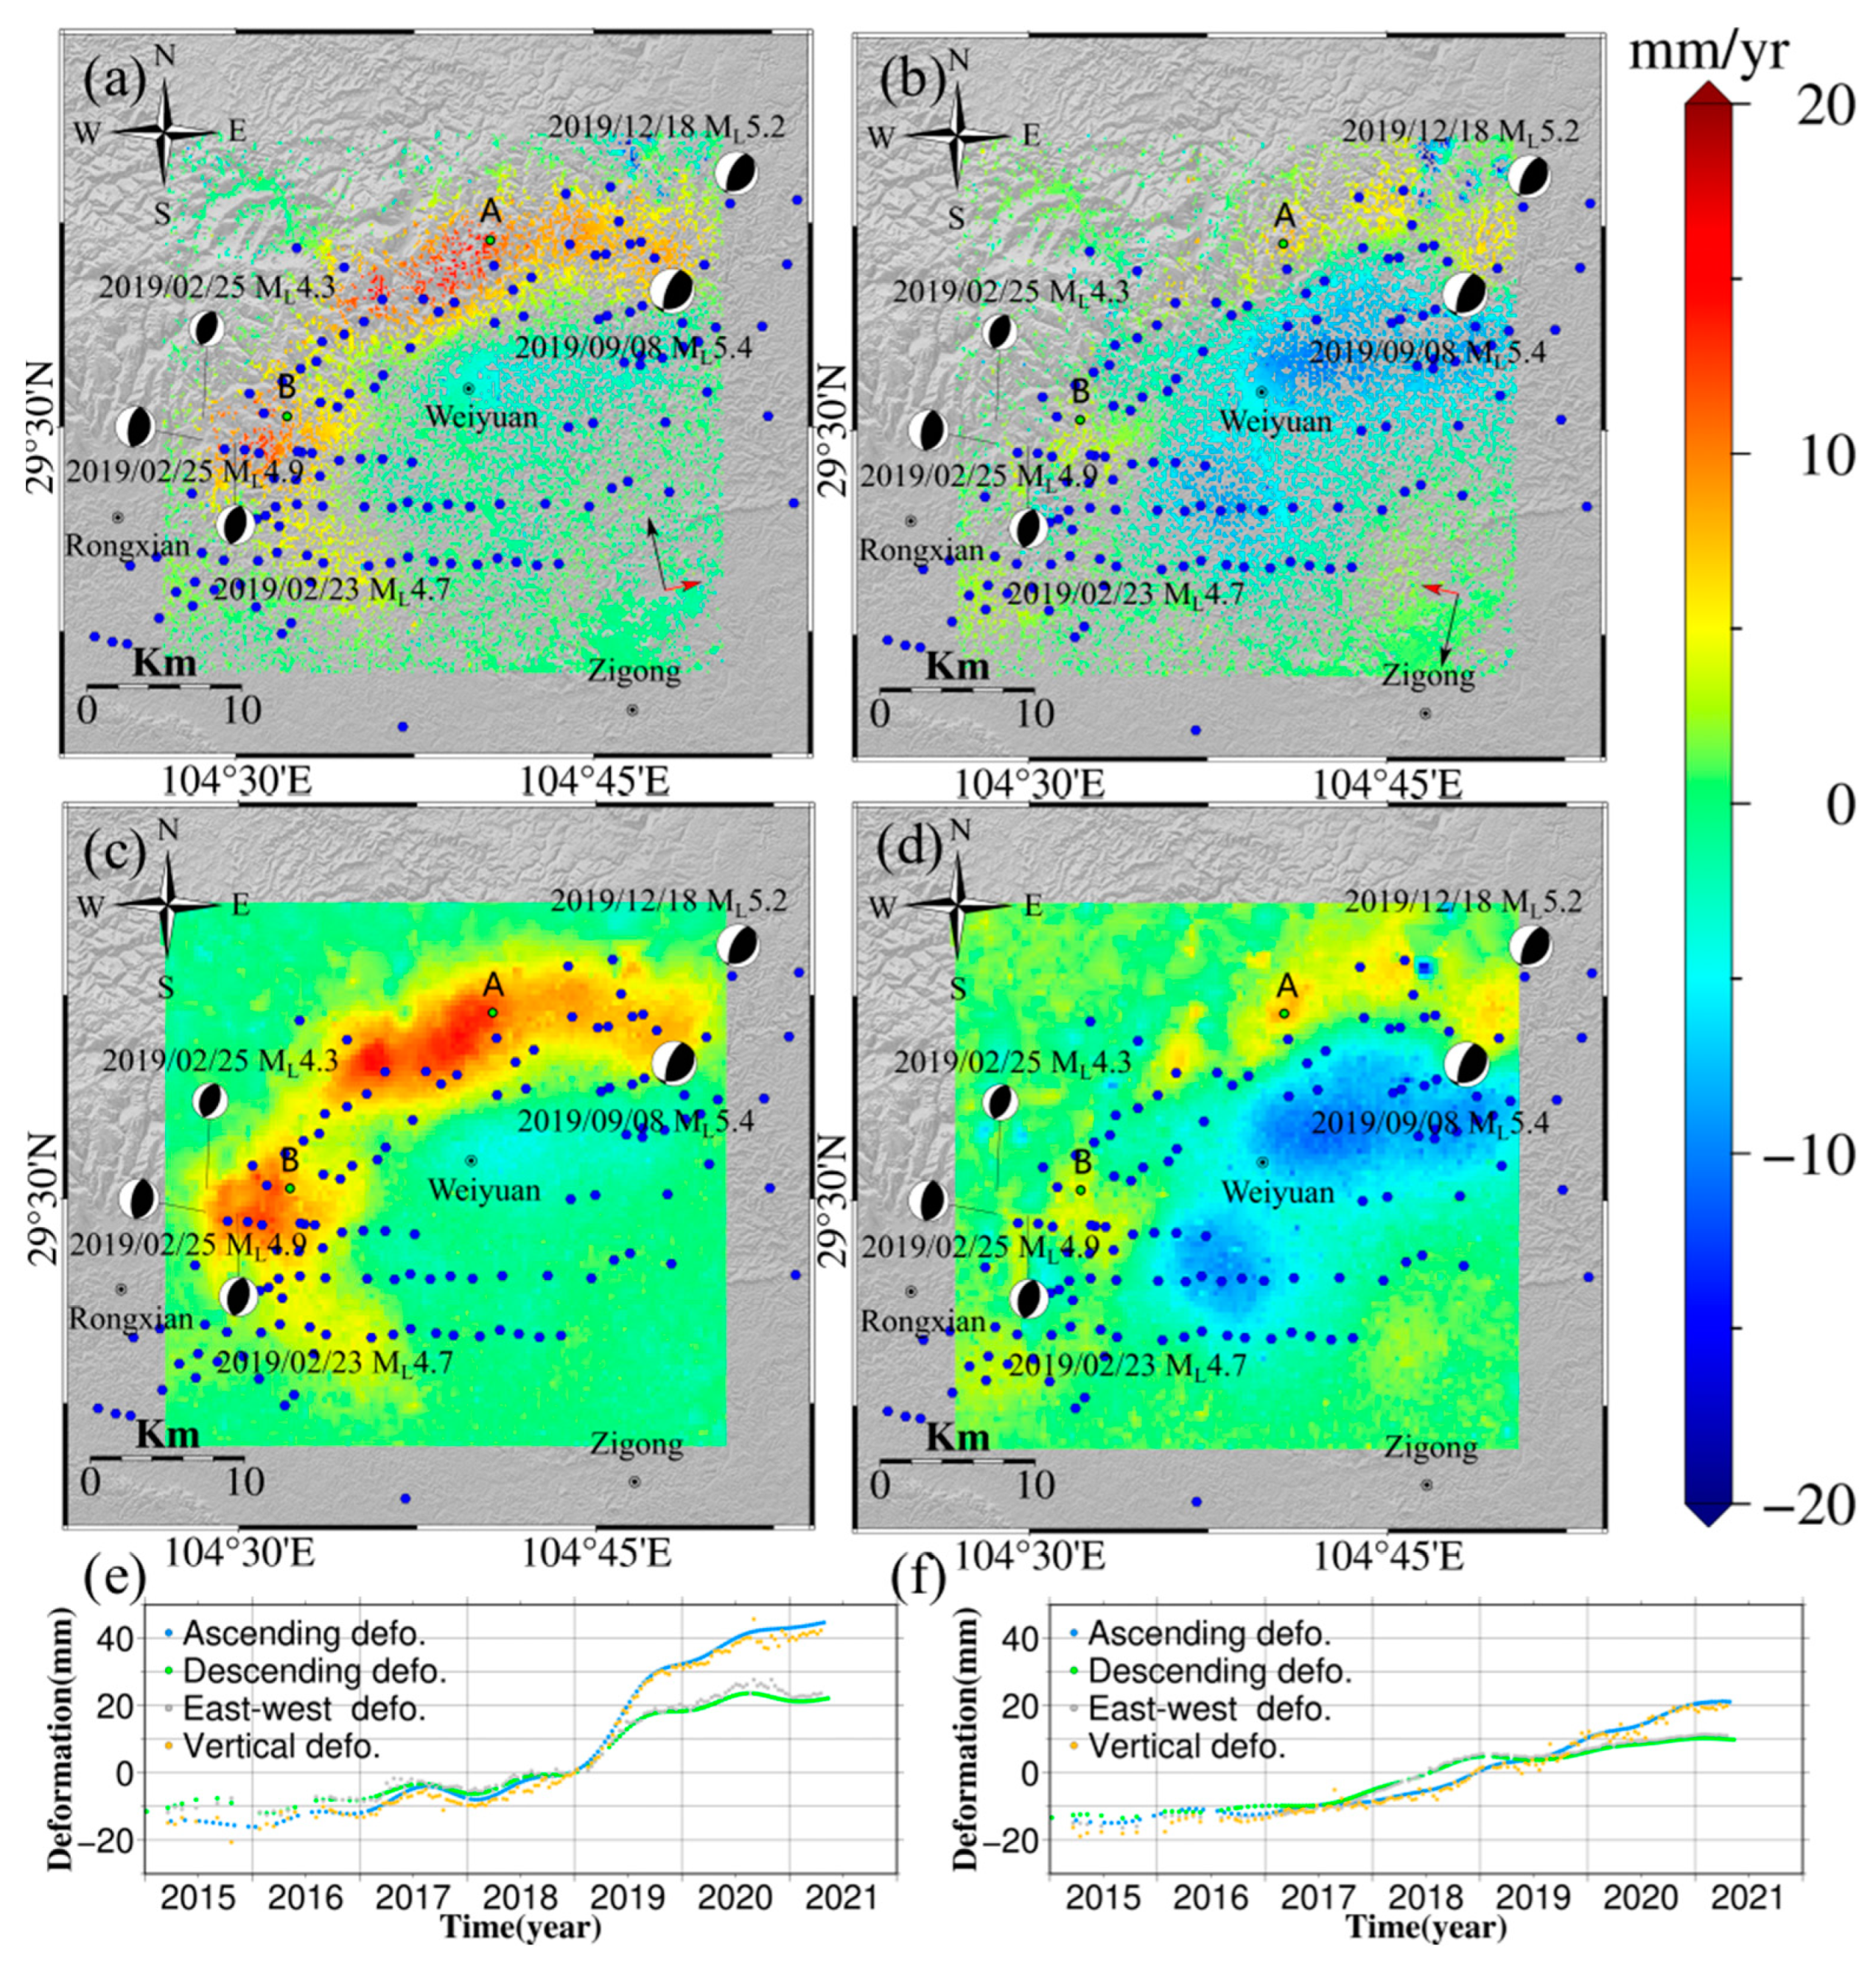
4.1. InSAR Deformation
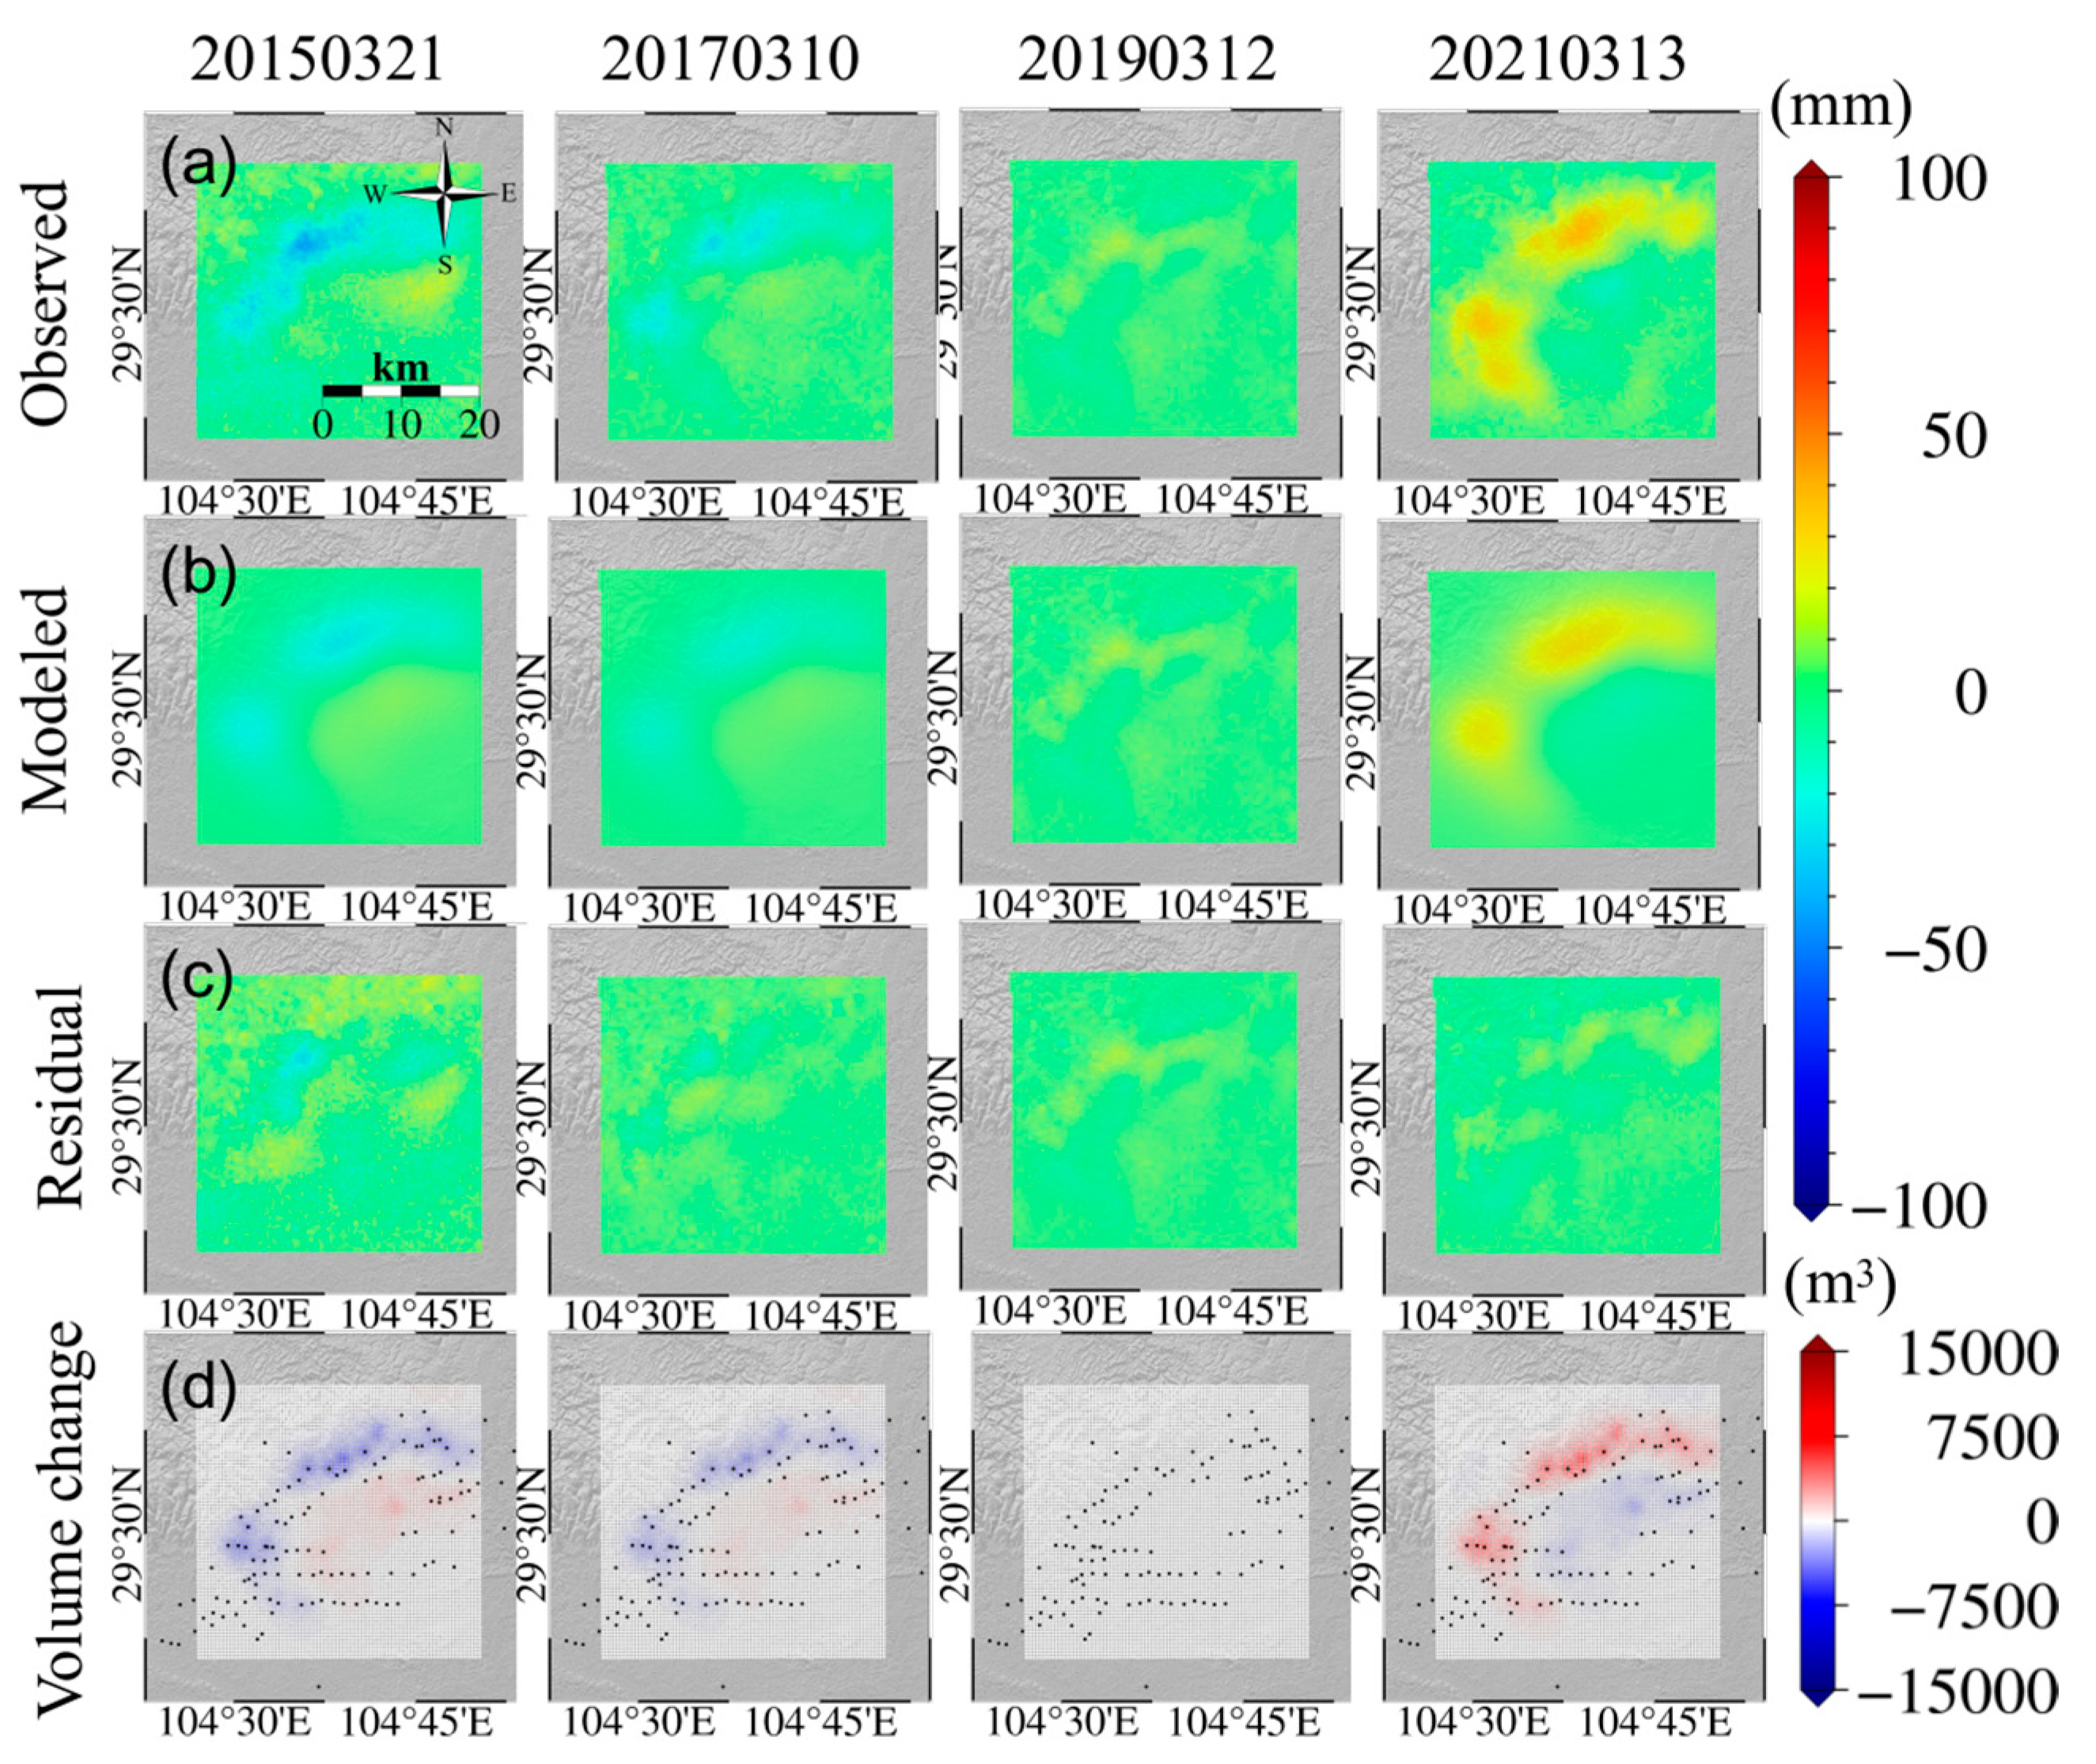
Our deformation velocity results show that the northeast of the Weiyuan-Rongxian shale gas field lifted rapidly from 2015 to 2021, while the southwest region subsided rapidly. The maximum uplift and subsidence were about 17 cm and 16 cm, respectively. Both the uplifting and subsiding areas were oval-shaped with an area of approximately 15 km2. The time series of ascending and descending tracks showed good consistency in both temporal behavior and amplitude, indicating that the vertical deformation was dominant. There were multiple wells undergoing hydraulic fracturing operations or shale gas production activities near the shale gas extraction area in the Weiyuan-Rongxian shale gas field [40]. We found both hydraulic fracturing and extraction wells were located within the deformation zone centered around Weiyuan.
Due to the lack of available in situ measurements, such as leveling and GNSS, we conducted a qualitative analysis for the surface deformation in the Changning shale gas field, which is 150 km southeast of our study area. In the Changning area, extensive fracturing has been carried out since 2015. The surface deformation accelerated from 2015 to 2019, since the excessive fracturing in July 2017. Similar to Changning, the amounts of accelerated deformation in the Weiyuan-Rongxian shale gas field are mainly distributed around shale gas production well platforms, which corresponds to the start of excessive fracturing [41]. Therefore, the deformation in these fields was governed by the combined effects of multiple wells operating at different stages of the production chain—fracturing or extraction [15].
Based on the LOS deformation, vertical deformation, and east-west deformation field in the Weiyuan-Rongxian shale gas field, we found that during the period from June 2018 to December 2020, large-scale fracturing was carried out on the west side of the Weiyuan-Rongxian shale gas field, which caused rapid and significant uplift of the ground. The injected fracturing fluid diffused southwestward, and the diffusion effect also resulted in horizontal surface deformation components in the same direction as the ground [41]. Meanwhile, we inferred that the southwestward deformation trend was nearly parallel to the flight direction of the ascending satellite. Therefore, it is difficult to observe deformation in this direction in the results of ascending deformation.
The time series deformation measurements at points A and B in Figure 3a showed strong linearity (Figure 3e,f). Therefore, other seasonal effects and irrigation factors were not considered in this study (Figure 3). Meanwhile, the reliability of deformation was evaluated by differencing the annual average deformation rates obtained from StaMPS-InSAR and SBAS-InSAR. The mean and standard deviation of the ascending difference values were 0.5 mm/yr and 1.6 mm/yr, respectively, while the descending difference values were 0.4 mm/yr and 1.7 mm/yr, respectively.

4.2. Volume Changes

We decomposed the vertical deformation in the Weiyuan-Rongxian shale gas field into a combination of spatial distribution and time series (Figure 4). The chi-squared value of the residuals between the observed and the reconstructed time series for the sixth component was lower than 0.1, potentially indicating that our estimation of the InSAR data uncertainty of 2 mm was overestimated. And the first six principal components, PC1-6, accounted for 50%, 19%, 14%, 9%, 5%, and 2% of eigenvalues, respectively, totaling 99% of the vertical surface deformation, which can characterize most of the deformation signals [42]. PC1 described the linear uplift trend of the ground during the observation period, which was closely related to the cumulative number of wells put into operation in the shale gas extraction area, and the seasonal signal was not obvious.
The second principal component, PC2, focused on the deformation pattern of the Weiyuan syncline and its southern region. PC2 showed a seasonal deformation with an annual cycle, and the temporal trend was consistent with the changes in rainfall in Weiyuan and Rongxian County. PC3 and PC5 also showed a deformation trend with an annual cycle, and they focus on the deformation pattern of the high-altitude areas such as the Weiyuan syncline, which represented residual turbulent atmospheric signals. PC4 was mainly distributed in the northwest and southeast of the study area, being closely related to the residual of topography-dependent atmospheric screen, which represents terrain-related atmospheric signals. PC6 exhibited significant deformation characteristics and fluctuated around zero values in the time series during the study period, representing other noise contributions. These contributions include phase jumps and residual turbulence delays.
The temporal changes in volume of the reservoir were inverted by the PC1 component, and the increasing reservoir volume was mainly located on the northwest side of the study area, which is consistent with the distribution of shale gas wells (Figure 5). The changes in reservoir were a reflection of the injection and migration of fracturing fluid during the hydraulic fracturing process of Weiyuan-Rongxian shale gas field. The vertical deformation observation matched well with the model simulation result, with a root mean square error of 3.9 mm (Figure 5c). Significant errors occurred only in low-coherence regions due to the influence of the residual phase. The total volume in the Weiyuan-Rongxian shale gas field increased by 7.95 × 10⁶ m3 from 2018 to 2020, which is consistent with the cumulative injection amount of 8.10 × 10⁶ m3 for 225 wells during the production period (2018–2020) [43].

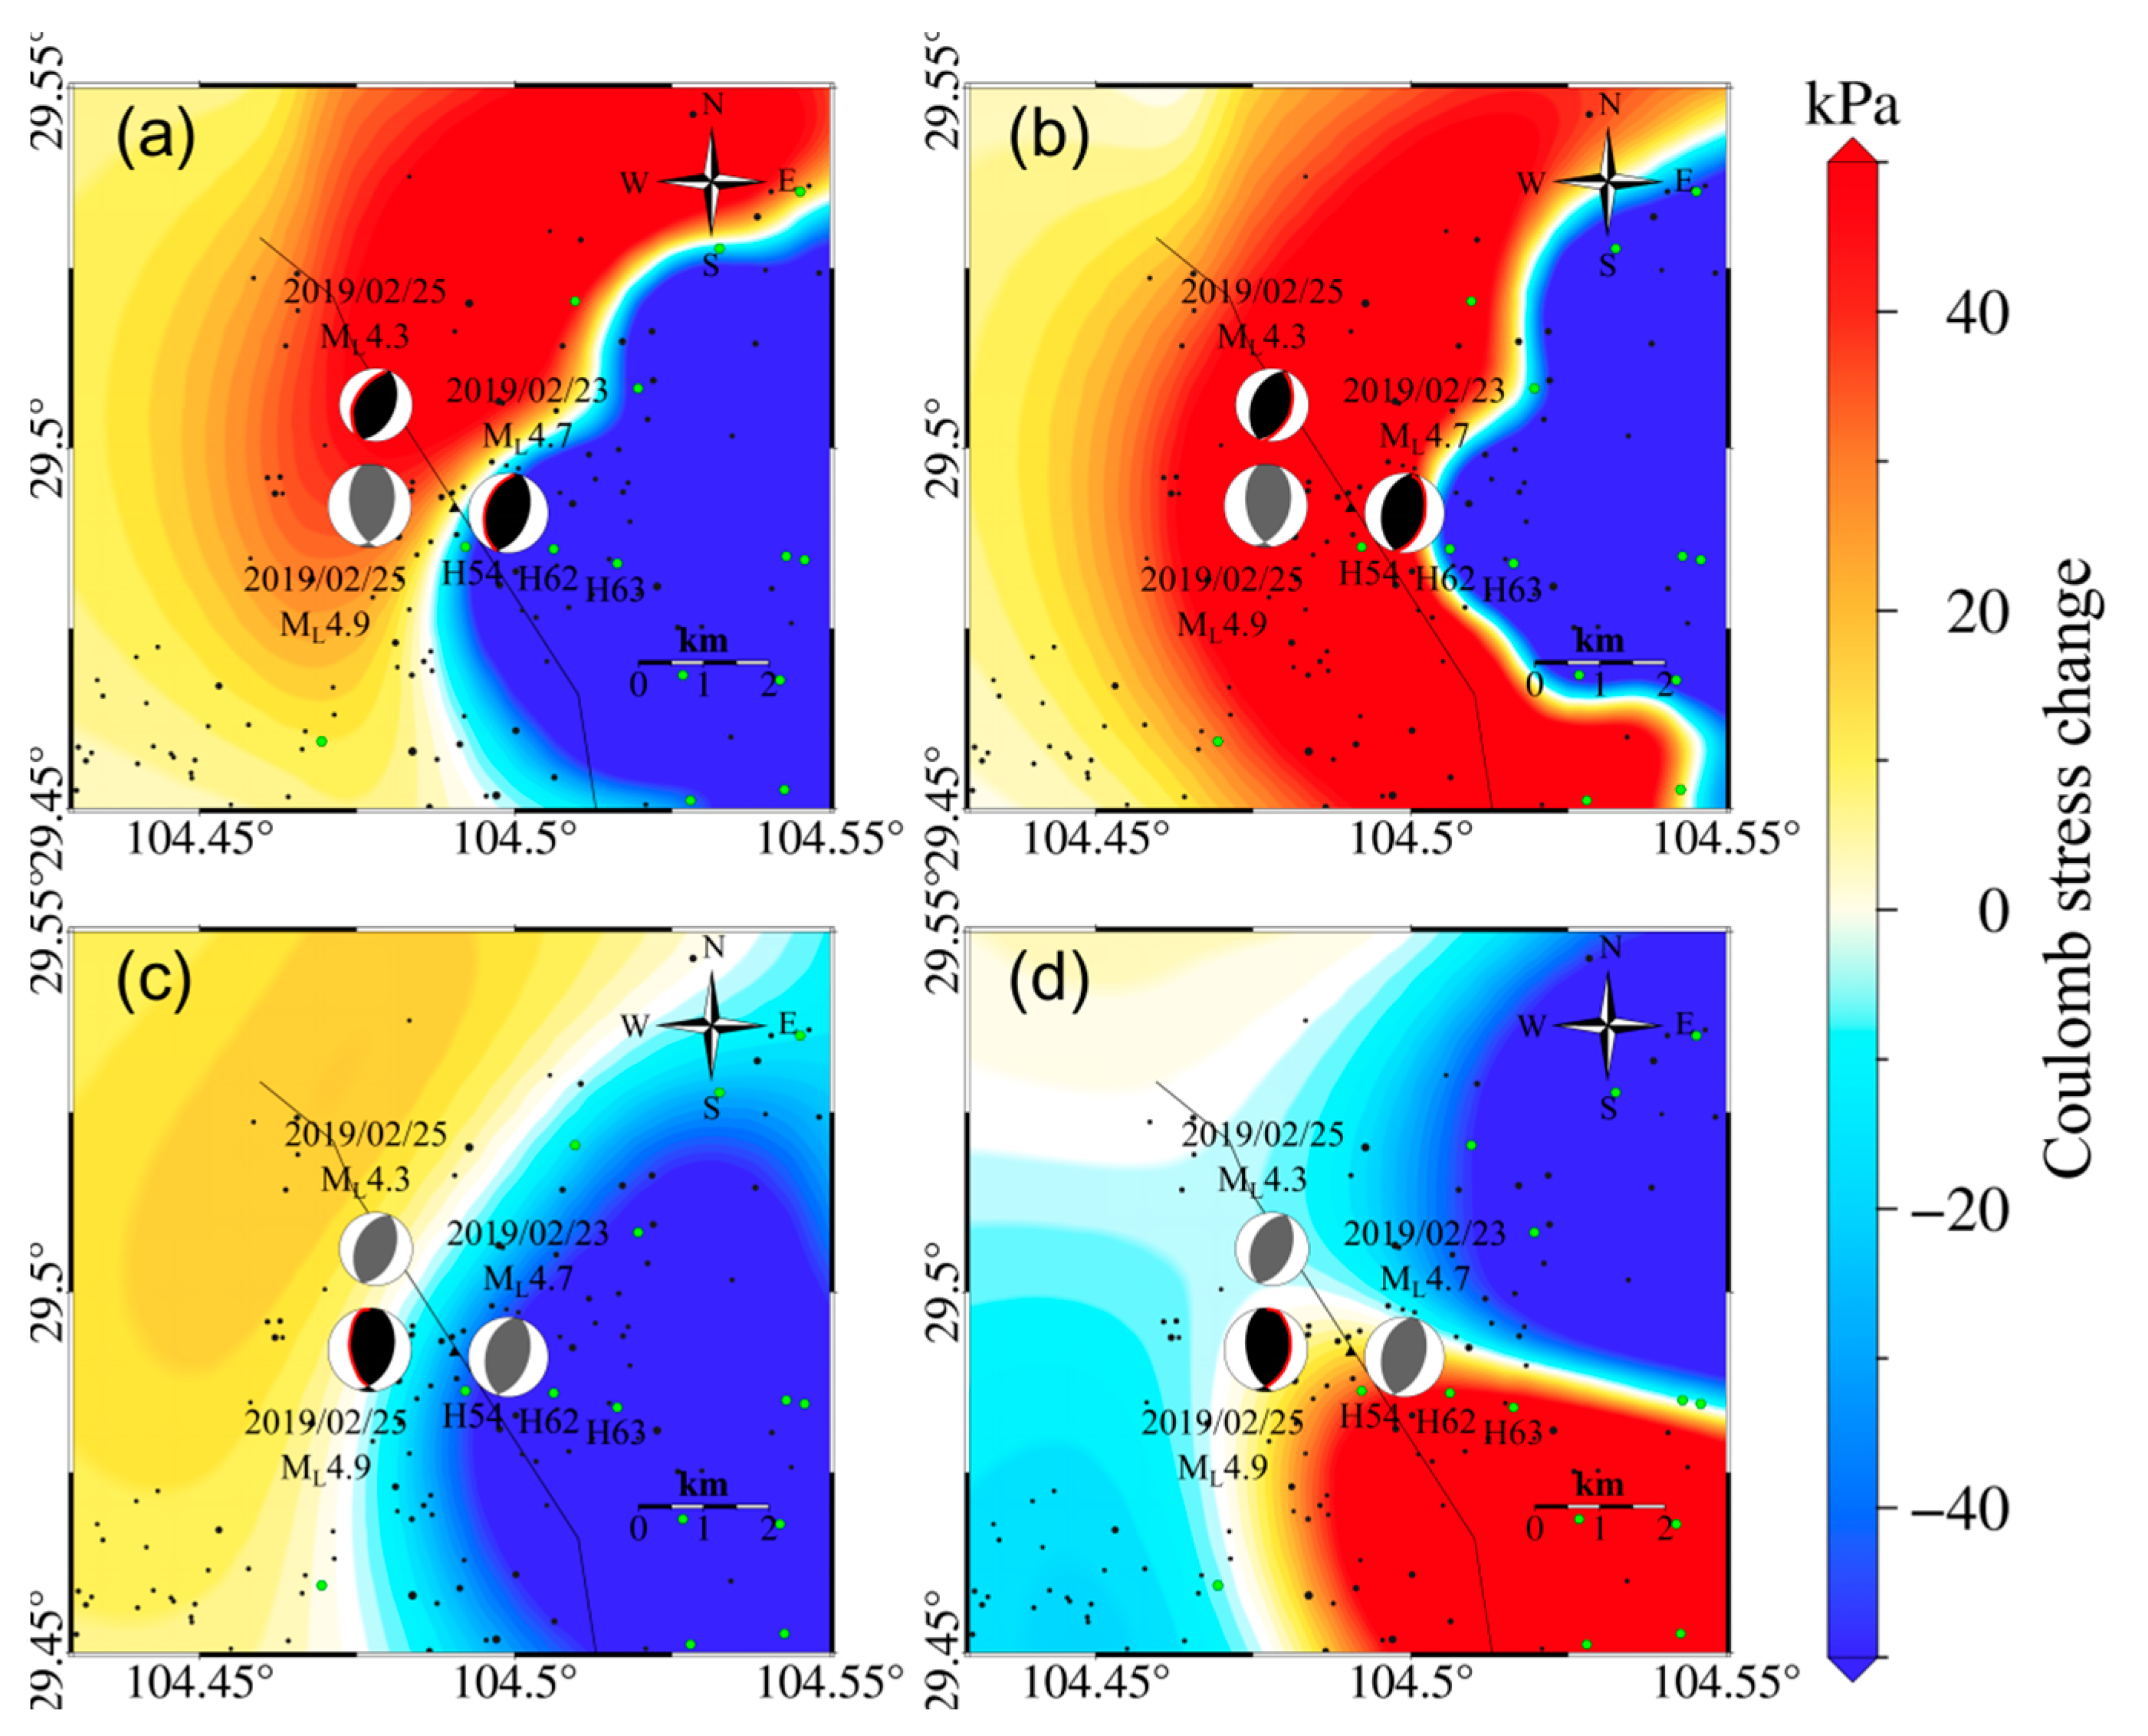
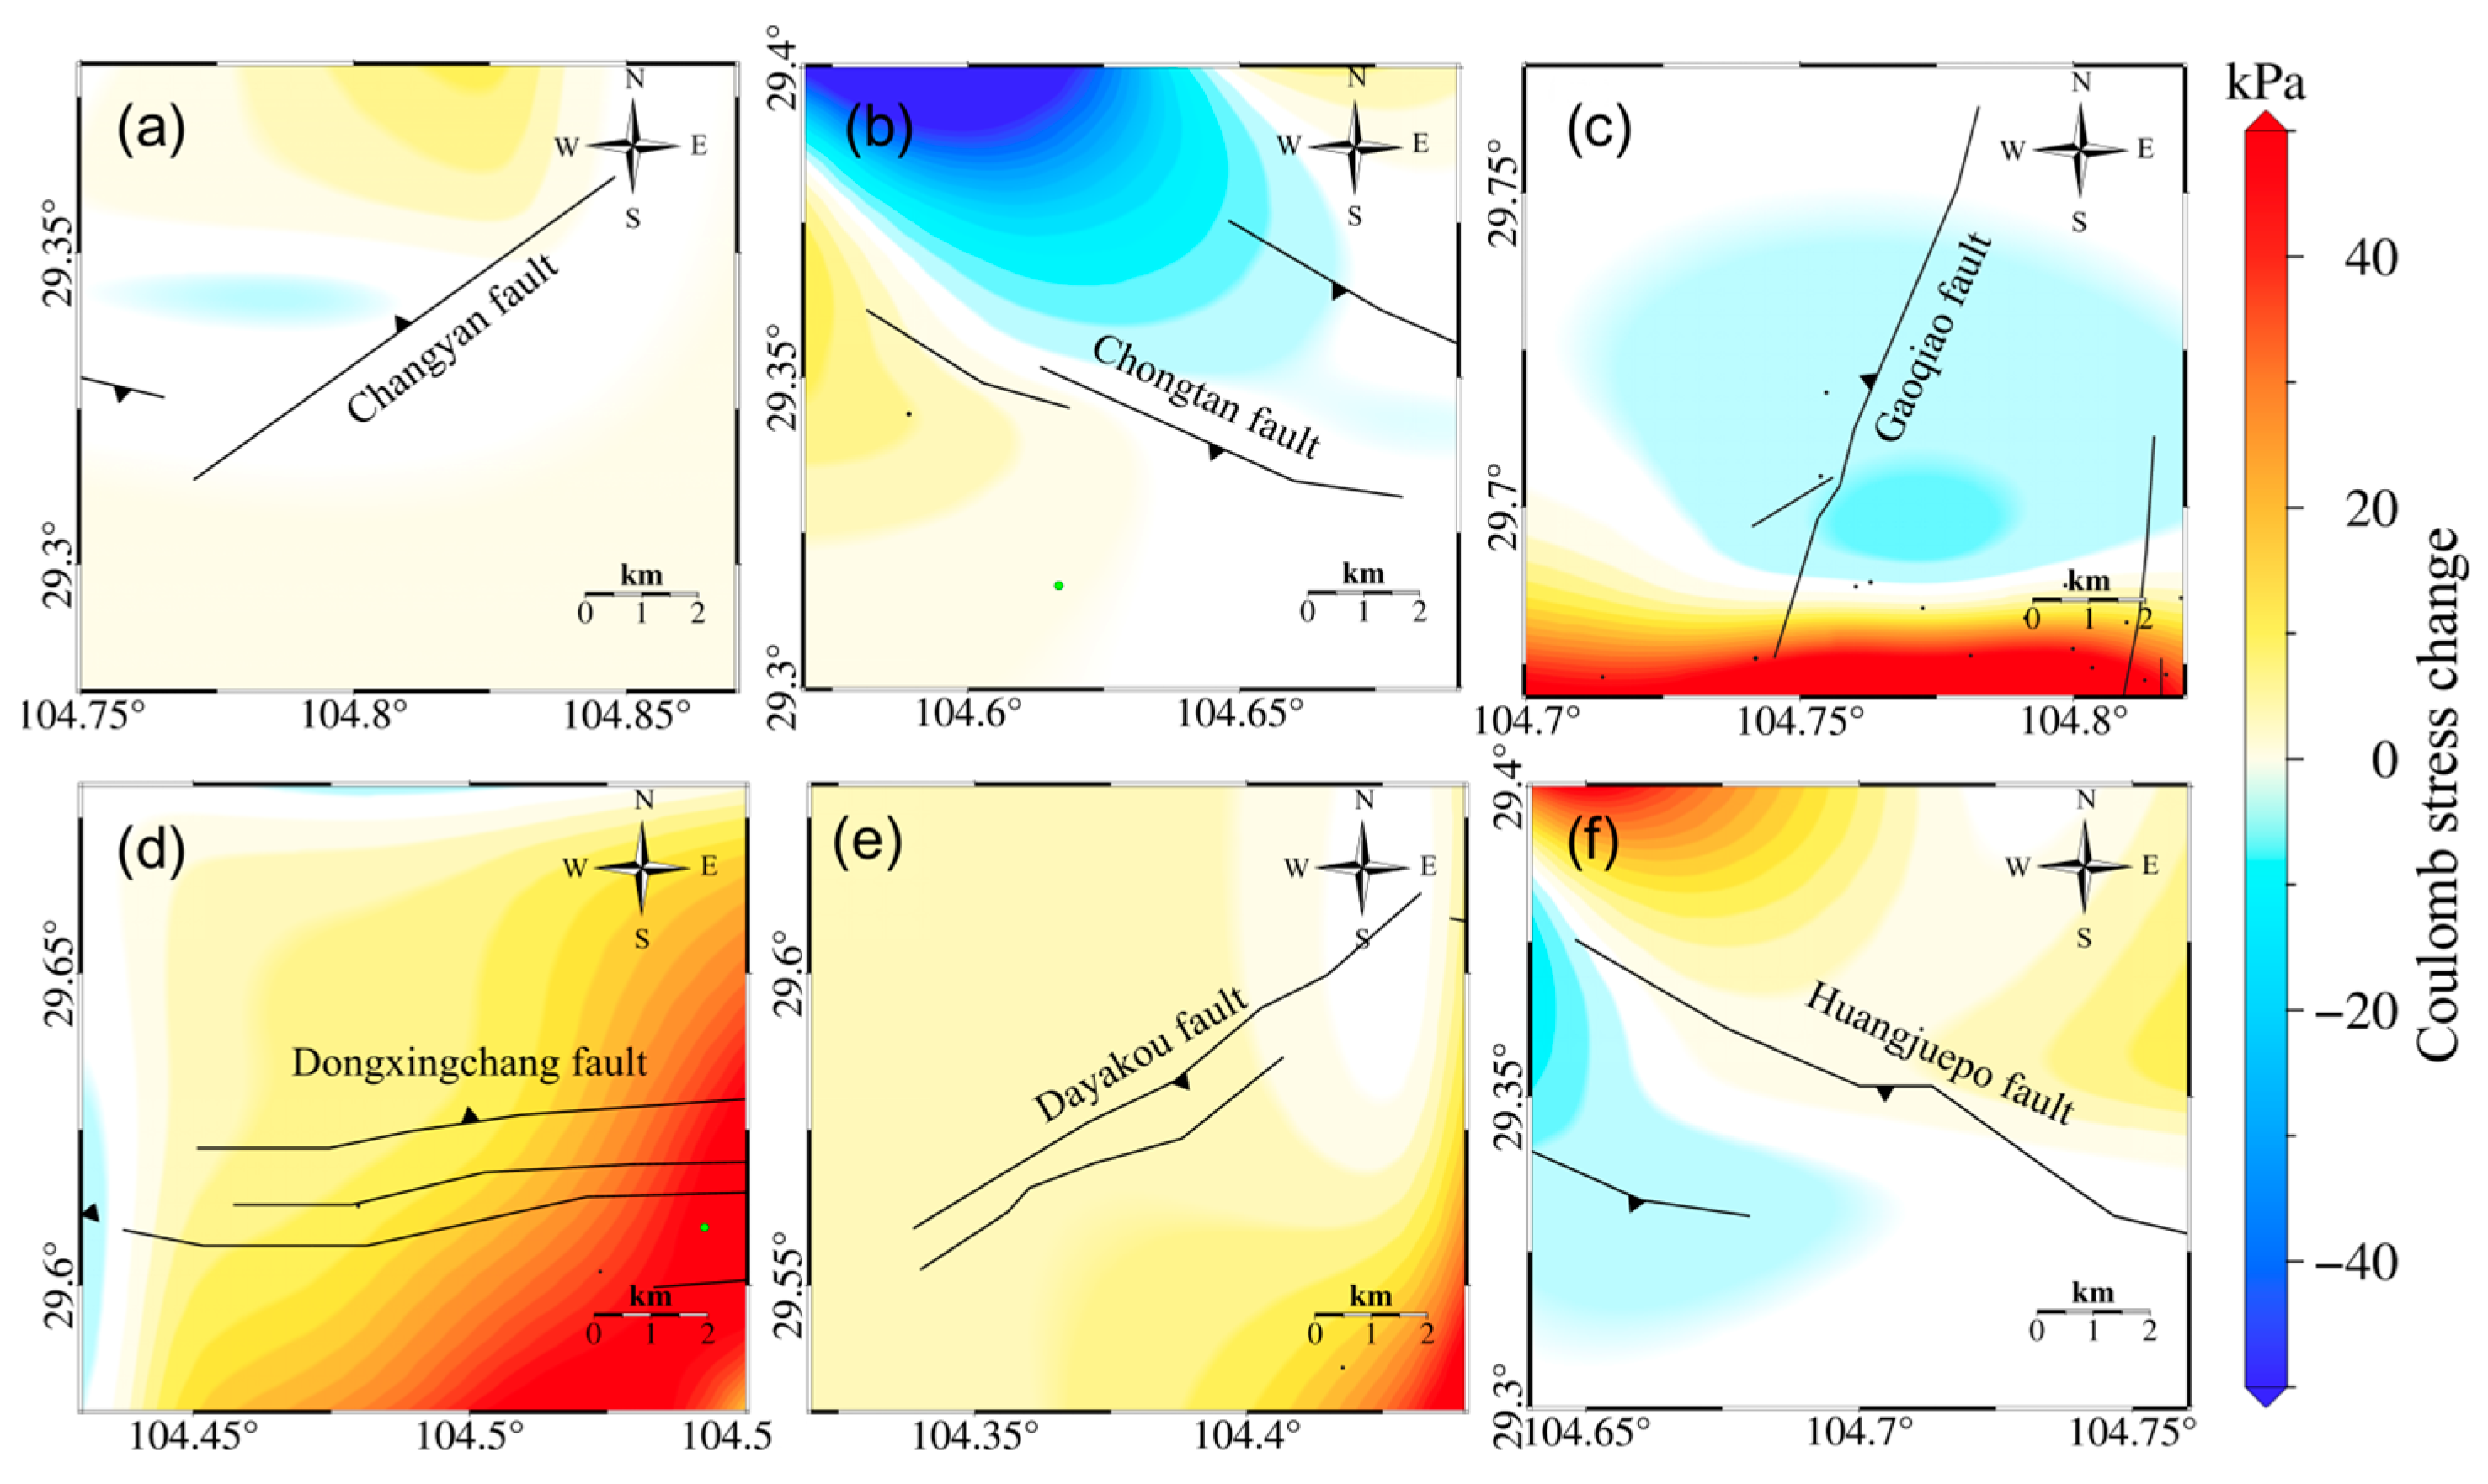
4.3. Coulomb Stress Estimation

We calculated the Coulomb stress changes on the source mechanism plane of three earthquakes with magnitudes of ML4.9, ML5.4, and ML5.2 in the shale gas extraction area to reveal the relationship between seismic activity and reservoir volume changes in the Weyuan-Rongxian shale gas field. The reservoir volume changes in the Weiyuan-Rongxian shale gas field had 57 kPa and −216 kPa Coulomb stress on the westward fault plane of the ML4.7 and ML4.3 earthquakes, respectively, while having 108 kPa and 86 kPa Coulomb stress loading on the eastward fault plane, respectively. Due to the shallow epicenter of the main shock of the ML4.9 Rongxian earthquake, reservoir volume changes only generated Coulomb stress loading of 14 kPa and 8 kPa near the fault plane of the ML4.9 Rongxian earthquake (Figure 6).
The reservoir volume changes in the Weiyuan-Rongixan shale gas field also produced significant Coulomb stress changes near the Weiyuan earthquake and Zizhong earthquake epicenters. Accumulated Coulomb stress changes of −123 kPa and 185 kPa occurred near the westward and eastward dipping fault planes of the Weiyuan earthquake epicenter, respectively, and accumulated Coulomb stress changes of 53 kPa and 15 kPa occurred near the westward and eastward dipping fault planes of the Zizhong earthquake epicenter, respectively (Figure 7).
To evaluate the seismic risk in the Weiyuan-Rongxian shale gas field, we used reservoir volume changes to simultaneously calculate the Coulomb stress changes on nine main faults and Lijiachang fold in the shale gas extraction area. Among them, the reservoir volume changes had Coulomb stress loadings of 10 kPa, 15 kPa, 5 kPa, 3 kPa, and 87 kPa on the Dongxingchang fault, Gaoqiao fault, Dayakou fault, Niujingao fault (Figure 8), and Lijiachang fold, respectively (Figure 9).

5. Discussion

5.1. Relationship between the Rongxian ML4.9 Earthquake and Hydraulic Fracturing

From the Coulomb stress changes inverted from our model, we inferred that the two foreshocks may have occurred on a northeast-dipping thrust fault, and that the Rongxian ML4.9 earthquake may have occurred on a southwest-dipping thrust fault, which is consistent with the results of Yang and Wang [9,13]. The reservoir volume changes caused by hydraulic fracturing loaded 14 kPa Coulomb stress at the depth of the main shock of the Rongxian ML4.9 earthquake. This indicated that fluid injection during hydraulic fracturing may have affected the occurrence of the Rongxian ML4.9 earthquake, and the spatiotemporal consistency between hydraulic fracturing activity and earthquakes proves causality between them. Previous studies showed that the two foreshocks of ML4.7 and ML4.3 caused ~ 3 kPa of Coulomb stress loading in the main-shock fault plane [9]. Although it is impossible to model pore elastic stress changes due to lack of injection data, the Coulomb stress changes induced by the foreshocks and hydraulic fracturing activities suggested that the Rongxian ML4.9 earthquake was triggered by static Coulomb stress combined with hydraulic fracturing activity and the two foreshocks.

5.2. Relationship between the Weiyuan ML5.4 and Zizhong ML5.2 Earthquakes and Hydraulic Fracturing

The Coulomb stress changes inferred from our model suggested that the Weiyuan ML5.4 earthquake and Zizhong ML5.2 earthquake may have occurred on a northeast-dipping thrust fault, which was consistent with the results of Lei and Wang [8,13]. Furthermore, the centroid distance between the Weiyuan ML5.4 earthquake and Zizhong ML5.2 earthquake was 5–7 km, and their focal depths were similar. The static CFS changes caused by the Weiyuan ML5.4 earthquake might have affected the triggering of the Zizhong earthquake. The existing study found that the Zizhong earthquake was located in the Coulomb stress loading region of the Weiyuan earthquake, where ΔCFS exceeded 20 kPa [12,13]. Our model estimated that the volume changes of the reservoir produced 185 kPa of Coulomb stress loading near the Weiyuan ML5.4 earthquake source plane and 15 kPa of positive Coulomb stress loading near the Zizhong ML5.2 earthquake source plane (Figure 7c), which suggested that fluid injection during hydraulic fracturing may have affected the timing of the Weiyuan ML5.4 earthquake and Zizhong ML5.2 earthquake. The Zizhong ML5.2 earthquake could have been triggered by the stress changes caused by nearby hydraulic fracturing activity and the static Coulomb stress loading from the Weiyuan ML5.4 earthquake.

5.3. Analysis of Regional Seismic Hazards

We found that the increase in Coulomb stress around three events was mainly caused by the increase in tensile stress. The tensile stress breaks the fault plane and allows for failure at lower shear stress. The fluid injection and extraction during hydraulic fracturing in the Weiyuan-Rongxian shale gas field have a substantial perturbation on the stress field of the region. The fluid injection during hydraulic fracturing changed the shear stress and normal stress on nearby faults, triggering fault activity around the shale gas field. Therefore, the main faults in the Weiyuan-Rongxian shale gas field are likely to be the locations of future earthquakes. We estimated that the volume changes of the reservoir in the Weiyuan-Rongxian shale gas field produced greater than 10 kPa of Coulomb stress loading on the Dongxingchang fault, Gaoqiao fault, and Lijiachang fold. These faults need to be focused on in seismic hazard assessment.

6. Conclusions

We used the MT-InSAR technology to monitor the deformation field of the Weiyuan-Rongxian shale gas field and combined the distributed Mogi model with PCA to invert the reservoir volume changes. The method only uses the vertical surface displacement and well location information as input, and it uses principal component analysis to invert the volume change parameters of distributed Mogi sources, which reduces computational workload and considers the temporal characteristics of fluid distribution. Due to the lower number of parameters, this simple model can be easily applied to the study of multi hydraulic fracturing wells. Moreover, we also calculated the Coulomb stress changes to reveal the relationship between seismic activity and reservoir volume changes, and we evaluated future earthquake risk in the region. Our results showed that the deformation in the Weiyuan-Rongxian shale gas field is mainly related to hydraulic fracturing activities and gas extraction activities. The deformation was mainly distributed on the southeast side of the Weiyuan Anticline. The deformation patterns on the east and west sides of the deformation zone are slightly different, with maximum cumulative subsidence and uplift of about 16 cm and 17 cm, respectively. Our results showed that large-scale fracturing was carried out on the west side of the Weiyuan-Rongxian shale gas field, and the injected fracturing fluid diffused southwestward. The total increase in volume from 2018 to 2020 in the Weiyuan-Rongxian shale gas field was 7.95 × 10⁶ m3, which was equivalent to the cumulative injection volume of 8.1 × 10⁶ m3 from 225 wells during the shale gas production period (2018–2020). Based on the results of Coulomb stress changes, we infer that the ML4.9 earthquake may have occurred on a southwest dipping thrust fault, and the ML5.4 and ML5.2 earthquakes may have occurred on eastward dipping thrust faults. Fluid injection and associated Coulomb stress loading during shale gas extraction and hydraulic fracturing may be the driving factors for seismic activity in the Weiyuan-Rongxian shale gas field. The reservoir volume changes have generated Coulomb stress loading greater than 10 kPa around the Dongxingchang fault, Gaoqiao fault, and Lijiachang fold, which should be focused on in future earthquake hazard assessment. Moreover, fluid injection in the Weiyuan-Rongxian shale gas field caused a substantial perturbation to the regional stress field.

Author Contributions

Conceptualization, H.H. and W.X.; methodology, H.H. and W.X.; software, H.H., Y.J. and W.X.; validation, H.H., W.X. and L.X.; formal analysis, L.X.; investigation, K.J. and H.H.; resources, W.X. and L.X.; data curation, H.H.; writing—original draft preparation, H.H.; writing—review and editing, H.H., W.X., Y.J. and L.X.; visualization, H.H. and K.J.; supervision, W.X. and Y.J.; project administration, W.X.; funding acquisition, W.X. All authors have read and agreed to the published version of the manuscript.

Funding

This research was funded by National Key Research and Development Program (2022YFB3903602), National Natural Science Foundation of China (42174023, 42304037), National Science Fund for Distinguished Young Scholars (41925016), Frontier Cross Research Project of Central South University (2023QYJC006), and Natural Science Foundation of Hunan Province (2024JJ3031).

Data Availability Statement

Data are contained within the article. The Synthetic Aperture Radar (SAR) images were acquired by the European Space Agency’s Sentinel-1 satellite (https://search.asf.alaska.edu/). The earthquake catalog was obtained from the China Earthquake Data Center (CEDC, http://data.earthquake.cn/index.html, last accessed 10 April 2024).

Acknowledgments

We thank the reviewers for their helpful comments. We thank Jinping Zi for providing well locations. We thank D. Trugman for helpful discussion on elastic volume strain modeling. We thank the European Space Agency (ESA) for providing Sentinel-I SAR data free of charge.

Conflicts of Interest

The authors declare no conflicts of interest.

References

  1. Rafiee, M.; Soliman, M.Y.; Pirayesh, E. Hydraulic Fracturing Design and Optimization: A Modification to Zipper Frac. In Proceedings of the SPE Annual Technical Conference and Exhibition, San Antonio, TX, USA, 8–10 October 2012; p. SPE–159786-MS. [Google Scholar] [CrossRef]
  2. Osiptsov, A.A. Fluid Mechanics of Hydraulic Fracturing: A Review. J. Pet. Sci. Eng. 2017, 156, 513–535. [Google Scholar] [CrossRef]
  3. Raleigh, C.B.; Healy, J.H.; Bredehoeft, J.D. An Experiment in Earthquake Control at Rangely, Colorado. Science 1976, 191, 1230–1237. [Google Scholar] [CrossRef] [PubMed]
  4. Rozhko, A.Y. Role of Seepage Forces on Seismicity Triggering. J. Geophys. Res. Solid Earth 2010, 115, B11314. [Google Scholar] [CrossRef]
  5. Foulger, G.R.; Wilson, M.P.; Gluyas, J.G.; Julian, B.R.; Davies, R.J.-P. Global Review of Human-induced Earthquakes. Earth-Sci. Rev. 2017, 178, 438–514. [Google Scholar] [CrossRef]
  6. Schultz, R.; Skoumal, R.J.; Brudzinski, M.R.; Eaton, D.; Baptie, B.; Ellsworth, W. Hydraulic Fracturing-Induced Seismicity. Rev. Geophys. 2020, 58, e2019RG000695. [Google Scholar] [CrossRef]
  7. Zhang, J.; Kuang, W.H.; Zhang, X.; Mo, C.K.; Zhang, D.X. Global Review of Induced Earthquakes in Oil and Gas Production Fields. Rev. Geophys. Planet. Phys. 2021, 52, 239–265. [Google Scholar] [CrossRef]
  8. Lei, X.; Su, J.; Wang, Z. Growing Seismicity in the Sichuan Basin and Its Association with Industrial Activities. Sci. China Earth Sci. 2020, 63, 1633–1660. [Google Scholar] [CrossRef]
  9. Yang, H.; Zhou, P.; Fang, N.; Zhu, G.; Xu, W.; Su, J.; Meng, F.; Chu, R. A Shallow Shock: The 25 February 2019 ML 4.9 Earthquake in the Weiyuan Shale Gas Field in Sichuan, China. Seismol. Res. Lett. 2020, 91, 3182–3194. [Google Scholar] [CrossRef]
  10. Chen, H.; Meng, X.; Niu, F.; Tang, Y.; Yin, C.; Wu, F. Microseismic Monitoring of Stimulating Shale Gas Reservoir in SW China: 2. Spatial Clustering Controlled by the Preexisting Faults and Fractures. J. Geophys. Res. Solid Earth 2018, 123, 1659–1672. [Google Scholar] [CrossRef]
  11. Yi, G.X.; Long, F.; Liang, M.J.; Zhao, M.; Wang, S.W. Geometry and Tectonic Deformation of Seismogenic Structures in the Rongxian-Weiyuan-Zizhong Region, Sichuan Basin: Insight from Focal Mechanism Solutions. Chin. J. Geophys. 2020, 63, 3275–3291. [Google Scholar] [CrossRef]
  12. Sheng, M.; Chu, R.; Ni, S.; Wang, Y.; Jiang, L.; Yang, H. Source Parameters of Three Moderate Size Earthquakes in Weiyuan, China, and Their Relations to Shale Gas Hydraulic Fracturing. J. Geophys. Res. Solid Earth 2020, 125, e2020JB019932. [Google Scholar] [CrossRef]
  13. Wang, M.; Yang, H.; Fang, L.; Han, L.; Jia, D.; Jiang, D.; Yan, B. Shallow Faults Reactivated by Hydraulic Fracturing: The 2019 Weiyuan Earthquake Sequences in Sichuan, China. Seismol. Res. Lett. 2020, 91, 3171–3181. [Google Scholar] [CrossRef]
  14. Liu, H.; Xie, L.; Zhao, G.; Ali, E.; Xu, W. A Joint InSAR-GNSS Workflow for Correction and Selection of Interferograms to Estimate High-resolution Interseismic Deformations. Satell. Navig. 2023, 4, 14. [Google Scholar] [CrossRef]
  15. Bao, Y.X.; Sun, J.B.; Li, T.; Liang, C.R.; Zhan, Y.; Han, J.; Li, Y.S.; Zhang, J.F. Characteristics of Surface Deformation Field of Changning Shale Gas Block in Southern Sichuan Basin with InSAR Data. Acta Seismol. Sin. 2022, 44, 427–451. [Google Scholar] [CrossRef]
  16. Li, B.Q.; Khoshmanesh, M.; Avouac, J.-P. Surface Deformation and Seismicity Induced by Poroelastic Stress at the Raft River Geothermal Field, Idaho, USA. Geophys. Res. Lett. 2021, 48, e2021GL095108. [Google Scholar] [CrossRef]
  17. Shirzaei, M.; Ellsworth, W.L.; Tiampo, K.F.; González, P.J.; Manga, M. Surface Uplift and Time-dependent Seismic Hazard Due to Fluid Injection in Eastern Texas. Science 2016, 353, 1416–1419. [Google Scholar] [CrossRef] [PubMed]
  18. Vasco, D.W.; Johnson, L.R.; Goldstein, N.E. Using Surface Displacement and Strain Observations to Determine Deformation at Depth, with an Application to Long Valley Caldera, California. J. Geophys. Res. 1988, 93, 3232–3242. [Google Scholar] [CrossRef]
  19. Tamburini-Beliveau, G.; Grosso-Heredia, J.A.; Béjar-Pizarro, M.; Pérez-López, R.; Portela, J.; Cismondi-Duarte, M.; Monserrat, O. Assessment of Ground Deformation and Seismicity in Two Areas of Intense Hydrocarbon Production in the Argentinian Patagonia. Sci. Rep. 2022, 12, 19198. [Google Scholar] [CrossRef]
  20. Staniewicz, S.; Chen, J.; Lee, H.; Olson, J.; Savvaidis, A.; Reedy, R.; Breton, C.; Rathje, E.; Hennings, P. InSAR Reveals Complex Surface Deformation Patterns Over an 80,000 km2 Oil-Producing Region in the Permian Basin. Geophys. Res. Lett. 2020, 47, e2020GL090151. [Google Scholar] [CrossRef]
  21. Feng, Z.; Dong, D.; Tian, J.; Qiu, Z.; Wu, W.; Zhang, C. Geochemical Characteristics of Longmaxi Formation Shale Gas in the Weiyuan Area, Sichuan Basin, China. J. Pet. Sci. Eng. 2018, 167, 538–548. [Google Scholar] [CrossRef]
  22. Ma, X.H.; Zhang, X.W.; Xiong, W.; Liu, Y.Y.; Gao, J.L.; Yu, R.Z.; Sun, Y.P.; Wu, J.; Kang, L.X.; Zhao, S.P. Prospects and Challenges of Shale Gas Development in China. Pet. Sci. Bull. 2023, 8, 491–501. [Google Scholar] [CrossRef]
  23. Zheng, G.; Wang, H.; Wright, T.J.; Lou, Y.; Zhang, R.; Zhang, W.; Shi, C.; Huang, J.; Wei, N. Crustal Deformation in the India-Eurasia Collision Zone From 25 Years of GPS Measurements. J. Geophys. Res. Solid Earth 2017, 122, 9290–9312. [Google Scholar] [CrossRef]
  24. Wei, Z.; Chu, R.; Xie, J.; Bao, F.; Zeng, S.; Sheng, M.; Zeng, Q. Crustal Structure in the Weiyuan Shale Gas Field, China, and Its Tectonic Implications. Tectonophysics 2022, 837, 229449. [Google Scholar] [CrossRef]
  25. Ran, Q.H.; Zhao, H. Key Technology and Development Direction of Horizontal Well Drilling Weiyuan Shale Gas. Drill. Prod. Technol. 2020, 43, 12–15+16. [Google Scholar]
  26. Vasco, D.W.; Dixon, T.H.; Ferretti, A.; Samsonov, S.V. Monitoring the Fate of Injected CO2 Using Geodetic Techniques. Geophysics 2020, 39, 29–37. [Google Scholar] [CrossRef]
  27. Hooper, A.; Segall, P.; Zebker, H. Persistent Scatterer Interferometric Synthetic Aperture Radar for Crustal Deformation Analysis, with Application to Volcán Alcedo, Galápagos. J. Geophys. Res. 2007, 112, B07407. [Google Scholar] [CrossRef]
  28. Tizzani, P.; Berardino, P.; Casu, F.; Casu, F.; Euillades, P.A.; Euillades, P.A.; Manzo, M.; Ricciardi, G.P.; Zeni, G.; Lanari, R. Surface Deformation of Long Valley Caldera and Mono Basin, California, Investigated with the SBAS-InSAR Approach. Remote Sens. Environ. 2007, 108, 277–289. [Google Scholar] [CrossRef]
  29. Liu, X.; Hu, J.; Sun, Q.; Li, Z.; Zhu, J. Deriving 3-D Time-Series Ground Deformations Induced by Underground Fluid Flows with InSAR: Case Study of Sebei Gas Fields, China. Remote Sens. 2017, 9, 1129. [Google Scholar] [CrossRef]
  30. Hu, J.; Wang, Q.; Li, Z.w.; Zhao, R.; Sun, Q. Investigating the Ground Deformation and Source Model of the Yangbajing Geothermal Field in Tibet, China with the WLS InSAR Technique. Remote Sens. 2016, 8, 191. [Google Scholar] [CrossRef]
  31. Hyvärinen, A. Fast and Robust Fixed-point Algorithms for Independent Component Analysis. IEEE Trans. Neural Netw. 1999, 10, 626–634. [Google Scholar] [CrossRef]
  32. Kositsky, A.P.; Avouac, J.P. Inverting Geodetic Time Series with a Principal Component Analysis-based Inversion Method. J. Geophys. Res. 2010, 115, B03401. [Google Scholar] [CrossRef]
  33. Rucci, A.; Vasco, D.W.; Novali, F. Monitoring the Geologic Storage of Carbon Dioxide Using Multicomponent SAR Interferometry. Geophys. J. Int. 2011, 193, 197–208. [Google Scholar] [CrossRef]
  34. Sabah, M.; Ameri, M.; Hofmann, H.; Ebrahimi, M.I. Numerical Modeling of Injection-Induced Earthquakes Based on Fully Coupled Thermo-Poroelastic Boundary Element Method. Geothermics 2022, 105, 102481. [Google Scholar] [CrossRef]
  35. Varejão, F.G.; Warren, L.V.; Simões, M.G.; Cerri, R.I.; Alessandretti, L.; Santos, M.G.M.; Assine, M.L. Evaluation of Distinct Soft-sediment Deformation Triggers in Mixed Carbonate-siliciclastic Systems: Lessons from the Brazilian Pre-Salt Analogue Crato Formation (Araripe Basin, NE Brazil). Mar. Pet. Geol. 2022, 140, 105673. [Google Scholar] [CrossRef]
  36. Mogi, K. Relations Between the Eruptions of Various Volcanoes and the Deformations of the Ground Surfaces around them. Earthq. Res. Inst. 1958, 36, 99–134. [Google Scholar]
  37. Trugman, D.T.; Borsa, A.A.; Sandwell, D.T. Did Stresses from the Cerro Prieto Geothermal Field Influence the El Mayor-Cucapah Rupture Sequence? Geophys. Res. Lett. 2014, 41, 8767–8774. [Google Scholar] [CrossRef]
  38. Xu, W.; Gao, H.; Bürgmann, R.; Feng, G.; Li, Z.; Jiang, G. Anthropogenic Activity at the Leyte Geothermal Field Promoted the 2017 Mw 6.5 Earthquake. Tectonophysics 2022, 824, 229227. [Google Scholar] [CrossRef]
  39. Steketee, J.A. On Volterra’s Dislocations in a Semi-infinite Elastic Medium. Can. J. Phys. 1958, 36, 192–205. [Google Scholar] [CrossRef]
  40. Yong, R.; Chen, G.S.; Yang, X.F.; Huang, S.; Li, B.; Zheng, M.J.; Liu, W.P.; He, Y.P. Profitable Development Technology of the Changning-Weiyuan National Shale Gas Demonstration Area in the Sichuan Basin and Its Enlightenment. Nat. Gas Ind. 2022, 42, 136–147. [Google Scholar] [CrossRef]
  41. Zhang, Q.; Li, X.; Li, S.K.; Yang, J.J.; Zhou, J.H. Evaluation of Water Environmental Carrying Capacity in Weiyuan County Based on Shale Gas Development. Sci. Technol. Eng. 2021, 21, 9152–9159. [Google Scholar]
  42. Lin, Y.-n.N.; Kositsky, A.P.; Avouac, J.-P. PCAIM Joint Inversion of InSAR and Ground-based Geodetic Time Series: Application to Monitoring Magmatic Inflation Beneath the Long Valley Caldera. Geophys. Res. Lett. 2010, 37, L23301. [Google Scholar] [CrossRef]
  43. Wu, X.; Xia, J.; Guan, B.; Yan, X.; Zou, L.; Liu, P.; Yang, L.; Hong, S.; Hu, S. Water Availability Assessment of Shale Gas Production in the Weiyuan Play, China. Sustainability 2019, 11, 940. [Google Scholar] [CrossRef]
Figure 1. (a) Structural background of Sichuan Basin; (b) seismic activity distribution in the Weiyuan-Rongxian shale gas field.
Remotesensing 16 01929 g001
Figure 2. Schematic diagram of the joint MT-InSAR and PCA-based inversion method.
Remotesensing 16 01929 g002
Figure 3. (a) Ascending LOS deformation velocity of the Weiyuan-Rongxian shale gas field over 2015–2021. (b) Descending LOS deformation velocity of the Weiyuan-Rongxian shale gas field over 2015–2021. (c) Vertical deformation velocity of the Weiyuan-Rongxian shale gas field over 2015–2021. (d) East-west LOS deformation velocity of the Weiyuan-Rongxian shale gas field over 2015–2021. (e) Deformation time series at point A. (f) Deformation time series at point B (blue dots in (ad) represent the position of the shale gas production well platforms).
Remotesensing 16 01929 g003
Figure 4. (a) The spatial distribution of 9 principal components. (b) Time series with 9 principal components. (c) Comparison between the time series of the first principal component and the cumulative number of shale gas production wells. (d) Comparison between time series of the second principal component and precipitation.
Remotesensing 16 01929 g004
Figure 5. (a) Vertical deformation in the Weiyuan-Rongxian shale gas field. (b) Model predictions of vertical temporal deformation based on reservoir volume changes in the Weiyuan-Rongxian shale gas field. (c) Residual of vertical time series deformation observations and simulated deformation in the Weiyuan-Rongxian shale gas field. (d) Volume changes of the reservoir in the Weiyuan-Rongxian shale gas field (black dots in the figure represent the position of the shale gas production well platforms).
Remotesensing 16 01929 g005
Figure 6. (a) Coulomb stress changes on Rongxian ML4.9 two pre-shocks source mechanism plane 1 (strike = 190°, dip = 42°, rake = 83°) due to reservoir volume changes. (b) Coulomb stress changes on Rongxian ML4.9 two pre-shocks source mechanism plane 2 (strike = 19°, dip = 48°, rake = 96°) due to reservoir volume changes. (c) Coulomb stress changes on Rongxian ML4.9 earthquake source mechanism plane 1 (strike = 170°, dip = 51°, rake = 72°) due to reservoir volume changes. (d) Coulomb stress changes on Rongxian ML4.9 earthquake source mechanism plane 2 (strike = 17°, dip = 42°, rake = 11°) due to reservoir volume changes. Green dots in the figure represent the position of the shale gas production well platforms, and black dots represent the position of the shale gas production well platforms.
Remotesensing 16 01929 g006
Figure 7. (a) Coulomb stress changes on the source mechanism plane 1 of the Weiyuan ML5.4 earthquake (strike = 25°, dip = 39°, rake = 70°), due to reservoir volume changes. (b) Coulomb stress changes on the source mechanism plane 2 of the Weiyuan ML5.4 earthquake (strike = 230°, dip = 52°, rake = 96°) due to reservoir volume changes. (c) Coulomb stress changes on the source mechanism plane 1 of the Zizhong ML5.2 earthquake (strike = 20°, dip = 41°, rake = 71°) due to reservoir volume changes. (d) Coulomb stress changes on the source mechanism plane 2 of the Zizhong ML5.2 earthquake (strike = 225°, dip = 52°, rake = 105°) due to reservoir volume changes. Green dots in the figure represent the position of the shale gas production well platforms, and black dots represent the position of the shale gas production well platforms.
Remotesensing 16 01929 g007
Figure 8. (a) Coulomb stress changes on the Molinchang fault (strike = 150°, dip = 40°, rake = 90°) due to reservoir volume changes. (b) Coulomb stress changes on the Niujingao fault (strike = 0°, dip = 30°, rake = 90°) due to reservoir volume changes. (c) Coulomb stress changes on the Zizhong fault (strike = 10°, dip = 20°, rake = 90°) due to reservoir volume changes. (d) Coulomb stress changes on the Lijiachang fold (strike angle = 45°, dip = 10°, rake = 90°) due to reservoir volume changes (green dots in the figure represent the position of the shale gas production well platforms, and black dots represent the position of the shale gas production well platforms).
Remotesensing 16 01929 g008
Figure 9. (a) Coulomb stress changes on the Changyan fault (strike = 230°, dip = 60°, rake = 90°) due to reservoir volume changes. (b) Coulomb stress changes on the Chongtan fault (strike = 110°, dip = 65°, rake = 90°) due to reservoir volume changes. (c) Coulomb stress changes on the Gaoqiao fault (strike = 190°, dip = 28°, rake = 72°) due to reservoir volume changes. (d) Coulomb stress changes on the Dongxingchang fault (strike = 90°, dip = 55°, rake = 90°) due to reservoir volume changes. (e) Coulomb stress changes on the Dayakou fault (strike = 25°, dip = 40°, rake = 90°) due to reservoir volume changes. (f) Coulomb stress changes on the Huangquepo fault (strike = 120°, dip = 30°, rake = 90°) due to reservoir volume changes (green dots in the figure represent the position of the shale gas production well platforms, and black dots represent the position of the shale gas production well platforms).
Remotesensing 16 01929 g009
Disclaimer/Publisher’s Note: The statements, opinions and data contained in all publications are solely those of the individual author(s) and contributor(s) and not of MDPI and/or the editor(s). MDPI and/or the editor(s) disclaim responsibility for any injury to people or property resulting from any ideas, methods, instructions or products referred to in the content.

