Article

Precipitation Characteristics at Different Developmental Stages of the Tibetan Plateau Vortex in July 2021 Based on GPM-DPR Data

1
National Satellite Meteorological Center (National Center for Space Weather), China Meteorological Administration, Beijing 100081, China
2
Innovation Center for FengYun Meteorological Satellite (FYSIC), Beijing 100081, China
3
Key Laboratory of Radiometric Calibration and Validation for Environmental Satellites, Beijing 100081, China
4
China Meteorological Administration Training Centre, Beijing 100081, China
*
Author to whom correspondence should be addressed.
Remote Sens. 2024, 16(11), 1947; https://doi.org/10.3390/rs16111947
Submission received: 9 April 2024 / Revised: 17 May 2024 / Accepted: 25 May 2024 / Published: 28 May 2024

Abstract

:
The Tibetan Plateau vortex (TPV), as an α-scale mesoscale weather system, often brings severe weather conditions like torrential rain and severe convective storms. Based on the detections from the Global Precipitation Measurement (GPM) Core Observatory’s Dual-frequency Precipitation Radar (DPR) and the FY-4A satellite’s Advanced Geostationary Radiation Imager (AGRI), combined with ERA5 reanalysis data, the precipitation characteristics of a TPV moving eastward during 8–13 July 2021 at different developmental stages are explored in this study. It was clear that the near-surface precipitation rate of the TPV during the initial stage at the eastern Tibetan Plateau (TP) was below 1 mm·h−1, implying overall weak precipitation dominated by stratiform clouds. After moving out of the TP, the radar reflectivity factor (Ze), precipitation rate, and normalized intercept parameter (dBNw) significantly increased, while the proportion of convective clouds gradually rose. Following the TPV movement, the distribution range and vertical thickness of Ze, mass-weighted mean diameter (Dm), and dBNw tended to increase. The high-frequency region of Ze appeared at 15–20 dBZ, while Dm and dBNw occurred at around 1 mm and 33 mm−1·m−3, respectively. Near the melting layer, Ze was characterized by a significant increase due to the aggregation and melting of ice crystals. The precipitation rate of convective clouds was generally greater than that of stratiform clouds, whilst both of them increased during the movement of the TPV. Particularly, at 01:00 on 12 July, there was a significant increase in the precipitation rate and Dm of convective clouds, while dBNw noticeably decreased. These findings could provide valuable insights into the three-dimensional structure and microphysical characteristics of the precipitation during the movement of the TPV, contributing to a better understanding of cloud precipitation mechanisms.

1. Introduction

As an important weather system, the Tibetan Plateau vortex (TPV) refers to an α-scale mesoscale cyclonic vortex generated on the Tibetan Plateau (TP), primarily at the 500 hPa geopotential height field [1,2]. A small portion of TPVs that move away from the TP exhibit strong intensity and deep low-pressure systems, often resulting in disastrous weather conditions such as torrential rain and severe convective storms in downstream areas [3,4]. Current research on TPVs is mainly focused on the vorticity, water vapor, heat budget, and characteristics of heavy precipitation associated with TPVs, based on ground, upper-air, and satellite observations and numerical model data [5,6,7,8,9]. In terms of TPV precipitation, Li et al. [5] showed that TPVs favored an ascending motion to the east of the plateau, which was conducive to precipitation and the genesis of southwest vortexes. Li et al. [6] found that the intense-rainfall-producing TPV was often characterized by a notable upper-level divergence north of a strong upper-level jet and a strong middle-level warm advection ahead of a shortwave trough over the TP. Lin et al. [7] discovered that the extreme precipitation events associated with TPVs tended to, remarkably, occur near the center and the southeastern quadrant of the TPVs. However, conventional observations are often limited, and it is difficult to obtain meteorological information on the large-scale spatial field, due to the complex physical geographic environment of the TP. Furthermore, the accuracy of the numerical model data is greatly reduced in regions with a lack of observational data.
With the improvement of satellite observation capabilities, the advantages of research based on remote-sensing satellite data have become evident. Satellite data provide better spatial coverage compared to conventional observational data, which can compensate for the lack of observational data in the TP region [10,11]. Passive remote-sensing observations can capture the multi-channel imaging features of cloud systems [12,13]. Comparatively, active remote-sensing observations can directly obtain the vertical structure of clouds [14,15]. The Tropical Rainfall Measurement Mission (TRMM) Precipitation Radar (PR) which is the world’s first precipitation radar, observed precipitation in tropical and subtropical regions between 35°S and 35°N [16]. The Global Precipitation Measurement (GPM) mission, as the successor to the TRMM, was jointly developed by the National Aeronautics and Space Administration (NASA) and the Japan Aerospace Exploration Agency (JAXA). The GPM Core Observatory satellite was launched on 27 February 2014, carrying the first space-borne Dual-frequency Precipitation Radar (DPR), operating at Ku and Ka bands (13 and 35 GHz, respectively) for active remote sensing, and a conical-scanning GPM Microwave Imager (GMI) for high-resolution, multi-channel (10–183 GHz) passive remote sensing [17]. It not only expands the observation range to 65°S-65°N but also further enhances the observation capabilities for light-intensity precipitation (less than 0.5 mm·h−1) and solid precipitation, which accounts for a significant fraction of precipitation occurrence in the middle and high latitudes [18,19]. In particular, the DPR and GMI measurements can construct a unique observational database by quantifying the microphysical properties of precipitating particles [20,21].
TRMM and GPM data have been widely used to acknowledge the precipitation types, three-dimensional structures, and microphysical characteristics of tropical cyclones [22,23,24,25,26], southwest vortexes [27], northeast China cold vortexes [28], cold fronts [29], Meiyu fronts [30], mesoscale convective systems [31], and East Asian monsoon systems [32]. Some research on the precipitation characteristics of TP weather systems is also reported in recent years. Typically, Hu et al. [33] extracted the diurnal variation characteristics of precipitation over the TP and its surrounding areas using TRMM data. Xiang et al. [34] analyzed the heavy precipitation processes caused by TPVs based on TRMM data and highlighted that the stratiform precipitation clouds with a higher fraction of area fostered a comparable ratio of contribution to the total precipitation and a much lower precipitation rate compared with the convective precipitation clouds. Wei et al. [35] investigated a heavy precipitation process caused by a TPV in the northwest region based on GPM and concluded that the contribution of convective rainfall to the total precipitation reached 75%, and the droplet spectrum and cloud particle radius in convective clouds differed widely. However, the three-dimensional characteristics of precipitation at different developmental stages of TPV are rarely mentioned.
Naturally, most TPVs are generated on the west or central part of the TP and disappear on the east part of the TP, but few of them can move off the TP under favorable circulation conditions and cause large-scale rainstorms, thunderstorms, and other disastrous weather processes in the downstream areas. Up to the present, there is still a lack of understanding regarding precipitation characteristics of TPVs in a long-life cycle. During 8–13 July 2021, a TPV moved off the TP across a wide coverage and brought heavy precipitation and severe convective weather to many provinces in China, including Sichuan, Shaanxi, Shanxi, Henan, Beijing, Tianjin, Hebei, and Shandong, which could be accepted as a representative TPV case. Therefore, we analyzed the precipitation characteristics of this TPV during its eastward movement at different developmental stages, based on the detections from GPM-DPR and the FY-4A satellite’s Advanced Geosynchronous Radiation Imager (AGRI), as well as ERA5 reanalysis data, during 8–13 July 2021. The objectives of the current work are (1) to trace the TPV event and extract the evolutionary characteristics of the corresponding cloud system and (2) to capture the horizontal and vertical structural features of the TPV precipitation at different developmental stages in different geographical regions. Acknowledging the variation in structure and characteristics of the precipitation during the movement of the TPV has important implications for better understanding the cloud precipitation mechanisms.

2. Materials and Methods

2.1. Data

2.1.1. GPM-DPR Measurements

The GPM-DPR is a dual-frequency precipitation radar at both the Ku-band (13.6 GHz) and the Ka-band (35.5 GHz). In this study, we utilized the V07 version of the GPM_2ADPR product, which is the first standard product to account for the Ka-band precipitation radar scan pattern changes implemented on 21 May 2018. This change allows for a more accurate precipitation estimation method for dual-frequency radar, which is implemented to improve the detectability of precipitation signals and the detection of weak, horizontally distributed precipitation that occurs at high-latitudes [36]. The GPM_2ADPR products contained full-swath (FS) format data with a vertical resolution of 125 m and high-sensitivity (HS) format data with a vertical resolution of 500 m, and the spatial resolution at the nadir is about 5 km. The three-dimensional radar reflectivity factor (Ze), precipitation rate, and droplet size distribution (DSD) were provided by the FS product, as well as the two-dimensional parameters such as near-surface precipitation rate, storm top height, melting layer height, bright band height, and precipitation type, which were collected during 8–13 July 2021. Additionally, the DSD includes parameters of the normalized intercept parameter (dBNw) and the mass-weighted mean diameter (Dm). The retrievals of DSD, rain type classification, and precipitation variables can be seen in previous studies [37,38,39,40,41].

2.1.2. FY-4A AGRI Measurements

The FY-4A meteorological satellite, as China’s second-generation geostationary meteorological satellite [42], is equipped with AGRI, which includes 14 spectral channels covering long-wave infrared channel, visible light channel, near-infrared channel, shortwave infrared channel, mid-wave infrared channel, and water vapor channel. It provides large-scale and high-frequency observations of the TPV precipitation at different developmental stages. The data used in this study is the full disk data of the 10.8 μm infrared channel brightness temperature from the FY-4A AGRI, with a horizontal resolution of 4 km and a temporal resolution of 15 min during 8–13 July 2021.

2.1.3. ERA5 Reanalysis Data

ERA5 is the fifth-generation global atmospheric reanalysis data produced by the European Centre for Medium-Range Weather Forecasts (ECMWF), containing hourly variables of the global atmosphere, ocean, and land surface [43]. Hourly data of the 500 hPa geopotential height field, wind field, total column water vapor, and precipitation rate for 8–13 July 2021 were accessed from the Copernicus Climate Data Store (https://cds.climate.copernicus.eu/cdsapp (accessed on 20 January 2024)), with a spatial resolution of 0.25° × 0.25°.

2.1.4. Gauge Precipitation Observation

The hourly gauge precipitation data covered 8–13 July 2021 from 2440 meteorological stations in China was obtained from the National Meteorological Information Center. These precipitation data were strictly quality controlled in maintaining internal consistency and homogeneity.

2.2. Methods

2.2.1. Identification of TPV Center

The TPV was defined as a low-pressure system on the 500 hPa geopotential height field that originates over the TP with closed contours or a cyclonic circulation pattern in wind direction at three stations. Due to the high spatiotemporal resolution, ERA5 data have been effectively applied in TPVs identification [44]. Therein, the hourly 500 hPa geopotential height field and wind field data from ERA5 were jointly utilized to identify the center position of the TPV.

2.2.2. Statistical Method

In order to reveal the vertical structural features of Ze, Dm, and dBNw of the TPV precipitation, we presented the contoured frequency by altitude diagrams (CFADs) for these variables. CFADs depict the frequency distribution of the variables within different intervals and vertical heights [45]. Each CFAD was normalized by its overall maximum at a vertical interval of 0.125 km and a horizontal interval of 1 dBZ, 0.1 mm, or 1 for Ze, Dm, or dBNw, respectively [26,27,29].

3. Results

3.1. Overview of the TPV Event

After being generated in western Tibet, the TPV gradually moved northeastward to southern Qinghai and continued to move eastward to southern Gansu, as seen from the hourly movement trajectory of the TPV overlaid with topography during 8–13 July 2021 (Figure 1). Subsequently, it moved northeast, passing through northern Shaanxi, northern Shanxi, and northwestern Hebei. Caused by the TPV system, regions including Sichuan, Shaanxi, Shanxi, Henan, Beijing-Tianjin-Hebei, and Shandong received heavy precipitation.
Associated with the TPV, the precipitation area with a magnitude greater than 10 mm was mainly located in the north-central part of Tibet on 8 July (Figure 2). It shifted eastward to northern Sichuan and northern Chongqing on 9 July and expanded northeastward to northeastern Sichuan, southern Shaanxi, western Hubei, southern Shanxi, and western Henan on 10 July. By 11 July, it continued to expand and move northeastward, covering a wide area including most parts of Beijing-Tianjin-Hebei, southern Shanxi, and western Shandong, with extensive, heavy precipitation exceeding 100 mm.

3.2. Evolutionary Characteristics of Cloud System

The GPM-DPR captured the cloud system of the TPV at 04:00 on 9 July, 17:00 on 9 July, 02:00 on 11 July, and 01:00 on 12 July, respectively. By combining the brightness temperature of the FY-4A/AGRI 10.8 µm channel, the 500 hPa geopotential height (Figure 3), and the total column vertically-integrated water vapor (Figure 4), the evolutionary characteristics of the cloud system were observed. It was clear that the TPV was located in the eastern part of the TP at 04:00 on 9 July, with closed contour lines at 500 hPa, and the north boundary of the line 588 of the subtropical high remained near 30°N. The cloud system was on the south side of the TPV, and the total water vapor was below 20 kg·m−2. As the TPV gradually moved eastward, it reached the northern part of Sichuan at 17:00 on 9 July. The cloud system was on the eastern side of the TPV where the total water vapor exceeded 50 kg·m−2, leading to heavy precipitation under favorable dynamic conditions. Subsequently, the 588 line of the subtropical high moved southward on the western side and lifted northward on the eastern side, forming a southwest-northeast orientation. Under the guidance of the northwest airflow on the west side of the subtropical high, the TPV gradually moved northeastward. At 02:00 on 11 July, the TPV was located in the southern part of Shanxi, the northwest part of Henan, and the eastern part of Shaanxi. The DPR observed the western side of the cloud system, with a total water vapor above 50 kg·m−2. With the TPV moving further northeastward, the cloud system expanded to the northern and eastern sides of the TPV at 01:00 on 12 July. Heavy precipitation was demonstrated in Inner Mongolia, Beijing-Tianjin-Hebei, Shandong, etc. The total water vapor in the western side of the cloud system observed by the DPR was above 50 kg·m−2.
By analyzing the dynamic conditions during the development of the TPV, the average divergence and vertical velocity profiles in the study regions in Figure 3 were analyzed (Figure 5). There was convergence below 450 hPa and divergence above 450 hPa when the TPV cloud system was in the eastern part of the TP. The overall upward motion was strong, with the maximum vertical velocity occurring at 450 hPa. After moving out of the TP, convergence dominated throughout the entire layer, with increasing divergence at 200 hPa over the four stages. The maximum vertical velocity weakened in the northern part of Sichuan and then strengthened again. The height at which the maximum vertical velocity occurred gradually increased. This was consistent with the research of Liu et al. [46], who discovered that the TPV exhibited distinct low-level convergence and upper-level divergence over the TP with an overall upward motion, and both convergence and divergence as well as upward motion weakened after moving out of the TP.

3.3. The Horizontal Characteristics of Precipitation

The distributions of the near-surface precipitation rate, precipitation type, and storm top height in the study regions at four developmental stages were used to characterize the precipitation at a horizontal scale (Figure 6). At 04:00 on 9 July, the TPV was located in the eastern part of the TP, with the vortex cloud system covering the southern part of Qinghai and the eastern part of Tibet in a comma-shaped pattern. Precipitation was mainly concentrated in the northern part, with near-surface precipitation rates below 1 mm·h−1. The precipitation type was predominantly stratiform, and the storm top height ranged from 6.0 to 10.0 km. As the TPV gradually moved eastward, the heavy precipitation area at 17:00 on 9 July was mainly declared in the northern part of Sichuan, where the maximum near-surface precipitation rate exceeded 10 mm·h−1, with a significant increase in precipitation intensity due to terrain factors. It was obvious that the stratiform precipitation appeared at the northern part, and the scattered convective precipitation was observed at the southern part, with a pixel ratio being 2196:480. The storm top height ranged from 5.0 to 9.0 km, smaller than at 04:00 on 9 July.
The TPV subsequently moved northeastward, covering Shaanxi, Shanxi, Henan, and Hubei at 02:00 on 11 July. The maximum near-surface precipitation rate on the western side exceeded 10 mm·h−1, and the centers of heavy precipitation were scattered. The northern and southern parts were dominated by stratiform clouds, while the central part was exposed to convective clouds. The pixel ratio of stratiform to convective precipitation was 1427:514, with an increased proportion of convective precipitation. The storm top height ranged from 5.0 to 10.0 km, with a relatively higher height in the northern and southern parts of the cloud system. At 01:00 on 12 July, the cloud system was demonstrated in the central part of Inner Mongolia, Beijing-Tianjin-Hebei, and Shandong, showing two distinct heavy precipitation areas in the north and south sides. High precipitation values exceeding 10 mm·h−1 were detected in the southern part of Beijing and the central-northern part of Shandong. The pixel ratio of the stratiform to convective precipitation was 3449:1106, with an increase in convective precipitation. The northern and southern parts were dominated by stratiform precipitation, while the central part was mastered by convective precipitation. The storm top height was relatively higher in the south of 39.0°N, with maximum values exceeding 13.0 km and below 9.0 km in the north of 39.0°N.

3.4. The Vertical Characteristics of Precipitation

The vertical structures of Ze, Dm, and dBNw along the AB lines in Figure 6 were demonstrated in Figure 7. At 04:00 on 9 July, the overall vertical precipitation was weak, with Ze mostly below 30 dBZ, Dm less than 2.0 mm, and dBNw ranging between 25 mm-1·m−3 and 35 mm−1·m−3. The storm top height was around 10.0 km while the terrain height was around 4.0 km. At 17:00 on 9 July, the western side of the precipitation area was located on the western Sichuan Plateau, and the values of Ze, Dm, and dBNw were not significantly different from that at 04:00 on 9 July. On the eastern side, Ze exceeded 35 dBZ, and dBNw increased to 35–45 mm−1·m−3. The bright band appeared near 5.0 km, indicating stratiform precipitation. Since Dm values were relatively consistent, areas with higher dBNw exhibited higher Ze and stronger precipitation [31]. Despite minimal differences in the storm top heights, relatively thinner cloud layers were detected at the western side with higher terrain height, while deeper cloud layers, higher Ze, and stronger precipitation intensity were observed at the eastern side.
At 02:00 on 11 July, the DPR captured the western side of the cloud system, and the precipitation areas were relatively scattered. Bright bands appeared to the west of 109.5°E, suggesting stratiform precipitation, with Dm below 1.8 mm and dBNw between 30 mm−1·m−3 and 40 mm−1·m−3. Scattered convective clouds were found to the east of 110.7°E in which dBNw was relatively higher, even exceeding 45 mm−1·m−3. At 01:00 on 12 July, the convective clouds of the TPV developed vigorously. The maximum Ze in the active convective area near 117.7°E exceeded 35 dBZ, with the storm top height higher than 13.0 km. The dBNw (30–40 mm−1·m−3) and the Dm (above 2.6 mm) in the convective precipitation were generally larger than that in the stratiform precipitation. The area from 115.7°E to 116.1°E were also exposed to convective precipitation, with larger dBNw (greater than 45 mm−1·m−3) and smaller Dm (0.6–1.0 mm), implying that cloud droplets had not undergone sufficient collision and coalescence growth.
To further assess the occurrence frequency of Ze, Dm, and dBNw at different heights, the CFADs in the study regions were conducted with average and median value lines (Figure 8). Overall, an increase in distribution ranges of Ze, Dm, and dBNw, as well as an enlargement in the vertical development thickness of the cloud system were observed at the four developmental stages. A bright band appeared near the melting layer, where Ze abruptly increased due to the aggregation and melting processes of ice crystals [26,27,30,31]. It was evident that inflection points were observed in the average and median vertical profiles. There was consistent high occurrence frequency in areas of 5–7 km and 15–20 dBZ at four periods. From 04:00 on 9 July to 01:00 on 12 July, the high occurrence frequency areas of Ze gradually extended to the near-surface. The maximum Ze with an occurrence frequency greater than 0.4 also increased gradually, reaching around 23 dBZ, 28 dBZ, 32 dBZ, and 35 dBZ at the respective four periods.
High occurrence frequency in Dm was concentrated around 1 mm, with the respective maximum frequency covering 1.0–3.0 km at 02:00 on 11 July and 5.0–7.0 km at the other times. The vertical profiles of average and median values peaked near the melting layer, indicating the growth of ice crystal particles through aggregation and melting processes [26]. Since the ice particles disguised with the liquid surface after partially melting and producing a larger echo signal than before, the aggregation produced particles with larger volume and, hence, increased the radar reflectivity [47]. The maximum occurrence frequencies of dBNw were around 33 mm−1·m−3, and the high-frequency area of dBNw gradually extended vertically with an expansion in dBNw values. In addition, the average and median lines of Dm and dBNw at the later three stages were located to the right side of the peak occurrence frequency, with the average lines on the right side of the median lines, revealing that most values of Dm and dBNw samples were smaller than the average values.
From the vertical profiles of average precipitation rates for stratiform and convective clouds in the study regions (Figure 9a,d,g,j), it was obvious that the precipitation rate for convective clouds was higher than stratiform clouds, in line with the findings of previous studies [27,30,35]. After moving away from the TP, the precipitation rate for stratiform clouds remained relatively stable, while that for convective clouds significantly increased at 01:00 on 12 July. The peak precipitation rate for convective clouds occurred around 4.5–5.0 km, with respective values of approximately 3 mm·h−1, 3 mm·h−1, and 7 mm·h−1 at the later three periods. Additionally, a peak of around 9 mm·h−1 was observed near the surface at 01:00 on 12 July. Regarding the average vertical profiles of Dm (Figure 9b,e,h,k), minimal variations at the first three time periods were declared for stratiform clouds, but a slight increase was declared at 01:00 on 12 July. For convective clouds, Dm significantly increased at 17:00 on 9 July and at 01:00 on 12 July. Relative to stratiform clouds, Dm for convective clouds was generally smaller at 04:00 on 9 July, larger above 4.5 km at 17:00 on 9 July and 02:00 on 11 July, and larger in whole layers at 01:00 on 12 July. From the vertical profiles of the average dBNw (Figure 9c,f,i,l), it was noted that the dBNw for convective clouds was generally higher than that for stratiform clouds at 04:00 on 9 July. At 17:00 on 9 July and 02:00 on 11 July, the dBNw for convective clouds below 6.0 km significantly increased, while it decreased noticeably, excluding higher altitudes at 01:00 on 12 July.

4. Discussion

This study offered us an opportunity to exploit the potential capabilities of satellite observations for assessing TPV precipitation at different developmental stages, since it was a typical case with weather influence in a wide range. Owing to the fact that this was a single case study, the ubiquity of the results herein should be examined by investigating more observations of storms associated with TPVs.
In the analysis of vertical characteristics of precipitation for stratiform and convective clouds, we discovered that the Dm and rain rate of convective clouds decreased from the melting layer to about 3 km, while that of stratiform clouds slightly increased. Furthermore, the dBNw of convective clouds increased more evidently with the descending altitude than that of stratiform clouds. This was in line with the findings of Janapati et al. [48], who inferred that a decrease in Dm and increase in dBNw in the warm rain regions hinted at the dominance of collision-breakup processes in the convective precipitation, while a slight increase in Dm with not much variation in dBNw brought up the equilibrium condition among collision-coalescence and breakup processes in the stratiform precipitation. Therefore, the studies regarding the microphysical processes within the TPV clouds would deserve to be further explored in depth.
It is important to understand the uncertainties in this study. Since GPM-DPR precipitation rate and DSD properties were retrieved from Ze, the accuracy of these data was deeply affected by parameter measurements and data processing, such as attenuation correction and retrieval models [23,24,49]. Furthermore, as the areas captured by GPM-DPR were parts of the TPV precipitation at the four stages, certain limitations remained inevitable. To address this, the GPM-DPR precipitation rate should be estimated by ground observations and reanalysis data. The distributions of the GPM-DPR near-surface precipitation rate, ERA5 hourly precipitation rate, and hourly gauge precipitation rate at the four stages are shown in Figure 10. As the GPM-DPR precipitation rate was an instantaneous value while ERA5 and gauge precipitation rate were an hourly averaged value, the precipitation areas of the three products were relatively consistent, but the intensities were different. The values of gauge and ERA5 precipitation were higher in general than that of DPR. In the first two periods, the values of gauge and ERA5 were higher than that of DPR. In the last two periods, the values of DPR and gauge were closer, while the values of ERA5 were significantly higher. In the future, the variables of GPM-DPR products, such as precipitation rate, Ze, Dm, dBNw, and cloud water content, should be estimated by ground-based measurements from rain gauges or radars.
In the perspective of quick development and increasing accuracy in remote-sensing techniques, multi-source data fusion was particularly worth considering. The joint application of active and passive remote-sensing satellite observations, ground-based measurements, and reanalysis data has great potential for research on TPV systems. For example, the GMI data can be used jointly with GPM-DPR data at the same orbit time in our future studies. Since GMI has a wider swath (approximately 904 km) than DPR, the ice water path of the sampling column and near-surface precipitation in larger areas can be denoted based on the GMI brightness temperature data. Chen et al. [24,32] defined PCT89 as 1.818 × T89v − 0.818T89h, where T89v and T89h were the vertically and horizontally polarized brightness temperatures at 89 GHz, respectively. More intense rainfall and a stronger ice-scattering signal (as indicated by low PCT89) was discovered near the center of the tropical cyclone. Furthermore, with the successful launch on 16 April 2023, the FY-3G satellite became the world’s third satellite to measure precipitation with space-borne radar after the TRMM mission in 1997 and GPM mission in 2014 [50]. It would be more possible that the developing precipitation characteristics of TPVs can be revealed by using joint observations from FY-3G and GPM satellites.

5. Conclusions

In this study, the characteristics of precipitation during an eastward-moving TPV were explored based on the detections from GPM-DPR and FY-4A AGRI, combined with ERA5 reanalysis data. After a comprehensive analysis, the following conclusions were eventually acquired:
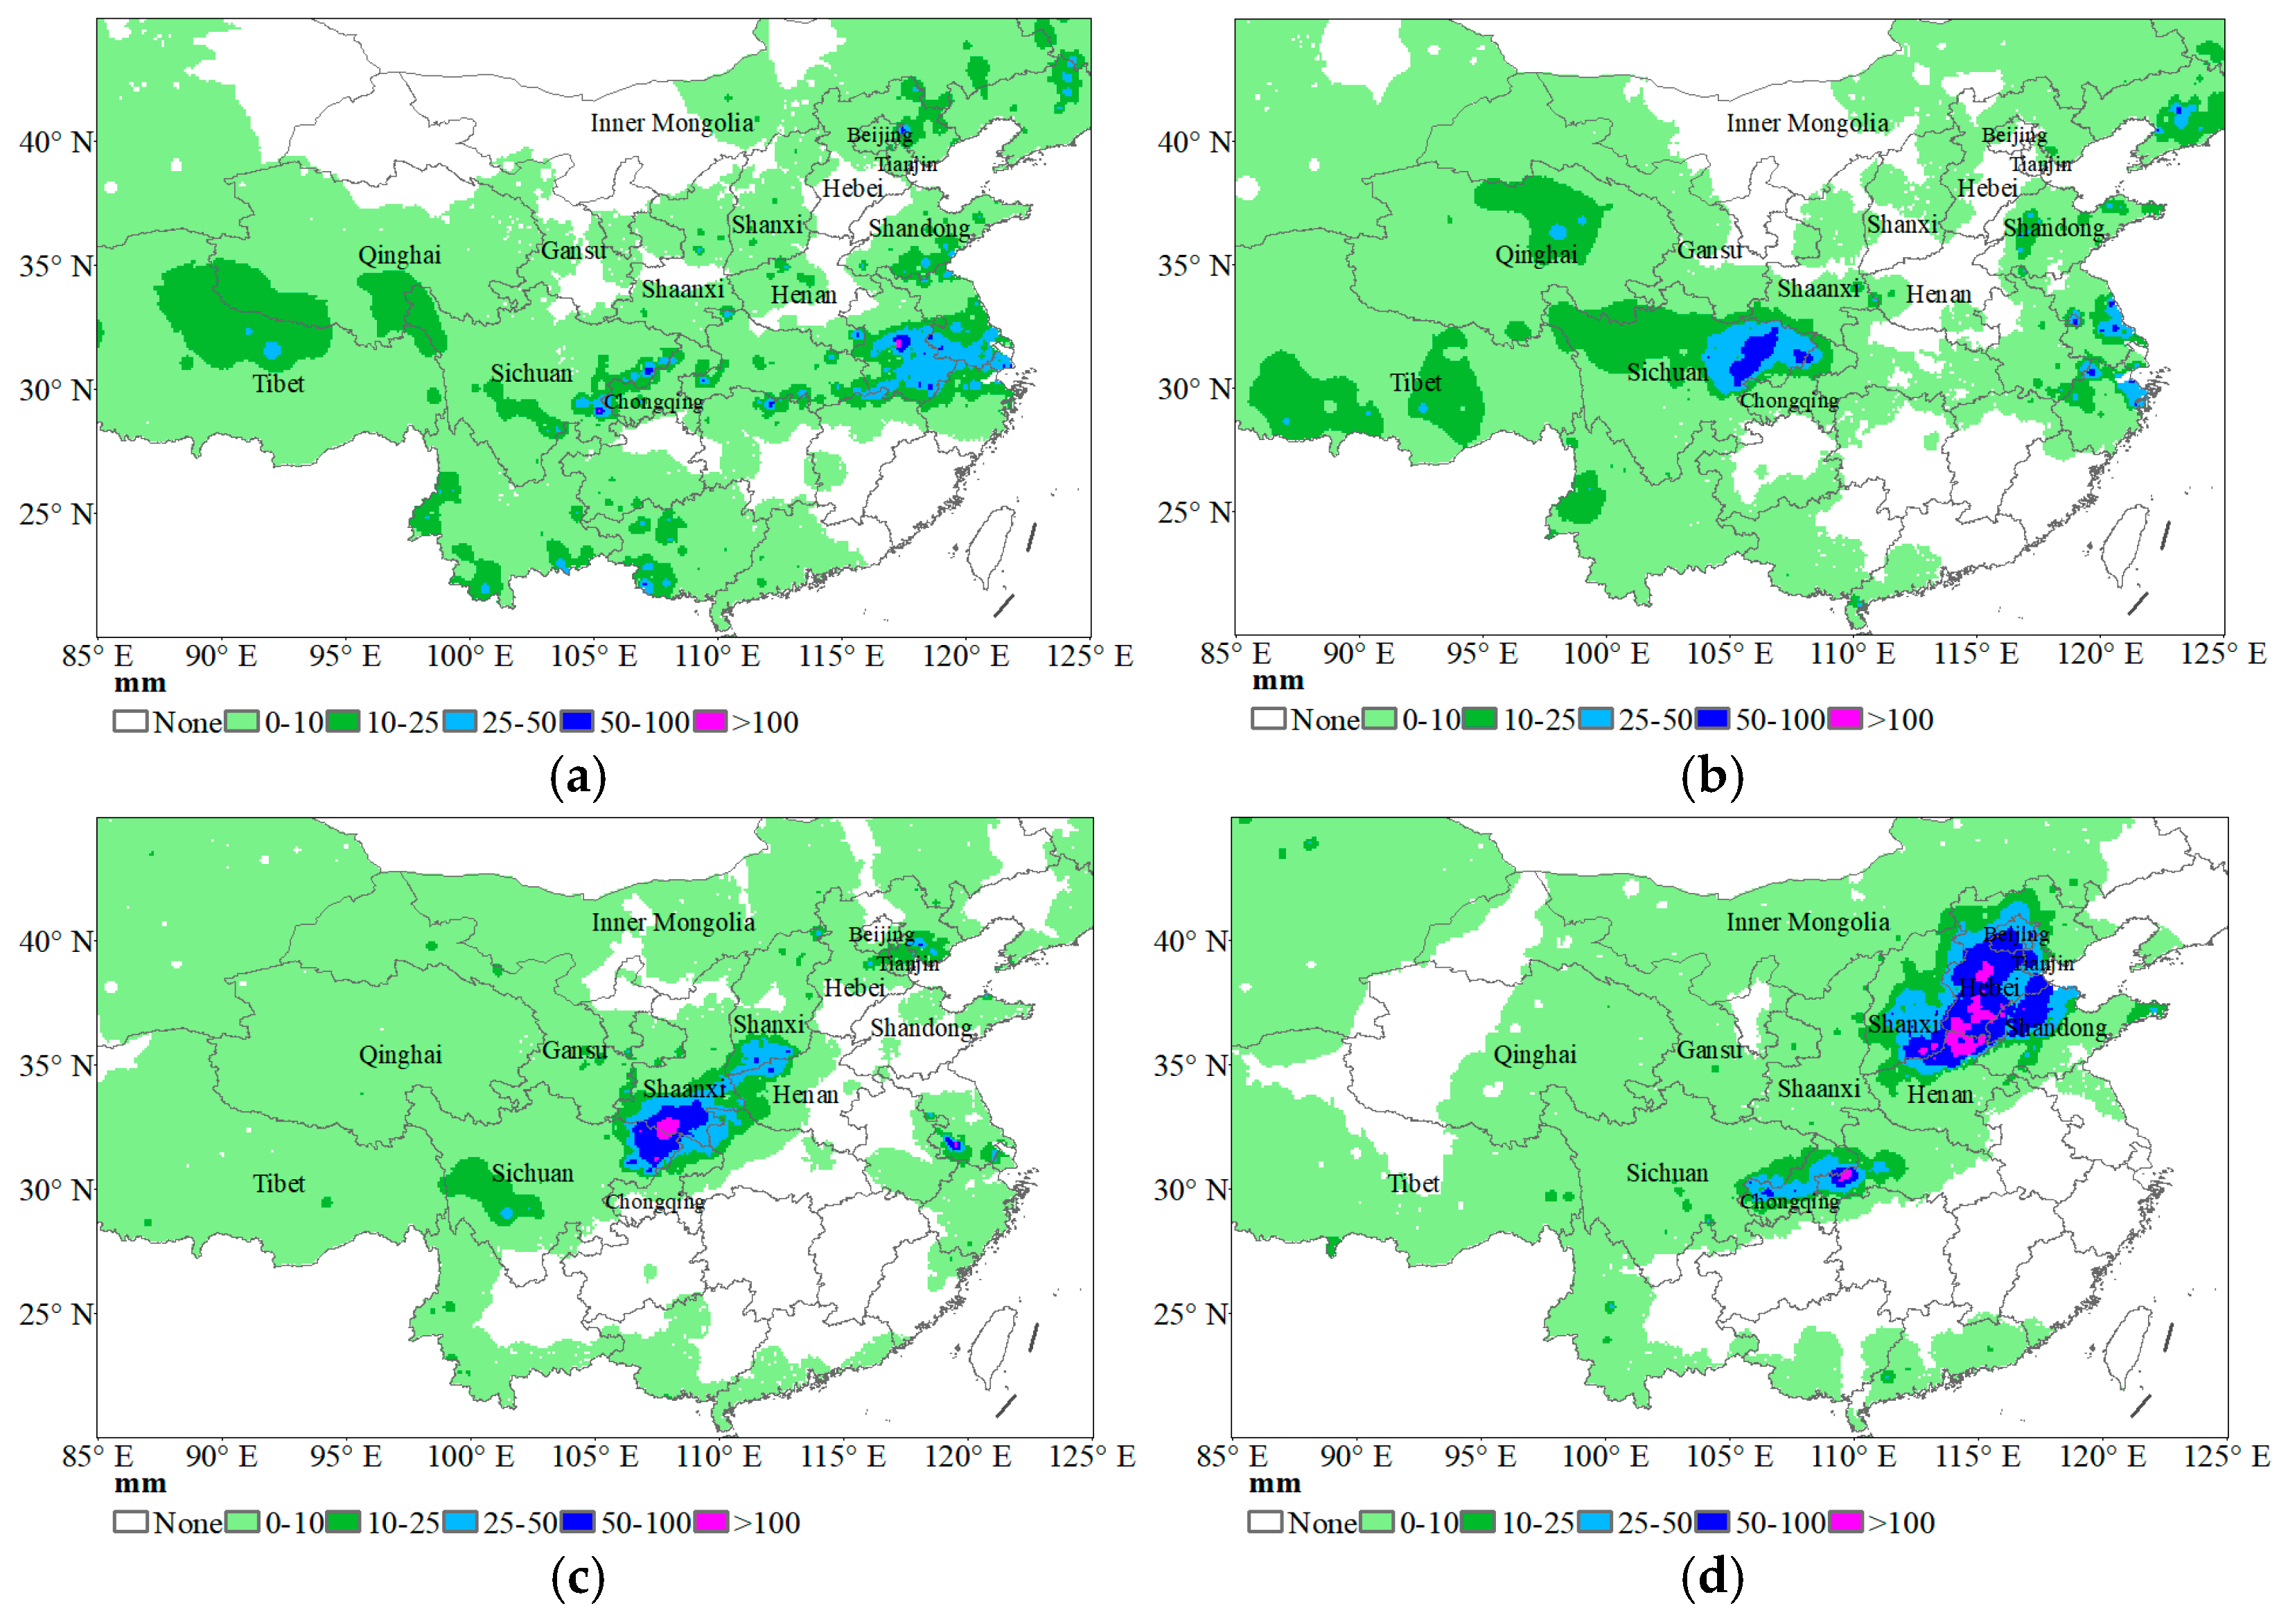
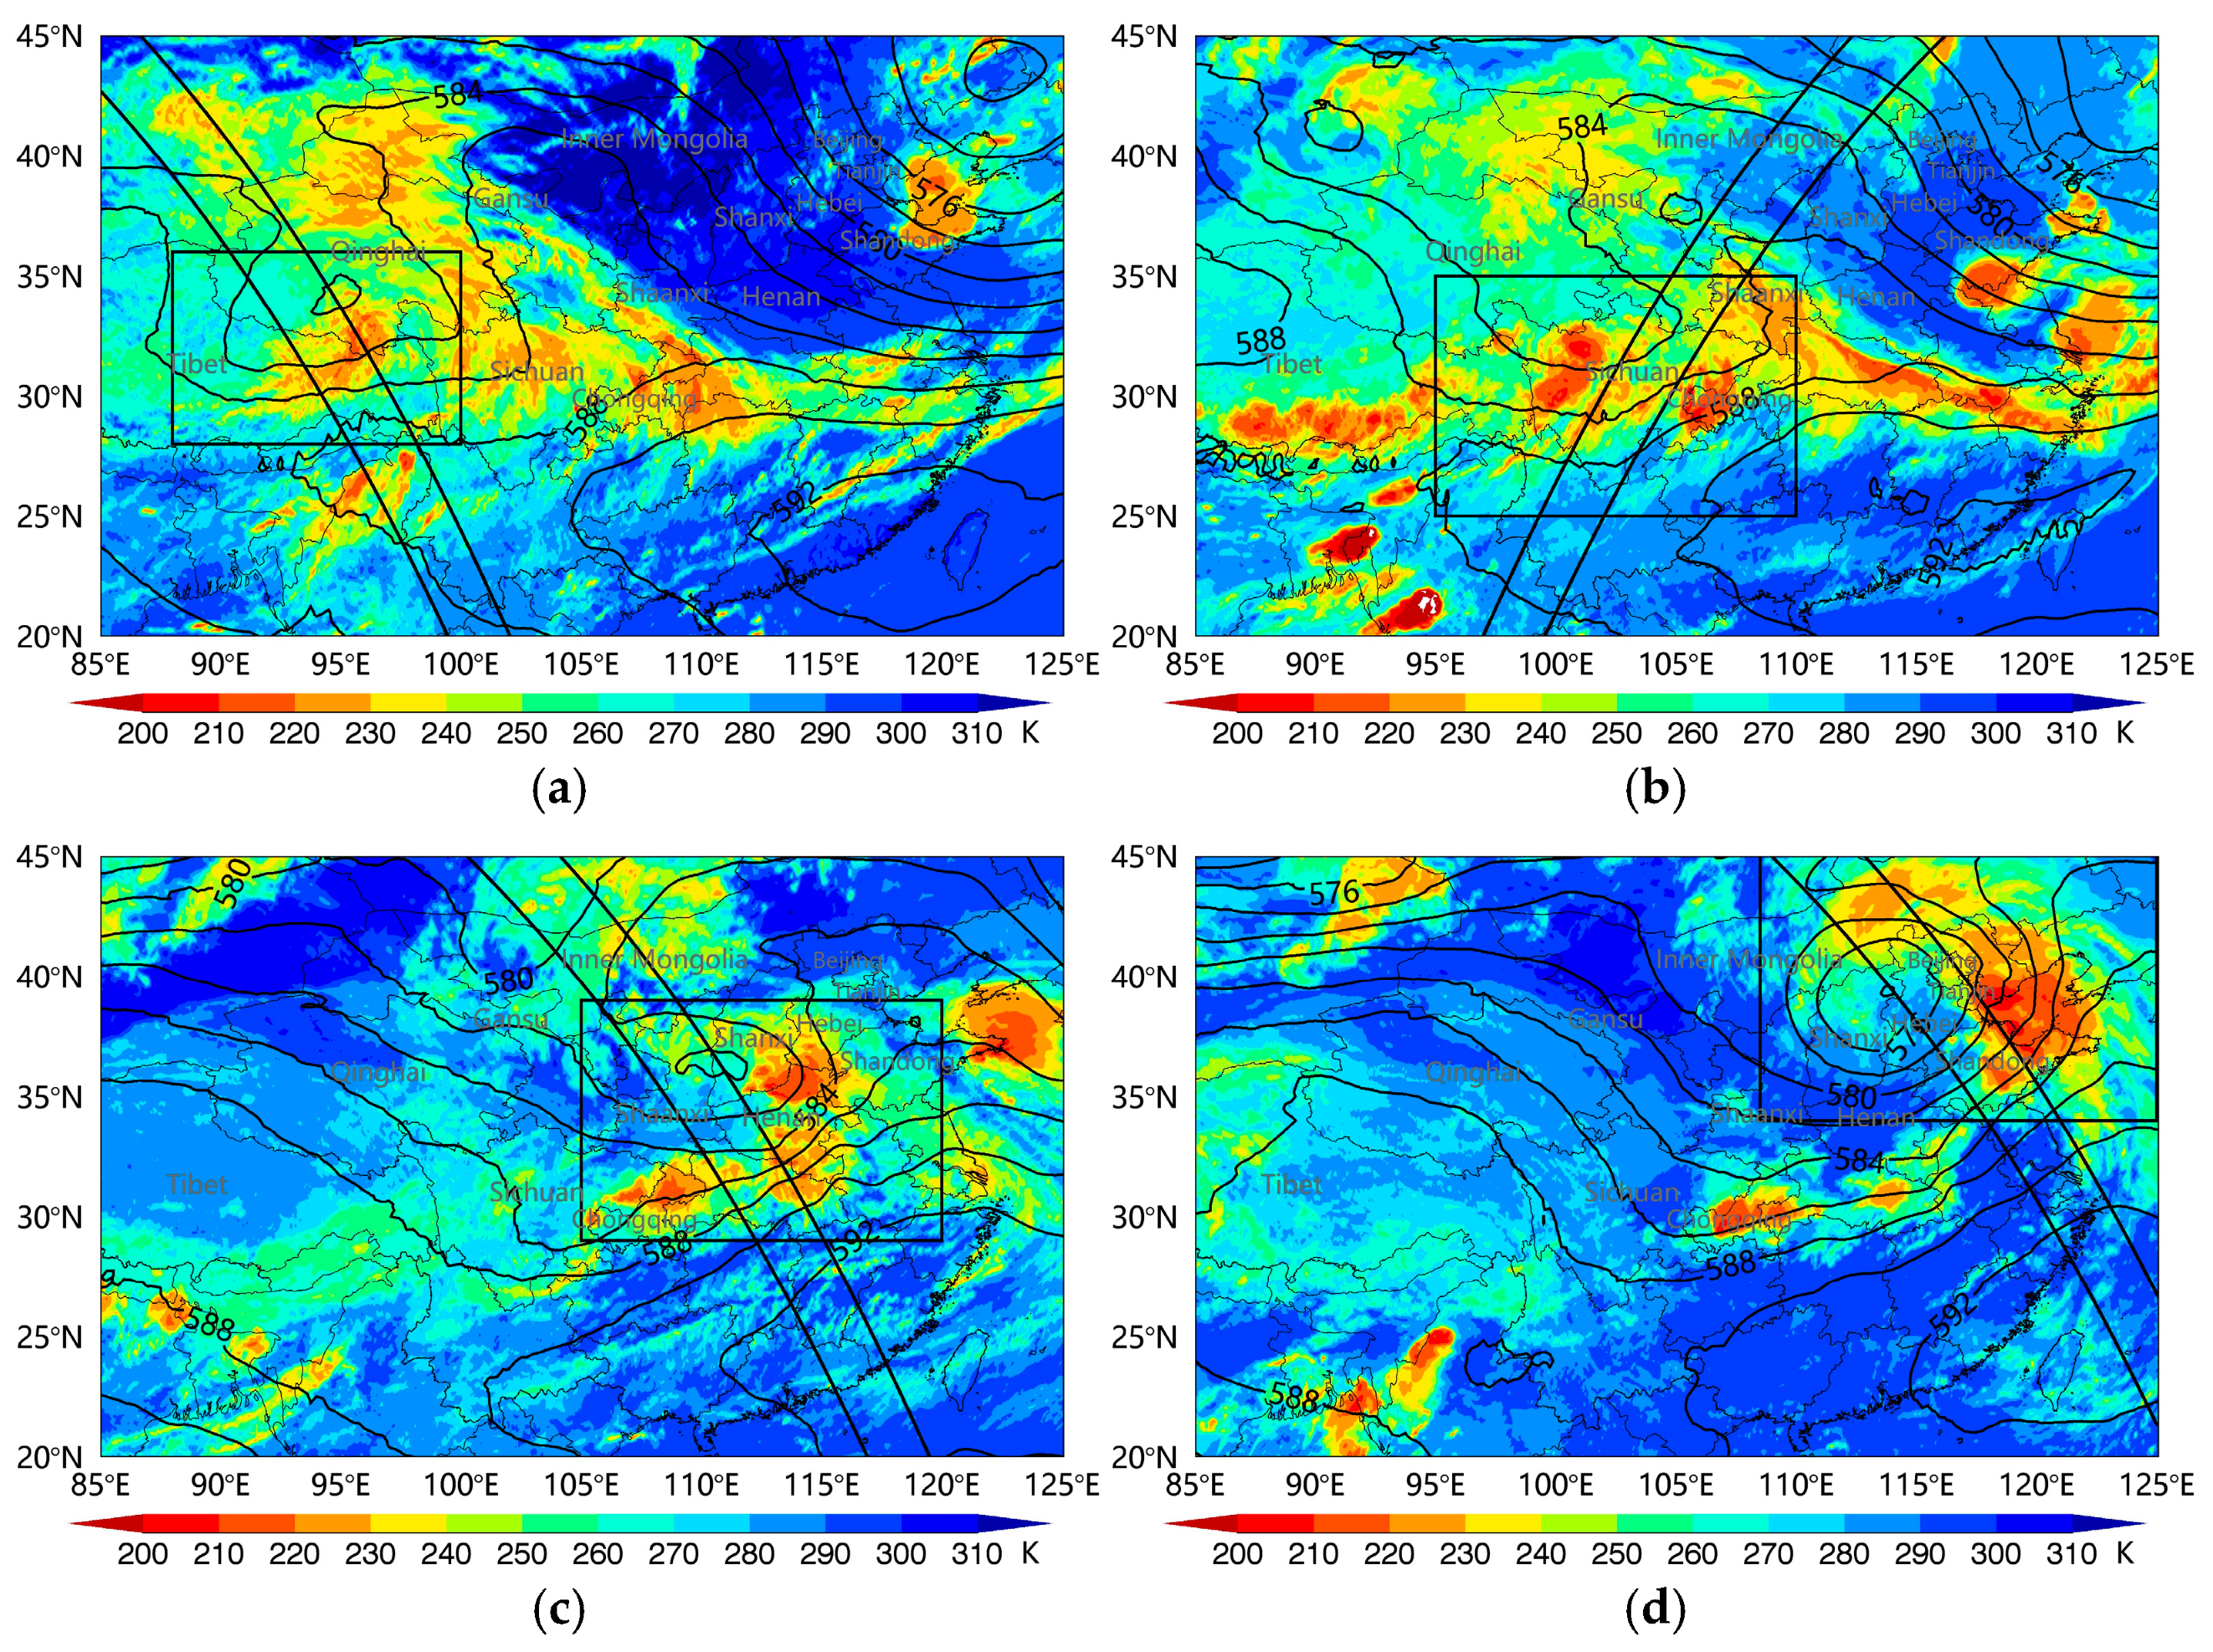
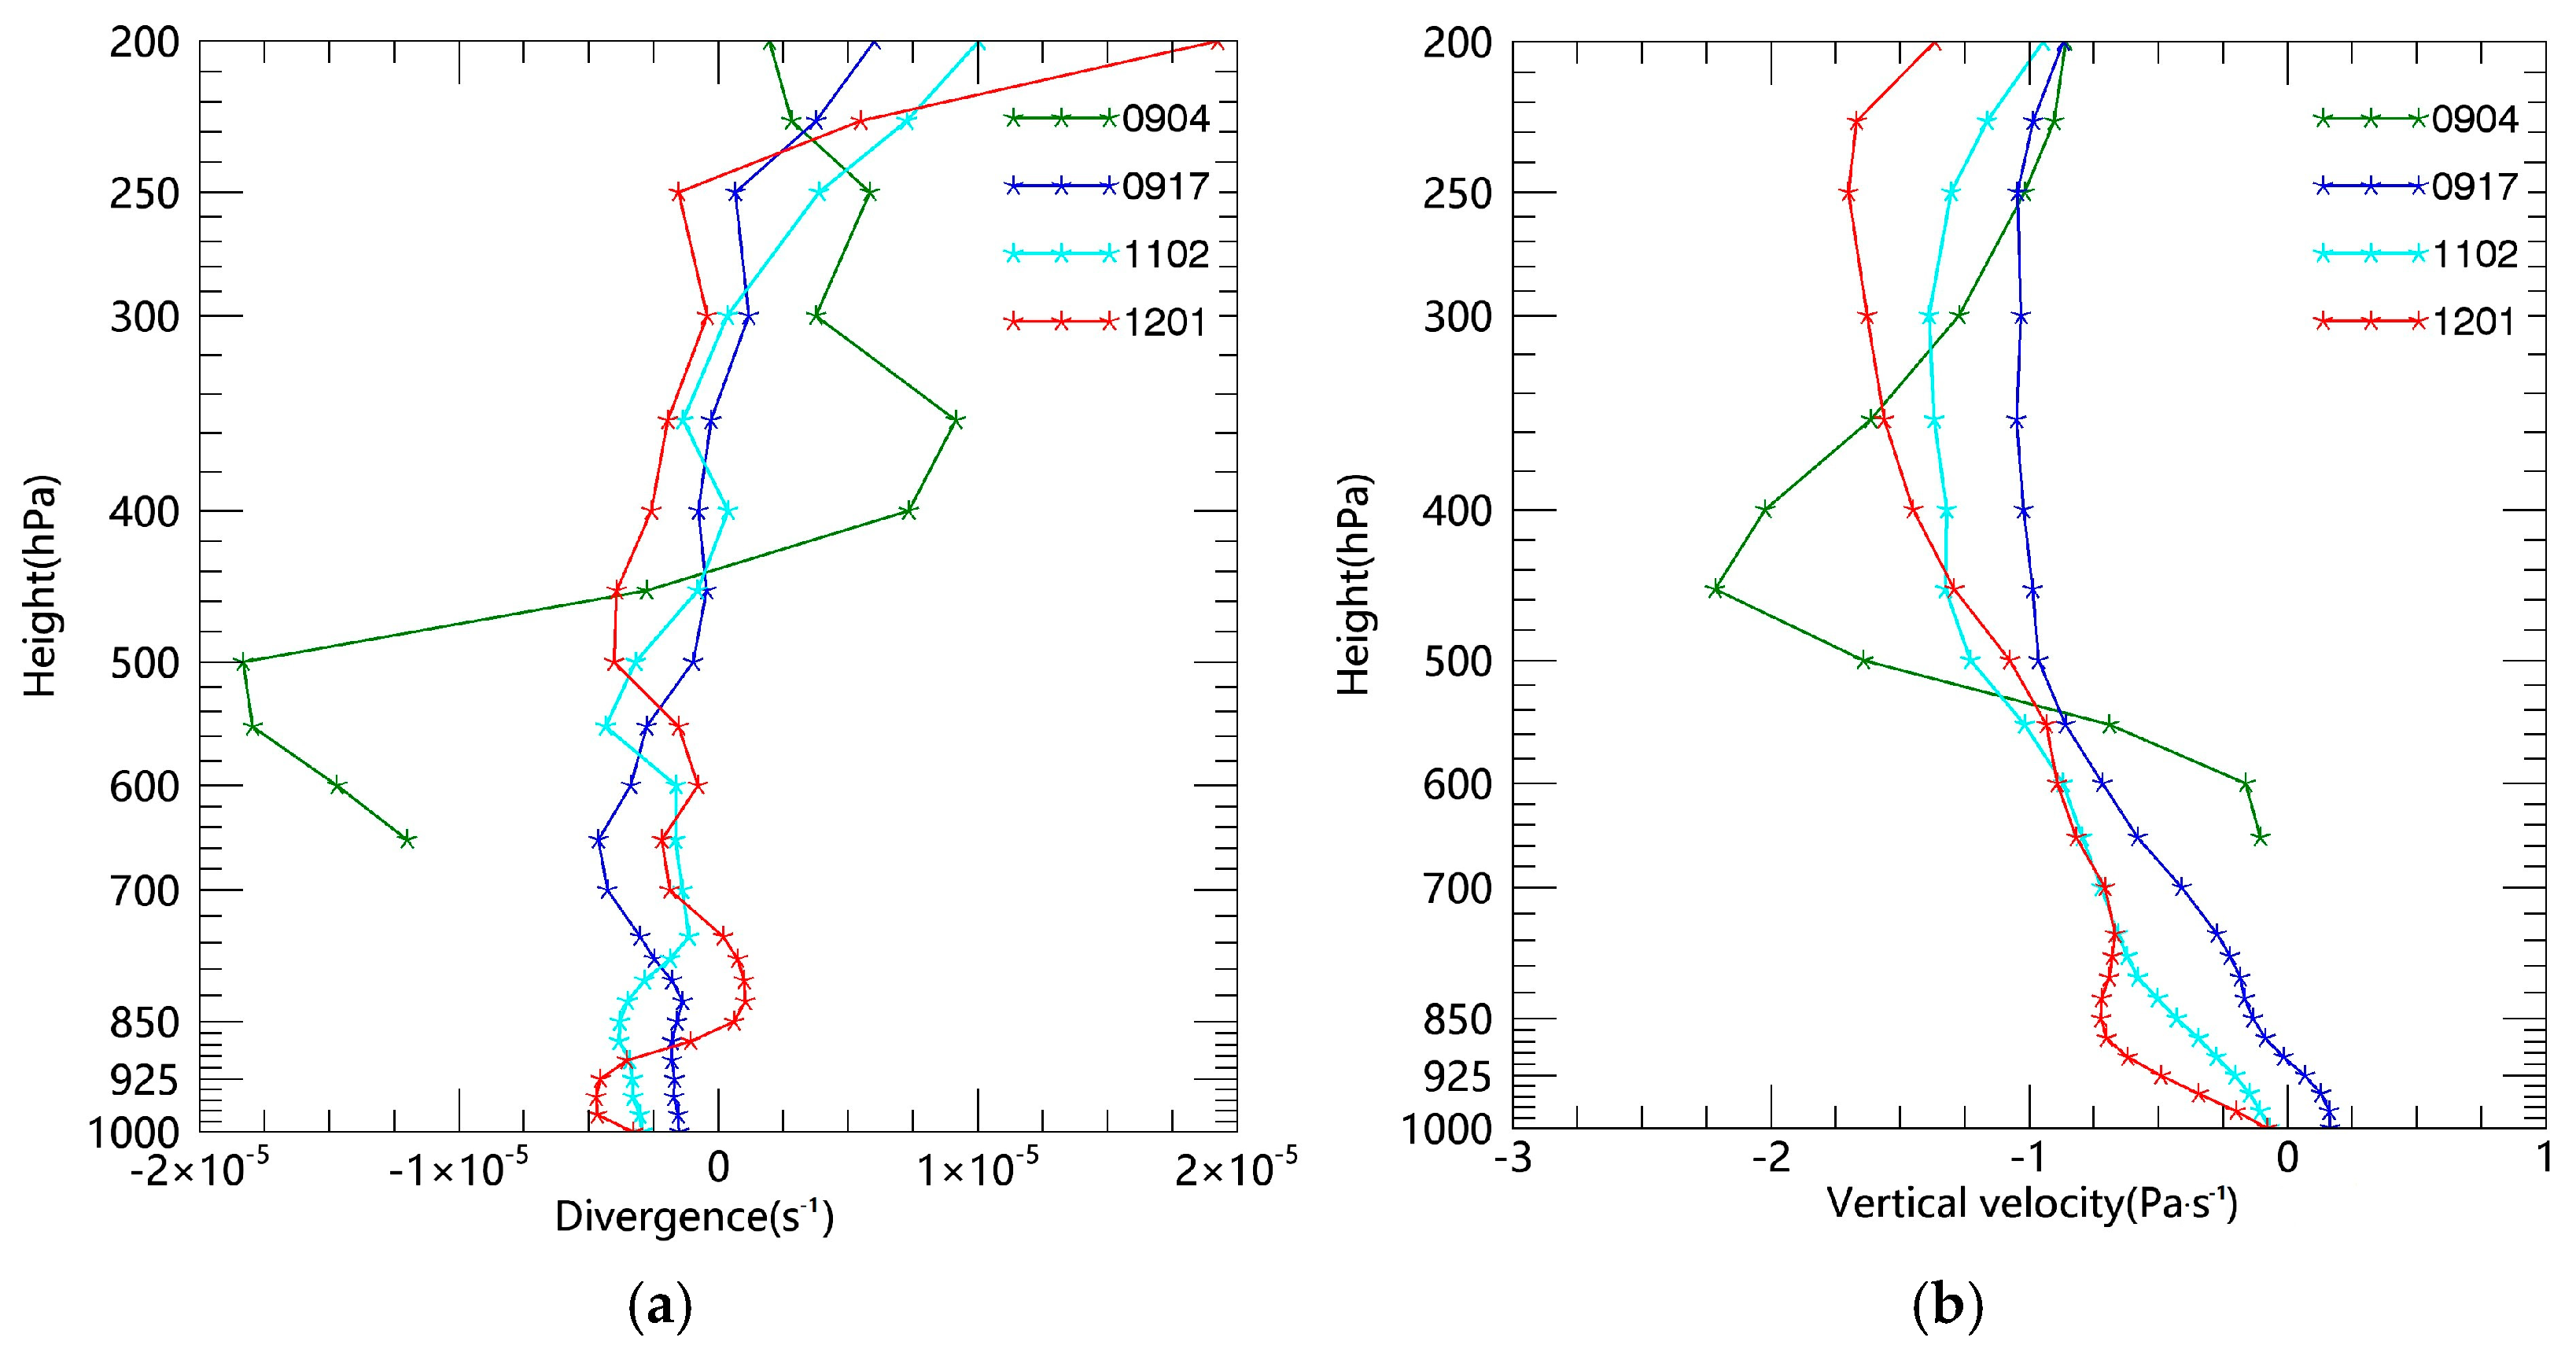
  • Formed in western Tibet, the TPV underwent a northeastward-eastward-northeastward movement, with heavy precipitation landing on Sichuan, Shaanxi, Shanxi, Henan, Beijing-Tianjin-Hebei, and Shandong. The cloud system associated with the TPV captured by the GPM-DPR was mainly distributed on the east and south sides of the vortex, with expanding coverage, favorable moisture, and dynamic conditions. After moving off the plateau, the convergence, divergence, and upward motion weakened.
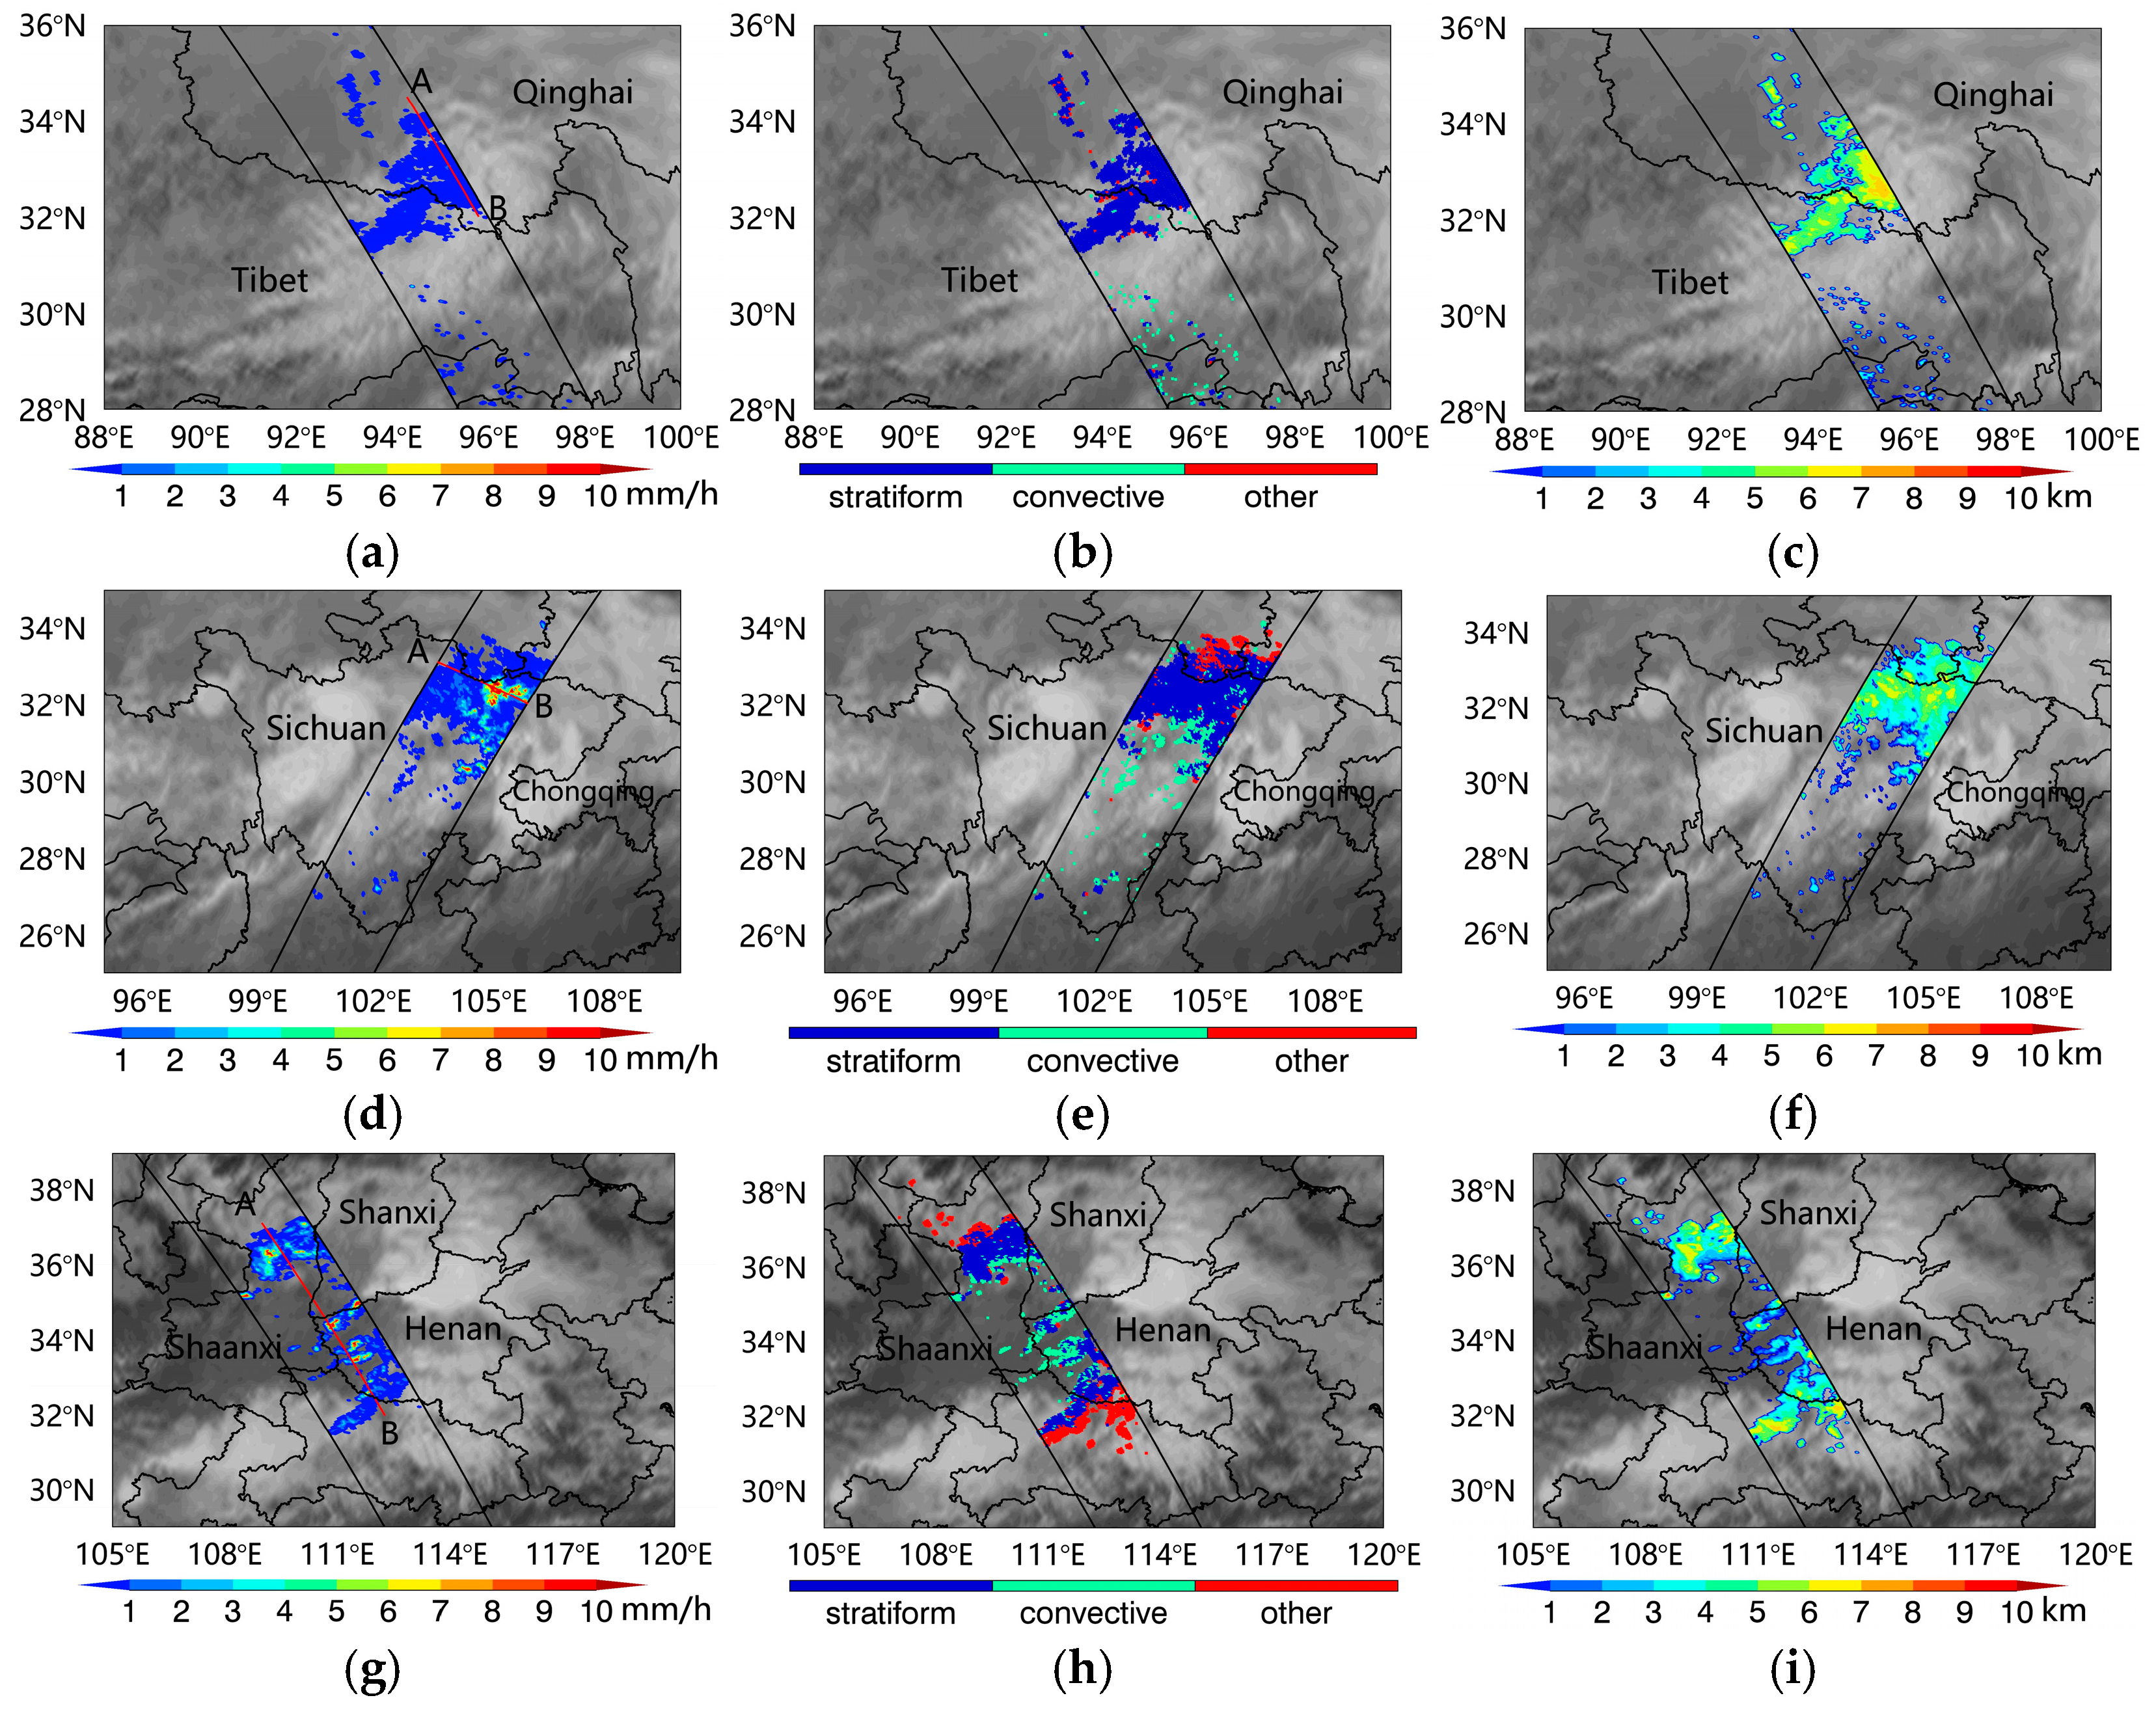
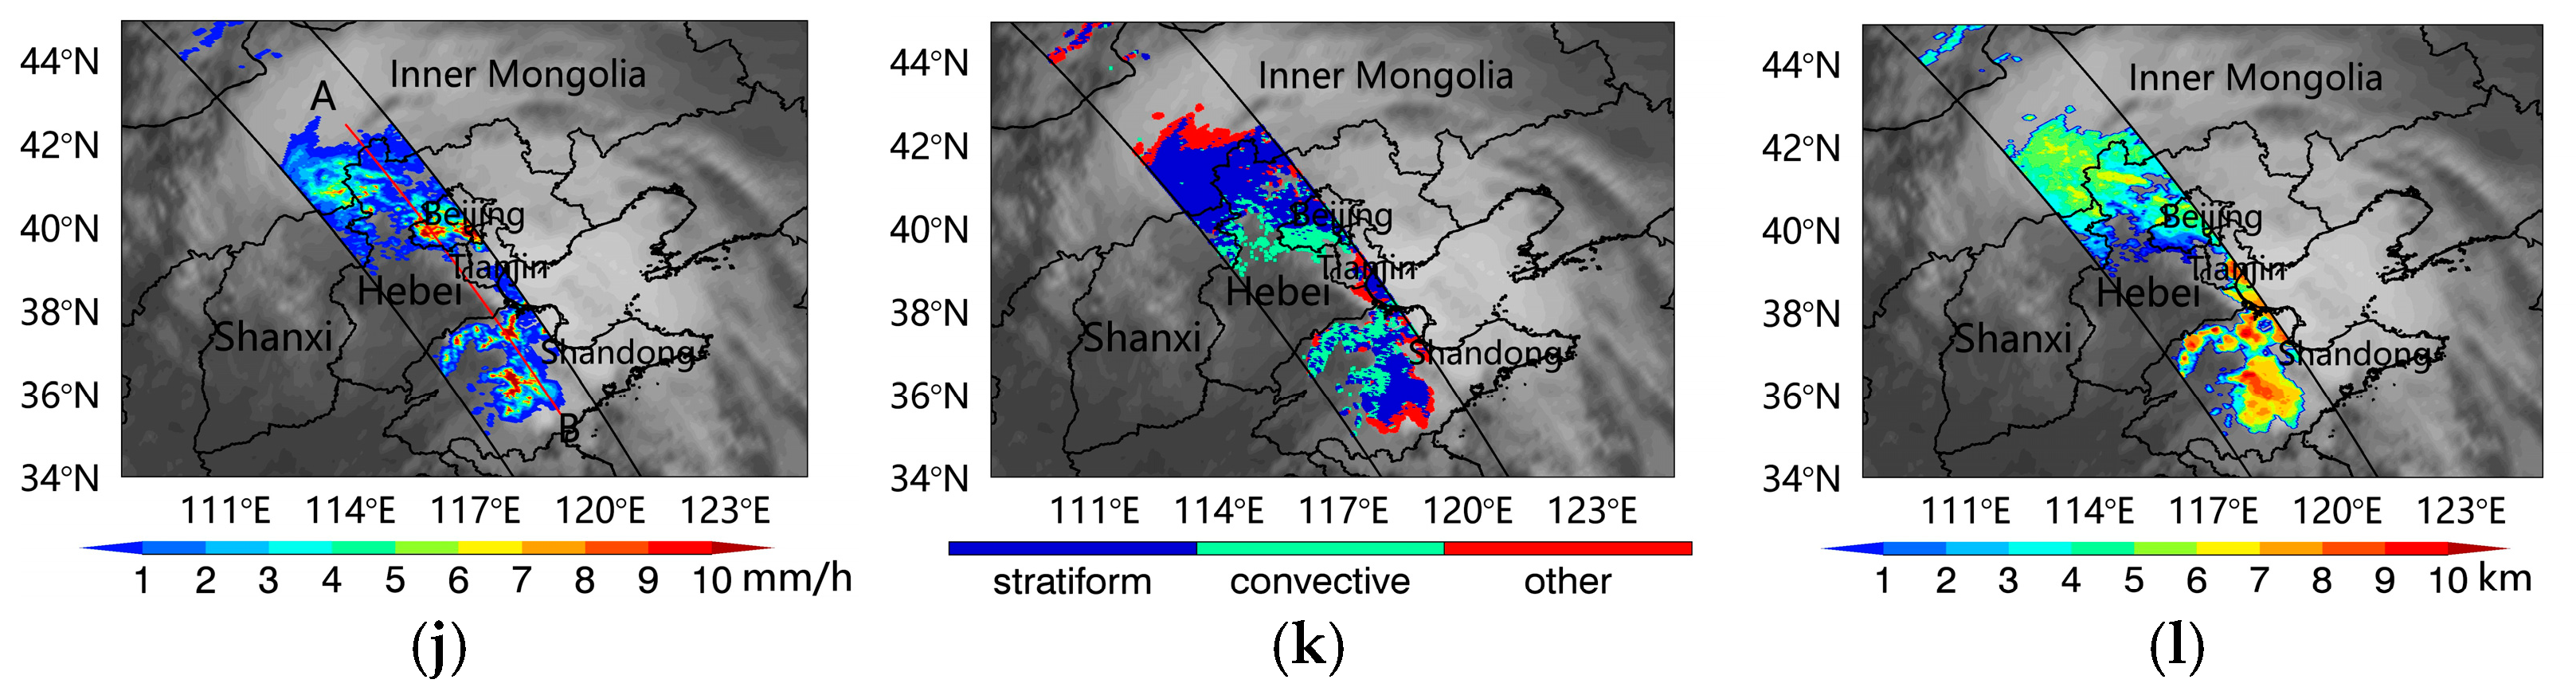
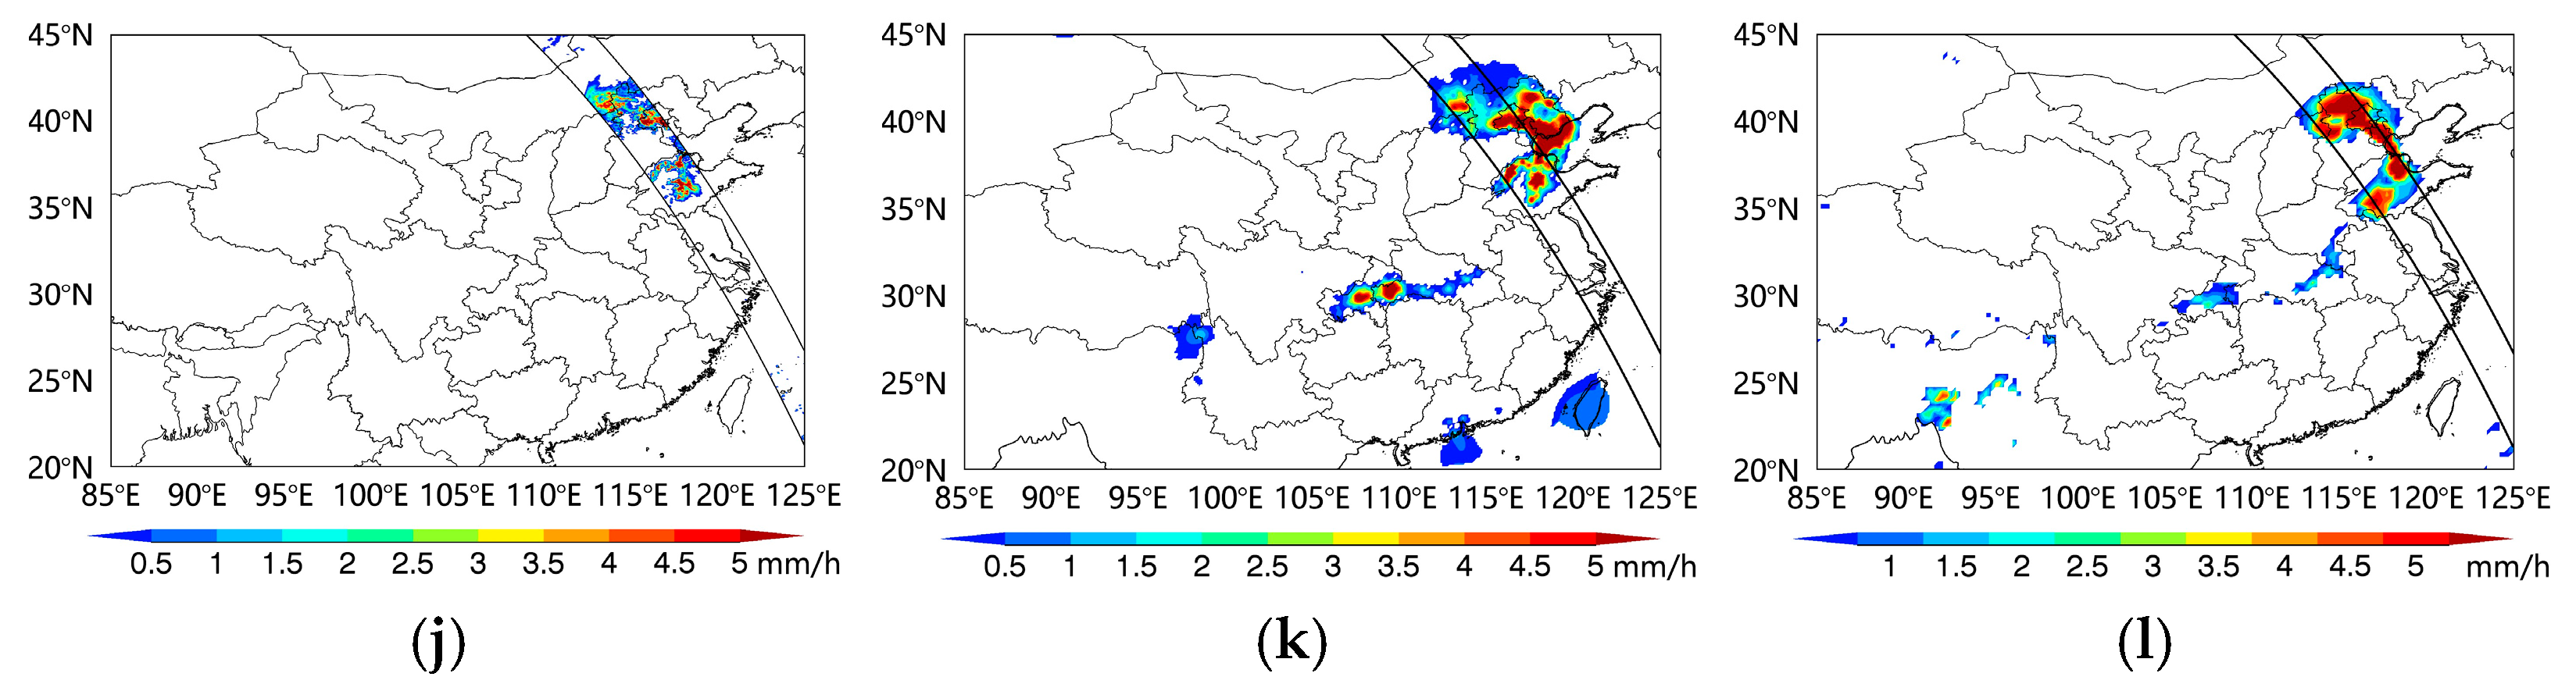
  • The near-surface precipitation rate was generally below 1 mm·h−1 in the eastern TP, with mainly stratiform precipitation. After moving off the plateau, the rate exceeded 10 mm·h−1, with an increase in the proportion of convective precipitation. The maximum storm top height occurred at around 9.0–10.0 km in first three stages (04:00 on 9 July, 17:00 on 9 July, and 02:00 on 11 July) and exceeded 13.0 km on the southern side of the cloud system at 01:00 on 12 July.
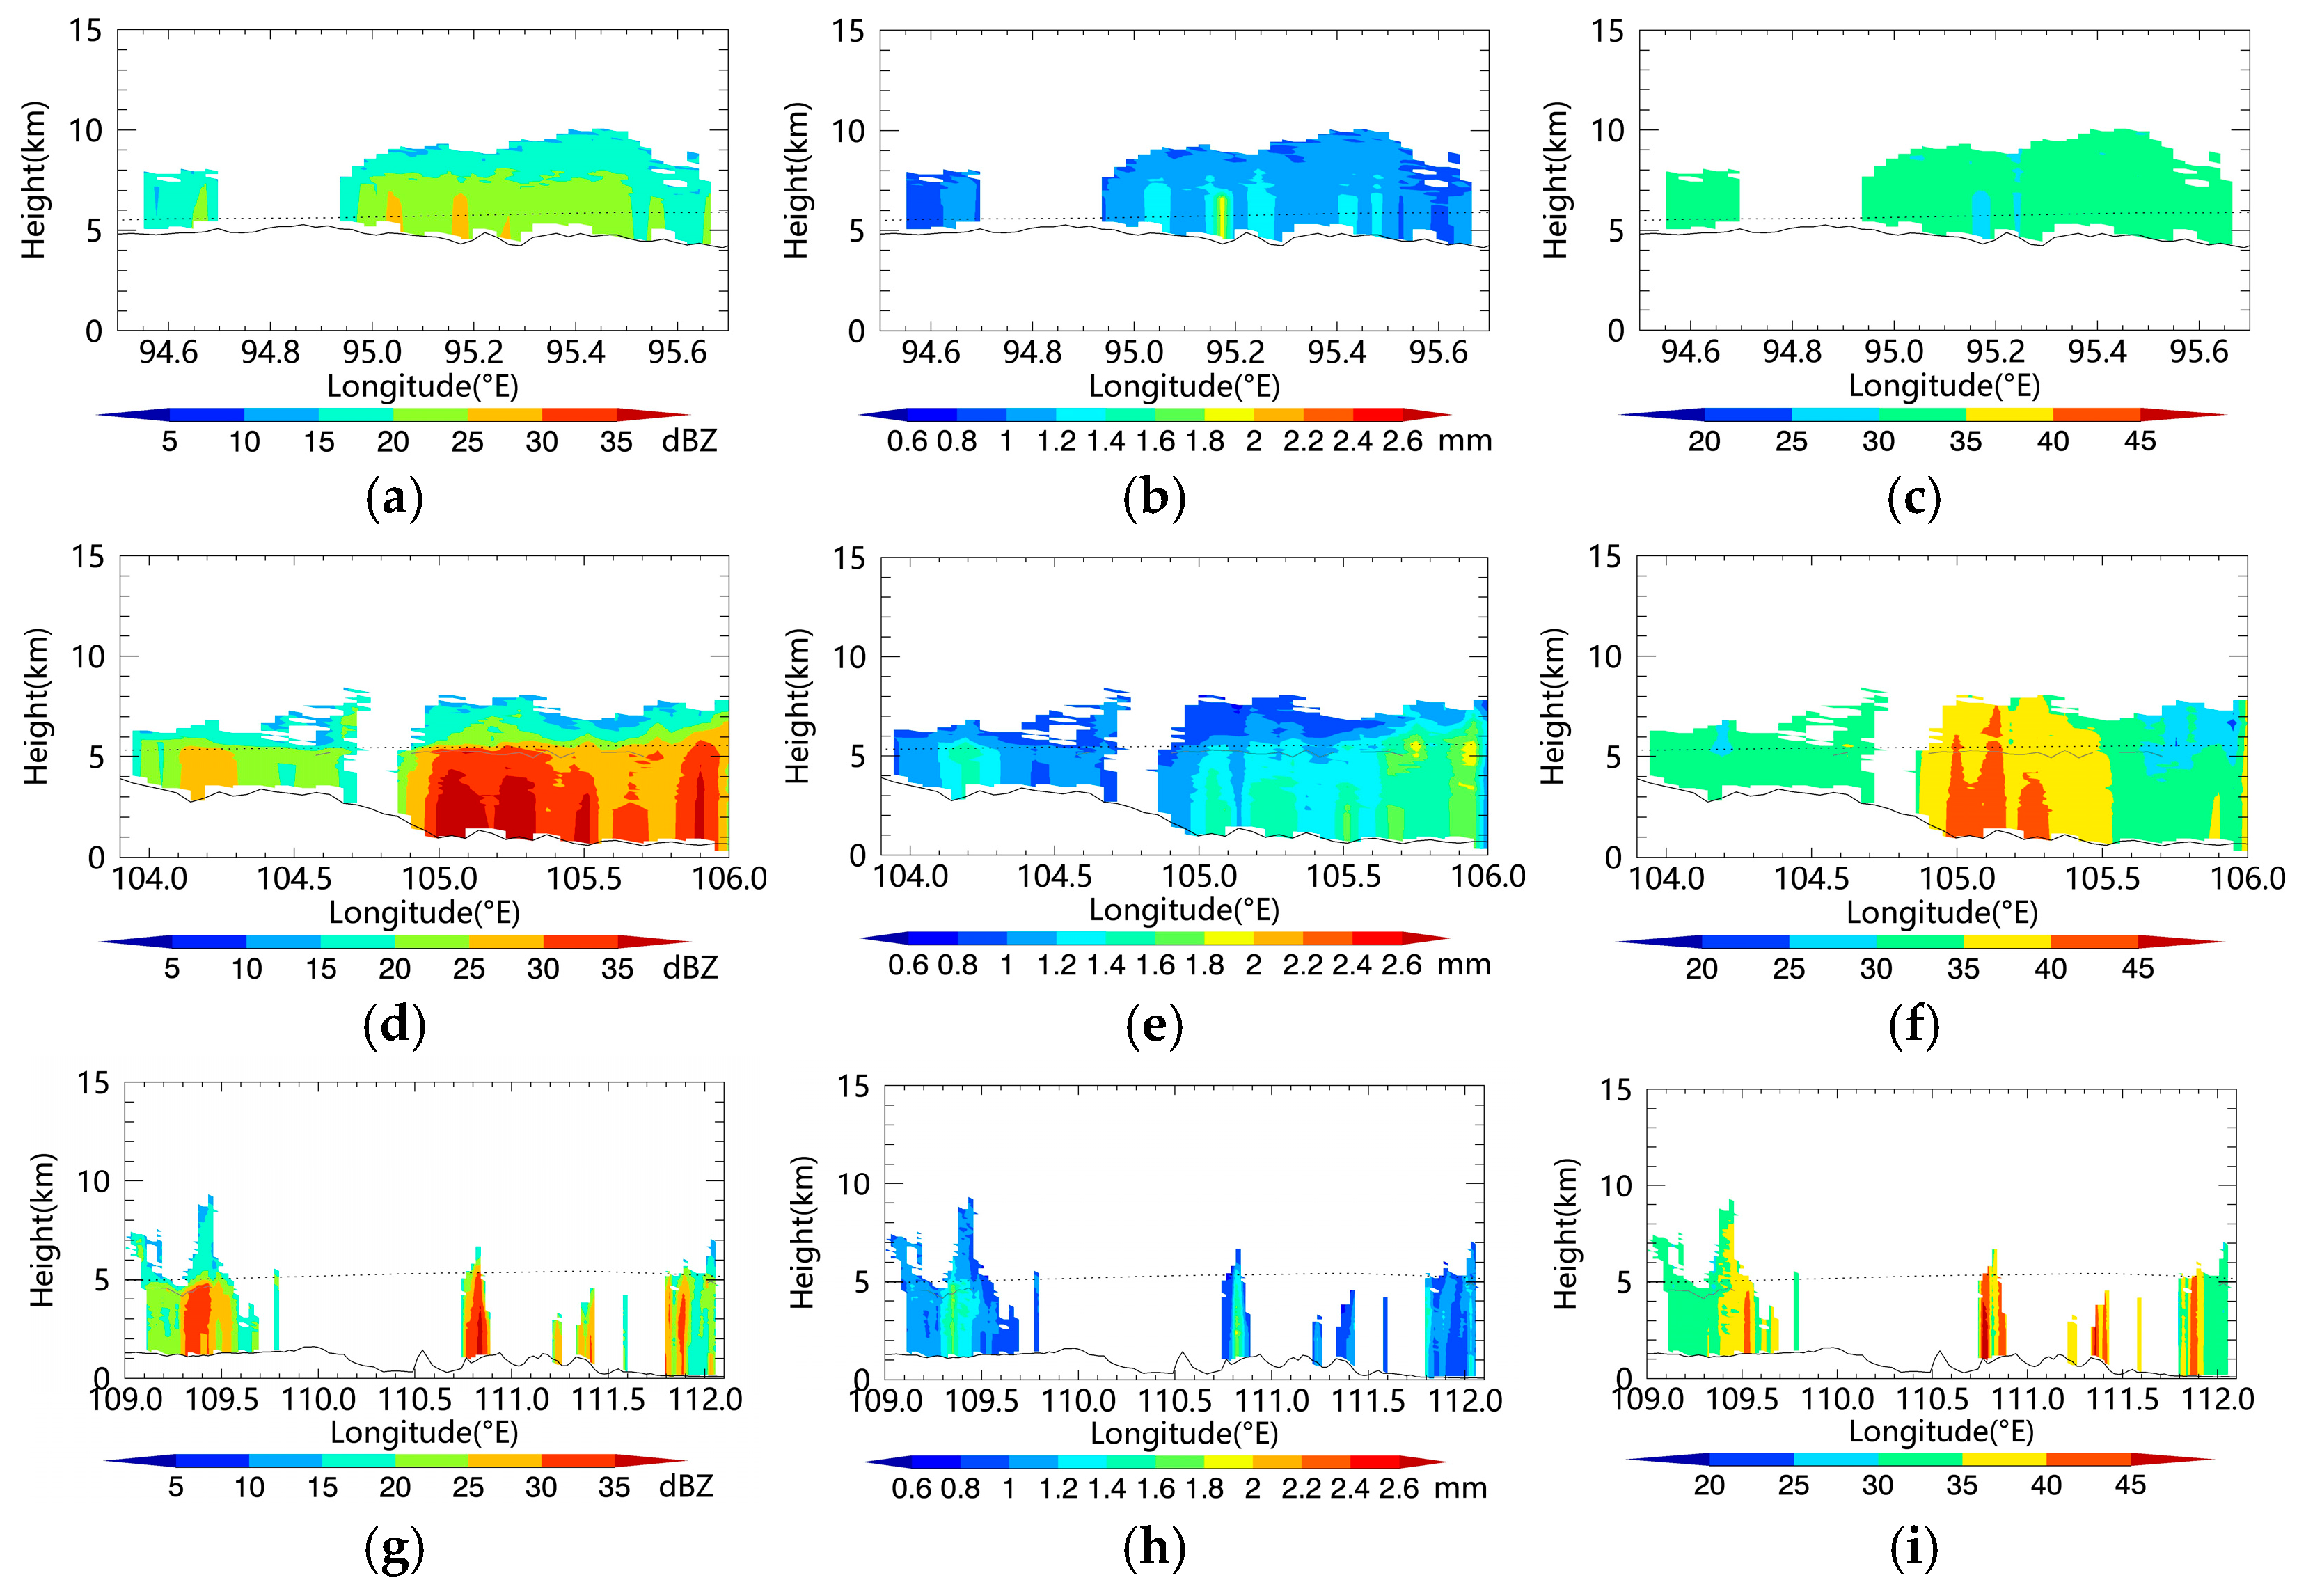
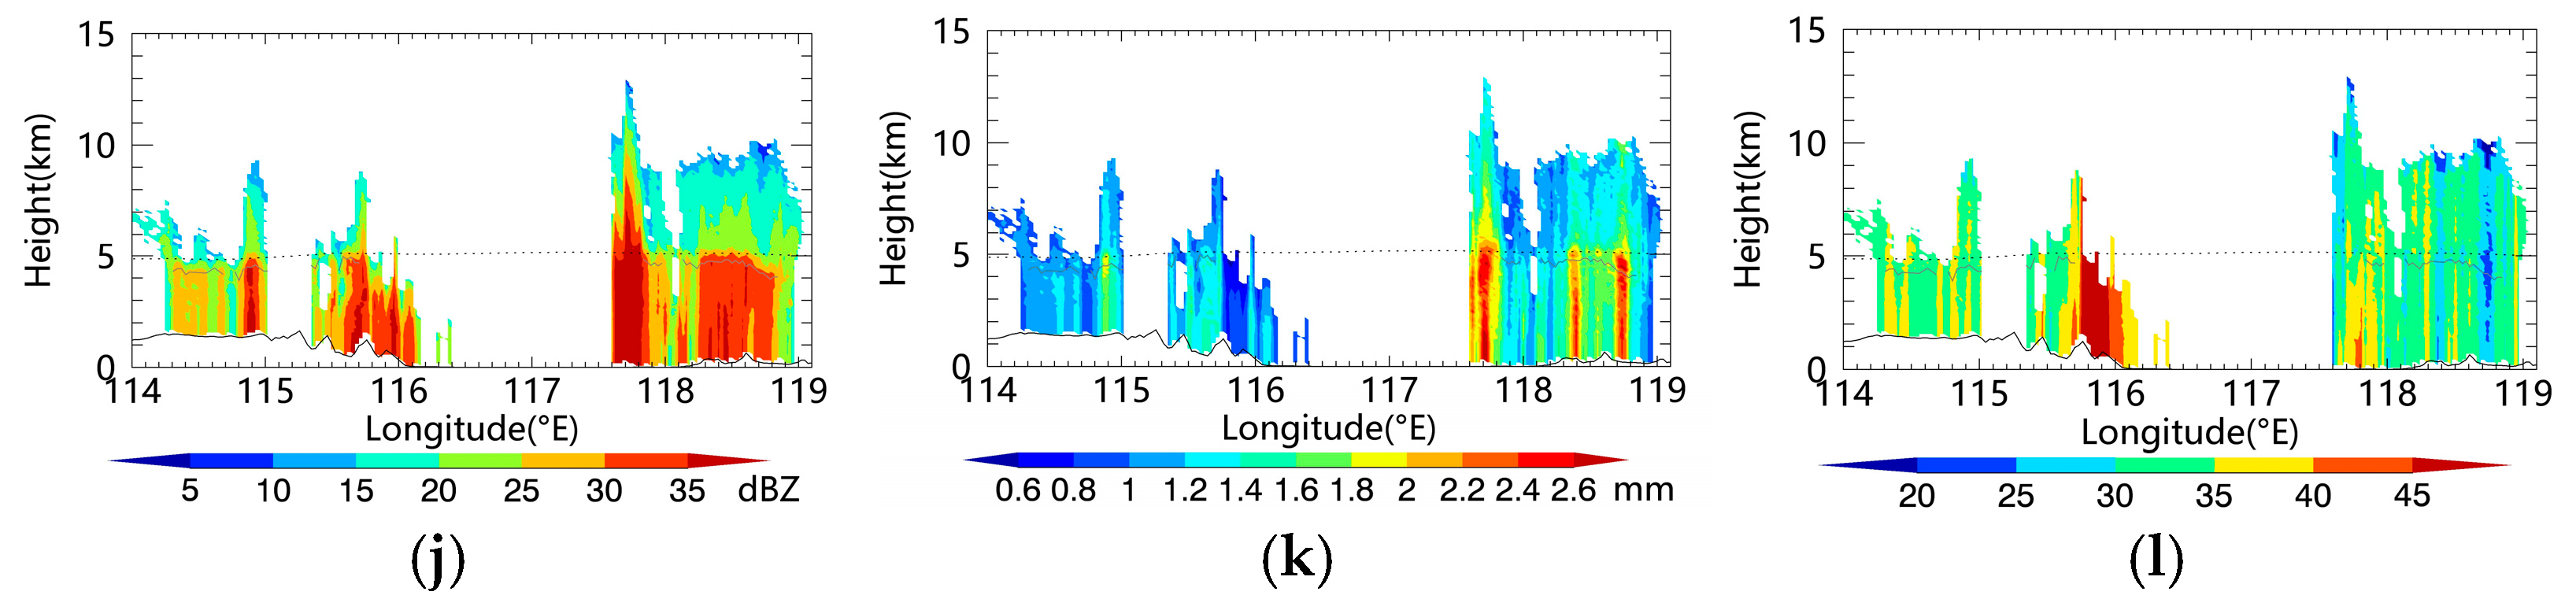
  • Ze, Dm, and dBNw profiles from the DPR reflected varying precipitation intensity and particle spectra. The precipitating cloud system deepened after leaving from the plateau, with a significant increase in dBNw and Ze and precipitation intensity. Stratiform precipitation was observed on the northern and southern parts of the system at 02:00 on 11 July and 01:00 on 12 July, while scattered convective precipitation with large dBNw and small Dm was on the middle parts.
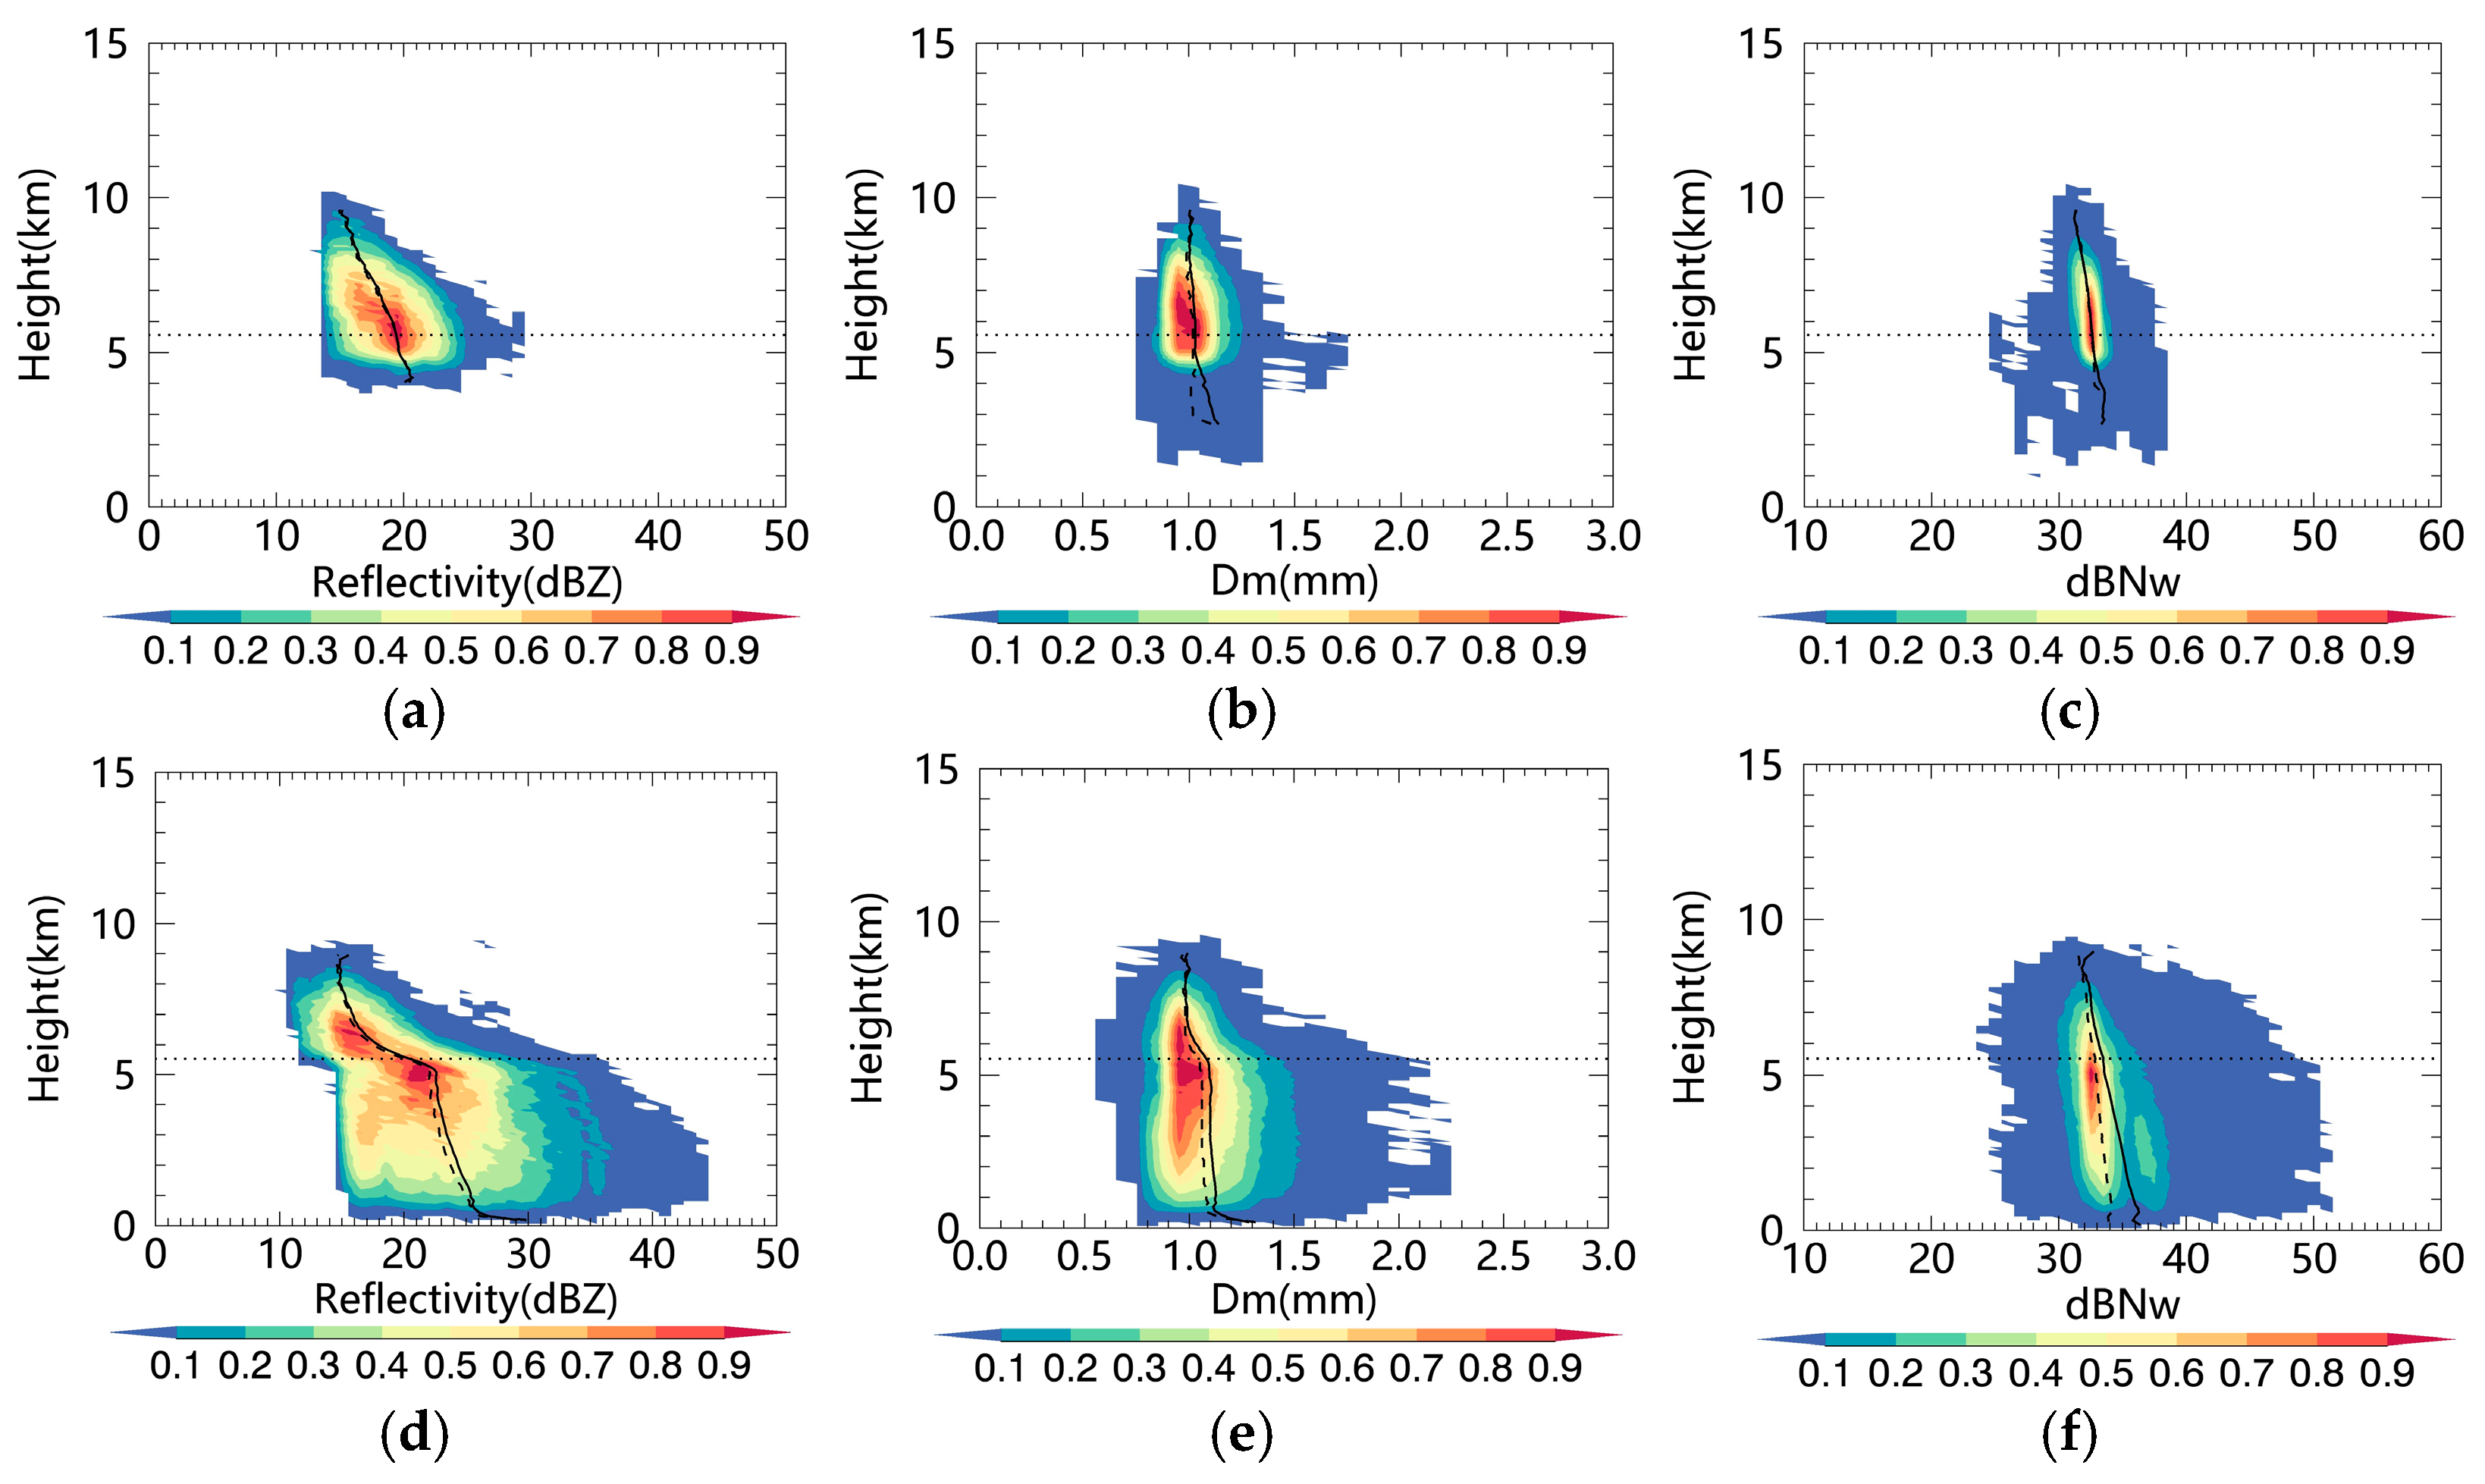
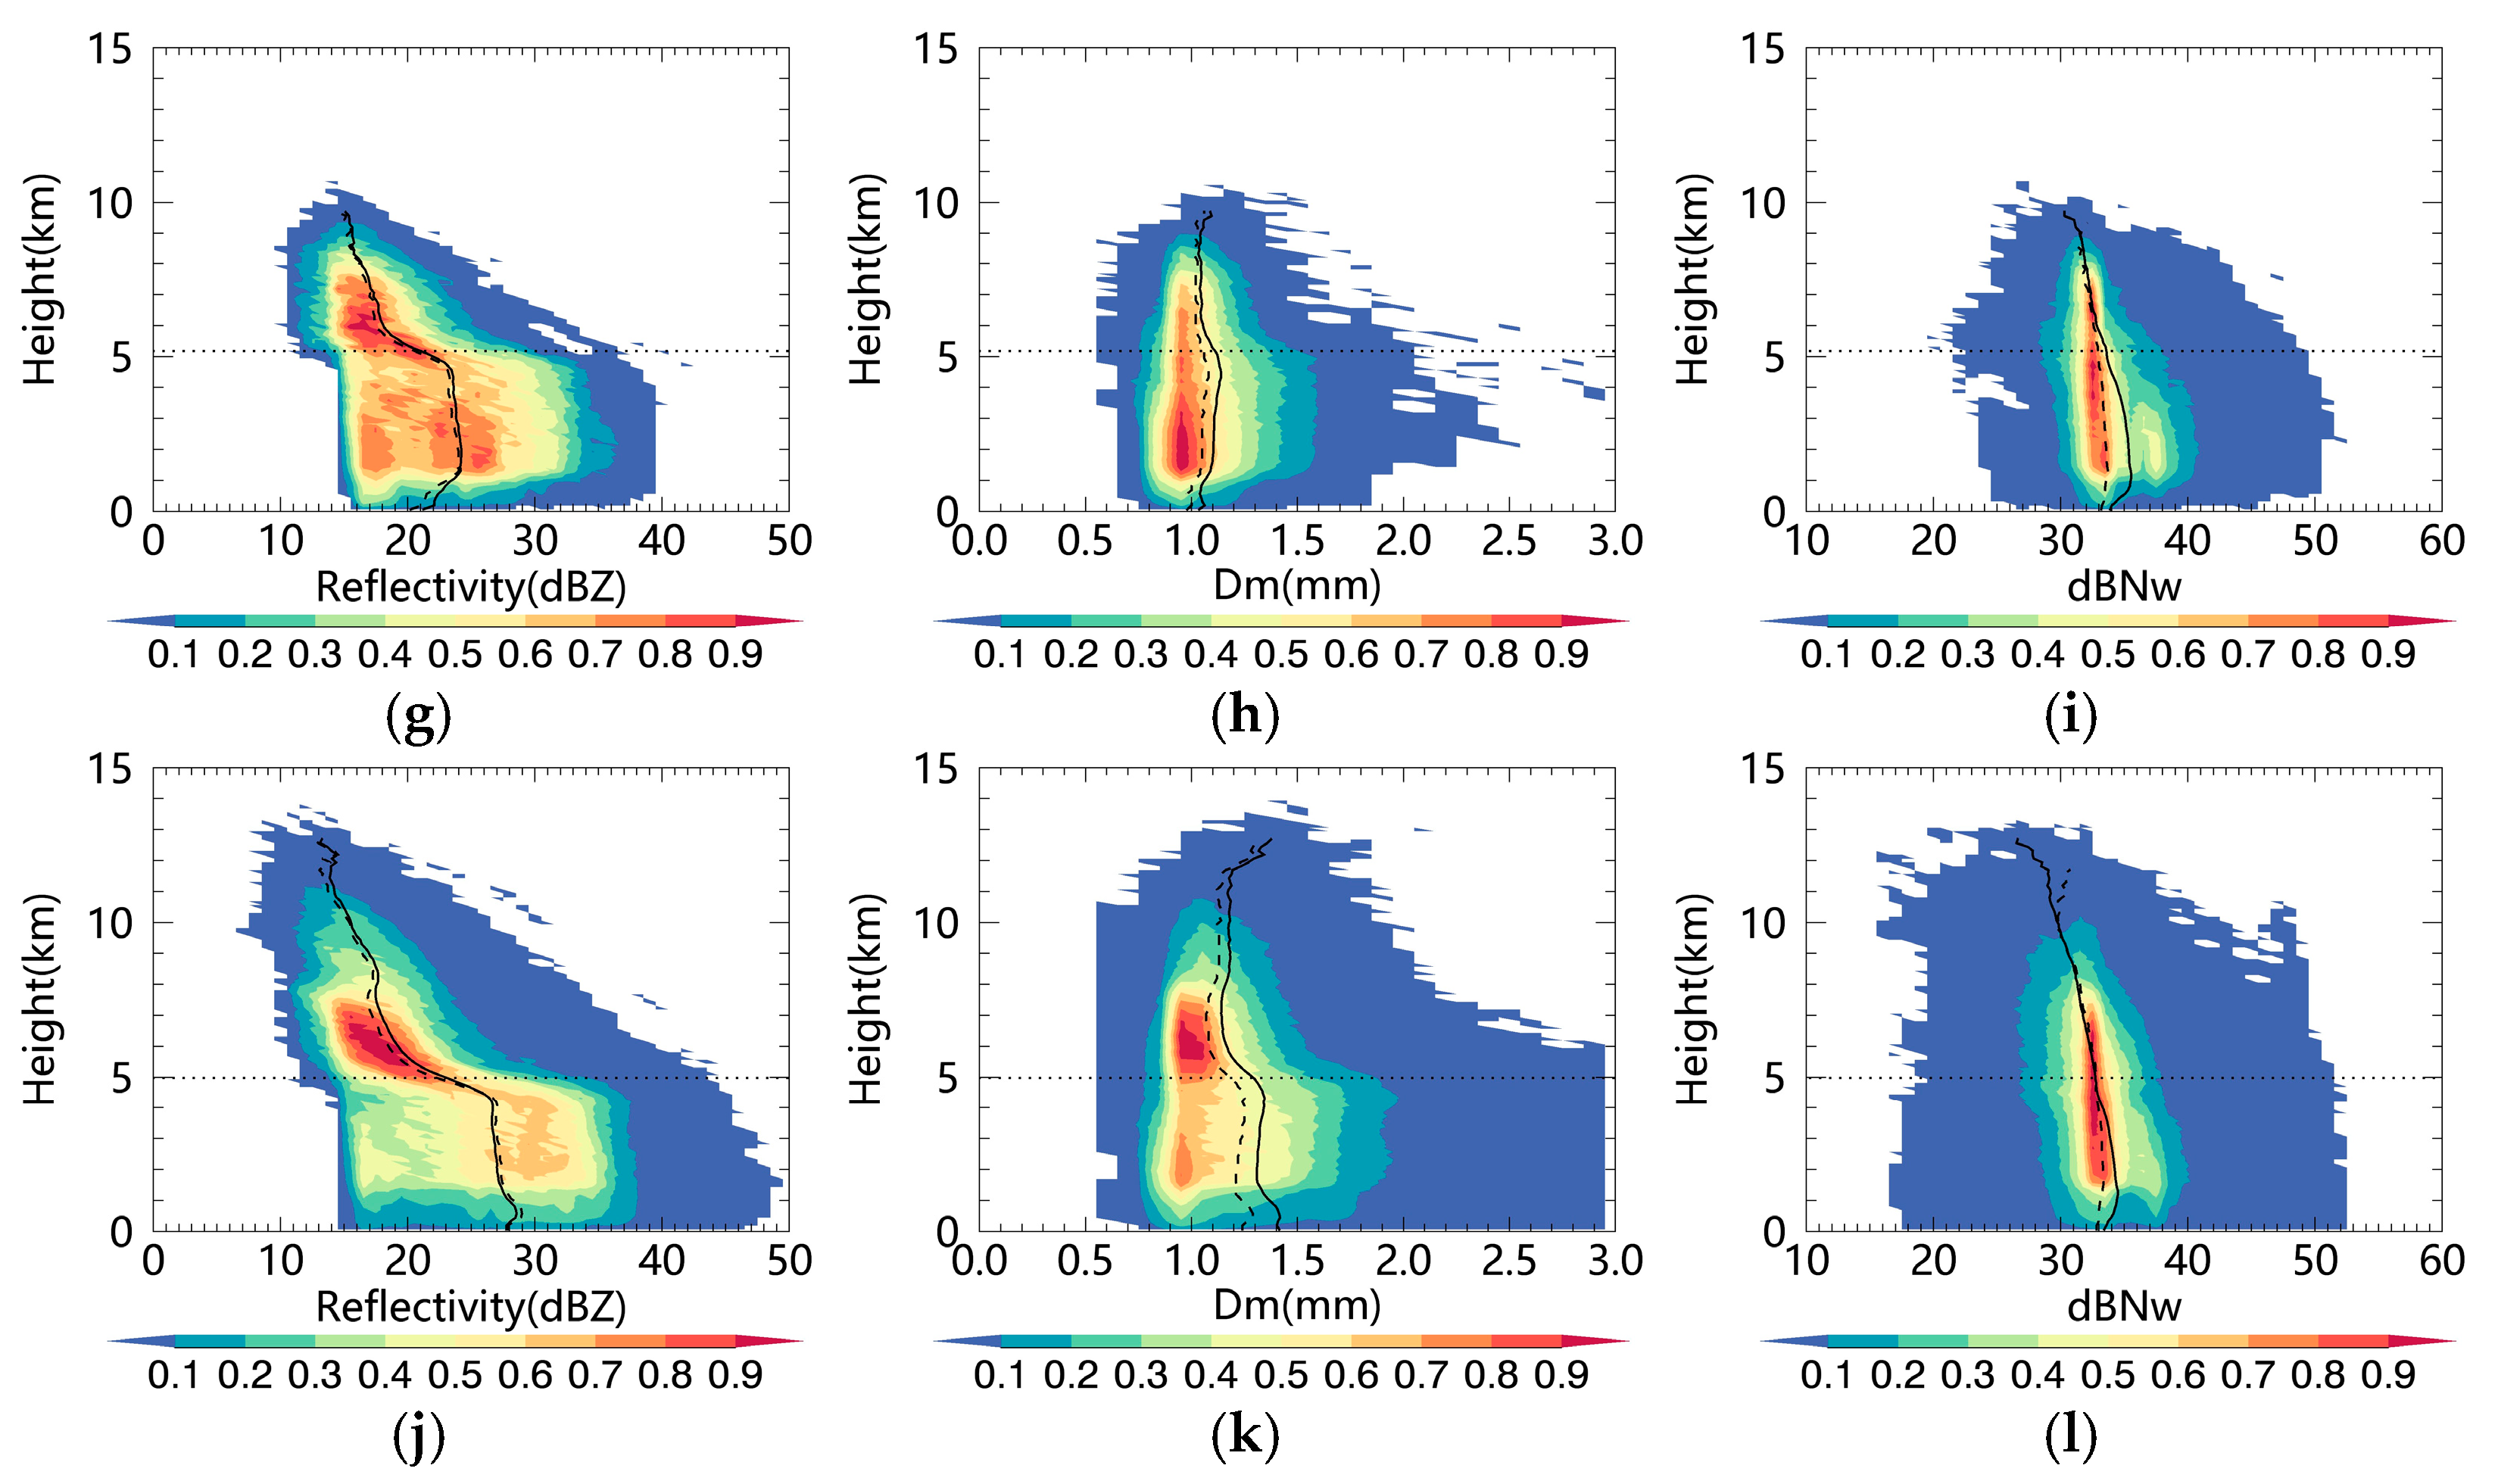
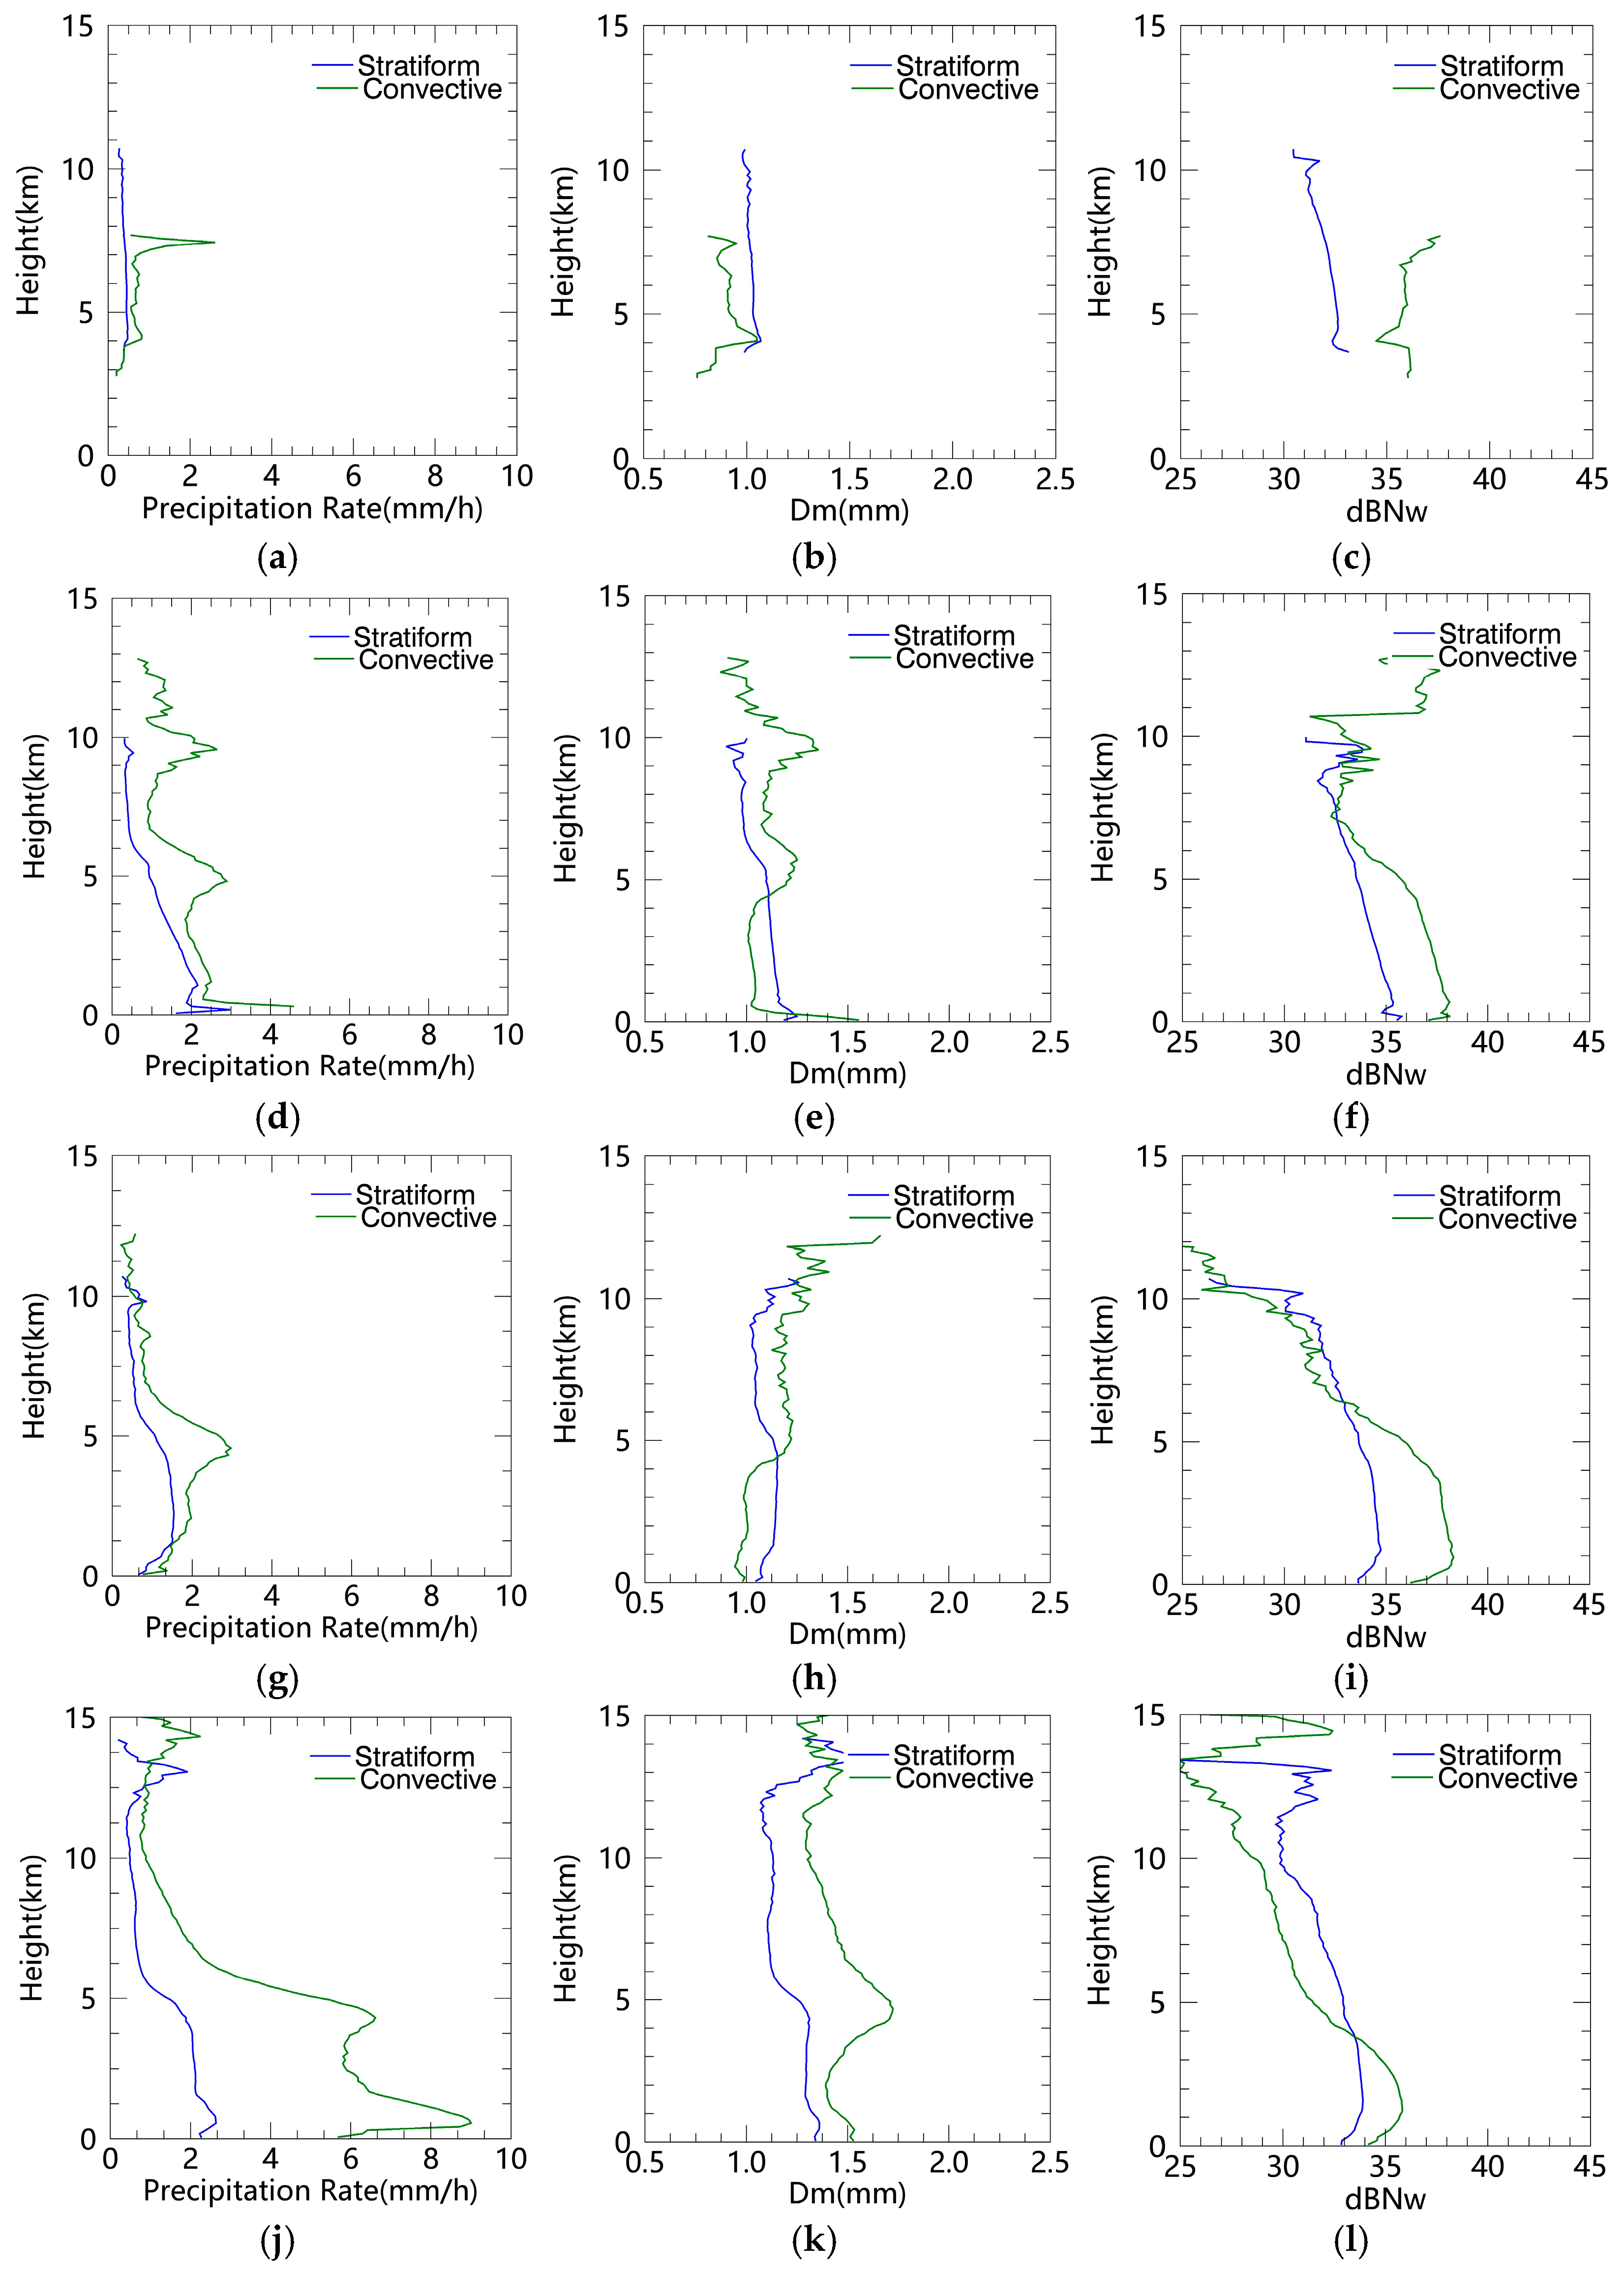
  • The distribution ranges and vertical thicknesses of Ze, Dm, and dBNw gradually increased during the developmental stages. The range of Ze in high-frequency occurrence occurred at 15–20 dBZ, while Dm and dBNw peaked at around 1 mm and 33 mm−1·m−3, respectively. Near the melting layer, Ze was exposed to a significant increase due to the aggregation and melting processes of ice particles. In terms of different precipitation types, the average precipitation rate for convective clouds was higher than that for stratiform clouds, with a peak at 4.5–5.0 km. It was evident that the precipitation rates of convective and stratiform clouds increased at four time periods. Among them, the precipitation rate and Dm for convective clouds increased significantly at 01:00 on 12 July, while dBNw decreased noticeably.

Author Contributions

Conceptualization, S.R.; methodology, S.R. and B.Y.; software, B.Y. and X.W.; validation, X.W. and N.N.; formal analysis, B.Y. and X.W.; investigation, N.N.; resources, S.R.; data curation, B.Y., X.W. and N.N.; writing—original draft preparation, B.Y.; writing—review and editing, S.R., X.W. and N.N.; visualization, B.Y. and N.N.; supervision, S.R. and B.Y.; project administration, S.R.; funding acquisition, S.R. All authors have read and agreed to the published version of the manuscript.

Funding

This study was financially supported by the National Natural Science Foundation of China (42175014) and the Fengyun Application Pioneering Project (FY-APP-2022.0112, FY-APP-ZX-2023.01).

Data Availability Statement

The ERA5 data are available from the Copernicus Climate Data Store at https://cds.climate.copernicus.eu/cdsapp, accessed on 19 October 2023. The GPM_2ADPR products was obtained from https://disc.gsfc.nasa.gov/datasets/GPM_2ADPR_07/summary, accessed on 17 August 2023. The bright temperature product provided was by Fengyun-4A at http://satellite.nsmc.org.cn/PortalSite/Data/Satellite.aspx, accessed on 9 July 2023.

Acknowledgments

The authors acknowledge the National Meteorological Information Center for providing the hourly gauge precipitation data and Resource and Environment Science Data Center for providing digital elevation model (DEM) data.

Conflicts of Interest

The authors declare no conflict of interest.

References

  1. Lin, Z. Analysis of Tibetan Plateau vortex activities using ERA-Interim data for the period 1979–2013. J. Meteorol. Res. 2015, 29, 720–734. [Google Scholar] [CrossRef]
  2. Curio, J.; Chen, Y.; Schiemann, R.; Turner, A.G.; Wong, K.C.; Hodges, K.; Li, Y. Comparison of a manual and an automated tracking method for Tibetan Plateau vortices. Adv. Atmos. Sci. 2018, 35, 965–980. [Google Scholar] [CrossRef]
  3. Chen, S.; Dell’osso, L. Numerical prediction of the heavy rainfall vortex over eastern Asia monsoon region. J. Meteorol. Soc. Jpn. Ser. II 1984, 62, 730–747. [Google Scholar] [CrossRef]
  4. Yu, S.; Gao, W. Observational analysis on the movement of vortices before/after moving out the Tibetan Plateau. Acta Meteorol. Sin. 2006, 3, 392–399. (In Chinese) [Google Scholar] [CrossRef]
  5. Li, L.; Zhang, R.; Wu, P.; Wen, M.; Duan, J. Roles of Tibetan Plateau vortices in the heavy rainfall over southwestern China in early July 2018. Atmos. Res. 2020, 245, 105059. [Google Scholar] [CrossRef]
  6. Li, W.; Xia, R.; Zhong, Q.; Wang, Y. Vorticity and moisture budget analyses on a plateau vortex that cause an intense rainfall event within the Qaidam Basin. Atmos. Sci. Lett. 2021, 22, e1040. [Google Scholar] [CrossRef]
  7. Lin, Z.; Yao, X.; Guo, W.; Du, J.; Zhou, Z. Extreme precipitation events over the Tibetan Plateau and its vicinity associated with Tibetan Plateau vortices. Atmos. Res. 2022, 280, 106433. [Google Scholar] [CrossRef]
  8. Zhou, S.; Sun, F.; Wang, M.; Zhou, S.; Qing, Y. Effects of atmospheric heat source on the Tibetan Plateau vortex in different stages: A case study in June 2016. Atmosphere 2022, 13, 689. [Google Scholar] [CrossRef]
  9. Li, X.; Zheng, J.; Zhu, K.; Zhang, J.; Wang, Y. Study of macro and micro properties of cloud and precipitation caused by Tibetan Plateau vortex based on radar observations. Meteorol. Mon. 2019, 45, 1415–1425. (In Chinese) [Google Scholar] [CrossRef]
  10. Shou, Y.; Lu, F.; Liu, H.; Cui, P.; Shou, S.; Liu, J. Satellite-based observational study of the Tibetan Plateau vortex: Features of deep convective cloud tops. Adv. Atmos. Sci. 2019, 36, 189–205. [Google Scholar] [CrossRef]
  11. Ren, S.; Fang, X.; Lu, N.; Liu, Q.; Li, Y. Recognition method of the Tibetan Plateau vortex based on meteorological satellite data. J. Appl. Meteorol. Sci. 2019, 30, 345–359. (In Chinese) [Google Scholar] [CrossRef]
  12. Gettelman, A.; Salby, M.L.; Sassi, F. Distribution and influence of convection in the tropical tropopause region. J. Geophys. Res.-Atmos. 2002, 107, ACL 6-1–ACL 6-12. [Google Scholar] [CrossRef]
  13. Hong, G.; Heygster, G.; Miao, J.; Kunzi, K. Detection of tropical deep convective clouds from AMSU-B water vapor channels measurements. J. Geophys. Res. 2005, 110, D05205. [Google Scholar] [CrossRef]
  14. Yang, B.; Wu, X.; Wang, X. The sea-land characteristics of deep convections and convective overshootings over China sea and surrounding areas based on the CloudSat and FY-2E datasets. Acta Meteorol. Sin. 2019, 77, 256–267. (In Chinese) [Google Scholar] [CrossRef]
  15. Yang, B.; Liu, J.; Jia, X. Correction for cirrus cloud top height of MODIS based on CALIPSO dataset in the Beijing-Tianjin-Hebei region. Chin. J. Atmos. Sci. 2020, 44, 1013–1022. (In Chinese) [Google Scholar] [CrossRef]
  16. Lonfat, M.; Marks, F.D.; Chen, S.S. Precipitation distribution in tropical cyclones using the Tropical Rainfall Measuring Mission (TRMM) microwave imager: A global perspective. Mon. Weather Rev. 2004, 132, 1645–1660. [Google Scholar] [CrossRef]
  17. Smith, E.A.; Asrar, G.; Furuhama, Y.; Ginati, A.; Mugnai, A.; Nakamura, K.; Zhang, W.; Lettenmaier, D.P.; Kuo, K.-S.; Kummerow, C.; et al. International Global Precipitation Measurement (GPM) Program and Mission: An Overview. In Measuring Precipitation from Space: Advances in Global Change Research; Levizzani, V., Bauer, P., Turk, F.J., Eds.; Springer: Dordrecht, The Netherlands, 2007; Volume 28, pp. 611–653. [Google Scholar] [CrossRef]
  18. Hou, A.Y.; Kakar, R.K.; Neeck, S.; Azarbarzin, A.A.; Kummerow, C.D.; Kojima, M.; Oki, R.; Nakamura, K.; Iguchi, T. The Global Precipitation Measurement Mission. Bull. Amer. Meteorol. Soc. 2014, 95, 701–722. [Google Scholar] [CrossRef]
  19. Skofronick-Jackson, G.; Petersen, W.A.; Berg, W.; Kidd, C.; Stocker, E.F.; Kirschbaum, D.B.; Wilheit, T.; Meneghini, R.; Kummerow, C.; Kirstetter, P.E.; et al. The Global Precipitation Measurement (GPM) Mission for Science and Society. Bull. Am. Meteorol. Soc. 2017, 98, 1679–1695. [Google Scholar] [CrossRef] [PubMed]
  20. Skofronick-Jackson, G.; Kirschbaum, D.; Petersen, W.; Huffman, G.; Kidd, C.; Stocker, E.; Kakar, R. The Global Precipitation Measurement (GPM) mission’s scientific achievements and societal contributions: Reviewing four years of advanced rain and snow observations. Q. J. Roy. Meteorol. Soc. 2018, 144, 27–48. [Google Scholar] [CrossRef]
  21. Ryu, J.; Song, H.-J.; Sohn, B.-J.; Liu, C. Global distribution of three types of drop size distribution representing heavy rainfall from GPM/DPR measurements. Geophys. Res. Lett. 2021, 48, e2020GL090871. [Google Scholar] [CrossRef]
  22. Luo, S.; Fu, Y.; Zhou, S.; Wang, S.; Wang, D. Analysis of the relationship between the cloud water path and precipitation intensity of mature typhoons in the Northwest Pacific Ocean. Adv. Atmos. Sci. 2020, 37, 359–376. [Google Scholar] [CrossRef]
  23. Huang, H.; Chen, F. Precipitation microphysics of tropical cyclones over the western North Pacific based on GPM DPR observations: A preliminary analysis. J. Geophys. Res.-Atmos. 2019, 124, 3124–3142. [Google Scholar] [CrossRef]
  24. Chen, F.; Fu, Y.; Yang, Y. Regional variability of precipitation in tropical cyclones over the western North Pacific revealed by the GPM Dual-Frequency Precipitation Radar and Microwave Imager. J. Geophys. Res.-Atmos. 2019, 124, 11281–11296. [Google Scholar] [CrossRef]
  25. Bao, X.; Wu, L.; Zhang, S.; Yuan, H.; Wang, H. A comparison of convective raindrop size distributions in the eyewall and spiral rainbands of Typhoon Lekima (2019). Geophys. Res. Lett. 2020, 47, e2020GL090729. [Google Scholar] [CrossRef]
  26. Wu, Z.; Huang, Y.; Zhang, Y.; Zhang, L.; Lei, H.; Zeng, H. Precipitation characteristics of typhoon Lekima (2019) at landfall revealed by joint observations from GPM satellite and S-band radar. Atmos. Res. 2021, 260, 105714. [Google Scholar] [CrossRef]
  27. Wang, H.; Tan, L.; Zhang, F.; Zheng, J.; Liu, Y.; Zeng, Q.; Yan, Y.; Ren, X.; Xiang, J. Three-dimensional structure analysis and droplet spectrum characteristics of Southwest Vortex precipitation system based on GPM-DPR. Remote Sens. 2022, 14, 4063. [Google Scholar] [CrossRef]
  28. Wang, J.; Zhuge, X.; Chen, F.; Chen, X.; Wang, Y. A preliminary analysis of typical structures and microphysical characteristics of precipitation in Northeastern China Cold Vortexes. Remote Sens. 2023, 15, 3399. [Google Scholar] [CrossRef]
  29. Chen, Y.; Li, W.; Chen, S.; Zhang, A.; Fu, Y. Linkage between the vertical evolution of clouds and droplet growth modes as seen from FY-4A AGRI and GPM DPR. Geophys. Res. Lett. 2020, 47, e2020GL088312. [Google Scholar] [CrossRef]
  30. Sun, Y.; Dong, X.; Cui, W.; Zhou, Z.; Fu, Z.; Zhou, L.; Deng, Y.; Cui, C. Vertical structures of typical Meiyu precipitation events retrieved from GPM-DPR. J. Geophys. Res.-Atmos. 2020, 125, e2019JD031466. [Google Scholar] [CrossRef]
  31. Fu, Y.; Luo, J.; Luo, S.; Chen, G.; Wang, M.; Sun, L.; Sun, N.; Yang, L. Rainstorm structure of a supercell cloud occurred in Chongqing in May 2018 measured by GPM DPR and GMI. Torrential Rain Disasters 2022, 41, 1–14. (In Chinese) [Google Scholar] [CrossRef]
  32. Chen, F.; Zheng, X.; Wen, H.; Yuan, Y. Microphysics of convective and stratiform precipitation during the summer monsoon season over the Yangtze–Huaihe River valley, China. J. Hydrometeorol. 2022, 23, 239–252. [Google Scholar] [CrossRef]
  33. Hu, L.; Yang, S.; Li, Y.; Gao, S. Diurnal variability of precipitation depth over the Tibetan Plateau and its surrounding regions. Adv. Atmos. Sci. 2010, 27, 115–122. [Google Scholar] [CrossRef]
  34. Xiang, S.; Li, Y.; Li, D.; Yang, S. An analysis of heavy precipitation caused by a retracing plateau vortex based on TRMM data. Meteorol. Atmos. Phys. 2013, 122, 33–45. [Google Scholar] [CrossRef]
  35. Wei, D.; Liu, L.; Tian, W.; Wang, R.; Yang, X.; Li, C.; Zhang, J. Analysis of the heavy precipitation caused by Plateau vortex in northwest China based on satellite data. Plateau Meteorol. 2021, 40, 829–839. (In Chinese) [Google Scholar] [CrossRef]
  36. Iguchi, T.; Seto, S.; Meneghini, R.; Yoshida, N.; Awaka, J.; Kubota, T. GPM/DPR Level-2 Algorithm Theoretical Basis Document; NASA Goddard Space Flight Center: Greenbelt, MD, USA, 2010. [Google Scholar]
  37. Awaka, J.; Le, M.; Brodzik, S.; Kubota, T.; Masaki, T.; Chandrasekar, V.; Iguchi, T. Development of precipitation type classification algorithms for a full scan mode of GPM Dual-frequency Precipitation Radar. J. Meteorol. Soc. Jpn. Ser. II 2021, 99, 1253–1270. [Google Scholar] [CrossRef]
  38. Awaka, J.; Le, M.; Chandrasekar, V.; Yoshida, N.; Higashiuwatoko, T.; Kubota, T.; Iguchi, T. Rain type classification algorithm module for GPM Dual-Frequency Precipitation Radar. J. Atmos. Ocean. Tech. 2016, 33, 1887–1898. [Google Scholar] [CrossRef]
  39. Chandrasekar, V.; Le, M.; Awaka, J. Vertical profile classification algorithm for GPM. In Proceedings of the 2014 IEEE Geoscience and Remote Sensing Symposium, Quebec City, QC, Canada, 13–18 July 2014; pp. 3458–3761. [Google Scholar] [CrossRef]
  40. Meneghini, R.; Liao, L.; Iguchi, T. A Generalized Dual-Frequency Ratio (DFR) approach for rain retrievals. J. Atmos. Ocean. Tech. 2022, 39, 1309–1329. [Google Scholar] [CrossRef]
  41. Seto, S.; Iguchi, T.; Meneghini, R.; Awaka, J.; Kubota, T.; Masaki, T.; Takahashi, N. The precipitation rate retrieval algorithms for the GPM Dual-frequency Precipitation Radar. J. Meteorol. Soc. JPN. Ser. II 2021, 99, 205–237. [Google Scholar] [CrossRef]
  42. Yang, J.; Zhang, Z.; Wei, C.; Lu, F.; Guo, Q. Introducing the new generation of Chinese geostationary weather satellites, Fengyun-4. Bull. Am. Meteorol. Soc. 2017, 98, 1637–1658. [Google Scholar] [CrossRef]
  43. Hersbach, H.; Bell, B.; Berrisford, P.; Hirahara, S.; Horányi, A.; Muñoz-Sabater, J.; Thépaut, J.N.; Villaume, S.; Vamborg, F.; Rozum, I.; et al. The ERA5 global reanalysis. Q. J. R. Meteorol. Soc. 2020, 146, 1999–2049. [Google Scholar] [CrossRef]
  44. Lin, Z.; Guo, W.; Jia, L.; Yao, X.; Zhou, Z. Climatology of Tibetan Plateau vortices derived from multiple reanalysis datasets. Clim. Dyn. 2020, 55, 2237–2252. [Google Scholar] [CrossRef]
  45. Yuter, S.E.; Houze, R.A. 3-dimensional kinematic and microphysical evolution of Florida cumulonimbus. Part II: Frequency-distributions of vertical velocity, reflectivity, and differential reflectivity. Mon. Weather Rev. 1995, 123, 1941–1963. [Google Scholar] [CrossRef]
  46. Liu, C.; Li, Y.; Li, D. Analysis on the dynamic structure of vortex moving out of the Tibetan Plateau. Plateau Mountain Meteorol. Res. 2009, 29, 8–11. (In Chinese) [Google Scholar] [CrossRef]
  47. Houze, R.A., Jr. Cloud Dynamics (2nd Utg.); Elsevier: Amsterdam, The Netherlands; Academic Press: Cambridge, MA, USA, 2014; p. 104. [Google Scholar]
  48. Chen, F.; Zheng, X.; Yu, L.; Wen, H.; Liu, Y. Precipitation, microphysical and environmental characteristics for shallow and deep clouds over Yangtze-Huaihe River Basin. Atmos. Res. 2023, 298, 107155. [Google Scholar] [CrossRef]
  49. Janapati, J.; Seela, B.K.; Lin, P.-L. Regional discrepancies in the microphysical attributes of summer season rainfall over Taiwan using GPM DPR. Sci. Rep. 2023, 13, 12118. [Google Scholar] [CrossRef]
  50. Zhang, P.; Gu, S.; Chen, L.; Shang, J.; Lin, M.; Zhu, A.; Yin, H.; Wu, Q.; Shou, Y.; Sun, F.; et al. FY-3G satellite instruments and precipitation products: First report of China’s Fengyun rainfall mission in-orbit. J. Remote Sens. 2023, 3, 97. [Google Scholar] [CrossRef]
Figure 1. Path of the TPV during 8–13 July 2021 overlaying topography. The blue dots indicated the locations of the TPV centers from 15:00 on 8 July to 03:00 on 13 July. The red dots represent the locations of the TPV centers from 00:00 on 9 July to 00:00 on 13 July.
Remotesensing 16 01947 g001
Figure 2. Daily gauge precipitation at (a) 00:00 on 8 July to 00:00 on 9 July, (b) 00:00 on 9 July to 00:00 on 10 July, (c) 00:00 on 10 July to 00:00 on 11 July and (d) 00:00 on 11 July to 12:00 on 12 July.
Remotesensing 16 01947 g002
Figure 3. The brightness temperature of FY-4A/AGRI 10.8 µm channel (shading, K) with 500 hPa geopotential height (contours, 10 gpm) of ERA5 data at (a) 04:00 on 9 July, (b) 17:00 on 9 July, (c) 02:00 on 11 July, and (d) 01:00 on 12 July. The paralleled black lines represent the boundaries of GPM/DPR scanning path. The black box areas represent the study regions.
Remotesensing 16 01947 g003
Figure 4. The total column vertically-integrated water vapor (shading, kg·m−2) of ERA5 data at (a) 04:00 on 9 July, (b) 17:00 on 9 July, (c) 02:00 on 11 July and (d) 01:00 on 12 July. The paralleled black lines represent the boundaries of GPM/DPR scanning path.
Remotesensing 16 01947 g004aRemotesensing 16 01947 g004b
Figure 5. Average (a) divergence(s−1) and (b) vertical velocity(Pa·s−1) profiles of ERA5 data in the study regions in Figure 3. The green, blue, cyan, and red solid lines represent 04:00 on 9 July, 17:00 on 9 July, 02:00 on 11 July, and 01:00 on 12 July, respectively.
Remotesensing 16 01947 g005
Figure 6. Horizontal distributions of (a,d,g,j) the near-surface precipitation rate (mm·h−1), (b,e,h,k) precipitation type, and (c,f,i,l) storm top height (km). The gray colors represent the brightness temperature of FY-4A/AGRI 10.8 µm channel. The paralleled black lines represent the boundaries of GPM/DPR scanning path. (ac) 04:00 on 9 July, (df) 17:00 on 9 July, (gi) 02:00 on 11 July, and (jl) 01:00 on 12 July.
Remotesensing 16 01947 g006aRemotesensing 16 01947 g006b
Figure 7. Vertical cross sections of (a,d,g,j) Ze (dBZ), (b,e,h,k) Dm (mm), and (c,f,i,l) dBNw (mm−1·m−3) along the AB lines in Figure 6. The black solid lines represent surface heights. The dotted lines represent melting layer heights. The gray solid lines represent bright band heights. (ac) 04:00 on 9 July, (df) 17:00 on 9 July, (gi) 02:00 on 11 July, and (jl) 01:00 on 12 July.
Remotesensing 16 01947 g007aRemotesensing 16 01947 g007b
Figure 8. CFAD distributions of (a,d,g,j) Ze (dBZ), (b,e,h,k) Dm (mm), and (c,f,i,l) dBNw (mm−1·m−3) in the study regions. The solid lines represent average lines. The long-dashed lines represent median lines. The dotted lines represent melting layer heights. (ac) 04:00 on 9 July, (df) 17:00 on 9 July, (gi) 02:00 on 11 July, and (jl) 01:00 on 12 July.
Remotesensing 16 01947 g008aRemotesensing 16 01947 g008b
Figure 9. Vertical average profiles of (a,d,g,j) precipitation rate (mm·h−1), (b,e,h,k) Dm (mm), and (c,f,i,l) dBNw (mm−1·m−3) in the study regions. The blue lines represent stratiform clouds, and the green lines represent convective clouds. (ac) 04:00 on 9 July, (df) 17:00 on 9 July, (gi) 02:00 on 11 July and (jl) 01:00 on 12 July.
Remotesensing 16 01947 g009
Figure 10. Horizontal distributions of (a,d,g,j) GPM-DPR near-surface precipitation rate (mm·h−1), (b,e,h,k) hourly gauge precipitation rate (mm·h−1), and (c,f,i,l) ERA5 hourly precipitation rate (mm·h−1). The paralleled black lines represent the boundaries of GPM/DPR scanning path at 04:00 on 9 July. (ac) 04:00 on 9 July, (df) 17:00 on 9 July, (gi) 02:00 on 11 July, and (jl) 01:00 on 12 July.
Remotesensing 16 01947 g010aRemotesensing 16 01947 g010b
Disclaimer/Publisher’s Note: The statements, opinions and data contained in all publications are solely those of the individual author(s) and contributor(s) and not of MDPI and/or the editor(s). MDPI and/or the editor(s) disclaim responsibility for any injury to people or property resulting from any ideas, methods, instructions or products referred to in the content.

