Article

DAMF-Net: Unsupervised Domain-Adaptive Multimodal Feature Fusion Method for Partial Point Cloud Registration

1
School of Mathematics and Statistics, Xi’an Jiaotong University, Xi’an 710049, China
2
Shaanxi Darerobot Intelligent Technology Co., Ltd., Xi’an 710075, China
*
Author to whom correspondence should be addressed.
Remote Sens. 2024, 16(11), 1993; https://doi.org/10.3390/rs16111993
Submission received: 31 March 2024 / Revised: 24 May 2024 / Accepted: 28 May 2024 / Published: 31 May 2024
(This article belongs to the Section Remote Sensing Image Processing)

Abstract

:
Current point cloud registration methods predominantly focus on extracting geometric information from point clouds. In certain scenarios, i.e., when the target objects to be registered contain a large number of repetitive planar structures, the point-only based methods struggle to extract distinctive features from the similar structures, which greatly limits the accuracy of registration. Moreover, the deep learning-based approaches achieve commendable results on public datasets, but they face challenges in generalizing to unseen few-shot datasets with significant domain differences from the training data, and that is especially common in industrial applications where samples are generally scarce. Moreover, existing registration methods can achieve high accuracy on complete point clouds. However, for partial point cloud registration, many methods are incapable of accurately identifying correspondences, making it challenging to estimate precise rigid transformations. This paper introduces a domain-adaptive multimodal feature fusion method for partial point cloud registration in an unsupervised manner, named DAMF-Net, that significantly addresses registration challenges in scenes dominated by repetitive planar structures, and it can generalize well-trained networks on public datasets to unseen few-shot datasets. Specifically, we first introduce a point-guided two-stage multimodal feature fusion module that utilizes the geometric information contained in point clouds to guide the texture information in images for preliminary and supplementary feature fusion. Secondly, we incorporate a gradient-inverse domain-aware module to construct a domain classifier in a generative adversarial manner, weakening the feature extractor’s ability to distinguish between source and target domain samples, thereby achieving generalization across different domains. Experiments on a public dataset and our industrial components dataset demonstrate that our method improves the registration accuracy in specific scenarios with numerous repetitive planar structures and achieves high accuracy on unseen few-shot datasets, compared with the results of state-of-the-art traditional and deep learning-based point cloud registration methods.

1. Introduction

Point cloud registration is one of the core issues in three-dimensional (3D) reconstruction technology and it has been widely applied in the field of intelligent industrial manufacturing. For example, the multi-view point cloud reconstruction of industrial components can be used for subsequent defect detection [1]. Due to the sensor’s limited field of view, 3D color cameras cannot completely capture the point cloud data of the entire object. The target object needs to be scanned from multiple views, which causes the relative position of the target object to change in the scanning device. The goal of point cloud registration is to estimate the rigid transformation matrix between point clouds from different views and align these point clouds to reconstruct a complete 3D point cloud of the target object, so that subsequent work such as defect detection can be carried out smoothly [2].
The point cloud registration process generally consists of three steps: feature extraction, correspondence estimation, and geometric fitting [2]. The effectiveness of feature extraction is essential for improving registration performance. A good feature extraction method can generate an abundance of correct correspondences, achieving high-precision point cloud registration. Point cloud registration methods can be broadly classified into two categories: traditional methods and deep learning methods. Traditional methods rely on manually designed feature descriptors to extract surface shape information, which limit the capability of the feature representation. Deep learning-based feature extractors can obtain depth semantic features, and they generally achieve robust and high-precision point cloud registration.
The existing point cloud registration methods with deep learning primarily face three challenges. Firstly, the deep learning-based methods mostly focus on extracting features using the geometric information of points. However, point clouds in specific scenes (such as indoor walls and floors, industrial planar components) contain many repeated geometric structures. Consequently, the similarity of features extracted based on these neighborhoods will be very high, which increases the number of mismatched correspondences and affects subsequent rigid transformation estimation. The texture information of image features can be helpful for registration when the features of the point cloud cannot distinguish similar geometric structures. Fortunately, the development of sensors such as red green blue-depth (RGB-D) cameras and structured light cameras has created conditions for simultaneously acquiring point clouds and image data of corresponding frames. Figure 1 and Figure 2 illustrate typical industrial components. Compared with point clouds, images have rich texture information such as patterns on wall murals, scratches in the planar components as shown in Figure 1 and Figure 2. More distinctive texture features can be supplemented to the point cloud’s geometric features. Thereby, it is important to combine the texture features of images and the geometric features of point clouds.
Secondly, the deep learning-based methods are well-trained on public datasets, but they are usually difficult to be generalized to few-shot unseen datasets, especially when the domain gap between the unseen dataset and the public dataset is huge and the number of trainable samples of the unseen dataset is extremely small for fine-tuning. Favorably, the domain adaptation method can significantly improve the generalization performance of the model, by transferring the model trained on the public dataset to the unseen few-shot dataset, and it can achieve the same test accuracy on the few-shot dataset as on the public dataset.
Thirdly, existing point cloud registration methods perform well in registering two complete point clouds, but they are less effective for partial point cloud registration, particularly in the absence of ground truth for rigid transformations. The supervised methods, such as PointNetLK [3], still tend to treat all points in a point cloud as a whole, extract features from the entire point cloud, and then perform registration. Moreover, supervised point cloud registration methods require ground-truth rigid transformations to train the model, which are expensive to obtain in many scenarios, particularly in the industry. The integration of a matching matrix during the process of the correspondence estimation facilitates the confidence levels of computation for the estimated correspondences, which makes the geometric fitting more robust. In addition, metrics such as the chamfer distance [4], which do not require ground-truth rigid transformations, also create possibilities for unsupervised point cloud registration.
In this study, we focus on unsupervised partial point cloud registration and aim to improve the existing point cloud registration framework in two aspects. The first is to fuse the geometric information of the point cloud with the texture information of the image. Previous multimodal feature fusion methods, such as Crosspoint [5], directly concatenate point cloud features and image features. The drawback of these fusion methods is their limited capacity to capture the intricate relationships between different modalities. In order to solve this problem, we propose an unsupervised domain-adaptive multimodal feature fusion method for partial point cloud registration (DAMF-Net), which combines image features and point cloud features through a point-guided two-stage multimodal feature fusion module. Moreover, we incorporate the domain adaptation into the point cloud registration to address few-shot and difficult generalization problems. We propose the gradient-inverse domain-aware module to construct a domain classifier parallel to the correspondence estimation module in a generative adversarial manner to predict the domain category labels of the samples. Moreover, the domain adaptation loss calculated by the domain category labels can weaken the feature extractor’s ability to discriminate source and target domain samples, thereby enhancing the generalization ability of the network.
The state-of-the-art methods can achieve high registration accuracy with obvious geometric features, such as RIENet [6] that can achieve a mean absolute error of 0.0033 on ModelNet40 [7]. However, what is really challenging is that point-only based feature extraction cannot distinguish point cloud neighborhoods with similar structures such as cases shown in Figure 1 and Figure 2. In addition, the number of industrial samples is generally small, and networks trained on public datasets cannot perform domain transformation on few-shot industrial datasets through fine-tuning. Although some well-designed deep learning-based point cloud registration methods have achieved good performance, our method provides a new perspective for multimodal feature fusion and domain adaptation registration, which improves registration accuracy on unseen few-shot datasets of industrial components. Experiments on the 7Scenes [8] dataset and our industrial components dataset demonstrate that our method can achieve higher precision of point cloud registration in terms of quantitative metrics and visualization results, compared with methods based only on points and methods without domain adaptation, especially for unseen few-shot dataset containing repetitive structures. Our model is compared to the baseline model RIENet [6] and the results show that the chamfer distance [4] reduces from 2.7058 to 0.5674 on the 7Scenes [8] dataset, while the root mean square error (RMSE) of the Euler angle decreases from 0.2137 to 0.0116 on the industrial components dataset.

2. Related Work

2.1. Point Cloud Registration

Point cloud registration methods can be divided into traditional methods and deep learning-based methods. The most typical of the traditional methods is ICP [9], which iteratively adjusts the transformation to minimize the discrepancy between correspondences. Its primary limitation lies in the necessity of a robust initialization to avoid convergence to a local optimum. Go-ICP [10] employs branch-and-bound optimization, but it remains susceptible to outliers because of its reliance on the least-squares objective function. Additionally, certain manually designed descriptors such as point feature histogram (PFH) [11] and fast point feature histogram (FPFH) [12] have been suggested for estimating rigid transformations using RANSAC [13]. In recent times, deep learning has proven to be effective in point cloud registration tasks, with the emergence of several supervised approaches. PointNetLK [3] adapts Lucas and Kanade’s [14] algorithm and integrates it into PointNet [15] for the purpose of point cloud registration. DCP [16] determines the rigid transformation using a singular value decomposition (SVD) [17], while establishing correspondences through the acquisition of a soft matching map.
However, acquiring the necessary ground truth-transformations is costly and time-intensive, potentially escalating training expenses and impeding real-world applications. Addressing these concerns, considerable attention has been given towards unsupervised methods. JCRNet [4] aims to achieve the optimal rigid transformation by minimizing alignment error metrics such as the chamfer distance between transformed source point clouds and target counterparts, ensuring the precise alignment of point cloud pairs. Zhang et al. introduces a semi-supervised point cloud registration method, treating point cloud alignment as the minimization of the Kullback–Leibler divergence between two Gaussian mixture models without any annotation [18]. Apart from the acquisition of expensive ground-truth transformation, in the case of partially overlapping point cloud pairs, the presence of noise from outliers increases the likelihood of convergence to local optima during optimization. PRNet [19] addresses the challenges of non-convex alignment and partial correspondence problems by learning keypoint detection and correspondences in a flexible and efficient manner. RPM-Net [20], akin to soft matching map methodologies, utilizes the Sinkhorn [21] layer to ensure doubly stochastic constraints on the matching map, ensuring dependable correspondences. PointDSCC [22] incorporates the color information of point clouds to assist in outlier removal, thereby enhancing the effectiveness of point cloud registration.

2.2. Multimodal Feature Fusion

An RGB image often contains abundant texture details, whereas a point cloud offers accurate geometric representations. Consequently, combining these modalities is a promising approach, leveraging their complementary information.
Crosspoint [5] extracts the features of both modal data through an image feature extractor and a point cloud feature extractor, respectively, which projects the features of the two modalities into the same feature space through the projection head. It fuses the two modalities by directly concatenating two vectors. DenseFusion [23] merges geometric and texture details by combining the embeddings derived from both a convolutional neural network (CNN) [24] and PointNet [15], while incorporating extra channels into the global contextual information. PointFusion [25] employs a two-dimensional (2D) object detection mechanism to generate bounding boxes in the 2D space, subsequently integrating image and point cloud characteristics via a fusion of CNN-based and point-based networks for 3D object detection. MVX-Net [26] leverages a pretrained 2D Faster R-CNN [27] for image feature extraction, complemented by a VoxelNet [28] for box generation. Notably, points or voxels undergo projection onto the image plane, where corresponding features are seamlessly integrated with 3D counterparts. FusionRCNN [29], a 3D object detection method, leverages a self-attention mechanism to enhance the domain-specific features, following by a cross-attention mechanism to fuse the two modalities’ information. Additionally, PointBEV [30] ingeniously employs continuous convolutions to seamlessly fuse image features onto bird’s eye view (BEV) feature maps across varying resolutions. However, the use of BEV point cloud projection loses the geometric information of the point cloud to a certain extent.

2.3. Domain Adaptation on Point Cloud

Domain adaptation addresses the formidable task of transferring knowledge learned from a label-rich dataset (i.e., the source domain) to a label-scarce dataset (i.e., the target domain), with the ultimate objective of achieving robust generalization. Nonetheless, the presence of distributional discrepancies across diverse domain datasets often leads to suboptimal performance of models trained on one domain when applied to others. To circumvent this challenge, numerous domain adaptation methodologies have been proposed, which encompass techniques ranging from feature space alignment to the minimization of instance-level divergences, such as MMD [31] and CORAL [32], facilitating the amalgamation of cross-domain features. Inspired by the remarkable success of Generative Adversarial Networks [33], adversarial-based domain adaptation strategies, exemplified by DANN [34], have garnered considerable attention and exhibited promising outcomes.
Even though the domain adaptation paradigm has achieved notable success in addressing 2D vision tasks, integrating it into a 3D vision problem is a recent preliminary exploration. Pioneering work by [35] introduces unsupervised domain adaptation in the context of 3D keypoint estimation, leveraging a regularization term to enforce multi-view consistency. However, the applicability of this method to broader tasks, such as classification, remains limited. PointDAN [36], on the other hand, proposes adversarial training strategies to effectively align distributional shifts between the source and target domains, both locally and globally, whereas previous methodologies have predominantly focused on domain adaptation for single-modality data, overlooking the potential for adaptation on fused features from both image and point cloud modalities.

3. Methods

The overall architecture of the proposed DAMF-Net is illustrated in Figure 3. It consists of five main components: point feature extractor, image feature extractor, point-guided two-stage multimodal feature fusion module, gradient-inverse domain-aware module, correspondence estimation and geometric fitting module.

3.1. Point-Guided Two-Stage Multimodal Feature Fusion Module

The point feature extractor follows the DGCNN [37] and use four edge convolution layers. The input point cloud is P R N × 3 and the output point feature is F P R N × C P . The image encoder is a pretrained ResNet18 [38]. The input image is I R W × H × 3 and the output image feature is F I R M × C I , where N denotes the number of points in the point cloud, C P denotes the dimension of the point cloud features, and C I denotes the dimensions of the image features. In our algorithm, we consider all pixels as one dimension M = W 8 × H 8 , denoting the number of abstract pixels of the image feature extractor, which is similar to representing the point cloud as an N × 3 matrix regardless of the order of the point cloud.
The goal of point-guided two-stage multimodal feature fusion module(P2MF) is to extract texture information for each point and perform deep fusion. Inspired by Transformer [39] and Resnet [38], our point-guided two-stage multimodal feature fusion module follows the form of cross-attention with skip connections. The input of our P2MF module is a point feature F P R N × C P with rich geometric information and an image feature F I R M × C I with texture information, while the output is F f u s e R N × C F , containing both texture information and geometric information for each point.

3.1.1. Initial Fusion Stage

The initial fusion of the point cloud with the image is achieved by the combination of the self-attention and cross-attention mechanisms. The initial fusion aims at capturing the internal relationships within features of two modalities through self-attention and then weight the pixel features according to how well it responds to the point cloud features through cross-attention. The weighted pixel feature represents the texture information corresponding to the query point, and we concatenate the feature of the query point with the weighted pixel feature containing the texture information to obtain the initial fusion features of the two modal data.
Specifically, we first apply the self-attention mechanism to F P and F I to obtain F P and F I after augmenting the internal relations of the feature sequence, mathematically described as
Q s P , K s P , V s P = F P W Q s P , F P W K s P , F P W V s P
F P = s o f t m a x ( Q s P K s P d 1 ) V s P
Q s P , K s P , V s P represent the query, key and value of input point feature, W Q s P , W K s P , W V s P are the transformation matrices of Q s P , K s P , V s P , respectively. d 1 is the linear map output dimention of K s P .
Q s I , K s I , V s I = F I W Q s I , F I W K s I , F I W V s I
F I = s o f t m a x ( Q s I K s I d 2 ) V s I
Q s I , K s I , V s I represent the query, key, and value of the input image feature, and W Q s I , W K s I , and W V s I are the transformation matrices of Q s I , K s I , and V s I , respectively. d 2 is the linear map output dimension of K s I .
Then, we project F P and F I to the same feature space using a linear map, the output of F P is considered as the query vector Q c , and the output of F I is regarded as key K c and value vector V c , respectively.
Q c , K c , V c = F P W Q c , F I W K c , F I W V c
W Q c , W K c , and W V c are the transformation matrices of Q c , K c , and V c , respectively. d 3 is the linear map output dimension of K c . The V c vector is weighted with attention weight W R N × M = s o f t m a x ( Q c K c T d 3 ) and concatenated with the point cloud feature F P in the feature channel dimension to obtain the first-stage fusion feature F 1 .
F 1 = s o f t m a x ( Q c K c T d 3 ) V c F P
where ⊕ denotes a concatenation operation between two features.

3.1.2. Complementary Fusion Stage

We perform an additional fusion on the features F 1 acquired during the initial fusion phase. Initially, the simple concatenated features F 1 , generated at the initial fusion stage, undergo deep fusion via a multilayer perceptron (MLP). Subsequently, the deep fused features mentioned above are combined with the input feature F P prior to the self-attention mechanism through skip connections. This methodology was adopted because we found that the accuracy of point cloud registration using only the deeply fused features obtained from the MLP was slightly less than that of the case where the point cloud features were added to the deeply fused features. We believe this discrepancy arose from the loss of detailed geometric information during the fusion process. However, in point cloud registration, the geometric information should serve as the guiding principle. Thus, integrating the fused features with the original point cloud feature F P acts as a “compensatory” mechanism, helping to emphasize the geometric information that is crucial to point cloud registration.
In our study, we applied a weighting scheme to the point cloud features F P and the deeply fused features obtained from the MLP, denoted as M L P ( F 1 ) .
F f u s e = α F P + ( 1 α ) M L P ( F 1 )
where α is a hyperparameter.

3.2. Gradient-Inverse Domain-Aware Module

The key idea of the gradient-inverse domain-aware module (GIDA) is to minimize both the registration error of the source domain samples and the difference between source and target domain data distributions during the training process. It draws on the idea of generative adversarial networks to construct a domain classifier parallel to the correspondence estimation module.
Moreover, the gradient-inverse domain-aware module comprises a gradient-inverse layer (GIL) in series with a domain classifier. During forward propagation, the GIL makes no changes and allows data to flow through it normally. However, during backpropagation, the GIL multiplies the gradient by a negative value. This means that although the domain classifier tries to maximize its accuracy (i.e., the ability to distinguish between the source and target domains), due to the presence of the GIL, the parameter of the feature extractor will update towards a direction that makes the domain classifier less accurate. In other words, the feature extractor is trained to produce features that makes it more difficult to distinguish between the two domains. The specific working principle of the GIL is described below:
  • Forward propagation
    During forward propagation, the GIL acts as a constant mapping, i.e., the input is directly equal to the output without any transformation. We denote the GIL function and its input vector as f and x, respectively. The forward propagation can be expressed as
    f ( x ) = x
  • Backward propagation
    During backpropagation, the GIL multiplies the gradient by a negative value σ (i.e., gradient inverse). We denote the parameter of the GIDA module and its loss function as θ g , L d a , respectively. The backward propagation can be expressed as
    θ g θ g μ · σ L d a θ g
    where μ denotes learning rate.
The domain classifier is a simple binary classifier that discriminates whether a sample belongs to the source domain or the target domain. It consists of two fully connected neural networks and a sigmoid activation function. In our network, the fused features are fed into the GIDA module, which successively passes through the gradient-inverse layer and the domain classifier to obtain the predicted values of the domain categories of the input samples. Moreover, the predicted results are used to compute the domain-adaptive loss L d a and the detailed construction of L d a is in Section 3.4.2.

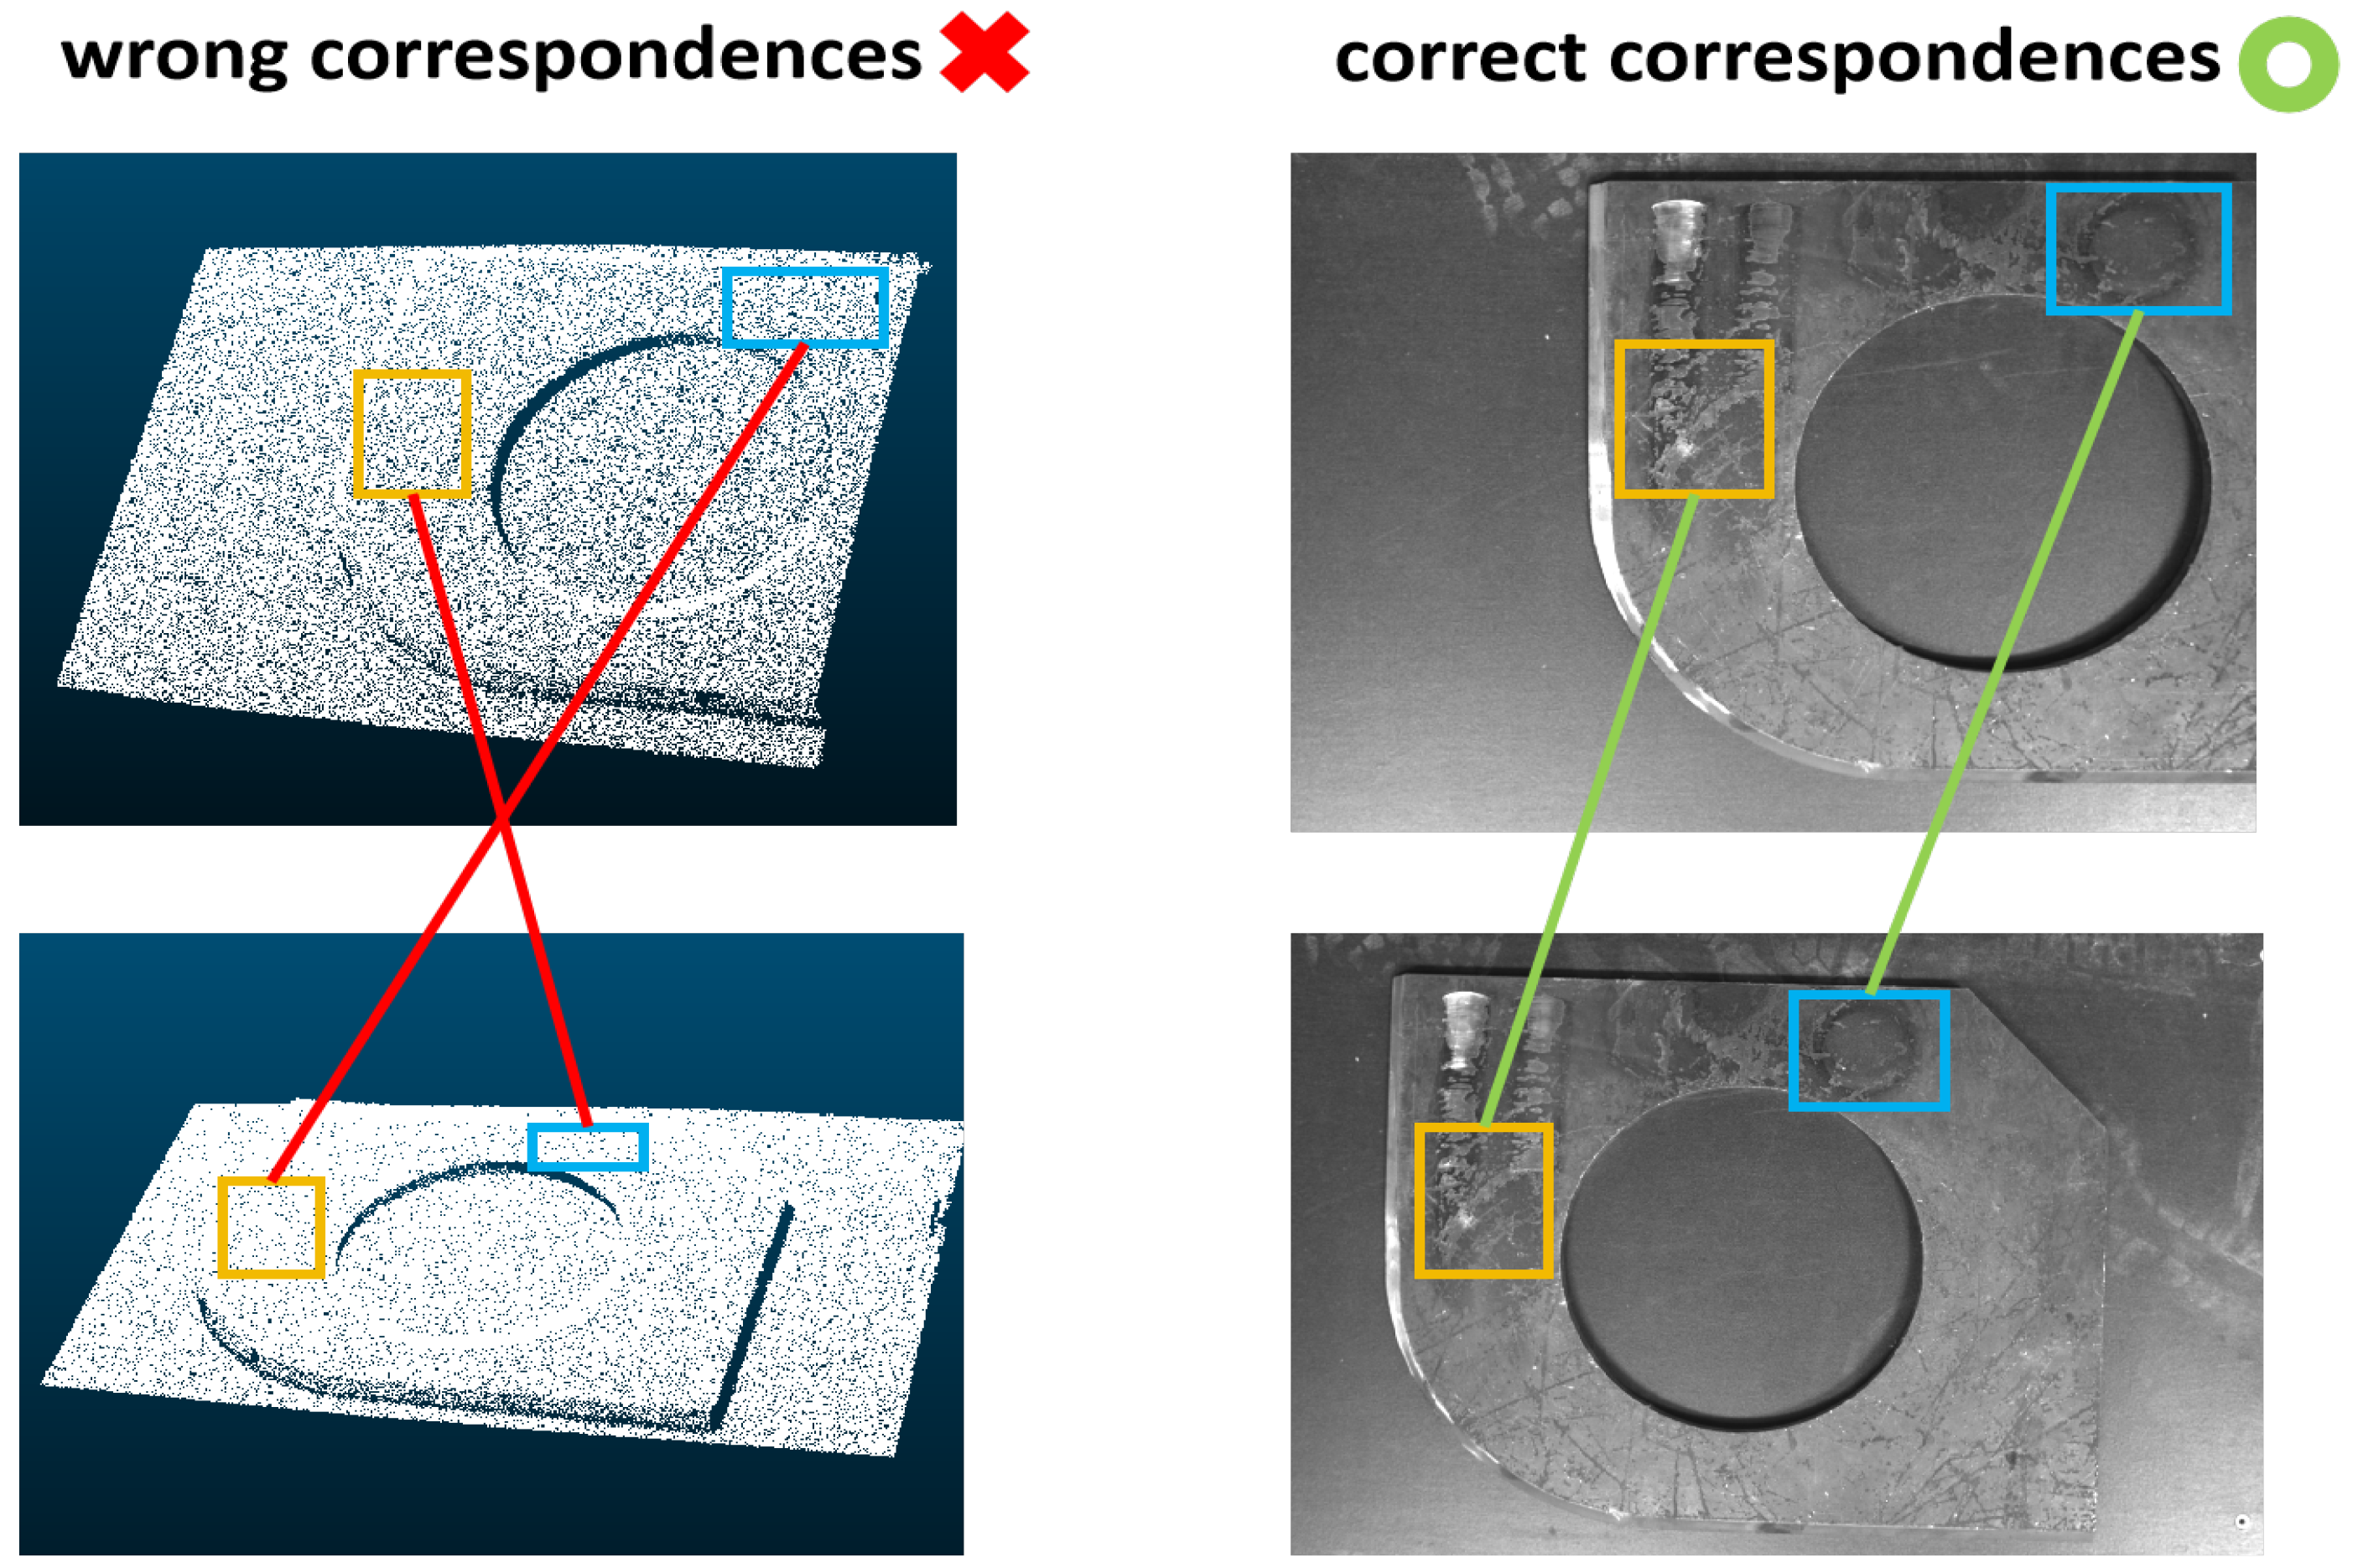
3.3. Correspondence Estimation and Geometric Fitting

After obtaining the source and target point clouds’ fused features, correspondences are established utilizing the approach described in RIENet [6]. It introduces the matching map refinement module and the inlier evaluation module to obtain trustworthy correspondences and carry out a weighted SVD [17].
Given the multimodal fused feature F f u s e P of source point cloud P = { p i R 3 | i = 1 , , N } and F f u s e Q of target point cloud Q = { q i R 3 | i = 1 , , M } , the matching score between any pair of points p i and q j is determined by the normalized distance between their features:
M i , j = softmax ( [ D i , 1 , , D i , M ] ) j
where D i , j = | | F f u s e p i F f u s e q j | | 2 is the Euclidean distance between the fused features of points p i and q j .
To incorporate neighborhood information, the neighborhood score is computed by taking the average of the matching scores of adjacent points, thus enhancing the robustness of correspondences by considering the spatial context of each point.
S i , j = 1 K p i N p i q j N q j M i , j
where N p i refers to the k-nearest neighborhood surrounding the point p i . A higher neighborhood score indicates that adjacent points are likely to have consistent, high matching probabilities. Correct correspondences often exhibit high neighborhood similarity, while incorrect ones tend to show low similarity. Thus, this neighborhood score is crucial in distinguishing non-matching point pairs.
M i , j = softmax D i , 1 , , D i , M ) j D i , j = exp ψ S i , j D i , j
The refined feature distance D i , j is inversely proportional to the neighborhood score S i , j . An exponential function is employed to regulate the rate of change. The parameter ψ governs the impact of the neighborhood consistence. Utilizing the refined matching map M R N × M , a point predictor is applied to each point p i in the source point cloud to produce a pseudo-correspondence q i as follows:
q i = j = 1 M M i , j · q j R 3
An inlier evaluation process is conducted to assess the reliability of each corresponding pair based on the obtained { ( p i , q i ) } , serving as the weight for the SVD [17] estimation. The inlier evaluation module focuses on dynamically capturing the geometric distinctions between the neighbors N p i and N q i by constructing a trainable graph representation. The edge features of the neighbors N p i and N q i are defined as e i , k p = p i p k , e i , k q = q i q k , where p k and q k represent the points within the neighborhood N p i and N q i .
To better capture the relationships between neighboring points, we integrate the edge features of neighbors into each point using an EdgeConv [37] operation h. Specifically, for each point p i P and q i Q , we utilize the subtraction of the edge features to characterize the disparity between their neighborhoods.
e i , k = h e i , k p h e i , k q
Subsequently, utilizing the difference of edge features between the two neighborhoods e i , k , the weight for each edge is dynamically learned using a softmax function, in order to emphasize the larger differences in edge features and reduce their weight during the SVD [17]. Ultimately, we aggregate the edge difference weighted by the weight mentioned above to determine the inlier confidence w i of the pseudo-correspondence { p i , q i } .
w i = 1 tanh k = 1 K softmax g e i , 1 , , g e i , K k e i , k
where K represents the number of neighbors, and g denotes another EdgeConv [37] operation. The obtained w i is used for the weighted SVD [17].
In summary, the whole framework of our model is as follows: we initially categorized the training set into target domain samples (industrial components on a plate background) and source domain samples (from the 7Scenes dataset [8]), where each input sample comprised a point cloud and its corresponding viewpoint image. Next, we extracted features from the point cloud and image using DGCNN [37] and ResNet [38], respectively. Subsequently, these features from both modalities were deeply fused using a point-guided two-stage multimodal feature fusion module. The fused features, along with those from another viewpoint, were input into a correspondence estimation module to obtain corresponding points. Lastly, based on these points, we estimated the rigid transformation using a weighted SVD [17], applying it to the source point cloud, and iteratively repeating this process three times.

3.4. Loss Function

The loss function was composed of a domain adaptation loss L d a and a registration loss L r e g in our algorithm. It is important to note that we developed an unsupervised network for point cloud registration, where neither the registration loss function nor the domain adaptation loss function required labeled data.

3.4.1. Registration Loss

We refer to RIENet [6] to divide the registration loss into three components: global alignment loss, neighborhood consensus loss, and spatial consistency loss. The three components mentioned are responsible for aligning the spatial positions of the source and target point clouds, ensuring neighborhood consistency between correspondences, and reducing the spatial distance for each inlier correspondence.
The global alignment loss exploits the chamfer distance [4] to train the model, given by
L g P , Q = p P β min q Q p q 2 2 + q Q β min p P q p 2 2
where P denotes the transformed source point cloud P. β denotes the Huber function, a robust loss function helping the chamfer distance [4] be more insensitive to outliers, and given as follows:
β ( u ) = 1 2 u 2 , if | u | β β | u | 1 2 β , otherwise
The neighborhood consensus loss leverages the coherence within the neighborhoods of inliers to train the model in an unsupervised way. Ideally, for every inlier x i X and its corresponding point y i Y , applying the transformation R , t to the neighborhood of x i , the transformed N x i should seamlessly align with the neighborhood N y i . Consequently, the neighborhood consensus loss is formulated as
L n = x i X , y i Y p j N x i , q j N y i R p j + t q j 2
The spatial consistency loss is introduced to reduce the spatial difference between the pseudo-target correspondence and the actual target correspondence. For each chosen inlier x i X , a cross-entropy spatial consistency loss is utilized to enhance their matching distributions as follows:
L s = 1 | X | x i X j = 1 M I j = arg max j M i , j log M i , j
where I { · } represents the indicator function. We selected the target point q j * with the highest matching probability to estimate the actual target correspondence. By enhancing the matching probability of the “true” target correspondence ( M i , j * 1 ), the resultant pseudo-target correspondence from Equation (13) tended to align closely with the “true” target correspondence q j * . Ultimately, we employed a comprehensive loss function in the registration phase to optimize our model as
L r e g = L g + γ L n + δ L s
where γ and δ serve as hyperparameters that regulate the importance of the neighborhood consensus loss and the spatial consistency loss in the model optimization process.

3.4.2. Domain Adaptation Loss

We employed a cross-entropy-based loss function to train the RIDA module. However, we observed a significant disparity in the number of samples between the source and target domains within the training set. This discrepancy primarily arose from the substantial difference in the volume of public datasets compared to industrial datasets. Training a binary classifier under such conditions of extreme sample imbalance leads to the feature extractor categorizing all samples into the class with a larger quantity of samples, namely, the source domain samples. This issue encapsulates the prevailing challenge in industrial applications of how to effectively transfer models trained on large and diverse public datasets to industrial scenario datasets with a limited number of samples.
It is crucial to note that our intention to diminish the feature extractor’s ability to distinguish between source and target domain samples did not equate to making the feature extractor predict all samples as belonging to the source domain. Instead, our goal was to enable the model to learn features that are universally applicable across both domains, thereby enhancing the model’s generalization ability across any target domain.
Fortunately, focal loss [40] can effectively address the issue of sample imbalance in binary classification tasks by introducing a novel element into the loss calculation, which diminishes the weight of easy-to-classify examples and amplifies the hard or misclassified examples. It is achieved through the incorporation of a focusing parameter γ t , which adjusts the easy examples that contribute less to the overall loss. The focal loss is given by
L d a = α t ( 1 y ^ ) γ t l o g y ^ , y = 1 ( 1 α t ) y ^ γ t l o g ( 1 y ^ ) , y = 0
where y ^ is the predicted domain’s class label. α t denotes class weights, used to assign a greater weight to categories with fewer samples. γ t is the focusing parameter that effectively reduces the loss contribution from well-classified examples. This mechanism ensures that the model’s training process concentrates more on difficult and misclassified examples.
Eventually, we summed the registration loss and the domain-adaptive loss in a certain proportion to obtain the total loss function, given by
L = L r e g + λ L d a
Here, λ is a hyperparameter, which needs to be obtained through multiple experiments.

4. Experiments

4.1. Datasets and Implementation Details

We evaluated our method on the 7Scenes [8] and industrial components datasets. 7Scenes [8] is a widely used indoor environment point cloud dataset, collected by a handheld Kinect RGB-D camera. The point cloud was obtained by fusing the depth map and color map, before being input into the subsequent model. It contained point clouds of seven different indoor environments: Chess, Fires, Heads, Office, Pumpkin, RedKitchen and Stairs. Each point cloud in the dataset was composed of continuous 50 frames with an RGB image and corresponding depth map. We refer to [41] to project each point cloud along the main axis of the camera and manually select the image closest to the point cloud projection among the corresponding 50 frames of the RGB images as the corresponding RGB image of that point cloud. Thanks to the extensive work of IMFNet [41], we conducted inspection and correction on the first-round filtered data. For pairs where there was a significant disparity between the RGB image and the projected point cloud image, we re-selected the closest RGB image from the 50 frames to correct the training samples. We screened out 26 images that were significantly different from the point cloud projections in 1184 7Scenes samples and finally replaced them with the images closet to the projections. It is noted that there were domain differences among the samples of each scene. Therefore, we utilized scenes Chess, Stair, Heads, Pumpkin, and Redkitchen as source domain samples, scene Fires as the target domain samples, and scene Office as the test set.
The industrial components dataset was acquired by the Mech-Eye PRO structured light camera in two different scenarios: a pure background plate and a complex workshop background. The Mech-Eye PRO structured light camera can directly acquire the point cloud and its corresponding image. Samples from the pure background plate and complex workshop background are shown in Figure 4. The industrial components dataset comprises 48 samples, with 25 pure background plate samples and 23 complex workshop backgrounds samples. It should be noted that pure plate background data are ideal samples, and data acquisition in most industrial scenarios cannot avoid containing a large amount of background noise. Therefore, we used the 7Scenes public dataset as the source domain sample, and the components scanned under the pure background plate as the target domain sample. The training set was jointly composed of samples from both the source domain and the target domain. The samples under the complex workshop background served as the test set to create a huge domain gap and validate the domain adaptation capabilities of our model. The division of the 7Scenes and industrial components datasets is shown in Figure 5.
Moreover, for each RGB image, the resolution was unified to 320 × 480 by bilinear interpolation. Each point cloud was downsampled to 2048 points, and the downsampled point cloud was voxel-normalized. The source point cloud and target point cloud were downsampled to 1536 points (75% of the complete point cloud). The inputs to the model were the downsampled source and target point cloud and their corresponding RGB image. Our model was implemented on one Geforce RTX 3090 GPU. We optimized the parameters with the adaptive moment estimation (ADAM) optimizer [42]. The initial learning rate was 0.001. For both the 7Scenes and industrial components datasets, we trained the network for 100 epochs and multiplied the learning rate by 0.7 at epoch 25, 50, and 75. As for hyperparameters, we set α , γ , δ , λ to 0.5, 1, 1, and 1, respectively.

4.2. Compared Methods and Evaluation Metrics

We conducted comparative experiments with three traditional methods, ICP [9], Go-ICP [10], and FPFH [12], where FPFH [12] was used for the feature descriptor extraction, followed by RANSAC [13] to estimate rigid transformations. Apart from this, we selected five deep learning approaches including PointNetLK [3], DCP [16], PRNet [19], RPMNet [20], and RIENet [6] to validate the effectiveness of our DAMF-Net. In order to introduce texture information into the comparative models and ensure the fairness of the comparative experiments, we utilized six dimensions (x, y, z, R, G, B) of features from point clouds in the following comparative experiments. The aforementioned six dimensions represented the spatial position and color information of the point clouds, respectively.
We evaluated the registration by the RMSE of the Euler angle and translation vector used in PRNet [19], and the chamfer distance used in PointMBF [43]. We employed RMSE(R) and RMSE(t) to denote the RMSE between the ground truth and predicted values of both Euler angles and translation vectors, respectively. We used CD to represent the chamfer distance between two point clouds. The calculation formulas of the three evaluation metrics are as follows:
R M S E ( R ) = 1 N i = 1 N ( ϕ 1 , ϕ 2 , ϕ 3 ) ( ϕ 1 ^ , ϕ 2 ^ , ϕ 3 ^ ) 2
where ϕ 1 , ϕ 2 , and ϕ 3 represent the pitch angle, yaw angle, and roll angle in Euler angles, respectively, and ϕ 1 ^ , ϕ 2 ^ , and ϕ 3 ^ represent their predicted values, respectively.
ϕ x = arctan 2 r 32 , r 33
ϕ y = arctan 2 r 31 , r 32 2 + r 33 2
ϕ z = arctan 2 r 21 , r 11
R M S E ( t ) = 1 N i = 1 N ( t 1 , t 2 , t 3 ) ( t ^ 1 , t ^ 2 , t ^ 3 ) 2
CD ( P ^ 1 , P 2 ) = p ^ 1 P ^ 1 min p 2 P ^ 2 p ^ 1 p 2 2 2 + p 2 P 2 min p ^ 1 P ^ 1 p 2 p ^ 1 2 2
r i j represents the element of row i and column j in the rotation matrix. t 1 , t 2 , and t 3 represent the ground truth of translation distances in x, y, and z directions, and t ^ 1 , t ^ 2 , and t ^ 3 represent their predicted values.

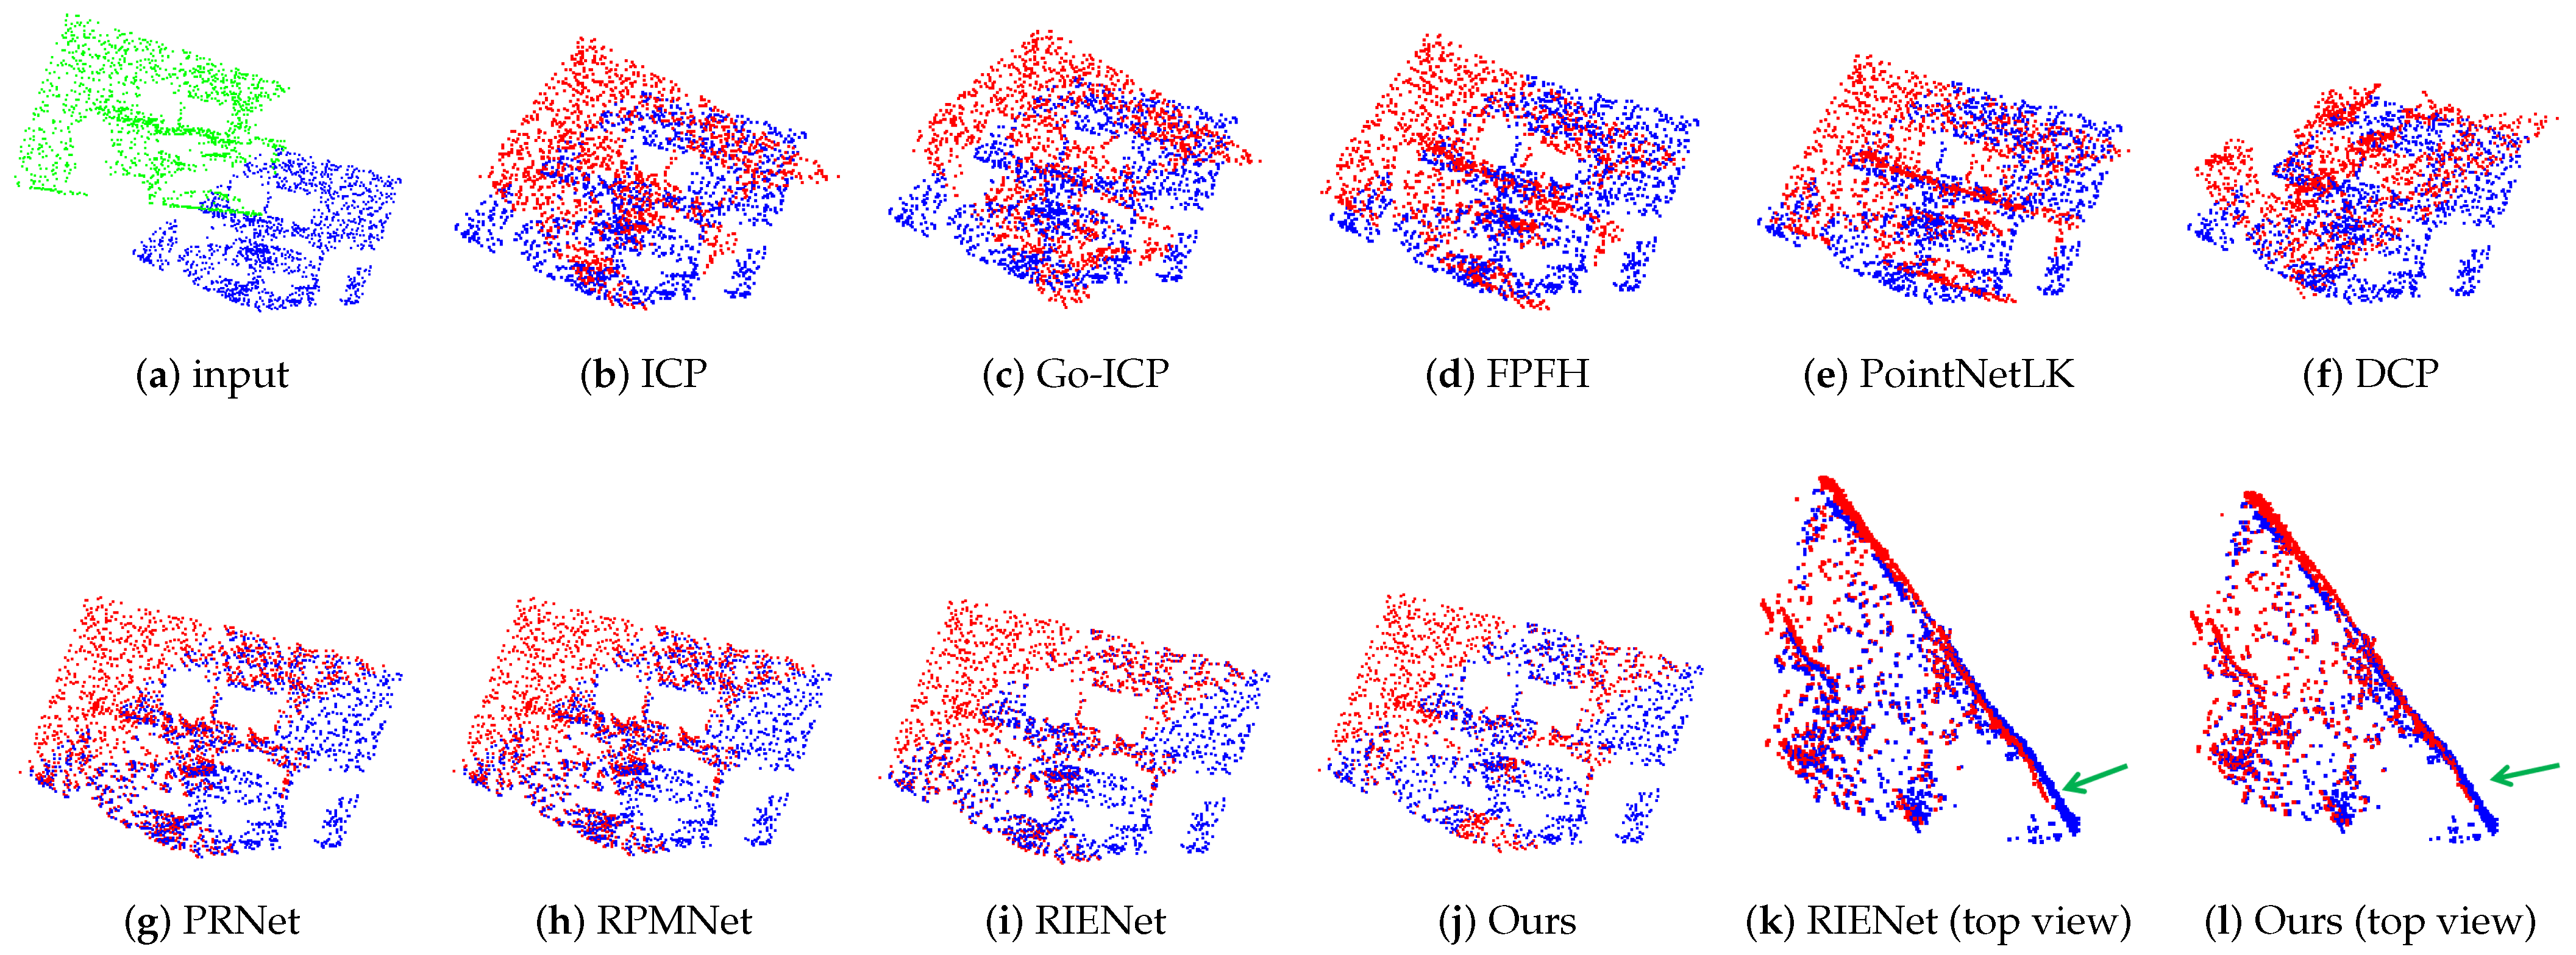
4.3. Comparative Evaluation

To validate our method, we conducted a series of experiments on the publicly available 7Scenes dataset and our own industrial components dataset. In Figure 6, we considered the office scene in 7scenes as a test sample, which contains a desk and a chair, and the corresponding image is displayed in the second column of Figure 4. In Figure 7, we used an industrial component as a test sample, and the point cloud characterized scanned industrial parts in a complex workshop background, the corresponding images being shown in the fourth column of Figure 4. When the two parts of the point cloud could form a complete point cloud, the corresponding parts could be overlapped as much as possible, and there was no large rotation error and translation error; thus, we considered that the point cloud registration had achieved preferable results. The results of our method were compared with those of the state-of-the-art methods mentioned above, as illustrated in Figure 6 and Figure 7 as well as Table 1. As shown in Table 1, on the 7Scenes dataset, RMSE(R) was greater than two in the traditional methods such as ICP [9], Go-ICP [10], and FPFH [12] + RANSAC [13]. It can also be observed in Figure 6b–d that the registration results obtained by methods ICP [9], Go-ICP [10], and FPFH + RANSAC [12] had a significant angular discrepancy with the target point cloud. Early deep learning methods such as PointNetLK [3] also produced a significant translation error, as shown in Figure 6e. Notably, DCP [16] exhibited the lowest accuracy among all evaluated methods with an RMSE(R) of 6.0744. Its registration result, as shown in Figure 6f, had substantial errors in both rotation matrix and translation vector. Our DAMF-Net approach achieved the highest accuracy among all methods as illustrated in Figure 6j, with RMSE(R) and RMSE(t) reaching 0.0109 and 0.0001, respectively, outperforming other partial point cloud registration methods such as PRNet [19], RPMNet [20], and the baseline method RIENet [6], whose chamfer distances were 8.7981, 6.5086, and 2.7058, respectively, higher than DAMF-Net’s result of 0.5674. To emphasize more clearly the improved accuracy of our method compared to RIENet (baseline), we show a top view of the measured sample in Figure 6k,l in which the green arrows mark the portion where RIENet had a larger rotation deviation than our method in alignment.
On the industrial components dataset, the performance of traditional methods remained poor, as shown in Table 1, where, for example, ICP [9] showed the highest RMSE(R) at 6.1539. Furthermore, it was observed that deep learning-based partial point cloud registration methods also failed to achieve satisfactory results on the industrial components dataset containing repetitive structures. For instance, the RMSE(R) of PRNet [19] increased from 0.1568 to 0.8901, while the values for RPMNet [20] and RIENet [6] also increased from 0.0781 and 0.0247 to 0.1878 and 0.2137, respectively. Figure 7 illustrate the registration results of industrial components to further evaluate the performance of different models. Figure 7 indicates that the registration performance of all selected methods on industrial components was slightly inferior compared to that on the 7Scenes dataset. However, for 3D object defect detection, it is crucially important to reconstruct the 3D model of the target object with high precision, as any minor registration deviation could lead to the incorrect identification of defects.
Our DAMF-Net achieved the smallest RMSE(R) among all methods, reaching 0.0109 and 0.0116 on the 7Scenes and industrial components datasets, respectively. The error in the translation vector RMSE(t) was also the lowest with a value of 0.0001. Notably, the performance of our DAMF-Net on the industrial components dataset with a complex workshop background, which had a significant domain difference from the training set, was very close to the results on the 7Scenes dataset. This demonstrates the good generalization ability of DAMF-Net. We also show side views of the tested samples in Figure 7k,l, in which the green arrows indicate that RIENet had a larger translation deviation than our method in alignment.
Initially, the traditional methods yielded relatively poor results, indicating that even though these methods achieve satisfactory outcomes on dataset with distinct geometric features, such as ModelNet40 [7], their performance deteriorates on more complex scene datasets, particularly those with repetitive geometric structures like 7Scenes. Some deep learning-based point cloud registration methods, such as PointNetLK [3] and DCP [16], even underperform compared to traditional methods. We believe this phenomenon arises because these network architectures are primarily designed for the registration of complete point clouds, whereas in our context, only a subset of the source and target point clouds correspond to each other. It is also noticeable that the performance of all selected methods on the industrial components dataset was even poorer than on the 7Scenes dataset, including those methods based on deep learning for partial point cloud registration like RPMNet [20] and PRNet [19]. The baseline method RIENet [6] demonstrated good performance on the 7Scenes dataset, with RMSE(R) and RMSE(t) values reaching 0.0247 and 0.0001, respectively. However, these values increased to 0.2137 and 0.0006 on the industrial components dataset. This indicates that RIENet [6] cannot generalize well to few-shot industrial scene datasets. We believe this is due to the repetitive planar structures in industrial components being far more common than those in the 7Scenes dataset, and also because of the huge domain gap between the 7Scenes and industrial components datasets. Despite the significant discrepancy between the industrial components dataset used during testing and the public dataset employed during the training phase, our DAMF-Net still achieved remarkably proximate RMSE(R) values of 0.0109 and 0.0116 on the public dataset and industrial components dataset, respectively. This demonstrates that our DAMF-Net possesses strong domain adaptation capabilities and also achieves good results in industrial scenes with a large number of planar repetitive structures.

4.4. Ablation Experiments

4.4.1. The Effectiveness of Key Components

We conducted ablation experiments on two key components of our model: the point-guided two-stage multimodal feature fusion module (P2MF) and the gradient-inverse domain-adaptation module (GIDA), using the RIENet [6] model as our baseline (BS), which only uses point cloud data for registration. BS + P2MF represents the model that incorporated image information on the basis of the baseline, while BS + P2MF + GIDA indicates that the domain-adaptive module was added to enhance the generalization of the model. For the 7Scenes dataset, we consistently used five scenes (Redkitchen, Stairs, Head, Chess, and Pumpkin) as the training set and conducted experiments on the Fire scene for all models in the ablation experiments. To prevent the baseline model and BS + P2MF model from underperforming due to unfamiliarity with the target domain samples (industrial components on a pure plate background), we pretrained these models on the 7Scenes dataset and then fine-tuned them on the target domain for 50 epochs before comparing them with the BS + P2MF + GIDA model. For the industrial components dataset, we trained the model for 100 epochs on the training set comprising 7Scenes and pure background components with the combination of registration loss and domain adaptation loss as the loss function. Subsequent testing was conducted directly on industrial components acquired in complex workshop backgrounds. Both the baseline model and BS + P2MF model utilized only the registration loss as their loss function.
Table 2 lists the registration results of three models of BS, BS + P2MF and BS + P2MF + GIDA to evaluate the contribution of the P2MF and GIDA modules. Table 2 illustrates that on the 7Scenes dataset, the marginal enhancement provided by the P2MF module over the baseline model was pivotal for achieving high precision in 3D defect detection, with RMSE(R) being reduced from 0.0254 to 0.0142. Conversely, the baseline model exhibited suboptimal performance on the industrial components dataset. The BS + P2MF module significantly improved the accuracy of the baseline model on industrial components, diminishing RMSE(R) from 0.2507 to 0.0735. Despite the application of fine-tuning, the accuracy attained on the industrial components dataset did not align with that of publicly available 7Scenes datasets. Specifically, after fine-tuning on the industrial components dataset, the baseline achieved an RMSE(R) of 0.2507, which was substantially higher than its performance on the 7Scenes dataset. When the baseline was supplemented with the P2MF module (BS + P2MF), RMSE(R) significantly reduced to 0.0735. However, this result was still markedly inferior to the outcomes observed on the 7Scenes dataset at 0.0109. Our proposed DAMF-Net further enhanced the accuracy without the necessity for fine-tuning. This was evidenced by a reduction in RMSE(R) to 0.0116 and in RMSE(t) to 0.0001. We also present the image of a test sample and the results of the point cloud registration using BS, BS + P2MF, and BS + P2MF + GIDA in Figure 8. We highlight the regions in Figure 8 with green boxes where BS and BS + P2MF were poorly aligned compared to our method.

4.4.2. Combination of Different Point Cloud and Image Backbones

We tested different point cloud and image backbones for feature extraction to verify that the combination of backbones selected for our model (DGCNN for point cloud and ResNet for image) was the best performing one. As shown in Table 3, it was noted that the combination of PointNet as the point cloud backbone and ResNet as the image backbone yielded the least favorable results on both the 7Scenes dataset and the industrial components dataset. Specifically, on the 7Scenes dataset, the RMSE(R) and RMSE(t) were 2.2217 and 0.0166, respectively, while on the industrial components dataset, the above two values were 3.1183 and 0.0747, respectively. The highest registration accuracy on both datasets was achieved when DGCNN was utilized as the point cloud backbone and ResNet as the image backbone, with RMSE(R) values of 0.0109 and 0.0116 on the 7Scenes and industrial components datasets, respectively. As for the reason why the pairing of PointNet and ResNet did not yield optimal results, we attribute this to the fact that PointNet’s max pooling operation directly extracts features from the entire point cloud, whereas PointNet++ and DGCNN take the local structure of the point cloud into consideration. Furthermore, powerful image feature extractor such as ViT did not achieve the best outcomes. We believe this is due to ResNet’s streamlined network architecture being more adaptable to tasks with few-shot problems.

4.4.3. The Effectiveness of Fusion Style in Two-Stage Feature Fusion

We conducted ablation experiments on different fusion styles in the feature fusion module. As shown in Figure 9, CA denotes the fusion features of the direct output of the cross-attention, that is, without subsequent concatenating and MLP fusion operations. We use C to represent the initial fusion result, obtained by directly concatenating point cloud features and CA. (C, MLP) represents the feature vector acquired from the MLP fusion of the above concatenated vectors (C). (C, MLP, ⨁) represents the addition of point features extracted from DGCNN and features (C, MLP) in the form of skip connections. In addition, because of the low accuracy of the direct C operation without the MLP, we removed the C operation to verify whether inputting the output of CA directly into the MLP yielded higher accuracy. MLP represents the operation where C was not performed, and the output of CA was directly fed into MLP. (MLP, ⨁) represents the addition of features (MLP) and point features extracted from DGCNN.
As shown in Table 4, the lowest accuracy was attained through (C), with RMSE(R) on the 7Scenes and industrial components datasets at 0.0358 and 0.1196, respectively. The potential reason for this could be that the concatenated vector was not thoroughly integrated, and the interrelationship between the two vectors remained unlearned. Conversely, RMSE(R) attained by (CA) was slightly lower, recorded at 0.0167 and 0.0814 on both datasets. The test values of RMSE(R) for (MLP) were 0.0248 and 0.1049 on both datasets, and the test values of RMSE(R) for (MLP, ⨁) were 0.0136 and 0.0788. The results of the above two connection styles were slightly higher than those of (CA) and slightly lower than those of (C). Nevertheless, it was discovered that the incorporation of point cloud features into deep fusion features via a skip connection method (C, MLP, ⨁) could further enhance registration accuracy, achieving a 12% reduction in RMSE(R) compared to (C, MLP). This improvement can be attributed to the blurring of certain point cloud geometric information when subjected to the MLP for a deep fusion of concatenated features. Although image texture information can assist point cloud registration, point cloud registration should still predominantly rely on point cloud geometric data. Therefore, in the final phase, the emphasis on point cloud information through skip connections serves to substantially increase the network’s accuracy.

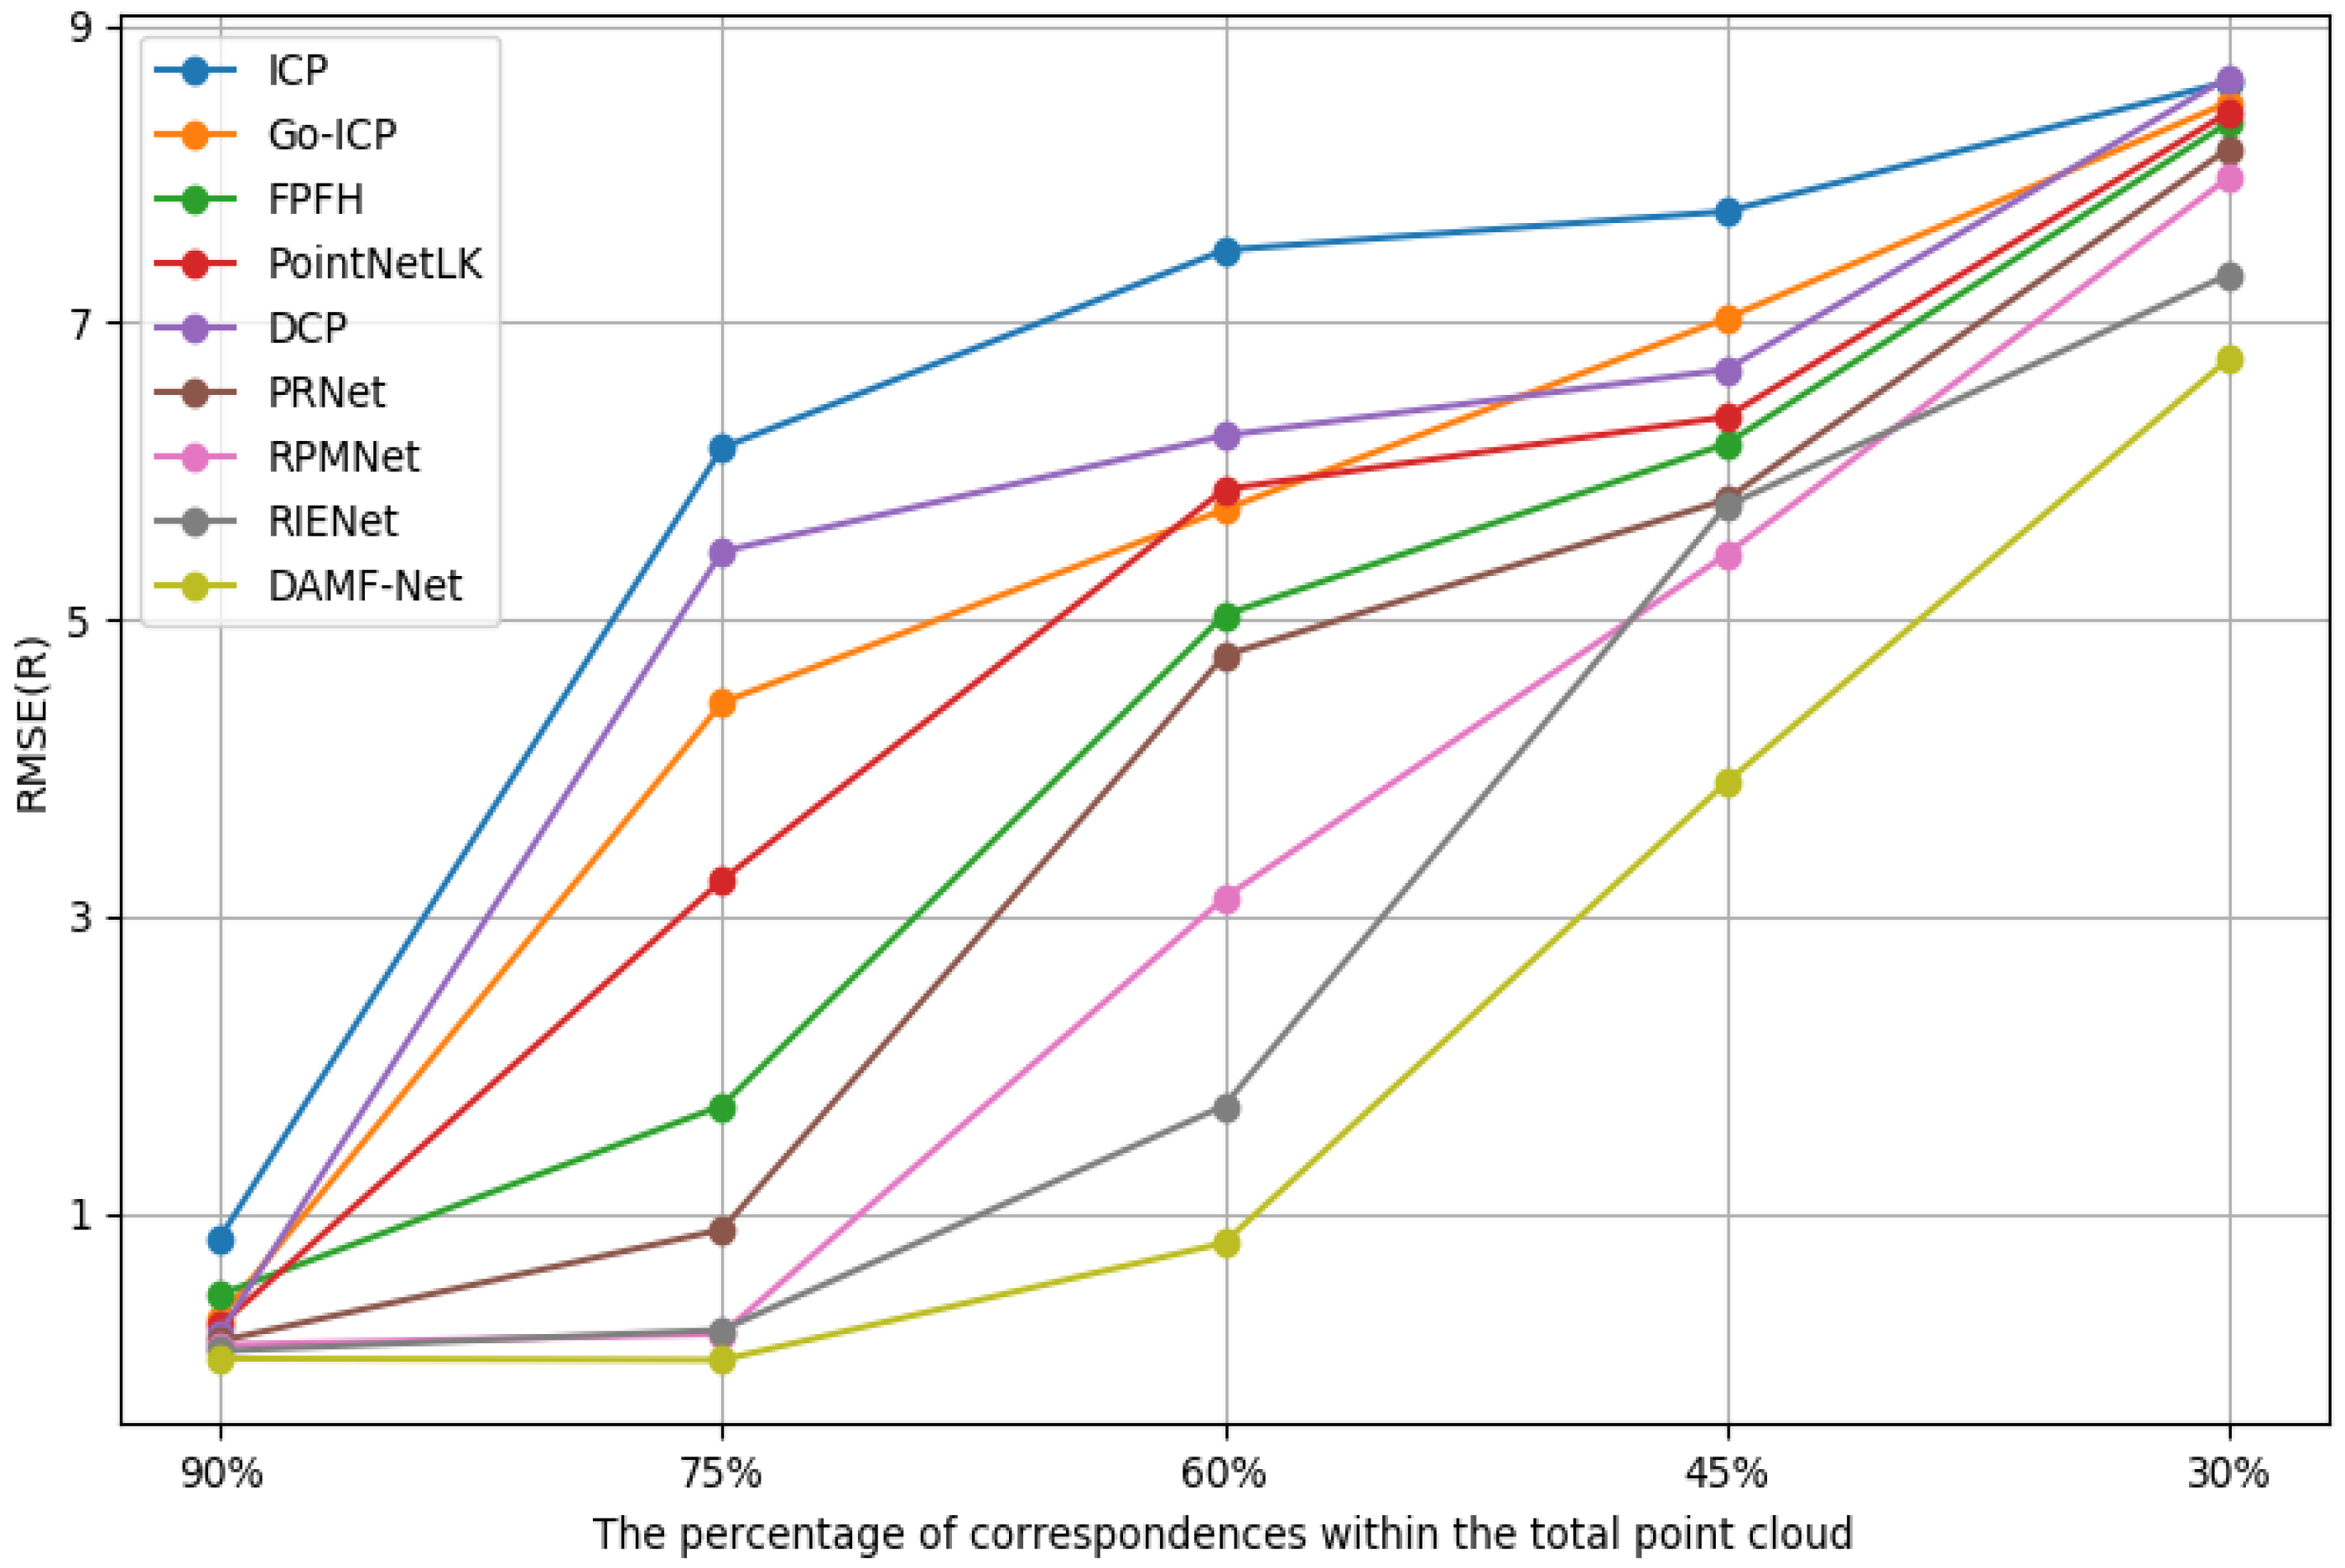
4.4.4. Ablation Study on the Number of Correspondences

As shown in Figure 10, we conducted an ablation study on the number of correspondences, setting the number of corresponding points to the values that accounted for 90%, 75%, 60%, 45%, and 30% of the total number of points, respectively. It was observed that when a high proportion (90%) of corresponding points was present, all methods achieved high registration accuracy, with RMSE(R) values below 1.5. However, as the number of correspondences decreased to 75%, the RMSE(R) of traditional methods such as ICP [9] surged from 1.1 to 8.7, and DCP [16] increased from 0.07 to 6.9. Meanwhile, for the partial point cloud registration methods, our DAMF-Net, along with RIENet [6] and RPMNet [20], still achieved commendable accuracy with all RMSE(R) values kept below two. Furthermore, it was noted that our DAMF-Net exhibited stronger robustness to the number of correspondences compared to other methods even when the proportion of correspondences was reduced to 45%, as RMSE(R) was still maintained at 3.88. However, at extremely low overlap rates, our method also faced the issue of reduced accuracy. In the future, we will further refine our model to enhance accuracy in point cloud registration under low overlap conditions.

4.4.5. Ablation Study on the Robustness to Noise

We found that it was difficult to avoid motion blur with RGB-D cameras when capturing images as shown in Figure 11. In addition, due to the data structure of point clouds being composed of the position coordinates of points in space, it was difficult to avoid random errors. In order to explore the impact of motion blur in the images and random errors in point clouds on our model, we conducted the following two experiments.
Firstly, to test the impact of point cloud random error on our model, we referred to [6] to add Gaussian noise to industrial components’ point cloud. Specifically, we generated Gaussian noise with μ = 0 and σ = 0.5 and then clipped the noise to [ 1.0 , 1.0 ] like [6]. As shown in Table 5, after adding Gaussian noise, the accuracy of ICP and other registration methods had different degrees of degradation. For example, the RMSE(R) of PRNet on noisy dataset exceeded 1, and the value of ICP was 7.7306. While the RMSE(R) of our model increased with the addition of noise, it was still controlled within 0.1 (0.0920). Experiments demonstrated that our method was more robust to random error in point clouds compared to other commonly used point cloud registration methods.
Secondly, to test the impact of image quality on our model, we selected 15 blurred images and clear images in the 7Scenes [8] test dataset, respectively, and tested the model on both tiny datasets. In order to maintain test sample consistency, we selected the clear images from 20 adjacent frames of each blurred image. When testing our method on the blur samples, RMSE(R) was 0.0237, while the RMSE(R) on clear samples was 0.0103. This experiment showed that motion blur in images indeed affected the accuracy of point cloud registration.
To enhance the robustness of the model to motion blurred images, we added some motion blur noise on the training dataset. We sampled the training set at a ratio of 0.1 and added motion blur noise to it. Although some samples in the training dataset already contained motion blur noise, we believed that adding a greater degree of motion blur noise to the training set could enhance the model’s robustness to minor motion blur.
In Figure 12, we present the comparison of images before and after adding motion blur noise to the Chess samples in the training dataset. The motion blur was implemented by using the filter2d function from the cv2 library in Python. The first row of the Figure 12 illustrates the clear sample and the corresponding sample with motion blur noise, respectively. The left figure of the second row illustrates a blurred sample from the original dataset, the right figure is the counterpart with additional noise. We posited that augmenting a subset of training images with greater levels of noise could enhance the robustness of the model when testing with examples containing subtle noise. Consequently, we trained the model on the dataset with motion blur noise and then tested it in office scenarios. We found that RMSE(R) was decreased by 0.00016 compared to the case without the addition of blur noise. Although the effect of adding blur noise on the model enhancement was relatively small, we will continue to introduce the blur noise in our subsequent work and explore the most efficient way of adding noise to enhance the robustness of the model to motion blur.

5. Conclusions

We introduced a domain-adaptive multimodal feature fusion method named DAMF-Net for partial point cloud registration. In the case of a large number of repeated planar structures in the scene, it is difficult to extract the discriminant features for point matching solely by relying on the geometric information of the point cloud. Therefore, we integrated the texture information from images into the point cloud. We utilized a point-guided two-stage multimodal feature fusion module to enrich the geometric information of point clouds with the texture information contained in images, for addressing the challenge of point cloud registration in planar components characterized by a lack of texture information. Moreover, neural networks trained on public datasets often struggle to generalize to datasets in different domains; therefore, we diminished the feature extractor’s discriminative ability between source and target domain samples through a gradient-inverse domain-aware module, enabling model generalization from publicly available datasets to industrial scenario datasets, thereby improving the registration accuracy of industrial components.
In order to demonstrate the effectiveness of our proposed method, we conducted comparison experiments with today’s most popular point cloud registration methods. Our experiments demonstrated that DAMF-Net outperformed state-of-the-art point cloud registration methods in registration accuracy on both the 7Scenes public dataset and our industrial components dataset. We explain the superiority of our method from two quantifiable perspectives. Firstly, our approach integrated texture information from images into the conventional point cloud registration methods, resulting in an RMSE(R) of 0.0109 on the 7Scenes public dataset, which was lower than the result of the baseline model RIENet of 0.0247 and much lower than those of traditional methods such as ICP (2.7752) and deep learning methods such as PointNetLK (1.1554). Secondly, we introduced a domain-adaptive module into our model to address the challenge of model generalization. RIENet achieved an RMSE(R) of 0.2137 on industrial components dataset which was higher than the test result of 0.0247 on the 7Scenes dataset. However, our method kept the RMSE(R) within 0.0116, which was very close to the test result of 0.0109 on the 7scenes dataset. In addition, we conducted ablation experiments on two core modules (P2MF and GIDA) to demonstrate that our proposed method could effectively introduce the texture information of images to assist point cloud registration and avoid the problem of a difficult generalization of the model. Our approach provides a high-precision point cloud registration framework for few-shot planar industrial components, and it also eliminates the need for ground-truth rigid transformations. We also explored the factors affecting the effectiveness of the model, such as the image and point cloud backbones, the fusion styles of multimodal features, as well as the number of corresponding points.
We further analyzed the effect of the quality of the image and the point cloud on the registration results. We found that our method was more robust to random errors in point clouds but was more susceptible to blurring noise on images. The result in our experiments showed that the quality of images significantly affected the efficacy of models in tasks related to multimodal feature fusion. However, in industrial cases, many images collected on-site inevitably suffer from blurriness, dim lighting, or even overexposure issues. In our future work, we aim to exert stricter control over image quality and explore adaptive image preprocessing methods within the multimodal fusion process to address these challenges. In addition, our model did not perform well in point cloud registration under extremely low overlap rates, which will be a direction for future improvements in our model.

Author Contributions

All the authors made significant contributions to this work. H.Z., B.D. and J.S. designed the framework of the network and performed the experiments; H.Z. and B.D. prepared the training dataset; H.Z., B.D. and J.S. analyzed the results; H.Z. and J.S. wrote the original draft of the paper; H.Z. and B.D. revised the paper; H.Z. acquired the funding support; B.D. provided the field data; H.Z. supervised the work. All authors have read and agreed to the published version of the manuscript.

Funding

This research was funded by the National Key R&D Program of China under grant number 2021YFA0716901, the National Natural Science Foundation of China under grant number 41974132 and the Fundamental Research Funds for the Central Universities under grant number xzy012023050.

Data Availability Statement

Data availability statement: the 7Scenes dataset come from 3DMatch data (https://3dmatch.cs.princeton.edu/ (accessed on 12 April 2023)).

Acknowledgments

The authors would like to thank Zeng Andy and Song Shuran et al. for the open model 3DMatch and the open data. We would also like to acknowledge the open-source code of RIENet (https://github.com/supersyq/RIENet/ (accessed on 11 October 2023)) and open-source code of IMFNet (https://github.com/XiaoshuiHuang/IMFNet/ (accessed on 4 October 2023)).

Conflicts of Interest

Author Bin Dong was employed by the company Shaanxi Darerobot Intelligent Technology Co., Ltd. The remaining authors declare that the research was conducted in the absence of any commercial or financial relationships that could be construed as a potential conflict of interest.

Abbreviations

The following abbreviations are used in this manuscript:
3DThree dimensional
RGB-DRed green blue-depth
RMSERoot mean square error
PFHPoint feature histogram
FPFHFast point feature histogram
SVDSingular value decomposition
CNNConvolutional neural network
2DTwo dimensional
BEVBird’s eye view
MLPMultilayer perceptron
ADAMAdaptive moment estimation

References

  1. Tulbure, A.; Dulf, E. A review on modern defect detection models using DCNNs—Deep convolutional neural networks. J. Adv. Res. 2022, 35, 33–48. [Google Scholar] [CrossRef] [PubMed]
  2. Zhang, Z.; Dai, Y.; Sun, J. Deep learning based point cloud registration: An overview. Virtual Real. Intell. Hardw. 2020, 2, 222–246. [Google Scholar] [CrossRef]
  3. Aoki, Y.; Goforth, H.; Srivatsan, R.A.; Lucey, S. Pointnetlk: Robust & efficient point cloud registration using pointnet. In Proceedings of the IEEE/CVF Conference on Computer Vision and Pattern Recognition, Long Beach, CA, USA, 16–20 June 2019; pp. 7163–7172. [Google Scholar]
  4. Li, X.; Wang, L.; Fang, Y. Unsupervised category-specific partial point set registration via joint shape completion and registration. IEEE Trans. Vis. Comput. Graph. 2023, 29, 3251–3265. [Google Scholar] [CrossRef]
  5. Afham, M.; Dissanayake, I.; Dissanayake, D.; Dharmasiri, A.; Thilakarathna, K.; Rodrigo, R. Crosspoint: Self-supervised cross-modal contrastive learning for 3d point cloud understanding. In Proceedings of the IEEE/CVF Conference on Computer Vision and Pattern Recognition, New Orleans, LA, USA, 21–24 June 2022; pp. 9902–9912. [Google Scholar]
  6. Shen, Y.; Hui, L.; Jiang, H.; Xie, J.; Yang, J. Reliable inlier evaluation for unsupervised point cloud registration. In Proceedings of the AAAI Conference on Artificial Intelligence, Virtual, 22 February–1 March 2022; pp. 2198–2206. [Google Scholar]
  7. Wu, Z.; Song, S.; Khosla, A.; Yu, F.; Zhang, L.; Tang, X.; Xiao, J. 3D shapenets: A deep representation for volumetric shapes. In Proceedings of the IEEE/CVF International Conference on Computer Vision, Boston, MA, USA, 7–12 June 2015; pp. 1912–1920. [Google Scholar]
  8. Zeng, A.; Song, S.; Nießner, M.; Fisher, M.; Xiao, J.; Funkhouser, T. 3DMatch: Learning local geometric descriptors from RGB-D reconstructions. In Proceedings of the IEEE/CVF Conference on Computer Vision and Pattern Recognition, Honolulu, HI, USA, 21–26 July 2017; pp. 1802–1811. [Google Scholar]
  9. Besl, P.J.; McKay, N.D. Method for registration of 3-D shapes. IEEE Trans. Pattern Anal. Mach. Intell. 1992, 14, 239–256. [Google Scholar] [CrossRef]
  10. Yang, J.; Li, H.; Campbell, D.; Jia, Y. Go-ICP: A globally optimal solution to 3D ICP point-set registration. IEEE Trans. Pattern Anal. Mach. Intell. 2016, 38, 2241–2254. [Google Scholar] [CrossRef] [PubMed]
  11. Rusu, R.B.; Blodow, N.; Marton, Z.C.; Beetz, M. Aligning point cloud views using persistent feature histograms. In Proceedings of the 2008 IEEE/RSJ International Conference on Intelligent Robots and Systems, Nice, France, 22–26 September 2008; pp. 3384–3391. [Google Scholar]
  12. Rusu, R.B.; Blodow, N.; Beetz, M. Fast point feature histograms (FPFH) for 3D registration. In Proceedings of the 2009 IEEE International Conference on Robotics and Automation, Kobe, Japan, 12–17 May 2009; pp. 3212–3217. [Google Scholar]
  13. Fischler, M.A.; Bolles, R.C. Random sample consensus: A paradigm for model fitting with applications to image analysis and automated cartography. Commun. ACM 1981, 24, 381–395. [Google Scholar] [CrossRef]
  14. Lucas, B.D.; Kanade, T. An iterative image registration technique with an application to stereo vision. In Proceedings of the 7th International Joint Conference on Artificial Intelligence, Vancouver, BC, Canada, 24–28 August 1981; pp. 674–679. [Google Scholar]
  15. Qi, C.R.; Su, H.; Mo, K.; Guibas, L.J. Pointnet: Deep learning on point sets for 3d classification and segmentation. In Proceedings of the IEEE/CVF Conference on Computer Vision and Pattern Recognition, Honolulu, HI, USA, 21–26 July 2017; pp. 652–660. [Google Scholar]
  16. Wang, Y.; Solomon, J.M. Deep closest point: Learning representations for point cloud registration. In Proceedings of the IEEE/CVF Conference on Computer Vision and Pattern Recognition, Seoul, Republic of Korea, 27 October–2 November 2019; pp. 3523–3532. [Google Scholar]
  17. Eckart, C.; Young, G. Approximation by superpositions of a given matrix and its transpose. Math. Control. Signals Syst. 1989, 2, 303–314. [Google Scholar]
  18. Zhang, Z.; Lyu, E.; Min, Z.; Zhang, A.; Yu, Y.; Meng, M.Q.-H. Robust Semi-Supervised Point Cloud Registration via Latent GMM-Based Correspondence. Remote Sens. 2023, 15, 4493. [Google Scholar] [CrossRef]
  19. Wang, Y.; Solomon, J.M. PRNet: Self-supervised learning for partial-to-partial registration. In Proceedings of the Advances in Neural Information Processing Systems 32 (NeurIPS 2019), Vancouver, BC, Canada, 8–14 December 2019. [Google Scholar]
  20. Yew, Z.J.; Lee, G.H. RPM-Net: Robust point matching using learned features. In Proceedings of the IEEE/CVF Conference on Computer Vision and Pattern Recognition, Virtual, 14–19 June 2020; pp. 11824–11833. [Google Scholar]
  21. Sinkhorn, R. Diagonal equivalence to matrices with prescribed row and column sums. Am. Math. Mon. 1967, 74, 402–405. [Google Scholar] [CrossRef]
  22. Han, T.; Zhang, R.; Kan, J.; Dong, R.; Zhao, X.; Yao, S. A Point Cloud Registration Framework with Color Information Integration. Remote Sens. 2024, 16, 743. [Google Scholar] [CrossRef]
  23. Wang, C.; Xu, D.; Zhu, Y.; Martin, R.; Lu, C.; Fei-Fei, L.; Savarese, S. DenseFusion: 6D object pose estimation by iterative dense fusion. In Proceedings of the IEEE/CVF Conference on Computer Vision and Pattern Recognition, Long Beach, CA, USA, 15–20 June 2019; pp. 3343–3352. [Google Scholar]
  24. LeCun, Y.; Boser, B.; Denker, J.S.; Henderson, D.; Howard, R.E.; Hubbard, W.; Jackel, L.D. Backpropagation Applied to handwritten zip code recognition. Neural Comput. 1989, 1, 541–551. [Google Scholar] [CrossRef]
  25. Xu, D.; Anguelov, D.; Jain, A. PointFusion: Deep sensor fusion for 3D bounding box estimation. In Proceedings of the IEEE/CVF Conference on Computer Vision and Pattern Recognition, Salt Lake City, UT, USA, 18–22 June 2018; pp. 244–253. [Google Scholar]
  26. Sindagi, V.A.; Zhou, Y.; Tuzel, O. MVX-Net: Multimodal voxelNet for 3D object detection. In Proceedings of the 2019 International Conference on Robotics and Automation (ICRA), Montreal, QC, Canada, 20–24 May 2019; pp. 7276–7282. [Google Scholar]
  27. Ren, S.; He, K.; Girshick, R.; Sun, J. Faster R-CNN: Towards real-time object detection with region proposal networks. In Proceedings of the Advances in Neural Information Processing Systems (NeurIPS), Montreal, QC, Canada, 7–12 December 2015; pp. 91–99. [Google Scholar]
  28. Zhou, Y.; Tuzel, O. VoxelNet: End-to-end learning for point cloud based 3D object detection. In Proceedings of the IEEE/CVF Conference on Computer Vision and Pattern Recognition, Salt Lake City, UT, USA, 18–22 June 2018; pp. 4490–4499. [Google Scholar]
  29. Xu, X.; Dong, S.; Xu, T.; Ding, L.; Wang, J.; Jiang, P.; Song, L.; Li, J. FusionRCNN: LiDAR-camera fusion for two-stage 3D object detection. Remote Sens. 2023, 15, 1839. [Google Scholar] [CrossRef]
  30. Luo, Z.; Zhou, C.; Pan, L.; Zhang, G.; Liu, T.; Luo, Y.; Zhao, H.; Liu, Z.; Lu, S. Exploring point-BEV fusion for 3D point cloud object tracking with transformer. IEEE Trans. Pattern Anal. Mach. Intell. 2024, 1, 1–15. [Google Scholar] [CrossRef] [PubMed]
  31. Bińkowski, M.; Sutherland, D.J.; Arbel, M.; Gretton, A. Demystifying mmd gans. arXiv 2018, arXiv:1801.01401. [Google Scholar]
  32. Sun, B.; Saenko, K. Deep coral: Correlation alignment for deep domain adaptation. In Proceedings of the Computer Vision—ECCV 2016Workshops, Amsterdam, The Netherlands, October 8–10 and 15–16, 2016, Proceedings, Part III 14; Springer International Publishing: Berlin/Heidelberg, Germany, 2016; pp. 443–450. [Google Scholar]
  33. Goodfellow, I.; Pouget-Abadie, J.; Mirza, M.; Xu, B.; Warde-Farley, D.; Ozair, S.; Courville, A.; Bengio, Y. Generative adversarial nets. In Proceedings of the Advances in Neural Information Processing Systems (NeurIPS), Montreal, QC, Canada, 8–13 December 2014. [Google Scholar]
  34. Ganin, Y.; Ustinova, E.; Ajakan, H.; Germain, P.; Larochelle, H.; Laviolette, F.; March, M.; Lempitsky, V. Domain-adversarial training of neural networks. J. Mach. Learn. Res. 2016, 17, 1–35. [Google Scholar]
  35. Zhou, X.; Karpur, A.; Gan, C.; Luo, L.; Huang, Q. Unsupervised domain adaptation for 3D keypoint estimation via view consistency. In Proceedings of the European Conference on Computer Vision (ECCV), Munich, Germany, 8–14 September 2018; pp. 137–153. [Google Scholar]
  36. Qin, C.; You, H.; Wang, L.; Kuo, C.-C.J.; Fu, Y. PointDAN: A multi-scale 3D domain adaption network for point cloud representation. In Proceedings of the Advances in Neural Information Processing Systems (NeurIPS), Vancouver, BC, Canada, 8–14 December 2019. [Google Scholar]
  37. Wang, Y.; Sun, Y.; Liu, Z.; Sarma, S.E.; Bronstein, M.M.; Solomon, J.M. Dynamic graph CNN for learning on point clouds. In Proceedings of the IEEE/CVF Conference on Computer Vision and Pattern Recognition, Long Beach, CA, USA, 16–20 June 2019; pp. 6418–6427. [Google Scholar]
  38. He, K.; Zhang, X.; Ren, S.; Sun, J. Deep residual learning for image recognition. In Proceedings of the IEEE/CVF Conference on Computer Vision and Pattern Recognition, Las Vegas, NV, USA, 27–30 June 2016; pp. 770–778. [Google Scholar]
  39. Vaswani, A.; Shazeer, N.; Parmar, N.; Uszkoreit, J.; Jones, L.; Gomez, A.N.; Kaiser, Ł.; Polosukhin, I. Attention is all you need. In Proceedings of the Advances in Neural Information Processing Systems (NeurIPS), Long Beach, CA, USA, 4–9 December 2017. [Google Scholar]
  40. Lin, T.Y.; Goyal, P.; Girshick, R.; He, K. Focal loss for dense object detection. In Proceedings of the IEEE/CVF Conference on Computer Vision and Pattern Recognition (CVPR), Salt Lake City, UT, USA, 18–22 June 2018; pp. 2980–2988. [Google Scholar]
  41. Huang, X.; Qu, W.; Zuo, Y.; Fang, Y.; Zhao, X. IMFNet: Interpretable multimodal fusion for point cloud registration. IEEE Robot. Autom. Lett. 2022, 7, 12323–12330. [Google Scholar] [CrossRef]
  42. Kingma, D.P.; Ba, J. Adam: A Method for Stochastic Optimization. In Proceedings of the International Conference on Learning Representations (ICLR), San Diego, CA, USA, 7–9 May 2014. [Google Scholar]
  43. Yuan, M.; Fu, K.; Li, Z.; Meng, Y.; Wang, M. PointMBF: A multi-scale bidirectional fusion network for unsupervised RGB-D point cloud registration. In Proceedings of the IEEE/CVF International Conference on Computer Vision, Vancouver, BC, Canada, 18–22 June 2023; pp. 17694–17705. [Google Scholar]
  44. Dosovitskiy, A.; Beyer, L.; Kolesnikov, A.; Weissenborn, D.; Zhai, X.; Unterthiner, T.; Dehghani, M.; Minderer, M.; Heigold, G.; Gelly, S. An image is worth 16x16 words: Transformers for image recognition at scale. arXiv 2020, arXiv:2010.11929. [Google Scholar]
  45. Qi, C.R.; Yi, L.; Su, H.; Guibas, L.J. Pointnet + +: Deep hierarchical feature learning on point sets in a metric space. Adv. Neural Inf. Process. Syst. 2017, 30, 5105–5114. [Google Scholar]
Figure 1. Illustration of different texture information and similar geometric information. As depicted in the figure, corresponding regions in point clouds and images are denoted by the same color. Registration based solely on point clouds is challenging as both the orange and blue boxed areas exhibit planar structures, making them indistinct. However, their corresponding images reveal significant differences in the scratches within the orange and blue boxes, facilitating easier identification.
Remotesensing 16 01993 g001
Figure 2. Illustration of why texture information can assist correspondence estimation of a typical industrial component. As shown in the figure, when performing correspondence estimation based solely on the point cloud structure, it is easy to produce false matches due to similar geometric information in the two neighborhoods. If the texture information of the image is used to assist correspondence estimation, the occurrence of false matches will be reduced.
Remotesensing 16 01993 g002
Figure 3. An overview of DAMF-Net.
Remotesensing 16 01993 g003
Figure 4. The visualization of training and test dataset. We used six scenes from the 7Scenes dataset as training dataset and one scene as test set. The industrial components dataset was divided into two parts: the pure background plate dataset and complex workshop background dataset.
Remotesensing 16 01993 g004
Figure 5. The division of datasets. For the experiments on 7Scenes, we used Chess, Pumpkin, Redkitchen, Heads, Stairs, and Fires to form the training set, where the first five scenes were used as the source domain samples, Fires was used as the target domain samples, and Office was used as the test set. As for the experiments on the industrial components dataset, we used the entire 7Scenes dataset as the source domain samples for the training set, the pure background plate dataset from industrial components as the target domain samples, and components acquired from a complex workshop as the test set.
Remotesensing 16 01993 g005
Figure 6. Visualization of registration results on the 7Scenes datasets. Green: source point clouds. Blue: target point clouds. Red: registration results.
Remotesensing 16 01993 g006
Figure 7. Visualization of registration results on the industrial components datasets. Green: source point clouds. Blue: target point clouds. Red: registration results.
Remotesensing 16 01993 g007
Figure 8. Visualization of the effectiveness of key components. Blue: target point clouds. Red: registration results.
Remotesensing 16 01993 g008
Figure 9. Six fusion styles for multimodal feature fusion.
Remotesensing 16 01993 g009
Figure 10. The RMSE of the Euler angle of selected models with different numbers of correspondences on the industrial components dataset.
Remotesensing 16 01993 g010
Figure 11. Illustration of motion blur samples and clear samples: the top panel shows blurred samples, and the bottom panel shows the corresponding clear samples.
Remotesensing 16 01993 g011
Figure 12. Illustration of the effect of adding motion blur noise to the training dataset.
Remotesensing 16 01993 g012
Table 1. The registration results of different methods on 7Scenes and industrial components datasets. The bold fonts indicate the best results in all methods.
Model7ScenesIndustrial Components
RMSE(R)RMSE(t)CDRMSE(R)RMSE(t)CD
ICP2.77520.027119.17956.15390.239139.0656
Go-ICP5.11330.382338.45634.43890.071826.6444
FPFH + RANSAC2.14040.038213.40471.72530.022712.9046
PointNetLK1.15540.026910.90583.24350.031121.4798
DCP6.07440.218341.72165.45620.181135.4356
PRNet0.15680.00218.79810.89010.01579.0159
RPMNet0.07810.00196.50860.18780.00144.6819
RIENet0.02470.00012.70580.21370.00063.4755
Ours0.01090.00010.56740.01160.00010.0497
Table 2. The registration results of different combinations of key components. The bold fonts indicate the best results in all methods.
Model7ScenesIndustrial Components
RMSE(R)RMSE(t)CDRMSE(R)RMSE(t)CD
BS0.02540.00023.69720.25070.00094.2145
BS + P2MF0.01420.00010.84730.07350.00031.8095
BS + P2MF + GIDA0.01090.00010.56740.01160.00010.0497
Table 3. The registration results under different point cloud and image backbones. The bold fonts indicate the best results in all methods.
Point BackboneImage Backbone7ScenesIndustrial Components
RMSE(R)RMSE(t)RMSE(R)RMSE(t)
PointNetVGG0.88730.00240.97950.0006
ViT-B [44]1.75900.00181.51400.0095
ResNet2.22170.01663.11830.0747
PointNet++ [45]VGG1.67180.00392.52710.0082
ViT-B0.24290.00050.10900.0001
ResNet0.56010.00040.96780.0031
DGCNNVGG0.18640.00070.02250.0001
ViT-B0.18340.00120.71590.0034
ResNet0.01090.00010.01160.0001
Table 4. The registration results under different fusion styles. The bold fonts indicate the best results in all methods.
Connection Style7ScenesIndustrial Components
RMSE(R)RMSE(t)RMSE(R)RMSE(t)
CA0.01670.00010.08140.0001
C0.03580.00020.11960.0001
C, MLP0.01240.00010.05320.0002
MLP0.02480.00010.10490.0002
MLP, ⨁0.01360.00010.07880.0001
C, MLP, ⨁0.01090.00010.01160.0001
Table 5. The impact of point cloud noise on registration accuracy on industrial components. The bold fonts indicate the best results in all methods.
ModelOriginal DatasetNoisy Dataset
RMSE(R)RMSE(t)RMSE(R)RMSE(t)
ICP6.15390.23917.73060.3674
Go-ICP4.43890.07184.95960.0742
FPFH + RANSAC1.72530.02272.16450.0293
PointNetLK3.24350.03113.50380.0536
DCP5.45620.18115.95720.1703
PRNet0.89010.01571.33920.0285
RPMNet0.18780.00140.31420.0037
RIENet0.21370.00060.35190.0008
Ours0.01160.00010.09200.0002
Disclaimer/Publisher’s Note: The statements, opinions and data contained in all publications are solely those of the individual author(s) and contributor(s) and not of MDPI and/or the editor(s). MDPI and/or the editor(s) disclaim responsibility for any injury to people or property resulting from any ideas, methods, instructions or products referred to in the content.

