1. Introduction
Stellar occultation is an advanced space-based detection technique suitable for the atmospheric detection in near space. This technique uses the absorption characteristics of the stellar spectrum through Earth’s atmosphere to detect the middle and upper atmosphere. The technique has the advantages of global coverage and a large amount of detection data. The main parameters of the detection are atmospheric trace component density, temperature, aerosol, and so on [
1]. The stellar occultation measurement technique plays an irreplaceable role in the study of space environment change and the monitoring of atmospheric composition.
The stellar occultation technique was first proposed by Smith and Hunten to detect the number density profile of the ozone in Earth’s atmosphere [
2]. In 1970 and 1971, NASA used OAO-2 to directly detect the maximum concentration of the mesosphere ozone for the first time [
3], and to obtain the nighttime distribution of molecular oxygen and ozone in the lower thermosphere and upper mesosphere [
4], demonstrating the feasibility of this technique. In 2002, the ESA started the practice of the stellar occultation technique, and GOMOS is the first space instrument to use the stellar occultation technique to specifically detect the trace component density of Earth’s atmosphere [
5], which mainly focuses on the global ozone content distribution and monitors other trace components, including nitrogen dioxide and water vapor [
6].
The proportion of oxygen in the atmosphere below the altitude of 80 km is stable at 20.947% [
7], and it has a uniform distribution from the stratosphere to the mesosphere; thus, the total air density can be calculated based on the oxygen density. There are currently no stellar occultation instruments dedicated to detecting oxygen density. However, there are some solar occultation instruments that have performed oxygen density detection, mainly using the absorption characteristics of the 761 nm oxygen absorption A-band. In 1993 and 1998, NASA launched the POAM II and POAM III solar occultation instruments, respectively, carrying photometers with a central wavelength of 761.3 nm and a bandwidth of 2.3 nm, specifically for the detection of oxygen density. The ILAS solar occultation instrument, operated by the Japanese Environment Agency in 1996, obtained the atmospheric temperature and pressure by detecting the oxygen density, with an estimated error of about 4 K and 4% [
8]. The Canadian Space Agency’s ACE−MAESTRO solar occultation instrument, operating in 2003, obtained the total air density by measuring the oxygen density [
9]. The main principle of the above multi-band occultation detection methods is to use the global fitting technique to minimize the residual difference between the detected multi-band transmission and the multi-band transmission generated by the simulated numerical model and continuously adjust the temperature pressure and density values. In this way, the optimal density numerical solution can be obtained.
2. The Principle of Stellar Occultation
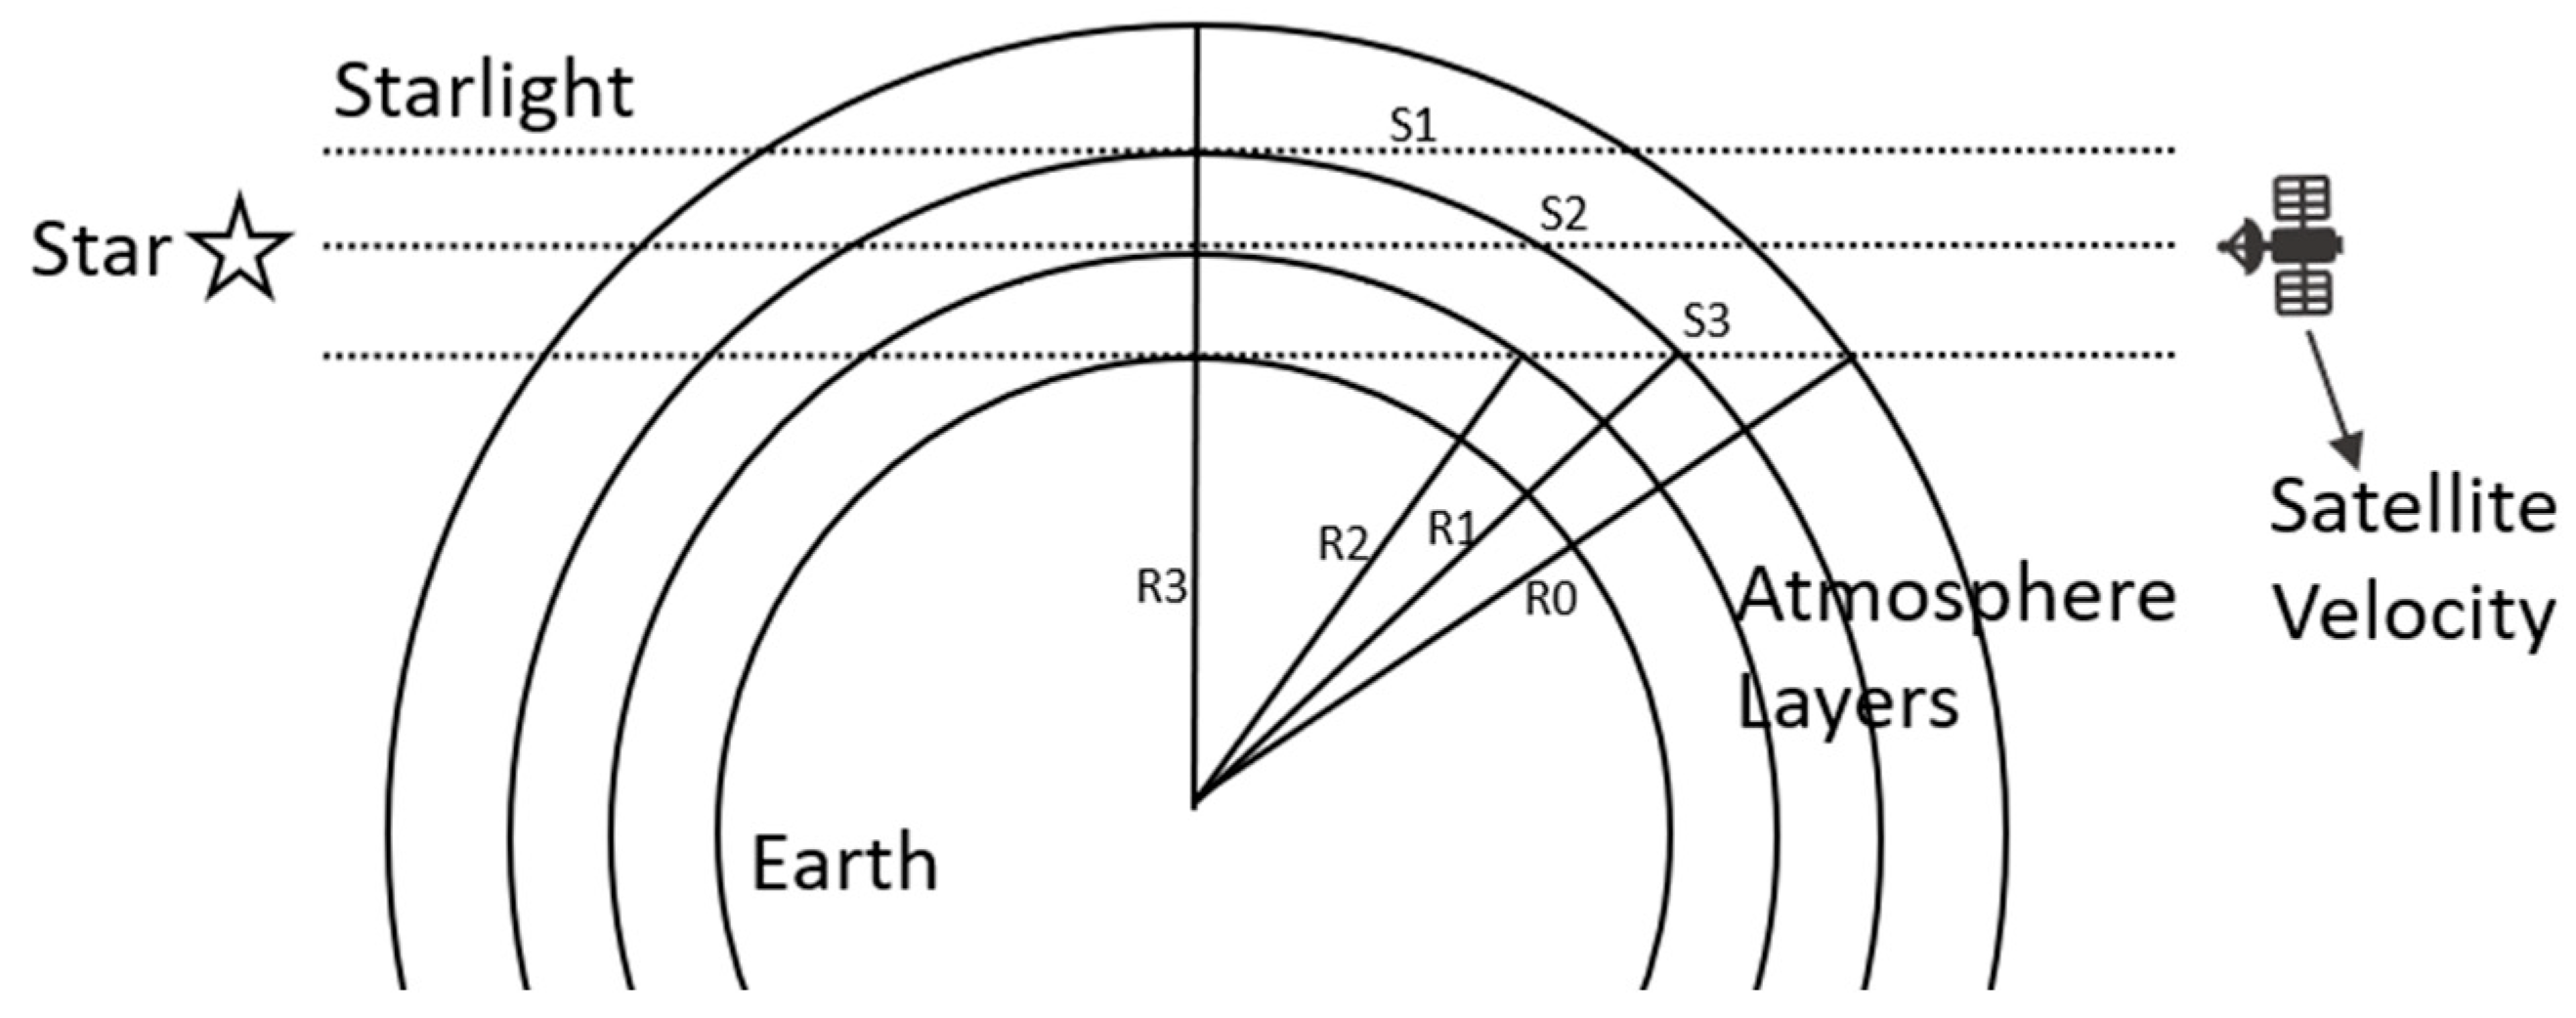
In a stellar occultation event, the star is viewed as a point source passing through the atmosphere. As the satellite orbits, starlight passes through the atmosphere at different altitudes and is collected by detectors on board the satellite (see
Figure 1). The spectral transmission changes due to the absorption and scattering at different tangent altitudes of the atmosphere, and parameters such as atmospheric component density can be retrieved by using these characteristics.
The tangent height is defined as the minimum distance from the star–satellite line to Earth’s surface. As the satellite orbits, the height of the tangent point decreases, the optical path of starlight through the atmosphere becomes longer, and the starlight intensity received by the detector decreases. The ratio of the attenuated spectrum passing through the atmosphere to the unattenuated spectrum is called the atmospheric spectral transmission:
where
λ is the wavelength of spectrum and
z is the tangent height.
F is the detected flux of star in different tangent height,
F0 is the unattenuated reference flux, and
Tobs is the observed transmission. According to the Beer–Lambert law:
where
τ is optical depth,
σ is absorption cross-section,
ρ is the density of atmospheric component, and
is the location along the light path. Optical depth is the product of cross-section and density integrated along the light path. The Beer–Lambert law is key to the retrieval. The onion-peeling method is also used to retrieve the density of atmospheric components [
10].
In this paper, in order to develop the new space-based air density sounding technique, the simulation data from the stellar occultation all-link forward model are used to perform retrieval studies for single-band spectrum sounding.
3. The Non-Iterative Retrieval Method
Due to the special characteristics of the absorption cross-section of some atmospheric components such as oxygen or water vapor, the concept of effective absorption cross-section and effective optical depth should be introduced in the retrieval process [
11]. As for the average transmission of oxygen A-band at 761 nm, the effective optical depth of each layer is calculated by using the onion-peeling algorithm.
The effective absorption cross-section with a given bandwidth is
, which is dependent on temperature
T, density
ρ, and path length
L. According to the characteristics of oxygen molecules absorption A-band at 761 nm, the average transmission detected by the instrument in this band is
where Δ
λ is the bandwidth and
λ is wavelength. The effective absorption cross-section
is
The effective optical depth is defined as
The concept of effective absorption cross-section was introduced in the retrieval process of solar occultation photometer POAM III, and the effective cross-section database was established. In the process of oxygen density retrieval, table lookup was performed [
12]. The value range of temperature variable in the database was set to 160 ≤
T ≤ 290 K, and the value range of oxygen number density variable was set to 10
18 ≤
NO2 ≤ 10
26 mol/cm
2. POAM III used the average transmission to obtain the effective optical depth, and the oxygen density was retrieved by looking up the table. The disadvantage of table lookup is relatively low precision.
In order to improve the precision of retrieval, the algorithm is improved in this paper. The lookup database is not created in advance. Instead, the oxygen density is gradually optimized by the bisection method. The oxygen density obtained by bisection is continually substituted into Equations (5) and (6) for the optical depth calculation. When the calculated optical depth is equal to the value detected by the instrument, it is regarded as the end of the retrieval and the oxygen density is obtained.
The following describes the process of the onion-peeling method. This method sees Earth’s atmosphere as spherically symmetric and uniformly layered, as shown in
Figure 1.
The distance between the upper boundary of the top atmospheric layer and the Earth center is R
0, the distance between the top starlight and the Earth center is
R1, and the distance between the
ith line and the Earth center is
Ri.
Si is half of the length of the light passing through the atmosphere. The
T in the retrieval process represents a priori temperature. The stratification is based on the heights of tangent points measured at each time. As shown in
Figure 1, it can be deduced that the oxygen number density of the highest layer is
The oxygen number density in the second layer is
The recursive equation can be obtained as follows:
According to the above equations, the vertical oxygen number density profile ρi of an occultation event can be calculated.
4. The Non-Iterative Retrieval Results
The transmission data of a stellar occultation event were calculated using the forward model [
13]. The model NRLMSISE00 results are the atmospheric parameter inputs to the forward model. NRLMSISE00 is a semiempirical atmospheric model that is an upgrade of the MSISE model series [
14]. In the retrieval process, the input NRLMSISE00 results are considered as the true values for the retrieval error analyses. The orbital altitude of the satellite is set to 830 km, the detection time interval is set to 0.2 s, and the spectral band is set to 759.8–761.8 nm. Only oxygen within altitudes of 0–150 km is considered. The latitude is set to −45.0°, and the longitude is set to −39.8°, 2018, 180th day, UT 06:00. The transmission data of this occultation event are retrieved using the retrieval method described in
Section 2. The a priori temperature used in the retrieval process is set to be the same as the temperature used in the forward model. The error is calculated by Equation (10), where
ε is the error,
ρretr is the retrieved density, and
ρtrue is the true density.
The retrieval results are shown in
Figure 2.
The retrieval results are in good agreement with the NRLMSISE model, with an average error of about 0.3% within altitudes of 40–90 km. The main reason for this error is that the parameters of the atmosphere used in the forward model are different within the same layer, while the onion-peeling algorithm in the retrieval process treats all the parameters within the same layer as equal. The layer height corresponding to the 0.2 s detection time interval is about 620 m. Reducing the layer height can also reduce the parameter deviation within the same layer and thus improve the precision of the retrieval.
The time interval is reduced to 0.02 s, corresponding to a vertical interval of about 62 m. As shown in
Figure 3, the retrieval error is reduced at this time. The average retrieval error of the oxygen density is less than 0.1% within altitudes of 40–90 km.
5. The Iterative Method
In the non-iterative retrieval process analyzed in
Section 2, the a priori temperature is the same as the temperature used in the forward model. However, it is difficult to obtain the accurate atmospheric temperature in advance before the actual retrieval process. The absorption cross-section characteristics of the oxygen 761 nm A-band are strongly affected by the temperature, also causing another kind of error. To solve this problem, the following iteration method is proposed: 1. according to the constant oxygen density ratio of 20.947% of the air, constrain the relationship between air and oxygen density; 2. the relationship between atmospheric pressure and density is constrained by the introduction of atmospheric static equilibrium equation; 3. the ideal gas equation of state is introduced to constrain the relationship between atmospheric pressure, density, and temperature; 4. use the simulated or detected optical depth value to constrain the relationship between oxygen density and atmospheric temperature.
From the above analysis, the following four interrelated equations are written as follows:
where
ρO2 is oxygen number density,
ρair is air density,
NA is Avogadro’s number,
P is atmospheric pressure,
Pu is the atmospheric pressure at upper boundary,
M is average molecular weight of dry air, and
R is ideal gas constant.
In the iteration process, initial values of air density and other parameters are first substituted into Equations (11)–(14), and then the accurate air density is continuously approximated by the bisection method. Finally, the value of air density that satisfies all four equations is obtained. The threshold error is set to be less than 10−8. In our many attempts, the threshold value was found that can balance both accuracy and calculation speed. In this way, the retrieval is not affected by a priori temperature deviation.
6. The Iterative Retrieval Results
The stellar occultation event used in this section is the same as the one described in
Section 3, with the vertical interval of 200 m. First, an example of a priori temperature deviation is presented in
Figure 4:
As shown in
Figure 4a, the blue curve is the temperature used in the forward model, and the yellow curve is the a priori temperature used in the non-iterative retrieval (deliberately chosen to be different from the forward model). The result of the non-iterative retrieval is shown in
Figure 4b, where the deviation of the a priori temperature has less of an effect on the altitudes above 80 km. However, as the altitude decreases and the oxygen density increases, the effect of the temperature in Equation (6) on the effective cross-section increases, and the retrieval error also increases, reaching 12% at 45 km.
The results of the iterative retrieval are shown in
Figure 5.
The iteration method is able to improve the accuracy of the retrieval above 60 km with the effect of the a priori temperature deviation. However, when the altitude from the top-to-bottom retrieval decreases to 60 km and the optical depth of the innermost layer in the starlight path increases to a certain point, a double solution appears. Both solutions are able to satisfy the four Equations, (11)–(14), simultaneously, making it unclear as to which solution is the true one. If the correct solution for any layer is missing, the iterative retrieval cannot continue.
In order to investigate the mechanism of this problem, the equal-pressure curve and the equal-optical-depth curve are analyzed at altitudes of 80 km, 70 km, and 60 km, respectively. From hydrostatic equilibrium Equation (12), the pressure of each layer is determined by the state of the upper atmosphere, and then, with ideal gas state Equation (13), the equal-pressure curve (density–temperature) can be obtained. The pressures are the same at any point on this curve; the transmission or optical depth of each layer is determined by simulation or detection, and the equal-optical-depth curve (density–cross-section) can be obtained from Equation (14). Any point on this curve corresponds to the same transmission or optical depth. In addition, the vertical coordinate
σ(
T) of the equal-optical-depth curve is an independent variable of temperature; therefore, the two curves can be presented in the same coordinate system, as shown in
Figure 6.
As shown in
Figure 6a, the two curves have only one intersection for the altitude of 80 km. As shown in
Figure 6b, there is also only one intersection for the two curves, but the two curves tend to overlap. In
Figure 6c, for the altitude of 60 km, two intersections occur, corresponding to oxygen densities of 9.4 × 10
14 cm
−3 and 1.1 × 10
15 cm
−3. These two values are also solutions 1 and 2 in
Figure 5. The corresponding temperatures are 240.0 K and 206.3 K, respectively. This means that, in the case of a vertical interval of 200 m, at the altitude of 60 km, there are two solutions that both satisfy the four Equations, (11)–(14), simultaneously, and it is difficult to tell which of the solutions is the true one.
This phenomenon is caused by the characteristics of the effective absorption cross-section. As the altitude in the retrieval process decreases, the density of the oxygen increases, the optical depth increases, and then the equal-pressure and equal-optical-depth curves tend to overlap and produce two intersections. From this, we envisage that reducing the vertical interval of stellar occultation detections can reduce the length of the innermost layer of the atmosphere (as shown in
Figure 1), which in turn reduces the optical depth and delays or even avoids the double solution occurence.
Therefore, this paper explores the relationship between the altitude of a double solution occurence and the vertical interval. As shown in
Figure 7, the smaller the detection vertical interval, the lower the altitude of the occurence, and, when the vertical interval is less than 2 m, the altitude of occurence is lower than 40 km.
As in the example shown in
Figure 4a, the forward and retrieval temperatures are still different. The vertical interval is set to 2 m for both non-iterative and iterative retrieval. The error curves for both retrieval cases are provided. As shown in
Figure 8, it can be seen that the introduction of the iteration method greatly improves the accuracy of the retrieval. When the iteration is not implemented, the error comes from the deviation of the a priori temperature. After the iteration, the result accurately approximates the true atmospheric density.
In summary, reducing the vertical interval can delay the occurence of double solutions and improve the effective detection altitude range of the stellar occultation technique. Under the circumstance when the instrument cannot achieve high resolution due to design limitations, interpolating the detection data is a way to improve the detection performance.
7. Conclusions
In this paper, the non-iterative and iterative retrieval methods for oxygen and air density detection by stellar occultation are investigated. The retrieval method especially for oxygen 761 nm single-band detection is developed. The non-iterative retrieval error without the a priori temperature deviation is less than 0.1% in altitudes of 40–90 km.
In order to improve the error of a priori temperature deviation, an iteration method is also proposed. The iteration method introduces atmospheric hydrostatic equilibrium and the ideal gas equation of state, and achieves a more accurate retrieval of the air density under the condition of a priori temperature deviation.
Finally, this paper analyzes the limitations of this iteration method. The iteration method could produce a double density solution in the lower altitude regions. By interpolating the data or reducing the detection vertical interval, the double solution occurrence can be delayed or even avoided. The stellar occultation retrieval methods can also be applied in solar occultation due to the similarity between those two.


 ,
, 