Article

Geostationary Satellite-Based Overshooting Top Detections and Their Relationship to Severe Weather over Eastern China

1
Jiangsu Climate Center, Nanjing 210041, China
2
Key Laboratory of Transportation Meteorology of China Meteorological Administration, Nanjing Joint Institute for Atmospheric Sciences, Nanjing 210041, China
*
Author to whom correspondence should be addressed.
Remote Sens. 2024, 16(11), 2015; https://doi.org/10.3390/rs16112015
Submission received: 5 May 2024 / Revised: 27 May 2024 / Accepted: 1 June 2024 / Published: 4 June 2024
(This article belongs to the Section Atmospheric Remote Sensing)

Abstract

:
Overshooting tops (OTs), prominent signatures within deep convective storms, are produced by intense updrafts and are closely linked to heavy rainfall, strong winds, and other severe weather conditions. Using an OT dataset derived from multiyear observations of precipitation radar on board the Global Precipitation Measurement core observatory as a reference, the performances of two commonly used OT detection algorithms are evaluated for the Himawari-8 and Fengyun-4A satellites. The results indicate that the infrared contour-based algorithm based on Himawari-8 is the most effective for objective OT detection in eastern China. It exhibits a probability of detection (POD) of 62.1% and a false-alarm ratio (FAR) of 36.6%, outperforming others by achieving a greater POD and a lower FAR. Furthermore, based on the severe weather records from surface meteorological stations and nearby OT detections, a strong relationship is revealed between GEO-detected OTs and the occurrence of short-term heavy rainfall (e.g., ≥20 mm h−1) and extreme wind speed (e.g., ≥17.2 m s−1) events. The OT matched percentages for these events are 61.8% and 54.0%, respectively. This suggests that GEO satellite-based OT data can serve as an important objective product for forecasters to increase their understanding of severe convective storms.

Graphical Abstract

1. Introduction

An overshooting top (OT) forms when a strong updraft within a deep convective storm forces the cloud top to ascend rapidly, penetrating the level of neutral buoyancy and reaching above the tropopause and into the lower stratosphere. The presence of OTs is one of the unique signatures of severe storm tops and is frequently associated with disastrous weather, such as heavy rainfall, destructive winds, large hail, and tornadoes [1,2,3,4,5,6,7]. Meanwhile, the subsidence of upper-level air and the release of latent heat associated with OTs can trigger the formation and development of the warm-core structure within a typhoon, causing the eye’s surface pressure to drop quickly and the tangential wind to accelerate rapidly [8,9,10]. Therefore, the occurrence of an OT is also an important signal that indicates the rapid intensification of a typhoon [11,12]. Moreover, the tropopause-penetrating updrafts embedded in OTs play a significant role in the process of stratosphere–troposphere exchange, which may have an important impact on the earth’s climate through changing the gas distribution of the upper troposphere and lower stratosphere [13,14].
Based on observations from the precipitation radar (PR) onboard the Tropical Rainfall Measuring Mission (TRMM) or the Global Precipitation Measurement core observatory (GPM-CO) satellites, past studies have adopted the maximum 20 dBZ echo-top height (MaxH20), exceeding an altitude threshold, as the main index for determining the presence of OTs [15,16,17]. The temporal resolution of PR is limited and insufficient for continuous monitoring in a fixed region, but the quality of these PR-observed OTs is very reliable due to the fact that the PR allows for the direct detection of the internal characteristics of a cloud and provides a detailed depiction of the vertical structure within a convective system. Therefore, the PR-observed OT dataset is often used as the truth to validate the performance of other OT detection algorithms [18,19].
To achieve more frequent OT detections, geostationary (GEO) satellite-based OT detection algorithms have been developed. One such algorithm uses the brightness temperature (BT) difference (BTD) from the water vapor (WV) channel minus the infrared (IR) window (IRW) channel [20,21]. This algorithm assumes that OTs typically correspond to a positive BTD as a result of the stratospheric WV injection by the updraft within OTs. Yet, the OT region detected by the WV−IRW BTD algorithm can be contaminated by surrounding anvil pixels due to the advection or spread of stratospheric WV, resulting in a larger size than that observed by space-borne radar [22]. Therefore, subsequent studies paired WV−IRW BTD with other BTD combinations, such as the BTD from the ozone channel minus the IRW channel, for accurate OT detections [23,24].
Additionally, OTs appear colder in IRW imagery compared to the surrounding anvil clouds due to adiabatic cooling within the storm updraft. Bedka et al. (2010; hereinafter B10), therefore, developed the IRW-texture algorithm based on the sharp BT gradient between the OT center and adjacent anvil cloud [25]. The OTs detected by this algorithm exhibit greater concordance with the OTs observed by space-borne radar than those detected by the WV−IRW BTD algorithm [22]. The IRW-texture algorithm has been widely used in various scenarios, including severe weather analysis [2,3,26], typhoon intensification diagnosis [27,28,29], and climatological statistics [30,31].
On the basis of the IRW-texture algorithm, Bedka and Khlopenkov [32] proposed a new probabilistic algorithm that utilizes multispectral imagery in both the visible and IRW channels to address the limitations from fixed BT thresholds. This algorithm was further updated and described in [33]. Sun et al. (2019; hereinafter S19) designed the IR contour-based algorithm, which constructs IRW BT contours in deep convection areas to distinguish the OT region and anvil clouds [18]. This algorithm enhances the accuracy of automated OT identifications and has been employed in recent studies (e.g., [12]).
Currently, GEO satellites serve as the primary means for identifying OTs worldwide, owing to their extensive and continuous observation capabilities. For example, the Meteosat Second Generation has provided OT detections over central Europe [23] and east Africa [34], while the GEO Operational Environmental Satellite (GOES) series have examined OT occurrences over the continental United States [3,4]. However, the OT detections from the new generation of GEO satellites covering China, such as Japan’s Himawari-8 (H8) satellite and China’s Fengyun-4A (FY4A) satellite, have not been extensively studied. It is uncertain whether the aforementioned GEO-based algorithms are equally effective in this region. Therefore, this study focuses on eastern China to evaluate the performance of the commonly used algorithms (the IRW-texture and the IR contour-based algorithms) based on H8 or FY4A, the aim being to determine the most effective method for OT detections. In addition, OT is considered an indicator for monitoring severe storm activity [35,36,37,38], but its specific relationship in eastern China remains unclear. Thus, investigating the correlation between GEO-detected OTs and severe weather events is another objective of this study.
The remainder of this paper is structured as follows: Section 2 illustrates the data and methodology; Section 3 evaluates the performance of GEO-detected OT detection; Section 4 analyzes the relationship between OTs and severe weather; and the discussion and conclusions are presented in Section 5 and Section 6, respectively.

2. Materials and Methods

2.1. Data

2.1.1. H8 Data

As the first of the new generation of Japanese GEO meteorological satellites, H8 was launched in October 2014 and has been in operation with a sub-satellite longitude of 140.7°E for over 7 years (from July 2015 to December 2022). As the main instrument onboard H8, the Advanced Himawari Imager (AHI) has the capability to perform a full-disk scan every 10 min with 16 channels. The spatial resolution for the AHI at nadir ranges from 0.5–1 km for visible and short-wave IR channels to 2 km for IR channels [39]. The AHI observations agree well with those simulated with fast radiative transfer models and/or measured by other imager instruments [40,41] and, thus, are frequently utilized in numerical weather prediction, severe weather forecasting, and so on. Similar to B10 and S19, this study employed the WV channel (channel 8; 6.05–6.45 µm) and IRW channel (channel 13; 10.3–10.6 µm) of AHI data to identify OTs.

2.1.2. FY4A Data

FY4A is the first of the second generation of Chinese GEO meteorological satellites. It was launched in December 2016 and commenced operation in September 2017, with a sub-satellite longitude of 104.7°E and 86.5°E before and after March 2024, respectively. As a multispectral radiation imager onboard FY4A, the Advanced Geostationary Radiation Imager (AGRI) can capture full-disk imagery with 14 channels as fast as every 15 min. The spatial resolution of the AGRI at nadir is 0.5–2 km for visible and short-wave IR channels and 4 km for IR channels [42]. The AGRI exhibits a good agreement when compared with radiative transfer model simulations [43]. Consistent with the channel selection for the AHI/H8, channels 9 (WV channel; 5.8–6.7 µm) and 12 (IRW channel; 10.3–11.3 µm) of the AGRI/FY4A were used for OT detections in this study.

2.1.3. GPM-Observed OT Dataset

To verify the performance of the objective OT detection algorithms based on the above-mentioned GEO satellites, we utilized observations from the GPM-CO satellite to generate an OT dataset as truth. The GPM-CO satellite, launched in February 2014, carries the first space-borne, dual-frequency PR (DPR) operating at the Ku-band (13.6 GHz) and the Ka-band (35.5 GHz). As the successor of PR onboard the TRMM, the Ku-band PR (KuPR) measures the three-dimensional structures of convective systems with a 250 m vertical resolution and 5 km horizontal resolution over a swath width of 245 km [44]. Due to its wider swath width and more extensive latitudinal coverage, spanning from 65°S to 65°N, KuPR has been widely used in the detection of deep convection, including OT [16,19,37]. Based on observations from March 2014 to December 2020, Hong et al. [19] demonstrated that KuPR and the Moderate Resolution Imaging Spectroradiometer exhibit a high consistency in OT detections in both the tropics and midlatitudes.
In this study, KuPR-corrected reflectivity from the GPM DPR level-2 dataset (GPM_2ADPR, version 7) [45] was used to collect OT truth. Considering the impact on tropopause folds in the subtropical region [46], we chose a fixed altitude as the reference level to determine OT pixels. Specifically, a KuPR pixel with a MaxH20 greater than or equal to 14 km is defined as a KuPR OT pixel. This approach is consistent with previous studies, e.g., Liu and Liu [16] used 14 km as one of the altitude thresholds to reveal the geographical distribution of OTs in the mid–high latitudes with GPM KuPR observations. Furthermore, to minimize the effects of random noise, a KuPR OT must consist of at least four contiguous KuPR OT pixels, as suggested by [16]. Based on these procedures, we established an OT truth dataset containing 174 KuPR OTs in eastern China from May to September in 2018–2022. The research period for this study was selected according to the operational periods of the three satellites (H8, FY4A, and GPM) and the months when OTs occur frequently [2,47]. Figure 1a shows the geographic distribution of these KuPR-observed OTs.

2.1.4. Weather Station Data

The hourly rainfall and hourly extreme wind speed observation data used in this study were obtained from weather stations of the Jiangsu Meteorological Bureau (Figure 1b), which have been strictly quality-controlled before release. Based on these data, we collected the records of short-term heavy rainfall, defined as hourly rainfall of 20 mm h−1 or greater, and the records of extreme wind, defined as hourly extreme wind speed of 17.2 m s−1 or greater. Note that the temporal resolution of the weather records is 1 h. For example, the weather record reported at 01:00 UTC represents the observations from 00:00 to 00:59 UTC. In order to further explore the relationship between these severe weather records and GEO-detected OTs, this study adopted the temporal and spatial match criteria of 30 min and 30 km as suggested by [3]. The 30 min match criterion means that a temporal difference of up to ±30 min between the occurrence time of an OT and a time benchmark is deemed acceptable. For example, for the weather record reported at 01:00 UTC, the midpoint (i.e., 00:30 UTC) of the observation period is employed as a time benchmark, and an OT detected within 00:00–00:59 UTC is considered a match. In addition, following the methods in previous studies [2,3], a constant cloud-top height of 14 km was utilized in this study to correct the locations of H8-detected OTs for parallax, thereby more accurately depicting their actual positions relative to the Earth’s surface.

2.2. Methods

2.2.1. IRW-Texture OT Detection Algorithm

As described in B10, the IRW-texture algorithm first identifies the possible OT pixels using a 215 K IRW BT threshold and assigns the pixels with local BT minima as candidate OT centers. Secondly, the anvil cloud pixels surrounding the candidate OT centers are sampled at an 8 km radius in 16 radial directions. The mean anvil cloud BT is then computed when there are at least five surrounding anvil pixels with BTs colder than 225 K. Finally, the candidate OT center is classified as an OT if the BT gradient (candidate OT central BT minus mean anvil cloud BT) is greater than or equal to 6.5 K. Based on the feedback of operational applications, subsequent studies modified the aforementioned conservative BT thresholds. For example, Bedka et al. (2018; hereafter B18) adjusted the possible OT pixel from 215 K to 217.5 K and the BT gradient from 6.5 K to 6 K [31].

2.2.2. IR Contour-Based OT Detection Algorithm

Compared to the IRW-texture algorithm in B10, the IR contour-based algorithm in S19 introduces two significant modifications to the OT detection process. Firstly, S19 avoids adopting a simple 215 K threshold for identifying candidate OT pixels. Instead, the method involves generating IRW BT contours at 5 K intervals within convective areas that have a BTD greater than −1 K. Then, the candidate OT pixels are determined within the inner-half region enclosed by the lower-BT contours. Secondly, S19 abandons the use of a fixed 225 K threshold for determining the anvil cloud pixels. It employs a method that searches for the innermost BT contour (Ca K), which includes at least 12 pixels within a radius of 8 km in 16 directions around a candidate OT pixel. The pixels located in the region between the Ca and Ca−1 K (i.e., Ca minus 5 K) contours are defined as anvil cloud pixels used for calculating the mean anvil cloud BT (see Figure 2 in S19 for more details). As for the final determination of OT pixels, the method used in S19 is consistent with that in B10.
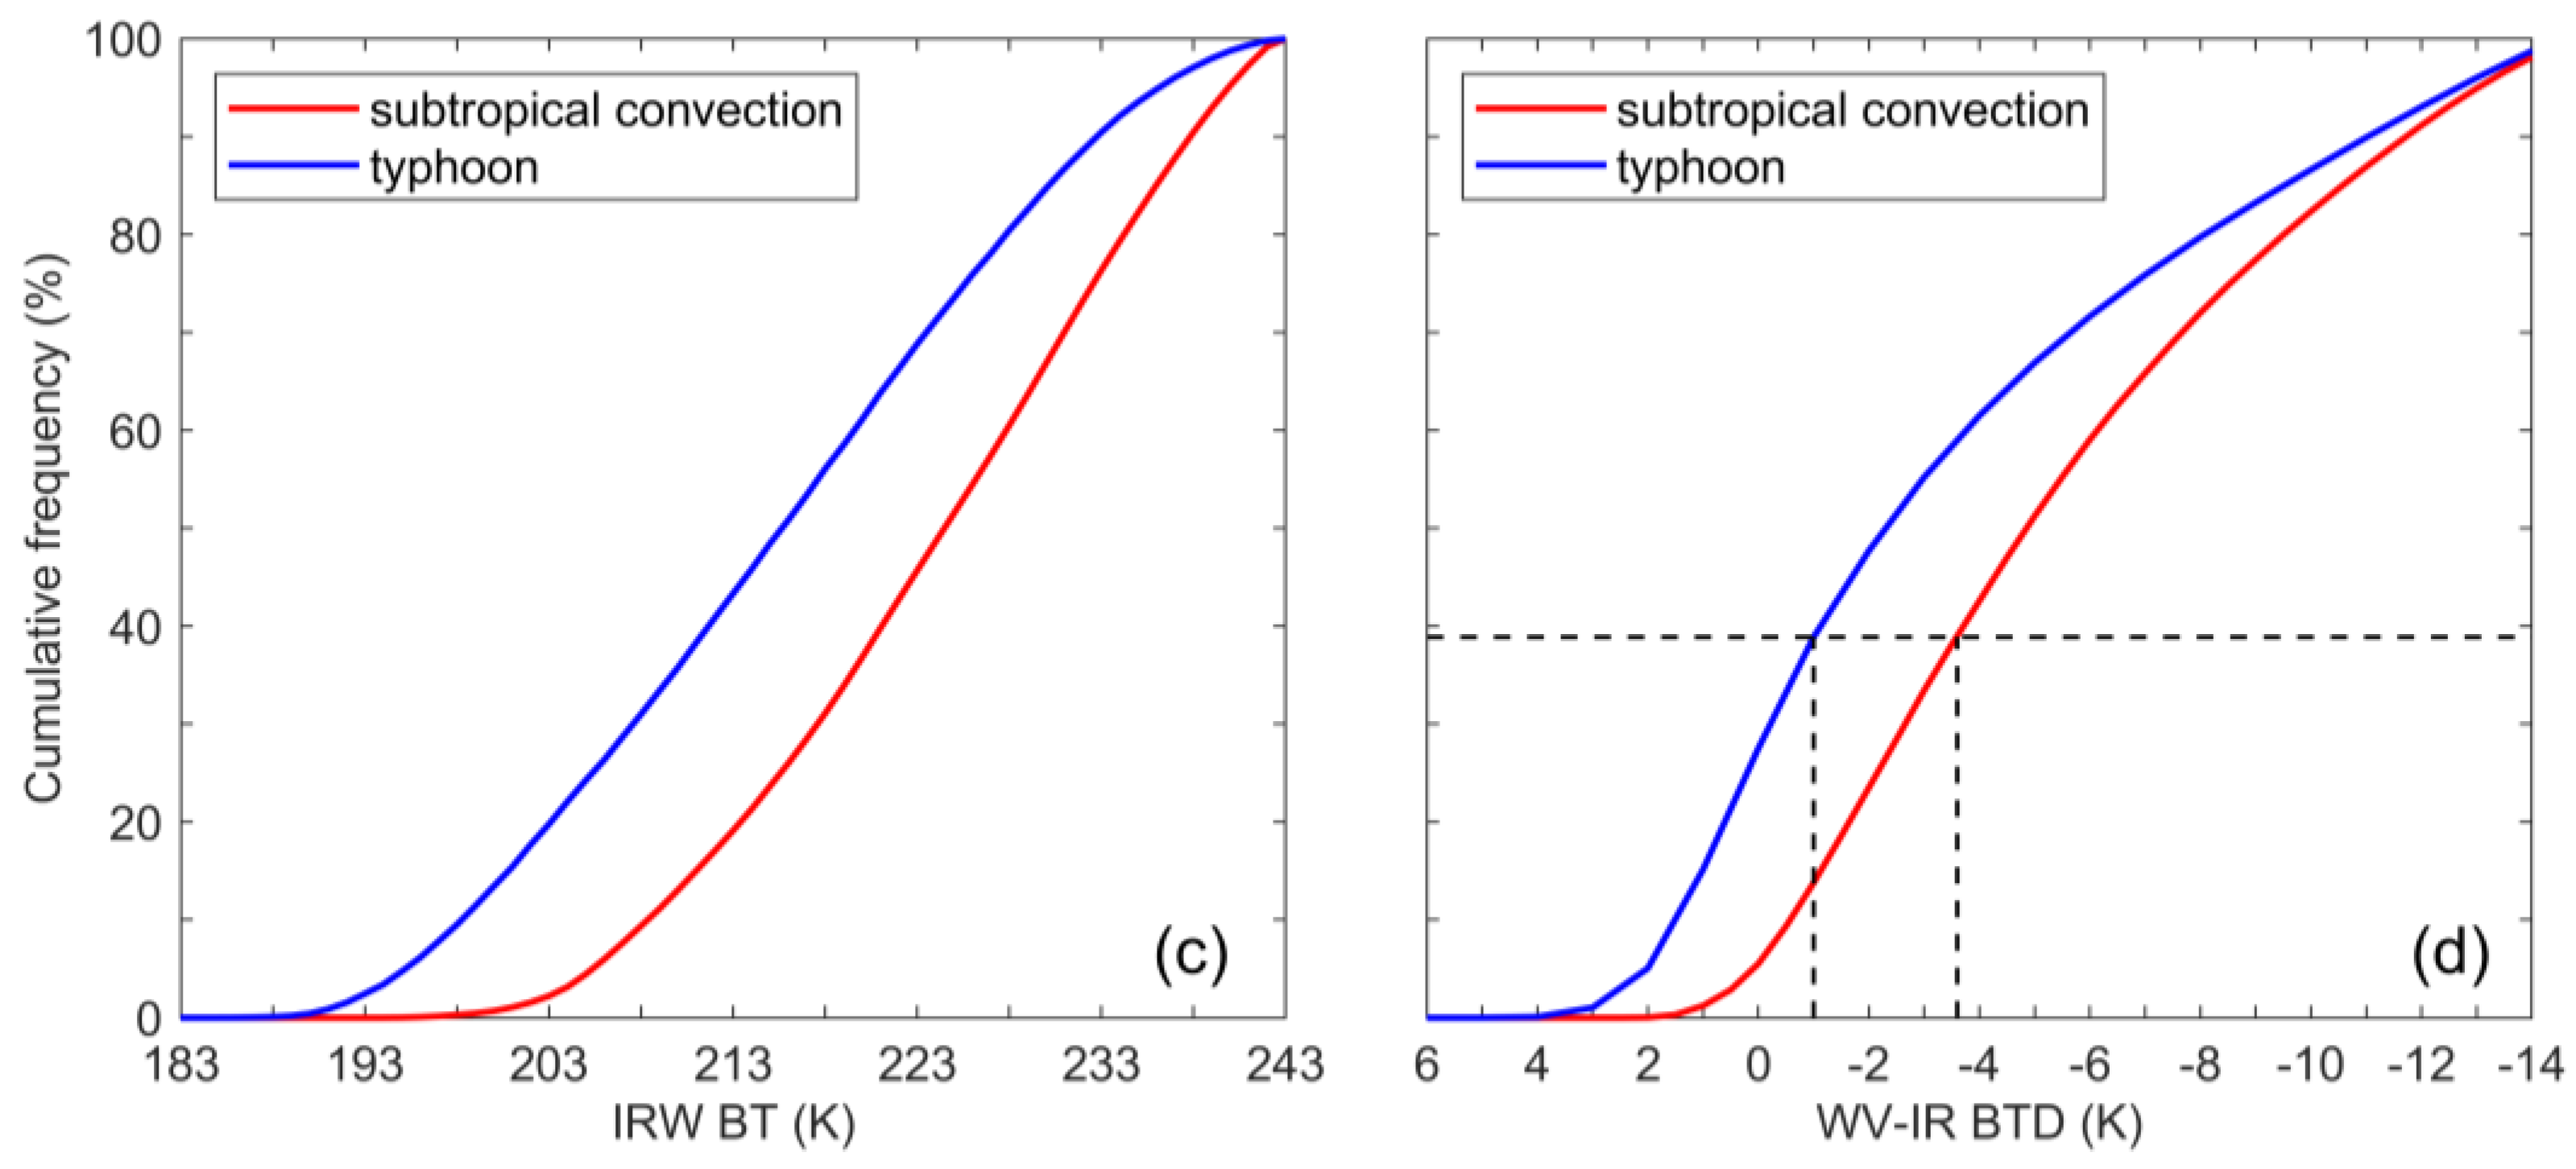
The S19 algorithm was originally designed to identify tropical OTs associated with western North Pacific (WNP) typhoons. However, when applying it to the subtropical continental convection, the environmental differences between them should be considered. To address this, we collected a WNP typhoon OT dataset using GPM observations from May to September in 2018 and compared the BT measurements with those in the subtropical continental convective storms during the same period. As shown in Figure 2, the analysis of IRW BT and WV−IRW BTD indicates that the altitude of cold cloud surrounding the GPM-defined OT region in typhoons is higher than that in subtropical convection, and the cumulative frequency distribution of these cold cloud pixels with different BTDs reveals that the −1 K of the former is consistent with the −3.6 K of the latter (Figure 2d). Thus, the BTD threshold for subtropical cases is adjusted from −1 K to −3.6 K. The modified IR contour-based algorithm is hereafter referred to as the MS19 algorithm and is used for subsequent OT detections.

3. Performance Comparison of OT Detection

3.1. Case Study with Two OT Detection Algorithms

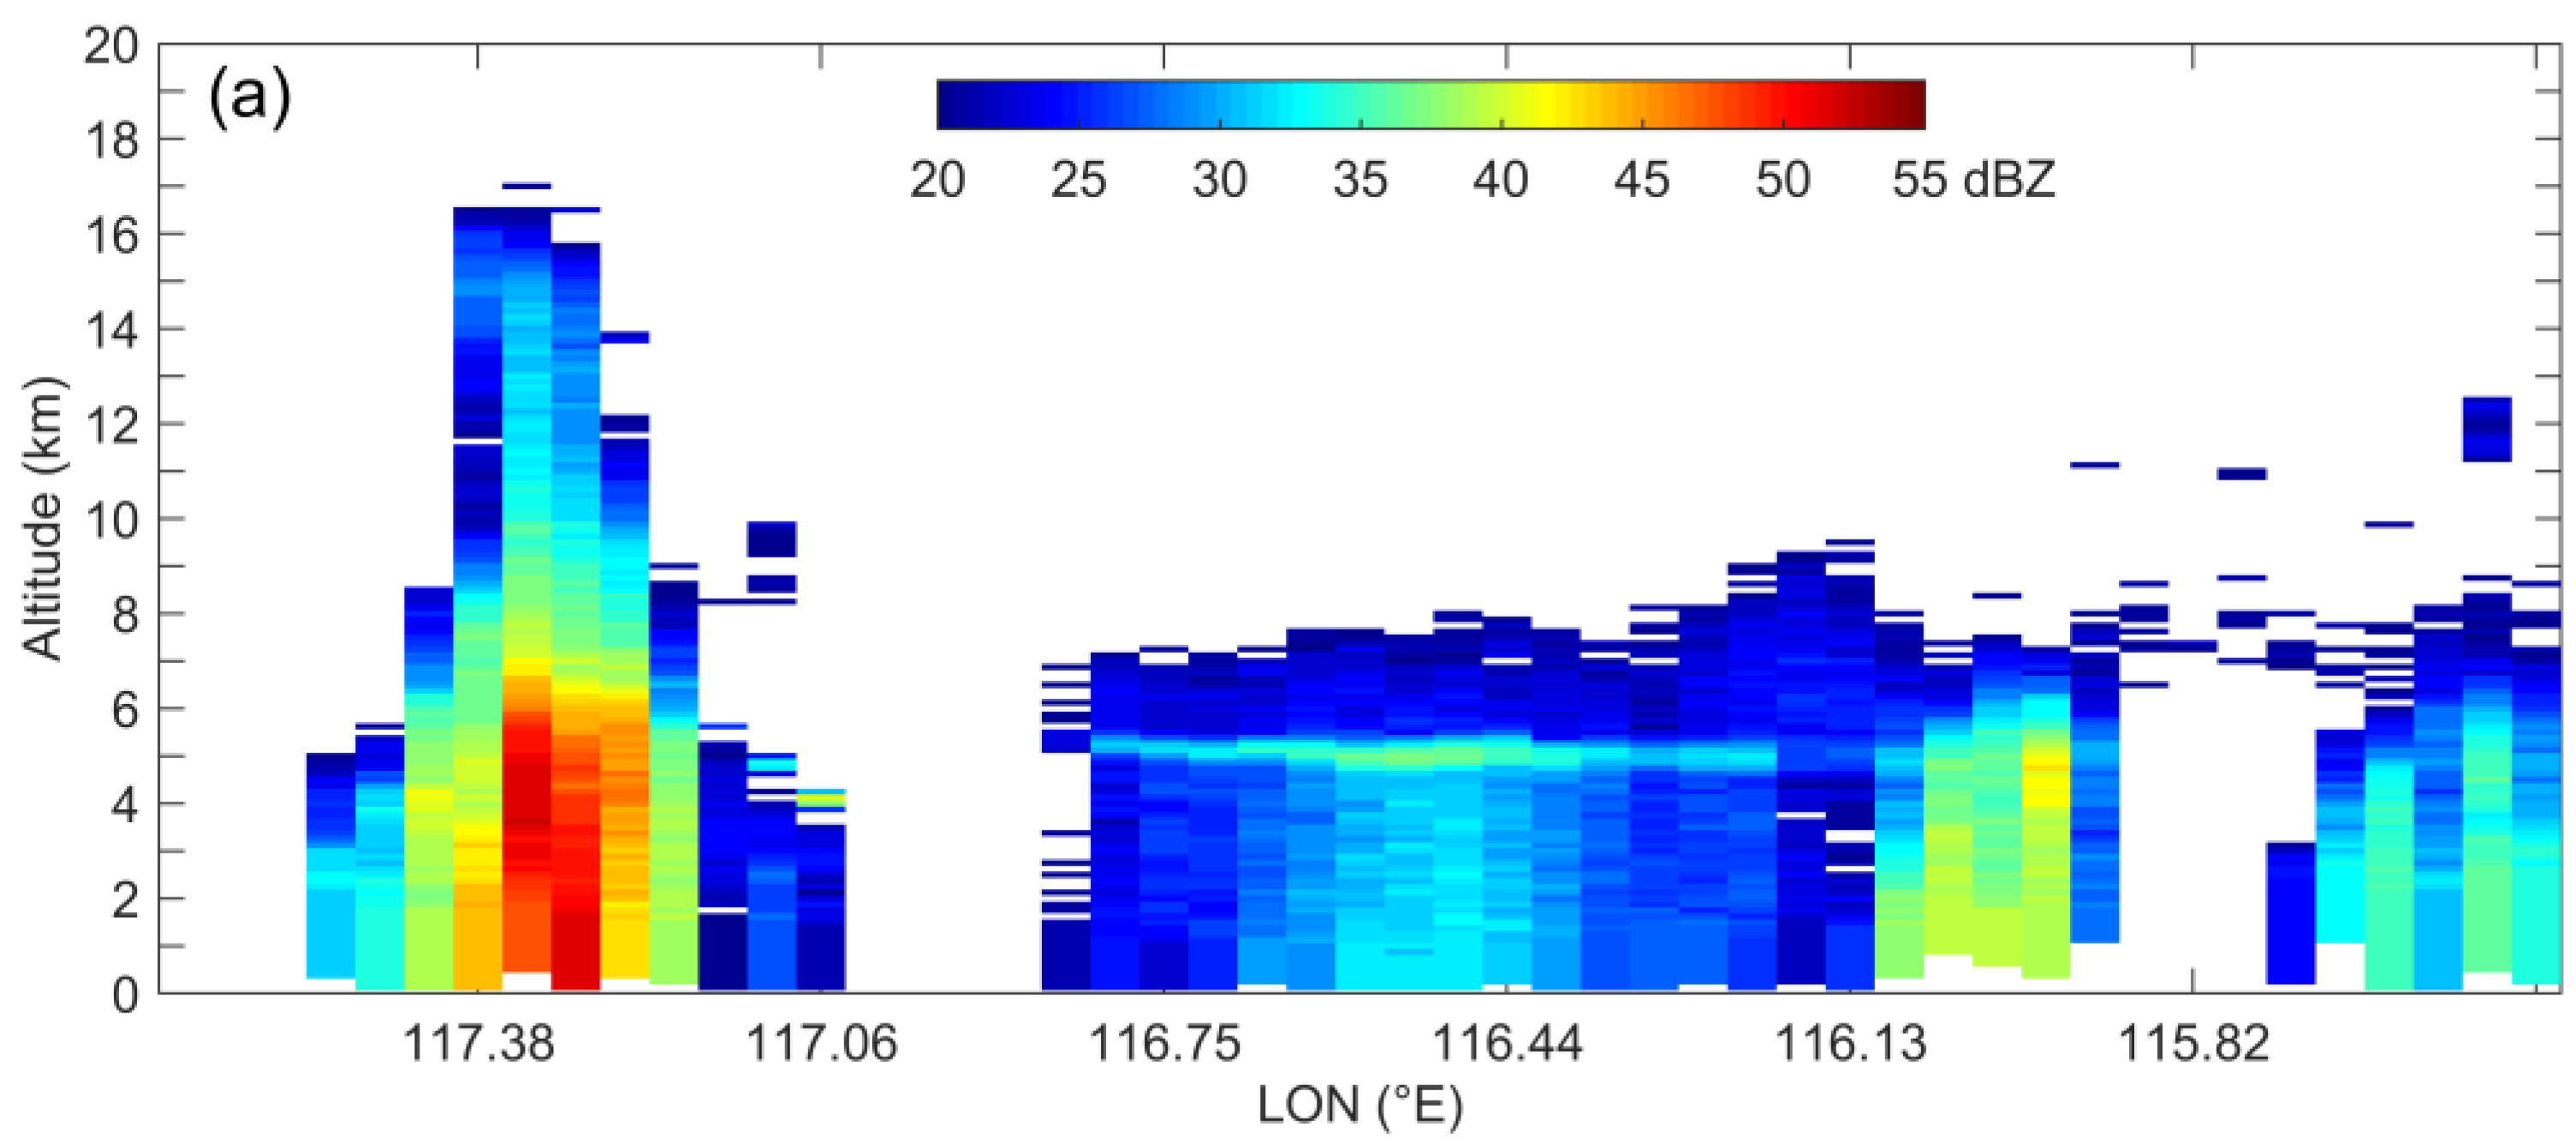
This section compares the performance of two commonly used algorithms, the IRW-texture algorithm and the IR contour-based algorithm, for identifying OTs in practical cases. Figure 3 first presents the satellite-observed signatures of an OT embedded within a deep convective storm, including detailed distributions of vertical radar reflectivity, storm-top height, and IRW BT. According to the definition in Section 2.1.3, two KuPR-observed OTs were captured in the region scanned by GPM at 10:10 UTC on 10 May 2021, whose locations are indicated by the blue dots in Figure 4.
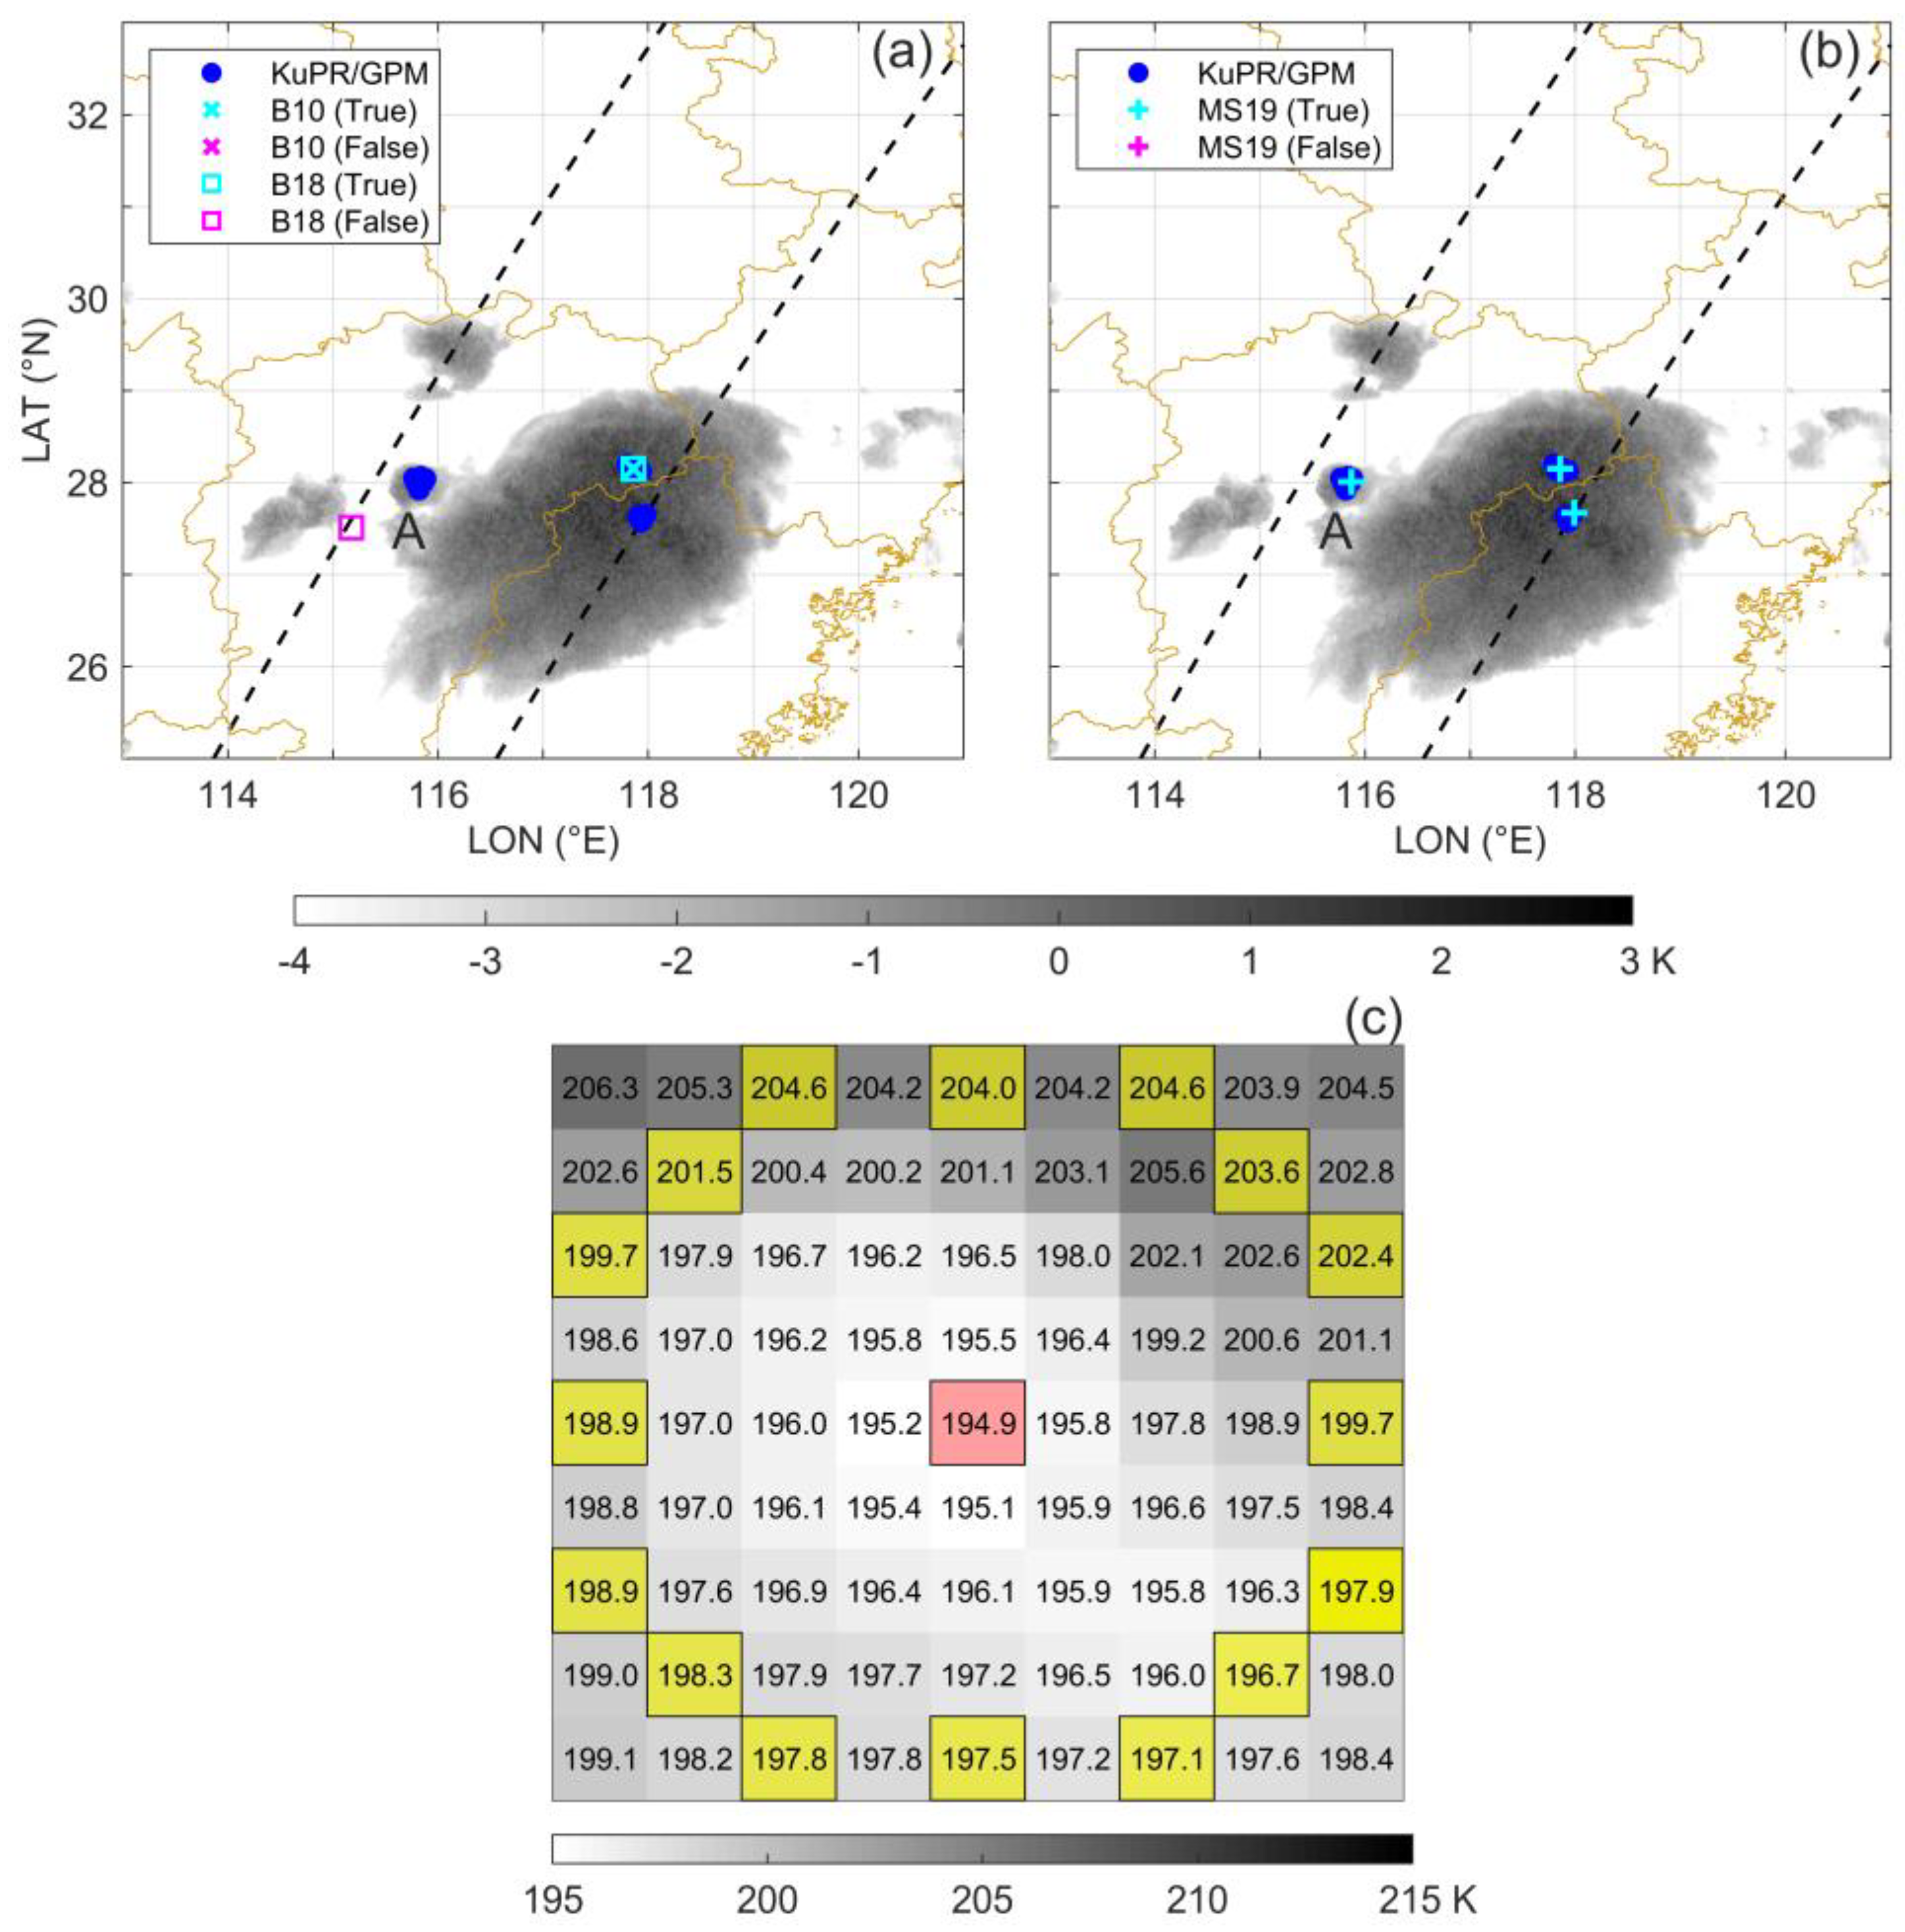
With H8 observations at the same time, both the IRW-texture algorithm (cyan markers in Figure 4a) and the IR contour-based algorithm (cyan markers in Figure 4b) successfully identify these KuPR-observed OTs. However, the IRW-texture algorithm is accompanied by many false OT results—five times for the B18 algorithm (magenta squares) and four times for the B10 algorithm (magenta multiplication signs)—whereas the IR contour-based algorithm produces none. To investigate the difference between these two algorithms in terms of false OT detections, we analyze the distributions of IRW BT contours with 5 K intervals in this case. Based on the definition of candidate OT pixels and the BT contours illustrated in Figure 4c, the inner-half regions enclosed by the 210 K BT contours are responsible for generating these pixels in the IR contour-based algorithm. However, the IRW-texture algorithm employs a fixed 215 K threshold to define candidate OT pixels. This indicates that it needs to detect more pixels than the IR contour-based algorithm to determine the OT occurrence, potentially leading to an increase in unnecessary detections and, consequently, more false alarms. Therefore, as shown in Figure 4, the IRW-texture algorithm produces more false OT results than the IR contour-based algorithm.
Similar to Figure 3, Figure 5 depicts another example of an OT event occurring within a severe convective storm at 19:20 UTC on 21 June 2019, in which one OT exhibits a 16.6 km MaxH20, significantly higher than the altitude threshold of the KuPR-defined OT (Figure 5a). In this event, KuPR observes a total of three OTs (Figure 6). However, the IRW-texture algorithm correctly identifies only one OT (Figure 6a), and the IR contour-based algorithm successfully detects all three (Figure 6b). The reason for the difference in OT misses between these two algorithms is the ability of the IR contour-based algorithm to effectively distinguish the OT region and its adjacent anvil clouds by utilizing the IRW BT contours. This approach makes the calculation of BT gradients more reasonable.
Figure 6c further shows the BT values of H8 satellite pixels in detail corresponding to location A, which represents one of the KuPR-observed OT regions. Although there is the presence of a uniform attribute in the actual anvil clouds, there is a noticeable discrepancy in the BT magnitude of the anvil cloud pixels (yellow) derived from the IRW-texture OT detection algorithm. For instance, a 196.7 K pixel is more likely to represent the OT region rather than the anvil cloud region when compared to a 204.6 K pixel. This may result in a lower mean anvil cloud BT calculated by the IRW-texture algorithm than its actual value due to the mixing of more lower-BT pixels. As a consequence, the BT gradient may not meet the required thresholds (6 K or 6.5 K), leading to a miss in OT detection. In contrast, the IR contour-based algorithm can easily divide the 196.7 K and 204.6 K pixels into different regions using a 200 K BT contour. This method allows for an accurate determination of the mean anvil cloud BT and BT gradient, ultimately achieving a successful OT detection.

3.2. Case Study with Two Geostationary Satellites

A comparison between two GEO satellites, H8 and FY4A, in terms of their OT detections is also discussed in this study. Figure 7 exhibits the KuPR-observed OTs and corresponding GEO-detected OTs from AHI/H8 (Figure 7a) and AGRI/FY4A (Figure 7b) at 18:40 UTC on 7 August 2020. When combined with the IR contour-based algorithm, H8 successfully identifies both KuPR-observed OTs without any false detections. In contrast, FY4A has no false results, but it only correctly captures one KuPR-observed OT and misses another.
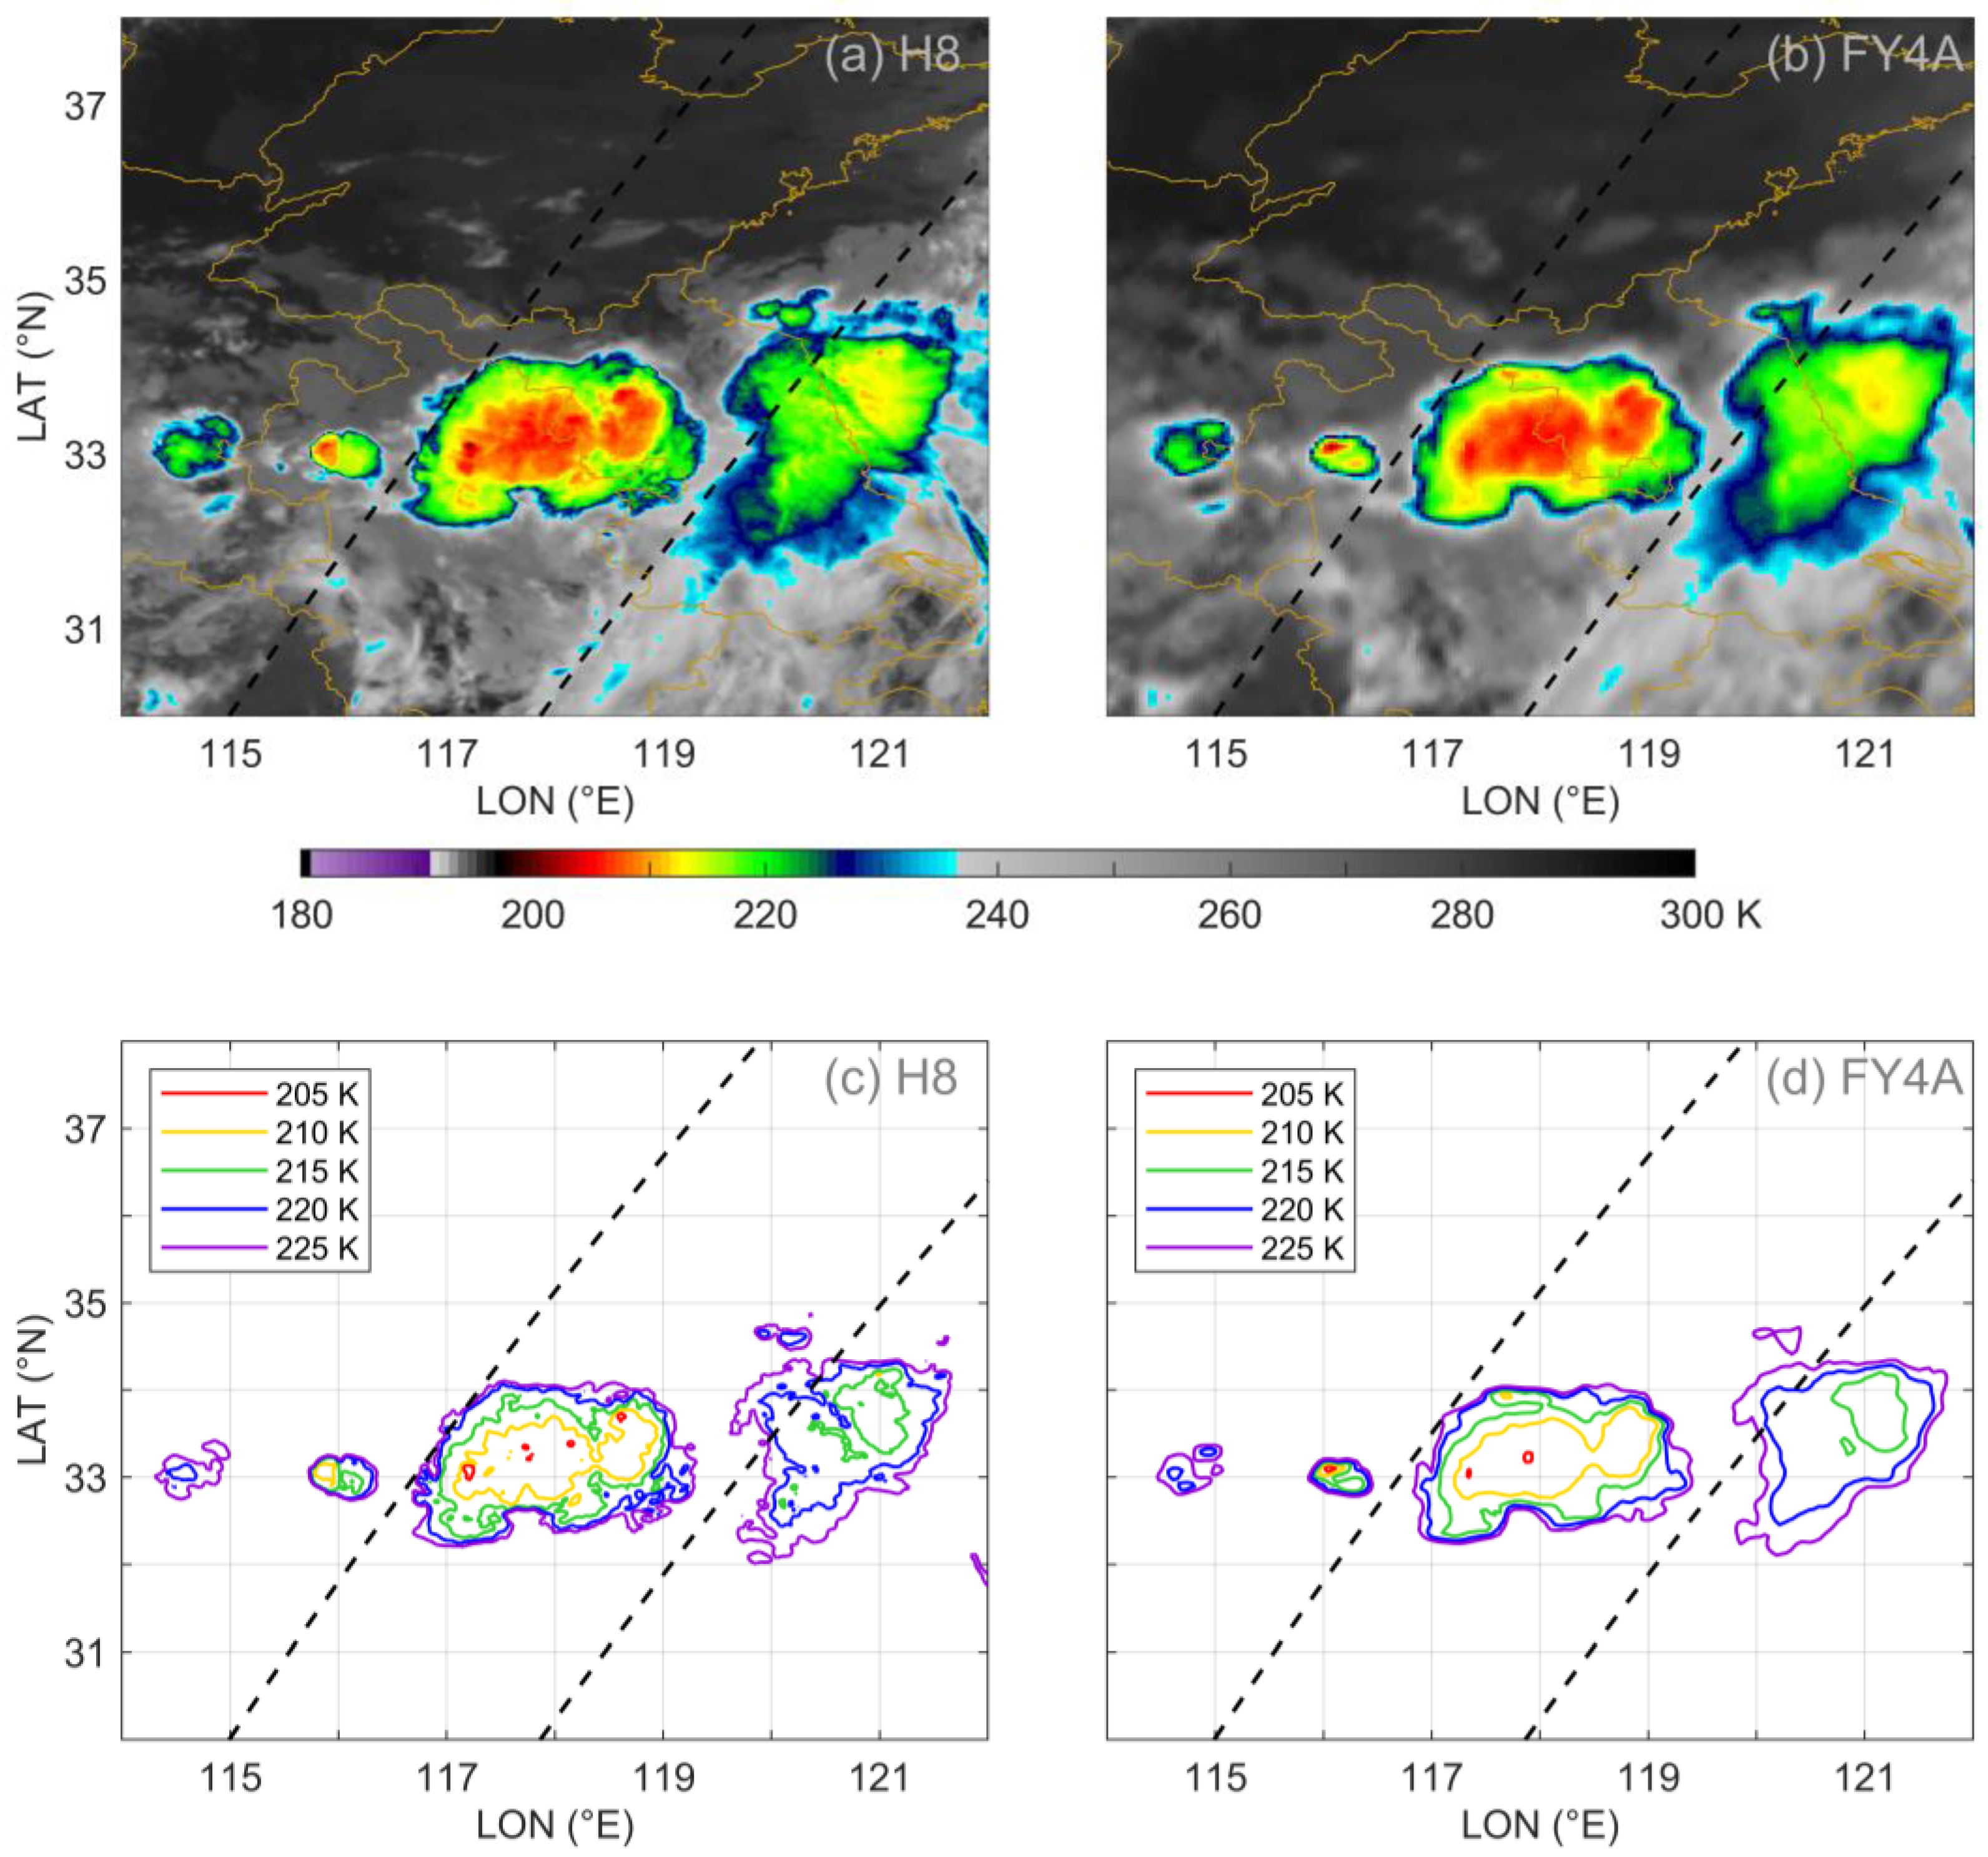
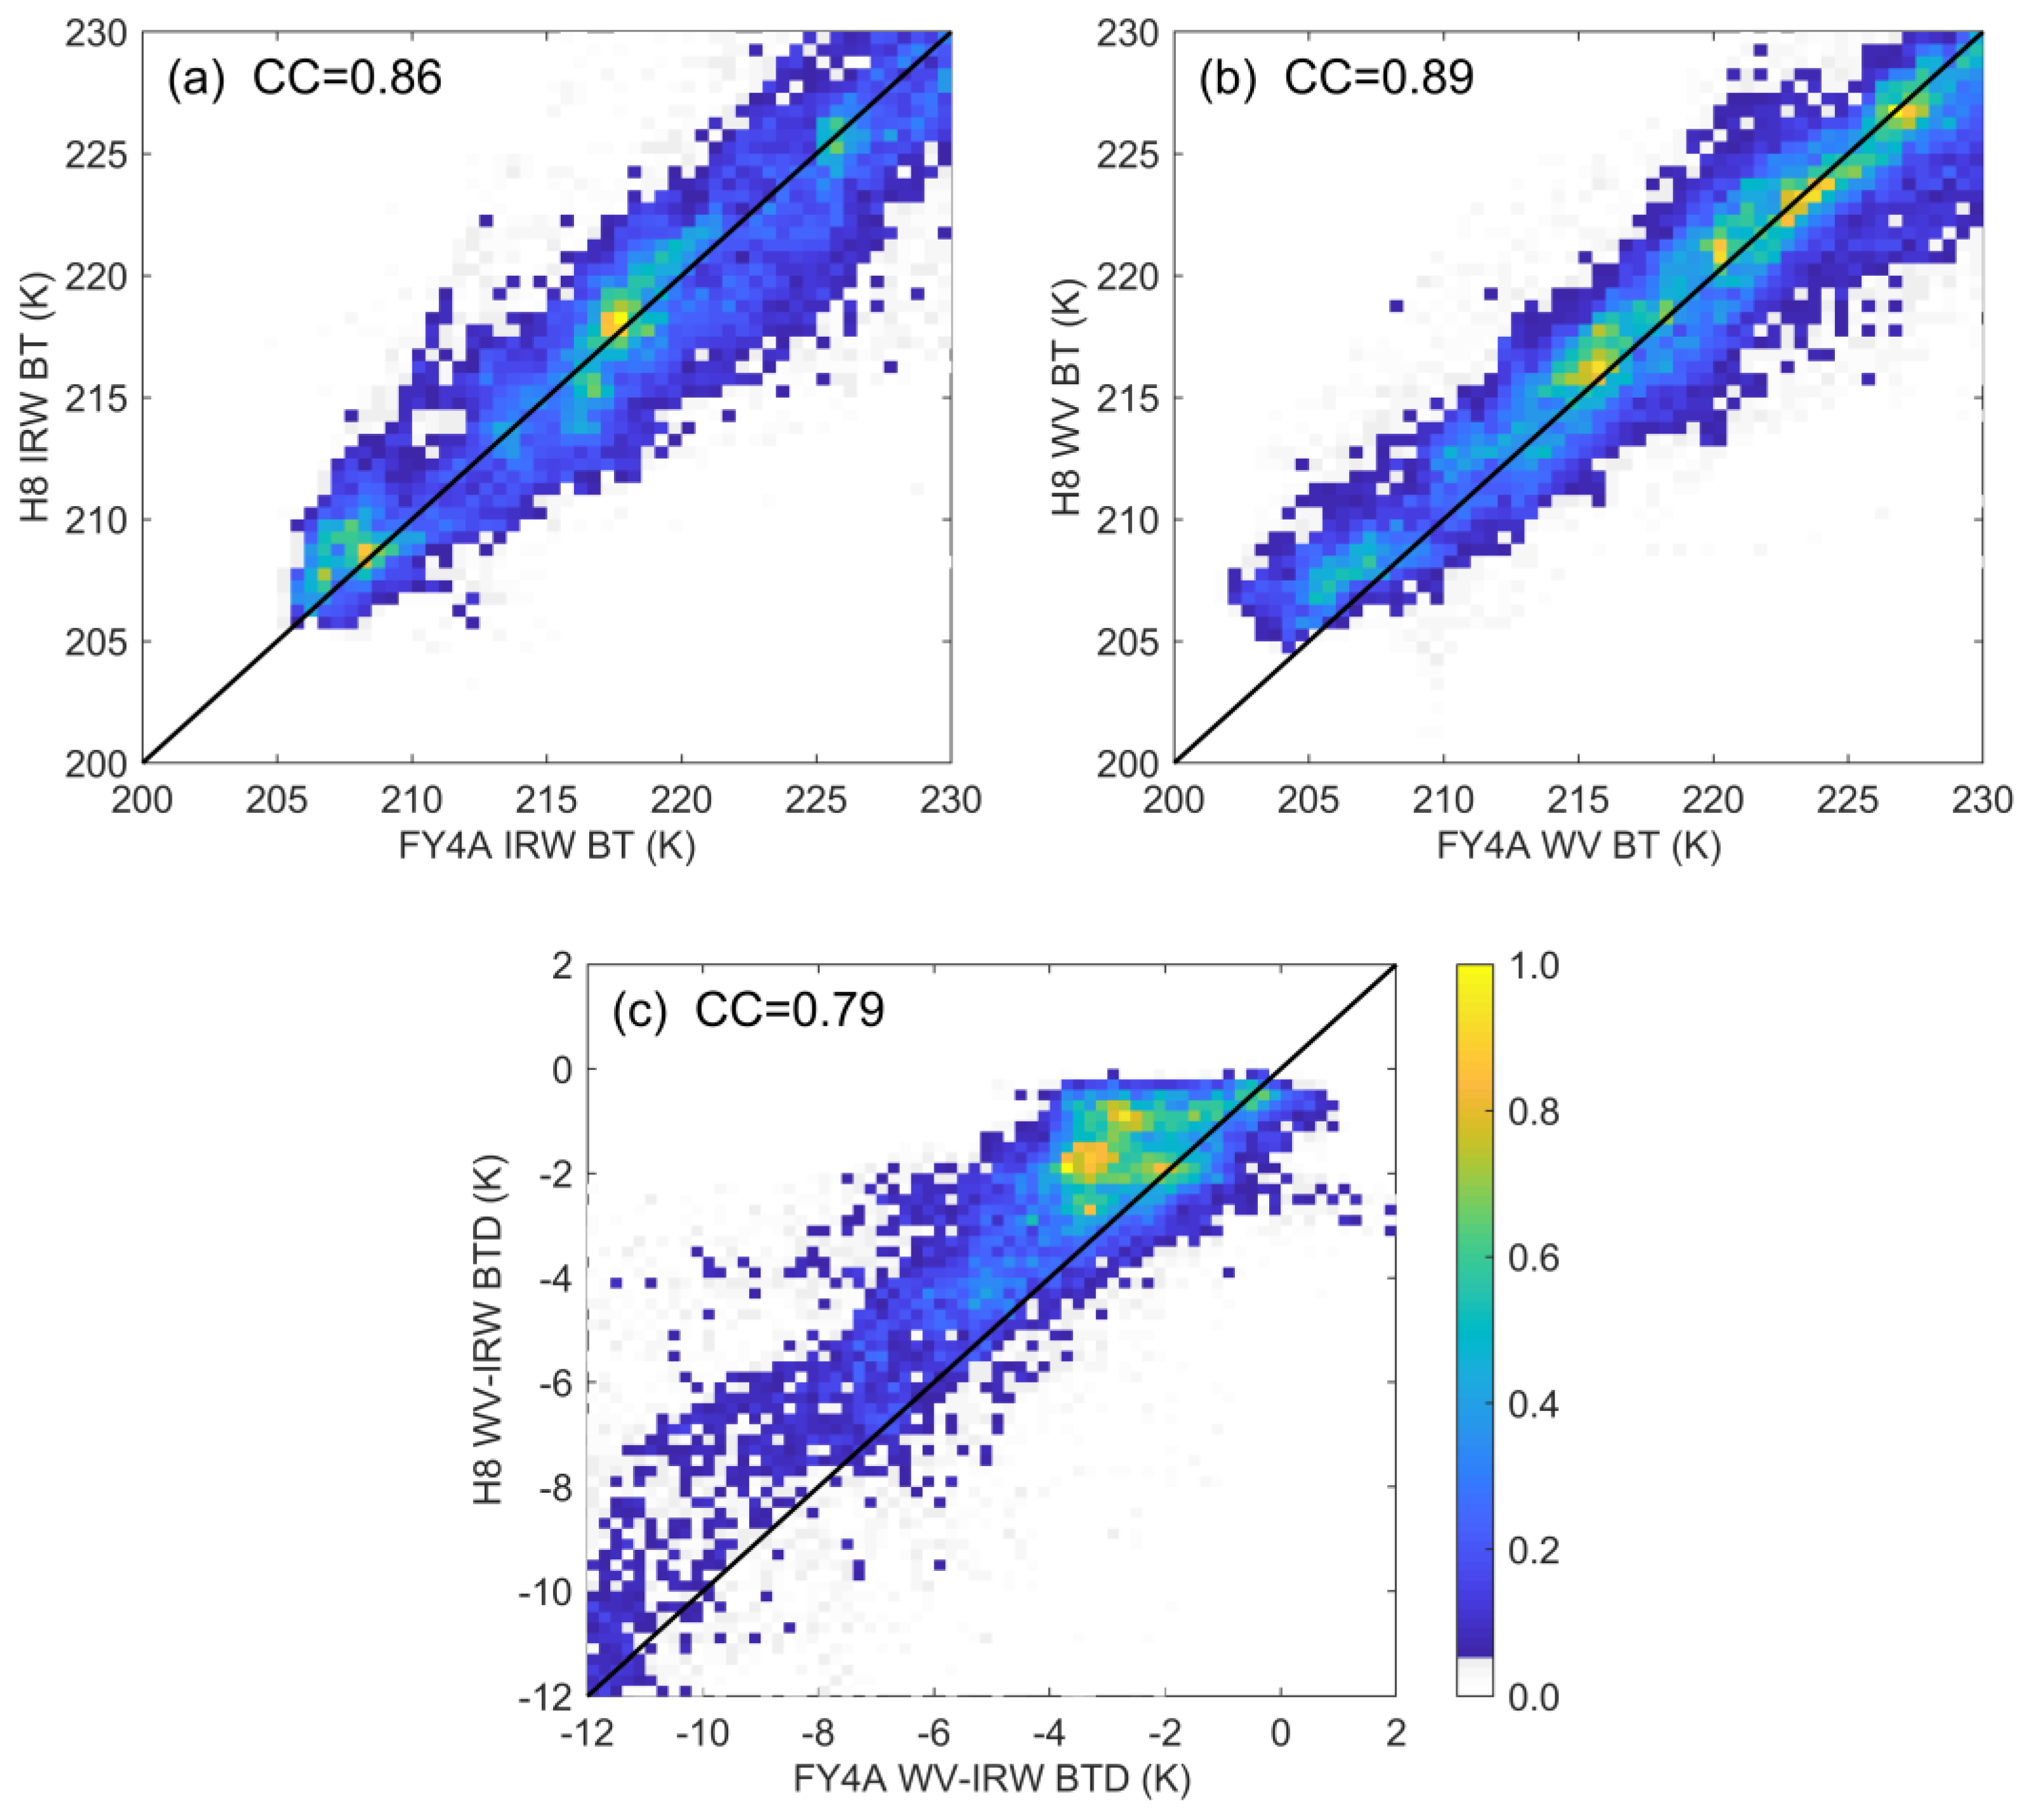
The difference in spatial resolution is one reason for the varying accuracy in OT detections between H8 and FY4A. While both satellites can effectively characterize the overall appearance of larger-scale storm systems, due to its higher spatial resolution, H8 provides a more accurate depiction of smaller, localized convective signals like OTs embedded within the storms. For the case discussed above, Figure 8 depicts the distribution of the BT pixels and BT contours. It is clear that some small and cold regions, which are encompassed by the 205 K BT contours of H8, are not captured by FY4A. In addition, Figure 9 presents additional comparisons of IRW BT, WV BT, and WV−IRW BTD between H8 and FY4A for this case. A significant difference exists in the distribution of WV−IRW BTD for both GEO satellites (Figure 9c), indicating that the inconsistency in central wavelengths may also affect the results of OT detection.

3.3. Long-Term Evaluation Based on GPM Observation

To verify the accuracy of the results obtained from the above case studies, a total of 174 KuPR-observed OTs are used to conduct a long-term evaluation of the OT detection algorithms based on GEO satellites. First, two statistical indexes—probability of detection (POD) and false-alarm ratio (FAR)—are introduced for quantitative calculation. POD is defined as the ratio of the total number of successfully detected KuPR-observed OTs to the total number of KuPR-observed OTs. A successfully detected KuPR-observed OT refers to the presence of a GEO-detected OT within 10 km of the KuPR-observed OT region. FAR is calculated by dividing the total number of unsuccessful GEO-detected OTs by the total number of GEO-detected OTs. An unsuccessful detection means a GEO-detected OT that occurred 10 km away from the KuPR-observed OT region. The 10 km match radius used here accounts for the distance biases caused by storm motion, parallax correction, and other possible errors, as suggested in the previous approach of [48].
For H8, Table 1 shows that the original IRW-texture algorithm (B10) has a POD of 58.1% and a FAR of 61.9%, and the modified algorithm (B18) improves the POD to 69.5% but also increases the FAR to 72.6%. This suggests that relaxing the BT thresholds will result in an increase in both correct and incorrect OT detections. The IR contour-based algorithm also shares this characteristic. Both the POD and FAR increase clearly as the BTD shifts from −1 K to −6 K. However, it is found that the IR contour-based algorithm has a much lower FAR compared to the IRW-texture algorithm, while their PODs are at the same level. Specifically, as the BTD equals −3.6 K, the IR contour-based algorithm achieves a 36.6% FAR and a 62.1% POD, which is a reduction of 25.3% and an increase of 4.0% compared to the B10 algorithm, respectively. When the BTD reaches −5 K, both the IR contour-based and B18 algorithms have a POD of 69.5%, but the former’s FAR decreases by 24.3% relative to the latter’s.
For FY4A, the statistical results reveal that, due to the employment of relaxed BT thresholds, the B18 algorithm also has a greater POD and FAR than the B10 algorithm; however, the IR contour-based algorithm shows no significant changes in POD and FAR when different BTD values are used. On the other hand, in contrast to the results of H8, the POD of FY4A in the B10 and B18 algorithms is significantly reduced by 25.3% and 29.3%, respectively, and the corresponding FAR is increased by 15.6% and 7.6%. This feature is also shown in the IR contour-based algorithm, where H8 consistently exhibits a greater POD and a lower FAR than FY4A when the BTD range is between −1 K and −6 K.
In summary, the IR contour-based algorithm generally provides more accurate OT results than the IRW-texture algorithm under the same GEO satellite, particularly in reducing false OT detections. This conclusion is consistent with the findings of S19 on the identification of OTs in typhoons. At the same time, regardless of which algorithm is used, H8 significantly outperforms FY4A. Based on these case studies and long-term statistical evaluations, it is concluded that the combination of H8 and the IR contour-based algorithm is more suitable than other combinations for automated OT detections in eastern China.

4. Severe Weather Analysis Associated with OT Occurrence

4.1. Typical Examples

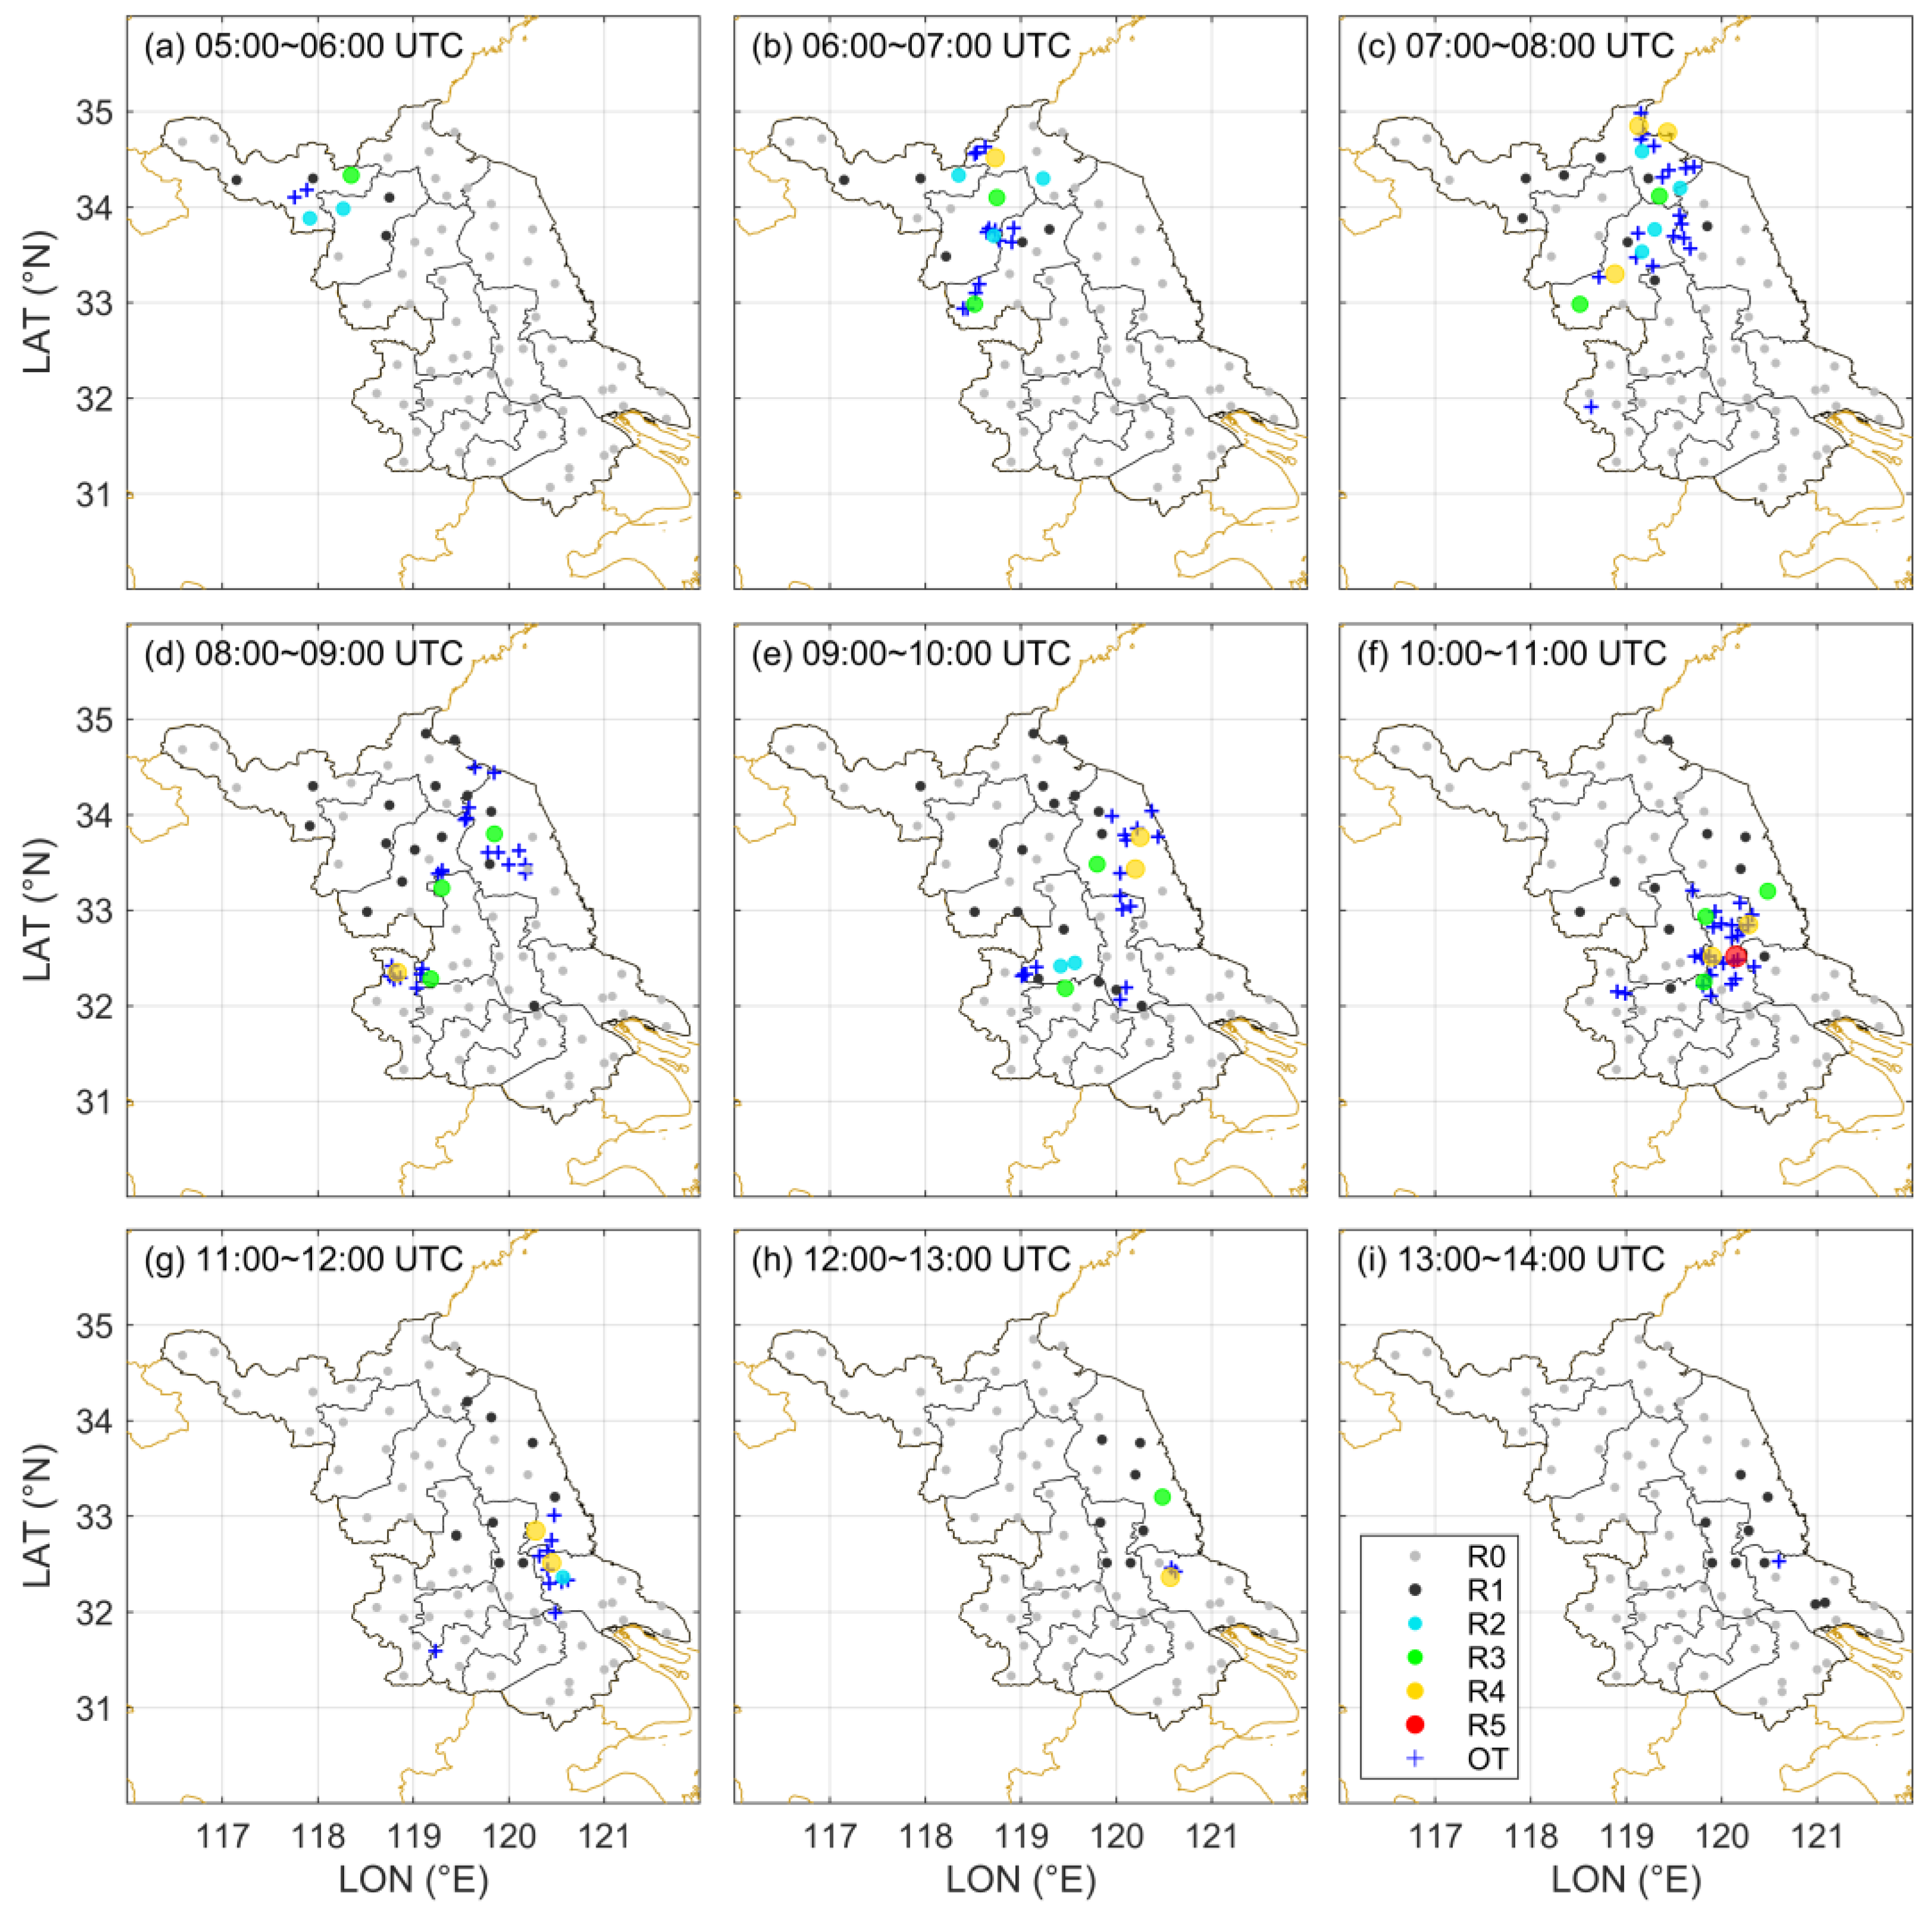
This section investigates the relationship between OTs detected by the IR contour-based algorithm in combination with H8 imagery every 10 min and severe weather events, with a focus on Jiangsu Province. Figure 10 illustrates the spatial distribution of hourly rainfall (dots) at weather stations and H8-detected OT locations (plus signs) on 28 July 2022. In general, the presence of OTs is typically accompanied by rainfall. As the OT number increases, so does the intensity and range of rainfall in their vicinity. Specifically, before the onset of heavy rainfall, only two OTs were recorded between 05:00 and 06:00 UTC, located near the weather stations where hourly rainfall exceeded 5 mm (Figure 10a). Subsequently, from 06:00 to 10:00 UTC (Figure 10b–e), the number of weather stations recording rainfall rapidly increased, and the rainfall intensity generally intensified as well. During this period, OTs appeared frequently, corresponding spatially to the heavy rainfall regions. At 10:00–11:00 UTC (Figure 10f), the rainfall intensity and the OT number reached their peak at 51.1 mm h−1 and 28, respectively. Then, the rainfall process began to weaken, and the OT number also decreased significantly (Figure 10g–i). In addition, we count the number of OTs that correspond to heavy rainfall records within a 30 km radius and present their respective time series in Figure 11. The result reveals that the occurrence of H8-detected OTs spans throughout the entire period of short-term heavy rainfall observed by each weather station. The timing of the initial and final OT seems to indicate the onset and end of the heavy rainfall record, respectively, exhibiting a high level of spatiotemporal consistency between them.
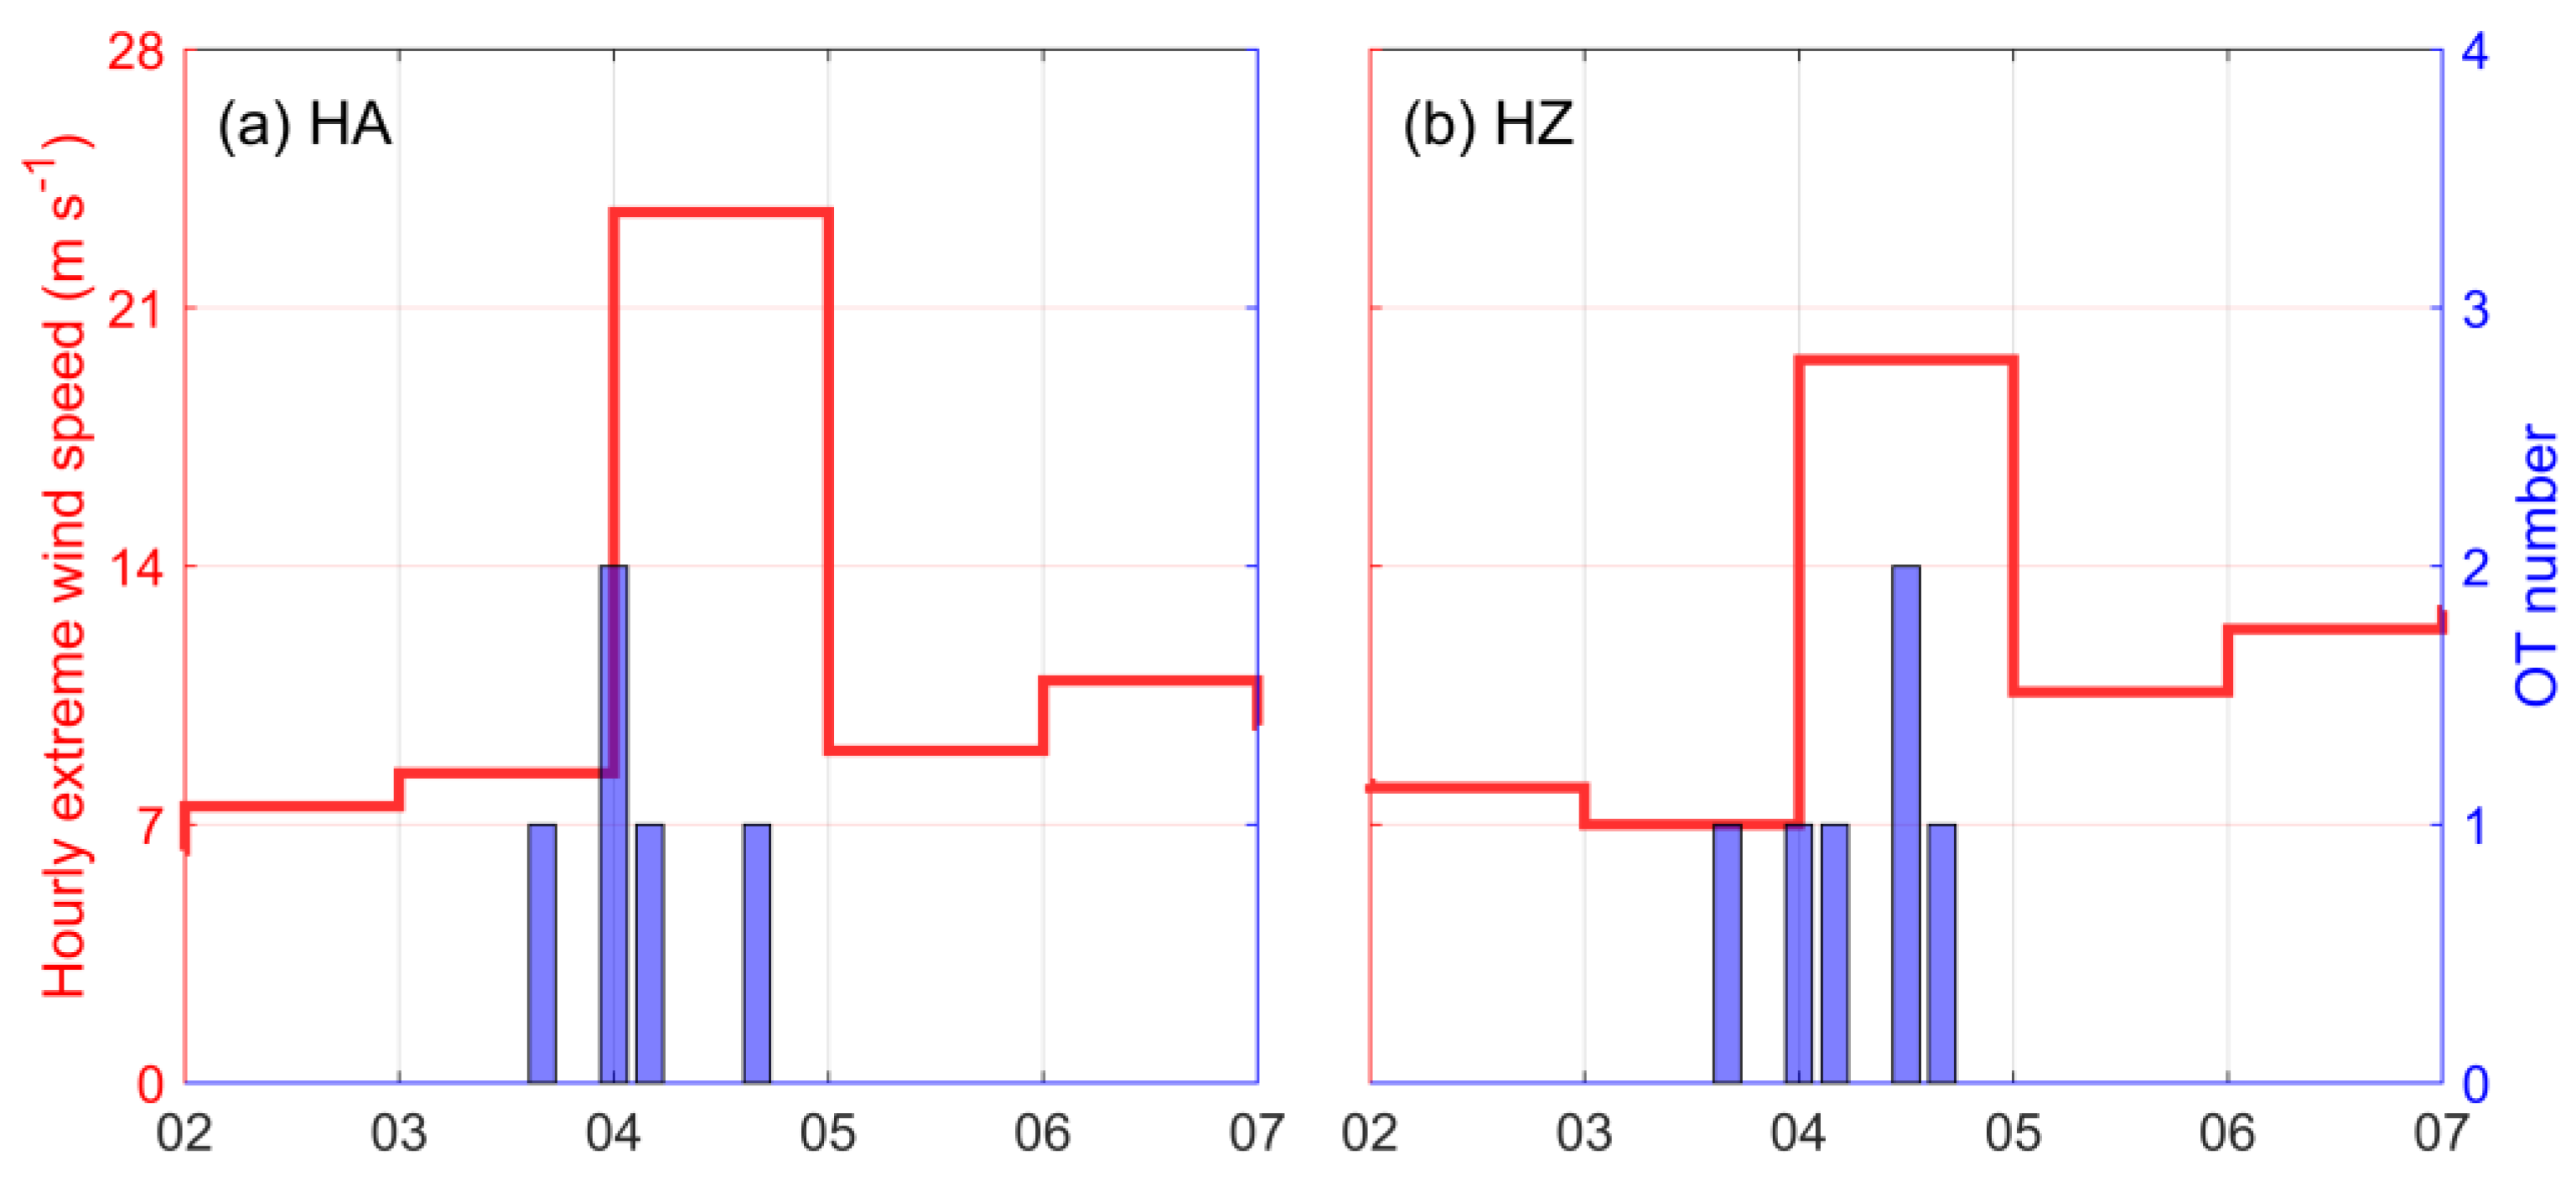
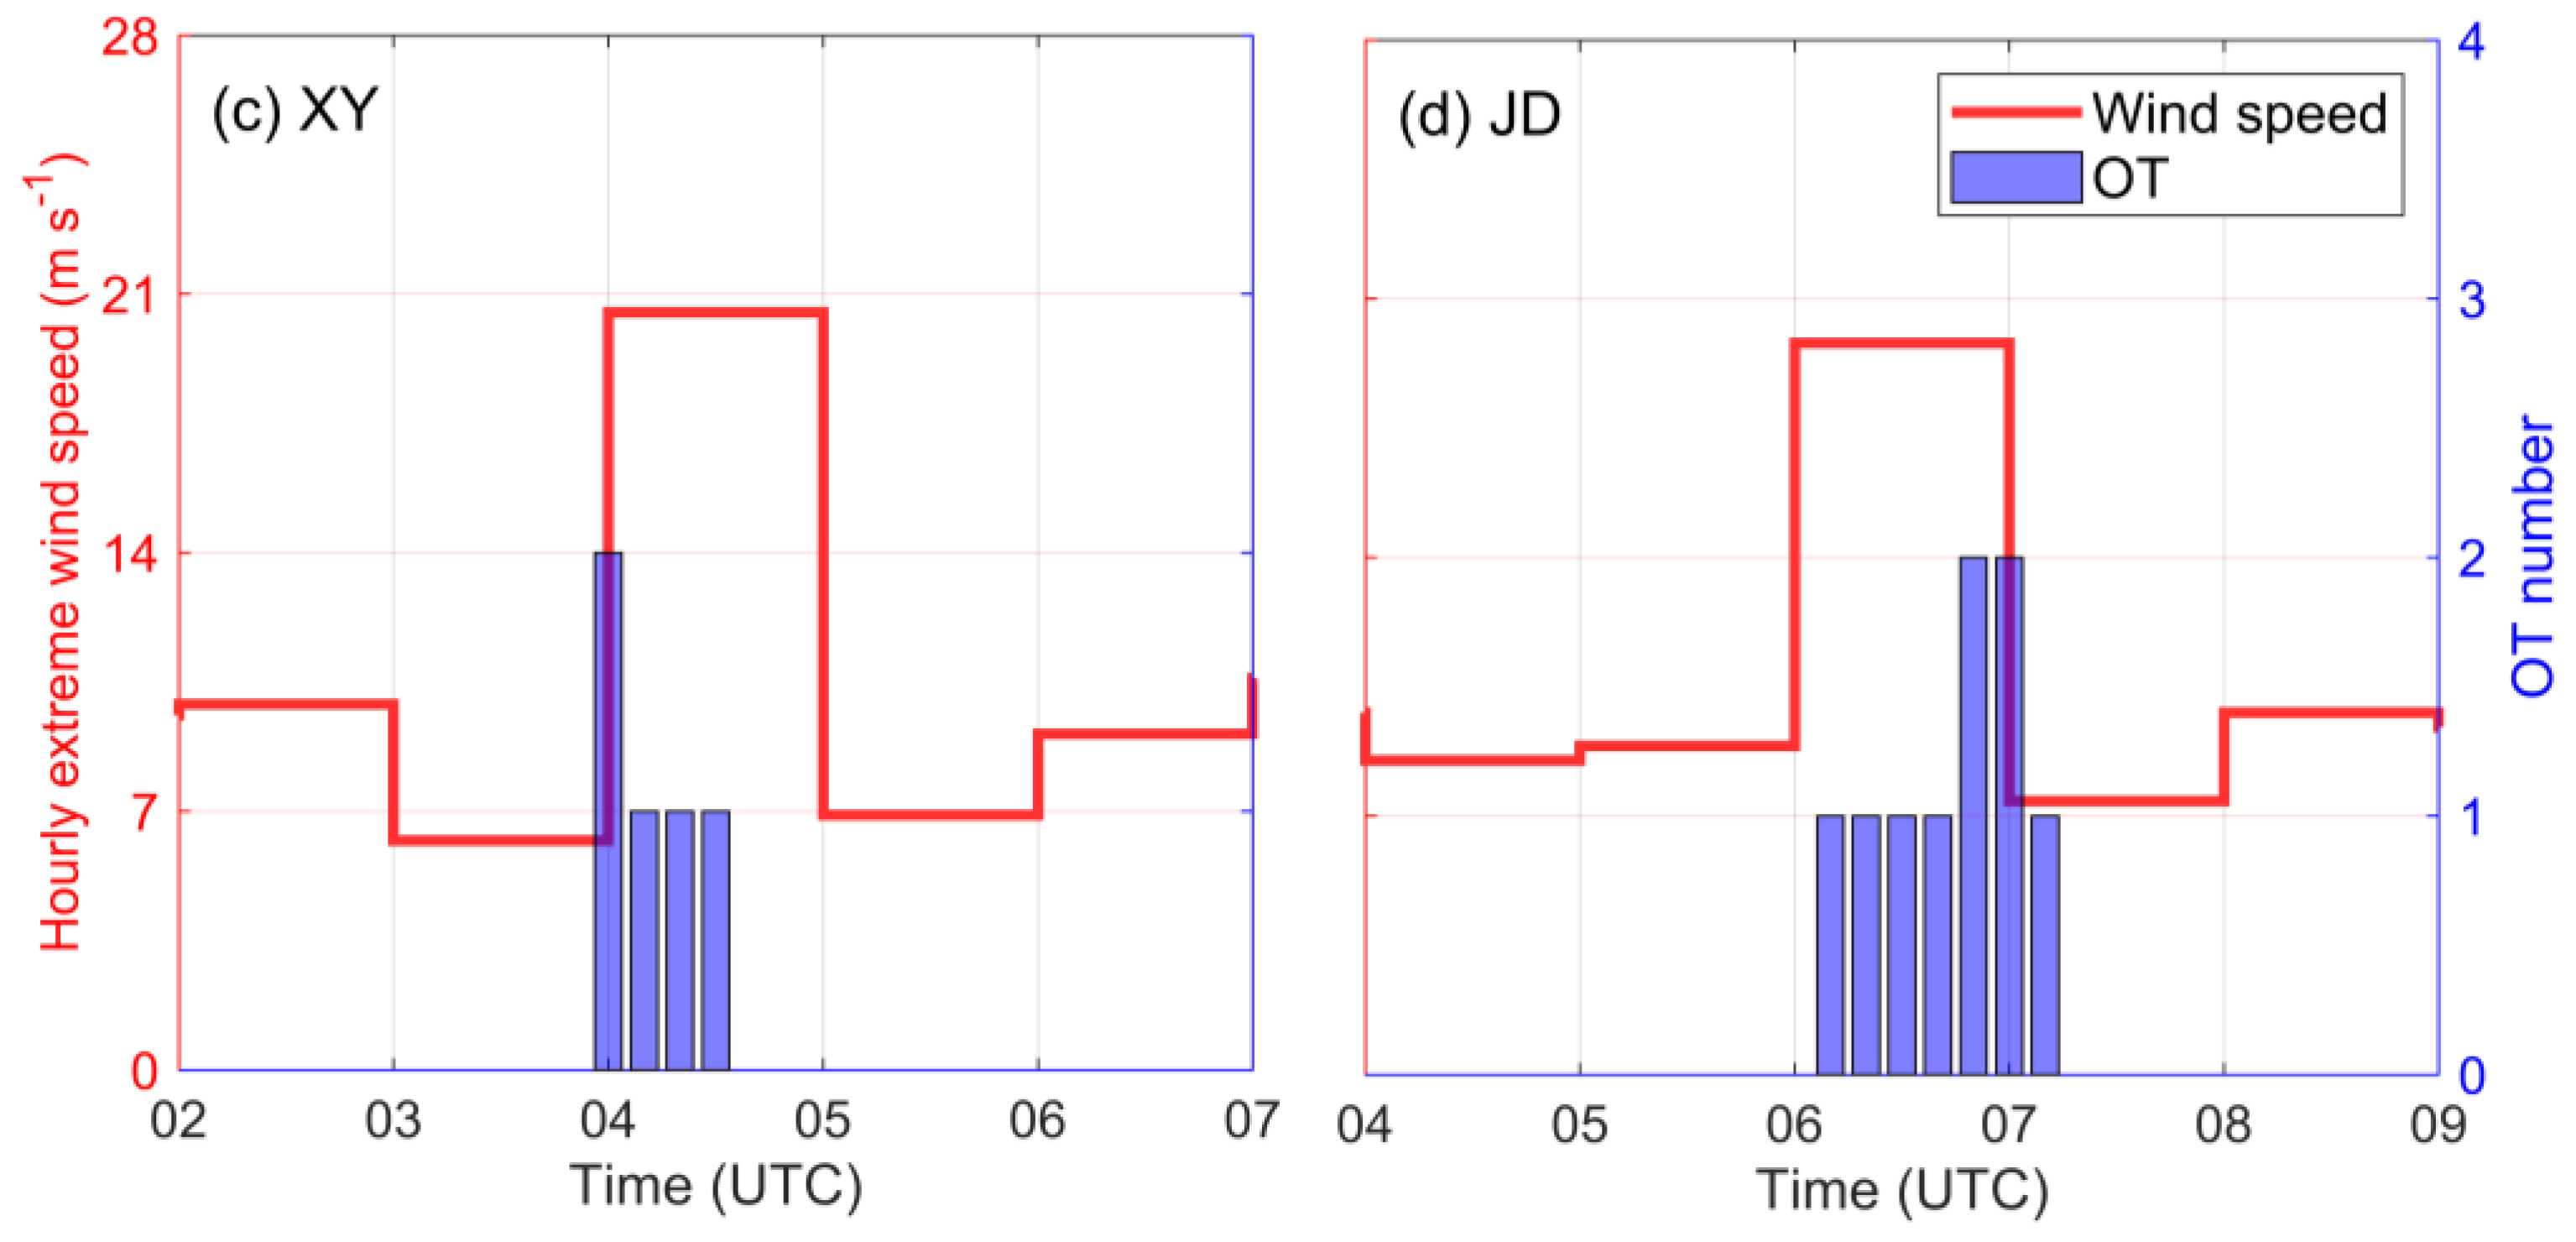
Regarding the extreme wind event, it displays characteristics similar to those of short-term heavy rainfall; for instance, the spatial distribution of hourly extreme wind speeds and corresponding H8-detected OT locations on 20 July 2022 suggests that the onset, intensification, and weakening of extreme wind speeds are consistent with the emergence, eruption, and disappearance of the OTs (Figure 12). Concurrently, the temporal distributions provided by individual weather stations indicate that the concentrated bursts of OTs and the occurrence of extreme wind speeds are closely aligned (Figure 13). However, it is worth noting that a cluster of H8-detected OTs occurred at 03:00–04:00 UTC, yet no hourly extreme wind speeds exceeding 10.8 m s−1 were recorded in its vicinity (Figure 12b). Until the next period (04:00–05:00 UTC; Figure 12c), the records above 17.2 m s−1 appear in the downstream adjacent area, with the highest reaching 23.6 m s−1. This feature was also mentioned in [4]. As the strong updraft within an OT rapidly weakens, the high-energy air accumulated at upper levels quickly descends to the surface, generating divergent and destructive winds. Consequently, when an OT begins to form and gradually intensifies, strong surface winds may not be immediately observed.

4.2. Statistical Analysis

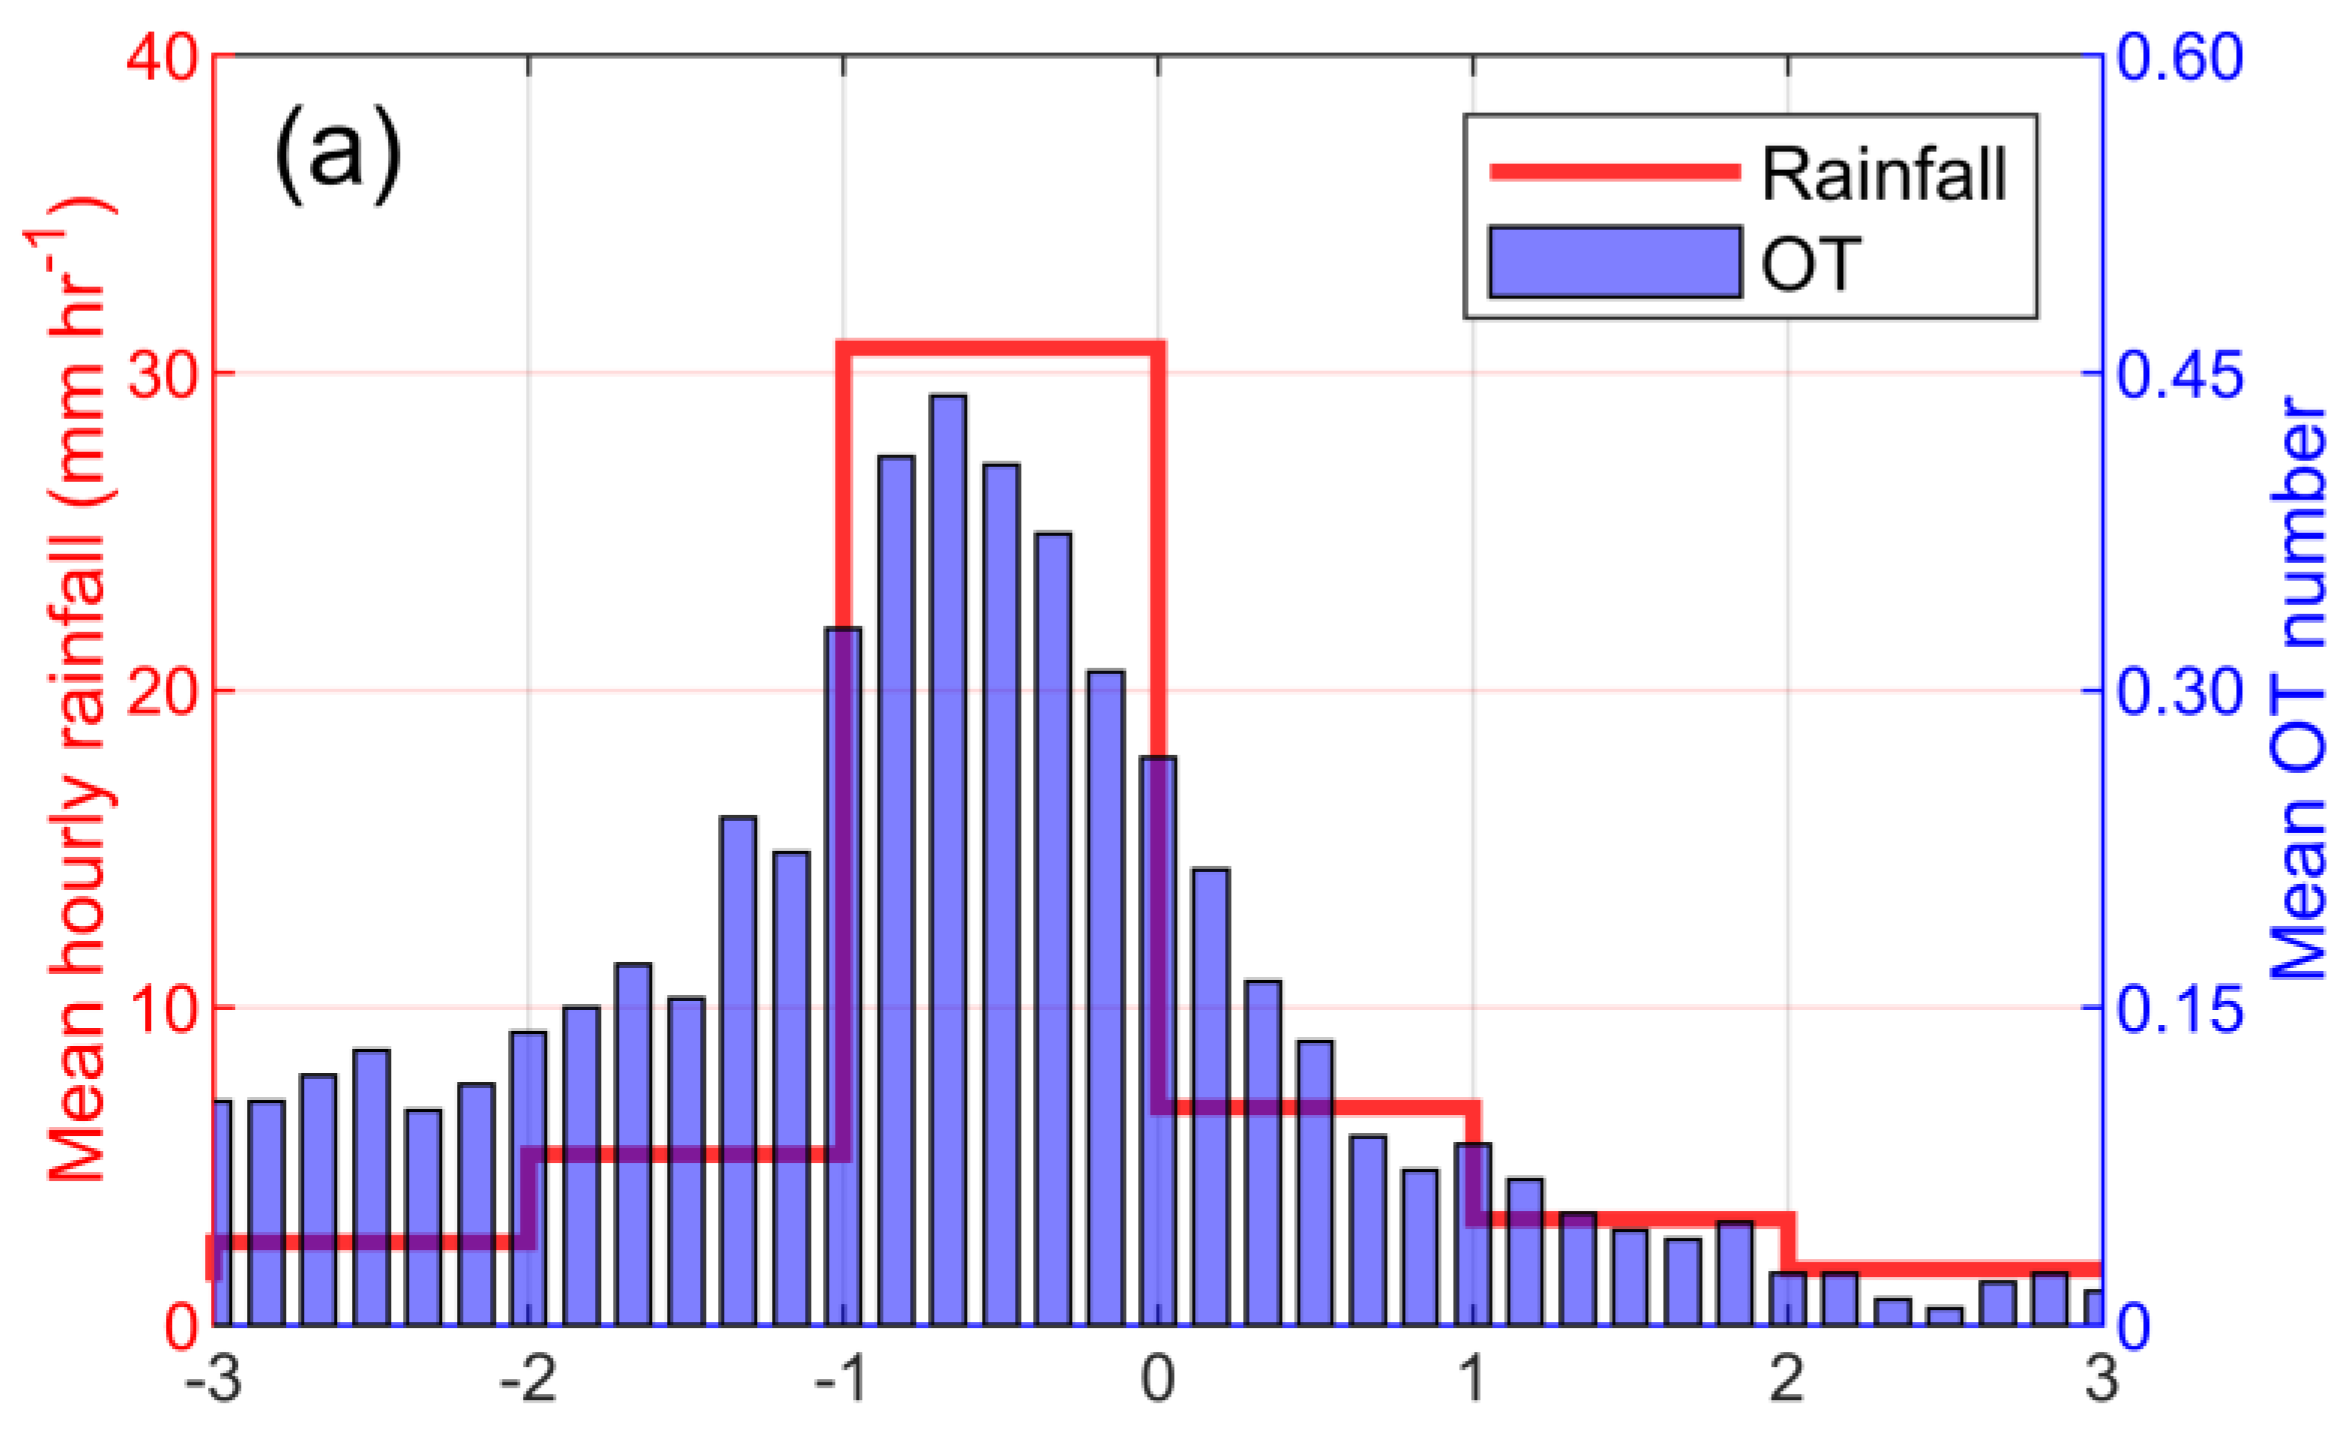
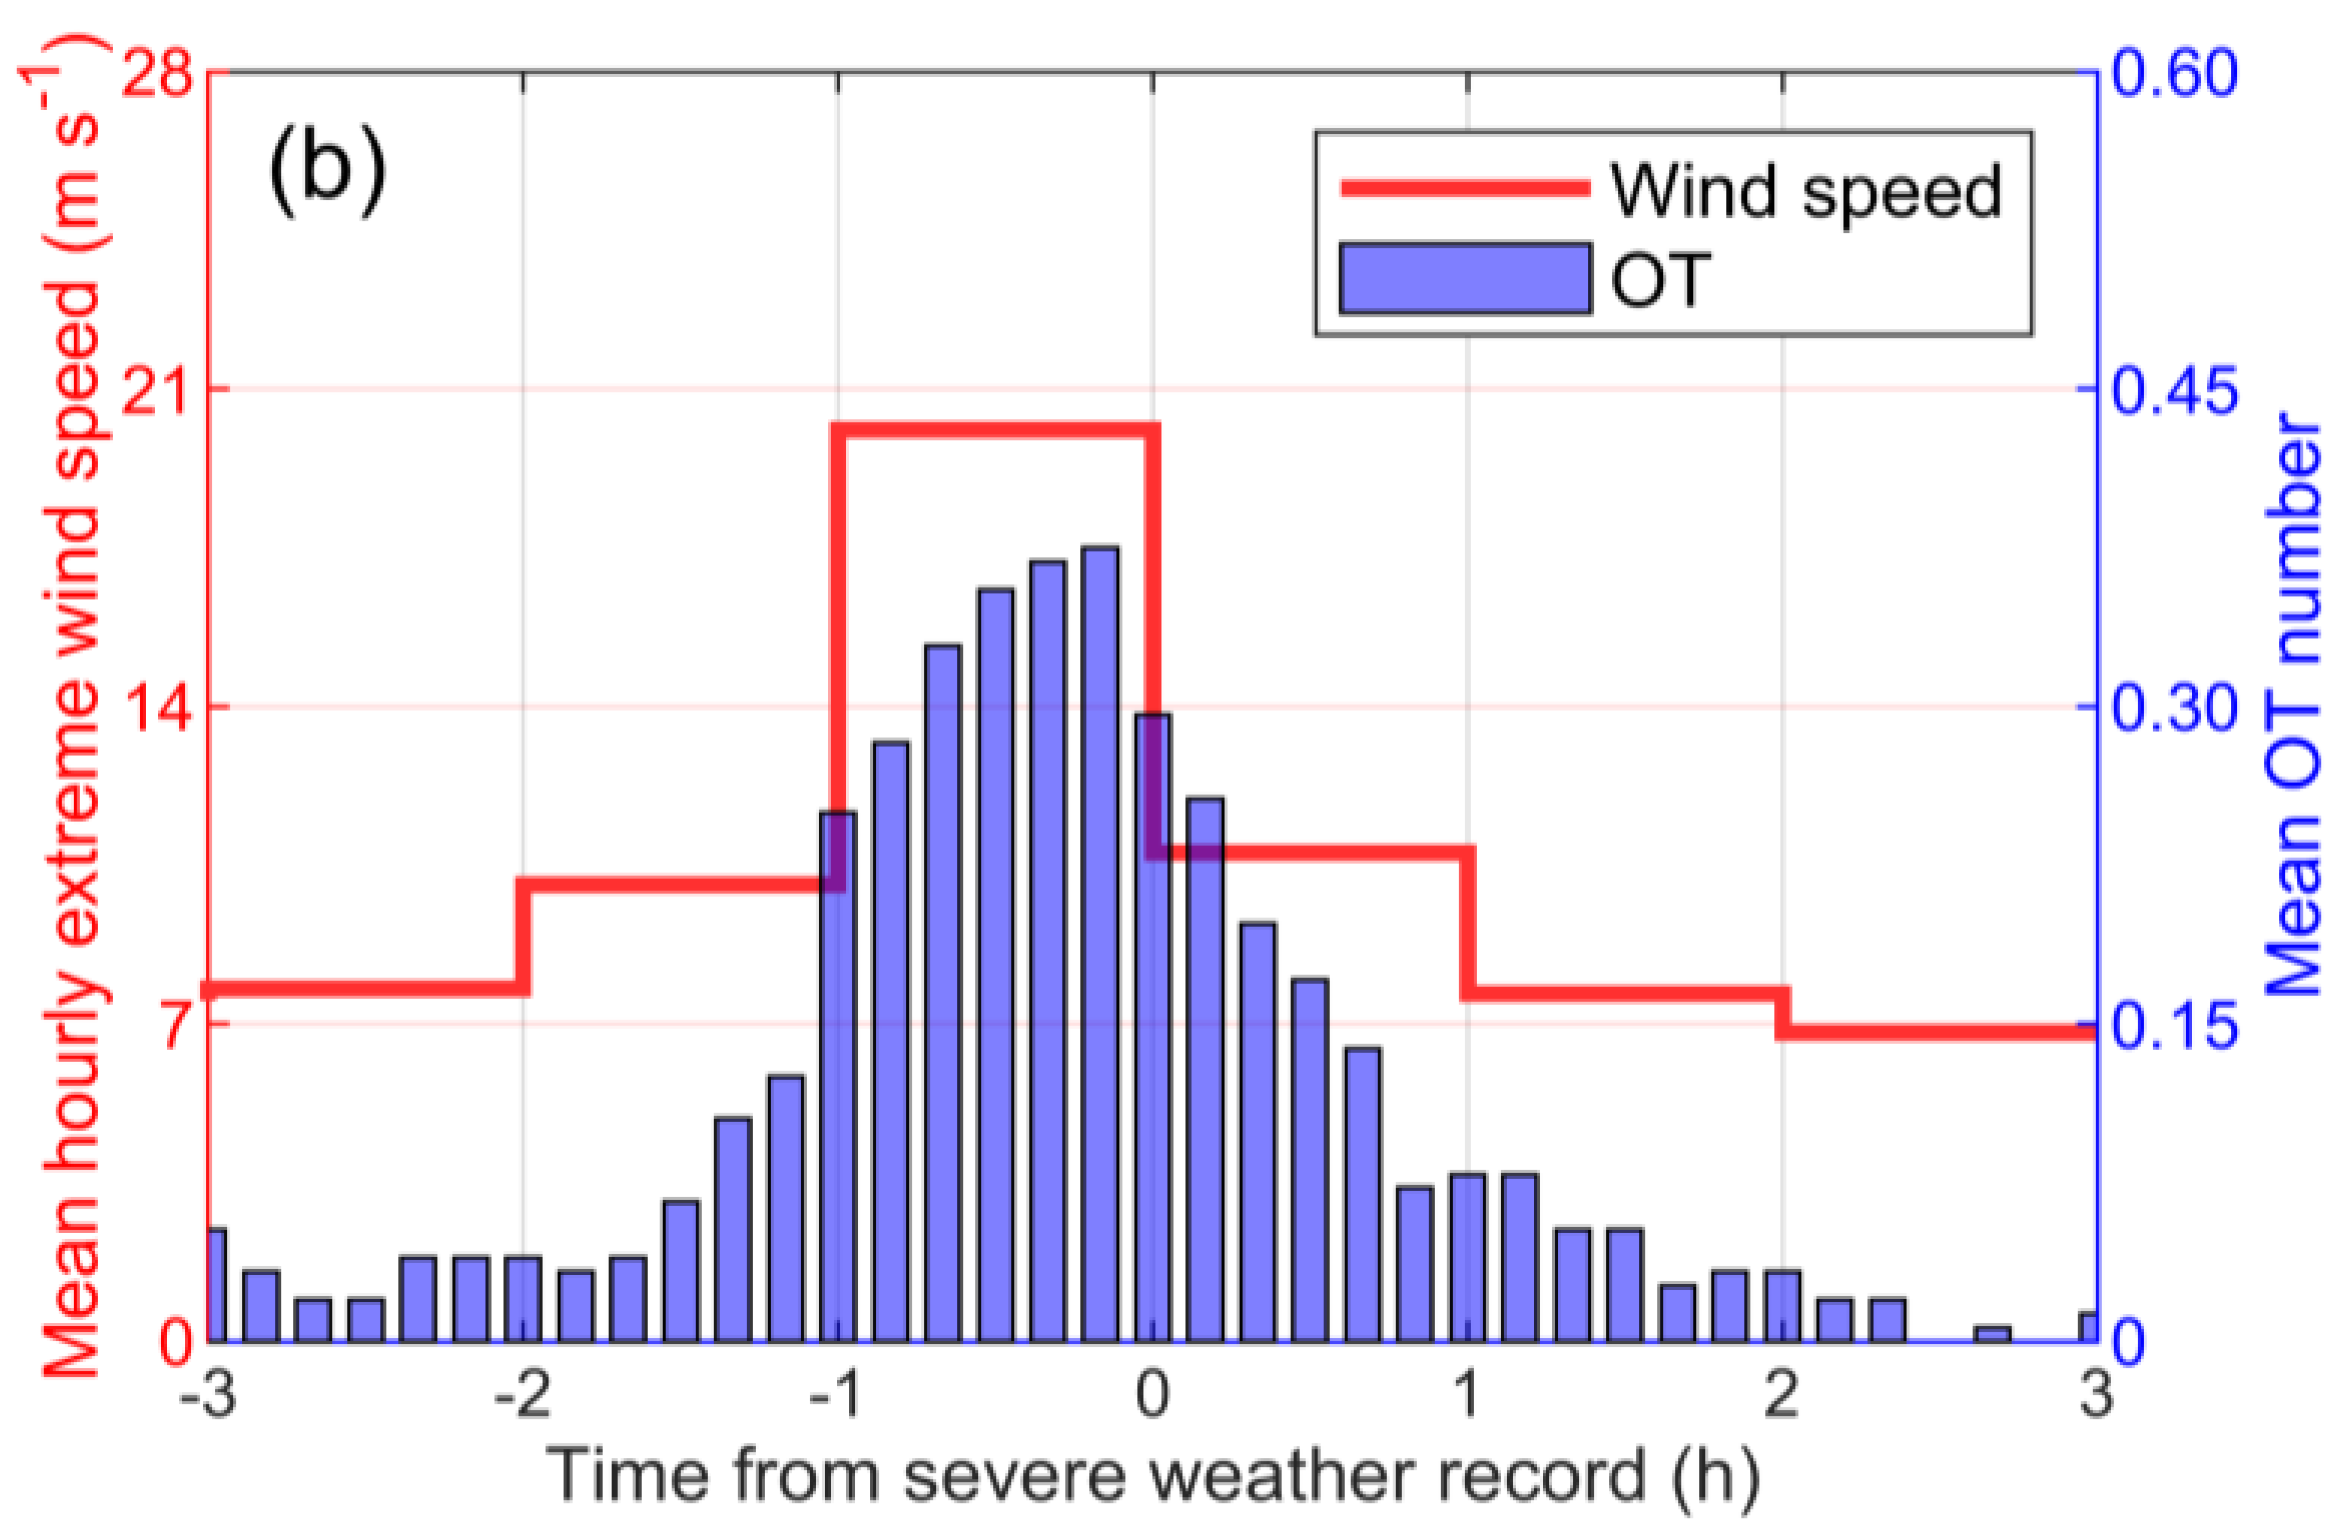
Based on 246 records of short-term heavy rainfall and 152 records of extreme wind collected from the weather stations over Jiangsu Province during May to September 2022, we further quantified the relationship between these severe weather events and OT detections. Figure 14 shows the time series of these records and the number of matched OT detections within a 30 km space window. On average, the hourly rainfall and hourly extreme wind speed reach their respective maximums of 30.8 mm h−1 and 20.1 m s−1, and the prominent maximum of OT numbers also occurs in the same periods. Furthermore, we add a 30 min time window to calculate the matched percentage between them. The result exhibits the matched percentages of H8-detected OTs for all short-term heavy rainfall records and extreme wind records to be 61.8% and 54.0%, respectively, greater than the equivalent statistics of severe weather documented by [2] in Europe and [3] in the United States. These findings mean that OTs identified by H8 combined with the IR contour-based algorithm serve as a good indicator for the occurrence of severe weather events in eastern China.

5. Discussion

In this study, we compare and evaluate the performance of four different combinations of OT detection methods in eastern China. The combinations include two GEO satellites, H8 and FY4A, paired with two OT detection algorithms: the IRW-texture and the IR contour-based algorithms. H8 exhibits superior performance to FY4A, attributed to its finer spatial resolution, which can capture the small regions of extremely cold IRW BTs within OTs. This conclusion is consistent with the study by [22], who found that the 3 km resolution Meteosat-9 outperforms both the 4 km resolution GOES-12 and the 5 km resolution Multifunction Transport Satellite in IRW-texture OT detection when using the space-borne-observed OT dataset as a reference. We also found that the IR contour-based algorithm outperforms the IRW-texture algorithm. This is attributed to the utilization of the WV−IRW BTD and BT contours, which effectively eliminates many unnecessary detections in the non-convection and shallow-convection regions, thereby reducing the FAR and improving the overall performance of OT detections.
The selection of these algorithms is based on their convenience and universality in operation. Our findings reveal that the IR contour-based algorithm, when used in conjunction with the H8 satellite, outperforms the other combinations, achieving a 62.1% POD and a 36.6% FAR. Although the accuracy of these metrics satisfies the current requirements for weather and climate analysis, an upgrade of the IR contour-based algorithm with more sophisticated procedures may be necessary for future research.
In the analysis of severe weather events, we only focused on the number of OTs without discussing other OT attributes, such as area [6,49], height [50], and duration [51]. It remains unclear whether these attributes of H8-detected OTs have a significant relationship with the presence of short-term heavy rainfall and extreme wind. Previous studies have reported that the width of the storm’s updraft, as measured by the area of the GEO-detected OT, is strongly correlated with tornado intensity [6]. Therefore, future research should include a more comprehensive examination of other OT attributes to better understand their relationship with severe weather events.

6. Conclusions

Taking the OT dataset derived from multiyear space-borne radar satellite (GPM) observations as truth, this study first presents a detailed case analysis and long-term quantitative evaluation on the performance of two commonly used OT detection algorithms (the IRW-texture and the IR contour-based algorithms) with two GEO satellites (H8 and FY4A) in eastern China. Subsequently, the relationship between GEO-detected OTs and severe weather events, including short-term heavy rainfall and extreme wind, is examined. Our findings are summarized as follows:
(1)
The IR contour-based algorithm paired with the H8 satellite exhibits better performance than the other combinations for automated OT detections in eastern China. Specifically, the H8 satellite identifies OTs with higher accuracy than FY4A in both algorithms, as evidenced by a greater POD and a lower FAR. Furthermore, the IR contour-based algorithm outperforms the IRW-texture algorithm in overall OT detection accuracy, particularly in reducing the FAR.
(2)
OTs detected by the IR contour-based algorithm using the H8 satellite serve as a good indicator for occurrences of severe weather events. Specifically, concentrated bursts of H8-detected OTs are spatiotemporally in agreement with occurrences of severe weather events. Under the matched criteria of a 30 min time window and 30 km space window, the matched percentages of H8-detected OTs for short-term heavy rainfall and extreme wind are 61.8% and 54.0%, respectively.

Author Contributions

Conceptualization, L.S. and X.Z.; methodology, L.S. and X.Z.; software, L.S.; formal analysis, L.S.; investigation, L.S.; resources, X.Z.; data curation, L.S.; writing—original draft preparation, L.S.; writing—review and editing, X.Z. and S.Z.; visualization, L.S.; supervision, X.Z.; project administration, X.Z.; funding acquisition, L.S. All authors have read and agreed to the published version of the manuscript.

Funding

This research was funded by the National Natural Science Foundation of China (42305009, 42175006).

Data Availability Statement

The Himawari-8 data were obtained from the Japan Aerospace Exploration Agency (https://www.eorc.jaxa.jp/ptree/, accessed on 15 May 2023). The Fengyun-4A data were provided by the FENGYUN Satellite Data Center (https://satellite.nsmc.org.cn/PortalSite/Data/Satellite.aspx, accessed on 22 May 2023). The GPM DPR data were openly available from the National Aeronautics and Space Administration Goddard Earth Sciences Data and Information Services Center (https://doi.org/10.5067/GPM/DPR/GPM/2A/07, accessed on 11 March 2023). The weather station data used in this study are available upon request from the corresponding author.

Acknowledgments

The authors thank Shaofeng Hua, Gang Chen, the editors, and the anonymous reviewers for their valuable advice on this study.

Conflicts of Interest

The authors declare no conflicts of interest.

References

  1. Brunner, J.C.; Ackerman, S.A.; Bachmeier, A.S.; Rabin, R.M. A quantitative analysis of the enhanced-V feature in relation to severe weather. Weather Forecast. 2007, 22, 853–872. [Google Scholar] [CrossRef]
  2. Bedka, K.M. Overshooting cloud top detections using MSG SEVIRI infrared brightness temperatures and their relationship to severe weather over Europe. Atmos. Res. 2011, 99, 175–189. [Google Scholar] [CrossRef]
  3. Dworak, R.; Bedka, K.; Brunner, J.; Feltz, W. Comparison between GOES-12 Overshooting-Top Detections, WSR-88D Radar Reflectivity, and Severe Storm Reports. Weather Forecast. 2012, 27, 684–699. [Google Scholar] [CrossRef]
  4. Bedka, K.M.; Wang, C.; Rogers, R.; Carey, L.; Feltz, W.; Kanak, J. Examining Deep Convective Cloud Evolution Using Total Lightning, WSR-88D, and GOES-14 Super Rapid Scan Datasets. Weather Forecast. 2015, 30, 571–590. [Google Scholar] [CrossRef]
  5. Bluestein, H.B.; Lindsey, D.T.; Bikos, D.; Reif, D.W.; Wienhoff, Z.B. The Relationship between Overshooting Tops in a Tornadic Supercell and Its Radar-Observed Evolution. Mon. Weather Rev. 2019, 147, 4151–4176. [Google Scholar] [CrossRef]
  6. Marion, G.R.; Trapp, R.J.; Nesbitt, S.W. Using Overshooting Top Area to Discriminate Potential for Large, Intense Tornadoes. Geophys. Res. Lett. 2019, 46, 12520–12526. [Google Scholar] [CrossRef]
  7. Rigo, T.; Farnell Barqué, C. Evaluation of the Radar Echo Tops in Catalonia: Relationship with Severe Weather. Remote Sens. 2022, 14, 6265. [Google Scholar] [CrossRef]
  8. Guimond, S.R.; Heymsfield, G.M.; Turk, F.J. Multiscale observations of Hurricane Dennis (2005): The effects of hot towers on rapid intensification. J. Atmos. Sci. 2010, 67, 633–654. [Google Scholar] [CrossRef]
  9. Hoffmann, L.; Wu, X.; Alexander, M.J. Satellite observations of stratospheric gravity waves associated with the intensification of tropical cyclones. Geophys. Res. Lett. 2018, 45, 1692–1700. [Google Scholar] [CrossRef]
  10. Yang, S.; Tang, X.B.; Zhong, S.X.; Chen, B.; Zhou, Y.S.; Gao, S.T.; Wang, C.X. Convective bursts episode of the rapidly intensified Typhoon Mujigae. Adv. Atmos. Sci. 2019, 36, 541–556. [Google Scholar] [CrossRef]
  11. Zhuge, X.Y.; Ming, J.; Wang, Y. Reassessing the use of inner-core hot towers to predict tropical cyclone rapid intensification. Weather Forecast. 2015, 30, 1265–1279. [Google Scholar] [CrossRef]
  12. Sun, L.X.; Tang, X.D.; Zhuge, X.Y.; Tan, Z.M.; Fang, J. Diurnal Variation of Overshooting Tops in Typhoons Detected by Himawari-8 Satellite. Geophys. Res. Lett. 2021, 48, e2021GL095565. [Google Scholar] [CrossRef]
  13. Wright, J.S.; Sobel, A.H.; Schmidt, G.A. Influence of condensate evaporation on water vapor and its stable isotopes in a GCM. Geophys. Res. Lett. 2009, 36, L12804. [Google Scholar] [CrossRef]
  14. Sang, W.; Huang, Q.; Tian, W.; Wright, J.S.; Zhang, J.; Tian, H.; Luo, J.; Hu, D.; Han, Y. A large Eddy model study on the effect of overshooting convection on lower stratospheric water vapor. J. Geophys. Res. 2018, 123, 10023–10036. [Google Scholar] [CrossRef]
  15. Liu, C.; Zipser, E.J. Global distribution of convection penetrating the tropical tropopause. J. Geophys. Res. Atmos. 2005, 110, D23104. [Google Scholar] [CrossRef]
  16. Liu, N.; Liu, C. Global distribution of deep convection reaching tropopause in 1 year GPM observations. J. Geophys. Res. Atmos. 2016, 121, 3824–3842. [Google Scholar] [CrossRef]
  17. Liu, N.; Liu, C.; Hayden, L. Climatology and Detection of Overshooting Convection from 4 Years of GPM Precipitation Radar and Passive Microwave Observations. J. Geophys. Res. Atmos. 2020, 125, e2019JD032003. [Google Scholar] [CrossRef]
  18. Sun, L.X.; Zhuge, X.Y.; Wang, Y. A Contour-Based Algorithm for Automated Detection of Overshooting Tops Using Satellite Infrared Imagery. IEEE Trans. Geosci. Remote Sens. 2019, 57, 497–508. [Google Scholar] [CrossRef]
  19. Hong, Y.; Nesbitt, S.W.; Trapp, R.J.; Di Girolamo, L. Near-global distributions of overshooting tops derived from Terra and Aqua MODIS observations. Atmos. Meas. Tech. 2023, 16, 1391–1406. [Google Scholar] [CrossRef]
  20. Schmetz, J.; Tjemkes, S.A.; Gube, M.; van de Berg, L. Monitoring deep convection and convective overshooting with Meteosat. Adv. Space Res. 1997, 19, 433–441. [Google Scholar] [CrossRef]
  21. Setvák, M.; Rabin, R.M.; Wang, P.K. Contribution of the MODIS instrument to observations of deep convective storms and stratospheric moisture detection in GOES and MSG imagery. Atmos. Res. 2007, 83, 505–518. [Google Scholar] [CrossRef]
  22. Bedka, K.M.; Dworak, R.; Brunner, J.; Feltz, W. Validation of Satellite-Based Objective Overshooting Cloud-Top Detection Methods Using CloudSat Cloud Profiling Radar Observations. J. Appl. Meteorol. Climatol. 2012, 51, 1811–1822. [Google Scholar] [CrossRef]
  23. Mikuš, P.; Mahović, N.S. Satellite-based overshooting top detection methods and an analysis of correlated weather conditions. Atmos. Res. 2013, 123, 268–280. [Google Scholar] [CrossRef]
  24. Jurković, P.M.; Mahovic, N.S.; Pocakal, D. Lightning, overshooting top and hail characteristics for strong convective storms in Central Europe. Atmos. Res. 2015, 161, 153–168. [Google Scholar] [CrossRef]
  25. Bedka, K.; Brunner, J.; Dworak, R.; Feltz, W.; Otkin, J.; Greenwald, T. Objective Satellite-Based Detection of Overshooting Tops Using Infrared Window Channel Brightness Temperature Gradients. J. Appl. Meteorol. Climatol. 2010, 49, 181–202. [Google Scholar] [CrossRef]
  26. Griffin, S.M.; Velden, C.S. Hazard Avoidance Products for Convectively-Induced Turbulence in Support of High-Altitude Global Hawk Aircraft Missions. Pure Appl. Geophys. 2019, 176, 2045–2055. [Google Scholar] [CrossRef]
  27. Monette, S.A.; Velden, C.S.; Griffin, K.S.; Rozoff, C.M. Examining Trends in Satellite-Detected Tropical Overshooting Tops as a Potential Predictor of Tropical Cyclone Rapid Intensification. J. Appl. Meteorol. Climatol. 2012, 51, 1917–1930. [Google Scholar] [CrossRef]
  28. Griffin, S.M. Climatology of Tropical Overshooting Tops in North Atlantic Tropical Cyclones. J. Appl. Meteorol. Climatol. 2017, 56, 1783–1796. [Google Scholar] [CrossRef]
  29. Sun, L.X.; Zhuge, X.Y.; Wang, Y. Favorable Environments for the Occurrence of Overshooting Tops in Tropical Cyclones. Adv. Atmos. Sci. 2017, 34, 532–544. [Google Scholar] [CrossRef]
  30. Proud, S.R. Analysis of overshooting top detections by Meteosat Second Generation: A 5-year dataset. Q. J. R. Meteorol. Soc. 2015, 141, 909–915. [Google Scholar] [CrossRef]
  31. Bedka, K.M.; Allen, J.T.; Punge, H.J.; Kunz, M.; Simanovic, D. A Long-Term Overshooting Convective Cloud-Top Detection Database over Australia Derived from MTSAT Japanese Advanced Meteorological Imager Observations. J. Appl. Meteorol. Climatol. 2018, 57, 937–951. [Google Scholar] [CrossRef]
  32. Bedka, K.M.; Khlopenkov, K. A Probabilistic Multispectral Pattern Recognition Method for Detection of Overshooting Cloud Tops Using Passive Satellite Imager Observations. J. Appl. Meteorol. Climatol. 2016, 55, 1983–2005. [Google Scholar] [CrossRef]
  33. Khlopenkov, K.V.; Bedka, K.M.; Cooney, J.W.; Itterly, K. Recent Advances in Detection of Overshooting Cloud Tops from Longwave Infrared Satellite Imagery. J. Geophys. Res. Atmos. 2021, 126, e2020JD034359. [Google Scholar] [CrossRef]
  34. Thiery, W.; Gudmundsson, L.; Bedka, K.M.; Semazzi, F.H.M.; Lhermitte, S.; Willems, P.; van Lipzig, N.P.M.; Seneviratne, S.I. Early warnings of hazardous storms over Lake Victoria. Environ. Res. Lett. 2017, 12, 074012. [Google Scholar] [CrossRef]
  35. Punge, H.J.; Bedka, K.M.; Kunz, M.; Werner, A. A new physically based stochastic event catalog for hail in Europe. Nat. Hazards 2014, 73, 1625–1645. [Google Scholar] [CrossRef]
  36. Thiery, W.; Davin, E.L.; Seneviratne, S.I.; Bedka, K.M.; Lhermitte, S.; van Lipzig, N. Hazardous thunderstorm intensification over Lake Victoria. Nat. Commun. 2016, 7, 12786. [Google Scholar] [CrossRef] [PubMed]
  37. Hourngir, D.; Panegrossi, G.; Casella, D.; Sanò, P.; D’Adderio, L.P.; Liu, C. A 4-Year Climatological Analysis Based on GPM Observations of Deep Convective Events in the Mediterranean Region. Remote Sens. 2021, 13, 1685. [Google Scholar] [CrossRef]
  38. Li, H.; Wei, X.; Min, M.; Li, B.; Nong, Z.; Chen, L. A Dataset of Overshooting Cloud Top from 12-Year CloudSat/CALIOP Joint Observations. Remote Sens. 2022, 14, 2417. [Google Scholar] [CrossRef]
  39. Bessho, K.; Date, K.; Hayashi, M.; Ikeda, A.; Imai, T.; Inoue, H.; Kumagai, Y.; Miyakawa, T.; Murata, H.; Ohno, T.; et al. An Introduction to Himawari-8/9—Japan’s New-Generation Geostationary Meteorological Satellites. J. Meteorol. Soc. Jpn. Ser. II 2016, 94, 151–183. [Google Scholar] [CrossRef]
  40. Yu, F.; Wu, X. Radiometric inter-calibration between Himawari-8 AHI and S-NPP VIIRS for the solar reflective bands. Remote Sens. 2016, 8, 165. [Google Scholar] [CrossRef]
  41. Zou, X.; Zhuge, X.; Weng, F. Characterization of Bias of Advanced Himawari Imager Infrared Observations from NWP Background Simulations Using CRTM and RTTOV. J. Atmos. Ocean. Technol. 2016, 33, 2553–2567. [Google Scholar] [CrossRef]
  42. Yang, J.; Zhang, Z.; Wei, C.; Lu, F.; Guo, Q. Introducing the New Generation of Chinese Geostationary Weather Satellites, Fengyun-4. Bull. Am. Meteorol. Soc. 2017, 98, 1637–1658. [Google Scholar] [CrossRef]
  43. Tang, F.; Zhuge, X.; Zeng, M.; Li, X.; Dong, P.; Han, Y. Applications of the Advanced Radiative Transfer Modeling System (ARMS) to Characterize the Performance of Fengyun-4A/AGRI. Remote Sens. 2021, 13, 3120. [Google Scholar] [CrossRef]
  44. Hou, A.Y.; Kakar, R.K.; Neeck, S.; Azarbarzin, A.A.; Kummerow, C.D.; Kojima, M.; Oki, R.; Nakamura, K.; Iguchi, T. The Global Precipitation Measurement Mission. Bull. Am. Meteorol. Soc. 2014, 95, 701–722. [Google Scholar] [CrossRef]
  45. Seto, S.; Iguchi, T.; Meneghini, R.; Awaka, J.; Kubota, T.; Masaki, T.; Takahashi, N. The Precipitation Rate Retrieval Algorithms for the GPM Dual-frequency Precipitation Radar. J. Meteorol. Soc. Jpn. Ser. II 2021, 99, 205–237. [Google Scholar] [CrossRef]
  46. Škerlak, B.; Sprenger, S.; Pfahl, M.; Tyrlis, E.; Wernli, H. Tropopause folds in ERA-Interim: Global climatology and relation to extreme weather events. J. Geophys. Res. Atmos. 2015, 120, 4860–4877. [Google Scholar] [CrossRef]
  47. Cooney, J.W.; Bowman, K.P.; Homeyer, C.R.; Fenske, T.M. Ten year analysis of tropopause-overshooting convection using GridRad data. J. Geophys. Res. Atmos. 2018, 123, 329–343. [Google Scholar] [CrossRef]
  48. Cooney, J.W.; Bedka, K.M.; Bowman, K.P.; Khlopenkov, K.V.; Itterly, K. Comparing Tropopause-Penetrating Convection Identifications Derived from NEXRAD and GOES Over the Contiguous United States. J. Geophys. Res. Atmos. 2021, 126, 1–23. [Google Scholar] [CrossRef]
  49. Trapp, R.J.; Marion, G.R.; Nesbitt, S.W. The Regulation of Tornado Intensity by Updraft Width. J. Atmos. Sci. 2017, 7, 4199–4211. [Google Scholar] [CrossRef]
  50. Griffin, S.M.; Bedka, K.M.; Velden, C.S. A Method for Calculating the Height of Overshooting Convective Cloud Tops Using Satellite-Based IR Imager and CloudSat Cloud Profiling Radar Observations. J. Appl. Meteorol. Climatol. 2016, 55, 479–491. [Google Scholar] [CrossRef]
  51. Jellis, D.; Bowman, K.P.; Rapp, A.D. Lifetimes of Overshooting Convective Events Using High-Frequency Gridded Radar Composites. Mon. Weather Rev. 2023, 151, 1979–1992. [Google Scholar] [CrossRef]
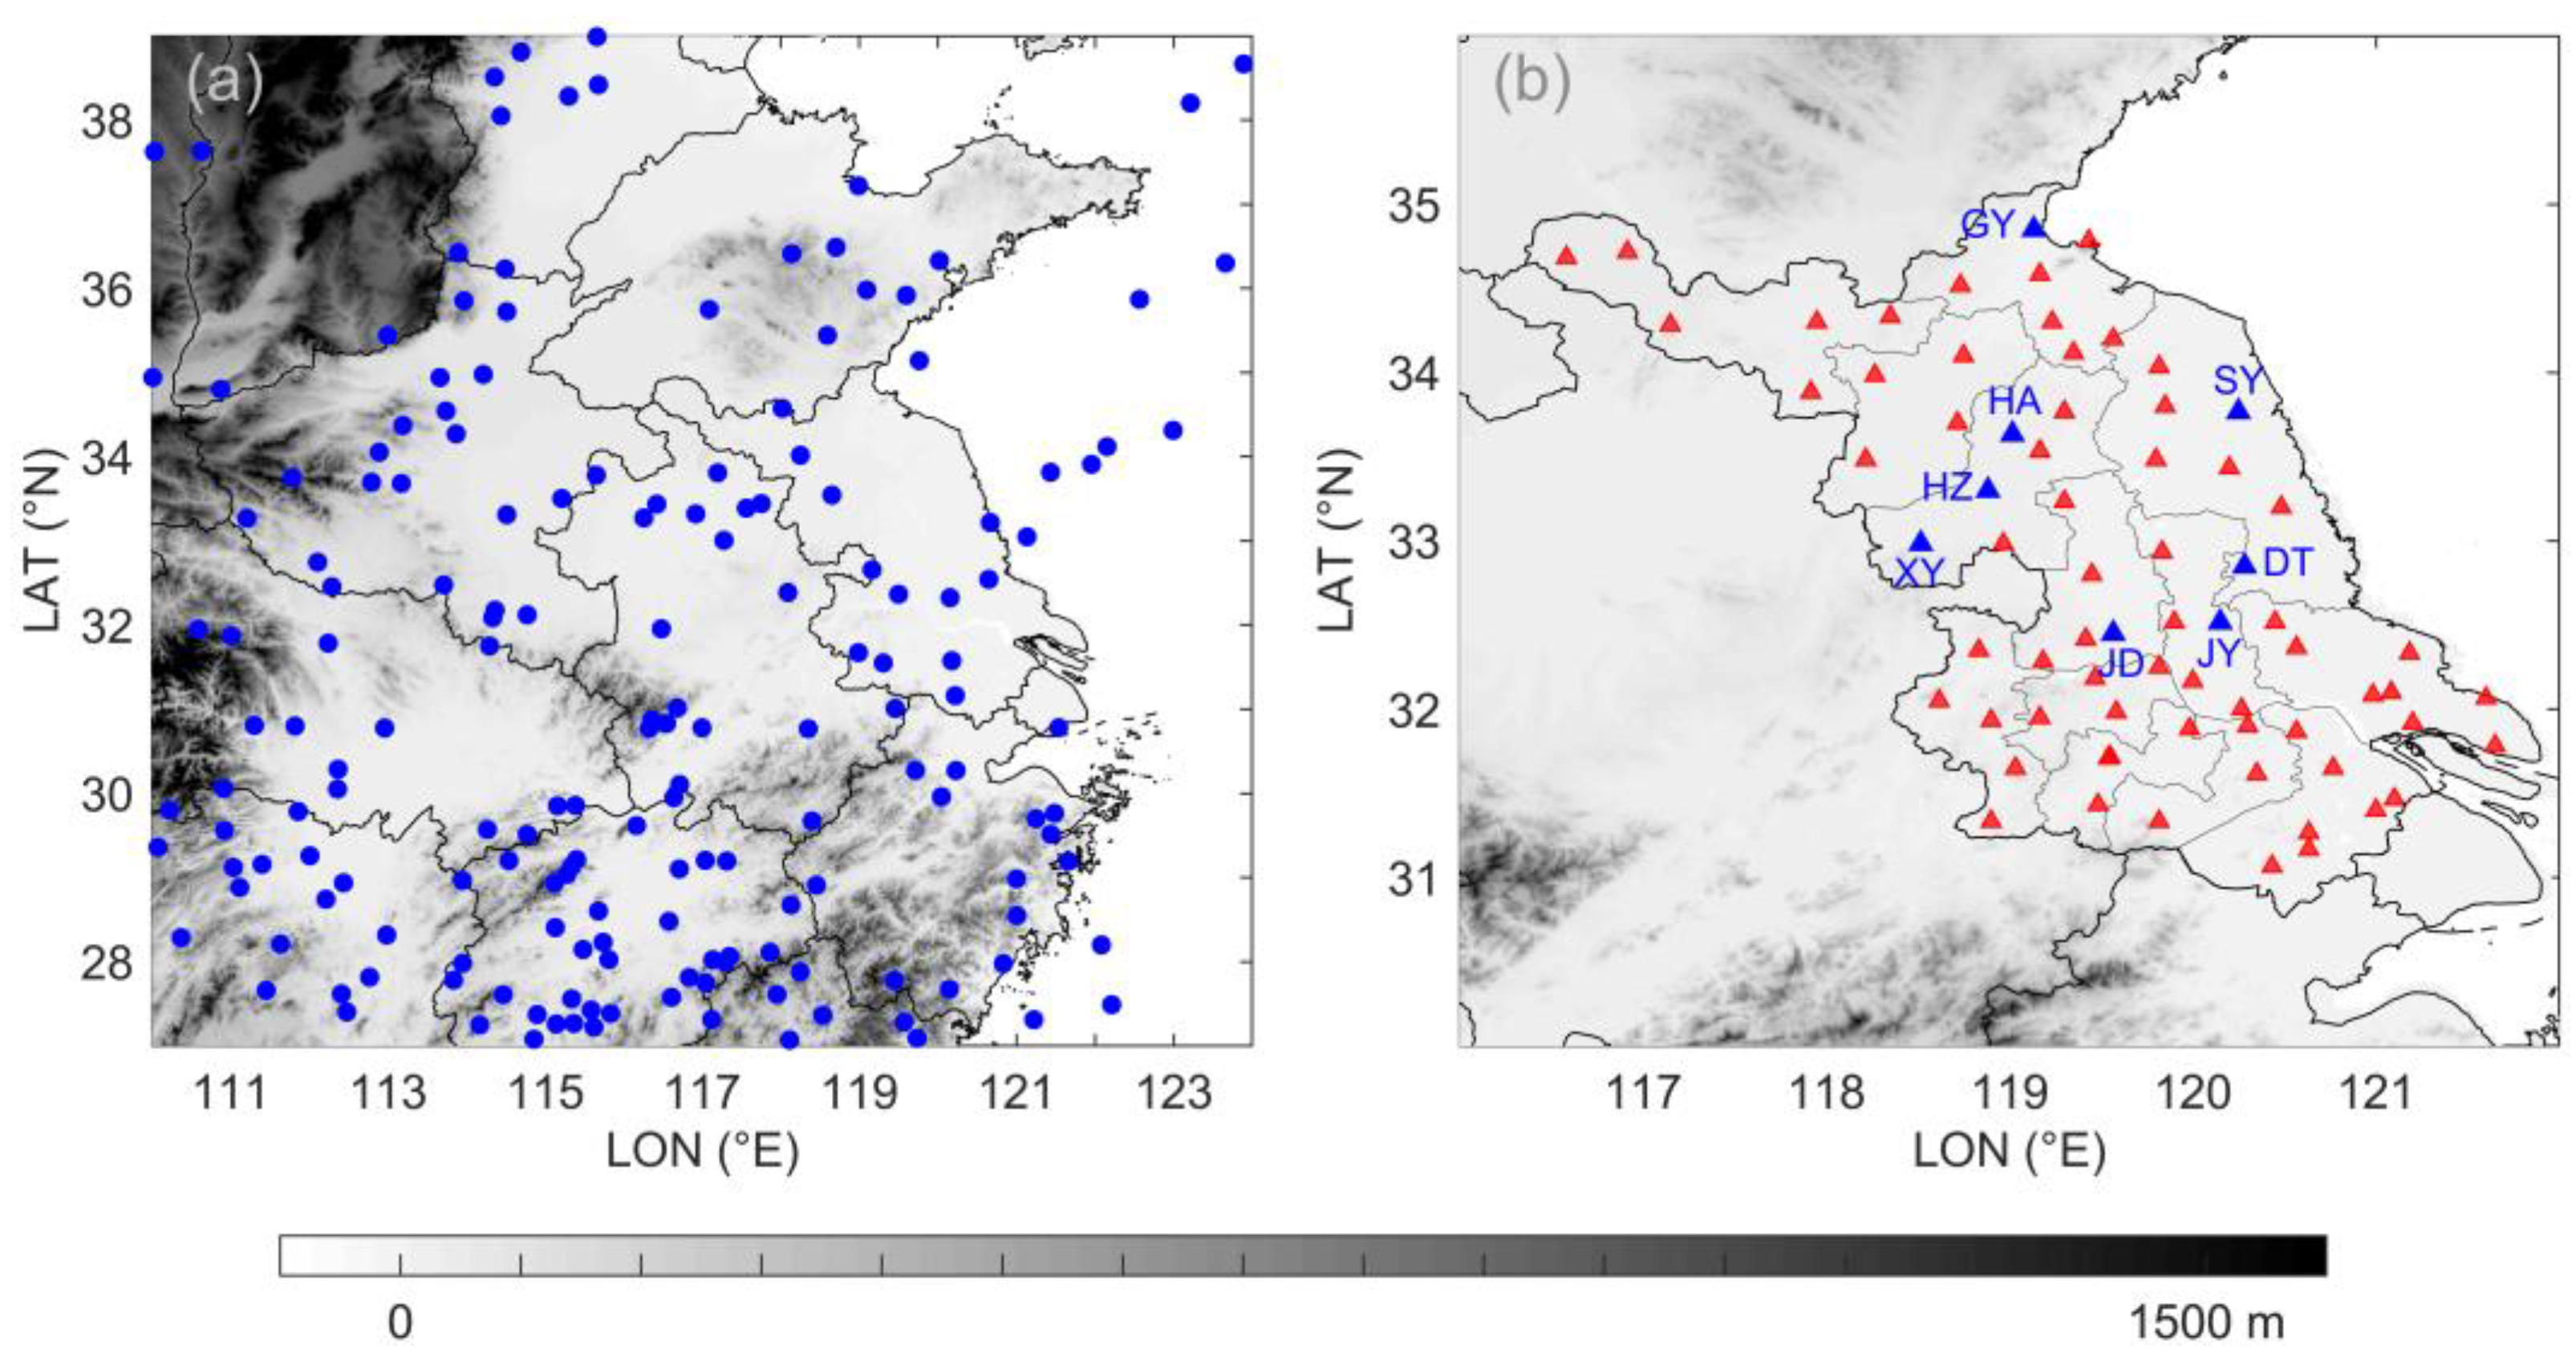
Figure 1. (a) Distribution map of the 174 OTs (dots) observed by KuPR/GPM from May to September in 2018–2022 in eastern China and (b) the locations of representative weather stations (blue triangles) including Ganyu (GY), Huai’an (HA), Hongze (HZ), Xuyi (XY), Sheyang (SY), Dongtai (DT), Jiangyan (JY), Jiangdu (JD), and other weather stations (red triangles) in Jiangsu Province. Grayscale shading: topography.
Remotesensing 16 02015 g001
Figure 2. Scatter plots of pixel-level comparisons between IRW BT and WV−IRW BTD for (a) subtropical continental convection and (b) WNP typhoons from AHI/H8 observations. Cumulative frequency distributions of the (c) IRW BT and (d) WV−IRW BTD for the pixels in (a,b). In (d), the horizontal dashed line represents the cumulative frequency value for WNP typhoon at BTD = −1 K (left dashed line) and for subtropical continental convection at BTD = −3.6 K (right dashed line). Only cold cloud pixels (IRW BT < 243.15 K) surrounding the OT regions are plotted here, and these OTs are collected by GPM observations from May to September in 2018. Color shading shows the normalized density distribution.
Remotesensing 16 02015 g002aRemotesensing 16 02015 g002b
Figure 3. (a) Vertical cross-section of reflectivity and (b) storm-top height from KuPR/GPM and (c) IRW BT from AHI/H8 at 10:10 UTC on 10 May 2021. The dashed line and solid line in (b,c) denote the edge of the KuPR swath and the location of the cross-section of (a), respectively.
Remotesensing 16 02015 g003
Figure 4. (a) IRW-texture OT detections (multiplication signs for B10 algorithm and squares for B18 algorithm), (b) IR contour-based OT detections (plus signs for MS19 algorithm), and (c) IRW BT contours for the case shown in Figure 3. In (a,b), the cyan (magenta) markers represent OT detections with (without) the occurrence of KuPR-observed OTs (blue dots). Grayscale shading: WV−IRW BTD. Dashed line: edge of the KuPR swath. Note that the OT locations have been parallax corrected.
Remotesensing 16 02015 g004
Figure 5. (a) Vertical cross-section of reflectivity and (b) storm-top height from KuPR/GPM and (c) IRW BT from AHI/H8 at 19:20 UTC on 21 June 2019. The dashed line and solid line in (b,c) denote the edge of the KuPR swath and the location of the cross-section of (a), respectively.
Remotesensing 16 02015 g005aRemotesensing 16 02015 g005b
Figure 6. (a) IRW-texture OT detections (multiplication signs for B10 algorithm and squares for B18 algorithm) and (b) IR contour-based OT detections (plus signs for MS19 algorithm) for the case shown in Figure 5. (c) The IRW BT values of AHI/H8 pixels correspond to the KuPR-observed OT region (location A) in (a,b). The cyan (magenta) markers, in (a,b), represent OT detections with (without) the occurrence of KuPR-observed OTs (blue dots), and the dashed lines indicate the edge of the KuPR swath. In (c), the red and yellow pixels indicate the locations of the candidate OT center and its surrounding anvil cloud pixels with an 8 km radius in 16 radial directions, respectively.
Remotesensing 16 02015 g006
Figure 7. IR contour-based OT detections (plus signs) based on (a) AHI/H8 and (b) AGRI/FY4A at 18:40 UTC on 7 August 2020. The cyan (magenta) markers represent OT detections with (without) the occurrence of KuPR-observed OTs (blue dots). Grayscale shading: WV−IRW BTD. Dashed line: edge of the KuPR swath.
Remotesensing 16 02015 g007
Figure 8. (a,b) IRW BT imagery and (c,d) BT contours for the case shown in Figure 7. The observations in (a,c) and (b,d) are from AHI/H8 and AGRI/FY4A, respectively. Dashed line: edge of the KuPR swath.
Remotesensing 16 02015 g008
Figure 9. Scatter plots of pixel-level comparisons between the AHI/H8 and ARGI/FY4A data for (a) IRW BT, (b) WV BT, and (c) WV−IRW BTD. Color shading shows the normalized density distribution. Black lines are the one-to-one ratio lines, and CC stands for correlation coefficient.
Remotesensing 16 02015 g009
Figure 10. Spatial distribution of the hourly rainfall (dots) at weather stations in Jiangsu Province overlaid on the OT locations (plus signs) detected by AHI/H8 every 10 min during the period of 05:00–14:00 UTC on 28 July 2022. The gray, black, cyan, green, yellow, and red dots correspond to an hourly rainfall intensity (R) < 0.1 mm, 0.1 ≤ R < 5 mm, 5 ≤ R < 10 mm, 10 ≤ R < 20 mm, 20 ≤ R < 50 mm, and R > 50 mm, respectively.
Remotesensing 16 02015 g010
Figure 11. Time series of hourly rainfall and corresponding number of OTs at the weather stations (a) JY, (b) SY, (c) GY, and (d) DT from the case in Figure 10. OTs are detected by AHI/H8 every 10 min and are simultaneously located within a 30 km radius around these weather stations.
Remotesensing 16 02015 g011
Figure 12. Spatial distribution of the hourly extreme wind speed (dots) at weather stations in Jiangsu Province overlaid on the OT locations (plus signs) detected by AHI/H8 every 10 min during the period of 02:00–11:00 UTC on 20 July 2022. The gray, black, green, yellow, and red dots correspond to an hourly extreme wind speed (V) < 10.8 m s−1, 10.8 ≤ V < 13.9 m s−1, 13.9 ≤ V < 17.2 m s−1, 17.2 ≤ V < 20.8 m s−1, and V ≥ 20.8 m s−1.
Remotesensing 16 02015 g012
Figure 13. Time series of hourly extreme wind speed and corresponding number of OTs at the weather stations (a) HA, (b) HZ, (c) XY, and (d) JD from the case in Figure 12. OTs are detected by AHI/H8 every 10 min and are simultaneously located within a 30 km radius around these weather stations.
Remotesensing 16 02015 g013aRemotesensing 16 02015 g013b
Figure 14. Time series of the mean value of (a) short-term heavy rainfall records and (b) extreme wind records and their corresponding mean number of OTs. These records are provided by the weather stations in Jiangsu Province during May to September 2022. The values −1 h and 0 h indicate the start and end times of the severe weather records, respectively. The OTs are detected by AHI/H8 every 10 min and are simultaneously located within a 30 km radius around the weather stations.
Remotesensing 16 02015 g014aRemotesensing 16 02015 g014b
Table 1. Validations of OT detections by the IRW-texture algorithm (B10 and B18) and the IR contour-based algorithm (with different BTD criteria) based on H8 and FY4A observations.
OT Detection AlgorithmH8FY4A
POD (%)FAR (%)POD (%)FAR (%)
IRW-texture algorithmB1058.161.932.877.5
B1869.572.640.280.2
IR contour-based algorithmBTD = −3.6 K
(benchmark)
62.136.632.265.6
BTD = −1 K29.314.727.667.4
BTD = −2 K44.323.429.366.5
BTD = −3 K55.831.431.064.7
BTD = −4 K66.139.632.867.6
BTD = −5 K69.548.335.169.0
BTD = −6 K71.857.836.870.1
Disclaimer/Publisher’s Note: The statements, opinions and data contained in all publications are solely those of the individual author(s) and contributor(s) and not of MDPI and/or the editor(s). MDPI and/or the editor(s) disclaim responsibility for any injury to people or property resulting from any ideas, methods, instructions or products referred to in the content.