Article

Monitoring Chlorophyll-a Concentration Variation in Fish Ponds from 2013 to 2022 in the Guangdong-Hong Kong-Macao Greater Bay Area, China

1
School of Geography and Remote Sensing, Guangzhou University, Guangzhou 510006, China
2
Rural Non-Point Source Pollution Comprehensive Management Technology Center of Guangdong Province, Guangzhou University, Guangzhou 510006, China
3
Department of Geography, The University of Hong Kong, Pokfulam Road, Hong Kong, China
4
Aerospace Information Research Institute, Chinese Academy of Sciences, Beijing 100101, China
*
Author to whom correspondence should be addressed.
Remote Sens. 2024, 16(11), 2033; https://doi.org/10.3390/rs16112033
Submission received: 2 April 2024 / Revised: 27 May 2024 / Accepted: 4 June 2024 / Published: 5 June 2024

Abstract

:
Aquaculture plays a vital role in global food production, with fish pond water quality directly impacting aquatic product quality. The Guangdong-Hong Kong-Macao Greater Bay Area (GBA) serves as a key producer of aquatic products in South China. Monitoring environmental changes in fish ponds serves as an indicator of their health. This study employed the extreme gradient boosting tree (BST) model of machine learning, utilizing Landsat imagery data, to assess Chlorophyll-a (Chl-a) concentration in GBA fish ponds from 2013 to 2022. The study also examined the corresponding spatiotemporal variations in Chl-a concentration. Key findings include: (1) clear seasonal fluctuations in Chl-a concentration, peaking in summer (56.7 μg·L−1) and reaching lows in winter (43.5 μg·L−1); (2) a slight overall increase in Chl-a concentration over the study period, notably in regions with rapid economic development, posing a heightened risk of eutrophication; (3) influence from both human activities and natural factors such as water cycle and climate, with water temperature notably impacting summer Chl-a levels; (4) elevated Chl-a levels in fish ponds compared to surrounding natural water bodies, primarily attributed to human activities, indicating an urgent need to revise breeding practices and address eutrophication. These findings offer a quantitative assessment of fish pond water quality and contribute to sustainable aquaculture management in the GBA.

1. Introduction

As a vital element in global nutrition, aquaculture contributed approximately 8% to the world’s animal protein consumption in 2020, with a production reaching 87.5 million tons [1]. Fish ponds, among all the inland water bodies, are particularly susceptible to human activities like feed input, artificial aeration, and aquaculture operations. These activities include rapid changes in water quality during cultivation, significantly impacting the quality of aquatic products [2]. Recognizing the profound influence of human activities on water quality is paramount. However, studies on water quality changes in fish ponds across large areas are still relatively rare due to insufficient in-situ observations and varied study approaches. Remarkably, over 90% of the world’s inland water bodies are smaller than <0.01 km2, excluding very small (<0.001 km2 in area) fish ponds, totaling approximately 3.2 billion in number, and covering an area of approximately 800,000 km2 [3]. Understanding their cumulative impact on global water environmental changes necessitates further intensive studies [3].
China’s fish ponds account for approximately 39% of the global area of aquaculture ponds [4]. The fish ponds in the Guangdong-Hong Kong-Macao Greater Bay Area (GBA) are primarily located in the Pearl River Delta and coastal areas [5]. The fish ponds utilize significant amounts of feed or disinfectants in their aquaculture activities. However, due to limited water circulation, there is often a high accumulation of feed and animal feces, resulting in sewage with elevated levels of nitrogen (N) and phosphorus (P) [6,7,8]. This leads to rapid algae proliferation [9,10,11], posing a threat to the ecosystems of inland water bodies and adjacent coastal areas [12]. The ecological changes observed in fish ponds within the GBA serve as a microcosm of ecological changes in Chinese aquaculture ponds.
Chlorophyll-a (Chl-a) is a crucial photosynthetic pigment produced by algae during photosynthesis, making it an effective indicator for monitoring water eutrophication [13]. In recent years, factors such as climate change [14] and excessive aquaculture activities resulting from human activities [15,16,17] have led to elevated eutrophication [18,19,20]. Consequently, there has been a proliferation of algae in inland water bodies, leading to an increase in Chl-a concentration [21,22]. Hence, continuous monitoring of Chl-a concentration in fish ponds in the GBA and studies of water eutrophication are vital for comprehending the current ecological conditions of Chinese aquaculture ponds. Additionally, such studies help evaluate the impact of aquaculture management practices on pond environments, and aid in the development of effective remediation strategies.
Traditional field surveys for Chl-a assessment are expensive, time-intensive, and have limited spatial coverage. In contrast, remote sensing offers unique advantages in such tasks, providing a cost-effective and efficient means to monitor Chl-a changes over large areas. Satellites like MODIS [2,21,23,24,25] and Landsat [25,26,27,28] offer extensive and continuous coverage, allowing for comprehensive monitoring over extended periods. Their high spatiotemporal resolution enables the detection of Chl-a variations at different scales and support long-term trend analysis [29]. Leveraging these data, previous studies have developed numerous algorithms for Chl-a concentration estimation, enhancing our understanding of Chl-a dynamics and their ecological implications.
So far, few retrieval algorithms of Chl-a concentration in inland waters have been applied to fish ponds. One barrier is that the inversion models were developed based on the optical characteristics of natural lakes and reservoirs. In previous studies, band combinations were often used to monitor Chl-a concentration [25,30,31,32,33]. Yet, inland waters present more intricate factors like water quality and optical properties, which can vary significantly. Even within the same lake, the composition and proportion of optically active substances in the water can vary significantly across various periods. Consequently, the models’ accuracy and applicability are relatively low [34]. As a result, these models are usually applicable for a specific regional and seasonal scenario, with low generic applicability. Addressing these gaps remains a challenge in current academic community.
Data selection is a crucial stage in the retrieval of Chlorophyll-a (Chl-a) concentration using satellite imagery. The medium-resolution imaging spectrometer (Medium Resolution Imaging Spectrometer, MERIS) and Sentinel-3 satellites, equipped with hyperspectral sensors, can offer high-precision inversion results for Chl-a concentration retrieval [35], while satellites with multi-band sensors such as the Landsat series are commonly used for long-term monitoring of Chl-a concentration in inland waters. In recent years, machine learning-based algorithms [36], including deep neural networks [37], convolutional neural networks [38], and random forests [39] have been used to analyze algal pigments in waters. Cao et al. [40] developed a practical method for retrieving Chl-a concentration in inland lakes using the XGBoost (BST) model with Landsat OLI images, reporting a higher accuracy. The results also underscored the improved applicability and accuracy of machine learning algorithms for Chl-a retrieval using multi-band Landsat imagery.
In addition, the atmosphere also has a great impact on the retrieval of water color parameters. Current atmospheric correction models do not take into account differences in atmospheric composition across regions, and thus are poor in applicability. Meanwhile, most studies merely focused on a small study area, such as Taihu Lake [41,42,43], Poyang Lake [32], and other lakes. The discrepancy in geographical locations, satellite data, and study time spans impeded the applicability of the retrieval models.
There are few studies on the spatiotemporal dynamics of Chl-a concentration in inland water bodies in the GBA, with even fewer studies focusing on fish ponds. The specific patterns of the Chl-a concentration change across fish ponds remain unclear. Therefore, leveraging Landsat-8/9 level-1 images acquired from 2013 to 2022 and applying Rayleigh correction products, we computed Chl-a concentration for the fish ponds in the GBA. By capitalizing on the frequent satellite observations and broad coverage, we aimed to investigate the spatiotemporal variations in Chl-a concentration and identify the driving forces. The findings serve as crucial quantitative benchmarks for guiding the sustainable development of the aquaculture industry in the GBA and facilitating the restoration of the fish pond ecosystem.

2. Materials and Methods

2.1. Study Area

The GBA, located in southern China (Figure 1), is an economic collaboration zone in the Pearl River Delta. Renowned as one of China’s most economically advanced and vibrant regions, the GBA plays a pivotal role in the country’s economic landscape. The geographical region of the GBA ranges approximately from 24.4°N to 21.5°N and 111.4°E to 115.4°E, covering a total area of 55,900 km2. This area encompasses eleven cities, including Hong Kong, Macao, and cities in Guangdong province such as Guangzhou, Shenzhen, Zhuhai, Foshan, Huizhou, Dongguan, Zhongshan, Jiangmen, and Zhaoqing. Due to rapid economic development, fast urbanization and sharp population growth, the GBA now faces tremendous social, economic, and environmental pressures. Notably, issues include environmental degradation, inadequate food resources, and the limited availability of natural resources.
The GBA experiences a subtropical humid monsoon climate, characterized by abundant rainfall, ample sunlight, and synchronized water-heat periods. Annual precipitation averages between 1600 and 2000 mm, coupled with an average annual temperature ranging from 21 to 22 °C. The monsoon season, occurring from April to September, contributes approximately 80% of the annual precipitation. Situated in the Pearl River Delta, the GBA features diverse topography and is notably shaped by tides, monsoons, and seawater intrusion. Its water landscape encompasses estuaries, bays, and aquaculture ponds, forming a rich array of aquatic habitats.
Aquaculture in the GBA, particularly in the Pearl River Delta, boasts a rich historical legacy. Pond-based aquaculture, featuring unique systems such as fruit-dike-fish pond, mulberry-dike-fish pond, and sugarcane-dike-fish pond [44], represents a prominent and traditional aquaculture method. With the increasing demand for aquatic products, there has been a shift from a focus on the “fish ponds” to an emphasis on the “dikes”, indicating a transition towards intensive aquaculture for a higher yield. The current area allocated to fish ponds in the GBA is 1730 km2, with freshwater fish ponds comprising over 80%, solidifying its position as a pivotal producer for aquaculture products in China. Most fish ponds in the region employ a mixed farming approach, cultivating a variety of fish species, including grass carp, tilapia, Nile tilapia, silver carp, common carp, and bighead carp, etc. Coastal ponds, specializing in spotted sea bass, black porgy, golden pompano, and grouper, represent the marine aquaculture sector.
Fish ponds are primarily located in the Pearl River Delta and coastal areas. However, urbanization tends to correlate with smaller pond areas in these regions. Over the past decade, both natural factors and anthropogenic activities have contributed to a notable increase in Chl-a concentration in the Pearl River Delta. This increase is particularly noticeable in ponds near the Pearl River mainstem, where Chl-a concentration surpasses that in riverine waters. The ecological changes observed in fish ponds in the GBA serve as a representative illustration of ecological shifts in Chinese fish ponds. Long-term monitoring of Chl-a concentration dynamics in fish ponds in the GBA offers valuable insights into studies on small water body eutrophication and fish ponds farming governance. It also enhances understanding of the current ecological status of fish ponds in China and the impacts of fish pond management on environment sustainability.

2.2. Data Sources and Data Processing

2.2.1. Landsat Data and Image Preprocessing

This study obtained 217 Landsat cloud-free images covering the entire GBA from 2013 to 2022 (Figure 2). These images comprise 203 scenes from Landsat-8 level-1 data and 14 scenes from Landsat-9 level-1 data, as illustrated in Figure 2b, which depicts the annual image availability. Landsat-8, launched on 11 February 2013, is equipped with the OLI sensor, which captures multispectral optical data in visible and infrared bands with higher spatial and spectral resolution, enabling detailed and precise surface observations. Landsat-9, the latest satellite in the Landsat series, launched on 16 September 2021, features the OLI-2 sensor. Both Landsat-8 and Landsat-9 offer a revisit period of 16 days, ensuring consistent temporal and spatial resolution for remote sensing image products.
A total of 8 images were required to adequately capture GBA. Typically, Landsat satellites have the capability to cover the GBA twice a month. However, during the monsoon season when high cloud coverage poses a significant limitation, we utilized available images from the preceding or subsequent year to address any gaps (Figure 3). For instance, if there is a missing image in spring 2021, we utilized images from either spring 2020 or 2022 to fill the gap.
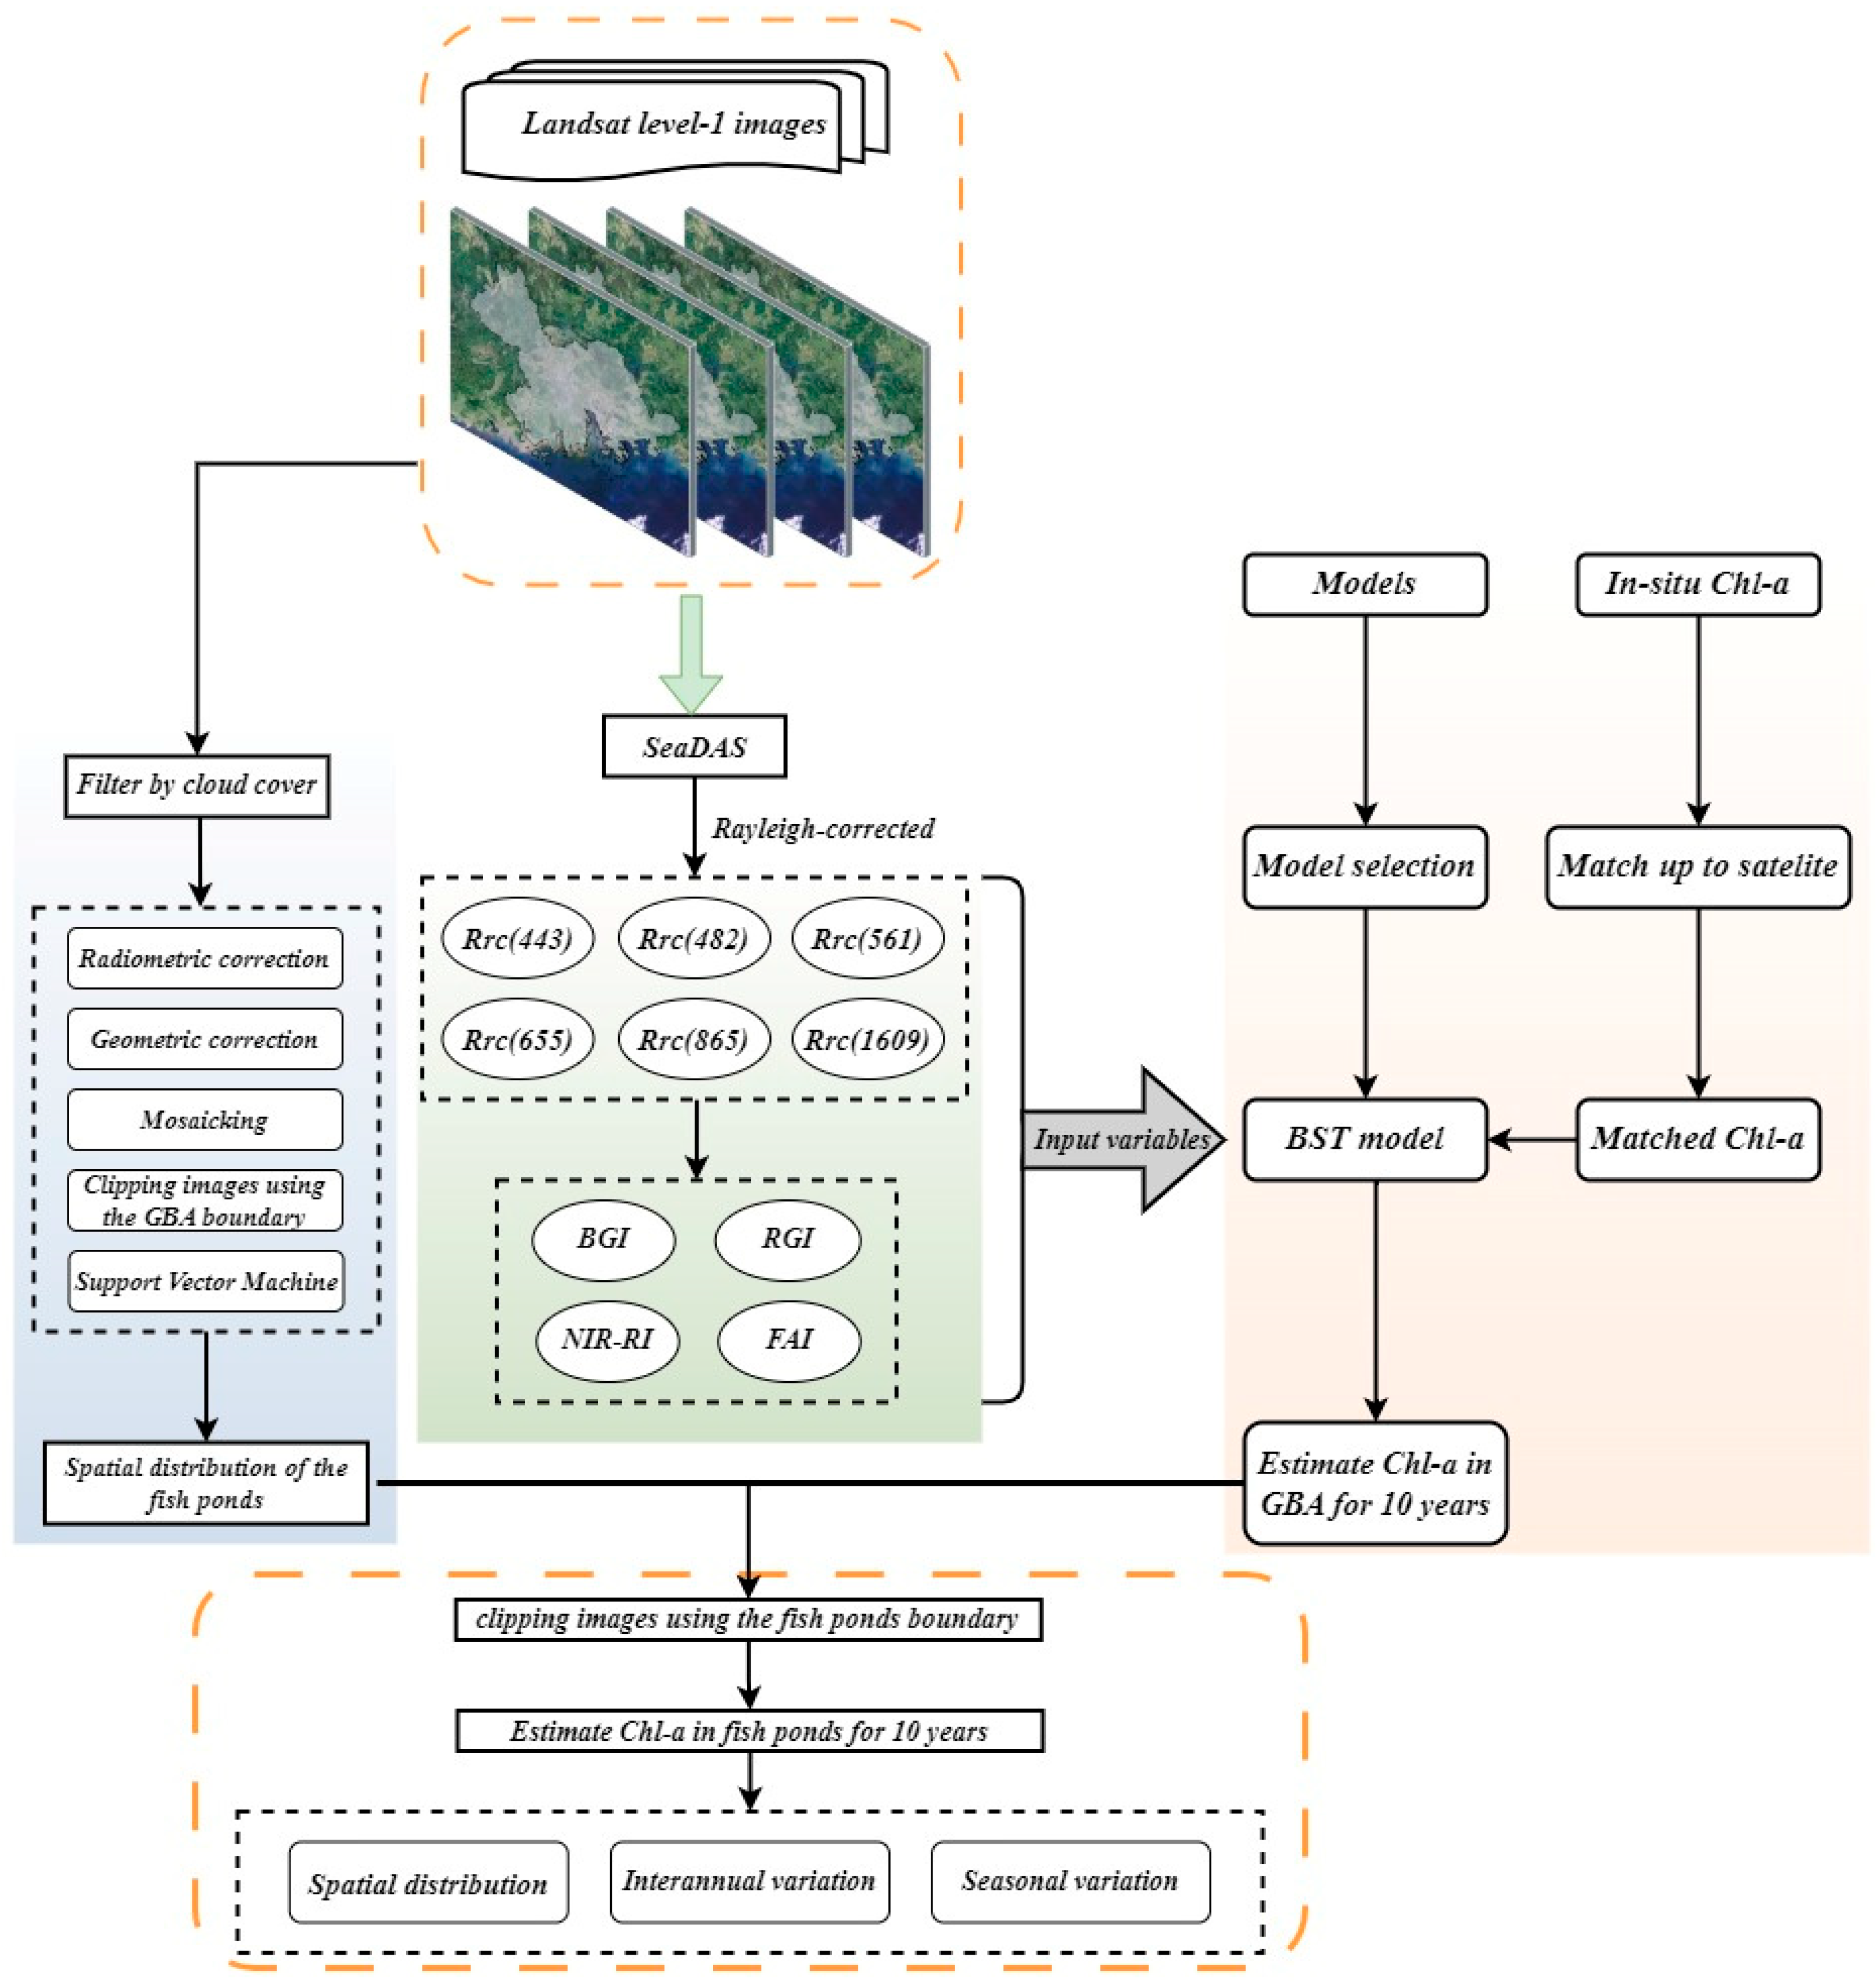
Before Chl-a retrieval, it is essential to mitigate the impact of atmospheric noise at high altitudes by addressing ozone and Rayleigh scattering effects. SeaDAS 8.4.0 (Software for Processing, Evaluation, and Analysis of Remote Sensing Data) is a comprehensive suite of tools developed by the NASA SeaWiFS project for processing, evaluating, and analyzing Landsat images. It provides a variety of preprocessing tools, atmospheric correction capabilities, data reprojection functions, result exporting options and image visualization features for satellite imagery. Utilizing SeaDAS’s l2gen tool, Landsat-8 OLI level-1 and Landsat-9 OLI level-1 images underwent atmospheric correction to obtain Rayleigh-corrected reflectance (Figure 4). Images post-correction for Rayleigh scattering also demonstrate excellent efficacy in water body identification. The initial six bands—Rrc (443), Rrc (482), Rrc (561), Rrc (655), Rrc (865), Rrc (1609)—serve as the primary input for the Chl-a retrieval model.

2.2.2. Field Data Collection and Processing

To guarantee model accuracy, this study conducted in-situ sampling to collect Chl-a concentration, water temperature, dissolved oxygen (DO), and other water quality parameters from fish ponds. In November 2023 and February 2024, field sampling was carried out in 15 fish ponds in Foshan, Huizhou, and Zhongshan. Each sampling site underwent 48 h continuous observation, samples taken every two hours. From April 2023 to February 2024, we also investigated a fish pond in Hong Kong. Field sampling was carried out at three different points in the pond, collecting samples every month (Figure 5 and Figure 6). The average water depth of the selected fish ponds is 1–2 m. Environmental indicators such as water temperature and wind speed were also recorded. The collected samples were brought in a fridge back to the laboratory for further analysis. The Chl-a concentration was measured by a sample analysis company to provide real Chl-a concentrations for subsequent model accuracy validation. We conducted continuous observations for 48 h at the same location to calculate mean Chl-a concentration for each data series to generate a real Chl-a concentration observation. Therefore, only 63 observations were obtained for model establishment and validation. Then, we opted to choose the image generated on the same day as field work or on dates close to the sampling day as the model input. We extracted the reflectance values of pixels from a single image corresponding to the field locations, and utilized these values as an input dataset. Among the dataset, two-thirds of the observations were utilized as training data, while the remainder was designated as testing data.
Figure 5 also depicts a comparison of the water samples collected from fish ponds, coastal fish farming areas, and standard purified clean water. It can be seen that the samples from fish ponds display a noticeable green color, whereas the water from coastal fish farming areas displays a light-yellow color, suggesting a significantly higher Chl-a concentration in fish ponds.

2.2.3. Spatial Data of Fish Ponds and Climate Data from 2013 to 2022

In the investigation of Chl-a concentration in fish ponds, we leveraged spatial distribution data of fish ponds from our previous study conducted in 2013, 2015, and 2019 [5]. In the prior study, our initial steps involved preprocessing cloud-free Landsat imagery, which encompassed radiometric correction, geometric correction, mosaicking, and clipping of images using the GBA boundary. The outcomes of the preprocessing were then harnessed to extract fish ponds employing a Support Vector Machine (SVM) algorithm, yielding the spatial distribution of the fish ponds.
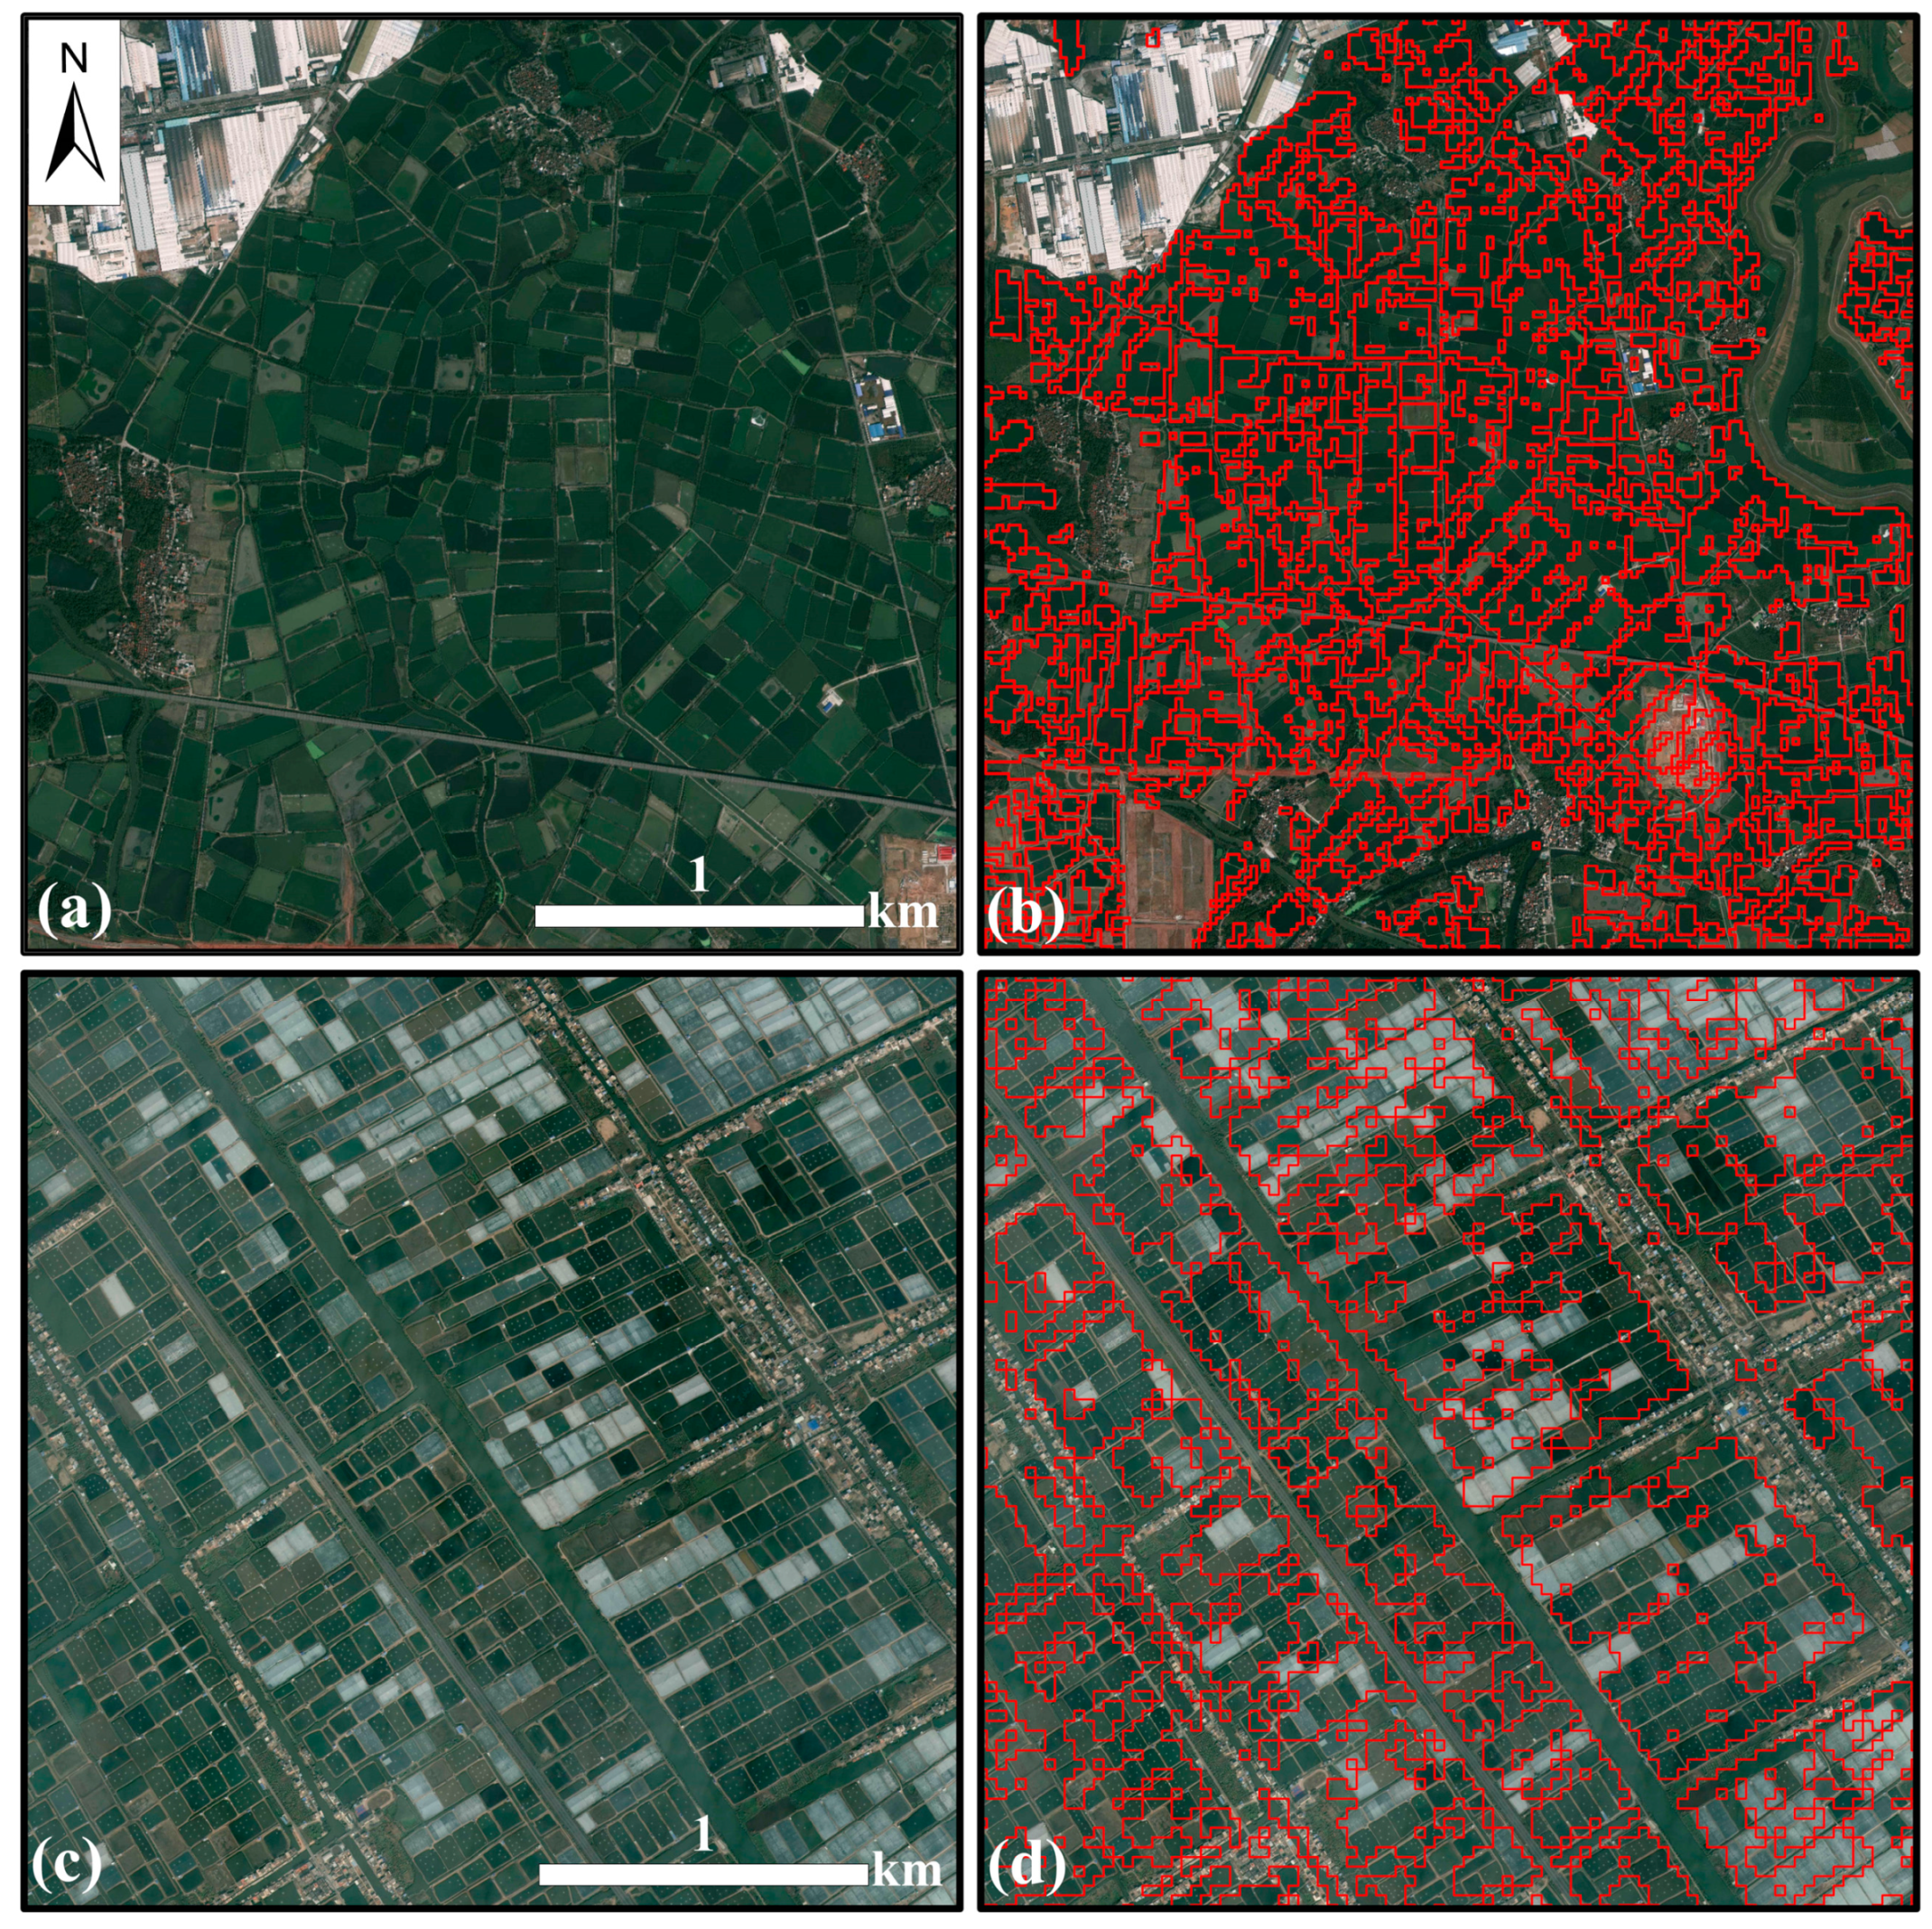
The total number of ponds was difficult to obtain, as the individual fish ponds may only occupy 1–2 pixels and connect with each other (Figure 7). In our previous study [5], fish ponds throughout the GBA were obtained (Figure 7), which were used to mask the investigation results. Due to the spatial resolution of Landsat imagery (30 m × 30 m), problems may happen to some extremely narrow ponds with an area less than 900 m2. Liu’s study in 2022 [45], taking Foshan as an example, used GF-1 satellite images to extract the area of fish ponds, indicating that the area of fish ponds ranges between 1000 and 3600 m2. Thus, we can identify almost all fish ponds using Landsat8/9, which can meet the needs of this study; the small discrepancy caused by misidentification should be negligible.
In addition, to analyze the influence of environmental factors on Chl-a concentration changes, this study also collected climate data and other datasets to support further analysis, such as temperature, rainfall, land use, and fish breeding methods. Temperature and rainfall data were obtained from the China Meteorological Data Service Center (https://data.cma.cn/, accessed on 1 December 2023), which provides comprehensive climate data, including temperature, wind speed, and precipitation. This study used data from Guangzhou Station and Foshan Station recorded between 2013 and 2022. Data on fish pond management and fish breeding methods were obtained by interviewing the local fishermen.

2.3. Machine Learning Model for Chl-a Retrieval

Using Landsat OLI images, Cao et al. developed a machine learning algorithm with the XGBoost (BST) model to estimate Chl-a concentration in inland lakes, as depicted in Figure 8 [40]. Compared with other machine learning models, this model offers high accuracy, efficiency, and concurrency for data processing. The results also indicate that machine learning models can significantly improve the model’s applicability in Chl-a concentration retrieval. BST is one of the BoostedTrees models used for the scenarios of regression analysis and data classification. It is a powerful and widely-used machine learning model which enhances its performance by using a group (ensemble) of decision trees. In this model, each new tree is built considering the errors of previous trees. The algorithm continuously trains decision trees, correcting errors of previous steps to improve performance, and finally obtains a weighted combination of weak decision trees (called weak learners). Additionally, BST can automatically cut leaves during construction to generate a more concise model. Cao et al. applied this model to predict Chl-a in inland lakes in China, comparing Chl-a estimation with the random forest model and Shi et al.’s model [25], and found that BST performs much better than the other two models. The R2 between prediction and measured data is 0.79, indicating high accuracy of the BST model for Chl-a retrieval.
This BST model utilized Rayleigh-corrected OLI data for Chl-a estimation. Additionally, the floating-algae-index (FAI) was also considered as a crucial input parameter. FAI plays an important role in monitoring and assessing algae and other aquatic organisms that can cause changes in Chl-a concentration [30]. It is defined as a composite algorithm between the RED (655 nm), NIR (865 nm), and SWIR (1610 nm) bands. Compared with normalized vegetation indices (NDVI) and enhanced vegetation indices (EVI), FAI has lower requirements in image quality. The FAI can be computed using the RED, NIR, and SWIR channels of the OLI sensor. The calculation is as follows:
F A I = R r c N I R R r c N I R
R r c N I R = R r c R E D + R r c S W I R R r c R E D × λ N I R λ R E D ( λ S W I R λ R E D  
where Rrc (NIR) represents the reflectance of the NIR band.
In this study, the BST model used ten input parameters, namely, Floating Algae Index (FAI), BGI Index (Rrc(Coastal/Aerosol)/Rrc(Green)), RGI Index (Rrc(Red)/Rrc(Green)), NIR-RI Index (Rrc(NIR)/Rrc(Red)), and the first six OLI bands after Rayleigh correction, including Rrc(Coastal/Aerosol) at 443 nm, Rrc(Blue) at 482 nm, Rrc(Green) at 561 nm, Rrc(Red) at 655 nm, Rrc(NIR) at 865 nm, and Rrc(SWIR) at 1610 nm.
The preprocessing and estimation of Landsat images were processed on a Linux server using Python 3.10.12 language. Python is widely used in remote sensing image processing because of its simplicity, ease of use, flexibility, and huge community support. Additionally, Python provides various open-source tools and libraries, such as NumPy, SciPy, and Scikit-learn packages, to support the construction, training, and evaluation of the BST model in this study.

2.4. Model Validation

In this study, we used the coefficient of determination (R2) to assess the correlation between two variables. In addition, Root Mean Square Error (RMSE), Mean Absolute Percentage Error (MAPE), Bias, and Mean Absolute Error (MAE) were used to evaluate the performance of the BST model. Lower values of RMSE and MAPE indicate better performance. Bias represents the overall bias and error of the model, and MAE indicates the absolute difference between estimated and real observations. The corresponding equations for RMSE, MAPE, Bias, and MAE are as follows:
R M S E = 1 n n = 1 n x i y i 2
M A P E = 1 n i = 1 n x i y i x i × 100 %
B i a s = 10 i = 1 n log 10 x i log 10 ( y i ) n
M A E = 10 i = 1 n log 10 x i log 10 ( y i ) n
where x i   represents the estimated values, y i   represents the observations, and n denotes the number of samples.

2.5. Chl-a Temporal Variation and Trend Analysis

In this study, we used the Mann-Kendall (MK) trend test and Sen’s slope test to investigate the changes in Chl-a concentration in fish ponds from 2013 to 2022. Both of them are non-parametric methods, and widely applied in trend analysis for environmentology, meteorology, and hydrology. The MK trend test and Sen’s slope test assess the upward or downward trends in time series by calculating the positive or negative values of the statistical measures. Z and β are calculated as follows:
f x i x j = 1 ;   x i x j < 0   0 ;   x i x j = 0 1 ;   x i x j > 0
S = j = 1 n 1 i = j + 1 n f x i x j       ( n i > j 1 )
V A R ( S ) = 1 18 n n 1 2 n + 5 p = 1 g t p t p 1 2 t p + 5
Z S 1 V A R S S > 0 0 S = 0 S + 1 V A R S S < 0
β = m e a n x i x j i j       ( i > j )
In the formula, n is the number of samples, f x i x j represents the difference function for all n(n − 1)/2 differences between x i and x j , S denotes the difference between positive values and negative values, p, g, and   t p   stand for the number of duplicate data, unique data, and frequency for duplicate data, respectively. When Z value is greater than or equal to 1.64, 1.96, and 2.58, these indicate that it passes the significant confidence levels of 90%, 95%, and 99%, respectively. When β   > 0, it indicates that the time series shows an upward trend, and β   < 0 means an opposite trend.

3. Results

3.1. Spatial Distribution of Chl-a Concentration across the GBA

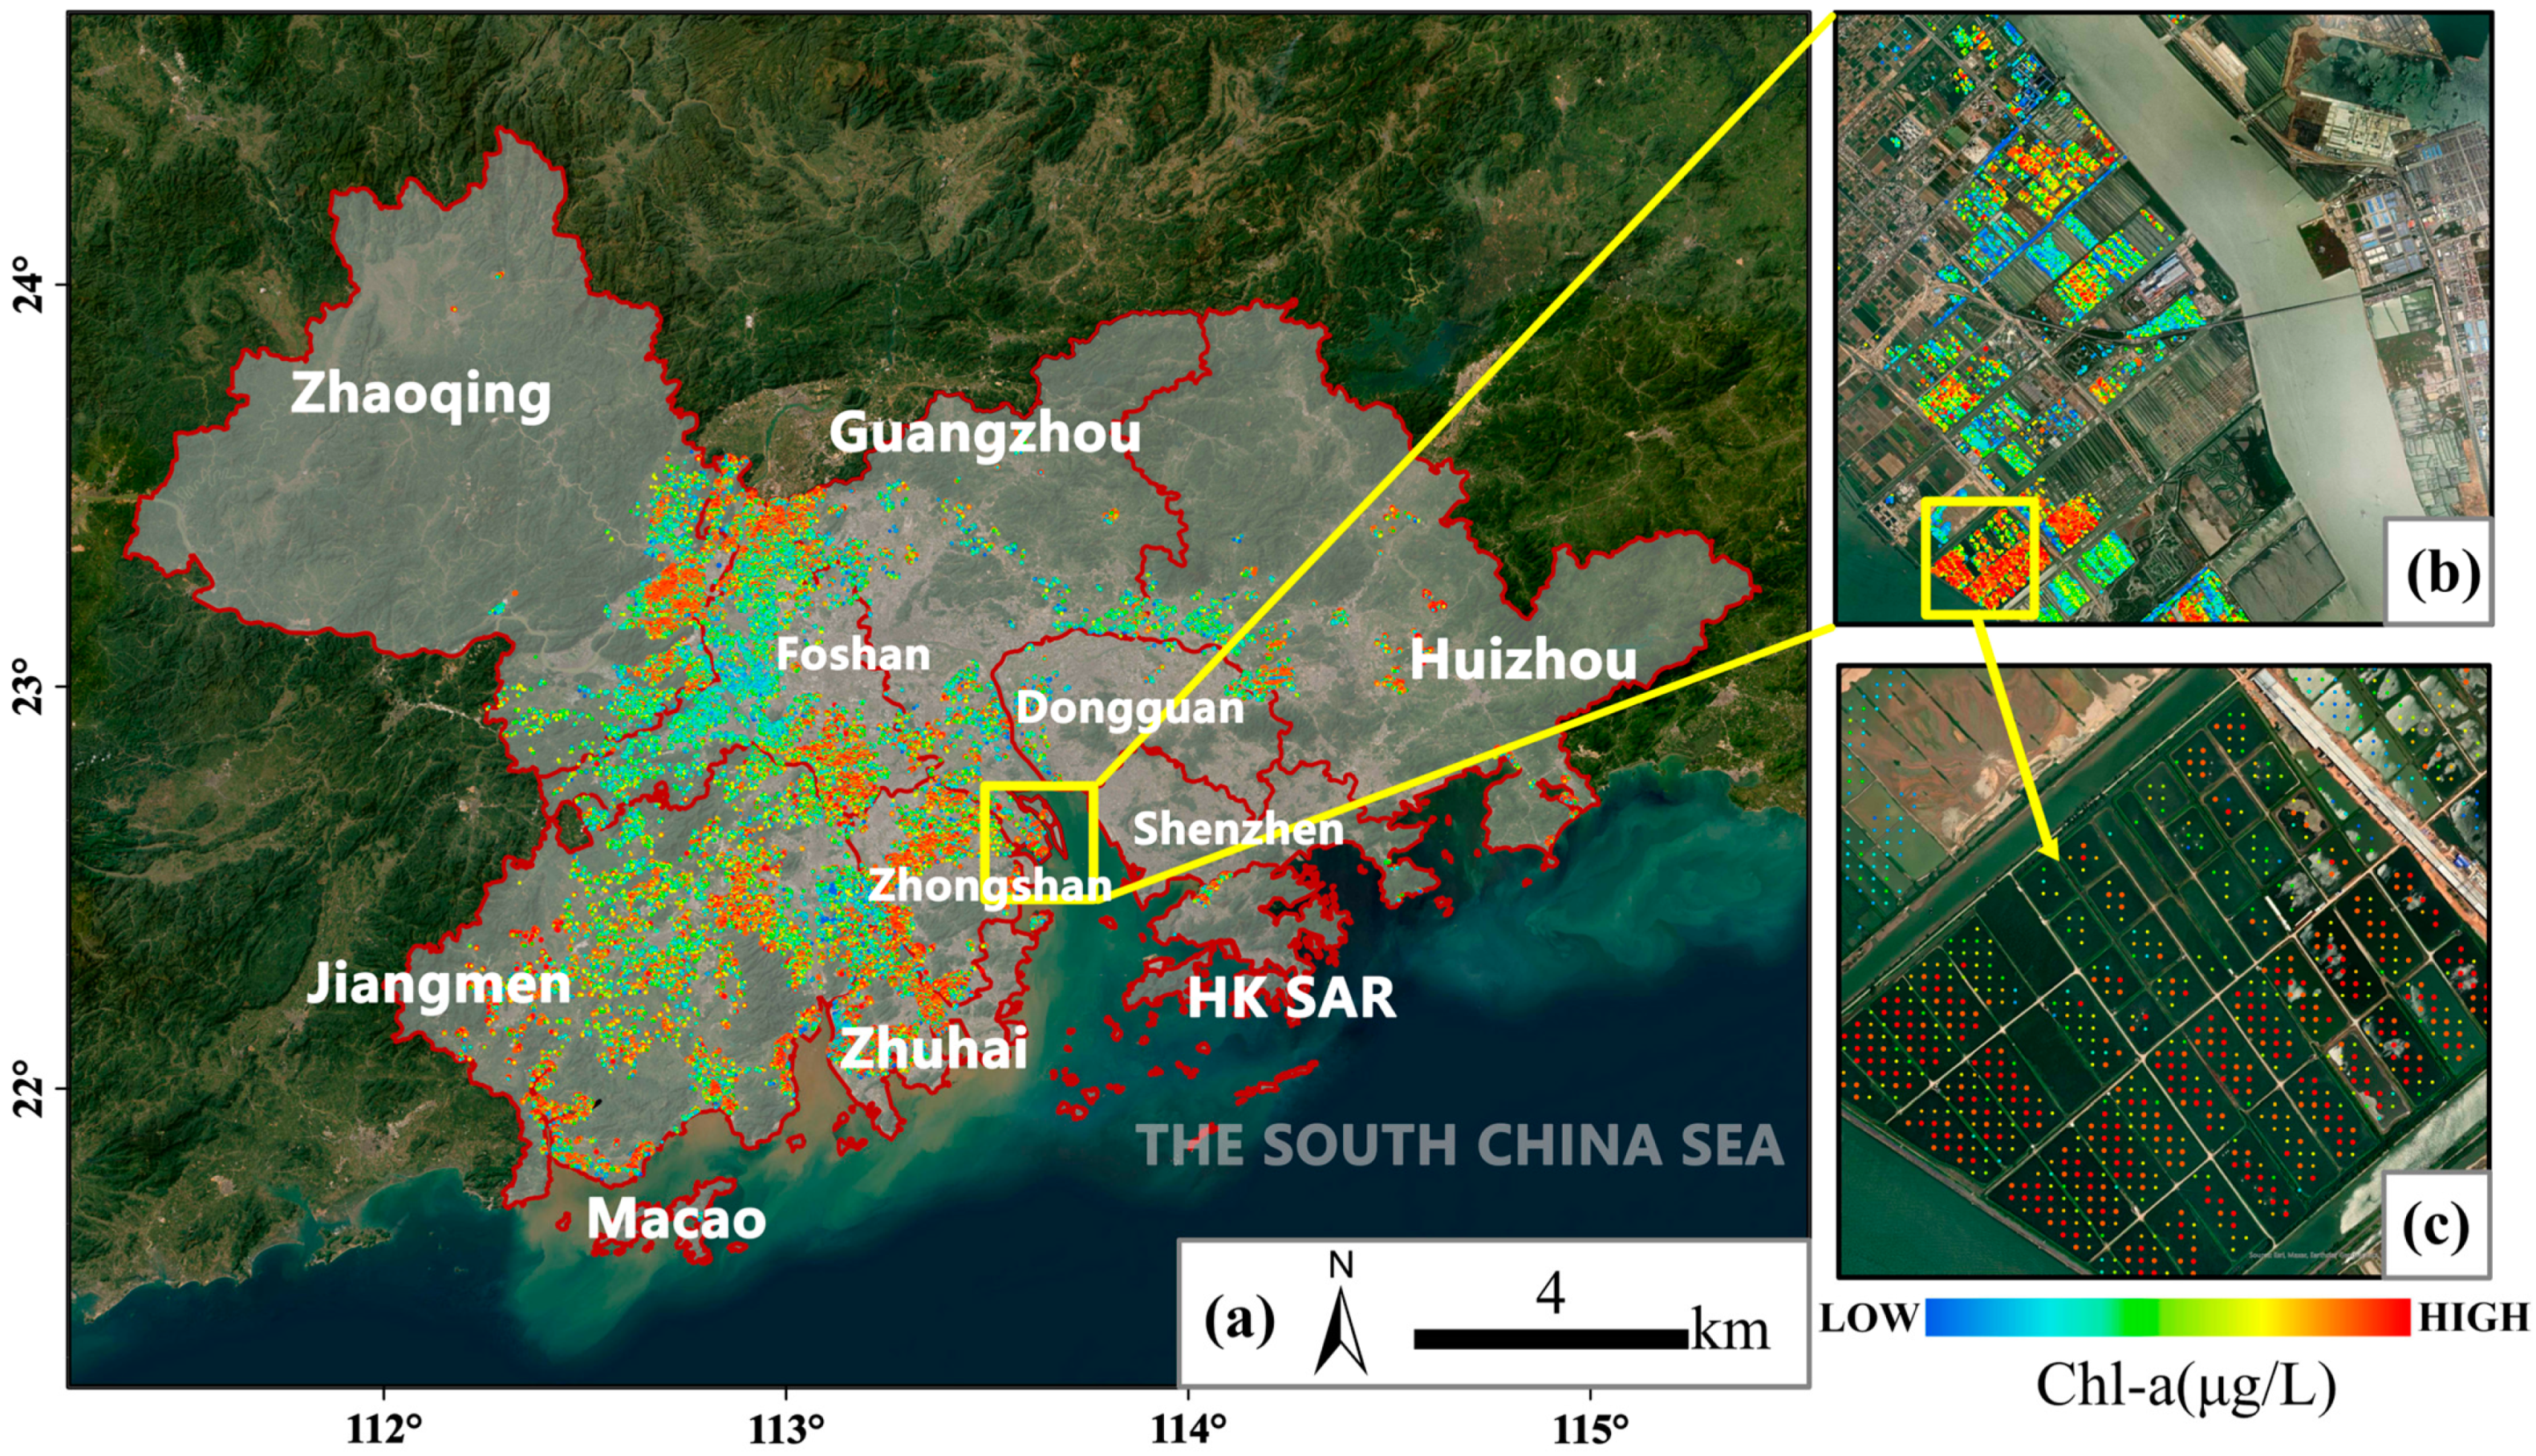
This section aims to show the spatial distribution of Chl-a concentration, hence only the retrieval results from 2022 were displayed here. These values represent the results of the BST model inversion for 2022, highlighting the variations in Chl-a concentration across different fish ponds. Over the past decade, anthropogenic influences have led to a significant shrinking in the spatial distribution and the size of fish ponds within the GBA, with an annual reduction rate of 10.242 hectares (hm2) [5]. The majority of fish ponds are now located in Jiangmen, Zhongshan, Foshan, Zhuhai, and Dongguan. However, Foshan and Dongguan have experienced a continuous decline over the past ten years. In contrast, Zhaoqing, Guangzhou, and Huizhou have maintained a relatively low but stable level in number of fish ponds. Notably, Shenzhen, Hong Kong, and Macau have virtually no fish ponds detected.
We calculated seasonal average Chl-a concentration, and then derived the annual Chl-a concentration product using the mean values of four seasons. Figure 9 illustrates the spatial distribution of Chl-a concentrations in fish ponds across the GBA in 2022. The spatial pattern indicates predominantly higher Chl-a concentration in the central and southern parts of the GBA, with comparatively lower Chl-a concentration observed in the western and eastern parts, and a higher prevalence of high Chl-a in the southern part. There are more fish ponds with higher Chl-a concentration in the southern region than in the northern region, potentially due to the relatively lower temperature in the northern region. To further analyze the spatial distribution changes of Chl-a concentration in the GBA, we subdivided the area into ten regions: Hong Kong, Guangzhou, Shenzhen, Foshan, Dongguan, Jiangmen, Zhongshan, Zhuhai, Zhaoqing, and Huizhou (excluding Macau due to few fish ponds there). It is evident that the majority of fish ponds in Jiangmen, Zhaoqing, Zhuhai, Dongguan, Huizhou, Shenzhen, and Hong Kong have relatively high Chl-a concentration, while those in Guangzhou and Foshan have relatively lower Chl-a concentrations.

3.2. Seasonal Variation in Chl-a Concentration

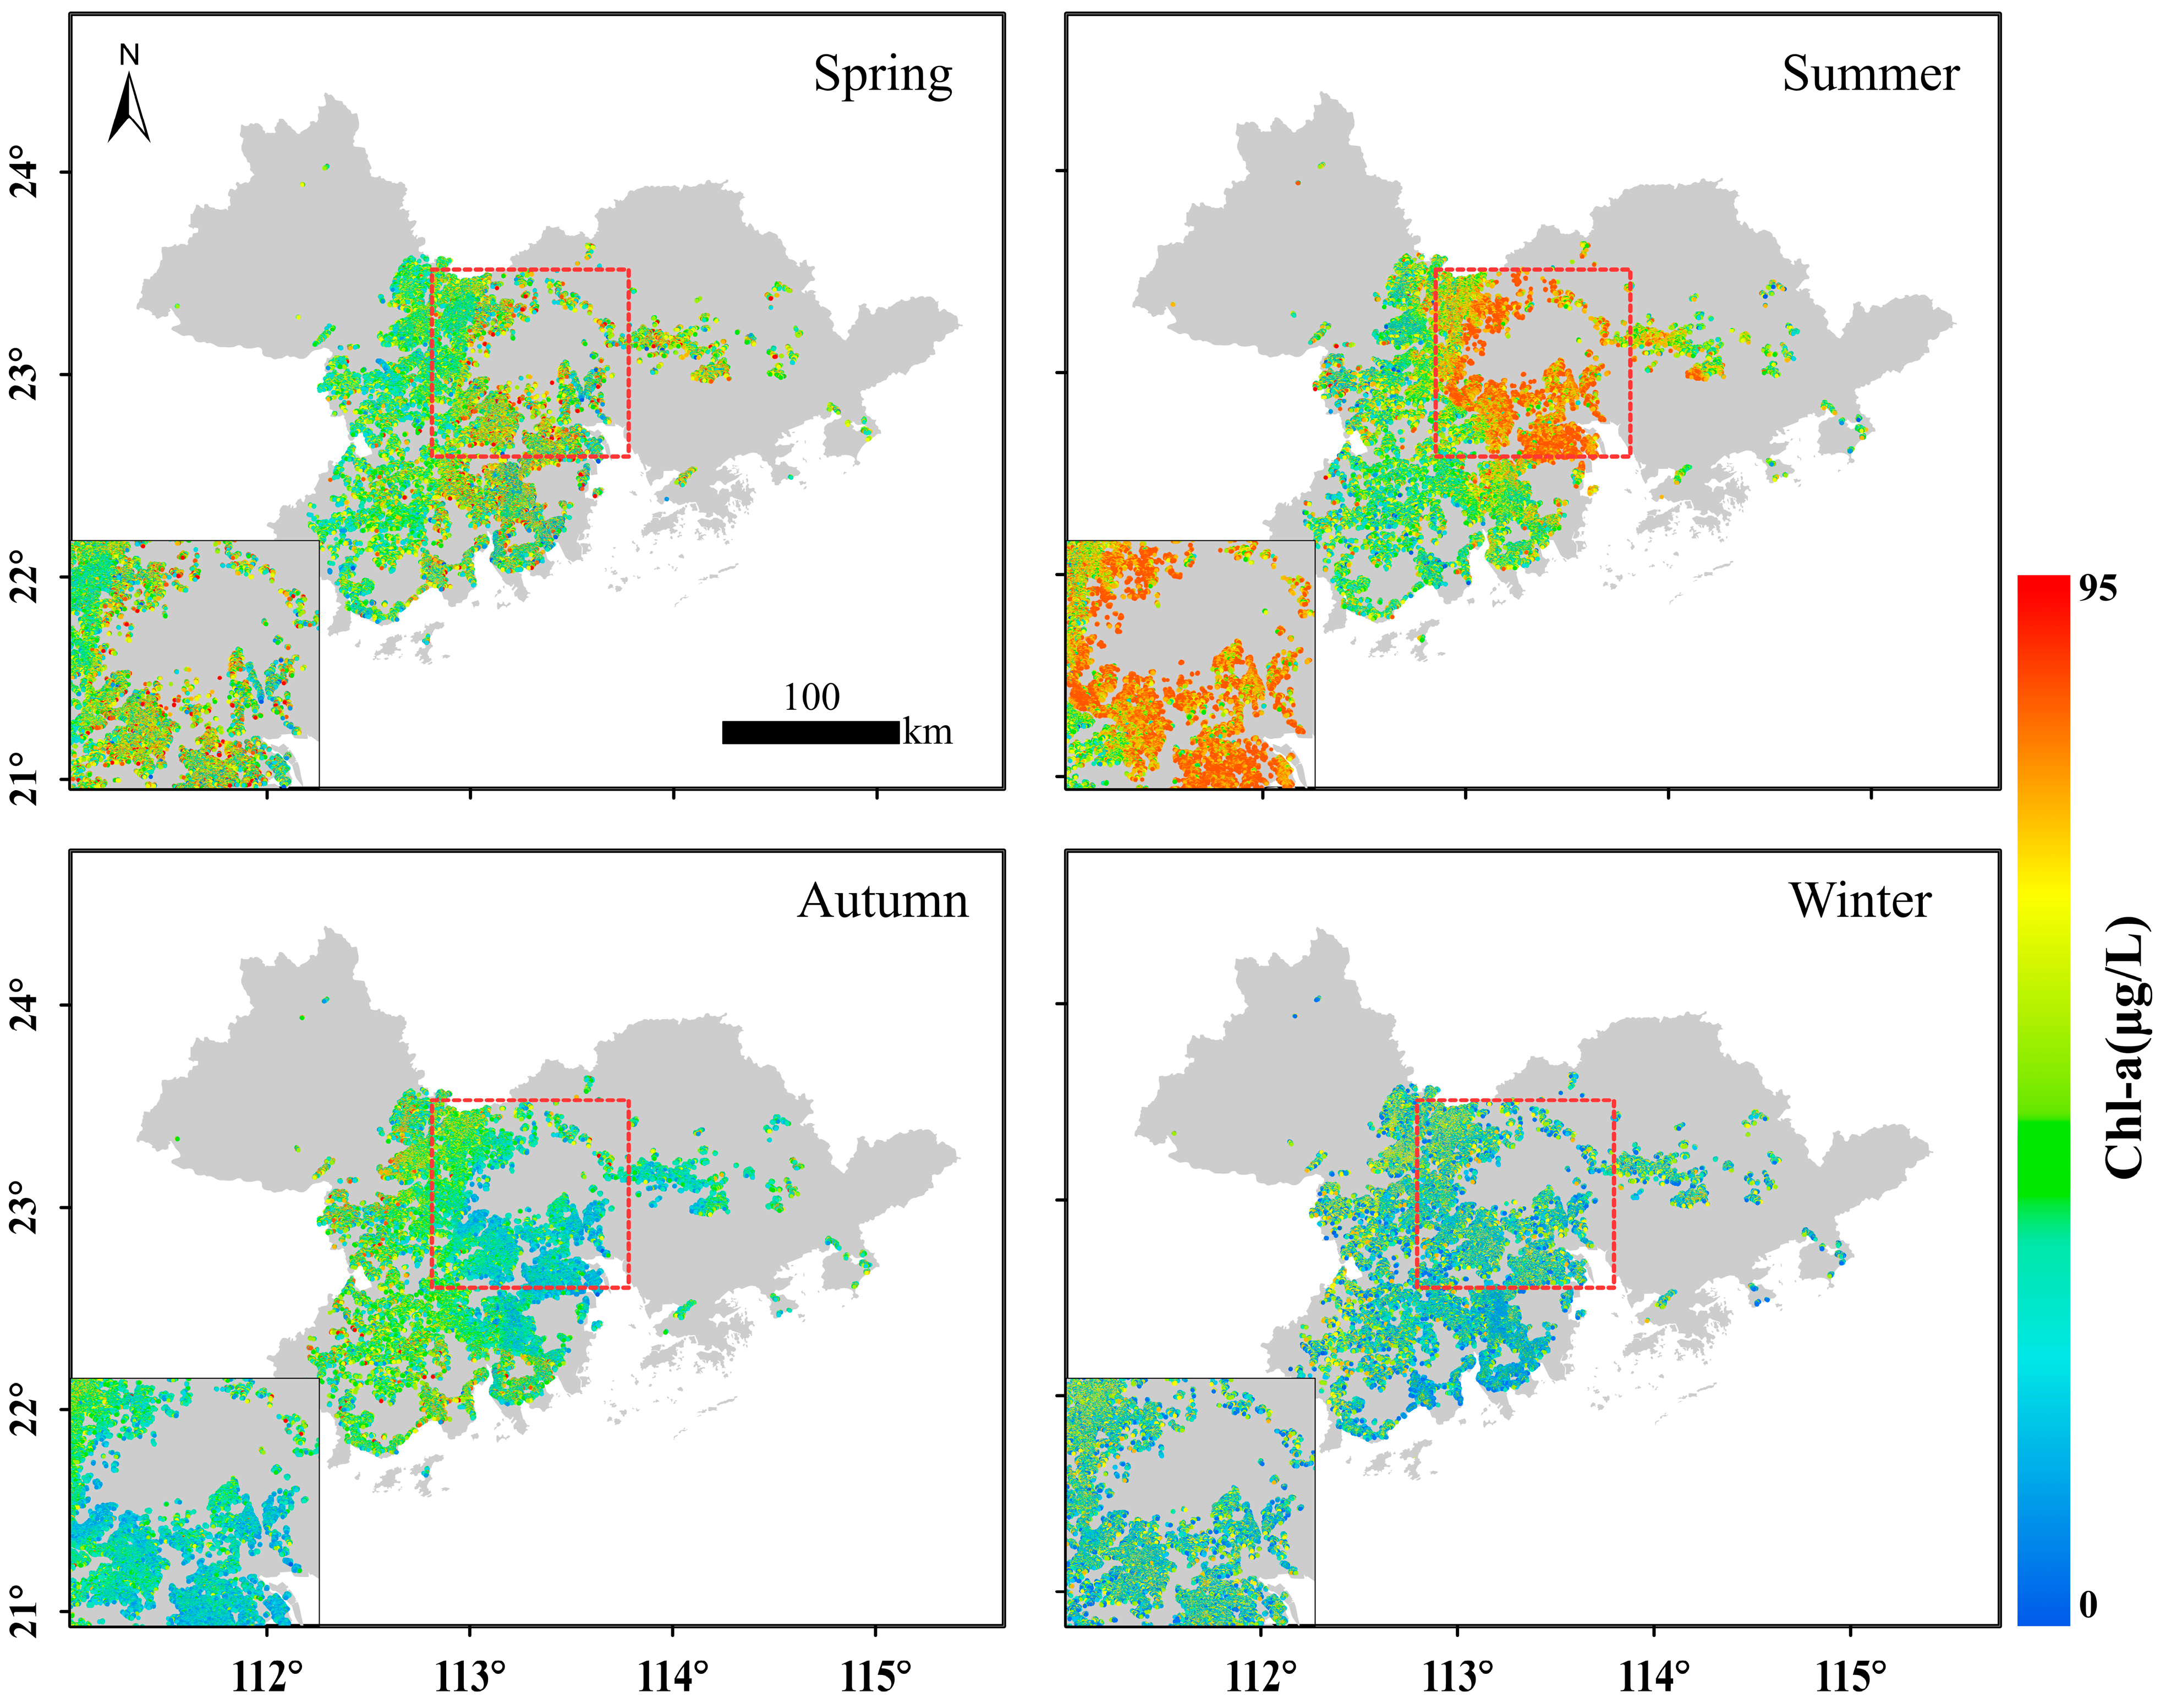
We calculated the Chl-a concentration of fish ponds for each of the four seasons spanning the years from 2013 to 2022, and derived the final seasonal result by averaging the values over the 10-year period (Figure 10). It is evident that Chl-a concentration exhibits noticeable seasonal variations, peaking in summer (56.7 μg·L−1) and reaching its lowest in winter (43.5 μg·L−1). The average concentrations in spring and summer surpass those in autumn and winter, with overall fluctuations between 43.5 μg·L−1 and 60.0 μg·L−1 across the four seasons. Furthermore, the maximum Chl-a concentration from spring to winter show a decreasing trend, with values of 90.66 μg·L−1 in spring, 89.84 μg·L−1 in summer, 88.94 μg·L−1 in autumn, and 87.46 μg·L−1 in winter.
It needs to be noted that the northern GBA (including Guangzhou, Foshan, Zhongshan, and Dongguan) exhibited more significant seasonal variations in Chl-a concentration. In this region, the Chl-a concentration during summer is higher than other seasons, with concentration between 62.36 μg·L−1 and 84.45 μg·L−1 in most fish ponds, while in autumn and winter, it generally ranges from 3.18 μg·L−1 to 56.62 μg·L−1. The seasonal variation shows a pattern that is highest in summer, followed by spring, and lowest in autumn and winter. Western and southern GBA experience relatively stable seasonal changes.
Additionally, the fluctuation of Chl-a concentration in fish ponds is more pronounced than in natural lakes. For instance, Cao et al. examined the changes of Chl-a concentration in Taihu Lake from 1984 to 2019, revealing that the summer average Chl-a concentration was the highest (24.9 ± 6.9 μg·L−1), while the winter average was the lowest (20.9 ± 63.6 μg·L−1) [16], with a difference of only 4 μg·L−1 between summer and winter. Deng et al. analyzed the seasonal variations of phytoplankton in Lake Taihu over twenty years, and found that Chl-a concentration is slightly higher in summer than that in winter [46]. Ha et al. utilized Landsat 8 to monitor eutrophication areas in West Lake (Vietnam) from 2013 to 2015, revealing significant seasonal variations in Chl-a concentration, with peak values in early summer (Chl-a ≥ 427 μg·L−1 in July), much higher than in autumn and winter (Chl-a = 59.4 μg·L−1 in January), but with a secondary peak occurring at the end of winter [47]. Kosten et al. investigated algae content in 143 lakes in Europe and South America, and found a strong correlation between the nutrients required for algal survival and climate, suggesting that algal content may significantly increase in warm climate [48]. It is evident that our result is highly consistent with previous studies.

3.3. Interannual Variation in Chl-a Concentration

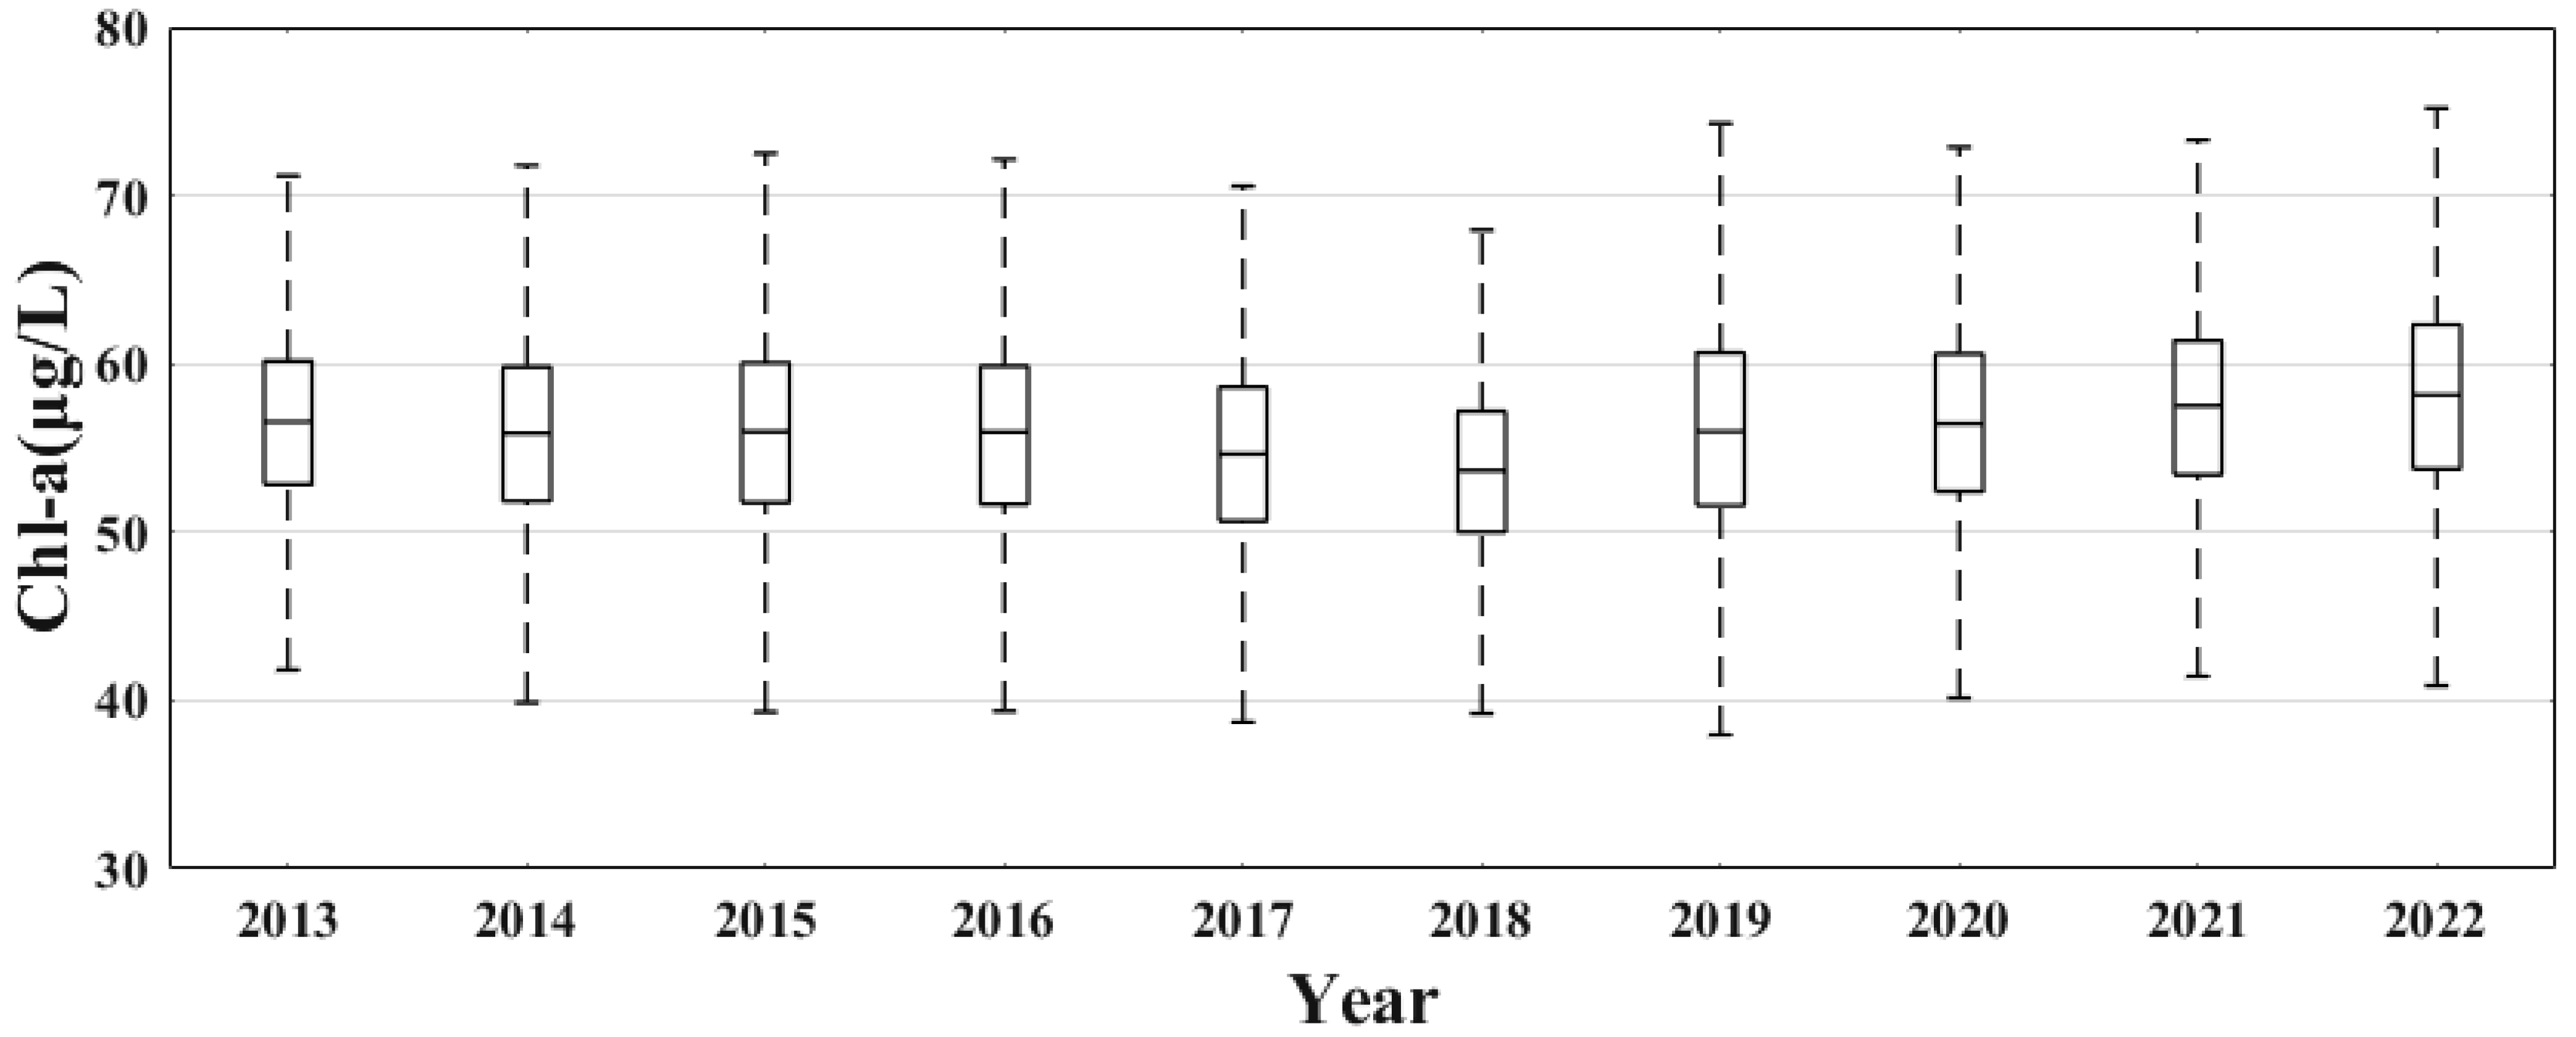
Figure 11 and Figure 12 demonstrate the interannual variations and evolving spatial distribution patterns of Chl-a concentration in the fish ponds within the GBA. The results suggested that from 2013 to 2022, there was no significant fluctuation in the annual average Chl-a concentration (Figure 11). Instead, the trend primarily exhibited a marginal year-on-year decrease from 2013 to 2018, with the Chl-a concentration dropping from 56.35 μg L−1 in 2013 to the lowest at 53.52 μg L−1 in 2018. Subsequently, from 2018 to 2022, the Chl-a concentration gradually rose to 57.90 μg L−1. The magnitude of variation varied greatly among regions, with the most notable changes observed near the Pearl River estuary in the central and southern parts of the GBA, showing a “high-low-high” pattern, while the northwestern and eastern areas maintained relatively stable Chl-a concentration levels. The number of fish ponds with high Chl-a concentration decreased from 2013 to 2018 and then gradually increased from 2018 to 2022. Table 1 outlines the Mann-Kendall (MK) test and Sen’s slope test results for the Chl-a concentration changes across the ten GBA cities over the decade, revealing a statistically insignificant upward trend (the Macao region is not included due to its absence of fish ponds).

3.4. Long-Term Chl-a Variations in Fish Ponds in the GBA

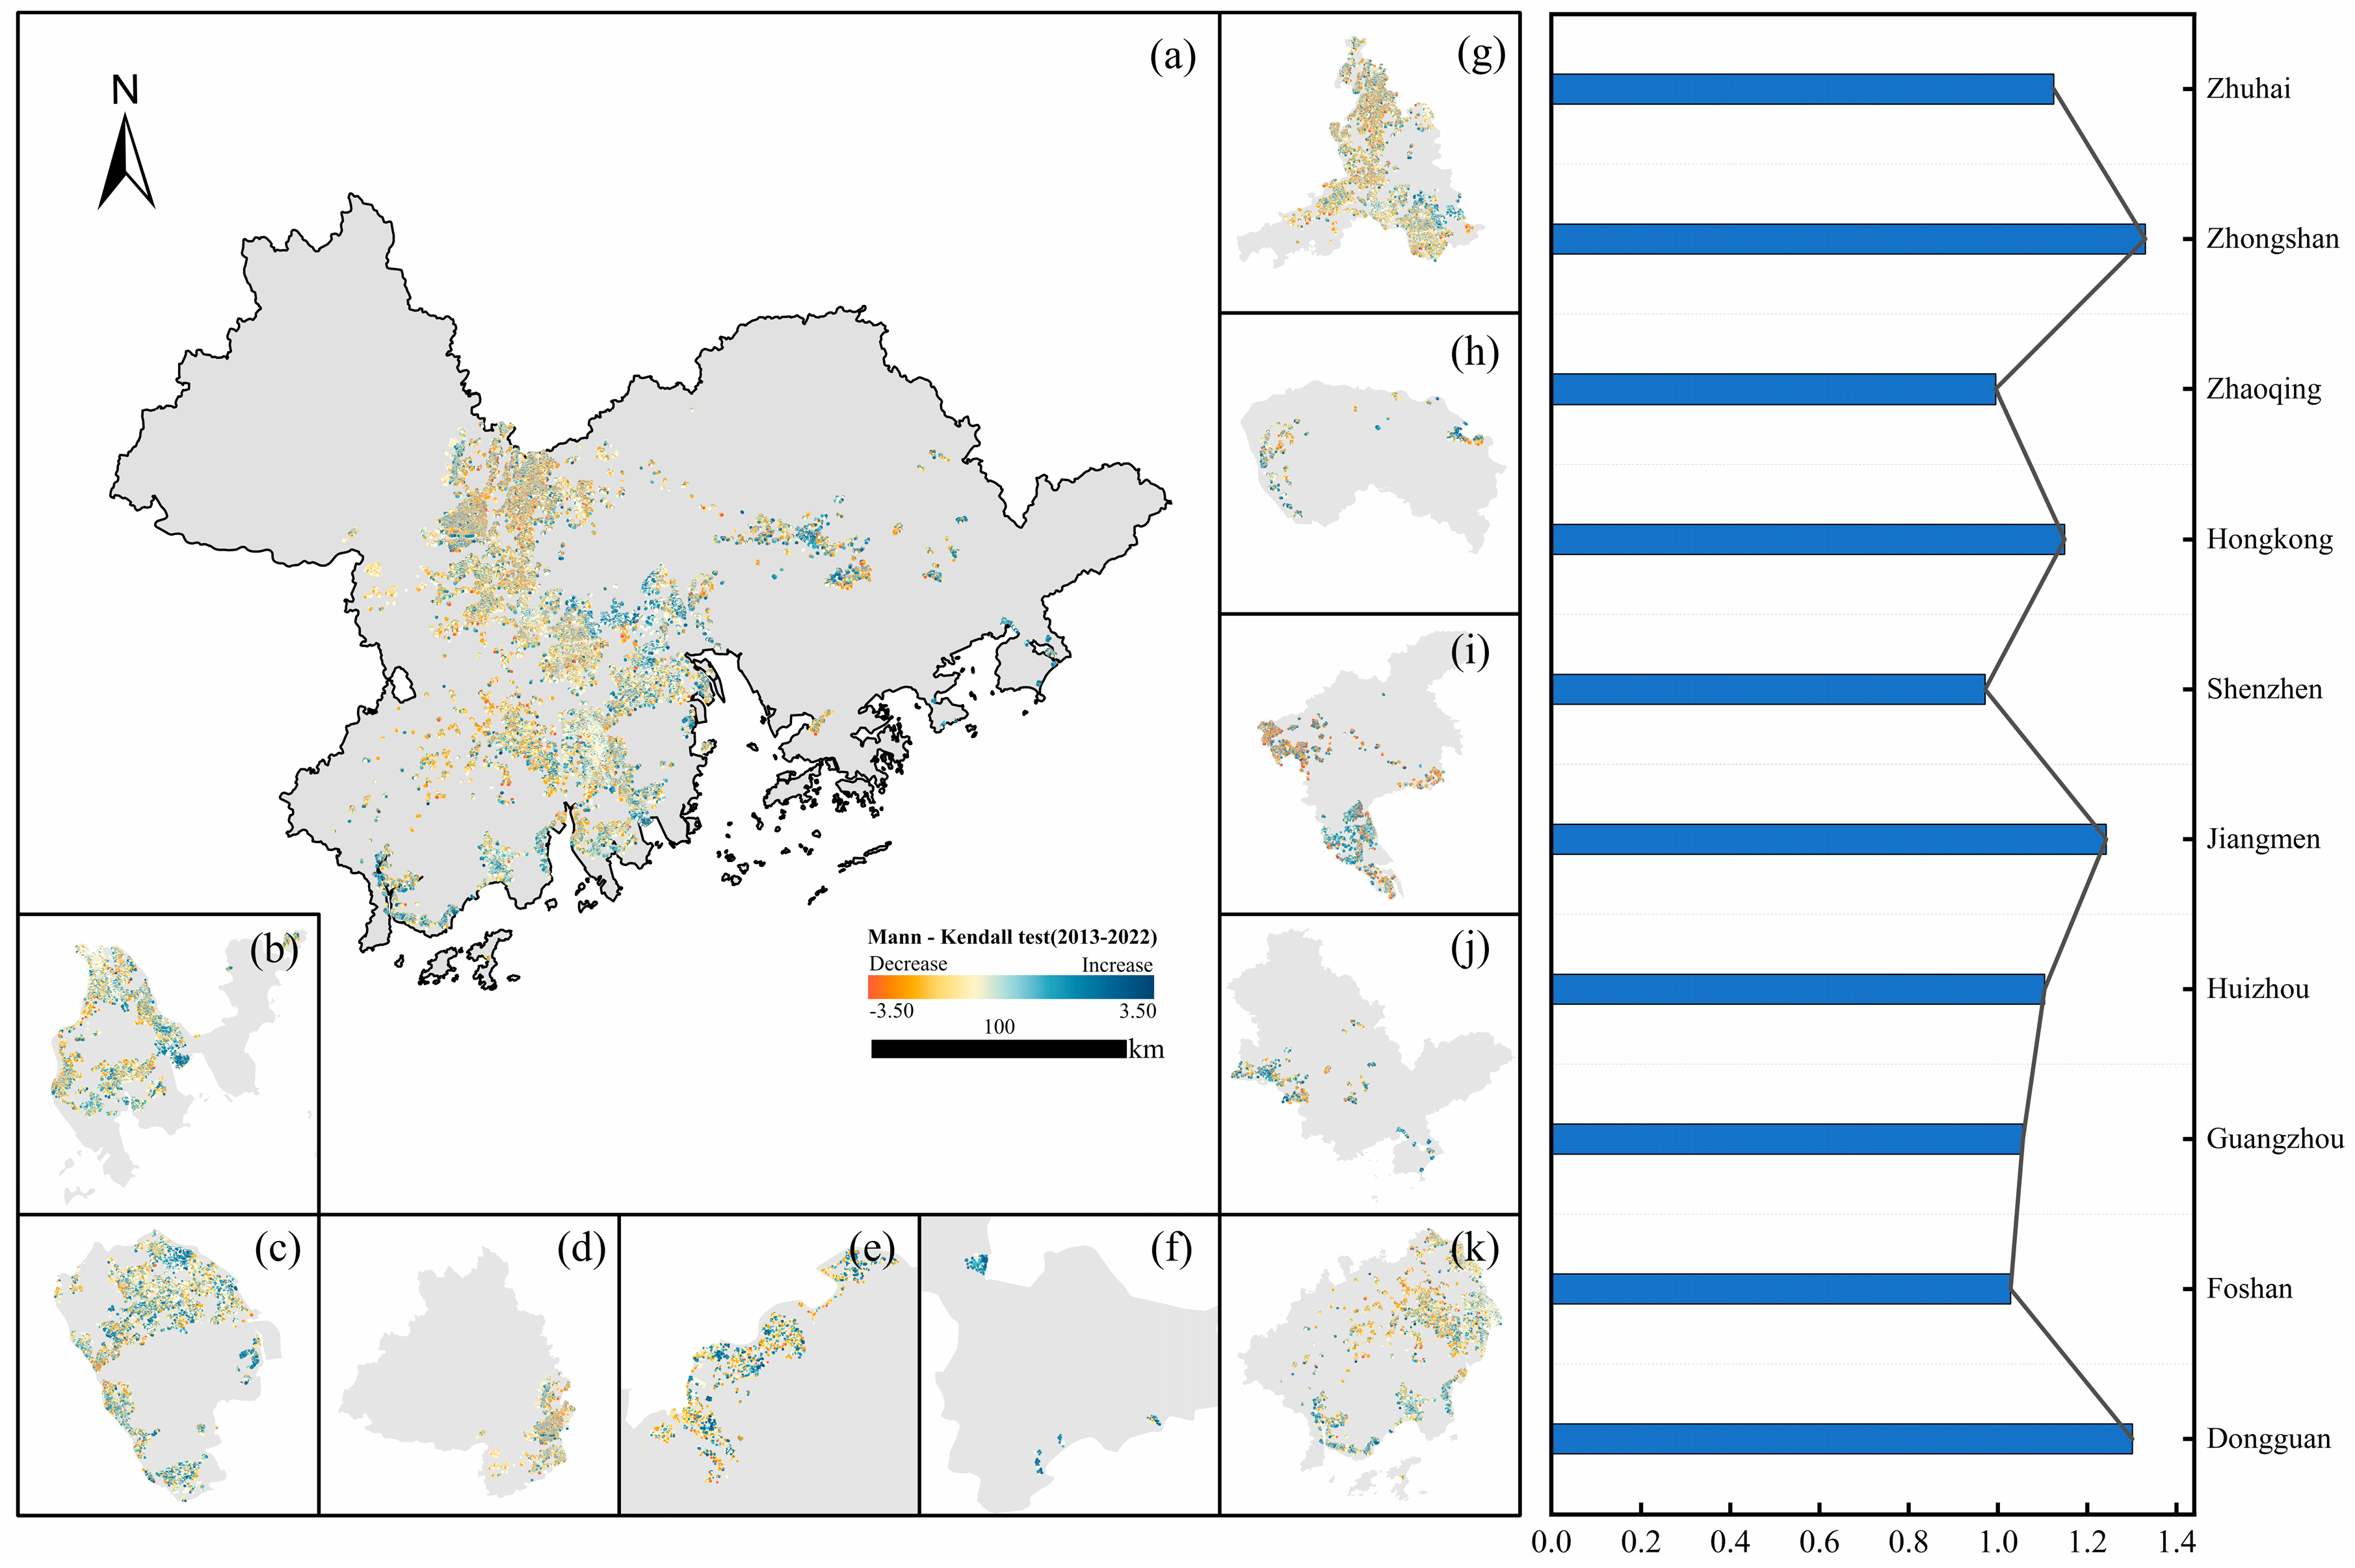
To quantify the changing trend in Chl-a concentration in fish ponds in the GBA from 2013 to 2022, we conducted a continuous trend analysis using the MK trend test and Sen’s test. Our analysis focused on ponds that remained consistently present throughout the decade, as identified in the lake identification results in 2013, 2015, and 2019. Subsequently, the results were also divided into ten individual regions (Zhuhai, Zhongshan, Zhaoqing, Hong Kong, Shenzhen, Jiangmen, Huizhou, Guangzhou, Foshan, and Dongguan city) to examine the changes based on Z and β values. Observations revealed that the Z values for all cities are less than 1.5, indicating that there is no statistically significant upward trend in Chl-a concentration change in the GBA (Figure 13). This suggests that the seasonal variations in Chl-a concentration is more significant than interannual variations. This phenomenon may be attributed to the relatively stable aquaculture conditions necessary for fish farming, encompassing feeding routines, environmental control, and cultivation cycles, resulting in a consistent interannual pattern in Chl-a concentration.
Despite the current high Chl-a concentration, Sen’s test results indicate an overall increasing trend (β = 1.9815) in Chl-a concentration change over the past decade (Figure 14). Across the ten cities, all β-values exceed 0, with Dongguan exhibiting the highest rate at 2.94 μg L−1 yr−1, while Guangzhou recorded the lowest increasing rate. This discrepancy may stem from Guangzhou’s extensive urbanization, posing challenges for the expansion of fish farming activities. The rate of increase of Chl-a concentration in the southeast GBA is somewhat higher than that in the northwest, potentially indicating an increase in the number of fish and corresponding feed input per fish pond over the last decade. Conversely, the relatively slower rate of Chl-a concentration increase in the northwest GBA may be attributed to its relatively lower level of development, resulting in reduced rental costs and lower unit output from aquaculture activities. In conclusion, economic activities and incentives remain the primary influencers on the ecological environment of fish ponds in the GBA.

4. Discussion

4.1. Possible Causes of Chl-a Changes

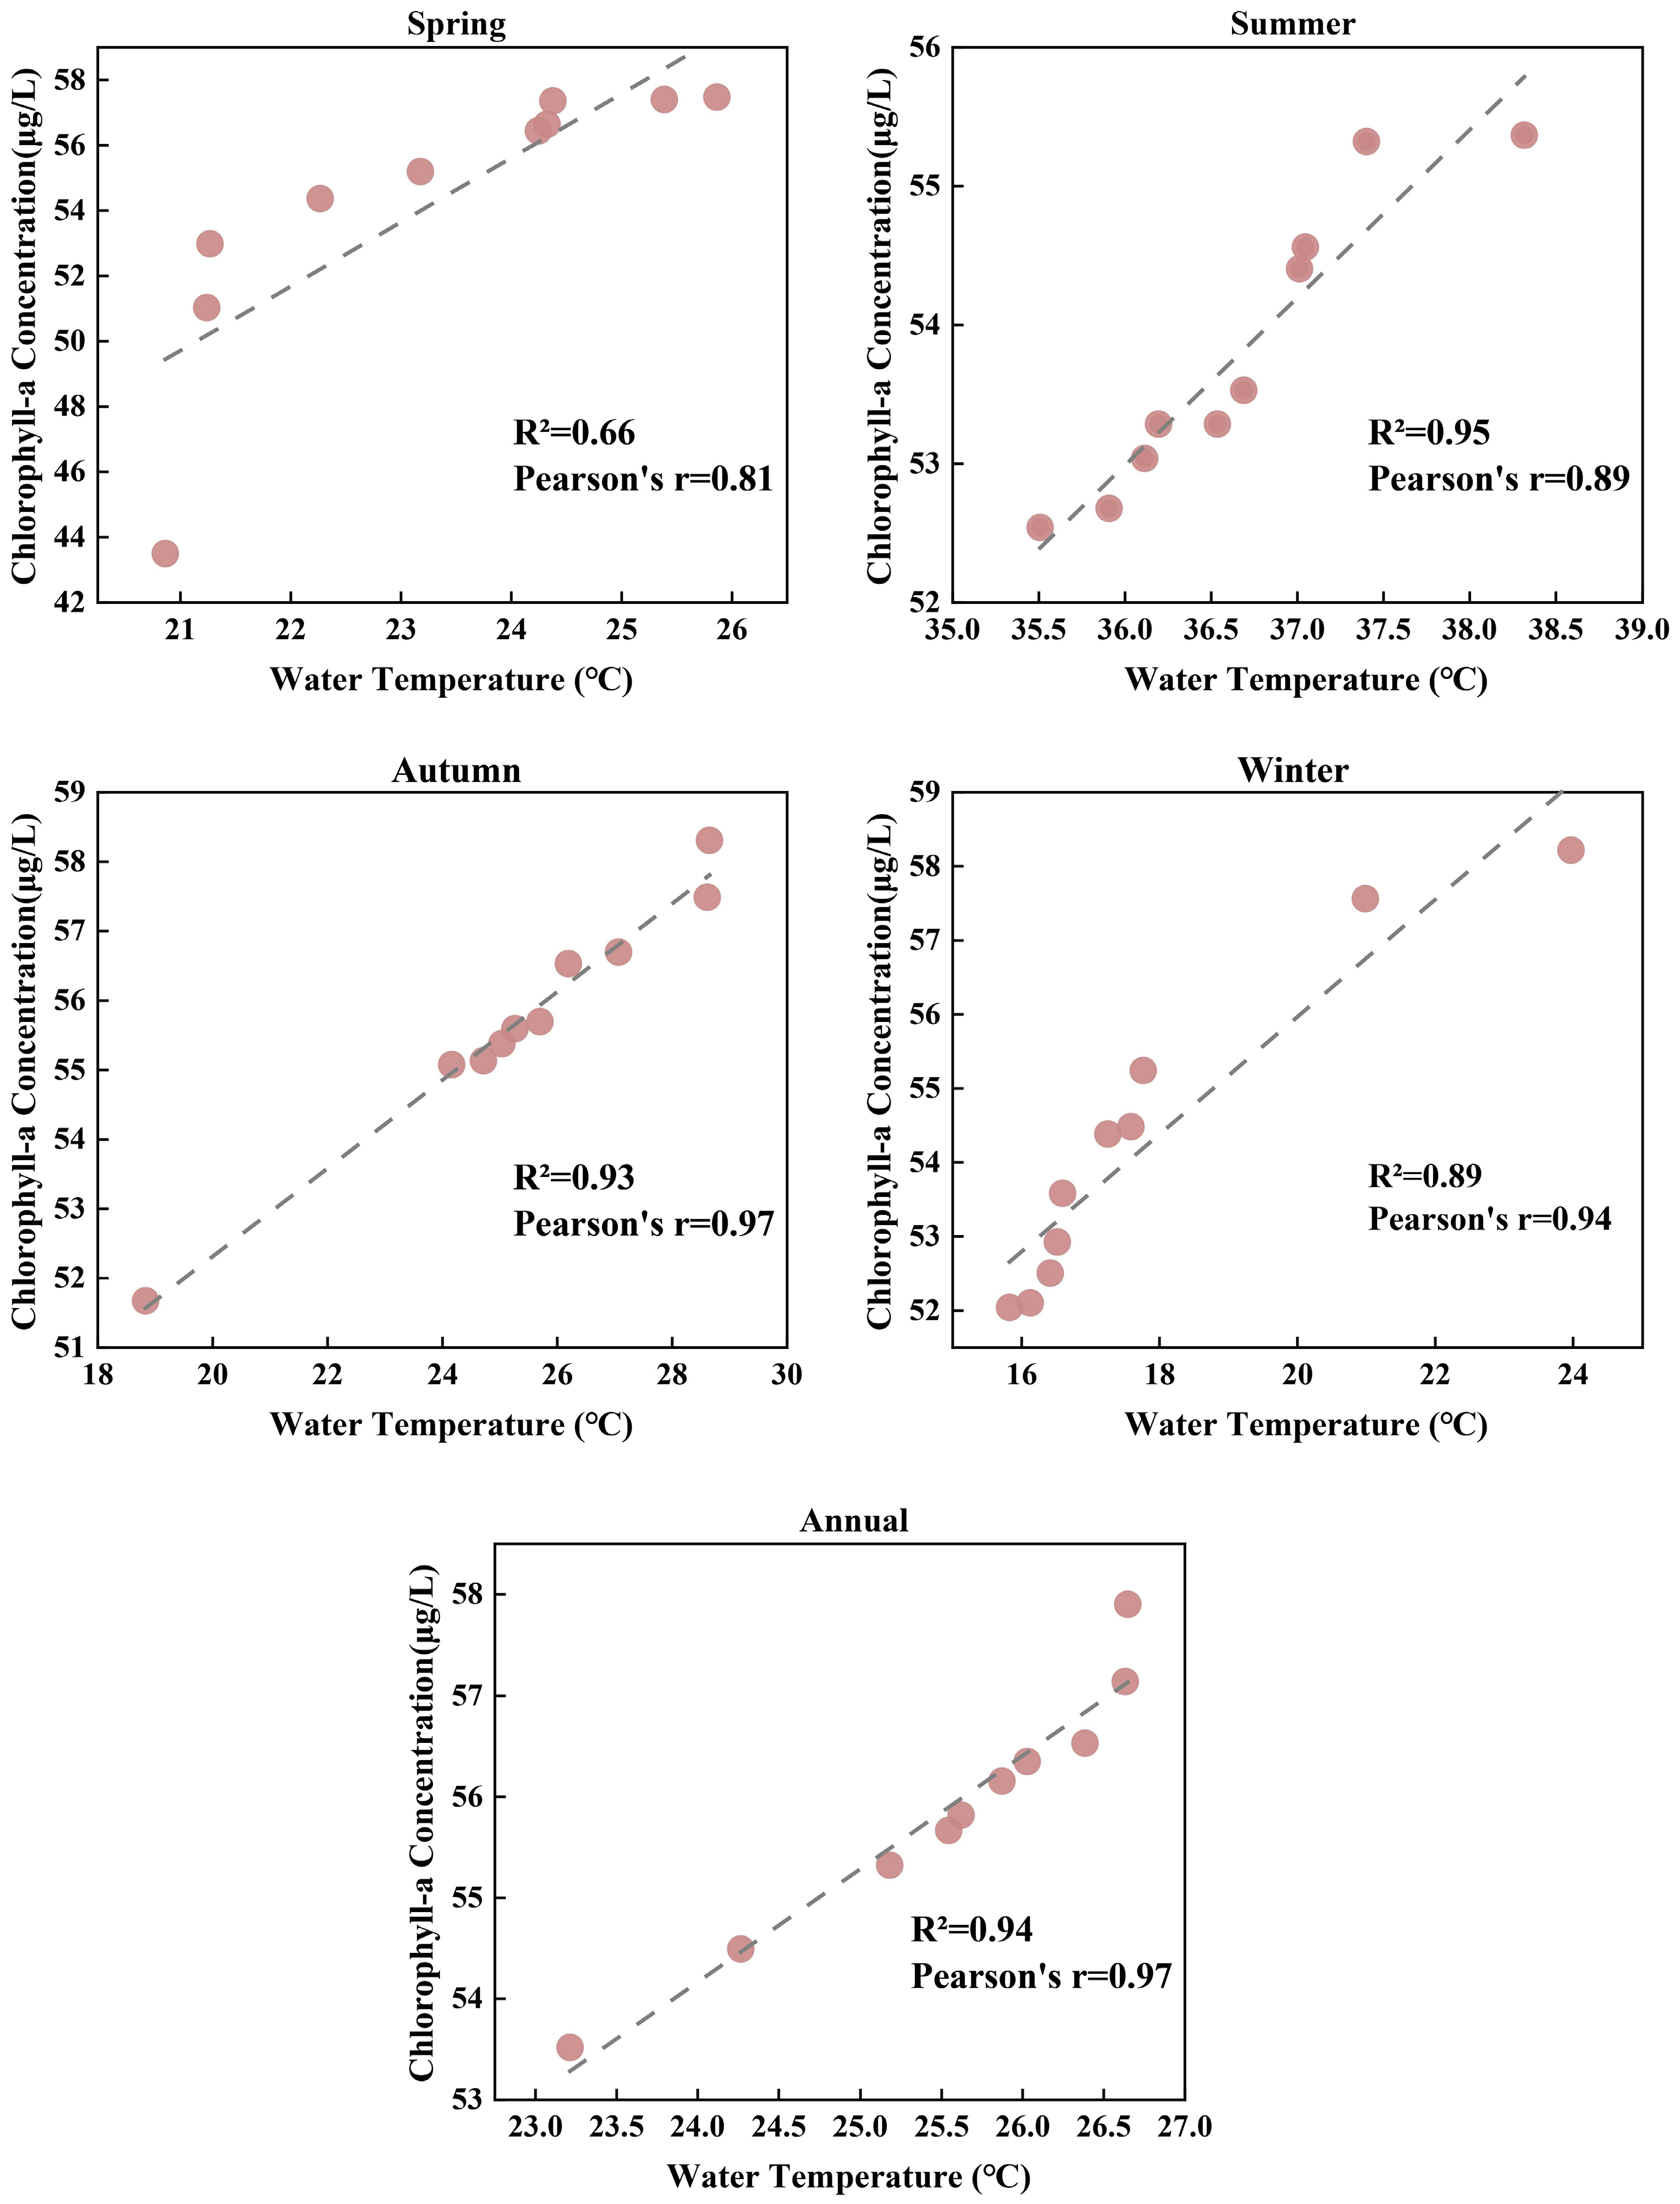
Our results revealed significant spatiotemporal variations in Chl-a concentration in fish ponds in the GBA, including interannual, seasonal, and spatial patterns. Environmental changes [49,50], climate changes [14], and human activities [5,16,17] are the primary driving forces of these changes, with temperature potentially exerting the most significant natural influence. To delve deeper into these dynamics, we calculated the water temperature of fish ponds for four seasons from 2013 to 2022, deriving the average over the decade. We also investigated the relationship between water temperature and Chl-a concentration in fish ponds across different seasons, unveiling a positive correlation (Figure 15). Fish ponds with elevated water temperatures also exhibited heightened Chl-a concentration, with both peaking in summer and dipping in winter.
Figure 16 shows the correlation between Chl-a concentration and water temperature across various time scales, each point representing a year from 2013 to 2022. The result shows the robust positive relationship between water temperature and Chl-a concentration (R2 > 0.65), with correlation being strongest in summer (R2 = 0.95), reaching 0.94 annually. The relationship between chlorophyll-a (Chl-a) concentration and temperature is typically positive. As temperature increases, the growth rate of phytoplankton often accelerates, leading to higher Chl-a concentrations. Warmer temperatures can enhance photosynthetic activity and nutrient uptake by phytoplankton, promoting their proliferation. However, this relationship can be influenced by other factors such as nutrient availability, light conditions, and water mixing patterns [51,52,53,54]. Except during algal bloom events when Chl-a concentration and water temperature exhibit significant disparities, a consistent strong correlation between the two variables persists under other scenarios. Therefore, we posit those seasonal changes in Chl-a concentration in fish ponds primarily stem from shifts in water temperature.
Chl-a concentration and suspended sediment concentration (SSC) serve as key indicators for eutrophication in inland waters. Previous studies have shown a strong connection between Chl-a and SSC, wherein higher SSC levels correspond to elevated Chl-a concentration [55]. Increased SSC can intensify light scattering, thereby augmenting phytoplankton photosynthesis [55]. Moreover, climate change indirectly influences Chl-a concentration in water bodies. Pang et al. identified a negative correlation between Chl-a concentration and water surface area and volume in fish ponds [56,57]. Seasonal rainfall patterns may transport greater quantities of suspended sediments from rivers into fish ponds, thus influencing the growth of phytoplankton. Conversely, while rainfall can introduce more nutrients into fish ponds, the subsequent rise in water volume may lead to Chl-a concentration dilution [58]. Furthermore, Chl-a concentration is subject to influence from various climate indicators and water quality parameters. For example, dissolved oxygen (DO) can modulate Chl-a concentration via changing phytoplankton metabolism [2].
Our previous study indicates a continuous impact of human activities on fish ponds [5]. Over time, the fish ponds have transitioned from being near-natural with varied sizes and random distribution, to having artificial layouts and specific shapes. Human activities have been responsible for the emergence or disappearance of fish ponds over the past decades, contributing to long-term changes in Chl-a concentration. Population growth and economic development have stimulated the demand for aquatic products, resulting in an increase in fish ponds. For instance, in Guangzhou and Huizhou, natural disasters, bacterial diseases, and fluctuating prices of aquatic products have heightened the risks associated with aquaculture development, discouraging farmers from aquaculture expansion. Additionally, the area occupied by fish ponds in Zhaoqing experienced a rapid decline from 2013 to 2019.
The overall mean Chl-a concentration across the GBA ranges from 53.52 to 57.90 μg L−1, significantly higher than those reported in previous studies. For instance, Cao’s study [24] on Lake Taihu reported an average Chl-a concentration ranging from 12.8 to 32.3 μg L−1 between 1984 and 2019, while Duan’s study [41] on three eutrophic lakes—Taihu, Gehu, and Dongjiuhu—showed Chl-a concentration lower than 42.44 μg L−1. Xu’s investigation [44] in the northeastern region’s Shitoukoumen Reservoir and Songhua Lake reported concentrations of only 1.53 to 19.35 μg L−1. Additionally, Guan’s study [46] presented average Chl-a concentration in various Chinese lakes, including Dongting Lake (22.79 μg L−1), Honghu Lake (32.13 μg L−1), and Chaohu Lake (21.07 μg L−1). These findings highlight the markedly higher Chl-a concentrations in fish ponds in the GBA compared to those in other natural lakes across China, as well as those large lakes heavily impacted by human activities such as Taihu and Chaohu lakes, suggesting a high level of eutrophication in GBA fish ponds.
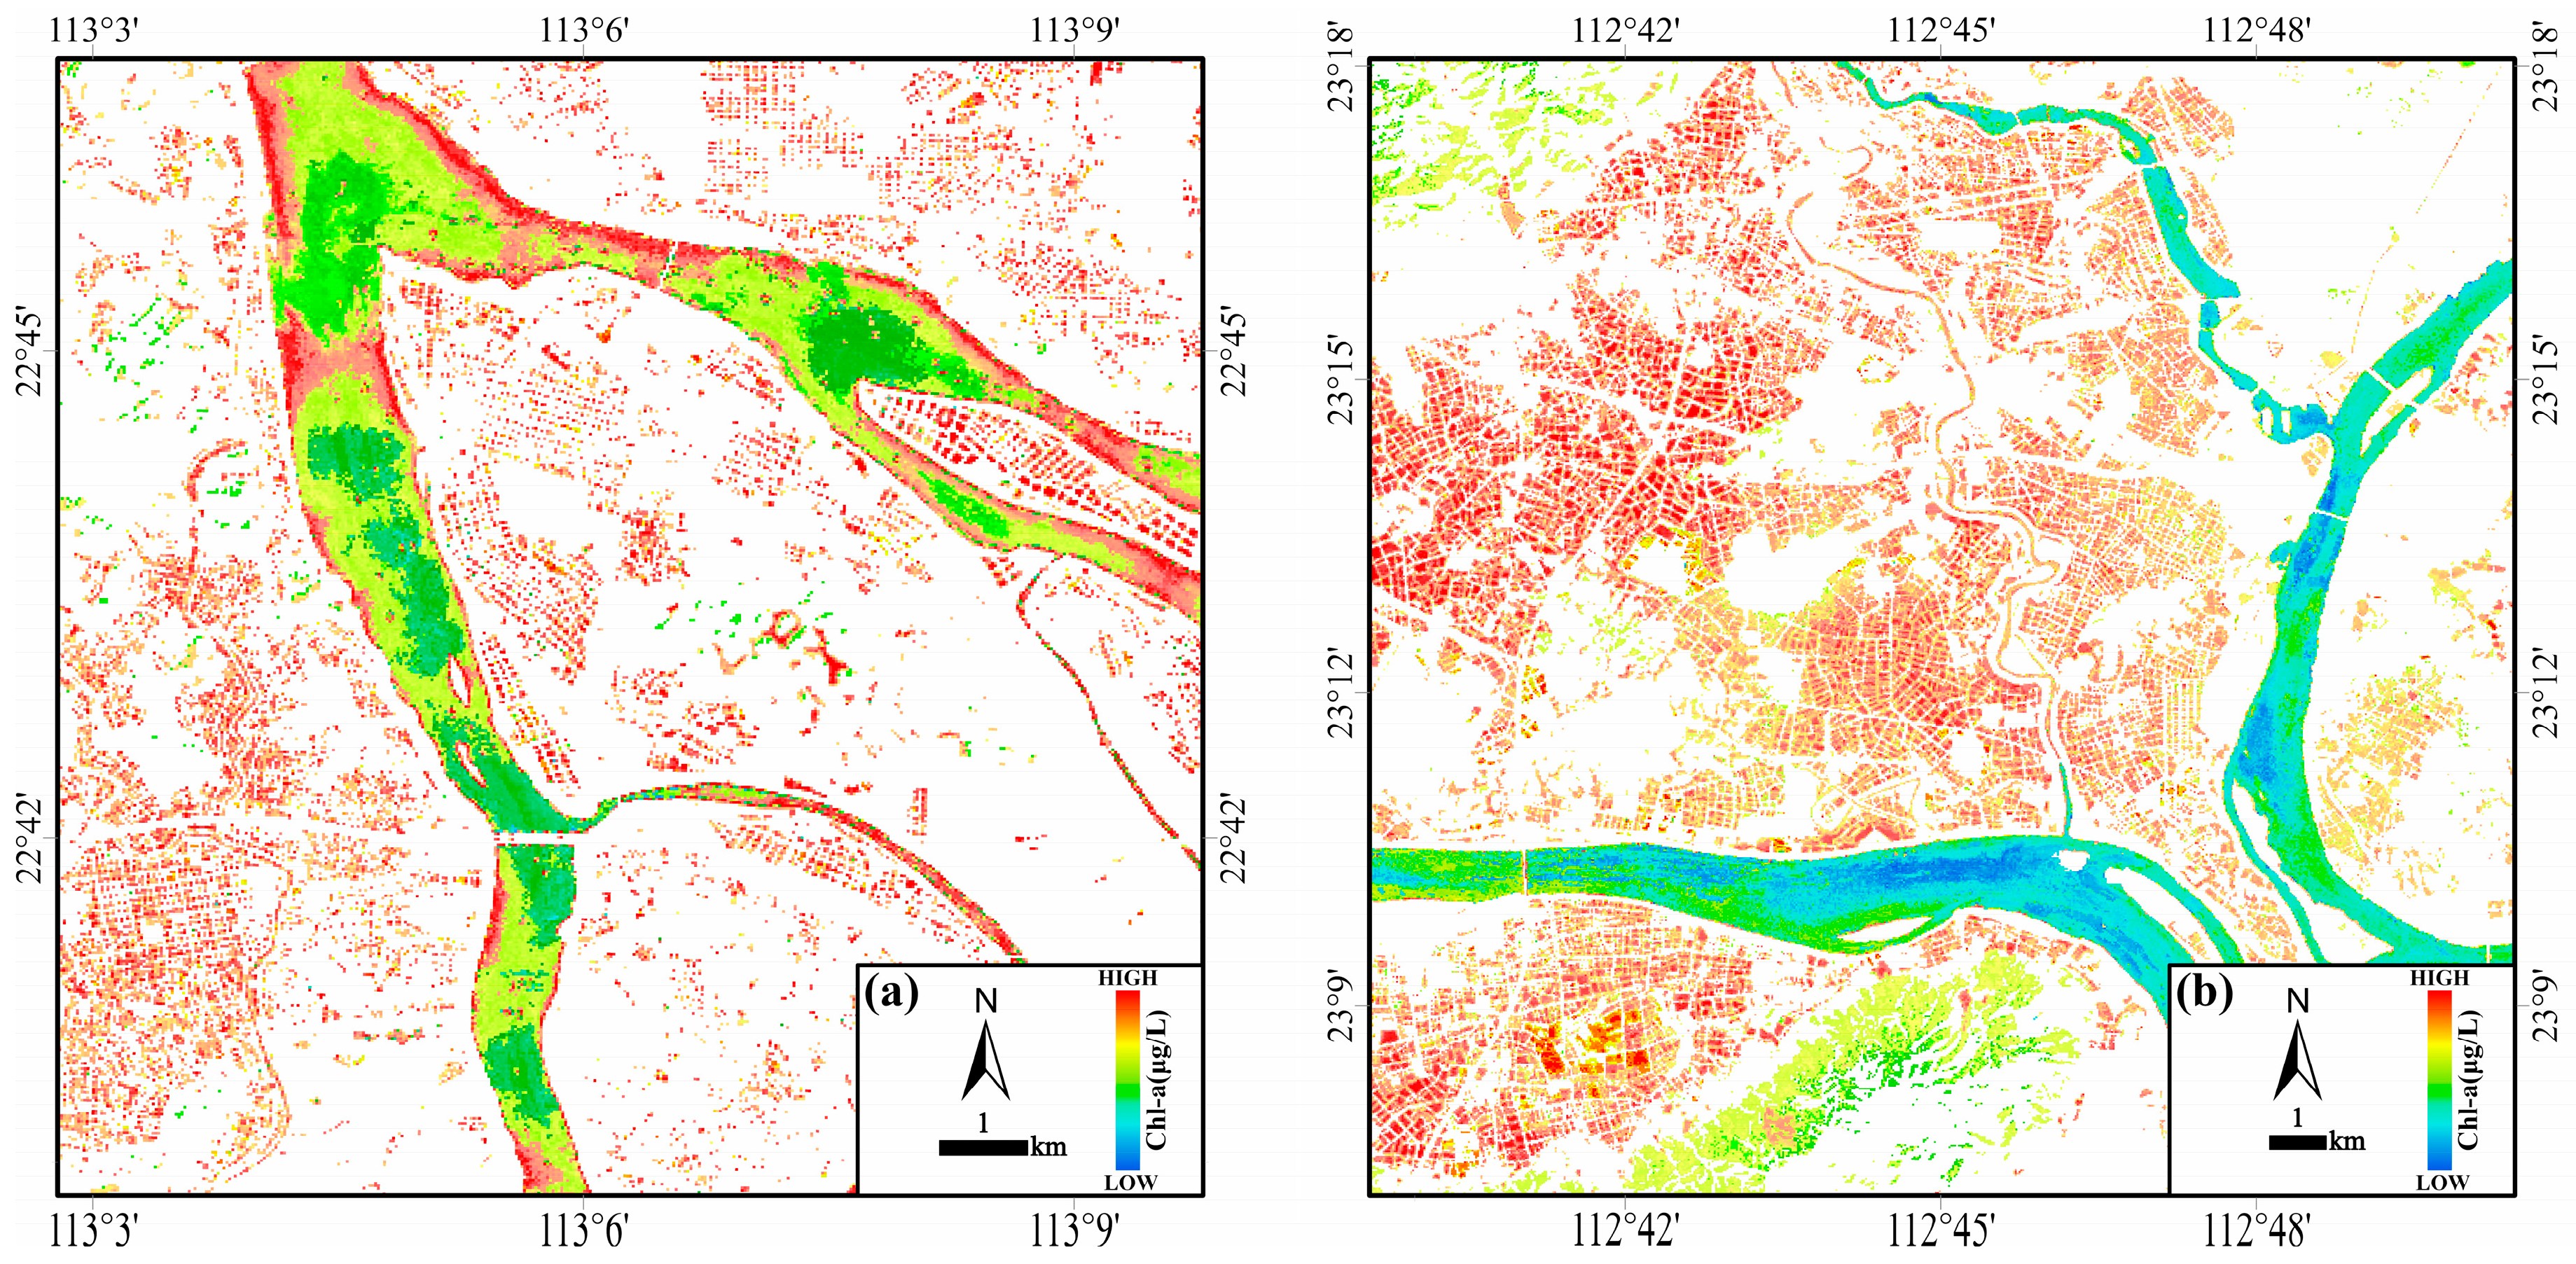
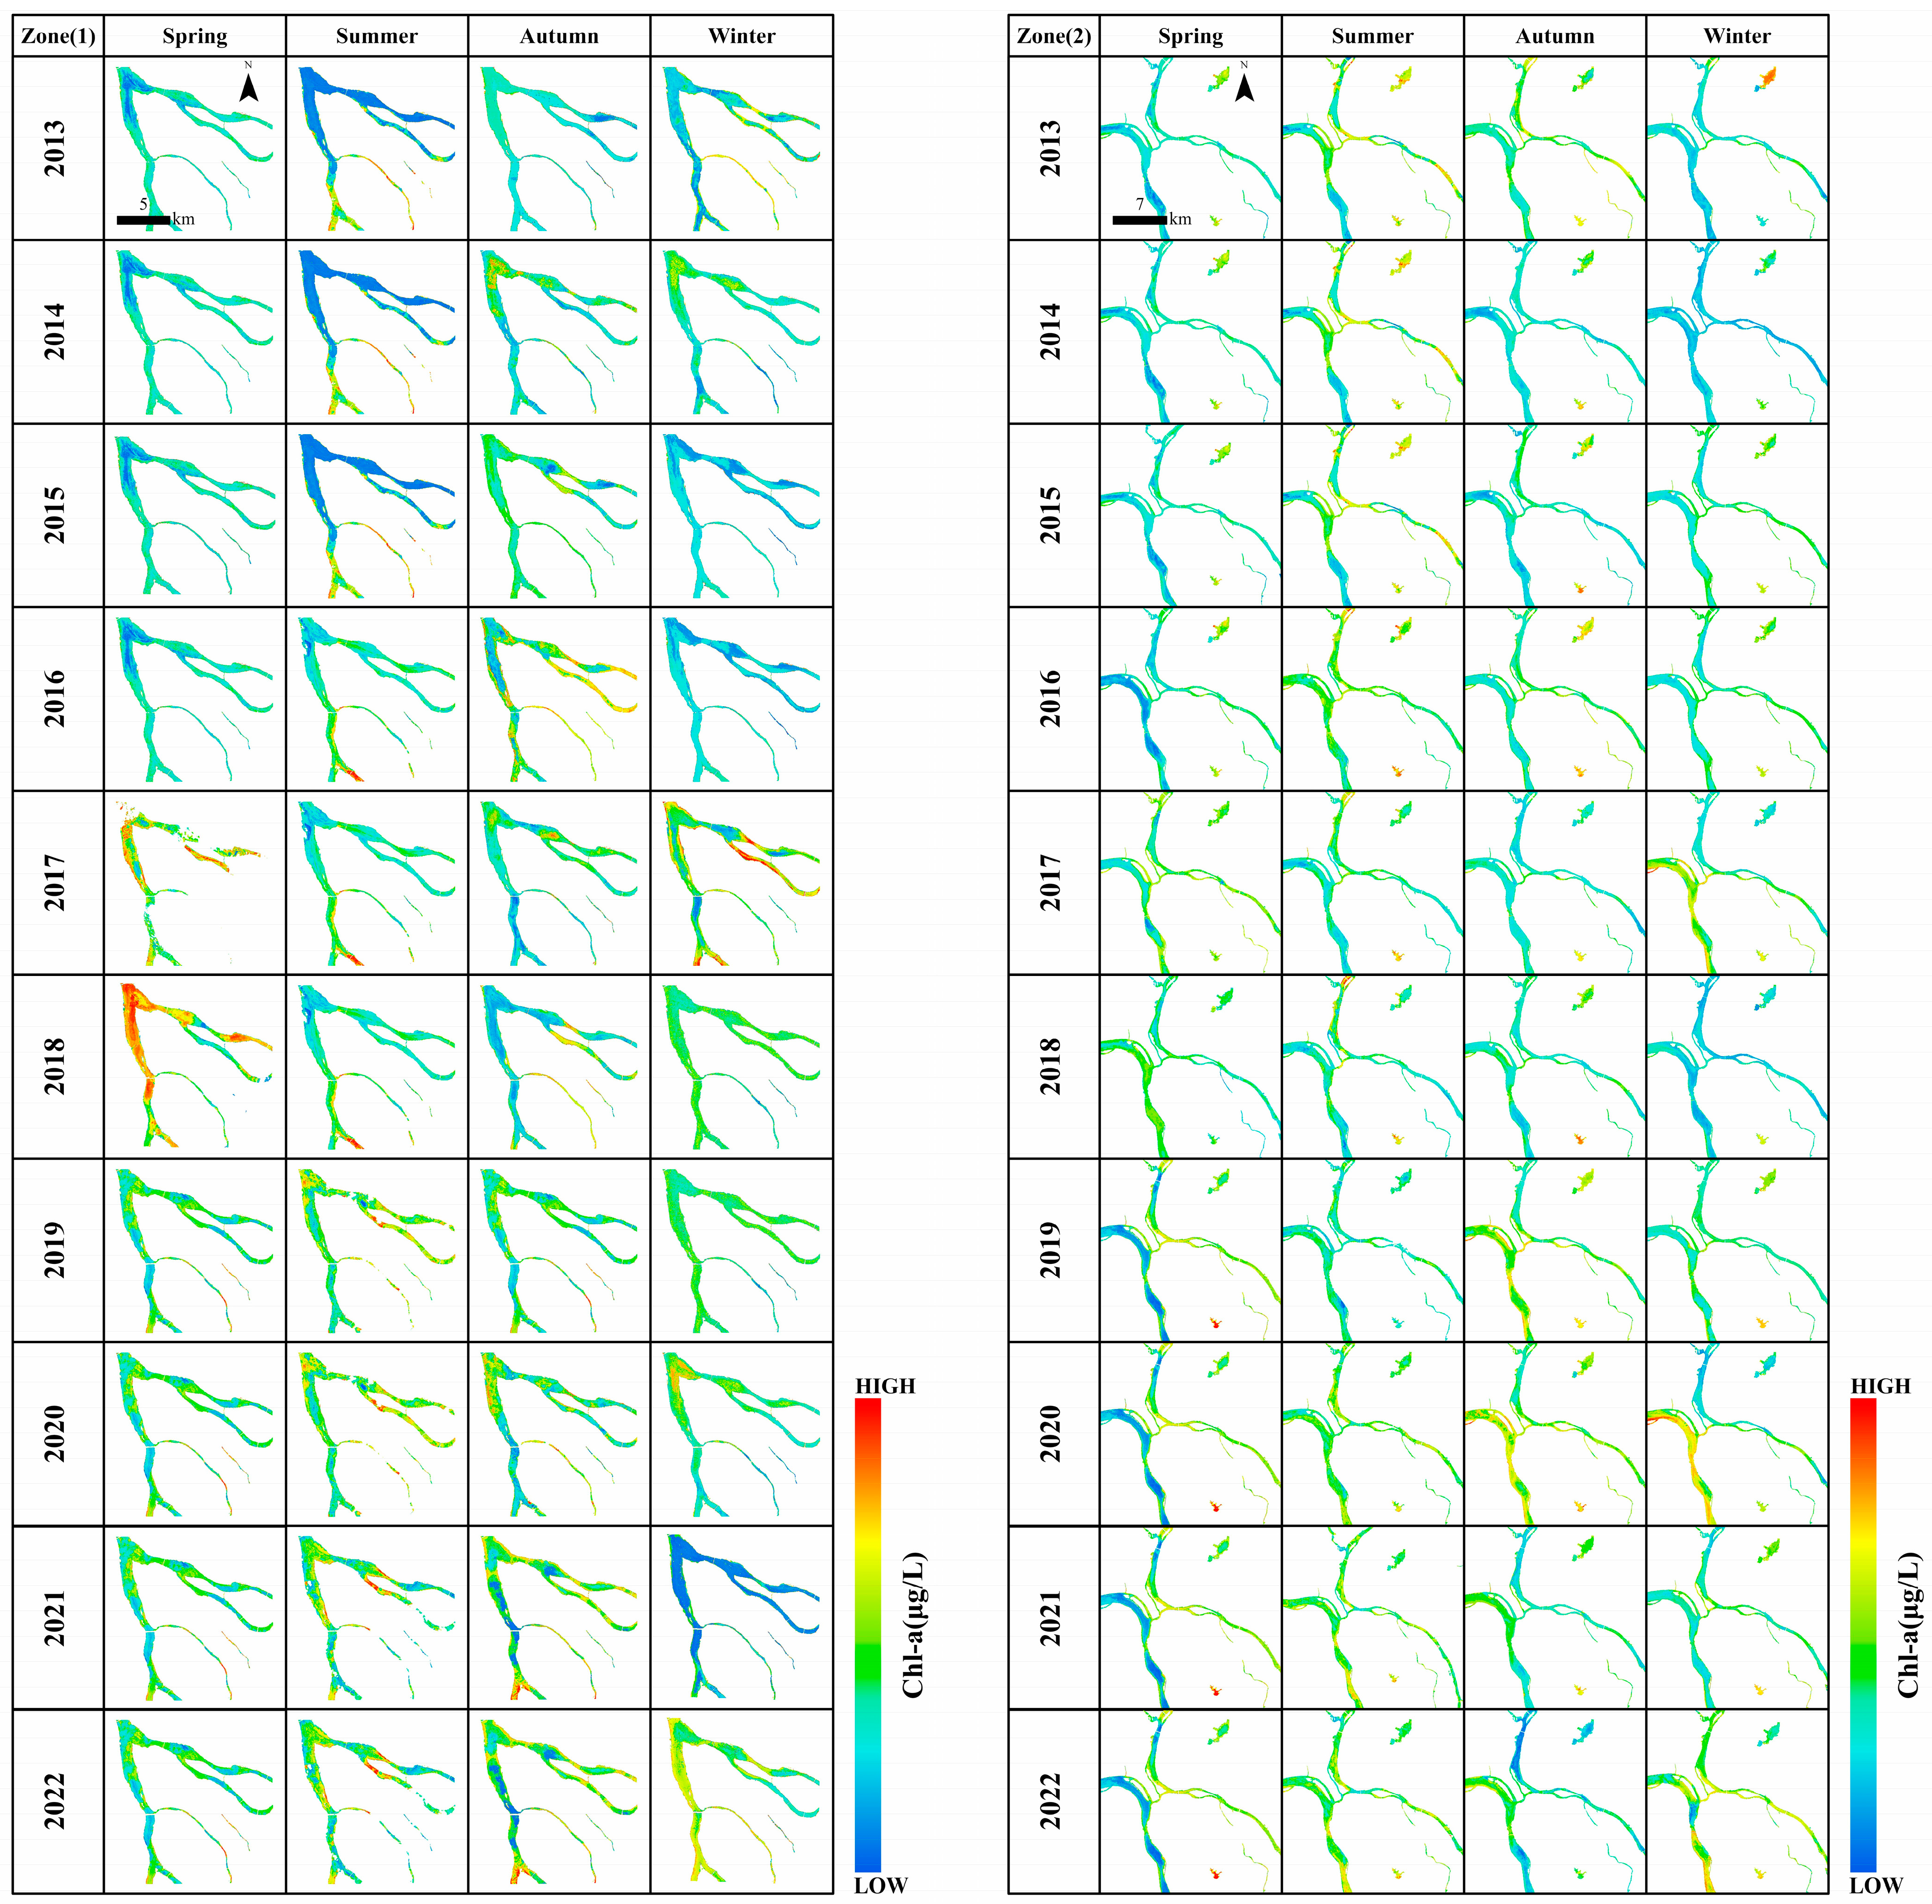
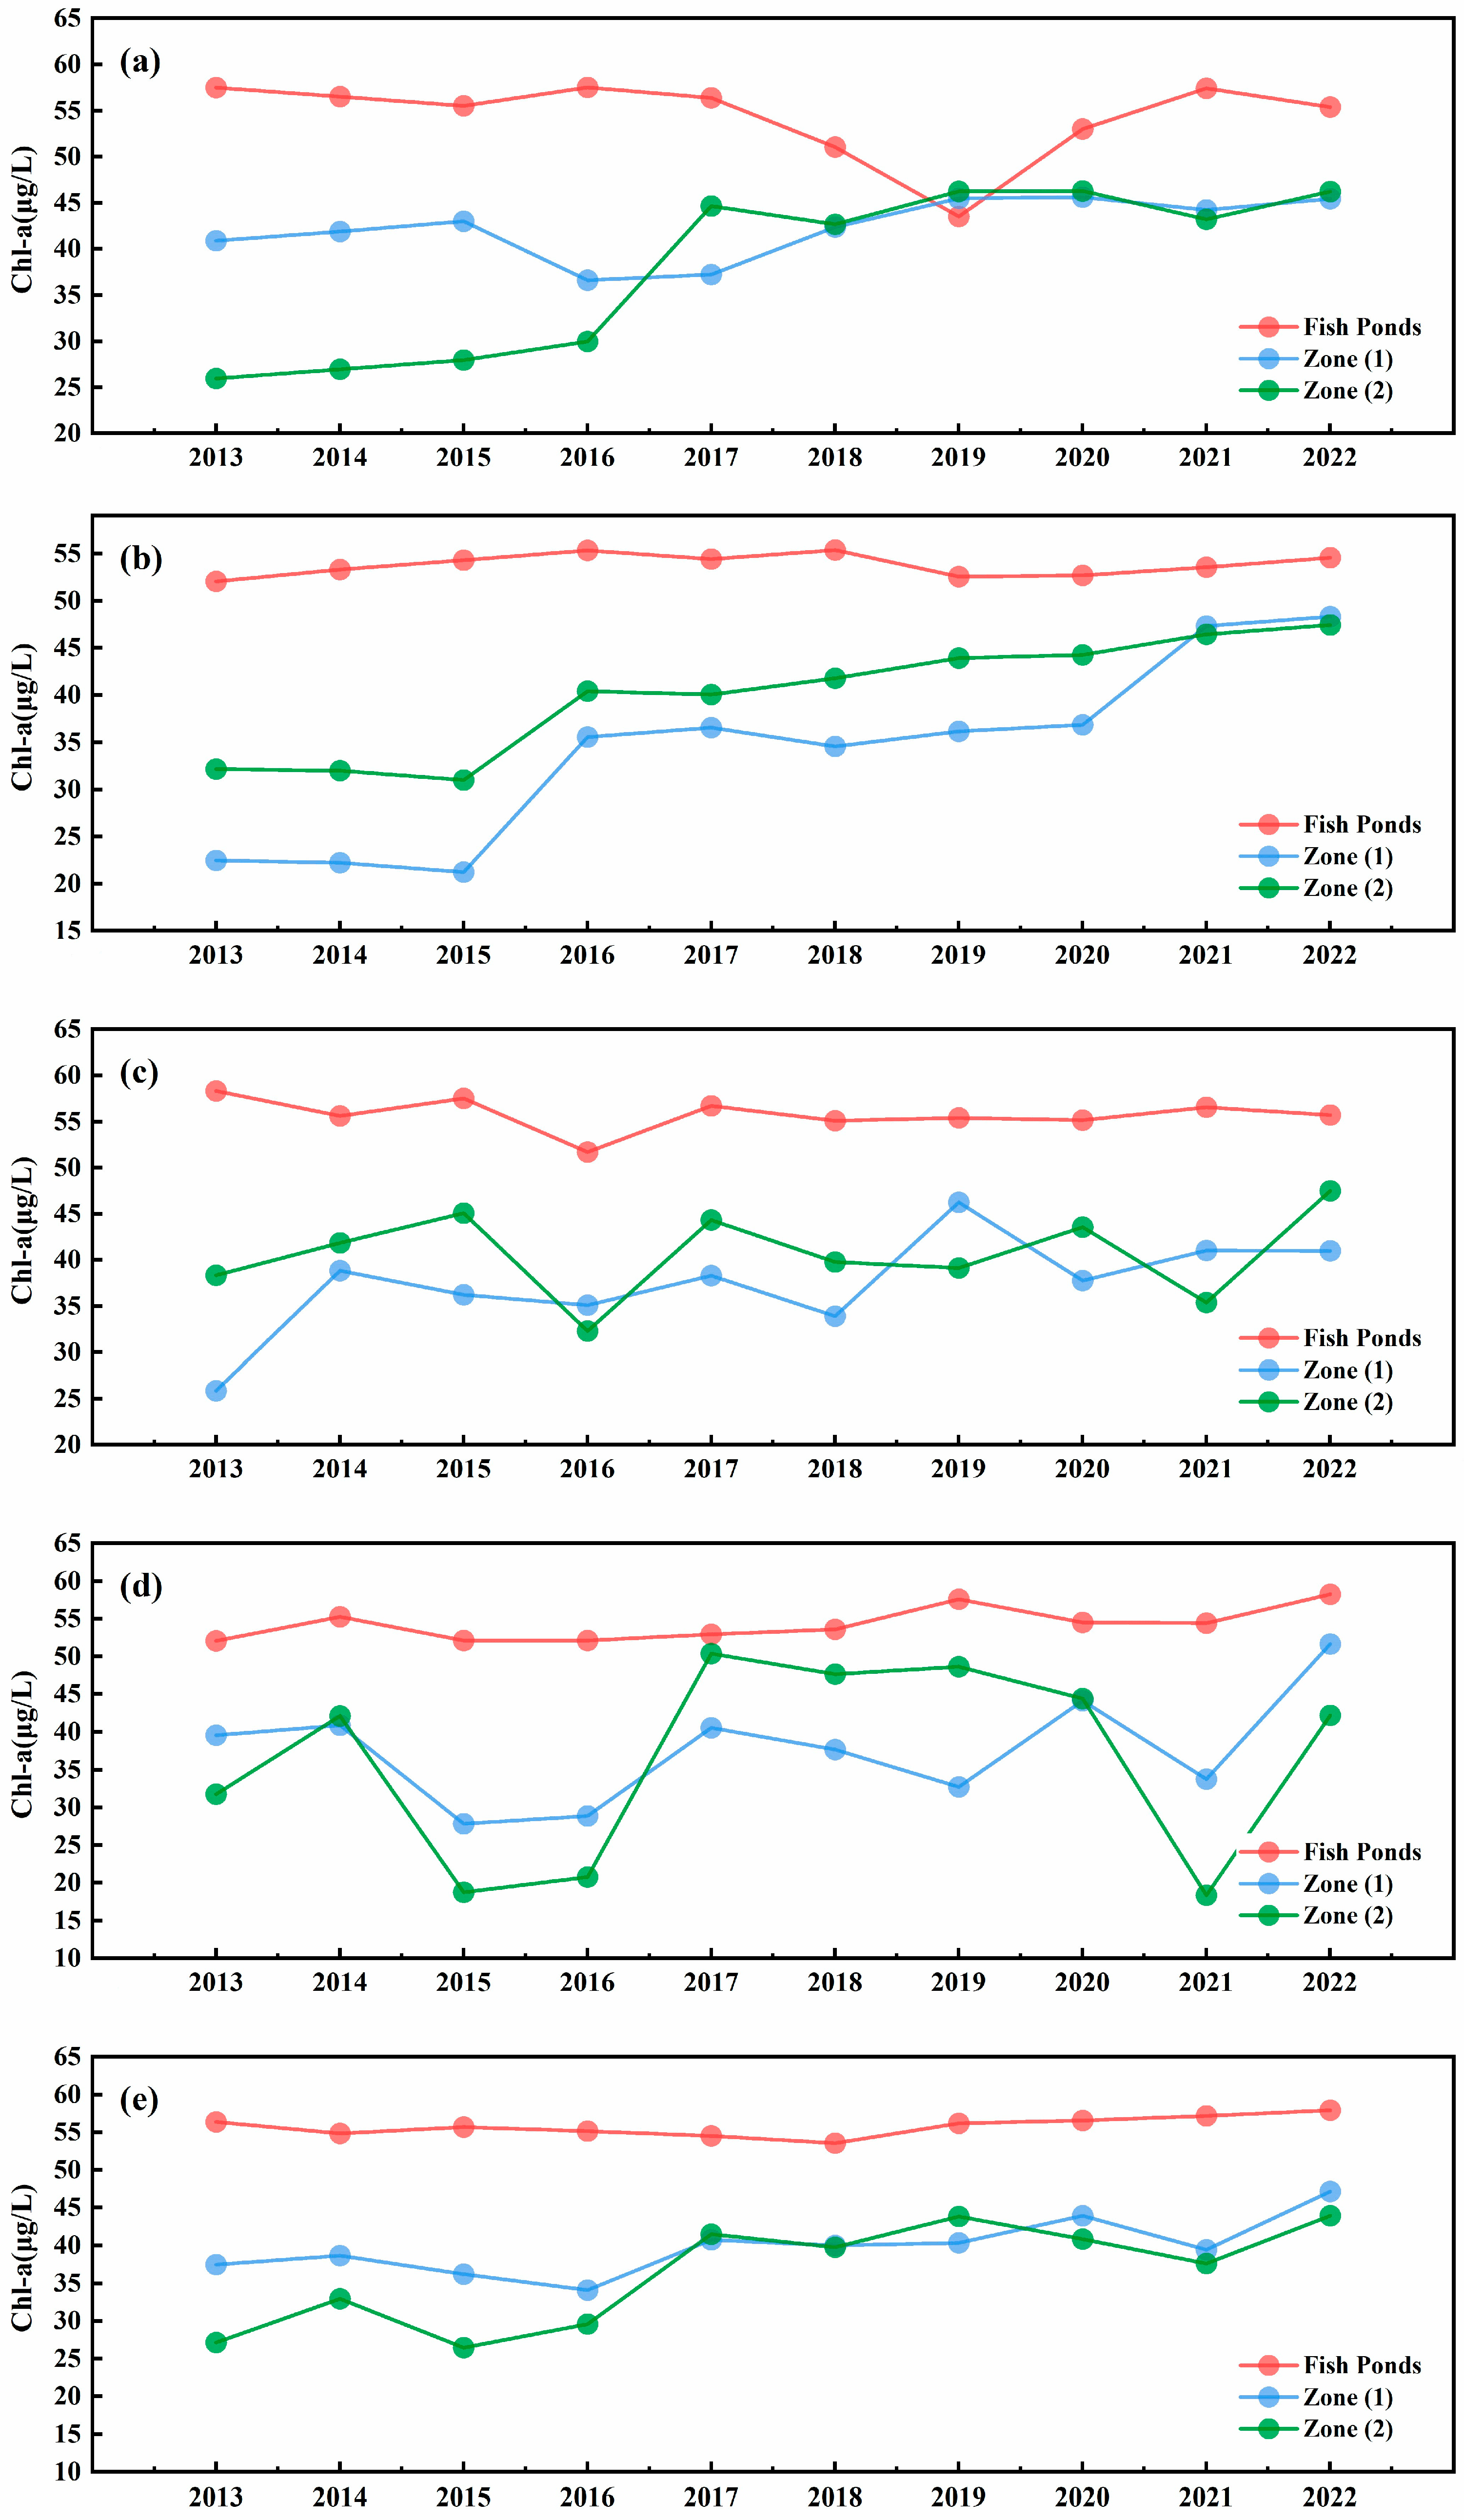
It should be noted that eutrophication has increased over the past decade, leading to frequent occurrences of harmful algal blooms in inland waters [21,22]. In the water bodies of the GBA, there are significant spatial variations in Chl-a concentration, particularly with fish ponds exhibiting much higher Chl-a concentration compared to the tributaries of the Pearl River and coastal seawaters. For an in-depth analysis, two regions with high densities of fish ponds were chosen. An examination of the variations in Chl-a concentrations from 2013 to 2022 was carried out (Figure 17). As seen in Figure 18 and Figure 19, Chl-a concentration in fish ponds was significantly higher than in the rivers and coastal waters. As can be seen from Figure 19, the Chl-a concentration in the rivers has also increased significantly over the past 10 years, especially in spring and summer. Despite this apparent increase, the Chl-a concentration in rivers remained consistently lower than that in fish ponds in all seasons. This difference is smallest in spring and winter and highest in summer and autumn.
The elevated levels of nitrogen (N) and phosphorus (P) in fish ponds compared to nearby natural rivers can be attributed to continual overfeeding practices, which result in nutrient accumulation and subsequent stimulation of phytoplankton growth and reproduction [59]. Excessive or inadequately treated feed contains nitrogen (N) and phosphorus (P), essential nutrients for phytoplankton growth [9,10,11]. Furthermore, the use of antibiotics, disinfectants, and other pharmaceuticals can lead to the buildup of drug residues, triggering eutrophication. Additionally, factors such as high-density aquaculture, infrequent water changes resulting in the buildup of fish and shrimp waste, and the discharge of untreated agricultural and industrial wastewater into fish ponds all contribute to severe eutrophication [10].

4.2. Sources of Study Uncertainty and Comparative Analysis

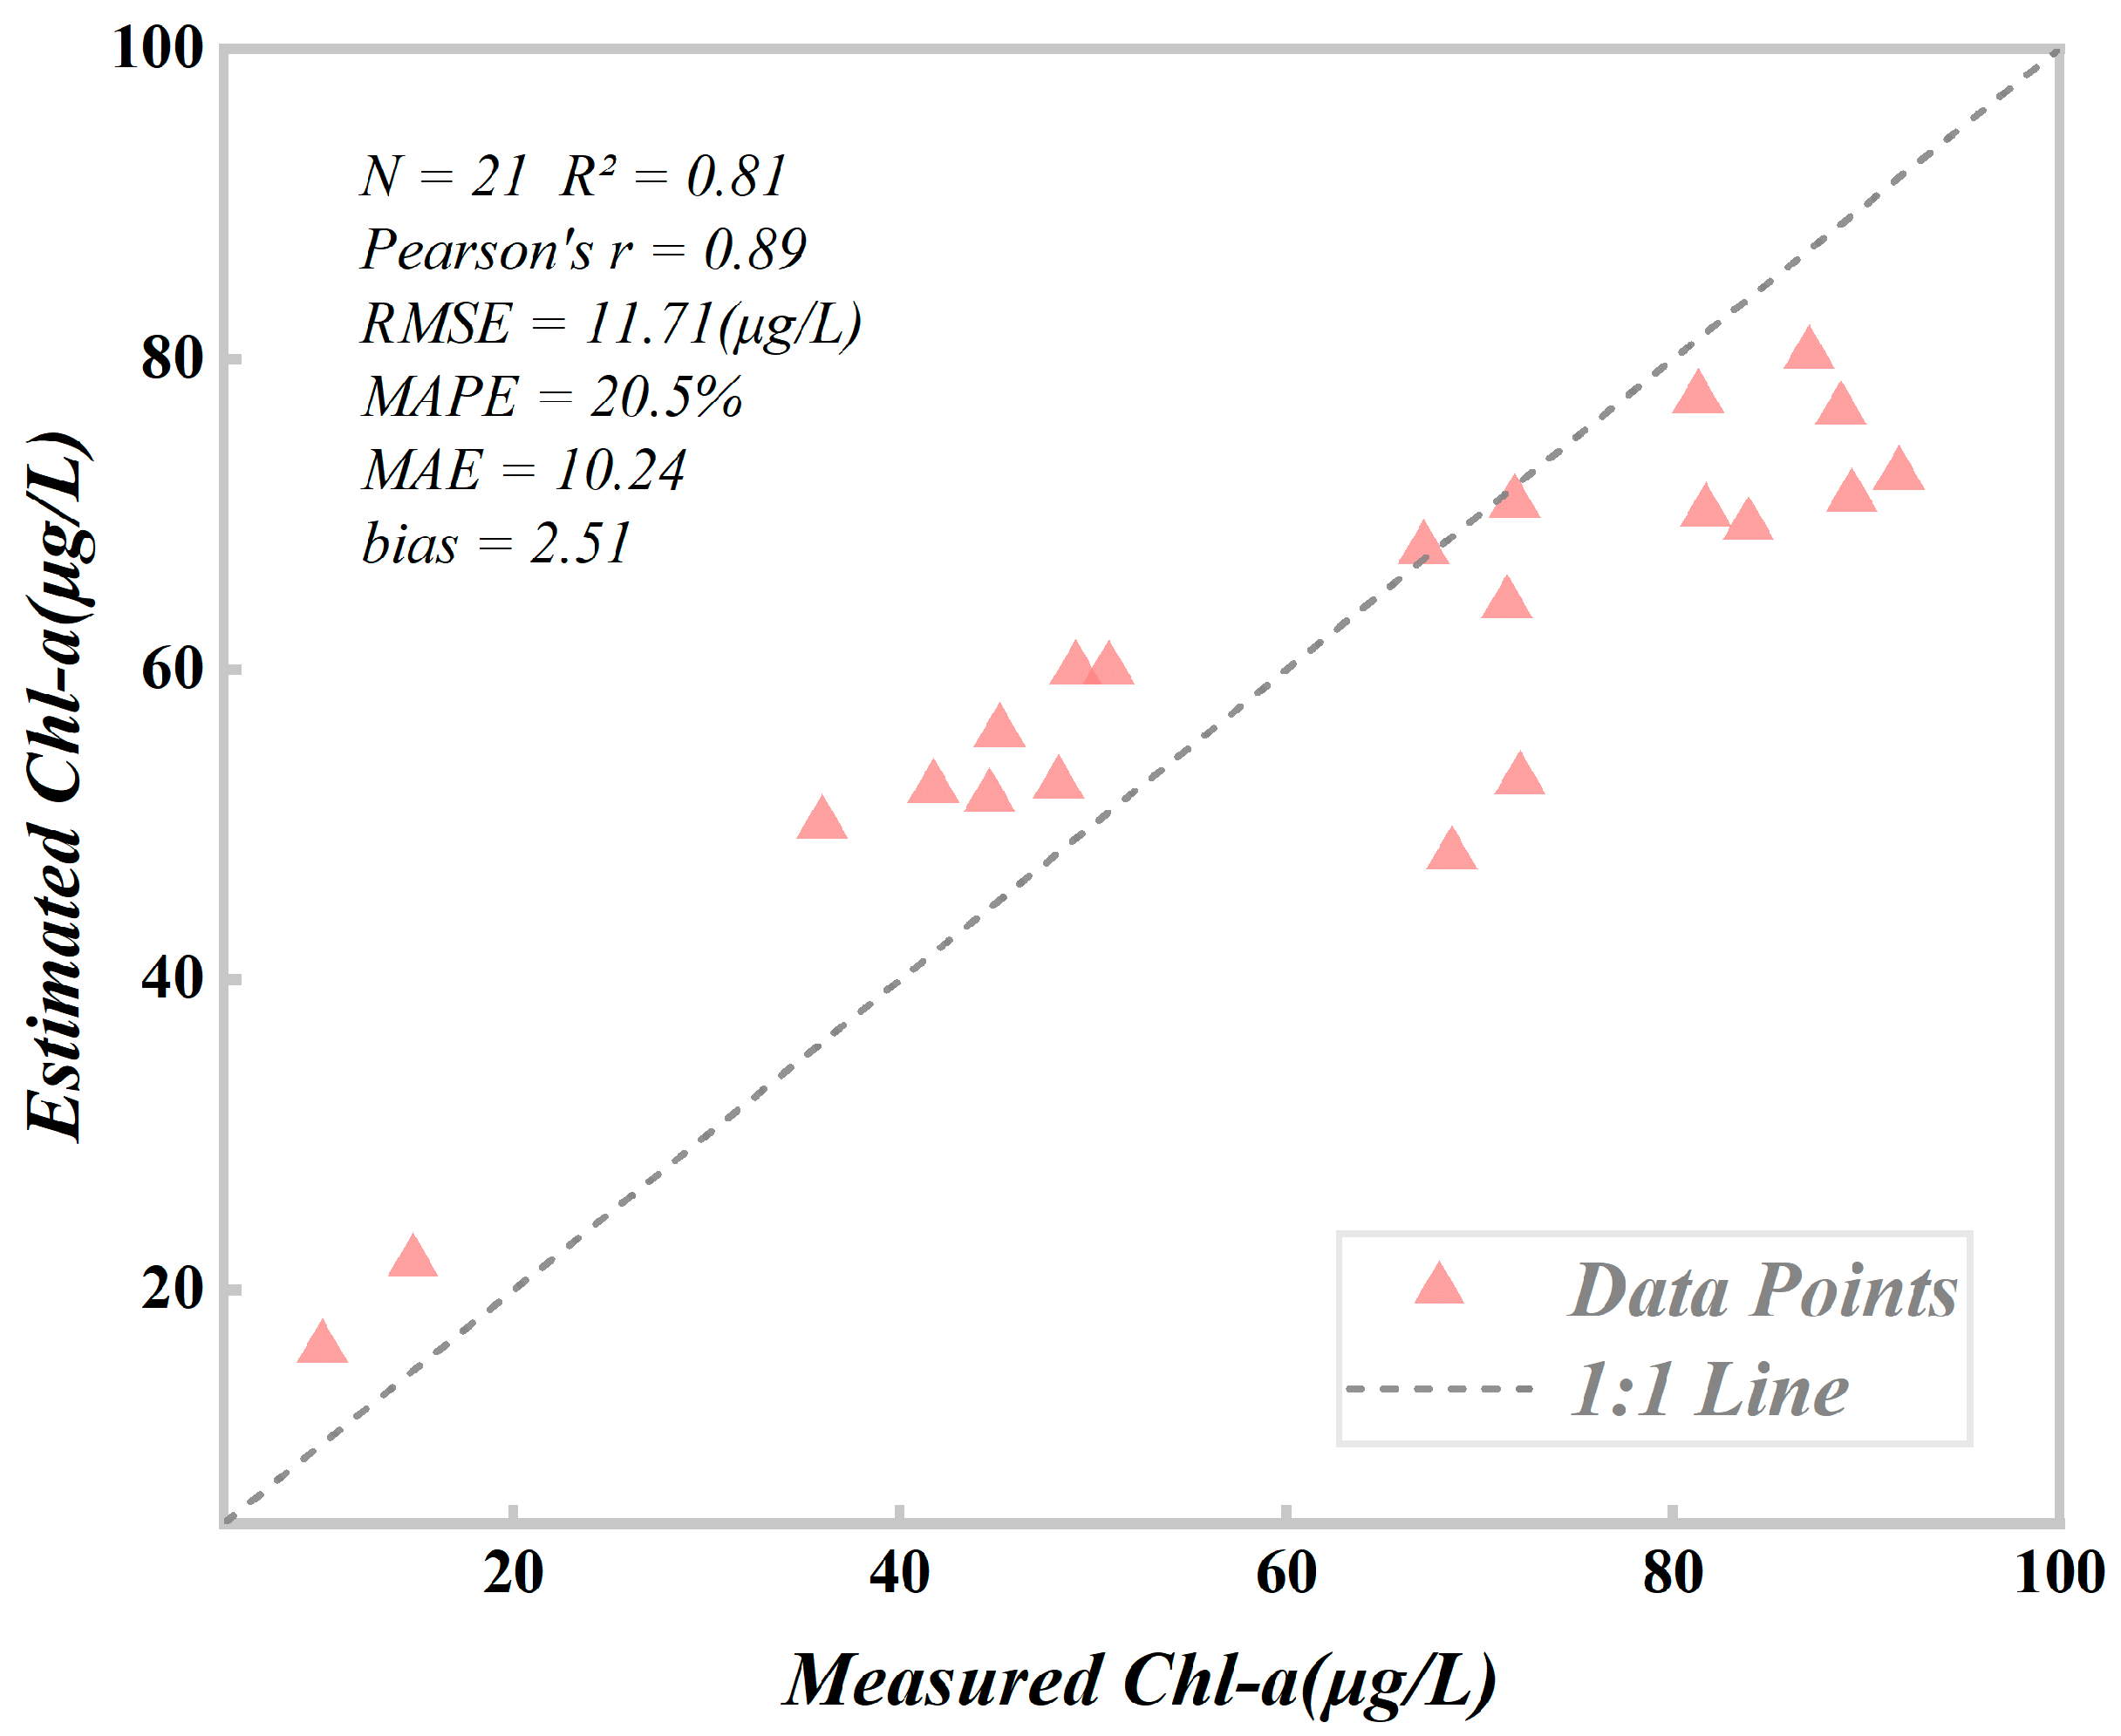
Accuracy verification involved 21 measured data points for Chl-a concentration. Concurrently, 3 × 3 pixel window averages were employed to extract Chl-a concentration at corresponding locations from the retrieval results. As depicted in Figure 20, both the estimated values and the measured values fall within the range of 10–100 μg L−1. Notably, there exists a high correlation between the estimated and measured values, suggesting that the BST model demonstrates favorable retrieval performance for the provided test data (R2 = 0.81, RMSE = 11.71 μg L−1, MAPE = 20.5%, MAE = 10.24, bias = 2.51). These results underscore the efficacy of the BST model in Chl-a retrieval for fish ponds in the GBA. It is worth noting that the estimated values slightly surpass the actual measured values, possibly due to the absence of high Chl-a concentration values in the training dataset, potentially resulting in the underestimation of high Chl-a concentration. Given the scarcity of high-quality in-situ observations with specific time and location for fish ponds in the GBA, the model’s applicability and accuracy may be constrained. In forthcoming studies, we aim to gather more high-quality samples to establish a more precise and robust model. Overall, the study’s findings validate the BST model’s effectiveness in Chl-a retrieval in the GBA.
Due to the long revisit period (16 days) of Landsat 8/9 satellites used in this study and the subtropical climate of the study area, especially during the monsoon season, most areas experience high cloud coverage, sometimes even lasting an entire year. It is challenging to obtain cloud-free images to cover the entire study area. The unavailability of satellite images has slightly affected the retrieval results. However, since a relatively small number of images are required to cover the GBA, and the study’s time span is long enough, the impact on the overall trend analysis should be negligible. For future larger-scale studies, multi-source satellite images could be used alternatively.
When using the BST model to retrieve Chl-a concentration in fish ponds in the GBA, it is possible to underestimate the values of high Chl-a concentration. The retrieval results of the model show that the maximum value of Chl-a concentration does not exceed 95 μg L−1. As mentioned in the study by Cao (2020) [40], when establishing this model, the training dataset lacks high-concentration Chl-a values, leading to possible underestimation of high Chl-a concentration. However, despite the possible underestimation, this study primarily focuses on the overall spatiotemporal trend of Chl-a concentration changes; its overall Chl-a concentration is still much higher than in natural lakes and rivers. In future studies, we will continue to increase and improve the Chl-a concentration range and quantity of in-situ observations to build a more comprehensive and accurate model.

5. Conclusions

Aquaculture plays a crucial role in the world’s food security. This study, based on the BST model, analyzed the dynamics of Chl-a concentration in fish ponds in the GBA over the past decade (2013–2022). The results indicated that the model has good performance in Chl-a concentration retrieval. The major conclusions derived from this study are as follows:
(1)
The Chl-a concentration in fish ponds in the GBA exhibits significant seasonal variations but with insignificant interannual fluctuations. Chl-a concentration is highest in summer, followed by spring and autumn, and lowest in winter. Despite the already high Chl-a concentration, there is still a weak increase in Chl-a concentration from 2013 to 2022, with higher concentration observed in the urbanized regions.
(2)
In addition to human activities, the seasonal and interannual variations in Chl-a concentration in fish ponds are highly correlated with water temperature, primarily through its effects on phytoplankton growth rates, seasonal dynamics, water column stratification, nutrient availability, and interactions with other organisms.
(3)
The Chl-a concentration in fish ponds in the GBA is significantly higher than that in the natural rivers and coastal waters, which is primarily attributed to high human disturbance to fish ponds via overbreeding.
Due to high cloud coverage, it is challenging to obtain cloud-free images to cover the entire study area. For future studies, multi-source satellite images could be a better solution to improve data availability. In addition, model improvement requires a large amount of in-situ observations covering different regions and seasons, which obliges us to adapt our field work and to try new models and data combinations. The findings are valuable for assessing the quality of aquatic products and revealing the health of aquatic ecosystems in the GBA.

Author Contributions

Conceptualization, X.Y.; formal analysis, Z.L.; data curation, Z.L.; supervision, X.Y.; writing—review editing, X.Y., T.Z., S.C., W.Z., K.M., H.O., L.R., Q.Y. and Y.W. All authors have read and agreed to the published version of the manuscript.

Funding

This research was funded by the National Key R&D Program of China [2021YFE0117300].

Data Availability Statement

The data presented in this study are available on request from the corresponding author due to (reason for the privacy).

Acknowledgments

The authors are very grateful to the National Aeronautics and Space Administration for providing the Level-1 surface reflectance products of Landsat8/9.

Conflicts of Interest

The authors declare no conflicts of interest.

References

  1. Agriculture Organization of the United Nations. The State of World Fisheries and Aquaculture 2022; FAO: Rome, Italy, 2022; ISBN 978-92-5-136364-5. [Google Scholar]
  2. Yao, L.; Wang, X.; Zhang, J.; Yu, X.; Zhang, S.; Li, Q. Prediction of Sea Surface Chlorophyll-a Concentrations Based on Deep Learning and Time-Series Remote Sensing Data. Remote Sens. 2023, 15, 4486. [Google Scholar] [CrossRef]
  3. Holgerson, M.A.; Raymond, P.A. Large Contribution to Inland Water CO2 and CH4 Emissions from Very Small Ponds. Nat. Geosci. 2016, 9, 222–226. [Google Scholar] [CrossRef]
  4. Wang, Z.; Zhang, J.; Yang, X.; Huang, C.; Su, F.; Liu, X.; Liu, Y.; Zhang, Y. Global Mapping of the Landside Clustering of Aquaculture Ponds from Dense Time-Series 10 m Sentinel-2 Images on Google Earth Engine. Int. J. Appl. Earth Obs. Geoinf. 2022, 115, 103100. [Google Scholar] [CrossRef]
  5. Zhang, W.; Cheng, Z.; Qiu, J.; Park, E.; Ran, L.; Xie, X.; Yang, X. Spatiotemporal Changes in Mulberry-Dyke-Fish Ponds in the Guangdong-Hong Kong-Macao Greater Bay Area over the Past 40 Years. Water 2021, 13, 2953. [Google Scholar] [CrossRef]
  6. Wang, B.; Cao, L.; Micheli, F.; Naylor, R.L.; Fringer, O.B. The Effects of Intensive Aquaculture on Nutrient Residence Time and Transport in a Coastal Embayment. Environ. Fluid Mech. 2018, 18, 1321–1349. [Google Scholar] [CrossRef]
  7. Lao, Q.; Wu, J.; Chen, F.; Zhou, X.; Li, Z.; Chen, C.; Zhu, Q.; Deng, Z.; Li, J. Increasing Intrusion of High Salinity Water Alters the Mariculture Activities in Zhanjiang Bay during the Past Two Decades Identified by Dual Water Isotopes. J. Environ. Manag. 2022, 320, 115815. [Google Scholar] [CrossRef] [PubMed]
  8. Campbell, M.D.; Hall, S.G. Hydrodynamic Effects on Oyster Aquaculture Systems: A Review. Rev. Aquacult. 2019, 11, 896–906. [Google Scholar] [CrossRef]
  9. Ai, Y.; Bi, Y.; Hu, Z. Changes in Phytoplankton Communities along Nutrient Gradients in Lake Taihu: Evidence for Nutrient Reduction Strategies. Chin. J. Oceanol. Limnol. 2015, 33, 447–457. [Google Scholar] [CrossRef]
  10. Paerl, H.W.; Xu, H.; McCarthy, M.J.; Zhu, G.; Qin, B.; Li, Y.; Gardner, W.S. Controlling Harmful Cyanobacterial Blooms in a Hyper-Eutrophic Lake (Lake Taihu, China): The Need for a Dual Nutrient (N & P) Management Strategy. Water Res. 2011, 45, 1973–1983. [Google Scholar] [CrossRef]
  11. Xu, H.; Paerl, H.W.; Qin, B.; Zhu, G.; Gaoa, G. Nitrogen and Phosphorus Inputs Control Phytoplankton Growth in Eutrophic Lake Taihu, China. Limnol. Oceanogr. 2010, 55, 420–432. [Google Scholar] [CrossRef]
  12. Tyler, R.M.; Brady, D.C.; Targett, T.E. Temporal and Spatial Dynamics of Diel-Cycling Hypoxia in Estuarine Tributaries. Estuaries Coasts 2009, 32, 123–145. [Google Scholar] [CrossRef]
  13. Carlson, R.E. Expanding the Trophic State Concept to Identify Non-Nutrient Limited Lakes and Reservoirs. In Proceedings of a National Conference on Enhancing the States’ Lake Management Programs; Northeastern Illinois Planning Commission: Chicago, IL, USA, 1991; pp. 59–71. [Google Scholar]
  14. Wang, J.; Zhang, Y.; Yang, F.; Cao, X.; Bai, Z.; Zhu, J.; Chen, E.; Li, Y.; Ran, Y. Spatial and Temporal Variations of Chlorophyll-a Concentration from 2009 to 2012 in Poyang Lake, China. Environ. Earth Sci. 2015, 73, 4063–4075. [Google Scholar] [CrossRef]
  15. Duan, H.; Ma, R.; Xu, X.; Kong, F.; Zhang, S.; Kong, W.; Hao, J.; Shang, L. Two-Decade Reconstruction of Algal Blooms in China’s Lake Taihu. Environ. Sci. Technol. 2009, 43, 3522–3528. [Google Scholar] [CrossRef] [PubMed]
  16. Qin, Z.; Ruan, B.; Yang, J.; Wei, Z.; Song, W.; Sun, Q. Long-Term Dynamics of Chlorophyll-a Concentration and Its Response to Human and Natural Factors in Lake Taihu Based on MODIS Data. Sustainability 2022, 14, 16874. [Google Scholar] [CrossRef]
  17. Du, Y.; Zhang, X.; Ma, S.; Yao, N. Chlorophyll-a Concentration Variations in Bohai Sea: Impacts of Environmental Complexity and Human Activities Based on Remote Sensing Technologies. Big Data Res. 2024, 36, 100440. [Google Scholar] [CrossRef]
  18. Lao, Q.; Liu, S.; Wang, C.; Chen, F. Global Warming Weakens the Ocean Front and Phytoplankton Blooms in the Luzon Strait over the Past 40 Years. J. Geophys. Res. Biogeosci. 2023, 128, e2023JG007726. [Google Scholar] [CrossRef]
  19. Guo, L.; Xiu, P.; Chai, F.; Xue, H.; Wang, D.; Sun, J. Enhanced Chlorophyll Concentrations Induced by Kuroshio Intrusion Fronts in the Northern South China Sea. Geophys. Res. Lett. 2017, 44, 11565–11572. [Google Scholar] [CrossRef]
  20. Lao, Q.; Liu, S.; Ling, Z.; Jin, G.; Chen, F.; Chen, C.; Zhu, Q. External Dynamic Mechanisms Controlling the Periodic Offshore Blooms in Beibu Gulf. J. Geophys. Res. Oceans 2023, 128, e2023JC019689. [Google Scholar] [CrossRef]
  21. Wang, S.; Li, J.; Zhang, B.; Spyrakos, E.; Tyler, A.N.; Shen, Q.; Zhang, F.; Kuster, T.; Lehmann, M.K.; Wu, Y.; et al. Trophic State Assessment of Global Inland Waters Using a MODIS-Derived Forel-Ule Index. Remote Sens. Environ. 2018, 217, 444–460. [Google Scholar] [CrossRef]
  22. Smith, V.H. Eutrophication of Freshwater and Coastal Marine Ecosystems a Global Problem. Environ. Sci. Pollut. Res. 2003, 10, 126–139. [Google Scholar] [CrossRef]
  23. Hu, C.; Lee, Z.; Ma, R.; Yu, K.; Li, D.; Shang, S. Moderate Resolution Imaging Spectroradiometer (MODIS) Observations of Cyanobacteria Blooms in Taihu Lake, China. J. Geophys. Res. Oceans 2010, 115, 2009JC005511. [Google Scholar] [CrossRef]
  24. Cao, Z.; Ma, R.; Melack, J.M.; Duan, H.; Liu, M.; Kutser, T.; Xue, K.; Shen, M.; Qi, T.; Yuan, H. Landsat Observations of Chlorophyll-a Variations in Lake Taihu from 1984 to 2019. Int. J. Appl. Earth Obs. Geoinf. 2022, 106, 102642. [Google Scholar] [CrossRef]
  25. Shi, K.; Zhang, Y.; Xu, H.; Zhu, G.; Qin, B.; Huang, C.; Liu, X.; Zhou, Y.; Lv, H. Long-Term Satellite Observations of Microcystin Concentrations in Lake Taihu during Cyanobacterial Bloom Periods. Environ. Sci. Technol. 2015, 49, 6448–6456. [Google Scholar] [CrossRef]
  26. Alparslan, E.; Aydöner, C.; Tufekci, V.; Tüfekci, H. Water Quality Assessment at Ömerli Dam Using Remote Sensing Techniques. Environ. Monit. Assess. 2007, 135, 391–398. [Google Scholar] [CrossRef] [PubMed]
  27. Verpoorter, C.; Kutser, T.; Seekell, D.A.; Tranvik, L.J. A Global Inventory of Lakes Based on High-Resolution Satellite Imagery. Geophys. Res. Lett. 2014, 41, 6396–6402. [Google Scholar] [CrossRef]
  28. Giardino, C.; Bresciani, M.; Cazzaniga, I.; Schenk, K.; Rieger, P.; Braga, F.; Matta, E.; Brando, V. Evaluation of Multi-Resolution Satellite Sensors for Assessing Water Quality and Bottom Depth of Lake Garda. Sensors 2014, 14, 24116–24131. [Google Scholar] [CrossRef] [PubMed]
  29. Wulder, M.A.; Loveland, T.R.; Roy, D.P.; Crawford, C.J.; Masek, J.G.; Woodcock, C.E.; Allen, R.G.; Anderson, M.C.; Belward, A.S.; Cohen, W.B.; et al. Current Status of Landsat Program, Science, and Applications. Remote Sens. Environ. 2019, 225, 127–147. [Google Scholar] [CrossRef]
  30. Hu, C. A Novel Ocean Color Index to Detect Floating Algae in the Global Oceans. Remote Sens. Environ. 2009, 113, 2118–2129. [Google Scholar] [CrossRef]
  31. Watanabe, F.; Alcântara, E.; Rodrigues, T.; Rotta, L.; Bernardo, N.; Imai, N. Remote Sensing of the Chlorophyll-a Based on OLI/Landsat-8 and MSI/Sentinel-2A (Barra Bonita Reservoir, Brazil). An. Acad. Bras. Ciênc. 2018, 90, 1987–2000. [Google Scholar] [CrossRef]
  32. Feng, L.; Hu, C.; Han, X.; Chen, X.; Qi, L. Long-Term Distribution Patterns of Chlorophyll-a Concentration in China’s Largest Freshwater Lake: MERIS Full-Resolution Observations with a Practical Approach. Remote Sens. 2014, 7, 275–299. [Google Scholar] [CrossRef]
  33. Duan, H.; Zhang, Y.; Zhang, B.; Song, K.; Wang, Z. Assessment of Chlorophyll-a Concentration and Trophic State for Lake Chagan Using Landsat TM and Field Spectral Data. Environ. Monit. Assess. 2007, 129, 295–308. [Google Scholar] [CrossRef] [PubMed]
  34. Neil, C.; Spyrakos, E.; Hunter, P.D.; Tyler, A.N. A Global Approach for Chlorophyll-a Retrieval across Optically Complex Inland Waters Based on Optical Water Types. Remote Sens. Environ. 2020, 229, 159–178, Erratum in Remote Sens. Environ. 2020, 246, 111837. [Google Scholar] [CrossRef]
  35. Salem, S.; Strand, M.; Higa, H.; Kim, H.; Kazuhiro, K.; Oki, K.; Oki, T. Evaluation of MERIS Chlorophyll-a Retrieval Processors in a Complex Turbid Lake Kasumigaura over a 10-Year Mission. Remote Sens. 2017, 9, 1022. [Google Scholar] [CrossRef]
  36. Sagan, V.; Peterson, K.T.; Maimaitijiang, M.; Sidike, P.; Sloan, J.; Greeling, B.A.; Maalouf, S.; Adams, C. Monitoring Inland Water Quality Using Remote Sensing: Potential and Limitations of Spectral Indices, Bio-Optical Simulations, Machine Learning, and Cloud Computing. Earth Sci. Rev. 2020, 205, 103187. [Google Scholar] [CrossRef]
  37. Cao, Z.; Ma, R.; Duan, H.; Xue, K. Effects of Broad Bandwidth on the Remote Sensing of Inland Waters: Implications for High Spatial Resolution Satellite Data Applications. ISPRS J. Photogramm. Remote Sens. 2019, 153, 110–122. [Google Scholar] [CrossRef]
  38. Pyo, J.; Duan, H.; Baek, S.; Kim, M.S.; Jeon, T.; Kwon, Y.S.; Lee, H.; Cho, K.H. A Convolutional Neural Network Regression for Quantifying Cyanobacteria Using Hyperspectral Imagery. Remote Sens. Environ. 2019, 233, 111350. [Google Scholar] [CrossRef]
  39. Chen, S.; Hu, C.; Barnes, B.B.; Wanninkhof, R.; Cai, W.-J.; Barbero, L.; Pierrot, D. A Machine Learning Approach to Estimate Surface Ocean pCO2 from Satellite Measurements. Remote Sens. Environ. 2019, 228, 203–226. [Google Scholar] [CrossRef]
  40. Cao, Z.; Ma, R.; Duan, H.; Pahlevan, N.; Melack, J.; Shen, M.; Xue, K. A Machine Learning Approach to Estimate Chlorophyll-a from Landsat-8 Measurements in Inland Lakes. Remote Sens. Environ. 2020, 248, 111974. [Google Scholar] [CrossRef]
  41. Duan, H.; Ma, R.; Hu, C. Evaluation of Remote Sensing Algorithms for Cyanobacterial Pigment Retrievals during Spring Bloom Formation in Several Lakes of East China. Remote Sens. Environ. 2012, 126, 126–135. [Google Scholar] [CrossRef]
  42. Qi, L.; Hu, C.; Duan, H.; Barnes, B.; Ma, R. An EOF-Based Algorithm to Estimate Chlorophyll a Concentrations in Taihu Lake from MODIS Land-Band Measurements: Implications for Near Real-Time Applications and Forecasting Models. Remote Sens. 2014, 6, 10694–10715. [Google Scholar] [CrossRef]
  43. Le, C.; Li, Y.; Zha, Y.; Sun, D.; Huang, C.; Lu, H. A Four-Band Semi-Analytical Model for Estimating Chlorophyll a in Highly Turbid Lakes: The Case of Taihu Lake, China. Remote Sens. Environ. 2009, 113, 1175–1182. [Google Scholar] [CrossRef]
  44. Xu, J.; Li, F.; Zhang, B.; Song, K.; Wang, Z.; Liu, D.; Zhang, G. Estimation of Chlorophyll-a Concentration Using Field Spectral Data: A Case Study in Inland Case-II Waters, North China. Environ. Monit. Assess. 2009, 158, 105–116. [Google Scholar] [CrossRef] [PubMed]
  45. Liu, G.; Li, J. Tracking Dike-Pond Landscape Dynamics in a Core Region of the Guangdong-Hong Kong-Macao Greater Bay Area Based on Topographic Maps and Remote Sensing Data during 1949–2020. Aquaculture 2022, 549, 737741. [Google Scholar] [CrossRef]
  46. Deng, J.; Salmaso, N.; Jeppesen, E.; Qin, B.; Zhang, Y. The Relative Importance of Weather and Nutrients Determining Phytoplankton Assemblages Differs between Seasons in Large Lake Taihu, China. Aquat. Sci. 2019, 81, 48. [Google Scholar] [CrossRef]
  47. Ha, N.T.T.; Koike, K.; Nhuan, M.T.; Canh, B.D.; Thao, N.T.P.; Parsons, M. Landsat 8/OLI Two Bands Ratio Algorithm for Chlorophyll-A Concentration Mapping in Hypertrophic Waters: An Application to West Lake in Hanoi (Vietnam). IEEE J. Sel. Topics Appl. Earth Observ. Remote Sens. 2017, 10, 4919–4929. [Google Scholar] [CrossRef]
  48. Kosten, S.; Huszar, V.L.M.; Bécares, E.; Costa, L.S.; Van Donk, E.; Hansson, L.; Jeppesen, E.; Kruk, C.; Lacerot, G.; Mazzeo, N.; et al. Warmer Climates Boost Cyanobacterial Dominance in Shallow Lakes. Glob. Chang. Biol. 2012, 18, 118–126. [Google Scholar] [CrossRef]
  49. Shen, S.; Leptoukh, G.G.; Acker, J.G.; Yu, Z.; Kempler, S.J. Seasonal Variations of Chlorophyll α Concentration in the Northern South China Sea. IEEE Geosci. Remote Sens. Lett. 2008, 5, 315–319. [Google Scholar] [CrossRef]
  50. Hao, Q.; Chai, F.; Xiu, P.; Bai, Y.; Chen, J.; Liu, C.; Le, F.; Zhou, F. Spatial and Temporal Variation in Chlorophyll a Concentration in the Eastern China Seas Based on a Locally Modified Satellite Dataset. Estuar. Coast. Shelf Sci. 2019, 220, 220–231. [Google Scholar] [CrossRef]
  51. Mei, X.; Gao, S.; Liu, Y.; Hu, J.; Razlustkij, V.; Rudstam, L.G.; Jeppesen, E.; Liu, Z.; Zhang, X. Effects of Elevated Temperature on Resources Competition of Nutrient and Light between Benthic and Planktonic Algae. Front. Environ. Sci. 2022, 10, 908088. [Google Scholar] [CrossRef]
  52. Nunes Carvalho, T.M.; Lima Neto, I.E.; Souza Filho, F.d.A. Uncovering the Influence of Hydrological and Climate Variables in Chlorophyll-A Concentration in Tropical Reservoirs with Machine Learning. Environ. Sci. Pollut. Res. 2022, 29, 74967–74982. [Google Scholar] [CrossRef]
  53. Lim, J.; Choi, M. Assessment of Water Quality Based on Landsat 8 Operational Land Imager Associated with Human Activities in Korea. Environ. Monit. Assess. 2015, 187, 384. [Google Scholar] [CrossRef]
  54. Gholizadeh, M.; Melesse, A.; Reddi, L. A Comprehensive Review on Water Quality Parameters Estimation Using Remote Sensing Techniques. Sensors 2016, 16, 1298. [Google Scholar] [CrossRef] [PubMed]
  55. Ren, J.; Cui, J.; Dong, W.; Xiao, Y.; Xu, M.; Liu, S.; Wan, J.; Li, Z.; Zhang, J. Remote Sensing Inversion of Typical Offshore Water Quality Parameter Concentration Based on Improved SVR Algorithm. Remote Sens. 2023, 15, 2104. [Google Scholar] [CrossRef]
  56. Markensten, H. Climate Effects on Early Phytoplankton Biomass Over Three Decades Modified by the Morphometry in Connected Lake Basins. Hydrobiologia 2006, 559, 319–329. [Google Scholar] [CrossRef]
  57. Pang, S.; Zhu, L.; Liu, C.; Ju, J. Causes and Impacts of Decreasing Chlorophyll-a in Tibet Plateau Lakes during 1986–2021 Based on Landsat Image Inversion. Remote Sens. 2023, 15, 1503. [Google Scholar] [CrossRef]
  58. Deng, W.; Sun, K.; Jia, J.; Ha, X.; Lu, Y.; Wang, S.; Li, Z.; Gao, Y. Evolving Phytoplankton Primary Productivity Patterns in Typical Tibetan Plateau Lake Systems and Associated Driving Mechanisms since the 2000s. Remote Sens. Appl. Soc. Environ. 2022, 28, 100825. [Google Scholar] [CrossRef]
  59. Liu, D.; Duan, H.; Yu, S.; Shen, M.; Xue, K. Human-Induced Eutrophication Dominates the Bio-Optical Compositions of Suspended Particles in Shallow Lakes: Implications for Remote Sensing. Sci. Total Environ. 2019, 667, 112–123. [Google Scholar] [CrossRef]
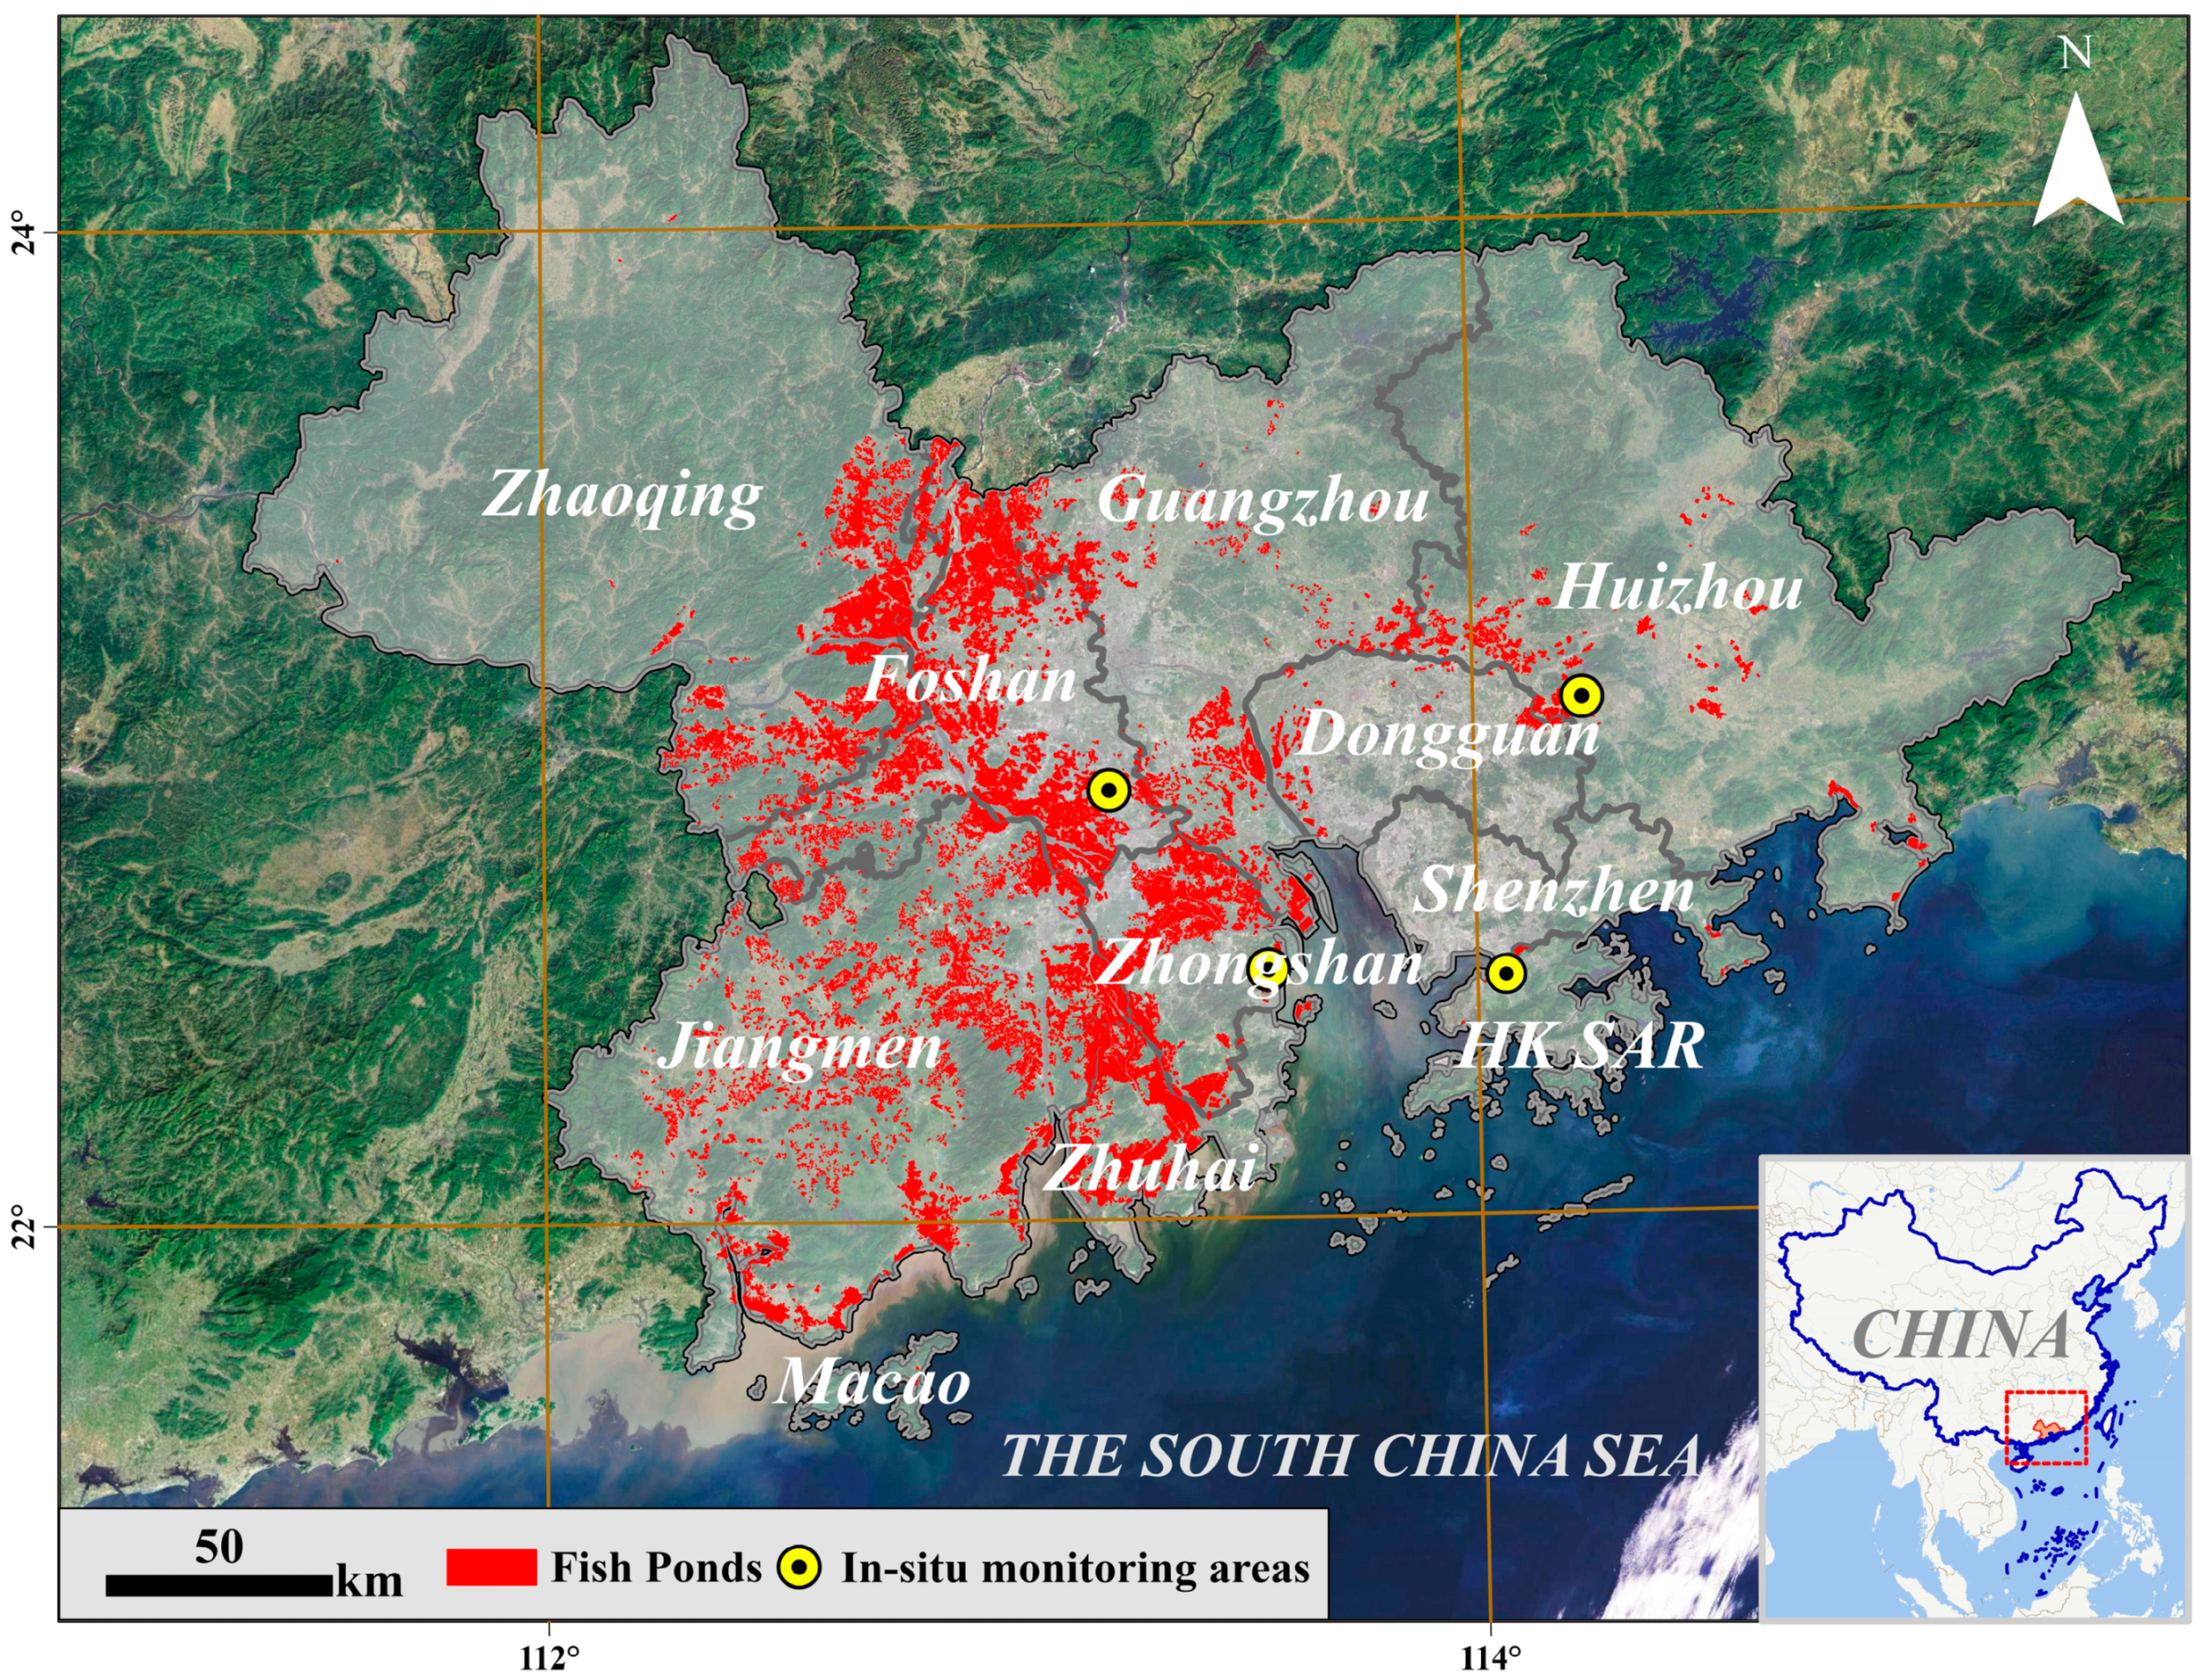
Figure 1. Geographical configuration of the GBA against the spatial distribution of fish ponds.
Remotesensing 16 02033 g001
Figure 2. Image selection and image availability for this study: (a) the strip number of the images covering the GBA, (b) the number of available images from Landsat8/9 for this study.
Remotesensing 16 02033 g002
Figure 3. Gap filling method used in this study; gap highlighted in red line to be filled with images from 2020 (left) or 2022 (right).
Remotesensing 16 02033 g003
Figure 4. Flowchart for image preprocessing and Chl-a concentration retrieval.
Remotesensing 16 02033 g004
Figure 5. On-site photos of water sampling conducted in fish ponds. The photos were taken by the authors.
Remotesensing 16 02033 g005
Figure 6. Locations of monitoring sites in Foshan, Huizhou, Zhongshan, and HK SAR. The monitoring sites in Zhongshan are far away from each other. It is difficult to distinguish two adjacent sampling points at this scale, so we further enlarged them in the figure.
Remotesensing 16 02033 g006
Figure 7. Fish ponds in high-resolution images (a,c) and fish ponds identified through SVM using Landsat imagery (b,d).
Remotesensing 16 02033 g007
Figure 8. Major flowchart for a BST model, an optimized distributed gradient-boosting method that solves the objective function (Obj) with decision tree ensembles and additive training to obtain an optimal Chl-a retrieval from Landsat OLI Rrc. The initial input data for the training is in-situ Chl-a concentration and subsequent inputs are the residual errors fitted by the previous decision trees. An optimal model structure with the lowest Obj value is used to estimate Chl-a concentration by summing up the score in the corresponding leaves.
Remotesensing 16 02033 g008
Figure 9. Spatial distribution of Chl-a concentration in fish ponds in the GBA in 2022 based on the prediction by the BST model. (a) shows the spatial distribution of Chl-a concentration in fish ponds across the GBA in 2022. (b) is a partial enlargement of an area with dense fish ponds. (c) is a partial enlargement of the area selected in (b).
Remotesensing 16 02033 g009
Figure 10. Seasonal changes of Chl-a concentration in fish ponds in the GBA under the BST model.
Remotesensing 16 02033 g010
Figure 11. Box plot of Chl-a concentration annual changes in fish ponds from 2013 to 2022.
Remotesensing 16 02033 g011
Figure 12. Annual average Chl-a concentration changes in fish ponds in the GBA from 2013 to 2022.
Remotesensing 16 02033 g012
Figure 13. MK trend test results for Chl-a concentration changes in fish ponds in the GBA from 2013 to 2022 ((a): overall test result, (b): Zhuhai, (c): Zhongshan, (d): Zhaoqing, (e): Hong Kong, (f): Shenzhen, (g): Foshan, (h): Dongguan, (i): Guangzhou, (j): Huizhou, (k): Jiangmen).
Remotesensing 16 02033 g013
Figure 14. Sen’s test results for Chl-a concentration change in fish ponds in the GBA from 2013 to 2022 ((a): overall test result, (b): Zhuhai, (c): Zhongshan, (d): Zhaoqing, (e): Hong Kong, (f): Shenzhen, (g): Foshan, (h): Dongguan, (i): Guangzhou, (j): Huizhou, (k): Jiangmen).
Remotesensing 16 02033 g014
Figure 15. Side-by-side comparison of seasonal changes in Chl-a concentration and water temperature in the GBA.
Remotesensing 16 02033 g015
Figure 16. Correlation between Chl-a concentration and water temperature at different time scales.
Remotesensing 16 02033 g016
Figure 17. Two representative riverine areas to represent the discrepancy in Chl-a concentrations in different waters. ((a): Zone (1), (b): Zone (2). These are “changes” averaged over 2013–2022).
Remotesensing 16 02033 g017
Figure 18. Chl-a concentration variations of riverine Zone (1) and Zone (2) in different seasons from 2013 to 2022.
Remotesensing 16 02033 g018
Figure 19. Comparison of Chl-a concentration change between riverine Zone (1) and Zone (2) and fish ponds (referring to fish ponds in the entire GBA) in different seasons in the past decade: (a) Spring; (b) Summer; (c) Autumn; (d) Winter; (e) Annual.
Remotesensing 16 02033 g019
Figure 20. Correlation between measured and predicted Chl-a concentration in the GBA.
Remotesensing 16 02033 g020
Table 1. Trend test of Chl-a concentration change across the GBA and the changes in ten individual cities based on the predictions based on the BST model from 2013 to 2022.
CityZβ
Zhuhai1.1251.5216
Zhongshan1.33042.4944
Zhaoqing0.99491.917
Hong Kong1.14961.9822
Shenzhen0.97092.1405
Jiangmen1.24232.4006
Huizhou1.10432.4203
Guangzhou1.05611.4258
Foshan1.02812.5894
Dongguan1.30142.9391
Overall0.30731.9815
Disclaimer/Publisher’s Note: The statements, opinions and data contained in all publications are solely those of the individual author(s) and contributor(s) and not of MDPI and/or the editor(s). MDPI and/or the editor(s) disclaim responsibility for any injury to people or property resulting from any ideas, methods, instructions or products referred to in the content.