Article

Cooling Potential of Urban Tree Species during Extreme Heat and Drought: A Thermal Remote Sensing Assessment

1
Department of Geography and Regional Science, Geospatial Technologies, University of Graz, Heinrichstr. 36, 8010 Graz, Austria
2
Climatology Research Group, University of Bayreuth, 95447 Bayreuth, Germany
3
Bayreuth Centre of Ecology and Environmental Research, University of Bayreuth, 95448 Bayreuth, Germany
*
Author to whom correspondence should be addressed.
Remote Sens. 2024, 16(12), 2059; https://doi.org/10.3390/rs16122059
Submission received: 25 April 2024 / Revised: 3 June 2024 / Accepted: 5 June 2024 / Published: 7 June 2024
(This article belongs to the Special Issue Remote Sensing for Land Surface Temperature and Related Applications)

Abstract

:
The cooling potential of tree species in Central European cities is insufficiently studied during extreme heat and drought, although a stronger surge in heatwaves compared to the global average is observed in this region. Remote sensing-based thermal surveys are an important tool to shed light on the mitigation effects of green infrastructure, but approaches covering extreme events are scarce. In this study, we present a simple, low-cost thermal airborne methodology that covers the current daily heat record in 2022, after the second warmest and third driest spring-to-summer period since 1949, in the medium-sized German city of Forchheim. We found that in spite of record-breaking heat and drought conditions, trees still had a considerable cooling potential with surface temperatures of 2 °C to 6 °C below air temperatures. Tree species were characterized by substantial median differences in tree surface temperatures up to 3.64 °C. Conifers and drought-sensitive broadleaf species showed the highest temperatures during the extreme event, while riparian species with potentially good water provision showed the highest cooling potential. In addition to tree species, imperviousness and tree NDVI were important variables for urban tree surface temperature, showing positive (imperviousness) and negative (NDVI) correlations with tree surface temperatures. Our study provides a methodological remote sensing example for the spontaneous and rapid coverage of extreme events, documenting the benefits of tree species in the urban context.

1. Introduction

Extreme heatwaves have amplified globally, and Europe is considered a regional hotspot that is affected by a three to four times faster increase in heatwaves [1]. This situation is of major concern, as extreme heatwaves lead to considerable surges in total mortality [2,3] and have negative impacts on agriculture, water resources, and ecosystems [4]. The related health impacts are most severe in urban environments [5]. The promotion of green vegetation, and urban trees in particular, is considered as a main strategy to alleviate this issue [6,7,8,9]. Thereby, remote sensing is crucial to quantify the cooling effects of green infrastructure [10,11,12], and several studies evaluate the impact of trees on lowering urban heat island (UHI) effects in this field [13,14,15,16,17].
A central research question in urban regions is the role of tree species- and species-specific potentials in mitigating extreme temperatures, and several approaches shed light on respective issues using remote sensing methods. Leuzinger et al. [18] used a thermal camera on a helicopter to compare 13 different common species in the city of Basel, Switzerland, reporting strong differences due to location and species during warm summer temperatures and with sufficient water availability. Similarly, an airborne study conducted a thermal analysis of six tree species at German forest sites with different environmental conditions and varying temporal water availability, providing evidence of higher tree surface temperatures during drought conditions [19]. Another approach used fixed thermal cameras to investigate temporal variations in surface temperatures of 18 tree species over a two-month period in a relatively green area in the city of Berlin, Germany, which showed tree surface temperature differences due to impervious surfaces, species, and leaf size [20]. High-resolution approaches using UAV multispectral and thermal data in Changchun, China, reported very large differences in the cooling capacity of tree species up to 10 °C in a parklike environment of a university campus [13]. Research using airborne thermal sensors investigating five tree species in a national park in Poland confirmed species-specific temperature differences, whereby the largest differences were reported at noon compared to morning surveys [21]. A high-resolution approach with 0.4 × 0.4 m thermal data obtained using a gyrocopter platform in an urban floodplain forest site in Leipzig, Germany, resulted in median tree species differences of around 1 °C during dry-to-moderate conditions [22]. The results of the mentioned studies show some similarities in surface temperatures of tree species, but also distinct differences in the relative order and magnitude of tree species’ leaf temperatures. Furthermore, large variations in the results exist regarding the comparison of tree surface temperatures with air temperatures. Different environmental conditions in general, and different seasonal weather situations in particular, may be essential factors for some of these differences [18,19]. However, there are indications that the cooling capacity of trees is severely reduced during drought conditions [18,19].
Although some studies also included drier conditions in their approach, extreme temperatures and drought events are currently not covered by the presented studies. Therefore, the functioning of green infrastructure and the effects of different tree species to cool their surroundings are insufficiently studied during heatwaves and drought [5,23]. Furthermore, high-resolution studies at the tree level, i.e., below about 2 m spatial resolution, and covering the city scale are particularly scarce. One reason for the limitation of studies covering heatwaves with high-resolution data may be related to the limited spontaneousness of planned flights and legal restrictions for UAV missions [24]. However, analyzing such conditions is an important prerequisite for sustainable city planning, as several studies showed that most trees only react to longer-term climatic effects, and tree sap flow, an indirect measure of evapotranspiration, was only influenced by drought lasting for several weeks [18,19].
To approach this issue and shed light on tree species cooling potential under extreme heatwaves and drought in Central Europe, we present a simple, low-cost remote sensing thermal survey methodology for the city scale using small standard aircraft. With this approach, we covered the absolute daily temperature record, the second warmest and the third driest spring-to-summer period in the district of Forchheim, Germany, since measurements began in 1949. The analysis of tree surface temperatures and respective comparisons to air temperatures, NDVI, and imperviousness values intends to uncover the functioning of green urban infrastructure during extreme events that are more likely to occur in the foreseeable future.

2. Materials and Methods

2.1. Study Area and Conducted Measurements

Our study covers the city of Forchheim in northern Bavaria, Germany, which has a population of around 33,500 [25] and represents a region that is exemplary for Central Europe with towns of intermediate size and extensive agricultural areas in their surroundings (Figure 1). The final research area covered about 30 km2 with an approximate boundary of 646,000 to 653,000 Easting and 5,504,000 to 5,515,000 Northing (Projection: ETRS89/UTM zone 32N—CRS 25832). The cooling potential of trees was defined as tree surface temperature in the presented approach similar to existing work [13,18,26].
To enable surveys at the city scale and the possibility of short-term flight campaigns in case of an extreme heatwave, we rented a private Cessna F172P aircraft from the regional flight club at the small airport Burg Feuerstein in a distance of about 10 km from the city center. UAV measurements were not considered because legal restrictions, such as the flight height limitation, line-of-sight rules, and flight constraints due to weight and privacy laws, as well as the confined areal coverage within a meaningful time frame, render the respective platform unsuitable for the presented analysis and scale. For surface temperature measurements, we installed an Optris® PI-450 longwave infrared camera (Optris, Berlin, Germany), which was successfully applied in existing research on tree surface temperatures [33,34]. This camera has a resolution of 382 × 288 pixels, a focal length of 8 mm, a temperature range from −20 °C to 100 °C (accuracy +/− 2% or 2 °C), and a thermal sensitivity of 0.4 °C [35]. To simultaneously record vegetation conditions, we mounted a multispectral MicaSense RedEdge-MTM with a focal length of 6 mm (AgEagle Aerial Systems Inc., Wichita, KS, USA), which proved to be suitable for analyzing temperature and drought impacts on vegetation [36]. The respective cameras were mounted in a near-nadir position on the wing support bar of the plane. Following legal restrictions over densely populated areas, we set the flight altitude to 350 m above ground, which required an interval of one photo per second for sufficient overlap (>80% in flight direction, >75% side overlap) and led to a calculated resolution of around 1 m for thermal data and 0.4 m for multispectral data. The thermal camera requires some time to stabilize at the beginning [34]. Therefore, prior to reaching the survey area, we flew some survey lines to warm up and stabilize the camera.
In addition to the remote sensing survey, we established two urban weather stations with air temperature measurements at a height of 2 m (HOBO S-THC-M002, Onset Computer Corporation, Bourne, MA, USA, ±0.25 °C), as existing climate stations are located outside of the city (Figure 1). The stations cover the densely built city center (station Landratsamt) and a relatively green area at the western margin of the buildup area (station Ehrenbürg) to represent two different climatological situations. Both stations were placed above short-clipped grass according to WMO measurement guidelines.

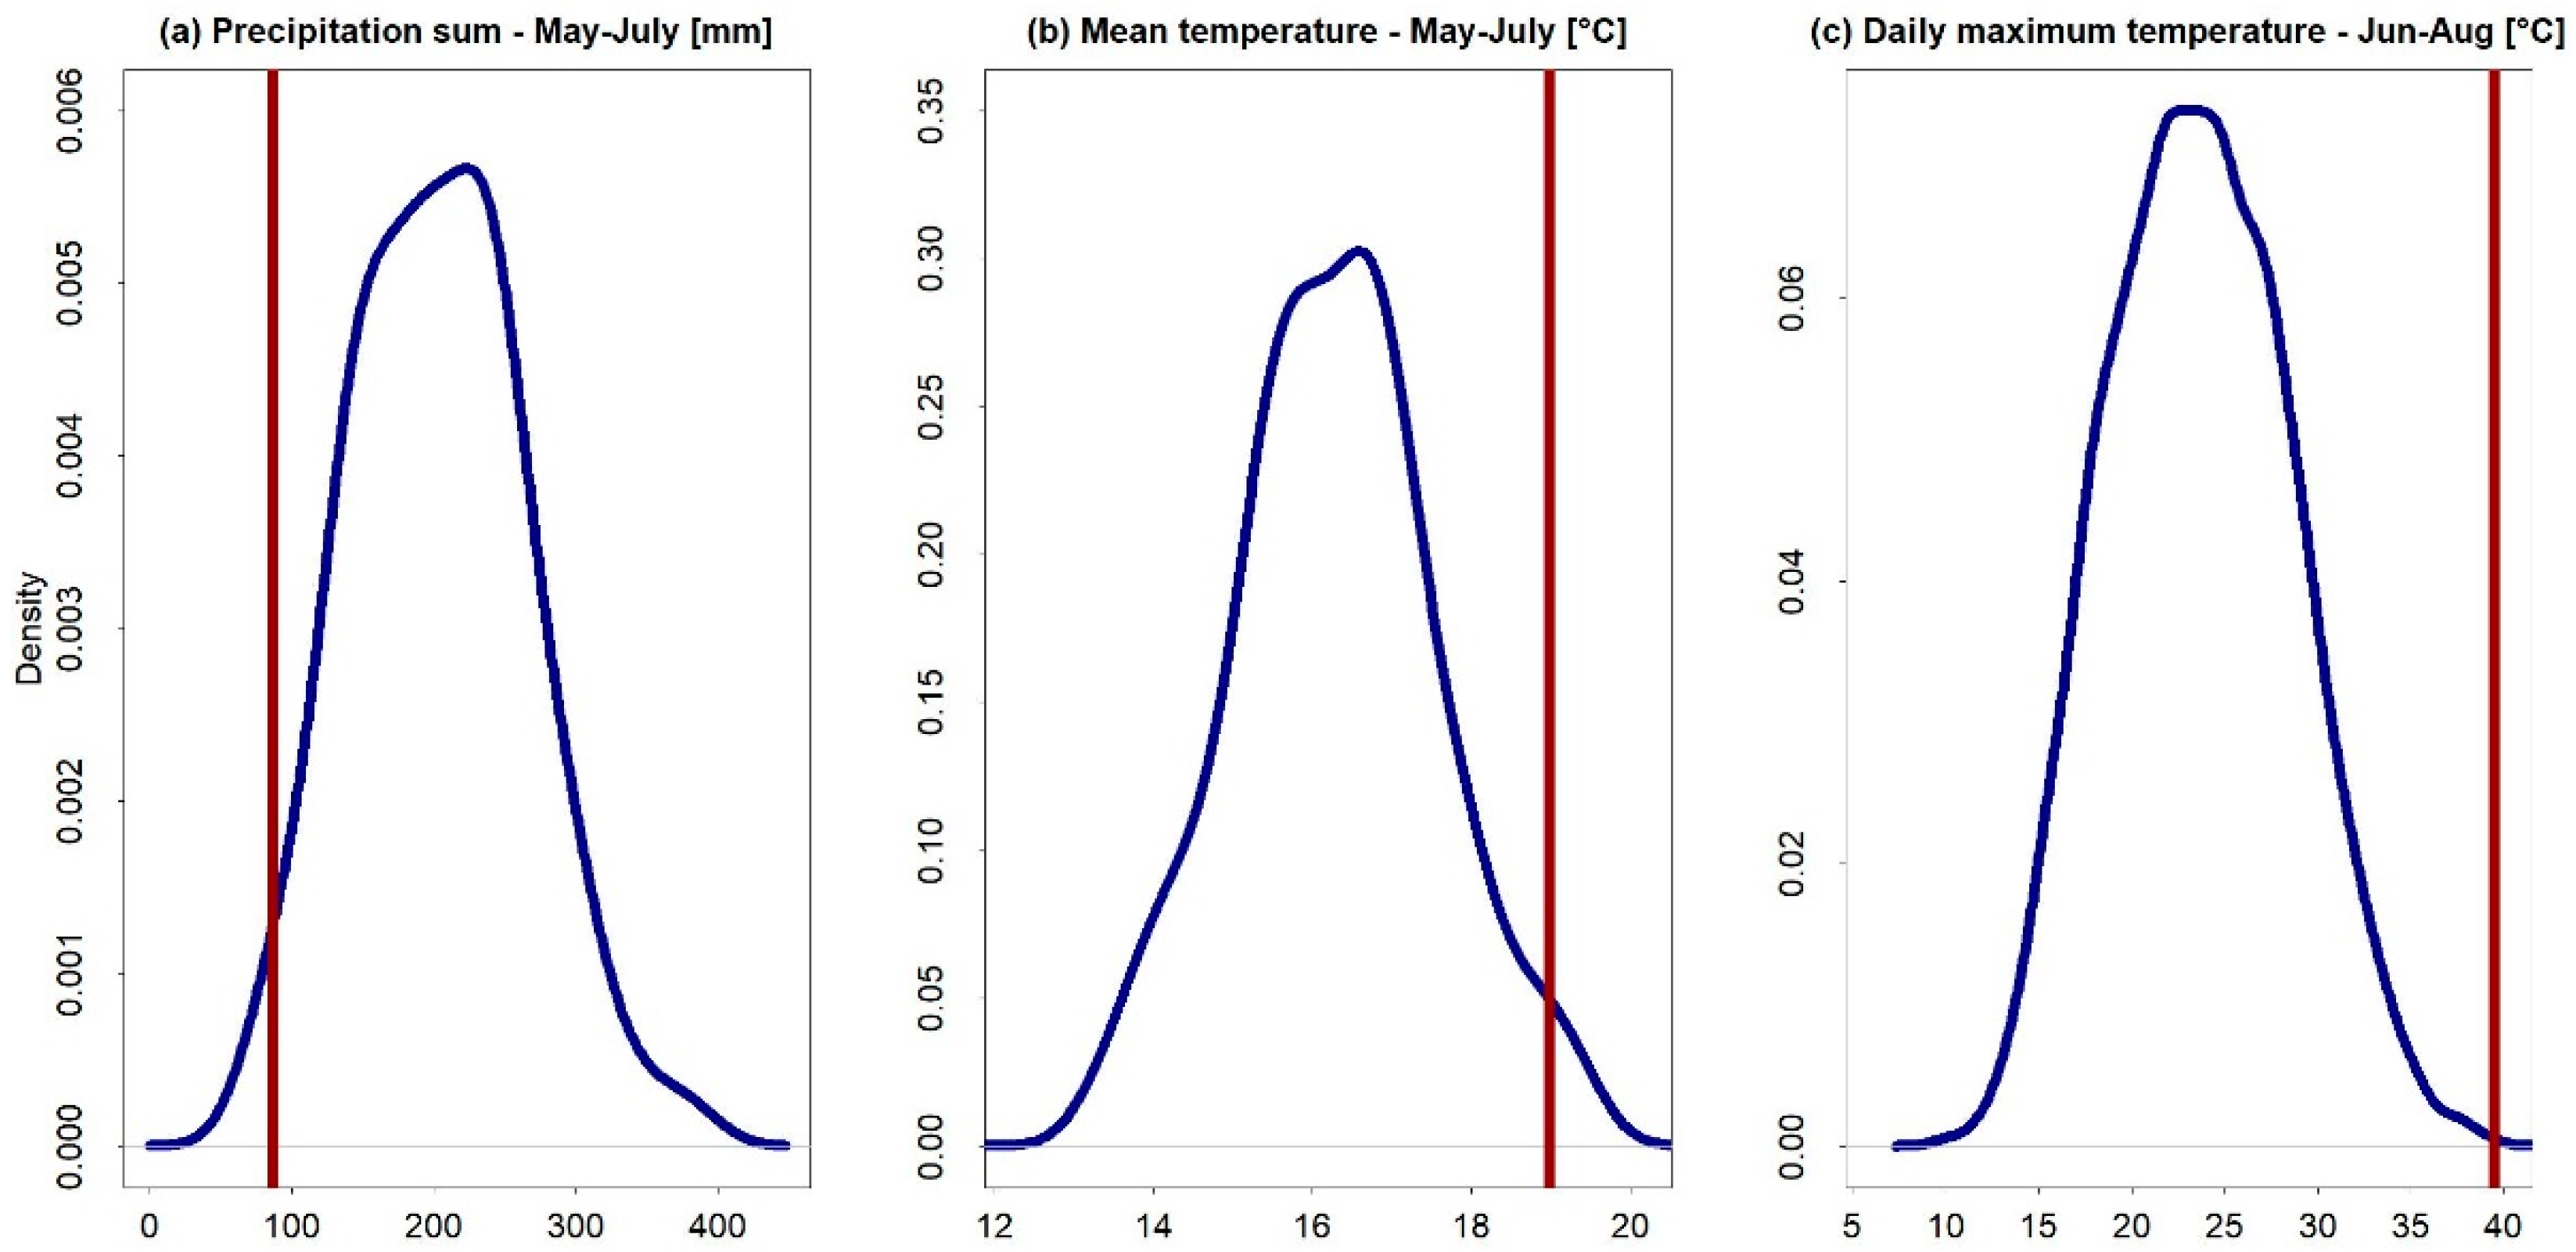
2.2. Climatic Situation during the Flight Campaign

Different definitions of extreme heatwaves exist, but usually, values above or below certain percentiles, i.e., the 90th, 92.5th, 95th, and 97.5th percentiles, are utilized [37]. We considered climate metrics above or below the 95th or 5th percentile as extreme in this study. In the research areas, two climate stations exist, and we used the station that covers the longer period as a reference, which is Möhrendorf–Kleinseebach, with daily measurements since 1949 [28]. To cover an extreme heatwave, we conducted our survey on 20 July 2022, which was the hottest day since measurements began, with 39.5 °C in Möhrendorf–Kleinseebach and the third day in a row with temperatures above 30 °C. This day was also the hottest ever measured at station Bammersdorf with a maximum temperature of 38.9 °C since measurements began in 1991 [29]. In addition to the daily temperature record, the climate was extremely dry, with a precipitation sum of 87.2 mm from May to July, which is below the 5th percentile compared to the whole period. Finally, average temperatures before the flight (May–July) were above the 97.5th percentile, with a mean of 19.0 °C (Figure 2). The flight time was set to the period of expected maximum temperatures and during maximum evaporative demand, as suggested by existing research [34], which is the early afternoon, and the sensing period of images over the city was between 14:40 and 15:40, covering the air temperature peak at Bammersdorf at 15:00 [29].
Temperatures of the newly installed urban stations were slightly lower than official stations, with an average value of 37.6 °C during the survey flight, whereby higher temperatures were recorded earlier at Landratsamt at 13:50 with 38 °C and 38.8 °C at Ehrenbürg at 16:40, reflecting the influence of shading at these stations.

2.3. Tree Data

Information on tree species was derived from the tree cadastre of the city of Forchheim [27], whereby tree positions are stored as point coordinates. To match the resolution of remote sensing data and increase the probability that only tree surfaces were considered, our approach aimed to use trees above a crown diameter of 2 m. However, most trees in the dataset did not provide crown size information, but stem diameter at breast height (DBH) was available. Therefore, we used an allometric study on regionally occurring trees, which showed that the crown radius is usually above 2 m if the stem DBH is at or above 20 cm, and only extreme outliers showed a crown radius below 1 m at this stem size [38]. Following the respective results, we only used trees at or above a stem DBH of 20 cm, providing a conservative threshold that assures that tree crown diameters were above 2 m with adequate tolerance. The respective threshold was applied as the expected ground sampling distance of the thermal camera was estimated to be around 1 m or a little higher before the flight, and we wanted to exclude mixed pixels. After this filtering approach, we manually reviewed tree locations, which were adapted in case of large deviations from the orthophoto. Finally, we used a 1 m buffer around mapped stem centers as a reference area to analyze tree surface temperatures, following existing remote sensing approaches [22], and eliminate the influence of other surface types in our analysis. Furthermore, this small buffer was used to reduce mixed signals due to the potential overlap of several tree species. However, as the majority of the analyzed trees were intentionally planted, trees were usually spaced in a manner that allowed for a sufficient distance to other trees to prevent growth limitations [27], and in many cases, the same species were planted next to each other, which reduced respective uncertainties. To minimize outlier effects and only include tree species with sufficient sample size, we only analyzed tree species with more than 20 individuals within flight coverage. Furthermore, we did not consider species varieties but added them to the respective species (i.e., Quercus roburFastigiata’ was included in Quercus robur). This left 3011 tree individuals and 29 species that occurred in both multispectral and thermal products for the final analysis.

2.4. Processing of Remote Sensing Imagery

Thermal images included live-offset within image calibration every few seconds to avoid drift, and absolute temperatures were calibrated using blackbody temperatures within the camera-specific software Optris PIX-connect Version 3.21.3113.0 [39]. The detector signal was converted to object temperature following Stefan–Boltzmann law, which uses camera internal temperature measurements and a number of additional variables, such as emissivity, atmospheric transmittance, background radiation, and atmospheric temperatures [40,41]. We set emissivity to a constant value of 1, following existing remote sensing studies [18,21,22], due to several reasons, such as the negligible effect of emissivity corrections on temperatures if research focuses on vegetation surfaces [18,21], the close proximity of tree species emissivities to one [42], the convergence of vegetation emissivities toward one with increasing sensor distance to the vegetation [43,44], and missing emissivity information for all species used in this study [22]. Existing research also showed that the distribution of emissivity-corrected and uncorrected data was almost identical, and errors within vegetation were around 0.1 to 0.6 K [45], so impacts on species comparisons were expected to be low. Freely available thermal infrared software (ResearchIR, Version 4) examples [46] to test the effect of different tree emissivity values and emissivity values for selected tree species (Oak, Pine, Spruce, and Laurel) from the MODIS UCSB Emissivity Library [42] also show that differences in emissivity between species and due to measurement uncertainties lead to small temperature differences of around 0.1 °C to 0.3 °C, which is considered negligible compared to camera and random errors.
However, atmospheric and radiative effects are known to have a substantial impact on derived object temperatures. As some of these parameters are not available in sufficient quality for a suitable correction, and the camera also has an error of up to 2 °C, we applied a ground-based bias correction to calculate surface temperatures from calibrated radiative temperatures. Thereby, we used available water temperatures from the official measurement station at Hausen [30], at the Regnitz River (Figure 1), which provides measurements at a 15-min interval. The corrected image temperatures were then derived using the time stamp of the images and the calculated difference to the in situ water temperatures. Although more sophisticated correction or calibration methods exist, most of which need additional data on the atmosphere or surface properties, the respective simple method is a suitable and frequently applied method to validate or correct remotely sensed thermal data given the highly linear relationship of remotely sensed surface temperatures and in situ water temperatures [45,47,48].
Individual photos of both cameras were processed to orthomosaics using Agisoft Metashape 2.1. The final products were georeferenced to the official orthophoto of Bavaria, which has a spatial resolution of 0.4 m [49], using 133/62 control points for the thermal/multispectral datasets. The derived spatial resolution of the final product was 1.15 m for the thermal data and 0.4 m for multispectral data (Figure 3).
Shadows introduce noise into the analysis by lowering the temperature regardless of species and shadow source, and they influence values of vegetation indices [51,52]. Therefore, we derived a shadow mask to exclude the shaded areas. We tried various approaches, such as shadow generation from the sun position and a LIDAR-derived surface model using the R-package rayshader [53], but due to the temporal variation in shadow position during the flight, this approach was not ideal, and we used a reflectance threshold in the green band to create a shadow mask. Additionally, we masked out all non-tree surfaces potentially introduced by gaps in the crown using the normalized difference vegetation index (NDVI) of the multispectral data, whereby the literature suggests values above an NDVI of 0.5 for trees with higher-resolution data [54,55], which was a good match for our tree centers, as 99% had a value above this threshold. Therefore, all shaded areas and all pixels below an NDVI of 0.5 were excluded from the analysis, and only pixels above respective thresholds and within 1 m of the tree centers were considered for the analysis of thermal and NDVI data.

2.5. Impervious Surfaces

Existing research showed that impervious surfaces are a central factor influencing tree surface temperatures [18,20], and the results showed that the percentage of impervious surfaces in a 90 m radius had an almost linear effect on temperatures [56]. To account for the respective influence, we included imperviousness in our analysis using the Imperviousness Density 2018 raster of the European Environmental Agency, which has a spatial resolution of 10 m [57]. Using this dataset, we also modeled the linear influence of imperviousness on all tree pixels with a pixel-based ordinary least-square model and used this model to remove the effect for an additional analysis of surface temperatures without the linear imperviousness effects. We refer to this dataset, i.e., surface temperatures with removed linear effects using the imperviousness model, as the adjusted tree surface temperatures.

2.6. Statistical Analysis

To provide a good overview of tree species differences in surface temperatures similar to existing studies [18,21,22], we calculated boxplots based on tree species-specific pixel values. We preferred boxplots because pixel-based analyses tend to have outliers and extreme values that strongly influence the calculation of mean and standard deviation. However, we also included the mean in our graphical analysis but omitted standard deviation to avoid overloading the descriptive statistic figures. To allow for a first tentative visual estimate of differences in the median between species, we included notches that were calculated from the interquartile range and, in case of no overlap, are a rough estimate for a significant difference in the median between boxplots at a 95% confidence level [58,59].
For a general comparison to air temperatures, we calculated differences between remotely sensed tree surface temperatures and the mean air temperature of both stations during flight time from 14:40 to 15:40 as follows:
Tdiff = Tsurf − Tair
where Tdiff is the temperature difference, Tsurf is the surface temperature of trees, and Tair is the averaged air temperature. Additionally, we calculated species-specific boxplots of imperviousness, and NDVI values, and adjusted tree surface temperatures. To investigate the relationships of NDVI and surface temperatures of tree species, whereby linear relationships of NDVI, leaf area density, or tree cover were reported in existing studies [60,61,62], we also calculated the Pearson correlation between adjusted tree surface temperatures and NDVI.
Comparing significant differences with spatial data is challenging, as trees in spatial proximity are usually more alike compared to more remote stands, which introduces spatial autocorrelation into the analysis, leading to non-independent samples [63,64]. Autoregressive modeling (ARM) ANOVA, as outlined in Scolforo et al. [64], can be used to address such issues. Accordingly, the method was used to derive the spatial variation in the dependent variable, which was the surface temperature in the presented study. Thereby, spatial relationships should be detected and removed using a transformation as originally presented in Long et al. [65], leading to a spatially uncorrelated dataset. Afterward, we computed Tukey’s significant differences at the 95% confidence level for a spatially correlated model. We used the R-package spANOVA (R version 4.3.3) to compute the respective differences between species [66]. For the variable imperviousness, which is a spatially computed variable by design, we used the traditional Tukey test for multiple comparisons instead [67].
To also include a non-parametric machine learning method in our analysis, we assessed the importance of the different variables on surface temperatures using a 500-repeated Boruta algorithm, as this is considered a powerful method for quantifying influential predictors [68,69]. In this approach, the dependent variable is modeled using random forest regression, whereby shadow variables are created by randomly shuffling original predictors, which are then compared to the performance of original variables for a quantitative importance assessment [70]. The performance of this algorithm to identify important predictors that are highly correlated was extensively examined [71]. We used Tdiff as the dependent variable, and tree species, NDVI, and imperviousness within a 91 m radius, as outlined in Ziter et al. [56], as independent variables to assess if all variables are considered important in a collective model. The performance of the model was assessed using 100-repeated, 10-fold cross-validation, which is considered to yield an unbiased error estimate [68]. Formulas for performance metrics are outlined in Zandler et al. [72].

3. Results

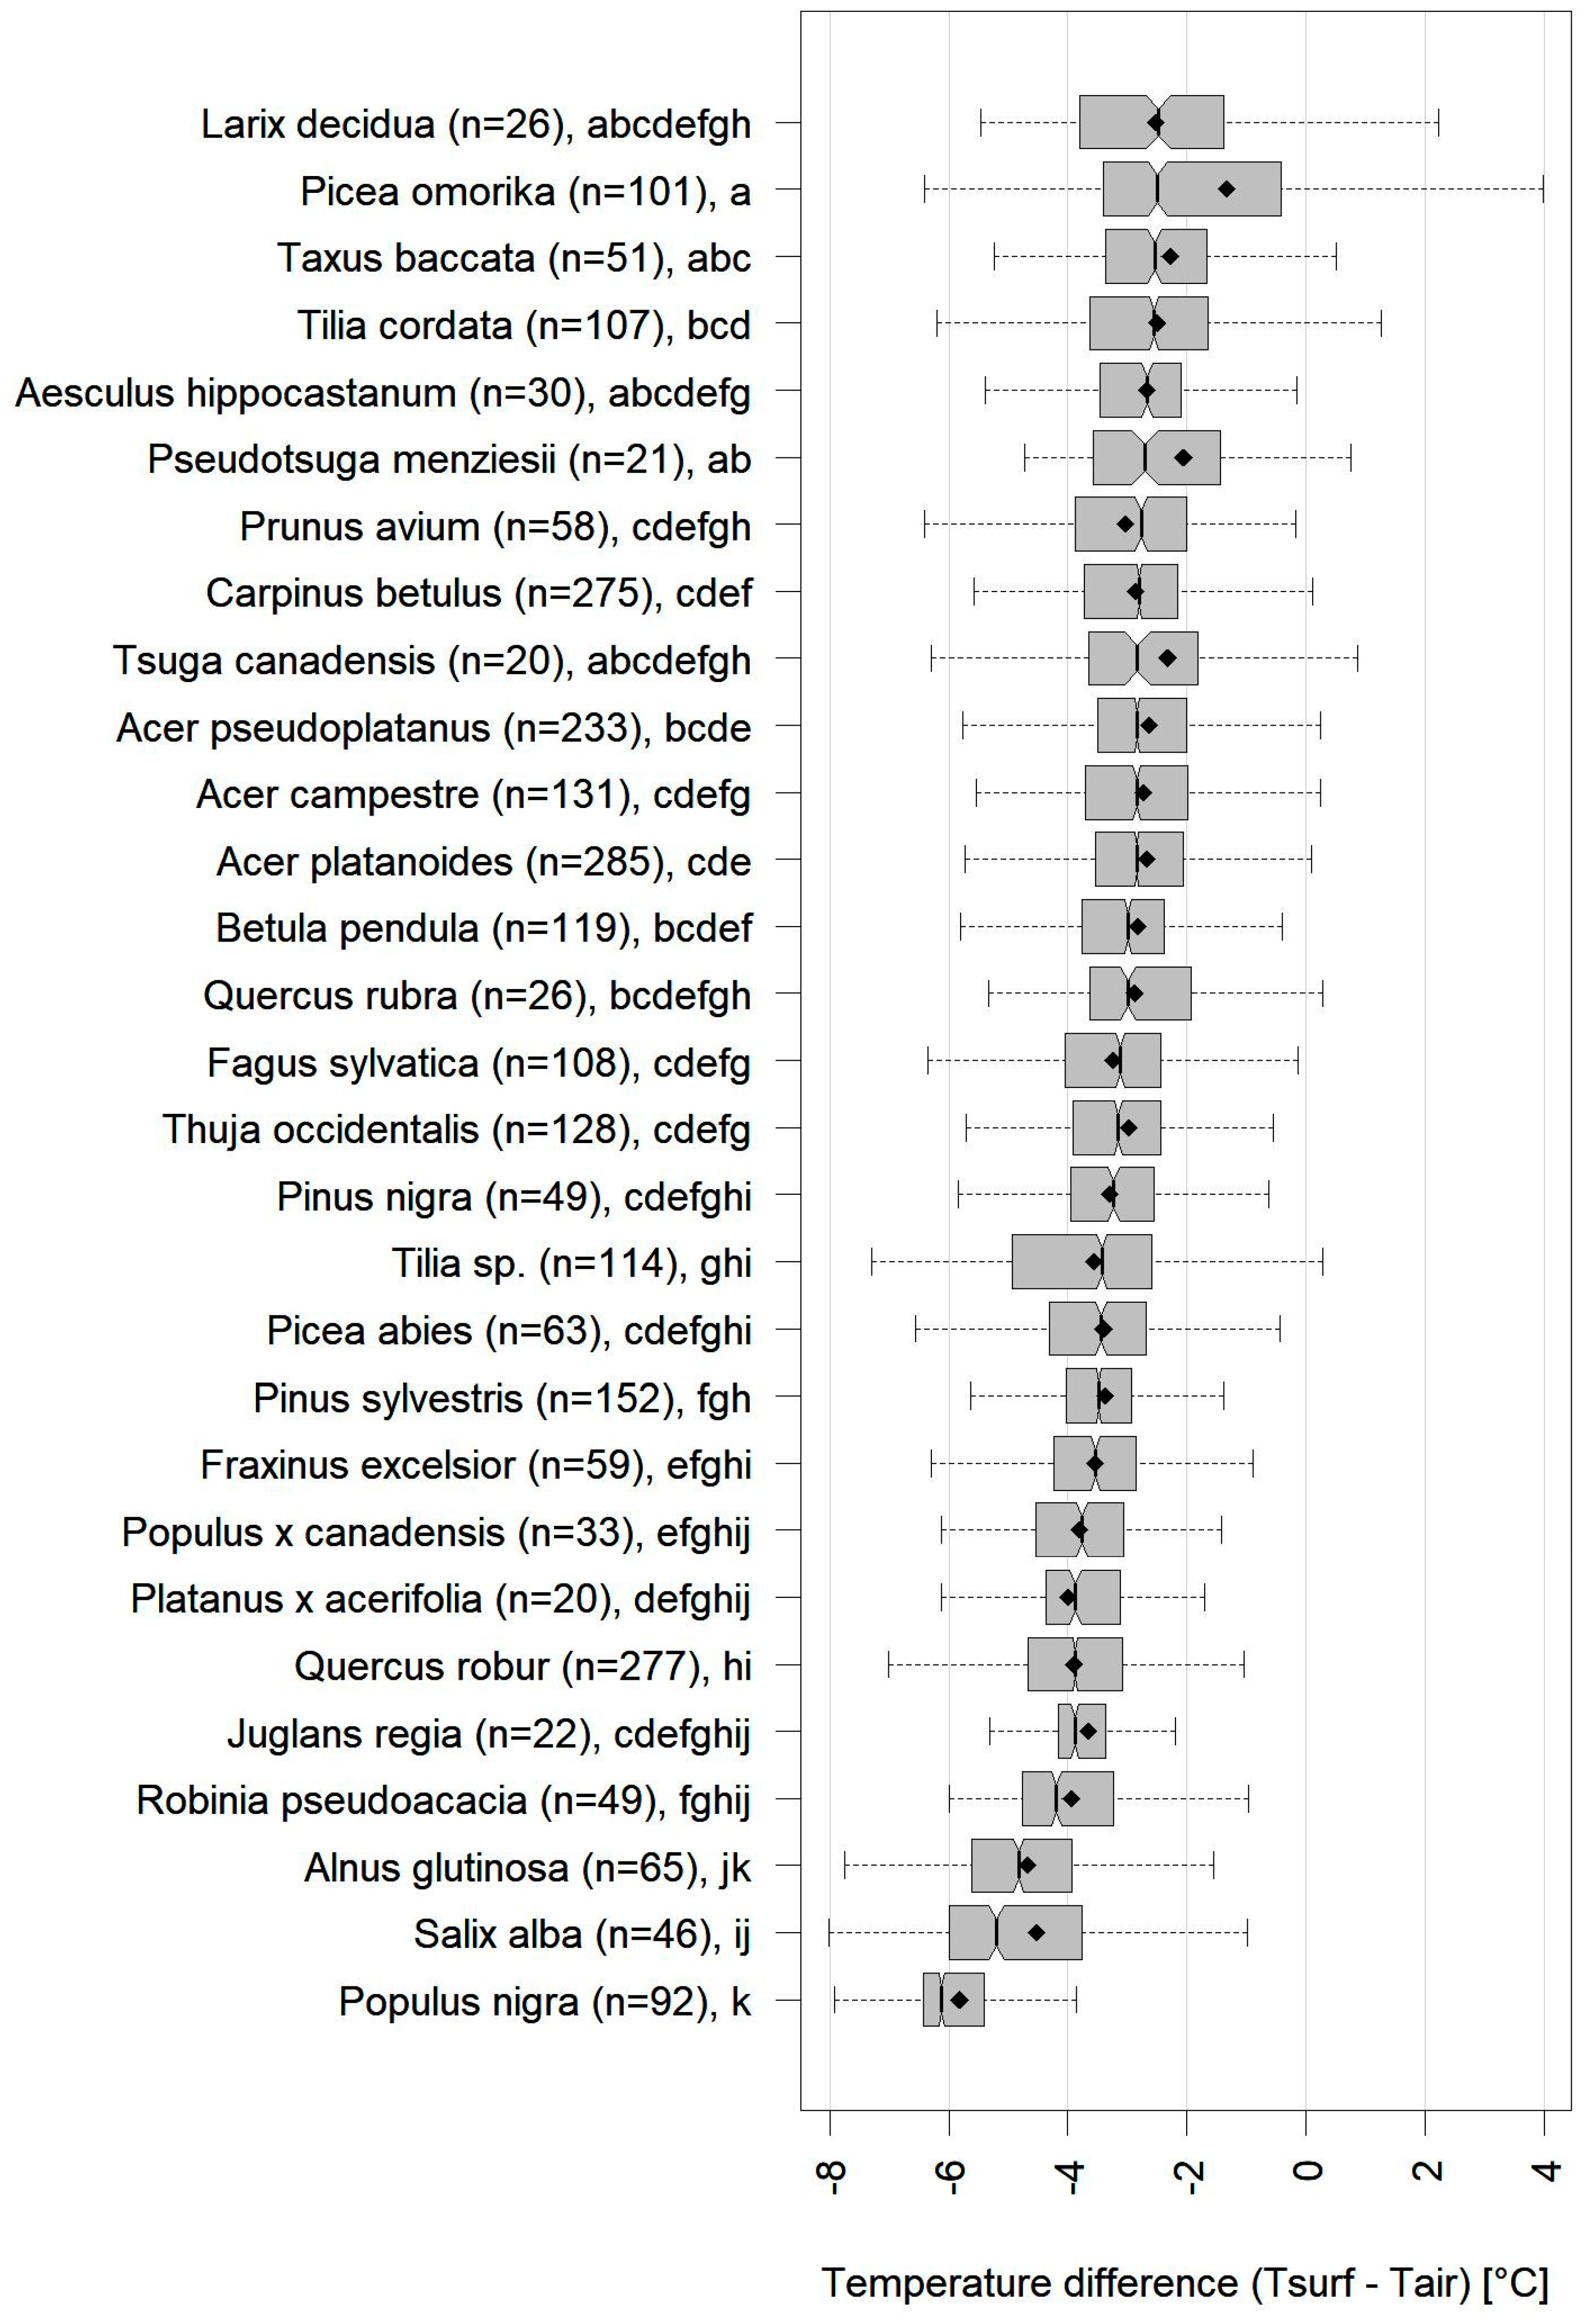
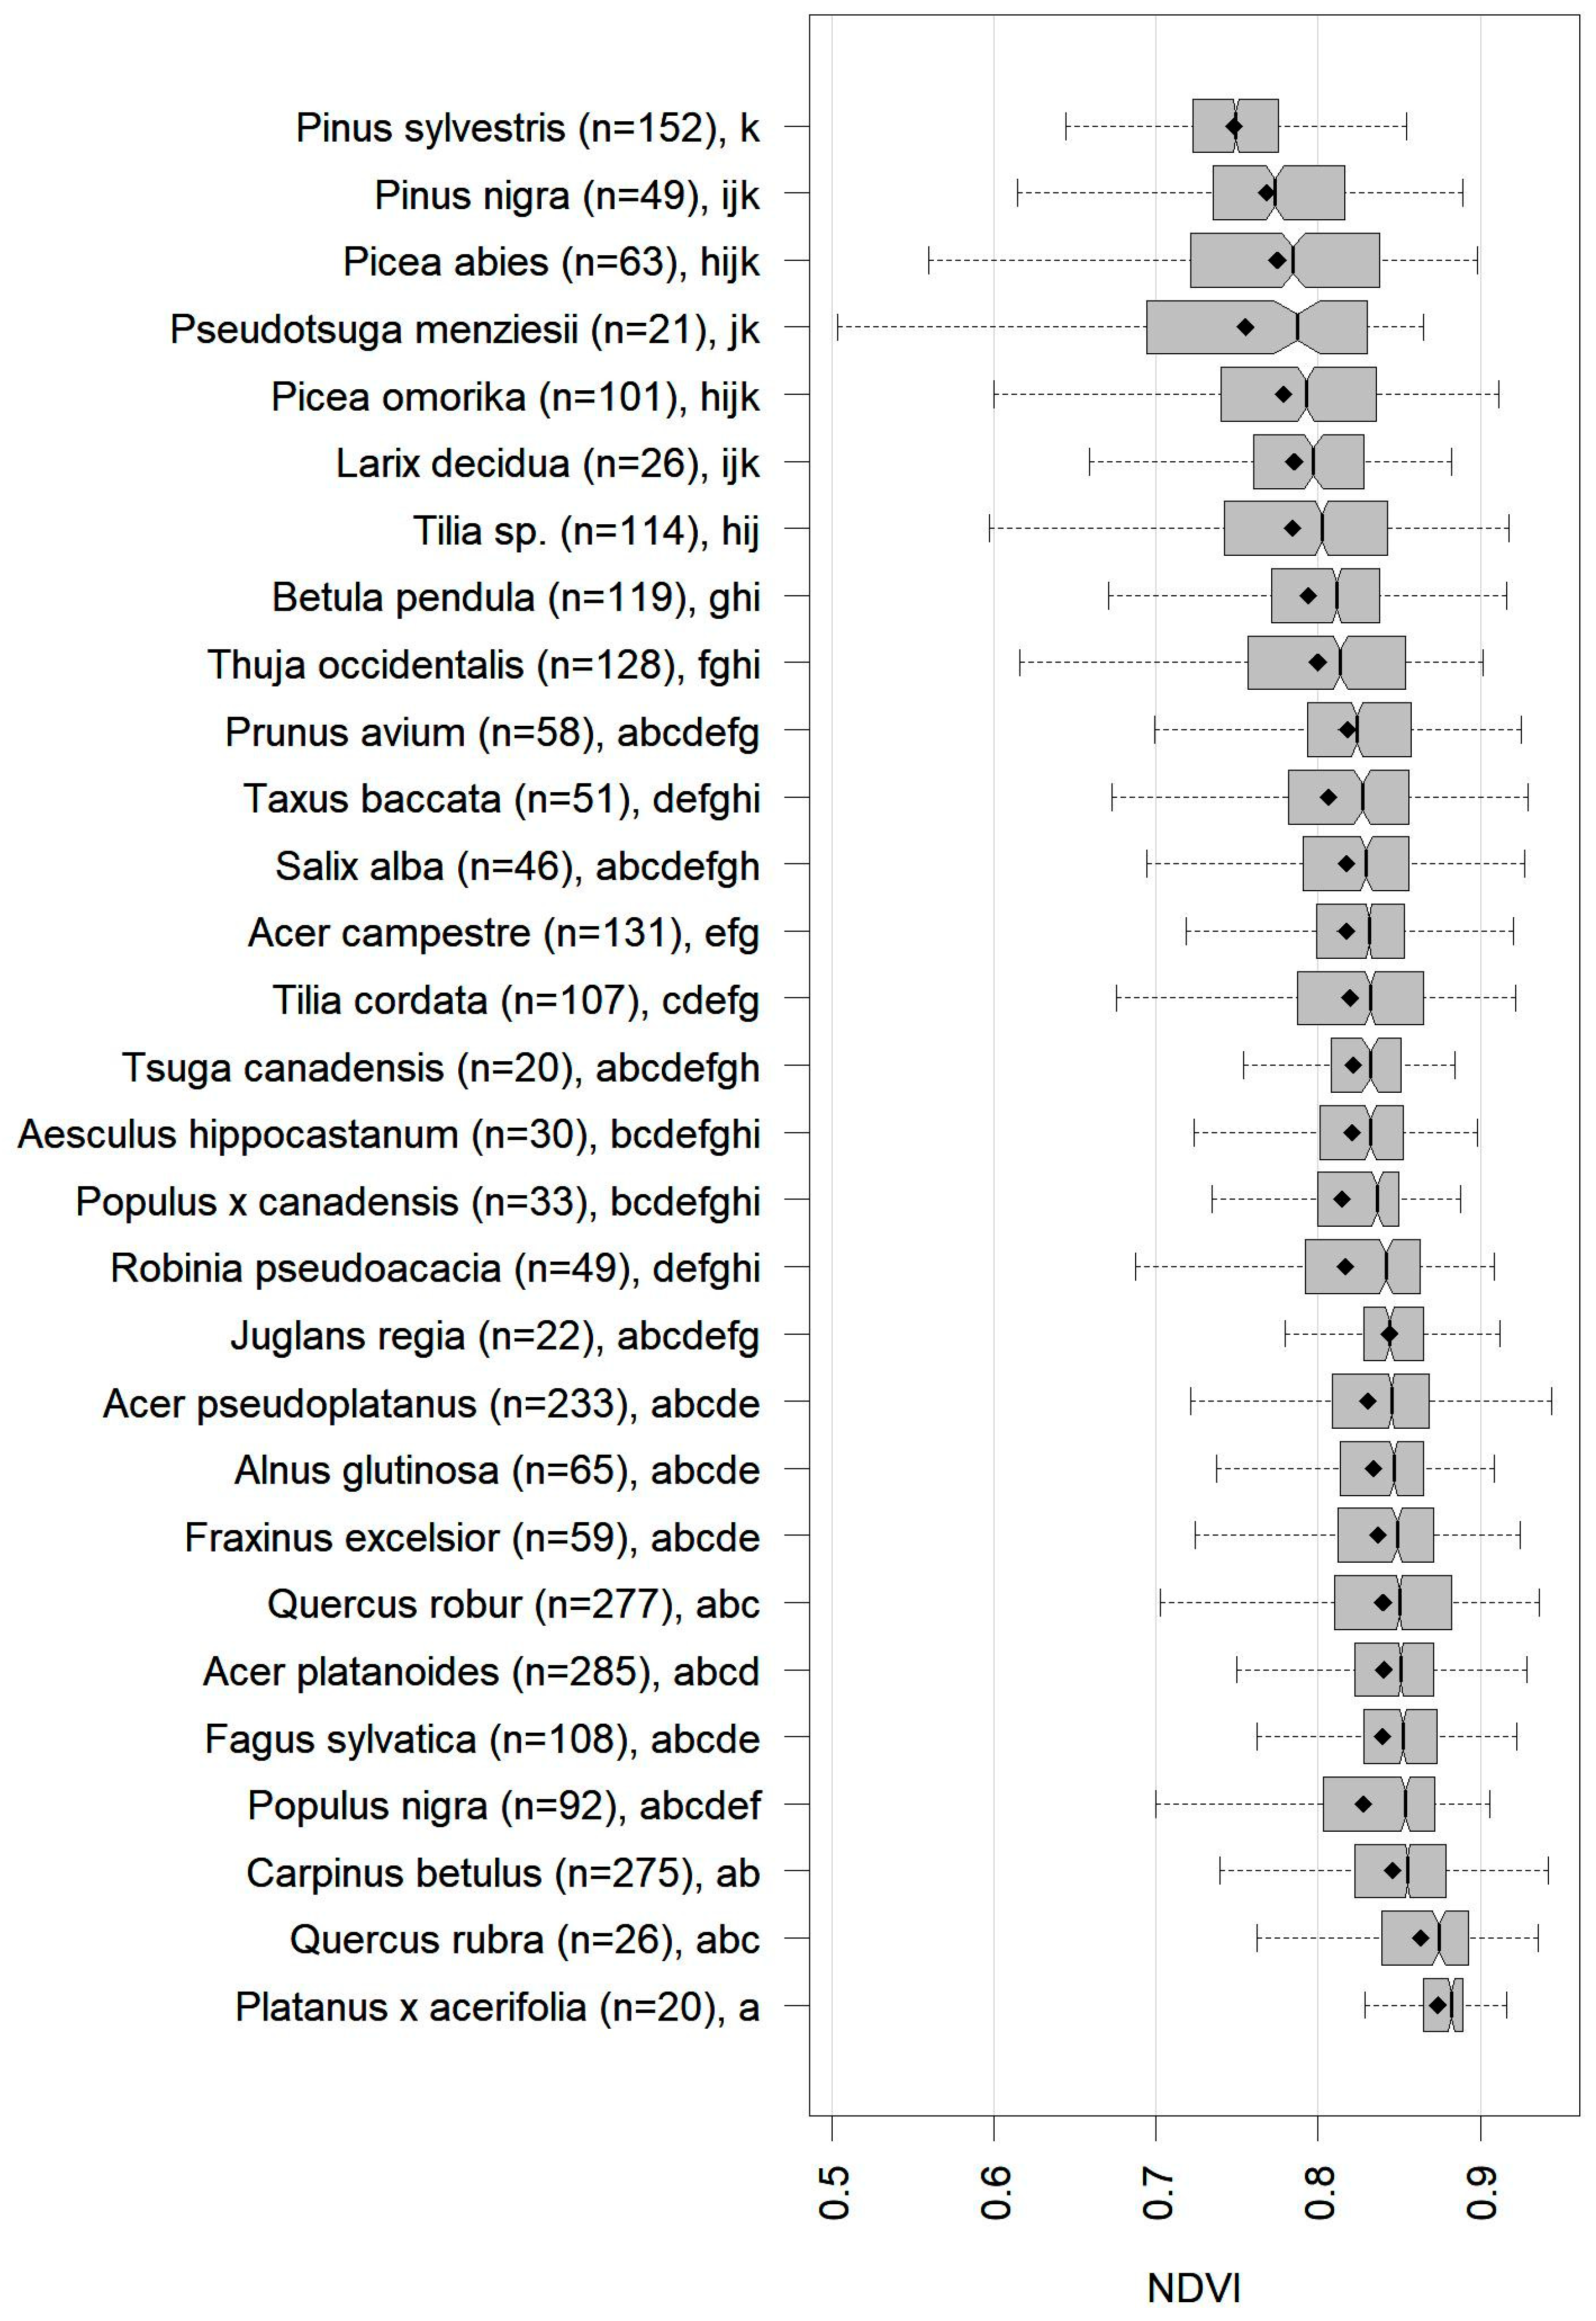
3.1. Distribution of Temperature Differences, Imperviousness, and NDVI of Tree Species

The analysis of temperature differences showed that almost all trees had substantially lower surface temperatures compared to the measured air temperature during the analyzed heatwave (Figure 4). Without considering the influence of imperviousness, the coolest trees were riparian species, such as Populus nigra, Salix alba, or Alnus glutinosa. Furthermore, Robinia pseudoacacia showed comparably low surface temperatures. The warmest surface temperatures were detected for conifers, such as Larix decidua, Picea omorika, and Taxus baccata, although medians of these species were almost identical to several deciduous species, such as Tilia cordata or Aesculus hippocastanum. However, the mean values of many conifers were much higher compared to broadleaf species. Some species showed large differences between median and mean, illustrating the influence of outliers and strong variation in surface temperatures. In summary, medians showed strong differences between species, with a total range of 3.64 °C between the coolest and warmest species medians.
The distribution of imperviousness in a 91 m window around the pixels resulted in a large interquartile range and a large spread of the data of most species (Figure 5). Some of the species with large negative differences to air temperature, such as Populus nigra, Salix alba, Alnus glutinosa, or Robinia pseudoacacia, also indicated low imperviousness in the surrounding area, with most of the data showing an average imperviousness below 50% in their neighborhood. However, single species, such as Larix decidua, had higher surface temperatures even though imperviousness in the neighborhood was low. Typical regional forest species, such as Pinus sylvestris, Picea abies, or Fagus sylvatica, also showed low imperviousness in their surroundings due to their growing locations being mostly outside of the city center. Platanus × acerifolia, a typical street tree in temperate and Mediterranean cities [73], also showed very high imperviousness in its surroundings. On the tree pixel level, the linear model with Tdiff as the dependent variable and mean imperviousness within a 91 m window was highly significant (p < 0.001), with an R2 of 0.16, indicating the climatic influence of sealed surfaces.
NDVI distribution showed that conifers, with rare exceptions such as Tsuga canadensis, had the lowest values of all tree species, while the higher half of medians consisted of broadleaf species, and none of those species had a median NDVI below 0.8 (Figure 6). Platanus × acerifolia showed the highest NDVI, followed by Quercus rubra and Carpinus betulus.

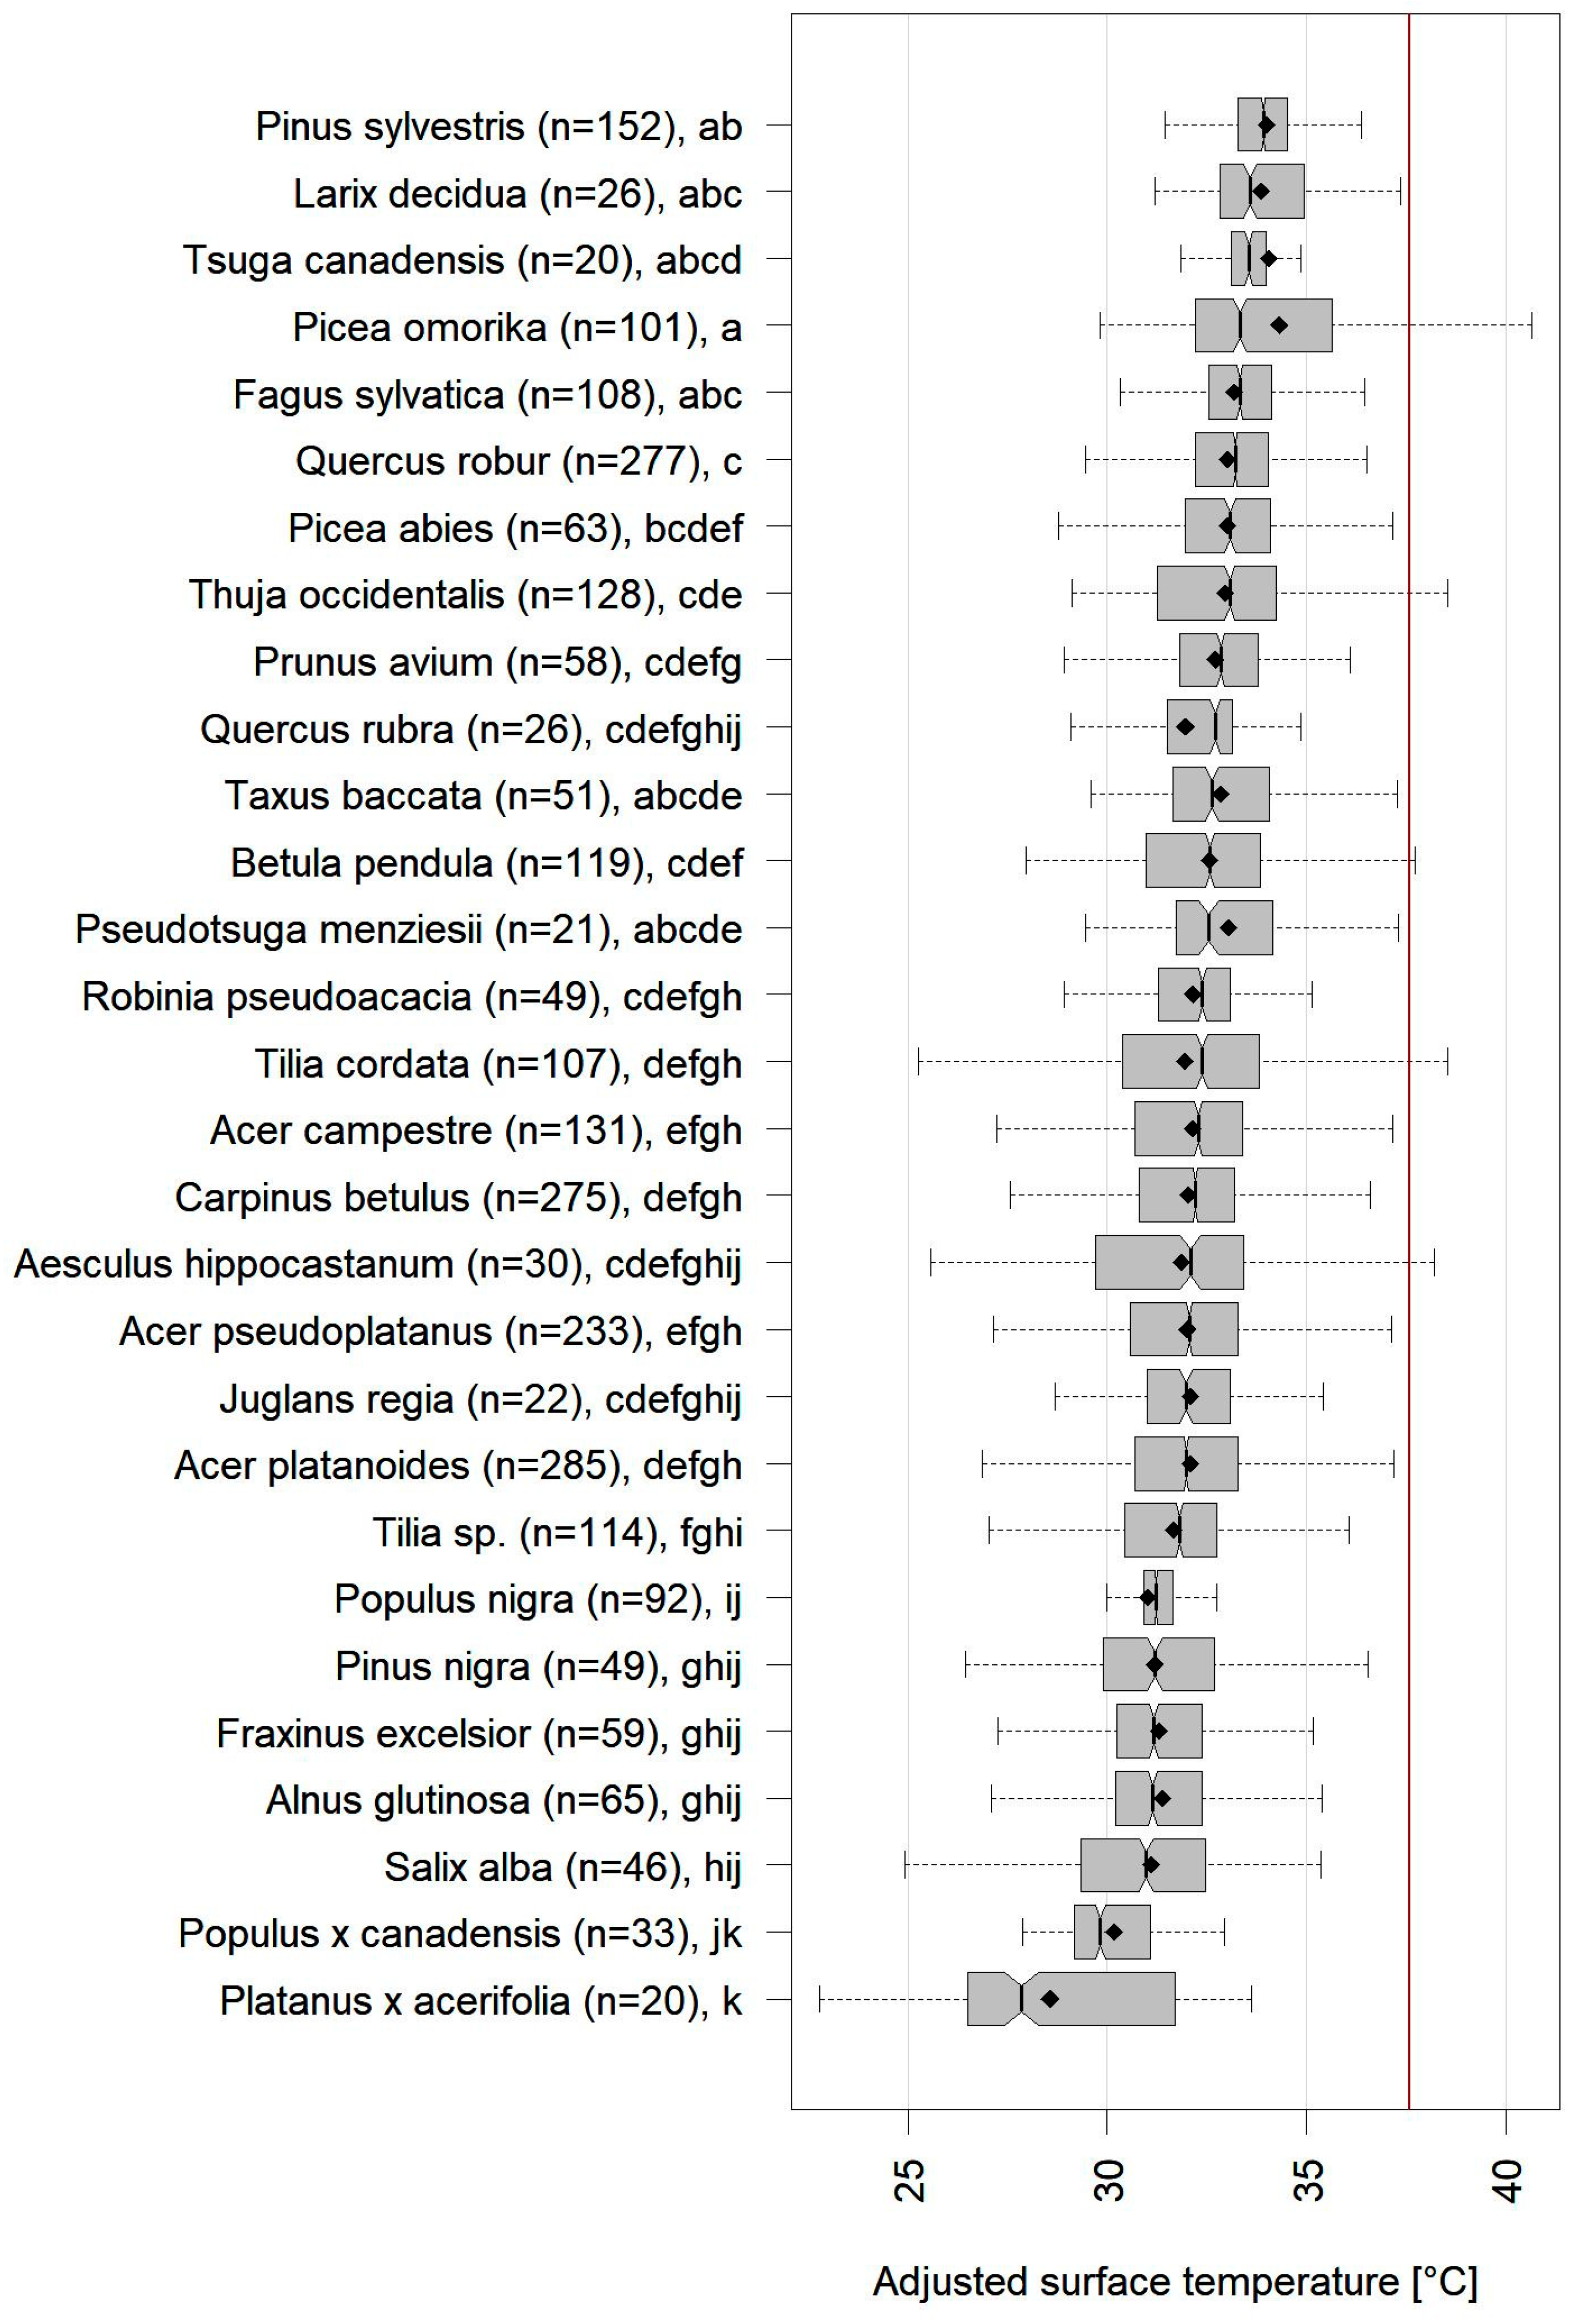
3.2. Adjusted Tree Surface Temperatures

After removing the linear effect of imperviousness using our ordinary least-square model, the relative order of species slightly changed (Figure 7). Tree species that mostly grow in forests in the research area, such as Pinus sylvestris or Fagus sylvatica, were only minorly adjusted by the model, leading to a large change in their relative order compared to other tree species. However, the highest surface temperatures were still found at coniferous tree species in general, with the exception of Pinus nigra with relatively low surface temperatures. Furthermore, riparian species had comparably low surface temperatures, with four species among the seven coolest species, a group that shows a distinctively lower median compared to other species. Platanus × acerifolia resulted in the lowest tree surface temperature after the adjustment.

3.3. Adjusted Tree Surface Temperatures Compared to NDVI

The comparison of adjusted tree surface temperatures with NDVI values of the species resulted in several similarities, whereby the species with the lowest/highest NDVI median value showed the highest/lowest surface temperature, and several species had a matching inverse order of these metrics (Figure 6 and Figure 7). The respective descriptive results matched the correlation analysis of tree species medians, with a significant (p = 0.013) negative correlation of −0.45 Pearson’s R.

3.4. Spatial Variation in Tree Surface Temperatures

Tree surface temperatures in the city center or within large areas of sealed surfaces showed higher temperatures compared to trees in dense forest stands outside of the city or in areas near water channels (Figure 3). Comparably warm surface temperatures were also observed for single trees within fallow agricultural areas outside of urban areas.

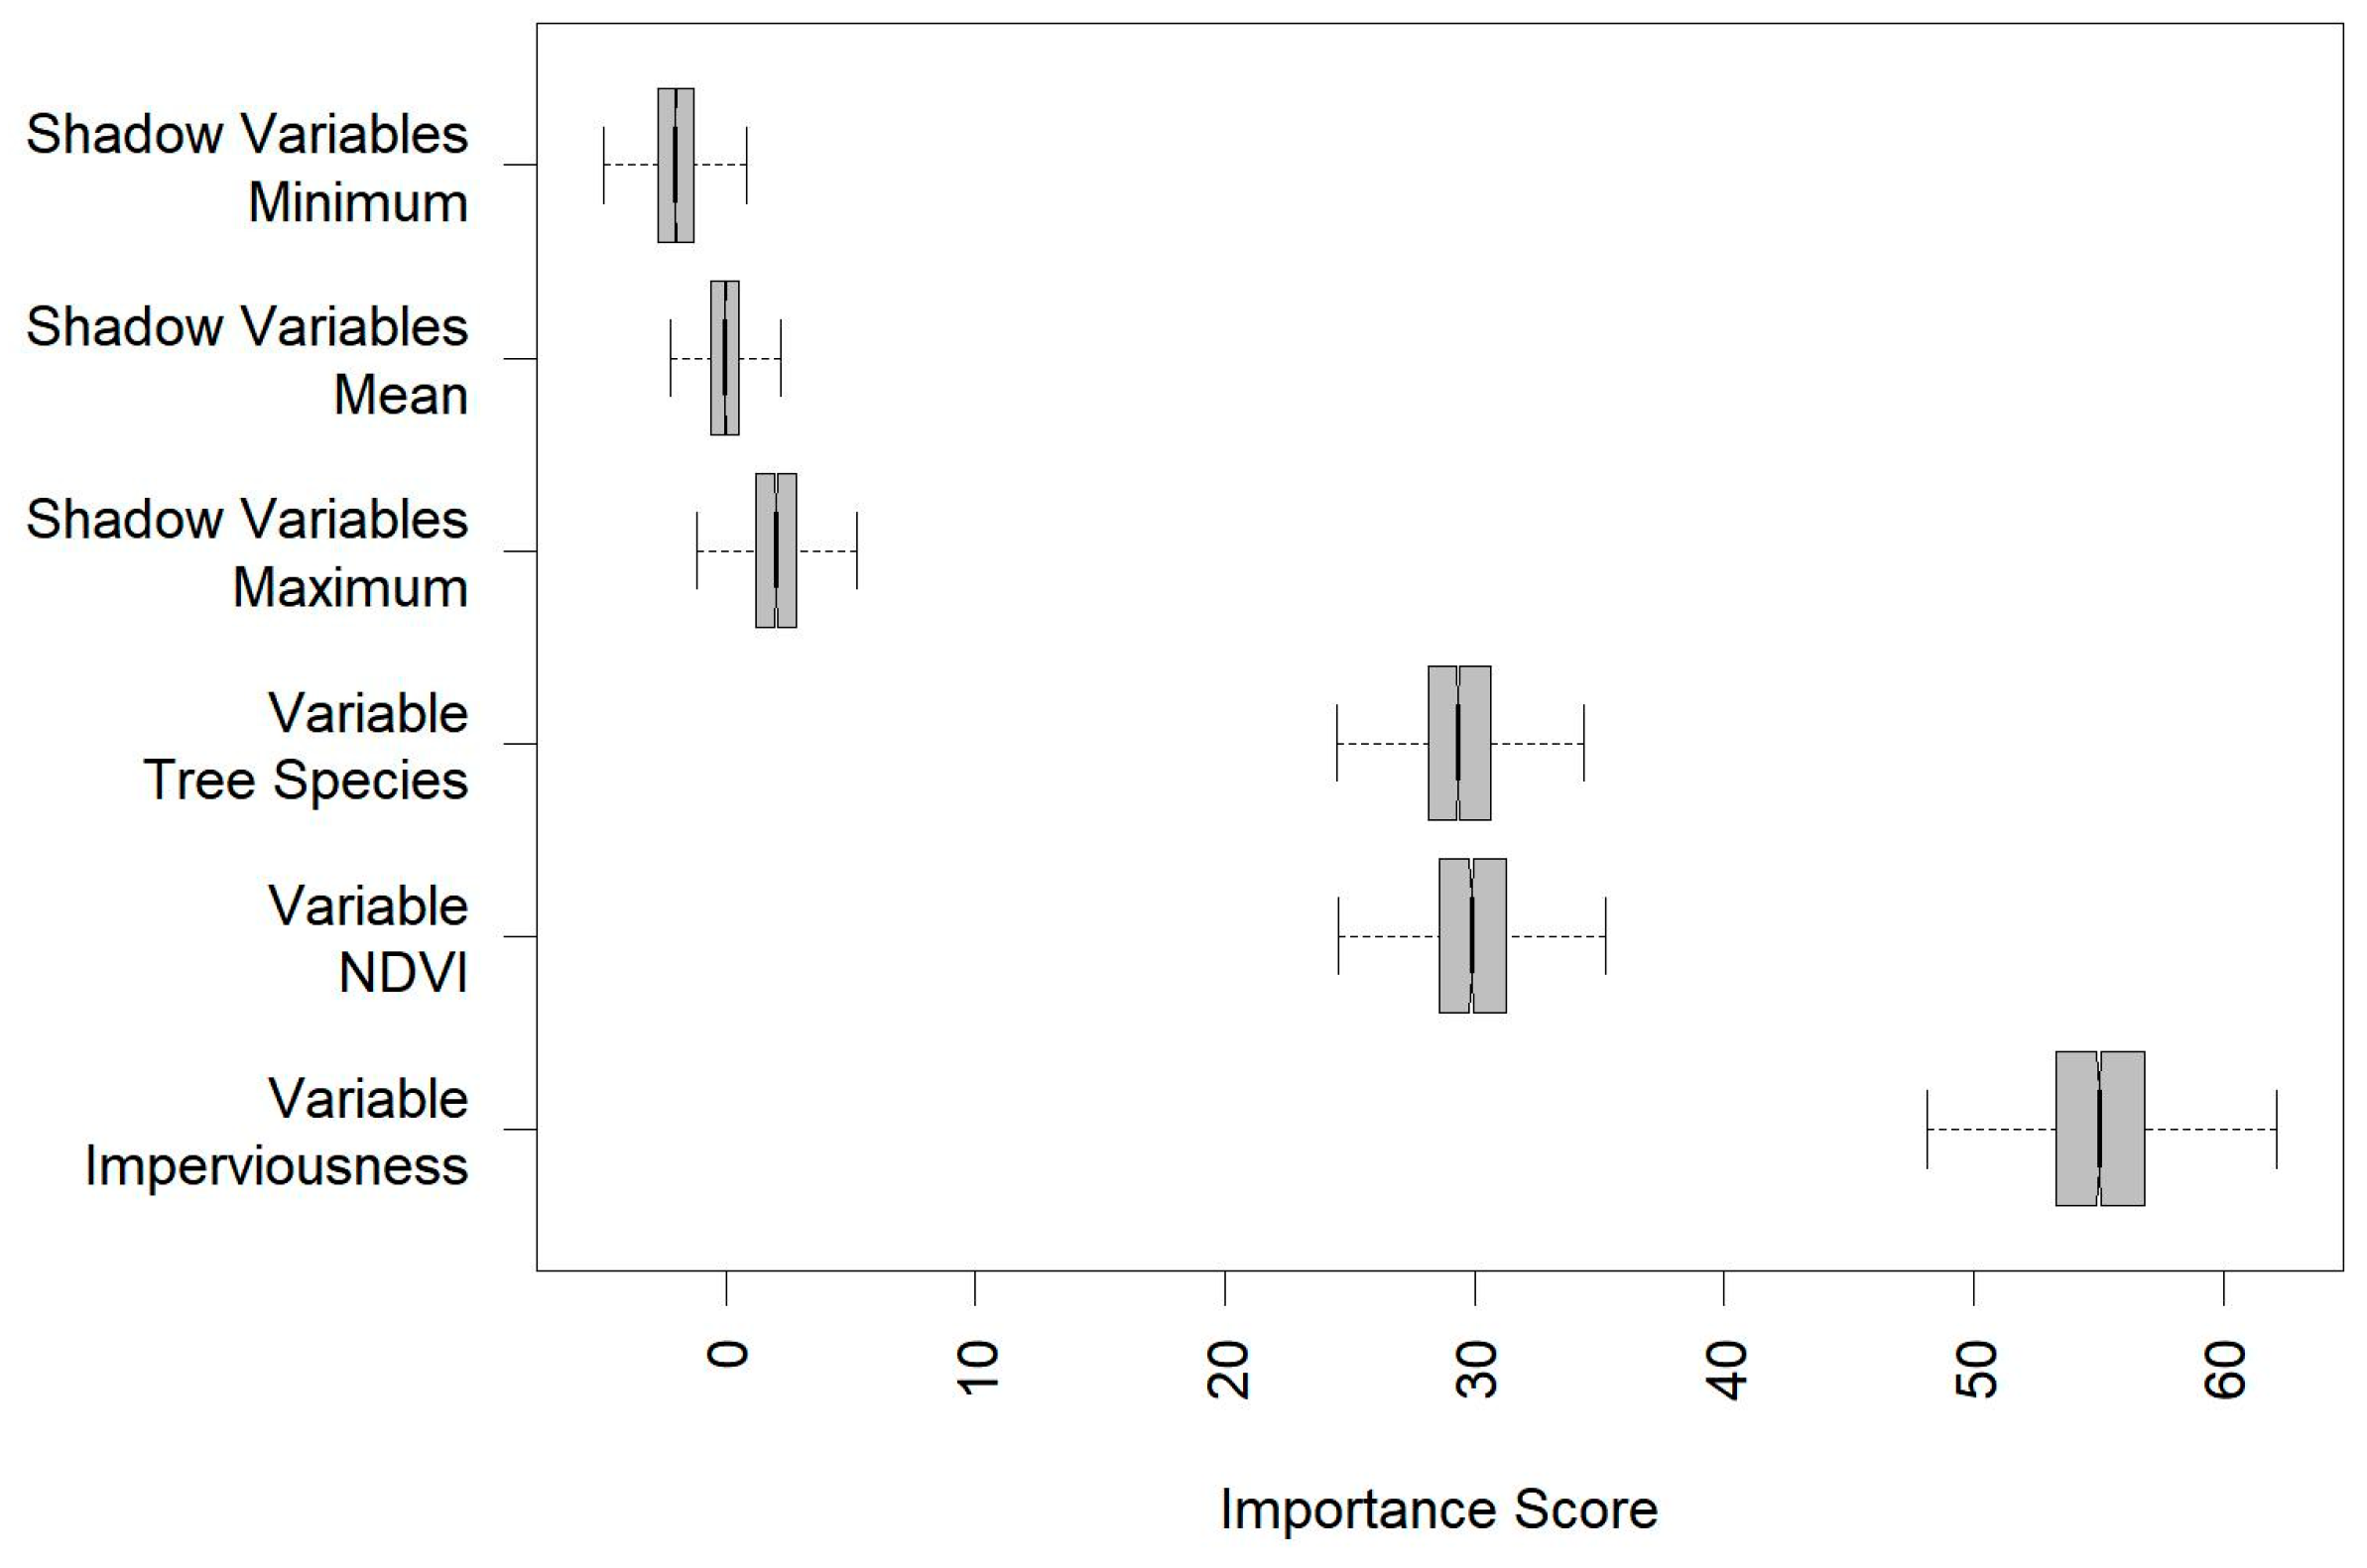
3.5. Boruta Variable Importance and Random Forest Model

The random forest model that considered imperviousness in a 91 m window, tree species, and NDVI to predict tree surface temperatures achieved a moderate cross-validated performance, with a R2 = 0.35 and a RMSE of 1.38 compared to a standard deviation of 1.72 °C of Tdiff of the surveyed trees (Table 1).
The importance assessment with the Boruta algorithm showed that all variables were highly important and had substantially higher importance than shadow variables (Figure 8). The importance of NDVI and tree species was almost identical and considerably lower than imperviousness, which showed the highest importance score.

4. Discussion

4.1. Cooling Potential under Extreme Heat and Drought

In this study, we present the first airborne analysis of tree species’ surface temperatures during a heat record after a prolonged drought in Central Europe. Our results illustrated that despite extreme conditions, trees had substantially lower surface temperatures of up to 6 °C in the median compared to the air temperature, which is in agreement with some existing findings during different conditions (e.g., sufficient water supply) that show that vegetation can have surface temperatures of up to 6.7 °C below air temperature in the afternoon [74]. Lower tree surface temperatures than air temperatures were also reported by a number of other studies [15,21,33,75] under normal conditions, but other findings also showed that parts of tree surfaces were above air temperatures, while others were considerably below [19], and several researchers also reported tree surfaces above air temperatures in summer [18,20,44]. Different reasons for this discrepancy exist, such as thermal camera characteristics, atmospheric effects, weather patterns, conversion of radiative temperatures to surface temperatures, tree and site conditions, various thermal regulation of leaves, and the selection of the reference air temperature stations [76]. Furthermore, spatial resolution may be the main reason for differences, as existing research found that a coarser spatial resolution leads to lower surface temperatures in relation to the air temperature [22]. With a resolution of 1.15 m of the analyzed thermal data in this study, pixels still represent a mixture of sunlit leave surfaces and shadows, which are known to show high temperature differences [60]. In spite of efforts to exclude shaded areas, this leads to an additional cooling effect of tree pixels in addition to evaporative effects at this resolution. However, the tree surfaces in this study were considerably cooler compared to air temperatures of all measurement stations in the research area.
The presented results do not support the hypothesis of severely reduced tree cooling potential during dry spells, as outlined by existing research [5,18,19,77], but indicate continued evapotranspirative cooling during extreme heatwaves and drought. This finding is supported by field experiments on some tree species, where temperatures of more than 40 °C and no water for one month did affect photosynthesis but not transpirational cooling [78]. Other experiments showed increases in leaf surface temperatures during drought conditions but also reported an opening of stromata in drought-stressed trees to avoid lethal overheating, while well-watered plants closed their stomata [79]. Therefore, trees provide cooling effects even under extreme conditions, although the respective situation may have a severe impact on tree health. It is also important to consider the urban setting of the presented findings. Under normal conditions, only young urban trees are watered in Forchheim to facilitate root growth [80]. However, during extreme conditions, such as the survey period in 2022, there are efforts to reduce the water deficit of urban trees by irrigation [81]. Naturally, these measures alleviate drought conditions and may lead to better cooling potential of trees, which is a confounding factor that has to be taken into account in an uncontrolled, in situ field survey. However, respective measures are not sufficient to prevent drought conditions because the available irrigation capacities are very limited, and several urban trees did not survive the heatwave of 2022 due to heat and drought [81].

4.2. Tree Species Differences

The presented analysis included a large number of species in comparison to existing approaches [18,19,20,21,22], whereby different patterns exist. Riparian species had considerably lower temperatures than others, which is in agreement with findings for selected species such as Populus nigra or Alnus glutinosa in other studies [20,21,22]. The main reason for this are high rates of transpiration of urban riparian vegetation due to sufficient water availability in their ecological habitat [23,82]. Following riparian species, Robinia pseudoacacia showed comparably cool surface temperatures, a result also reported in existing research [18,33]. This species is known for its drought tolerance and strong stomatal control during dry spells [83], which can also lead to much higher temperatures of this tree species compared to other urban trees during regular conditions [84]. However, this species may also maintain their cooling potential during drought due to their high water use efficiency [85], a potential reason for relatively low surface temperatures in comparison to other tree species in this study.
The species with the highest temperatures were mostly conifers, particularly if the mean values were considered in addition to the median, supporting the findings of different spatial scales that showed lower surface temperatures of broadleaf trees during hot extremes [26] as well as the results of some higher-resolution UAV surveys [86]. However, in other ecosystems, such as the Mediterranean maquis, reverse observations were also reported [87]. Larix decidua showed the highest median temperature of all species and was also among the group of hottest species in the mean. The reason for this finding may be high species-specific sensitivity to drought and reduced transpiration in summer as found in Urban et al. [88]. However, during non-drought conditions, the results for Larix decidua showed lower surface temperatures compared to many other species [20,89]. Therefore, our findings indicate that Larix decidua has reduced cooling potential during heat extremes and high sensitivity to drought in agreement with the expected decline in this species in natural habitats due to water limitations [88,90]. Similarly, the growth of Picea omorika and Taxus baccata, which were among the groups with the highest mean and median temperatures, showed high negative developments due to reduced water availability in existing work [91], and the latter species also showed highest temperatures in another remote sensing analysis [20]. Two coniferous species, Picea abies and Pinus sylvestris, showed lower surface temperatures compared to the other trees in this group. This result was most likely caused by their general locations in relatively green areas at the margins of the city.
Tilia cordata was the warmest broadleaf species in our study. This is seemingly contradictory to the results of studies that reported good cooling potential for this species in situations of good water availability [84] and remote sensing results where this species ranks in the middle among tree species [18,20,22]. However, comparable to other trees mentioned before, the main explanation is most likely the severe drought and high temperatures, as other researchers emphasize a strong susceptibility to drought [85] and a severely reduced cooling effect by limited water availability [77].
It is also important to state that tree surface temperature patterns between studies show considerable differences [18,19,20,21,22,33], and some species that had intermediate surface temperatures in our study showed highest temperatures in other research, such as Acer pseudoplatanus [19] or some other Acer spp. [18,20]. However, due to the many influencing factors involved in the surveys [76], and the extreme setting of our results, a detailed disentanglement of respective differences is out of the scope of the present study, but it is interesting to note that the pattern of surface temperatures presented herein shows notable similarities to tree crown die-back in tree species after heatwaves and drought, as reported by Lv et al. [92].
Our results also show large variances in surface temperatures even within the same species. To shed light on the driving factors of the respective differences, the extremes of certain individuals were examined. Picea omorika showed some of the largest variations, and detailed analysis showed that the main reasons for these differences were spatial differences in neighborhoods. Therefore, lower surface temperatures were found in individuals in parklike environments with many other trees and an abundance of shade. Highest temperatures were found in individuals with a large fraction of sealed surfaces in their surroundings and at sun-exposed locations, or far from other trees. This finding was comparable with the results of some other species. Similarly, very cool riparian species, such as Salix alba, are usually found near open water surfaces, which probably leads to a cooling effect, whereas the highest surface temperatures are observed at single isolated trees with some distance to surface water. Therefore, an important additional factor is the complex combination of surface materials in the vicinity of single trees, whereby imperviousness, green infrastructure, and water surfaces are probably the most important influencing factors [93]. Finally, the crown overlap of different species is another potential uncertainty factor that may lead to a large variation in surface temperatures of tree species, but our visual inspection only rarely indicated this issue. Future approaches would benefit from increased manual inspection of tree cadastre datasets to minimize these uncertainties.

4.3. Influence of Impervious Surfaces

The linear model indicates a highly significant, moderate influence of imperviousness on tree surface temperatures. These findings were also reported in other studies [16,56], but R2 was considerably higher in existing work with values around 0.37 [20]. The main reason for this is the different resolution of the cited study, with ground-based thermal data and a higher-resolution imperviousness layer. Furthermore, the mentioned study incorporated a very different scale, i.e., a 400 m × 200 m parklike environment with strong differences in imperviousness between trees at the margins of the green space and trees in the middle of green infrastructure and large distances to sealed surfaces. However, future approaches would potentially benefit from a custom land cover classification using multispectral data to investigate if a derived higher-resolution imperviousness dataset leads to different results and to experiment with different spatial windows. However, such an analysis that would include additional training and validation data, performance assessments, and modeling approaches was out of the scope of this study.
Generally, the model results show that imperviousness is an important factor that has the potential to mask other patterns of tree surface temperatures and species-specific differences. Our importance assessment even showed much higher importance for imperviousness compared to our main focus variable, tree species. On the one hand, this result is not unexpected, because one of the main causes of urban heat islands are sealed surfaces and missing vegetation due to a decrease in latent heat fluxes, albedo changes, and trapping of longwave radiation [93,94], and existing research shows an increase of up to 1 °C in surface temperatures per 20% increase in imperviousness [95]. Therefore, green infrastructure, which includes all trees regardless of tree species but also other vegetation types such as grassland, and the respective counterpart, namely the total fraction of sealed surfaces, are more important variables for surface temperatures in urban environments than tree species [6,7,8,9]. However, our importance assessment, which randomly shuffles one variable while maintaining the other variables unaltered in the model, clearly indicates that tree species is an additional important factor that influences the surface temperatures of the trees. Our assessment shows that leaving out the information on tree species would significantly reduce the performance of the model.
Finally, it is important to consider that the cooling potential of vegetation and sealed surfaces are interrelated variables, and the respective interlinkages are complex. One mechanism is that upward longwave radiation from the sealed surface may be intercepted by trees, leading to higher surface temperatures of respective individuals [20]. This effect from sealed surfaces thereby masks the cooling potential of the tree. Furthermore, several microclimatic connections exist, such as the increase in runoff and the reduction in infiltration due to imperviousness [96], which may reduce soil moisture and plant available water, leading to reduced evapotranspiration and higher surface temperatures. Additionally, dense stands of vegetation may have the opposite effect by creating a microclimate with increased shading, less exchange of air masses within the canopy, and higher relative humidity, which may lead to less evapotranspiration under the canopy and increased water conservation and soil moisture [97].
Untangling these effects is an important research area in urban climatology and could provide improved insights into the impacts of green infrastructure. Additional field surveys and in situ measurements, such as extended measurement networks in different urban neighborhoods or mobile measurements, are important approaches to distinguish between the effects of different imperviousness levels and the effects of trees on Tdiff [56,98]. High-resolution modeling approaches, such as ENVI-met, UrbClim HR, or PALM-4U [99], which were successfully applied to unravel urban climate mechanisms and influencing factors for urban heat islands in existing research [98,100,101], are another alternative method to augment research on the cooling effect of trees in urban environments. However, such refinements would require extensive additional field data or geospatial datasets and were out of scope for this manuscript; thus, we addressed this issue by removing linear imperviousness effects.

4.4. Adjusted Tree Surface Temperatures and NDVI

The relative order of species in regard to surface temperatures partly changed after removing the linear effect of imperviousness. The dominance of conifers at the highest temperatures increased, also with a strong rank change in Pinus sylvestris or Picea abies to warmer temperatures, whereas riparian species increased in the group of coolest surface temperatures. These changes amplified similarities to findings of existing research outside of urban centers [26,86]. Platanus × acerifolia, a typical urban tree species, also showed a strong change in the relative position to cooler temperatures compared to unadjusted Tdiff due to its characteristic urban location with high rates of impervious surfaces. Studies showed that this species provides cooling benefits even after heat and drought stress damage and temperatures above 43 °C, although these extremes reduce its cooling potential severely [73]. This species was also among the coolest species in other studies [18], but only in a park environment and not in urban regions as presented here. Therefore, the cooling potential of Platanus × acerifolia may be underestimated due to the usually strong impact of high imperviousness of their surroundings in approaches not considering this effect, and some studies indicate relatively high cooling potential of this species [102]. However, it is also important to state that the applied model involves strong generalization of the data, which may also induce some misleading effects, as not all relevant factors were considered in this study.
The generally lower NDVI values for conifer species compared to broadleaf species were also reported in other studies [103,104,105]. Additionally, our results showed that NDVI values were significantly negatively correlated to adjusted surface temperatures during the monitored heatwave and drought, an observation likely related to drought effects [103], as higher NDVI also indicates more active transpirational cooling. Thereby, our results confirmed previous results of a linear relationship between NDVI and surface temperature [60,61,62,103], showing that NDVI is also an important indicator of the cooling potential of urban trees.

4.5. Tree Surface Temperature Model and Importance

The variable importance assessment illustrated that all included parameters, imperviousness, NDVI, and tree species are important for predicting surface temperatures in a collective model. To our knowledge, a combined model of respective parameters has not been conducted yet, but existing results with separate analyses support these findings [13,20,60,62]. The total model only showed moderate predictive performance of surface temperatures compared to some coarser-resolution approaches of urban surface temperatures [106]. However, this model focused on tree temperatures only, and the aim of the presented approach was not to create an ideal model for tree surface temperature prediction, as this would involve many additional variables related to urban structure [16,106], but to compare the importance of tree species for surface temperature variations in parallel to other well-known predictors of surface temperatures. The importance of tree species was about the same magnitude as that of the tree NDVI, an established predictor of surface temperatures [60,61,62,103,107], showing the high relevance of tree species patterns for the urban climate.

5. Conclusions

This study showed that trees in Central European cities function as important cooling agents despite a record-breaking heatwave and drought conditions with tree temperatures between 2 °C and 6 °C below air temperatures. Tree species showed considerable median differences of up to 3.64 °C in their cooling potential. Riparian species with potentially good water provision showed the highest potential, whereas most conifers and drought-sensitive broadleaf species showed the lowest cooling potential during the extreme event. In addition to tree species, the urban structure, represented by imperviousness in this study, had a significant effect on tree surface temperatures, and the modeled removal of the respective effect increased some of the originally observed patterns but also changed the order of the cooling potential of trees. Median tree species’ NDVI values were found to be negatively correlated to species’ surface temperatures after removing linear impervious effects, indicating this variable as an important proxy for tree cooling potentials. Our study provides a methodological remote sensing example for a spontaneous and rapid coverage of extreme events. Future research would benefit from the augmentation of this analysis by including custom urban variables at higher resolutions and different spatial windows in addition to the repetition of surveys at different times and seasons.

Author Contributions

Conceptualization, H.Z. and C.S.; methodology, H.Z. and C.S.; scripting, H.Z.; validation, H.Z., formal analysis, H.Z.; investigation, H.Z. and C.S.; resources, C.S.; data curation, H.Z.; writing—original draft preparation, H.Z.; writing—review and editing, H.Z. and C.S.; visualization, H.Z.; supervision, C.S.; project administration, C.S.; funding acquisition, C.S. and H.Z. All authors have read and agreed to the published version of the manuscript.

Funding

The authors acknowledge Open Access Funding by the University of Graz. Furthermore, financing of the thermal survey flight and equipment by the University of Bayreuth is highly appreciated.

Data Availability Statement

The raw thermal data supporting the conclusions of this article is available via https://zenodo.org/records/11046143 (accessed on 4 June 2024).

Acknowledgments

We thank the City of Forchheim for providing the tree cadastre of the city. We are also grateful to the project coordinator of the STRENCH project at the municipality of Forchheim, Sebastian Maier, for logistical support of our measurements. The authors acknowledge the financial support by the University of Graz for open access funding of this article. Finally, we thank four anonymous reviewers for their efforts and time in reviewing this manuscript.

Conflicts of Interest

The authors declare no conflicts of interest.

References

  1. Rousi, E.; Kornhuber, K.; Beobide-Arsuaga, G.; Luo, F.; Coumou, D. Accelerated Western European Heatwave Trends Linked to More-Persistent Double Jets over Eurasia. Nat. Commun. 2022, 13, 3851. [Google Scholar] [CrossRef] [PubMed]
  2. Błażejczyk, K.; Twardosz, R.; Wałach, P.; Czarnecka, K.; Błażejczyk, A. Heat Strain and Mortality Effects of Prolonged Central European Heat Wave—An Example of June 2019 in Poland. Int. J. Biometeorol. 2022, 66, 149–161. [Google Scholar] [CrossRef]
  3. Masselot, P.; Mistry, M.; Vanoli, J.; Schneider, R.; Iungman, T.; Garcia-Leon, D.; Ciscar, J.-C.; Feyen, L.; Orru, H.; Urban, A.; et al. Excess Mortality Attributed to Heat and Cold: A Health Impact Assessment Study in 854 Cities in Europe. Lancet Planet. Health 2023, 7, e271–e281. [Google Scholar] [CrossRef] [PubMed]
  4. Basarin, B.; Lukić, T.; Matzarakis, A. Review of Biometeorology of Heatwaves and Warm Extremes in Europe. Atmosphere 2020, 11, 1276. [Google Scholar] [CrossRef]
  5. Zhao, J.; Meili, N.; Zhao, X.; Fatichi, S. Urban Vegetation Cooling Potential during Heatwaves Depends on Background Climate. Environ. Res. Lett. 2023, 18, 014035. [Google Scholar] [CrossRef]
  6. Santamouris, M.; Osmond, P. Increasing Green Infrastructure in Cities: Impact on Ambient Temperature, Air Quality and Heat-Related Mortality and Morbidity. Buildings 2020, 10, 233. [Google Scholar] [CrossRef]
  7. Kalkstein, L.S.; Eisenman, D.P.; de Guzman, E.B.; Sailor, D.J. Increasing Trees and High-Albedo Surfaces Decreases Heat Impacts and Mortality in Los Angeles, CA. Int. J. Biometeorol. 2022, 66, 911–925. [Google Scholar] [CrossRef] [PubMed]
  8. Maggiotto, G.; Miani, A.; Rizzo, E.; Castellone, M.D.; Piscitelli, P. Heat Waves and Adaptation Strategies in a Mediterranean Urban Context. Environ. Res. 2021, 197, 111066. [Google Scholar] [CrossRef] [PubMed]
  9. Marando, F.; Heris, M.P.; Zulian, G.; Udías, A.; Mentaschi, L.; Chrysoulakis, N.; Parastatidis, D.; Maes, J. Urban Heat Island Mitigation by Green Infrastructure in European Functional Urban Areas. Sustain. Cities Soc. 2022, 77, 103564. [Google Scholar] [CrossRef]
  10. Thekkan, A.F.; George, A.; Prasad, P.R.C.; Joseph, S. Understanding Blue-Green Infrastructure through Spatial Maps: Contribution of Remote Sensing and GIS Technology. In Blue-Green Infrastructure across Asian Countries: Improving Urban Resilience and Sustainability; Dhyani, S., Basu, M., Santhanam, H., Dasgupta, R., Eds.; Springer: Singapore, 2022; pp. 123–138. ISBN 978-981-16-7128-9. [Google Scholar]
  11. Arellano, B.; Roca, J. Effects of Urban Greenery on Health. A Study from Remote Sensing. Int. Arch. Photogramm. Remote Sens. Spat. Inf. Sci. 2022, XLIII-B3-2022, 17–24. [Google Scholar] [CrossRef]
  12. Voogt, J. Urban Heatwaves and Thermal Remote Sensing. In Proceedings of the 2021 IEEE International Geoscience and Remote Sensing Symposium IGARSS, Brussels, Belgium, 11–16 July 2021; IEEE: Piscataway, NJ, USA, 2021; pp. 938–941. [Google Scholar]
  13. Wang, C.; Ren, Z.; Chang, X.; Wang, G.; Hong, X.; Dong, Y.; Guo, Y.; Zhang, P.; Ma, Z.; Wang, W. Understanding the Cooling Capacity and Its Potential Drivers in Urban Forests at the Single Tree and Cluster Scales. Sustain. Cities Soc. 2023, 93, 104531. [Google Scholar] [CrossRef]
  14. Geng, X.; Yu, Z.; Zhang, D.; Li, C.; Yuan, Y.; Wang, X. The Influence of Local Background Climate on the Dominant Factors and Threshold-Size of the Cooling Effect of Urban Parks. Sci. Total Environ. 2022, 823, 153806. [Google Scholar] [CrossRef]
  15. Cheung, P.K.; Jim, C.Y.; Hung, P.L. Preliminary Study on the Temperature Relationship at Remotely-Sensed Tree Canopy and below-Canopy Air and Ground Surface. Build. Environ. 2021, 204, 108169. [Google Scholar] [CrossRef]
  16. Hu, J.; Zhou, Y.; Yang, Y.; Chen, G.; Chen, W.; Hejazi, M. Multi-City Assessments of Human Exposure to Extreme Heat during Heat Waves in the United States. Remote Sens. Environ. 2023, 295, 113700. [Google Scholar] [CrossRef]
  17. Yao, N.; Huang, C.; Yang, J.; Konijnendijk van den Bosch, C.C.; Ma, L.; Jia, Z. Combined Effects of Impervious Surface Change and Large-Scale Afforestation on the Surface Urban Heat Island Intensity of Beijing, China Based on Remote Sensing Analysis. Remote Sens. 2020, 12, 3906. [Google Scholar] [CrossRef]
  18. Leuzinger, S.; Vogt, R.; Körner, C. Tree Surface Temperature in an Urban Environment. Agric. For. Meteorol. 2010, 150, 56–62. [Google Scholar] [CrossRef]
  19. Scherrer, D.; Bader, M.K.-F.; Körner, C. Drought-Sensitivity Ranking of Deciduous Tree Species Based on Thermal Imaging of Forest Canopies. Agric. For. Meteorol. 2011, 151, 1632–1640. [Google Scholar] [CrossRef]
  20. Meier, F.; Scherer, D. Spatial and Temporal Variability of Urban Tree Canopy Temperature during Summer 2010 in Berlin, Germany. Theor. Appl. Climatol. 2012, 110, 373–384. [Google Scholar] [CrossRef]
  21. Zakrzewska, A.; Kopeć, D.; Krajewski, K.; Charyton, J. Canopy Temperatures of Selected Tree Species Growing in the Forest and Outside the Forest Using Aerial Thermal Infrared (3.6–4.9 Μm) Data. Eur. J. Remote Sens. 2022, 55, 313–325. [Google Scholar] [CrossRef]
  22. Richter, R.; Hutengs, C.; Wirth, C.; Bannehr, L.; Vohland, M. Detecting Tree Species Effects on Forest Canopy Temperatures with Thermal Remote Sensing: The Role of Spatial Resolution. Remote Sens. 2021, 13, 135. [Google Scholar] [CrossRef]
  23. Winbourne, J.B.; Jones, T.S.; Garvey, S.M.; Harrison, J.L.; Wang, L.; Li, D.; Templer, P.H.; Hutyra, L.R. Tree Transpiration and Urban Temperatures: Current Understanding, Implications, and Future Research Directions. BioScience 2020, 70, 576–588. [Google Scholar] [CrossRef]
  24. Adkins, K.; Wambolt, P.; Sescu, A.; Swinford, C.; Macchiarella, N.D. Observational Practices for Urban Microclimates Using Meteorologically Instrumented Unmanned Aircraft Systems. Atmosphere 2020, 11, 1008. [Google Scholar] [CrossRef]
  25. LfStat Population Data for Municipalities. 2023. Available online: https://www.statistik.bayern.de/ (accessed on 4 June 2024).
  26. Schwaab, J.; Davin, E.L.; Bebi, P.; Duguay-Tetzlaff, A.; Waser, L.T.; Haeni, M.; Meier, R. Increasing the Broad-Leaved Tree Fraction in European Forests Mitigates Hot Temperature Extremes. Sci. Rep. 2020, 10, 14153. [Google Scholar] [CrossRef] [PubMed]
  27. Stadt Forchheim. Tree Cadastre of the City of Forchheim; Amt für Öffentliches Grün: Forchheim, Germany, 2023. [Google Scholar]
  28. DWD Deutscher Wetterdienst. Daily Climate Data for Germany; DWD Deutscher Wetterdienst: Offenbach, Germany, 2022. Available online: https://opendata.dwd.de/climate_environment/CDC/observations_germany/climate/ (accessed on 6 April 2024).
  29. LfL Bayerische Landesanstalt für Landwirtschaft. Agrarmeteorologie Bayern. Weather Data for Agriculture in Bavaria. 2022. Available online: https://www.wetter-by.de/Agrarmeteorologie-BY/Wetterdaten/Oberfranken (accessed on 6 April 2024).
  30. LfU Bayerisches Landesamt Für Umwelt. Gewässerkundlicher Dienst Bayern. Water Data for Bavaria. 2022. Available online: https://www.gkd.bayern.de/de/fluesse/wassertemperatur/ (accessed on 6 April 2024).
  31. Venter, Z.S.; Sydenham, M.A.K. Continental-Scale Land Cover Mapping at 10 m Resolution Over Europe (ELC10). Remote Sens. 2021, 13, 2301. [Google Scholar] [CrossRef]
  32. ESA. Copernicus Sentinel 2 Data. 2022. Available online: https://scihub.copernicus.eu/ (accessed on 17 March 2024).
  33. Irmak, M.A.; Yilmaz, S.; Mutlu, E.; Yilmaz, H. Assessment of the Effects of Different Tree Species on Urban Microclimate. Environ. Sci Pollut. Res. 2018, 25, 15802–15822. [Google Scholar] [CrossRef] [PubMed]
  34. Smigaj, M.; Gaulton, R.; Suarez, J.; Barr, S. Use of Miniature Thermal Cameras for Detection of Physiological Stress in Conifers. Remote Sens. 2017, 9, 957. [Google Scholar] [CrossRef]
  35. OPTRIS GmbH. Infrared Cameras—The Most Portable Infrared Online Camera; Factsheet; Optris: Berlin, Germany, 2014. [Google Scholar]
  36. Das, S.; Christopher, J.; Roy Choudhury, M.; Apan, A.; Chapman, S.; Menzies, N.W.; Dang, Y.P. Evaluation of Drought Tolerance of Wheat Genotypes in Rain-Fed Sodic Soil Environments Using High-Resolution UAV Remote Sensing Techniques. Biosyst. Eng. 2022, 217, 68–82. [Google Scholar] [CrossRef]
  37. McElroy, S.; Schwarz, L.; Green, H.; Corcos, I.; Guirguis, K.; Gershunov, A.; Benmarhnia, T. Defining Heat Waves and Extreme Heat Events Using Sub-Regional Meteorological Data to Maximize Benefits of Early Warning Systems to Population Health. Sci. Total Environ. 2020, 721, 137678. [Google Scholar] [CrossRef] [PubMed]
  38. Pretzsch, H.; Biber, P.; Uhl, E.; Dahlhausen, J.; Rötzer, T.; Caldentey, J.; Koike, T.; Van Con, T.; Chavanne, A.; Seifert, T.; et al. Crown Size and Growing Space Requirement of Common Tree Species in Urban Centres, Parks, and Forests. Urban For. Urban Green. 2015, 14, 466–479. [Google Scholar] [CrossRef]
  39. OPTRIS GmbH. Optris PIX Connect. Software for Thermal Imager. Operators’s Manual; Optris: Berlin, Germany, 2021. [Google Scholar]
  40. OPTRIS GmbH. Basic Principles of Non-Contact Temperature Measurements; Optris: Berlin, Germany, 2022. [Google Scholar]
  41. Seier, G.; Abermann, J.; Andreassen, L.M.; Carrivick, J.L.; Kielland, P.H.; Löffler, K.; Nesje, A.; Robson, B.A.; Røthe, T.O.; Scheiber, T.; et al. Glacier Thinning, Recession and Advance, and the Associated Evolution of a Glacial Lake between 1966 and 2021 at Austerdalsbreen, Western Norway. Land Degrad. Dev. 2024, 35, 394–414. [Google Scholar] [CrossRef]
  42. Zhang, Y. MODIS UCSB Emissivity Library; NWP SAF: Reading, UK, 1999. [Google Scholar]
  43. Ribeiro Da Luz, B.; Crowley, J.K. Spectral Reflectance and Emissivity Features of Broad Leaf Plants: Prospects for Remote Sensing in the Thermal Infrared (8.0–14.0 Μm). Remote Sens. Environ. 2007, 109, 393–405. [Google Scholar] [CrossRef]
  44. Aubrecht, D.M.; Helliker, B.R.; Goulden, M.L.; Roberts, D.A.; Still, C.J.; Richardson, A.D. Continuous, Long-Term, High-Frequency Thermal Imaging of Vegetation: Uncertainties and Recommended Best Practices. Agric. For. Meteorol. 2016, 228–229, 315–326. [Google Scholar] [CrossRef]
  45. Heinemann, S.; Siegmann, B.; Thonfeld, F.; Muro, J.; Jedmowski, C.; Kemna, A.; Kraska, T.; Muller, O.; Schultz, J.; Udelhoven, T.; et al. Land Surface Temperature Retrieval for Agricultural Areas Using a Novel UAV Platform Equipped with a Thermal Infrared and Multispectral Sensor. Remote Sens. 2020, 12, 1075. [Google Scholar] [CrossRef]
  46. Teledyne FLIR. FLIR ResearchIR; Teledyne FLIR: Wilsonville, OR, USA, 2022. [Google Scholar]
  47. Malakar, N.K.; Hulley, G.C.; Hook, S.J.; Laraby, K.; Cook, M.; Schott, J.R. An Operational Land Surface Temperature Product for Landsat Thermal Data: Methodology and Validation. IEEE Trans. Geosci. Remote Sens. 2018, 56, 5717–5735. [Google Scholar] [CrossRef]
  48. Niwa, H. Comparison of the Accuracy of Two UAV-Mounted Uncooled Thermal Infrared Sensors in Predicting River Water Temperature. River Res. Appl. 2022, 38, 1660–1667. [Google Scholar] [CrossRef]
  49. Bayerische Vermessungsverwaltung. Digitales Orthophoto DOP40 (WMS); Bayerische Vermessungsverwaltung: München, Germany, 2022.
  50. LDBV. LIDAR Point Cloud of Bavaria; LBDV: München, Germany, 2024. [Google Scholar]
  51. Aboutalebi, M.; Torres-Rua, A.F.; McKee, M.; Kustas, W.; Nieto, H.; Coopmans, C. Behavior of Vegetation/Soil Indices in Shaded and Sunlit Pixels and Evaluation of Different Shadow Compensation Methods Using UAV High-Resolution Imagery over Vineyards. In Proceedings of the Autonomous Air and Ground Sensing Systems for Agricultural Optimization and Phenotyping III, Orlando, FL, USA, 16–17 April 2018; Volume 10664, p. 1066407. [Google Scholar]
  52. Zhang, L.; Sun, X.; Wu, T.; Zhang, H. An Analysis of Shadow Effects on Spectral Vegetation Indexes Using a Ground-Based Imaging Spectrometer. IEEE Geosci. Remote Sens. Lett. 2015, 12, 2188–2192. [Google Scholar] [CrossRef]
  53. Morgan-Wall, T. Rayshader: Create Maps and Visualize Data in 2D and 3D; R Foundation: Indianapolis, IN, USA, 2024. [Google Scholar]
  54. Otsu, K.; Pla, M.; Duane, A.; Cardil, A.; Brotons, L. Estimating the Threshold of Detection on Tree Crown Defoliation Using Vegetation Indices from UAS Multispectral Imagery. Drones 2019, 3, 80. [Google Scholar] [CrossRef]
  55. Hashim, H.; Abd Latif, Z.; Adnan, N.A. Urban Vegetation Classification with NDVI Threshold Value Method with Very High Resolution (VHR) Pleiades Imagery. Int. Arch. Photogramm. Remote Sens. Spat. Inf. Sci. 2019, XLII-4/W16, 237–240. [Google Scholar] [CrossRef]
  56. Ziter, C.D.; Pedersen, E.J.; Kucharik, C.J.; Turner, M.G. Scale-Dependent Interactions between Tree Canopy Cover and Impervious Surfaces Reduce Daytime Urban Heat during Summer. Proc. Natl. Acad. Sci. USA 2019, 116, 7575–7580. [Google Scholar] [CrossRef]
  57. EEA. Imperviousness Density 2018 (Raster 10 m), Europe, 3-Yearly, Aug. 2020; EEA: Copenhagen, Denmark, 2020. [Google Scholar]
  58. McGILL, R.; Tukey, J.W.; Larsen, W.A. Variations of Box Plots. Am. Stat. 1978, 32, 12–16. [Google Scholar] [CrossRef]
  59. Chambers, J.M. Graphical Methods for Data Analysis; Chapman and Hall/CRC: New York, NY, USA, 1983; ISBN 978-1-351-07230-4. [Google Scholar]
  60. Gillner, S.; Vogt, J.; Tharang, A.; Dettmann, S.; Roloff, A. Role of Street Trees in Mitigating Effects of Heat and Drought at Highly Sealed Urban Sites. Landsc. Urban Plan. 2015, 143, 33–42. [Google Scholar] [CrossRef]
  61. Yue, W.; Xu, J.; Tan, W.; Xu, L. The Relationship between Land Surface Temperature and NDVI with Remote Sensing: Application to Shanghai Landsat 7 ETM+ Data. Int. J. Remote Sens. 2007, 28, 3205–3226. [Google Scholar] [CrossRef]
  62. Adams, M.P.; Smith, P.L. A Systematic Approach to Model the Influence of the Type and Density of Vegetation Cover on Urban Heat Using Remote Sensing. Landsc. Urban Plan. 2014, 132, 47–54. [Google Scholar] [CrossRef]
  63. De Castro, L.R. spANOVA:Biblioteca para Análise de Variância de Experimentos com Dependência Espacial em Ambiente R. Master’s Dissertation, University Federal de Lavras, Lavras, Brazil, 2019. [Google Scholar]
  64. Scolforo, H.F.; Scolforo, J.R.S.; De Mello, J.M.; Filho, A.C.F.; Rossoni, D.F.; Altoé, T.F.; Oliveira, A.D.; De Lima, R.R. Autoregressive Spatial Analysis and Individual Tree Modeling as Strategies for the Management of Eremanthus Erythropappus. J. For. Res. 2016, 27, 595–603. [Google Scholar] [CrossRef]
  65. Long, D.S. Spatial Autoregression Modeling of Site-Specific Wheat Yield. Geoderma 1998, 85, 181–197. [Google Scholar] [CrossRef]
  66. De Castro, L.R.; De Lima, R.R.; Rossoni, D.F.; Nogueira, C.H. spANOVA: Spatial Analysis of Field Trials Experiments Using Geostatistics and Spatial Autoregressive Model 2021. Available online: https://CRAN.R-project.org/package=spANOVA (accessed on 6 April 2024).
  67. Mendiburu, F. HSD.Test Function—Rdocumentation. Available online: https://www.rdocumentation.org/packages/agricolae/versions/1.3-7/topics/HSD.test (accessed on 3 June 2024).
  68. Zandler, H.; Faryabi, S.P.; Ostrowski, S. Contributions to Satellite-Based Land Cover Classification, Vegetation Quantification and Grassland Monitoring in Central Asian Highlands Using Sentinel-2 and MODIS Data. Front. Environ. Sci. 2022, 10, 684589. [Google Scholar] [CrossRef]
  69. Zandler, H.; Senftl, T.; Vanselow, K.A. Reanalysis Datasets Outperform Other Gridded Climate Products in Vegetation Change Analysis in Peripheral Conservation Areas of Central Asia. Sci. Rep. 2020, 10, 22446. [Google Scholar] [CrossRef]
  70. Kursa, M.B.; Rudnicki, W.R. Feature Selection with the Boruta Package. J. Stat. Softw. 2010, 36, 1–13. [Google Scholar] [CrossRef]
  71. Cammarota, C.; Pinto, A. Variable Selection and Importance in Presence of High Collinearity: An Application to the Prediction of Lean Body Mass from Multi-Frequency Bioelectrical Impedance. J. Appl. Stat. 2021, 48, 1644–1658. [Google Scholar] [CrossRef]
  72. Zandler, H.; Haag, I.; Samimi, C. Evaluation Needs and Temporal Performance Differences of Gridded Precipitation Products in Peripheral Mountain Regions. Sci. Rep. 2019, 9, 15118. [Google Scholar] [CrossRef]
  73. Sanusi, R.; Livesley, S.J. London Plane Trees (Platanus × Acerifolia) before, during and after a Heatwave: Losing Leaves Means Less Cooling Benefit. Urban For. Urban Green. 2020, 54, 126746. [Google Scholar] [CrossRef]
  74. Hesslerová, P.; Pokorný, J.; Brom, J.; Rejšková-Procházková, A. Daily Dynamics of Radiation Surface Temperature of Different Land Cover Types in a Temperate Cultural Landscape: Consequences for the Local Climate. Ecol. Eng. 2013, 54, 145–154. [Google Scholar] [CrossRef]
  75. Hesslerová, P.; Pokorný, J.; Huryna, H.; Seják, J.; Jirka, V. The Impacts of Greenery on Urban Climate and the Options for Use of Thermal Data in Urban Areas. Prog. Plan. 2022, 159, 100545. [Google Scholar] [CrossRef]
  76. Song, B.; Park, K. Verification of Accuracy of Unmanned Aerial Vehicle (UAV) Land Surface Temperature Images Using In-Situ Data. Remote Sens. 2020, 12, 288. [Google Scholar] [CrossRef]
  77. Zhang; Stratopoulos; Pretzsch; Rötzer How Do Tilia Cordata Greenspire Trees Cope with Drought Stress Regarding Their Biomass Allocation and Ecosystem Services? Forests 2019, 10, 676. [CrossRef]
  78. Drake, J.E.; Tjoelker, M.G.; Vårhammar, A.; Medlyn, B.E.; Reich, P.B.; Leigh, A.; Pfautsch, S.; Blackman, C.J.; López, R.; Aspinwall, M.J.; et al. Trees Tolerate an Extreme Heatwave via Sustained Transpirational Cooling and Increased Leaf Thermal Tolerance. Glob. Chang. Biol. 2018, 24, 2390–2402. [Google Scholar] [CrossRef] [PubMed]
  79. Marchin, R.M.; Backes, D.; Ossola, A.; Leishman, M.R.; Tjoelker, M.G.; Ellsworth, D.S. Extreme Heat Increases Stomatal Conductance and Drought-induced Mortality Risk in Vulnerable Plant Species. Glob. Chang. Biol. 2022, 28, 1133–1146. [Google Scholar] [CrossRef] [PubMed]
  80. Stadt Forchheim Pressemitteilung Vom 14.07.2023: Anhaltende Hitze Und Trockenheit Führt Zu Hitzestress Bei Pflanzen Und Bäume—Press Release from July 14, 2023: Prolonged Heat and Drought Lead to Heat Stress for Plants and Trees. 2023. Available online: https://www.forchheim.de/bauen-und-wohnen-planen/natur-umwelt/oeffentliches-gruen/ (accessed on 6 April 2024).
  81. Nürnberger Nachrichten Hitze Setzt Dem Stadtgrün Zu—“Regen Kann Man Nicht Ersetzen”: So Geht Es Forchheims Straßenbäumen. 2022. Available online: https://www.nn.de/region/forchheim/regen-kann-man-nicht-ersetzen-so-geht-es-forchheims-strassenbaumen-1.12499107 (accessed on 6 April 2024).
  82. Frédette, C.; Labrecque, M.; Comeau, Y.; Brisson, J. Willows for Environmental Projects: A Literature Review of Results on Evapotranspiration Rate and Its Driving Factors across the Genus Salix. J. Environ. Manag. 2019, 246, 526–537. [Google Scholar] [CrossRef] [PubMed]
  83. Franceschi, E.; Moser-Reischl, A.; Honold, M.; Rahman, M.A.; Pretzsch, H.; Pauleit, S.; Rötzer, T. Urban Environment, Drought Events and Climate Change Strongly Affect the Growth of Common Urban Tree Species in a Temperate City. Urban For. Urban Green. 2023, 88, 128083. [Google Scholar] [CrossRef]
  84. Rahman, M.A.; Hartmann, C.; Moser-Reischl, A.; von Strachwitz, M.F.; Paeth, H.; Pretzsch, H.; Pauleit, S.; Rötzer, T. Tree Cooling Effects and Human Thermal Comfort under Contrasting Species and Sites. Agric. For. Meteorol. 2020, 287, 107947. [Google Scholar] [CrossRef]
  85. Moser-Reischl, A.; Rahman, M.A.; Pauleit, S.; Pretzsch, H.; Rötzer, T. Growth Patterns and Effects of Urban Micro-Climate on Two Physiologically Contrasting Urban Tree Species. Landsc. Urban Plan. 2019, 183, 88–99. [Google Scholar] [CrossRef]
  86. Choi, T.-Y.; Moon, H.-G.; Cha, J.-G. Analysis of Surface Temperature on Urban Green Space Using Unmanned Aerial Vehicle Images—A Case of Sorasan Mt. Nature Garden, Iksan, South Korea. J. Korean Assoc. Geogr. Inf. Stud. 2017, 20, 90–103. [Google Scholar]
  87. Lapidot, O.; Ignat, T.; Rud, R.; Rog, I.; Alchanatis, V.; Klein, T. Use of Thermal Imaging to Detect Evaporative Cooling in Coniferous and Broadleaved Tree Species of the Mediterranean Maquis. Agric. For. Meteorol. 2019, 271, 285–294. [Google Scholar] [CrossRef]
  88. Urban, J.; Rubtsov, A.V.; Urban, A.V.; Shashkin, A.V.; Benkova, V.E. Canopy Transpiration of a Larix Sibiricaand Pinus Sylvestris Forest in Central Siberia. Agric. For. Meteorol. 2019, 271, 64–72. [Google Scholar] [CrossRef]
  89. Leuzinger, S.; Körner, C. Tree Species Diversity Affects Canopy Leaf Temperatures in a Mature Temperate Forest. Agric. For. Meteorol. 2007, 146, 29–37. [Google Scholar] [CrossRef]
  90. Danek, M.; Danek, T. Recent Changes in the Climate-Growth Response of European Larch (Larix decidua Mill.) in the Polish Sudetes. Trees 2022, 36, 803–817. [Google Scholar] [CrossRef]
  91. Song, Y.; Sass-Klaassen, U.; Sterck, F.; Goudzwaard, L.; Akhmetzyanov, L.; Poorter, L. Growth of 19 Conifer Species Is Highly Sensitive to Winter Warming, Spring Frost and Summer Drought. Ann. Bot. 2021, 128, 545–557. [Google Scholar] [CrossRef] [PubMed]
  92. Lv, H.; Gangwisch, M.; Saha, S. Crown Die-Back of Peri-Urban Forests after Combined Heatwave and Drought Was Species-Specific, Size-Dependent, and Also Related to Tree Neighbourhood Characteristics. Sci. Total Environ. 2024, 913, 169716. [Google Scholar] [CrossRef] [PubMed]
  93. Dienst, M.; Lindén, J.; Esper, J. Determination of the Urban Heat Island Intensity in Villages and Its Connection to Land Cover in Three European Climate Zones. Clim. Res. 2018, 76, 1–15. [Google Scholar] [CrossRef]
  94. Mahmood, R.; Pielke, R.A.; Hubbard, K.G.; Niyogi, D.; Dirmeyer, P.A.; McAlpine, C.; Carleton, A.M.; Hale, R.; Gameda, S.; Beltrán-Przekurat, A.; et al. Land Cover Changes and Their Biogeophysical Effects on Climate. Int. J. Climatol. 2014, 34, 929–953. [Google Scholar] [CrossRef]
  95. Morabito, M.; Crisci, A.; Georgiadis, T.; Orlandini, S.; Munafò, M.; Congedo, L.; Rota, P.; Zazzi, M. Urban Imperviousness Effects on Summer Surface Temperatures Nearby Residential Buildings in Different Urban Zones of Parma. Remote Sens. 2017, 10, 26. [Google Scholar] [CrossRef]
  96. Gill, S.E.; Handley, J.F.; Ennos, A.R.; Pauleit, S. Adapting Cities for Climate Change: The Role of the Green Infrastructure. Built Environ. 2007, 33, 115–133. [Google Scholar] [CrossRef]
  97. Spangenberg, J.; Shinzato, P.; Johansson, E.; Duarte, D. The Impact of Urban Vegetation on Microclimate in Hot Humid São Paulo. In Proceedings of the PLEA2007—The 24th Conference on Passive and Low Energy Architecture, Singapore, 22–24 November 2007. [Google Scholar]
  98. Lobaccaro, G.; De Ridder, K.; Acero, J.A.; Hooyberghs, H.; Lauwaet, D.; Maiheu, B.; Sharma, R.; Govehovitch, B. Applications of Models and Tools for Mesoscale and Microscale Thermal Analysis in Mid-Latitude Climate Regions—A Review. Sustainability 2021, 13, 12385. [Google Scholar] [CrossRef]
  99. PALM Group. PALM-4U—Model for the Simulation of Urban Atmospheric Boundary Layers; PALM Group: Hanover, Germany, 2018. [Google Scholar]
  100. Yilmaz, S.; Mutlu, E.; Yilmaz, H. Alternative Scenarios for Ecological Urbanizations Using ENVI-Met Model. Environ. Sci. Pollut. Res. 2018, 25, 26307–26321. [Google Scholar] [CrossRef] [PubMed]
  101. García-Díez, M.; Lauwaet, D.; Hooyberghs, H.; Ballester, J.; De Ridder, K.; Rodó, X. Advantages of Using a Fast Urban Boundary Layer Model as Compared to a Full Mesoscale Model to Simulate the Urban Heat Island of Barcelona. Geosci. Model Dev. 2016, 9, 4439–4450. [Google Scholar] [CrossRef]
  102. Liu, Y.; Guo, Y.; Xiao, X.; Wang, S.; Lu, X.; Wang, B. Temperature-Decreasing and Humidity-Increasing Effects of Typical Landscape Plants in Suzhou City. In Proceedings of the 2015 International Forum on Energy, Environment Science and Materials, Shenzen, China, 26–26 September 2024; Atlantis Press: Amsterdam, The Netherlands, 2015. [Google Scholar]
  103. Miller, D.L.; Alonzo, M.; Meerdink, S.K.; Allen, M.A.; Tague, C.L.; Roberts, D.A.; McFadden, J.P. Seasonal and Interannual Drought Responses of Vegetation in a California Urbanized Area Measured Using Complementary Remote Sensing Indices. ISPRS J. Photogramm. Remote Sens. 2022, 183, 178–195. [Google Scholar] [CrossRef]
  104. Chen, W.; Moriya, K.; Sakai, T.; Koyama, L.; Cao, C. Temporal and Spatial Monitoring of Post-Fire Forest Dynamics Using Time-Series MODIS Data. In Proceedings of the 2014 IEEE Geoscience and Remote Sensing Symposium, Quebec City, QC, Canada, 13–18 July 2014; pp. 772–775. [Google Scholar]
  105. DeFries, R.; Hansen, M.; Townshend, J. Global Discrimination of Land Cover Types from Metrics Derived from AVHRR Pathfinder Data. Remote Sens. Environ. 1995, 54, 209–222. [Google Scholar] [CrossRef]
  106. Hofierka, J.; Gallay, M.; Onačillová, K.; Hofierka, J. Physically-Based Land Surface Temperature Modeling in Urban Areas Using a 3-D City Model and Multispectral Satellite Data. Urban Clim. 2020, 31, 100566. [Google Scholar] [CrossRef]
  107. Weng, Q.; Lu, D.; Schubring, J. Estimation of Land Surface Temperature–Vegetation Abundance Relationship for Urban Heat Island Studies. Remote Sens. Environ. 2004, 89, 467–483. [Google Scholar] [CrossRef]
Figure 1. Coverage of flight campaign, distribution of urban trees from the cadastre [27], and location of climate [28,29] or active hydrological stations [30], with ELC-10 land cover classes [31] and Sentinel-2 imagery from 20 July 2022 [32] in the background. Projection: ETRS89/UTM zone 32N (CRS 25832). The red rectangle in the small overview map shows the location of the large scale map.
Remotesensing 16 02059 g001
Figure 2. Climate situation during and before the survey flight on 20 July 2022 (2022 values marked by the red line), compared to density distribution curves of precipitation sums from May to July (a), mean temperatures from May to July (b), and daily maximum temperatures from June to August (c) in the period 1949 to 2023. All data were derived from the German Weather Service (DWD) [28].
Remotesensing 16 02059 g002
Figure 3. Detail of the thermal orthomosaic with a LIDAR-derived hillshade in the background [50]. Trees and water surfaces show clear differences from buildings and streets. The red rectangle in the small map indicates the location of the large-scale illustration in relation to the flight area.
Remotesensing 16 02059 g003
Figure 4. Species results for observed tree pixel temperature differences (Tsurf − Tair) in descending order by median values. Mean values are marked by black diamonds. Means of species sharing the same letter in the group label (e.g., a, b, or c) are not significantly different at the 95% confidence level. The number of analyzed trees is provided by n.
Remotesensing 16 02059 g004
Figure 5. Species differences of imperviousness in a 91 m window around tree pixels in descending order by median values. Mean values are marked by black diamonds. Means of species sharing the same letter in the group label (e.g., a, b, or c) are not significantly different at the 95% confidence level. The number of analyzed trees is provided by n.
Remotesensing 16 02059 g005
Figure 6. Species differences of tree pixel NDVI ascendingly sorted by median values. Mean values are marked by black diamonds. Means of species sharing the same letter in the group label (e.g., a, b, or c) are not significantly different at the 95% confidence level. The number of analyzed trees is provided by n.
Remotesensing 16 02059 g006
Figure 7. Species differences of tree pixel adjusted tree surface temperatures in descending order by median values. Mean values are marked by black diamonds. Means of species sharing the same letter in the group label (e.g., a, b, or c) are not significantly different at the 95% confidence level. The number of analyzed trees is provided by n. The red line shows the mean air temperature of urban reference stations during the survey.
Remotesensing 16 02059 g007
Figure 8. Importance score of the selected variables of interest using a 500-repeated Boruta algorithm with Tdiff as the dependent variable. Shadow variables are randomly shuffled variables to remove any potential correlation with the response [70].
Remotesensing 16 02059 g008
Table 1. Seven performance metrics of the random forest model compared to the mean temperature difference and standard deviation of the surveyed trees. Refer to Zandler et al. for explanations and mathematic formulas [72].
R2RMSERMSErelMAEMAErelBIASBIASrelMean Tdiff TreesSD Trees
0.351.3842.130.9228.250.010.233.271.72
Disclaimer/Publisher’s Note: The statements, opinions and data contained in all publications are solely those of the individual author(s) and contributor(s) and not of MDPI and/or the editor(s). MDPI and/or the editor(s) disclaim responsibility for any injury to people or property resulting from any ideas, methods, instructions or products referred to in the content.

