Article

Polarization Characteristics Distortion for L-Band Fully Polarimetric Radar Subject to Magnetized Plasma Sheath

1
School of Aerospace Science and Technology, Xidian University, Xi’an 710126, China
2
College of Information Engineering, Capital Normal University, Beijing 100048, China
*
Author to whom correspondence should be addressed.
Remote Sens. 2024, 16(12), 2061; https://doi.org/10.3390/rs16122061
Submission received: 7 April 2024 / Revised: 29 May 2024 / Accepted: 5 June 2024 / Published: 7 June 2024
(This article belongs to the Topic Radar Signal and Data Processing with Applications)

Abstract

:
High-velocity reentry objects suffer from plasma sheath during reentry through the atmosphere, which affects the propagation characteristics of radar signals. The existing research mainly focuses on the time-frequency characteristics of radar signals, neglecting the polarization within the geomagnetic environment. In this article, the distortion of polarization characteristics for L-band fully polarimetric radar is analyzed, and the influence of the geomagnetic field is evaluated. Based on the Appleton–Hartree formula, the refractive index of the plasma sheath considering the geomagnetic field is derived and analyzed. The error model for the polarization deflection (PD) of radar waves is then established based on the phase screen model. The magnetized plasma sheath causes the deflection of the polarization plane for the radar signal, leading to distortion in the polarization characteristics and the attenuation of the echo amplitude. Considering the typical parameters of the plasma sheath, the influences of the electron density, collision frequency, the geomagnetic field and the radar frequency are analyzed quantitatively. Specifically, the PD anomaly phenomenon is analyzed and the corresponding analytical result of radar frequency is also derived. The relationship between the geomagnetic field and the PD, as well as the attenuation, is considered to be approximately linear. The absorption attenuation is primarily influenced by collision frequency and is immune to the geomagnetic field. In addition, the increasing electron density expands them, whereas the radar frequency and the collision frequency have the opposite effect. Simulations with real SAR data from ALOS-2 demonstrate the distortions resulting from the magnetized plasma sheath on the radar echoes in an L-band fully polarimetric radar system.

Graphical Abstract

1. Introduction

L-band microwave radar is suitable for reentry object exploration due to its advantages of good temporal coherence and high resolution, and examples include the synthetic aperture radar (SAR) system [1]. Unfortunately, the radar echo will be interfered with by the plasma sheath due to its interferences on the electromagnetic (EM) wave, causing the distortion of the polarization characteristics of the echo, especially for a fully polarimetric system [2].
In terms of the impact of the plasma sheath on radar, some scholars have conducted research on the multi-domain characteristics of radar signals. From the perspective of the time-frequency domain, a non-uniform plasma layering model is first established [3]. Then, the equivalent transmission line model is established to describe the transmission characteristics of radar waves in the non-uniform plasma sheath [4,5]. In addition, the frequency diversity method [6] and the Finite-Difference Time-Domain (FDTD) method [7,8] are also used to analyze the reflection characteristics of EM waves in the plasma sheath. Furthermore, some research also investigates the distortion mechanism of the echo’s amplitude and phase considering the plasma sheath [9], and proposes corresponding compensation methods [10]. As to the polarization, few studies have explored the polarimetric impact of the plasma sheath on radar. Bai analyzed the effect of reentry plasma on oblique incidence EM waves using the equivalent transmission line method, and found that the polarization characteristics deteriorate most severely when the cut-off frequency of the peak electron density is closest to the radar frequency [11]. Although polarization analysis is partly discussed, the related research still relies on the equivalent transmission line model with time-frequency analysis, while the influence of the plasma sheath with its magnetized environment is seldom addressed.
In fact, the magnetized plasma environment is quite general and crucial for analyzing the polarization characteristics of a fully polarimetric radar system, such as the geomagnetic field. At present, most relevant research focuses on the ionosphere, with only a small amount dedicated to the plasma sheath. For research on the transmission characteristics of EM waves in a magnetized plasma sheath, some scholars have developed a transmission model for extremely high-frequency (EHF) waves in the hypersonic plasma sheath under the influence of dipole magnetic fields from a mechanical perspective, and calculated the attenuation effect of EM waves [12]. Nevertheless, this research does not include a representation of how EM waves are transmitted from the polarization domain, and there is a deficiency in the examination of the phase of EM waves. For the ionosphere (which is also a typical magnetized plasma structure), Lawrence analyzed the influence of the ionosphere on EM waves, particularly focusing on the Faraday rotation (FR) effect [13]. Bickel and Bates developed a polarization scattering matrix model considering the FR effect, and proposed the effective compensation method [14]. Gail established a polarization scattering matrix model, which includes factors such as FR effect, channel amplitude and phase imbalance, crosstalk, and noise, and gave a method for inverting the Faraday rotation angle (FRA) using fully polarimetric data [15]. For the fully polarimetric radar system, the influence of the FR effect on the back-projection of each polarimetric channel and the correlation coefficient between channels is analyzed [16]. At the same time, the compensation technology used to address the background ionospheric effect on spaceborne SAR has also been studied extensively [17,18,19]. Similarly, the magnetized plasma sheath subjected to the geomagnetic field will also distort the polarization characteristics of the fully polarimetric radar signals, which could lead to failures in target detection and recognition when using spaceborne and missile-borne platforms. However, little research has been undertaken so far.
In this article, the distortion of polarization characteristics in the L-band fully polarimetric radar subjected to the magnetized plasma sheath is analyzed systematically. Based on the distribution of the geomagnetic field and the Appleton–Hartree (A-H) formula, the refractive index of the magnetized plasma sheath is derived. Relying on the phase screen model, two main errors, the polarization deflection (PD) and the amplitude attenuation, are derived and analyzed quantitatively. The corresponding error models of the PD and the amplitude attenuation are established, respectively. Considering the variations in geomagnetic field intensity, radar frequency, electron density, and collision frequency, a set of rules outlining the influence of magnetized plasma sheath on radar echo is presented, supported by quantitative results. Meanwhile, PD inversion at the specific frequency is discussed in detail, where the radar angular frequency is approximately numerically equal to the collision frequency. Finally, the distortions of polarization characteristics on the L-band fully polarimetric radar system are analyzed based on the scattering matrix. The remainder of this article is organized as follows: In Section 2, the phase screen model is introduced to describe the typical distribution of the plasma sheath, and the status of the geomagnetic field is also presented. In Section 3, the polarimetric error model for radar echoes subjected to the magnetized plasma sheath is established, and the distortion of polarization characteristics in the fully polarimetric radar is analyzed. In Section 4, the simulations and analyses with real SAR data are presented. The performance and problems of the proposed method and previous related studies are discussed in detail in Section 5. The follow-up research is also presented in this section. Finally, the conclusions are drawn in Section 6.

2. Basics of Magnetized Plasma Sheath

2.1. Geomagnetic Environment of Plasma Sheath

When the hypersonic reentry vehicle returns to Earth, the plasma coating on its surface will inevitably be affected by the geomagnetic environment [20]. At present, the International Geomagnetic Reference Field (IGRF) model is generally used to describe the geomagnetic field. In Figure 1, the global distributions of the geomagnetic field at different altitudes (20 km, 50 km, and 100 km, the typical height range of the reentry object [21]) on 1 December 2023 are presented according to the IGRF-13. The geomagnetic field intensity ranges from 21,200 nT to 66,400 nT. From this, it is evident that the geomagnetic field intensity changes rapidly in the horizontal direction, but more gradually with height.

2.2. Typical Parameters of Plasma Sheath

The plasma sheath consists of a large number of free electrons, ions, and neutral particles. If a single charged particle is disturbed, significant group effects are generated due to the interaction between charged particles [22]. When the radar wave propagates through the plasma sheath, the movement of charged particles is altered. This alteration results in significant group effects, leading to a significant coupling effect between the radar wave and the plasma sheath, ultimately affecting the propagation characteristics of the radar wave [22]. During this process, two characteristics of charged particles need to be considered: the distribution density and the dynamic characteristics.
For the plasma sheath, the distribution of charged particles can be described as the electron density [23]. For example, the Total Electron Content (TEC) (the integration of the electron density along the propagation path) is often used to analyze the influence of charged particles on radar waves, especially for the ionosphere. It can be expressed as the integral of electron density along the propagation path of radar waves. Moreover, due to the rapid movement of electrons, the dynamic characteristics of charged particles can be described by the collision frequency between electrons [23]. The collision frequency is higher, the group effect is stronger, and the impact on radar wave propagation is more serious. According to the experimental data from RAM-C [24], the classic ranges of electron density and collision frequency for the plasma sheath are 1016–1019 m−3 and 0.1–40 GHz, respectively, which are also used as references in subsequent discussions.

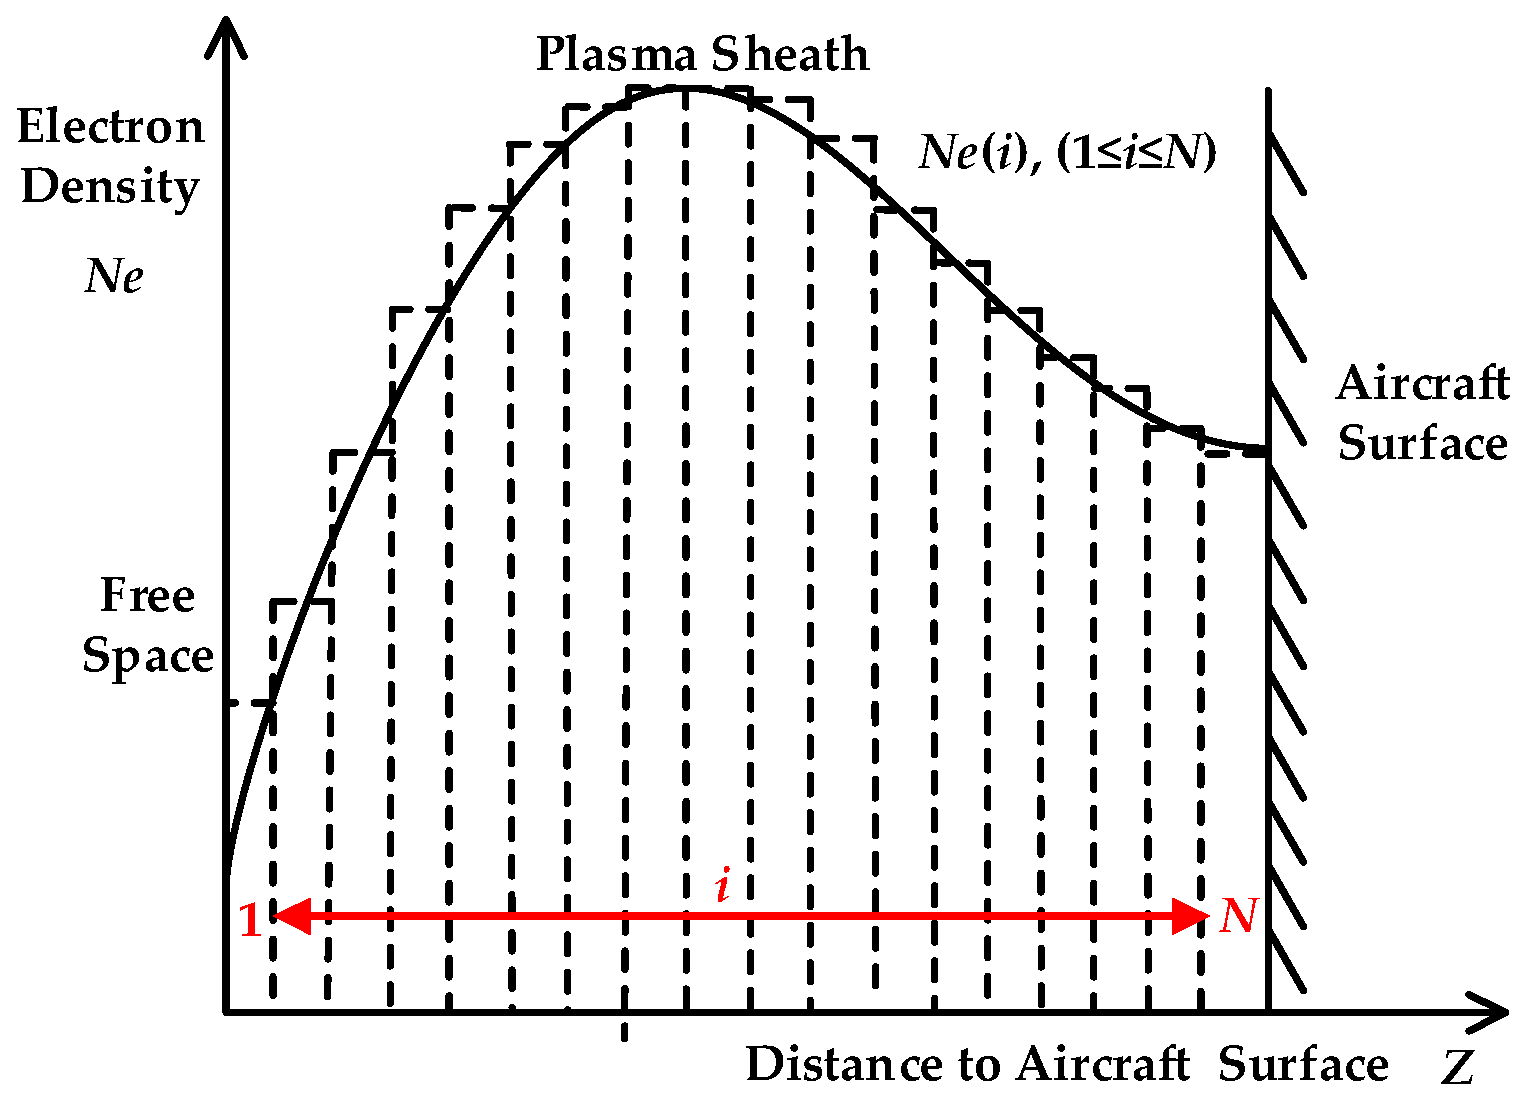
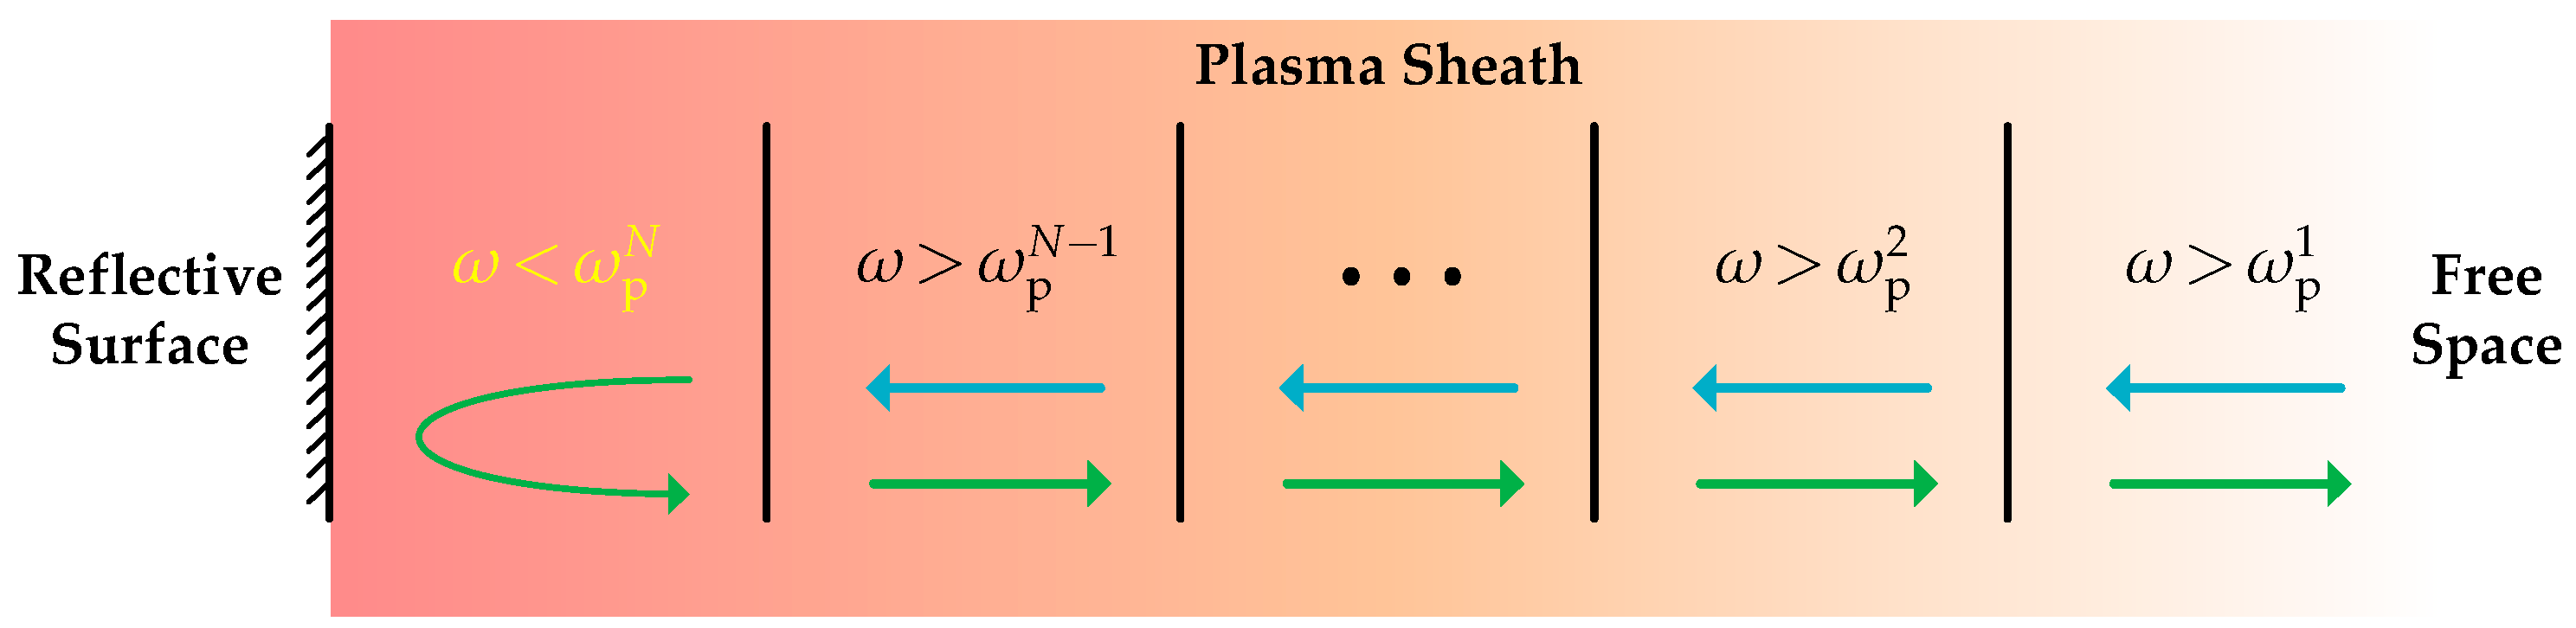
2.3. Phase Screen Model in Non-Uniform Plasma Sheath

According to research by the National Aeronautics and Space Administration (NASA), the electron density of a plasma sheath perpendicular to the hypersonic target surface approximately follows a double Gaussian distribution [25]. For the convenience of analysis, a multi-layer uniform structure is used to simulate a general non-uniform plasma sheath (assumed as N layers in Figure 2). With delamination, each layer of the plasma is approximately homogeneous.
The electron density of the ith plasma sheath is N e ( i ) , where the corresponding characteristic frequency ω p ( i ) is expressed as
ω p ( i ) = N e ( i ) e 2 m ε 0
where e is the electron charge, m is the electron mass, and ε 0 is the dielectric constant in a vacuum.
The relationship between the characteristic frequency and the electron density is shown in Figure 3.
For this non-uniform structure, the phase screen model is applied as an emerging method to describe the thin-layered plasma [26]. The idea of the phase screen method is first applied to simplify complex non-uniform structures by approximating with discrete uniform structures. Based on this, the piecewise integral method is used to analyze the propagation characteristics of radar waves in a non-uniform plasma sheath [27]. To date, the phase screen method has been utilized to analyze the impact of hypersonic turbulence on SAR imaging within the plasma sheath [28]. When the propagation of radar signals is simplified using this method, the integral process is treated as a discrete summation, which can significantly reduce computational complexity [29].
Figure 4 illustrates the propagation of the radar wave in a layered plasma sheath. If the radar frequency is higher than the plasma characteristic frequency of this layer, the wave is penetrable; otherwise, the wave is reflected.

3. Polarimetric Error Model of Fully Polarimetric Radar in Magnetized Plasma Sheath

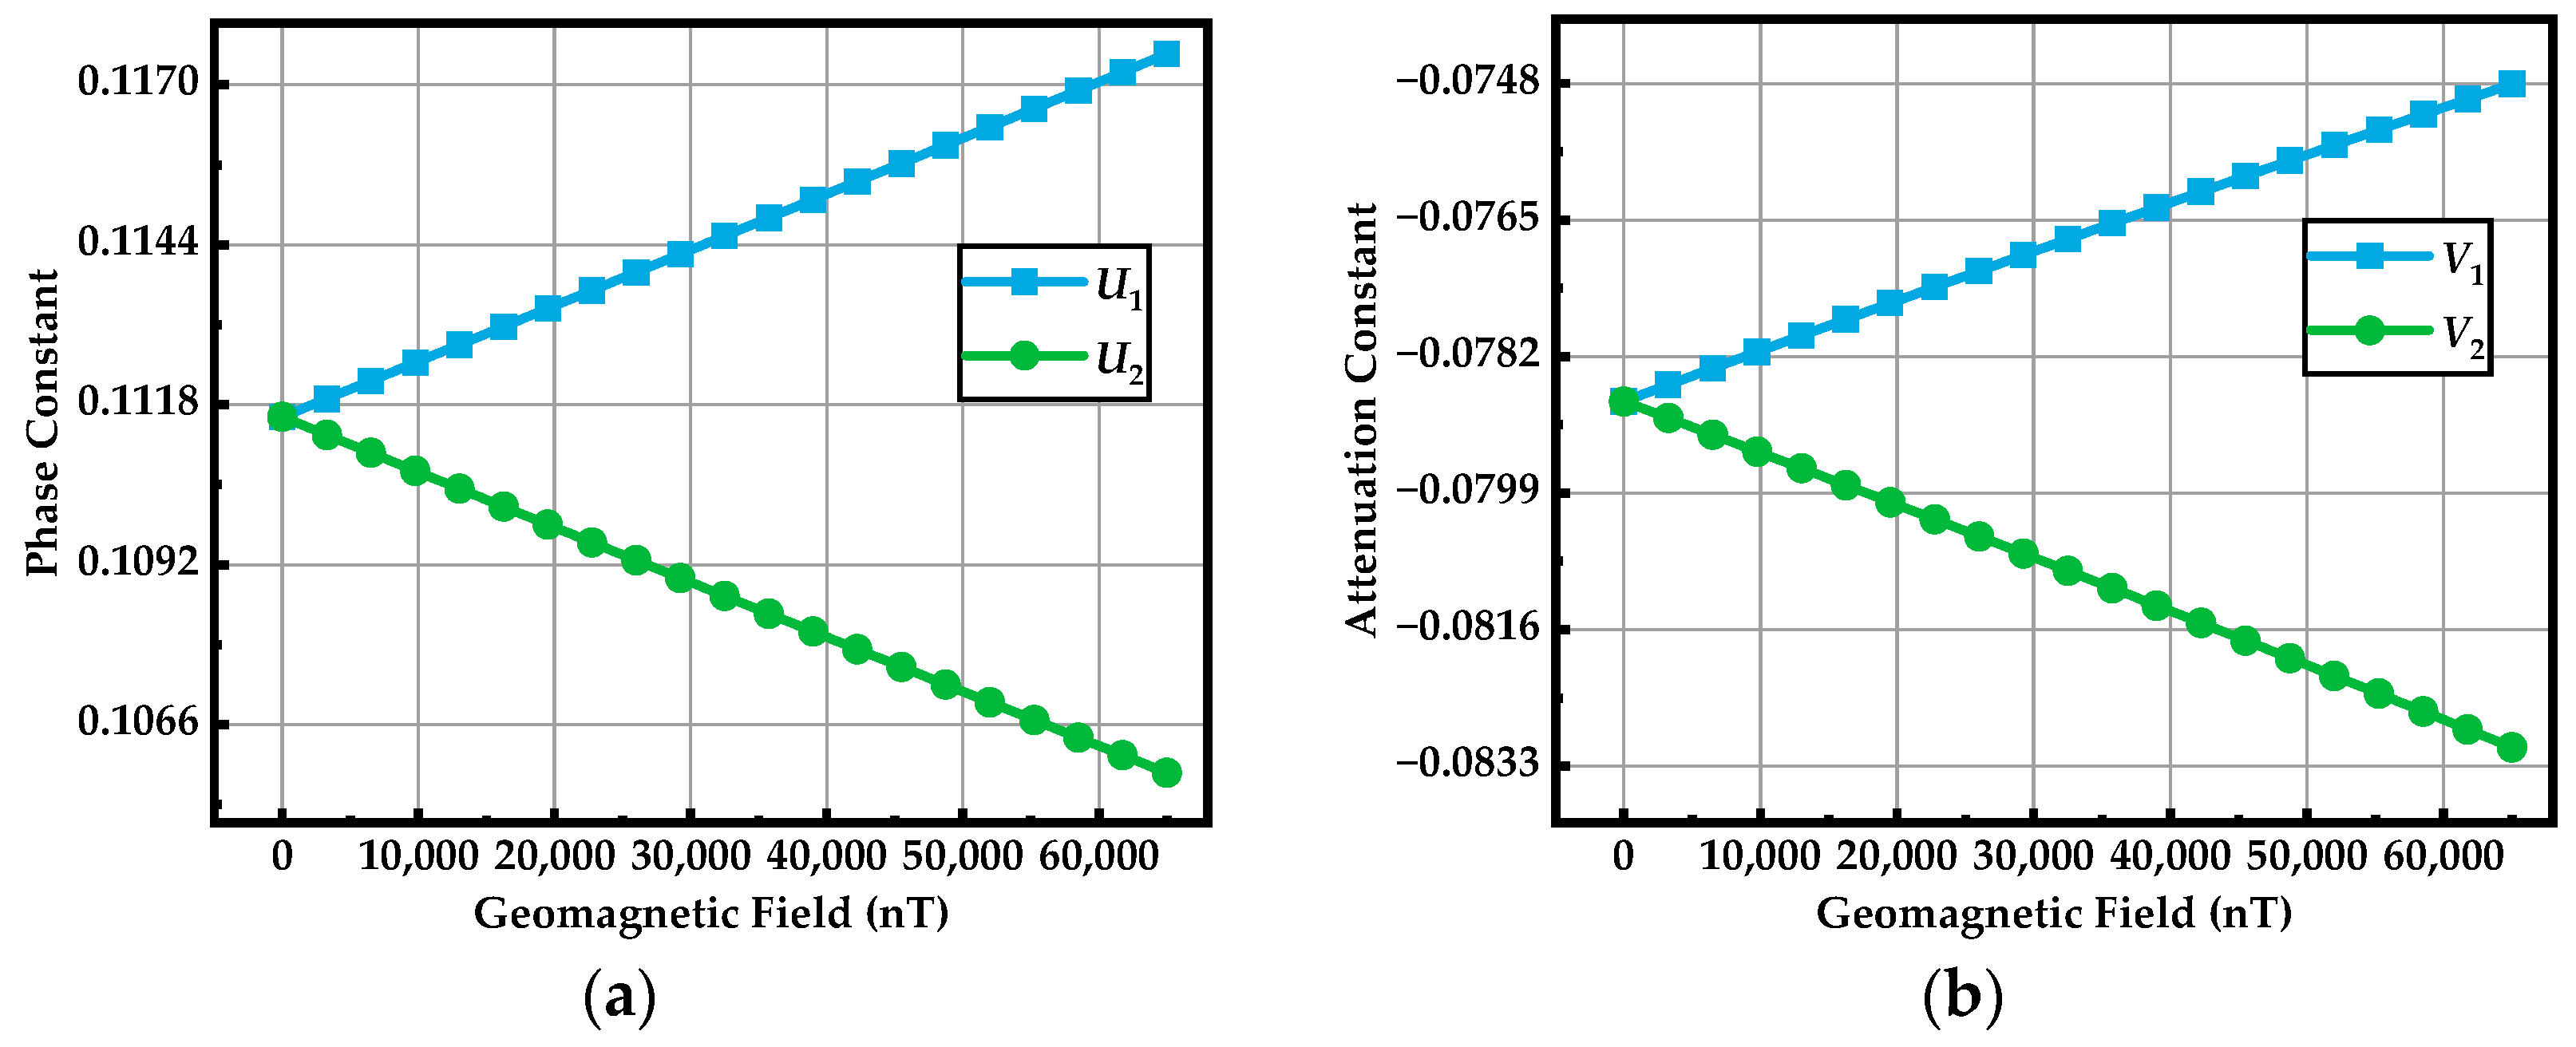
3.1. Characteristic of EM Wave in Magnetized Plasma Sheath

A linearly polarized EM wave can be expressed as [30]
E = a x E m e j k n z
where a x is the unit vector of the electric field, Em is the amplitude, k is the propagation constant, n is refractive index, and z is the propagation distance.
In a magnetized environment, based on the theory of magnetic ions, a linearly polarized EM wave will be decomposed into two circularly polarized EM waves with opposite rotation directions of the electric field vector, namely, the left- and right-handed circularly polarized waves [28]. Therefore, Equation (2) is rewritten as
E = E L + E R = 1 2 E m a x + j a y e j k n + z + 1 2 E m a x j a y e j k n z
where a y is the unit vector perpendicular to a x , E L and E R are the left- and right-handed circularly polarized waves, respectively, and n+ and n are the refractive indices of E L and E R , which are determined by the following A-H formula [31]
n 2 = 1 X U Y 2 sin 2 θ 2 U X ± Y 4 sin 4 θ 4 U X 2 + Y 2 cos 2 θ
where X = ω p 2 / ω 2 , Y = ω H / ω , U = 1 j υ / ω , θ is the angle between the geomagnetic field and the propagation direction, ω is the angular frequency, ω H = e B / m is the electron cyclotron angular frequency, B is the geomagnetic field intensity, and υ is the collision frequency. The positive and negative signs correspond to the left- and right-handed circularly polarized waves, respectively.
According to the angle between the applied geomagnetic field and the direction of EM wave propagation, the types of propagation can be quasi-transverse and quasi-longitudinal [32]. For the Very-High-Frequency (VHF) band and above, the propagation of radar waves in the plasma sheath can be regarded as quasi-longitudinal propagation [13]. In other words, the L-band EM wave in the magnetized plasma sheath is quasi-longitudinal propagation. Therefore, Equation (4) can be expressed as
n 2 = 1 X U ± Y = 1 ω p 2 ω 2 1 j υ ω ± e B m ω
According to Equation (5), the magnetic splitting phenomenon [31] results in two distinct values of the refractive index, corresponding to left- and right-handed circularly polarized waves, respectively. For convenience, let p+ = 1 + eB/(), p = 1 − eB/(), q = −υ/ω, after which Equation (5) becomes
n + 2 = p + 2 + q 2 X p + p + 2 + q 2 + j X q p + 2 + q 2
n 2 = p 2 + q 2 X p p 2 + q 2 + j X q p 2 + q 2
Considering that the magnetized plasma sheath is not a left-handed material, the real part of the refractive index cannot be negative [33]. Therefore, only two solutions with positive real parts are considered, which are
n + = U 1 + V 1 j
n = U 2 + V 2 j
where U1 and U2 are the phase constants, and V1 and V2 are the attenuation constants.
U 1 = p + 2 + q 2 X p + 2 + X q 2 + p + 2 + q 2 X p + 2 p + 2 + q 2
U 2 = p 2 + q 2 X p 2 + X q 2 + p 2 + q 2 X p 2 p 2 + q 2
V 1 = X q 2 p + 2 + q 2   1 p + 2 + q 2 X p + 2 + X q 2 + p + 2 + q 2 X p +
V 2 = X q 2 p 2 + q 2 1 p 2 + q 2 X p 2 + X q 2 + p 2 + q 2 X p
Referring to Equations (8) and (9), the geomagnetic field will result in doubled values of the phase constants and attenuation constants. The difference becomes more obvious with the increase in geomagnetic field intensity, as shown in Figure 5.
Substituting n+ and n, the circularly polarized waves, respectively, become
E L = 1 2 E m a x + j a y e j k n + z = 1 2 E m e k V 1 z a x + j a y e j k U 1 z
E R = 1 2 E m a x j a y e j k n z = 1 2 E m e k V 2 z a x j a y e j k U 2 z
So, Equation (3) becomes
E = E L + E R = 1 2 E m e k V 1 z a x + j a y e j k U 1 z + 1 2 E m e k V 2 z a x j a y e j k U 2 z
According to Equation (16), the phase constants (U1, U2) and attenuation constants (V1, V2) determine the phase and the amplitude of EM waves, respectively.

3.2. Polarization Deflection

The differential phase-path length for the left- and right-handed circularly polarized waves results in a rotation of the plane of polarization. This PD for one-way propagation is equal to one half of the differential phase path [34], expressed as
Ω one - way = 1 2 path k U 1 k U 2
For the plasma sheath, based on the phase screen model, the integral process of PD along the propagation path can be expressed in the form of discrete summation as [35]
Ω one - way = 1 2 i N k U 1 ( i ) L i k U 2 ( i ) L i = π λ i N U 1 ( i ) U 2 ( i ) L i
where Ω one - way is the one-way deflection angle of the linearly polarized wave after passing through the plasma sheath, N is the number of the plasma sheath’s layers, Li is the thickness of each layer, U1(i) and U2(i) are phase constants of the ith layer, respectively, c is the velocity of light, and λ is the wavelength.
Since the L-band radar wave propagates in the plasma sheath in a two-way manner, the final PD can be expressed as
Ω two - way = 2 π λ i N U 1 ( i ) U 2 ( i ) L i
It can be inferred that the geomagnetic field influences the phase constants, whose growth amplifies the difference of (U1U2), resulting in the increasement of the PD. Meanwhile, the increasing electron density reinforces the difference of (U1U2), while the radar frequency and collision frequency play the opposite roles. Combing the typical parameters of the plasma sheath and geomagnetic field, the relationship between the mentioned parameters and the PD for L-band radar shown in Figure 6 proves the analyses results.
According to the error models and numerical results above, we can conclude that:
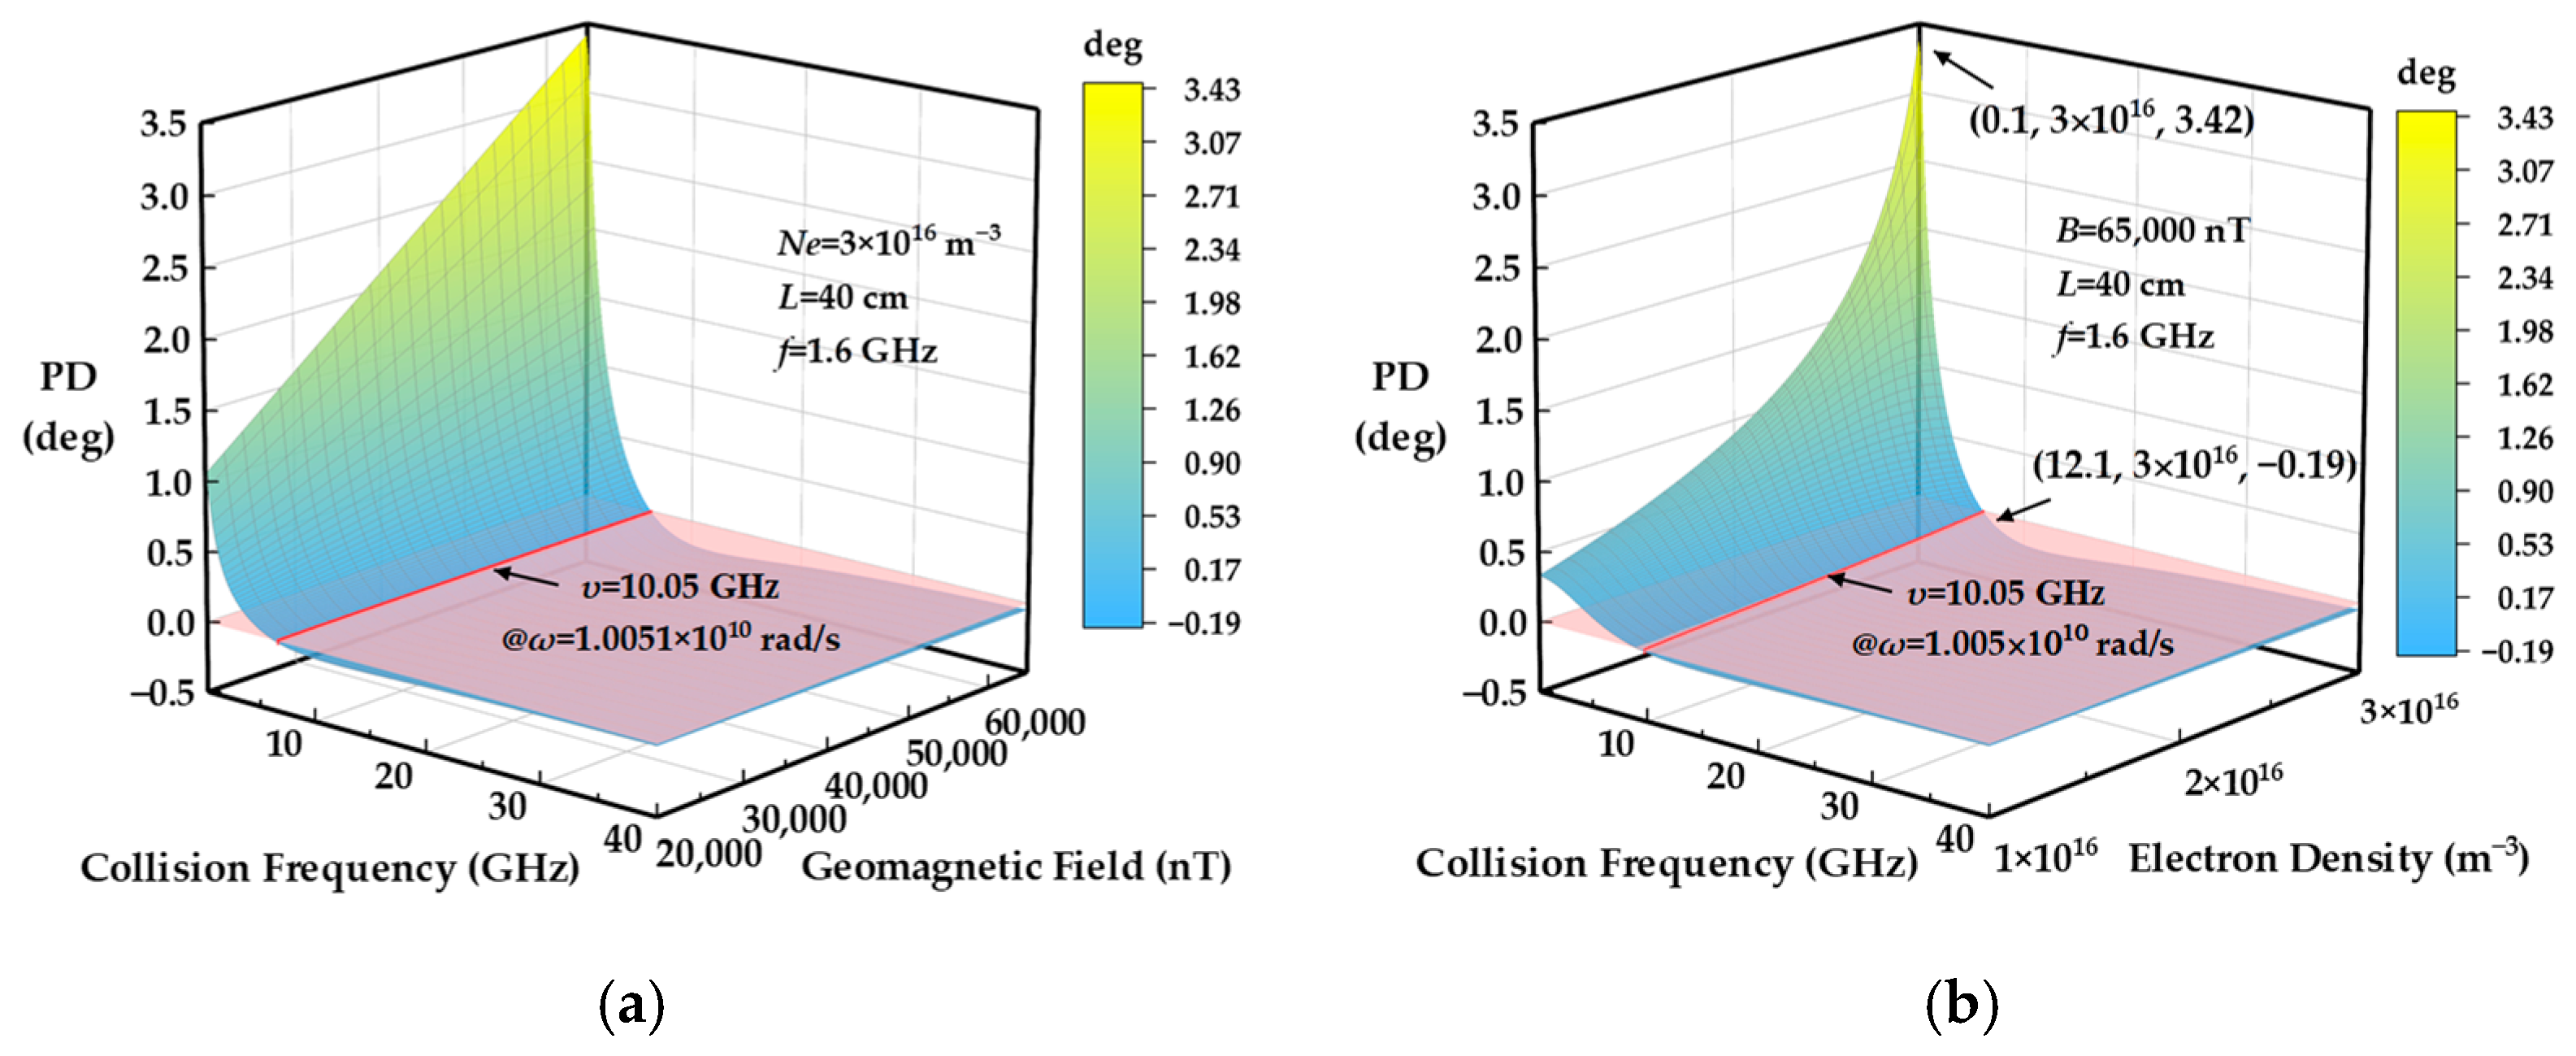
  • The necessary condition for the PD is the existence of the geomagnetic field, and the PD value is approximately linearly proportional to the geomagnetic field intensity;
  • The electron density, collision frequency, and radar frequency will affect the PD. As the electron density increases, the rate of change for PD increases, indicating that electron density gradually becomes the dominant factor influencing PD. In the “A–B” section of the curve (in Figure 6b), the electron density increases by 1 × 10¹⁶ m−3, and the PD increases by 0.57°. In the “B–C” section (in Figure 6b), the electron density increases by 1 × 10¹⁶ m−3, and the PD increases by 2.52°, which is 4.4 times that of the “A–B” section. The collision frequency plays the opposite role. When the collision frequency increases from 0.2 GHz to 0.4 GHz, PD decreases by 0.38° (in Figure 6c). However, when it increases from 0.6 GHz to 0.8 GHz, PD only decreases by 0.35° (in Figure 6c). Obviously, PD is also very sensitive to radar frequency. When the radar frequency is 1.6 GHz, the PD is approximately 4 times that when the radar frequency is 2 GHz, as illustrated at points D and E in Figure 6d.

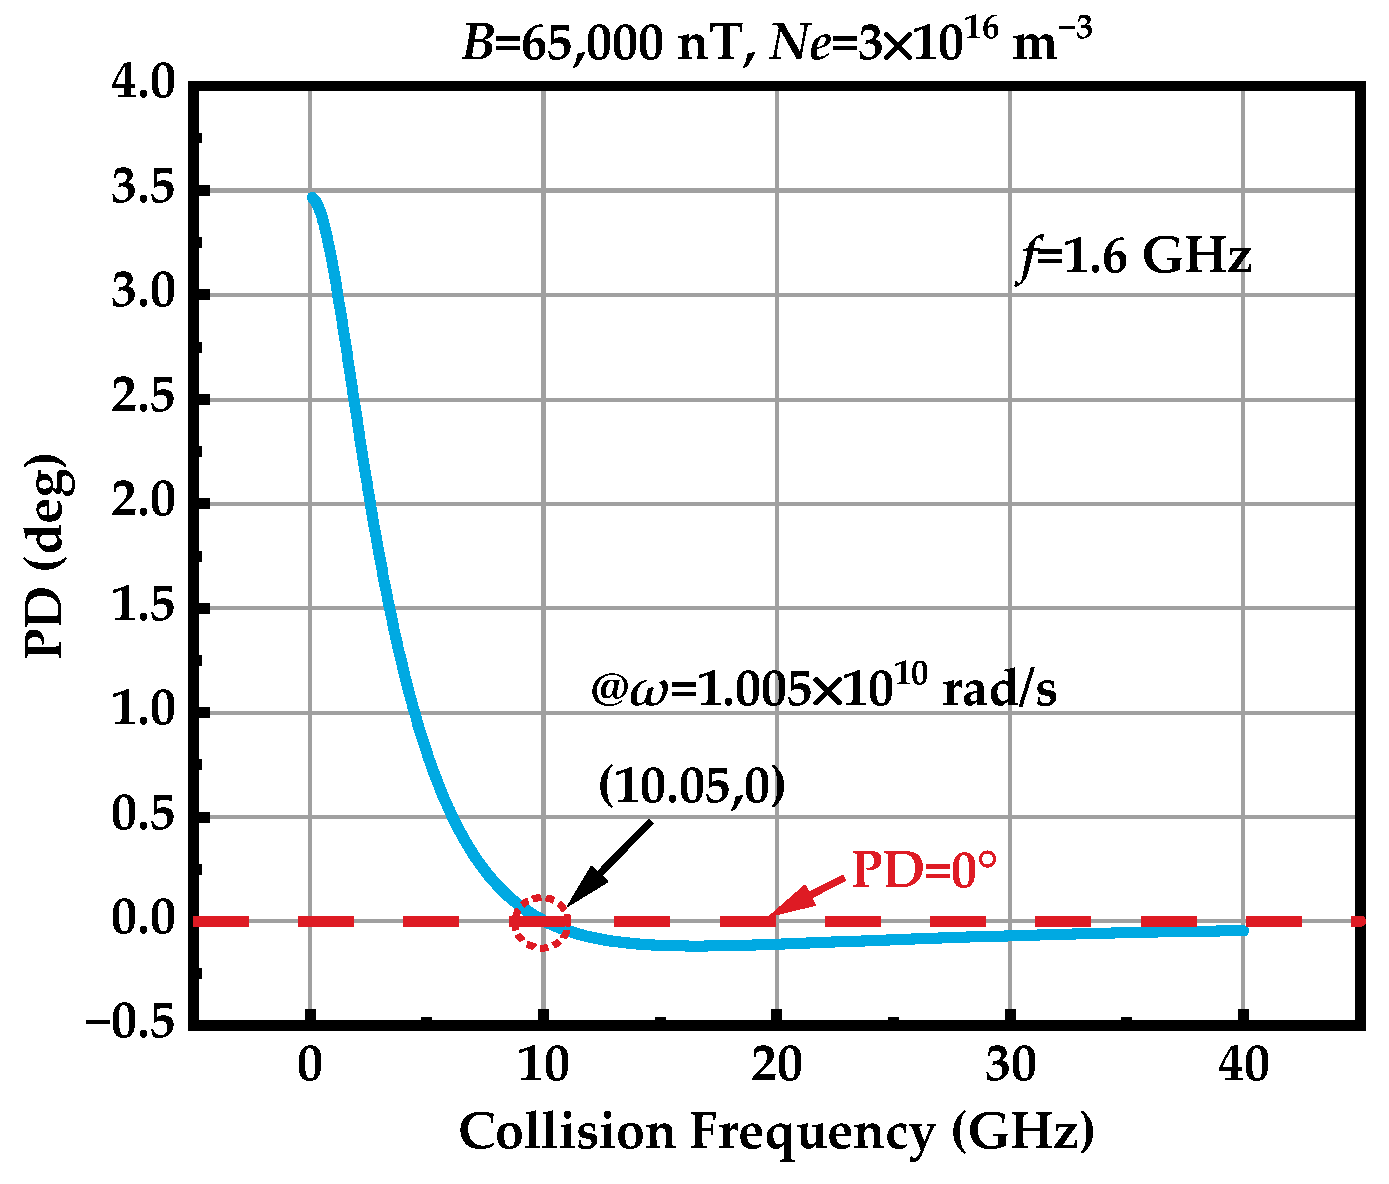
3.3. PD Anomaly Phenomenon

In most cases, the PD follows the rules outlined above. However, when the radar angular frequency is numerically close to the plasma sheath collision frequency, the polarization characteristics of the radar waves will be affected abnormally.
As shown in Figure 7, when the radar angular frequency (specifically for the L-band radar at 7.54 × 10⁹ rad/s) is numerically within the range of the collision frequency for the typical plasma sheath (0.1 GHz to 40 GHz), a PD anomaly phenomenon occurs when they are approximately equal. According to Equations (10) and (11), when the relative magnitude relation of the phase constant for two circularly polarized waves changes, the direction of PD reverses, leading to variations in the polarization characteristics. The PD anomaly is not a normal situation where the magnetic field or the electron density is zero, but a special occurrence happening under the high collision frequency in the plasma sheath. As to the heterogeneous texture of the plasma sheath, the collision frequency could be continuously changed. Thus, the PD could experience variation from positive to negative (or the other way around), through the frequency where “zero PD” happens. Alternatively, even the integral result of PD during the entire propagation through the plasma sheath may be zero, because of the counteraction.
In order to give the analytic expression of radar frequency where PD happens, the specific derivation process is provided in Appendix A. From this, the radar angular frequency of the PD anomaly point can be calculated as
ω zero _ PD = m 2 υ 2 + e 2 B z 2 m 2
It can be seen that ω zero _ PD is related to the collision frequency and the geomagnetic field. Because the electronic charge is very small, the effect of the geomagnetic field on the frequency point at the PD anomaly point can be ignored.
Similarly, the PD anomaly phenomenon also occurs at the S-band (the corresponding radar angular frequency is 1.885 × 10¹⁰ rad/s) and the C-band (with a corresponding radar angular frequency of 3.142 × 10¹⁰ rad/s). However, if the radar angular frequency (such as X-band at 5.652 × 10¹⁰ rad/s) exceeds the typical range of the collision frequency (0.1 GHz to 40 GHz), this phenomenon will disappear.
Thus, the PD anomaly phenomenon happens due to the existence of larger collision frequency (according the Equation (20) and simulation result in Figure 8), which is a typical characteristic of the plasma sheath, quite different from that in the ionosphere.

3.4. PD Attenuation

As shown in Figure 9, the original electric field intensity is E org . When the radar wave penetrates the plasma sheath and returns after reflection, the electric field intensity of the echo affected by PD is changed to E eff _ PD . Considering the antenna pattern, only part of the echo can be received by the antenna expressed as E rec _ PD , which means the receiving energy of the echo decreases.
E rec _ PD = E eff _ PD cos Ω two - way
So, the PD attenuation is calculated as
D p = 20 log 10 E org E rec _ PD = 20 log 10 E org E eff _ PD cos Ω two - way = 20 log 10 cos Ω two - way
Referring to Equation (22), the presence of the geomagnetic field causes the PD, which further leads to the amplitude attenuation of the signal. As shown in Figure 10, PD attenuation occurs due to the presence of the geomagnetic field and increases accordingly. When the geomagnetic field increases from 30,000 nT to 60,000 nT, the PD attenuation changes by 400%. However, its absolute value is quite small, only 0.0132 dB, when the geomagnetic field intensity is 60,000 nT.

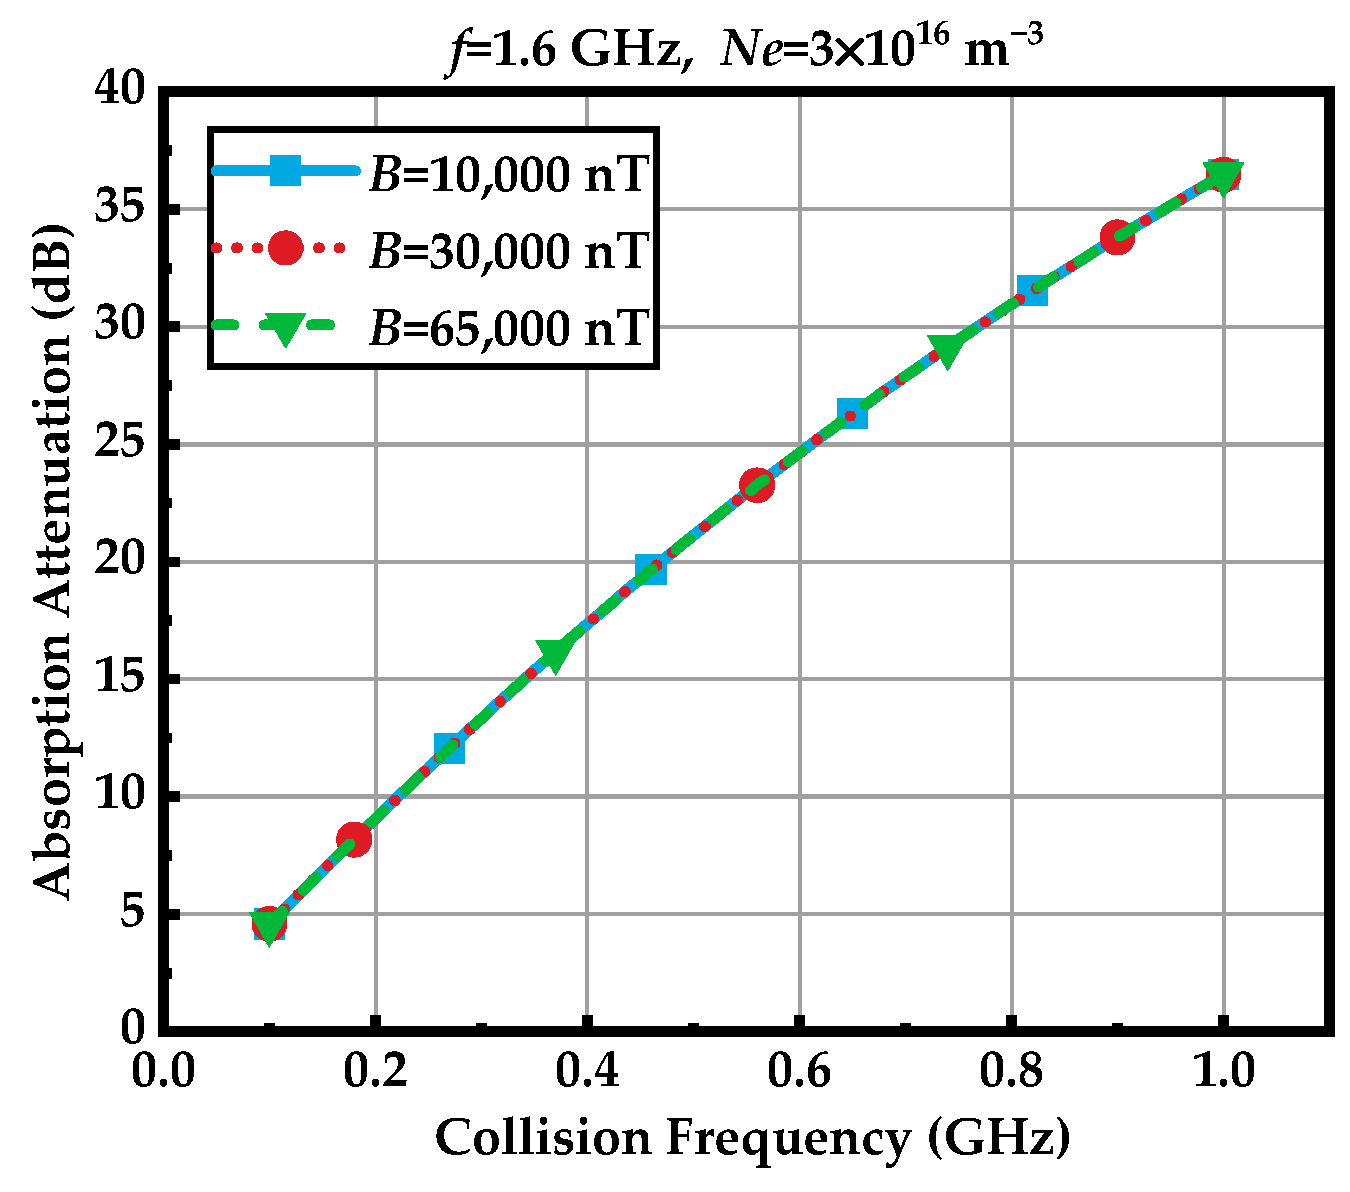
3.5. Absorption Attenuation

Due to the magnetic particle splitting, as shown in Equation (16), the absorption attenuation is determined by both attenuation constants (V1 and V2), indicating that the electric field vector is influenced by the geomagnetic field.
Equation (16) is reorganized as
E = E x + E y
where E x is the electric field vector in the x direction, and E y is the electric field vector in the y direction
E x = a x 1 2 E m e k V 1 z e j k U 1 z + e k V 2 z e j k U 2 z = a x 1 2 E m e k V 1 z cos ( k U 1 z ) + e k V 2 z cos ( k U 2 z ) j a x 1 2 E m e k V 1 z sin ( k U 1 z ) + e k V 2 z sin ( k U 2 z )
E y = a y 1 2 E m e k V 1 z e j π 2 k U 1 z + e k V 2 z e j π 2 k U 2 z = a y 1 2 E m e k V 1 z sin ( k U 1 z ) e k V 2 z sin ( k U 2 z ) + j a y 1 2 E m e k V 1 z cos ( k U 1 z ) e k V 2 z cos ( k U 2 z )
So, the amplitudes of E x and E y are derived as
A x = Re E x 2 + Im E x 2 = 1 4 E m 2 e k V 1 z cos ( k U 1 z ) + e k V 2 z cos ( k U 2 z ) 2 + 1 4 E m 2 e k V 1 z sin ( k U 1 z ) + e k V 2 z sin ( k U 2 z ) 2 = 1 2 E m e 2 k V 1 z + e 2 k V 2 z + 2 e k z V 1 + V 2 cos k U 1 z k U 2 z = 1 2 E m e 2 k V 1 z + e 2 k V 2 z + 2 e k z V 1 + V 2 cos Ω single
A y = Re E y 2 + Im E y 2 = 1 4 E m 2 e k V 1 z sin ( k U 1 z ) e k V 2 z sin ( k U 2 z ) 2 + 1 4 E m 2 e k V 1 z cos ( k U 1 z ) e k V 2 z cos ( k U 2 z ) 2 = 1 2 E m e 2 k V 1 z + e 2 k V 2 z 2 e k z V 1 + V 2 cos k U 1 z k U 2 z = 1 2 E m e 2 k V 1 z + e 2 k V 2 z 2 e k z V 1 + V 2 cos Ω sin gle
where Ω single represents the PD of a single layer.
Then, the absorption attenuation DA can be expressed as
A E eff - real = A x 2 + A y 2 = 1 2 E m 2 e 2 k V 1 z + 2 e 2 k V 2 z
D A = 20 log 10 E m A E eff - real = 20 log 10 2 e 2 k V 1 z + e 2 k V 2 z
where A E eff - real is the amplitude of the affected echo.
Finally, the two-way multi-layer absorption attenuation expression is
D A s u m = 2 i = 1 N D A ( i )
where D A ( i ) is the absorption attenuation at the ith layer of the plasma sheath.
According to Equation (30), it can be found that the absorption attenuation is independent of the PD but related to the attenuation constants (V1 and V2). According to Figure 5, the geomagnetic field has a nearly negligible effect on the attenuation constant. Thus, the absorption attenuation is less affected by the geomagnetic field. Based on Equations (12) and (13), the absorption attenuation is still primarily influenced by plasma parameters (such as electron density and collision frequency) and radar frequency. As shown in Figure 11, it can be found that when the geomagnetic field is 10,000 nT, 30,000 nT, and 65,000 nT, respectively, the absorption attenuation remains almost unchanged, while the collision frequency has a significant impact, which conforms to the analyses above.

3.6. PD Error Model for Fully Polarimetric Radar

For spaceborne SAR system, the radar waves emitted by the antenna will penetrate the plasma sheath before reaching the hypersonic aircraft. The reflected radar waves will pass through the plasma sheath again and be received by the antenna. Therefore, the two-way PD effect needs to be considered. For the fully polarimetric system with linearly polarized signal without loss of generality, the measured scattering matrix M can be expressed as
M = F S F
where
M = M HH M HV M VH M VV ,   F = cos Ω one - way sin Ω one - way sin Ω one - way cos Ω one - way ,   S = S HH S HV S VH S VV
F is the PD matrix, Ω one - way is the one-way PD, and S** and M** are the true and measured scattering components of each polarimetric channel, respectively (the subscript “**” represents HH, HV, VH or VV).
Specifically, each channel affected by the PD is derived as
M HH = cos 2 Ω one - way S HH sin 2 Ω one - way S VV M HV = S HV + 1 2 sin 2 Ω one - way S HH + S VV M VH = S HV 1 2 sin 2 Ω one - way S HH + S VV M VV = cos 2 Ω one - way S VV sin 2 Ω one - way S HH
According to Equation (33), the PD will interfere with the data of each polarimetric channel, leading to amplitude and phase errors for different polarimetric channels.

4. Simulations and Analyses

According to the typical status of the geomagnetic field from IGRF-13 and the plasma sheath parameters based on RAM-C data [24], simulations of PD and amplitude attenuation are carried out according to the experimental parameters in Table 1.

4.1. PD

The existence of the geomagnetic field is essential for PD, and factors such as electron density, collision frequency, and radar frequency will influence the PD. According to the simulation results in Figure 12, for an L-band radar system, the PD approximately linearly changes with the geomagnetic field intensities of 20,000 nT, 40,000 nT, and 60,000 nT, resulting in values of 1.05°, 2.11°, and 3.16°, respectively. Considering the different geomagnetic fields, the geomagnetic field and the PD increase proportionally (see points A, B and C in Figure 12a), reflecting the linear influence of the geomagnetic field on the PD. With the increase in electron density, the rate of change of the PD gradually increases. When the electron density expands 2.5 times at a 65,000 nT value of the geomagnetic field, the PD increases by about 4.48 times. While the electron density expands 3 times, the PD increases about 10.36 times. For the collision frequency, when it changes from 0.2 GHz to 0.6 GHz, the PD reduces to 76% of the original, whereas when it changes from 0.6 GHz to 1 GHz, the PD reduces to 74% of the original. As the collision frequency increases, the impact on the PD becomes more severe. Besides the geomagnetic field and the plasma sheath, the radar frequency also plays an important role in the PD. It can be seen that the increase in radar frequency reduces the PD (see Figure 12d). For L-band radar signals, the PD can reach 3.42° at polar regions, which is a quite comparable or more severe interference compared with the FR effect derived from the ionosphere.

4.2. PD Anomaly Phenomenon

According to the analysis in Section 3, the PD anomaly phenomenon is related to the collision frequency and the geomagnetic field, and the relationships between them are presented as follows.
The red curve in Figure 13 represents the PD anomaly line. When the radar angular frequency is 1.005 × 10¹⁰ rad/s, the collision frequency corresponding to the PD anomaly is 10.05 GHz, which conforms to the analytical result in Equation (20). As shown in Figure 13, although the geomagnetic field and the electron density change, the radar frequency at the PD anomaly point remains constant. This observation aligns with the analysis indicating a weak correlation between the geomagnetic field and the electron density. As the collision frequency increases from 0.1 GHz to 40 GHz (from the tail to the stagnation point of the plasma sheath), the PD changes from 3.42° to −0.19° (where B = 60,000 nT, Ne = 3 × 10¹⁶ m−3). This indicates a shift in polarization characteristics from left- to right-handed at various plasma sheath locations of the reentry target, which is significant for follow-up applications such as target detection and recognition.

4.3. PD Attenuation

In Figure 14a, when the geomagnetic field at points A, B, and C increases linearly (from 20,000 nT to 60,000 nT), the rate of change for the PD attenuation accelerates gradually, because the relationship between PD attenuation and PD follows a logarithmic and cosine function, as shown in Equation (22). With the increase in the radar frequency and the collision frequency, the rate of change of the PD attenuation decreases, while the electron density has the opposite effect. In general, the PD attenuation is minimal, no more than 0.02 dB for L-band radar, even when the geomagnetic field reaches 65,000 nT. Therefore, when the polarization characteristics of fully polarimetric radar are distorted, the PD attenuation is negligible.

4.4. Absorption Attenuation

According to the analysis above, the electron density, the collision frequency, and the radar frequency are still the main factors affecting the absorption attenuation. The corresponding simulation results are as follows.
In Figure 15, the absorption attenuation increases with the electron density and the collision frequency, and decreases with the radar frequency. As the electron density increases from 1 × 10¹⁶ m−3 to 3 × 10¹⁶ m−3, the absorption attenuation changes from 0.44 dB to 4.58 dB, approximately. By contrast, the impact of the collision frequency on the absorption attenuation is more pronounced. In Figure 15b, as the collision frequency increases from 0.1 GHz to 1 GHz, the absorption attenuation increases from 4.58 dB to 36.48 dB. Compared with the PD attenuation, the absorption attenuation has a more significant impact on radar signals. Different from the electron density and the collision frequency, the absorption attenuation decreases with the increase in the radar frequency at the L-band, ranging from 4.58 dB to 1.11 dB, while the absorption attenuation is minimally affected by the geomagnetic field. When the geomagnetic field is 25,000 nT, 40,000 nT, and 65,000 nT, representatively, the absorption attenuation curves almost overlap.

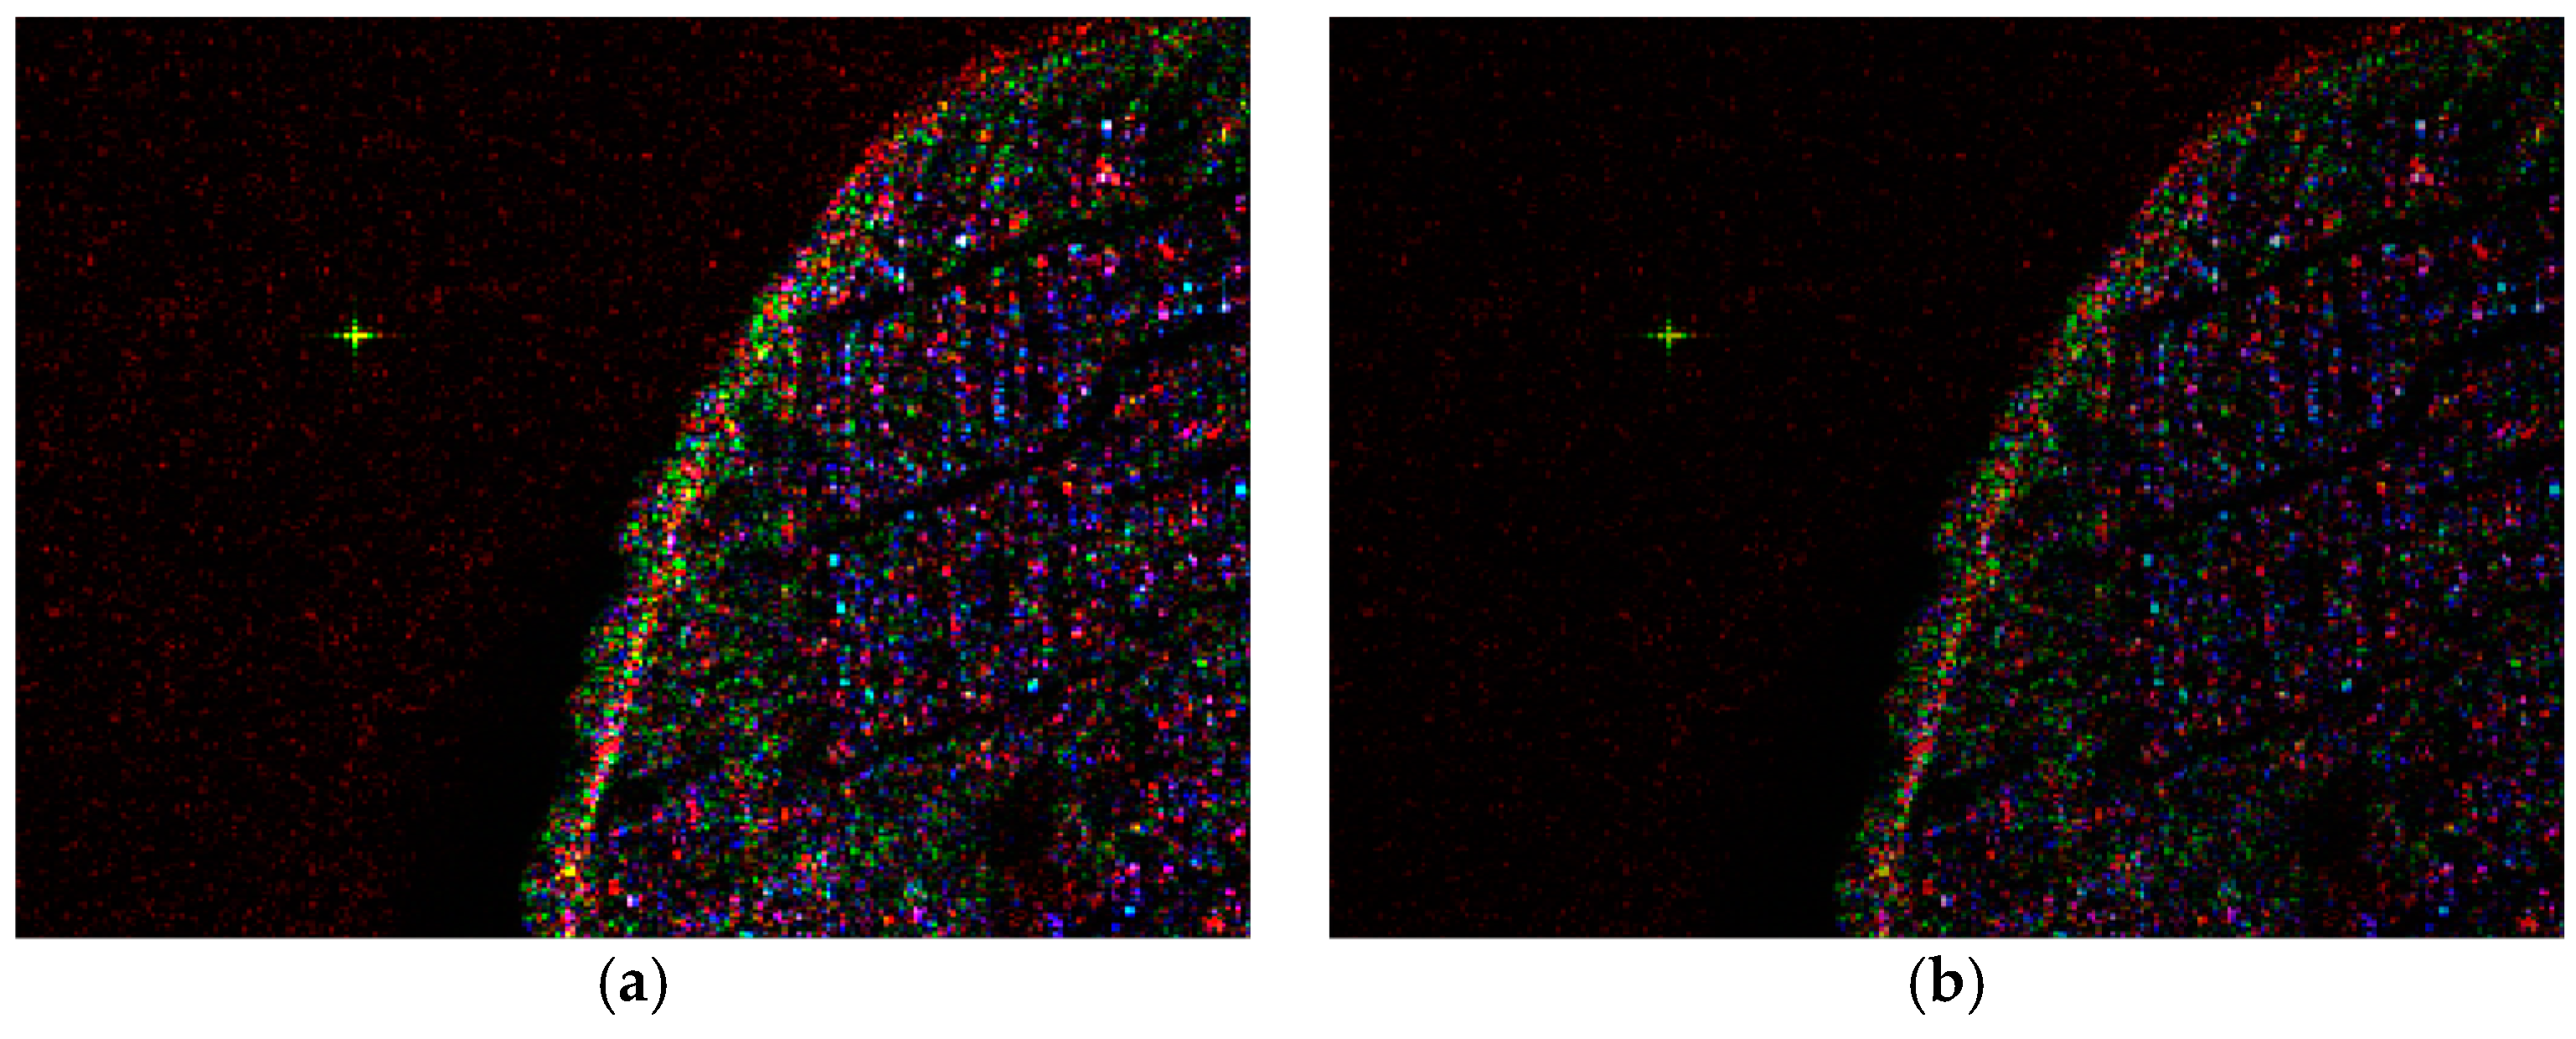
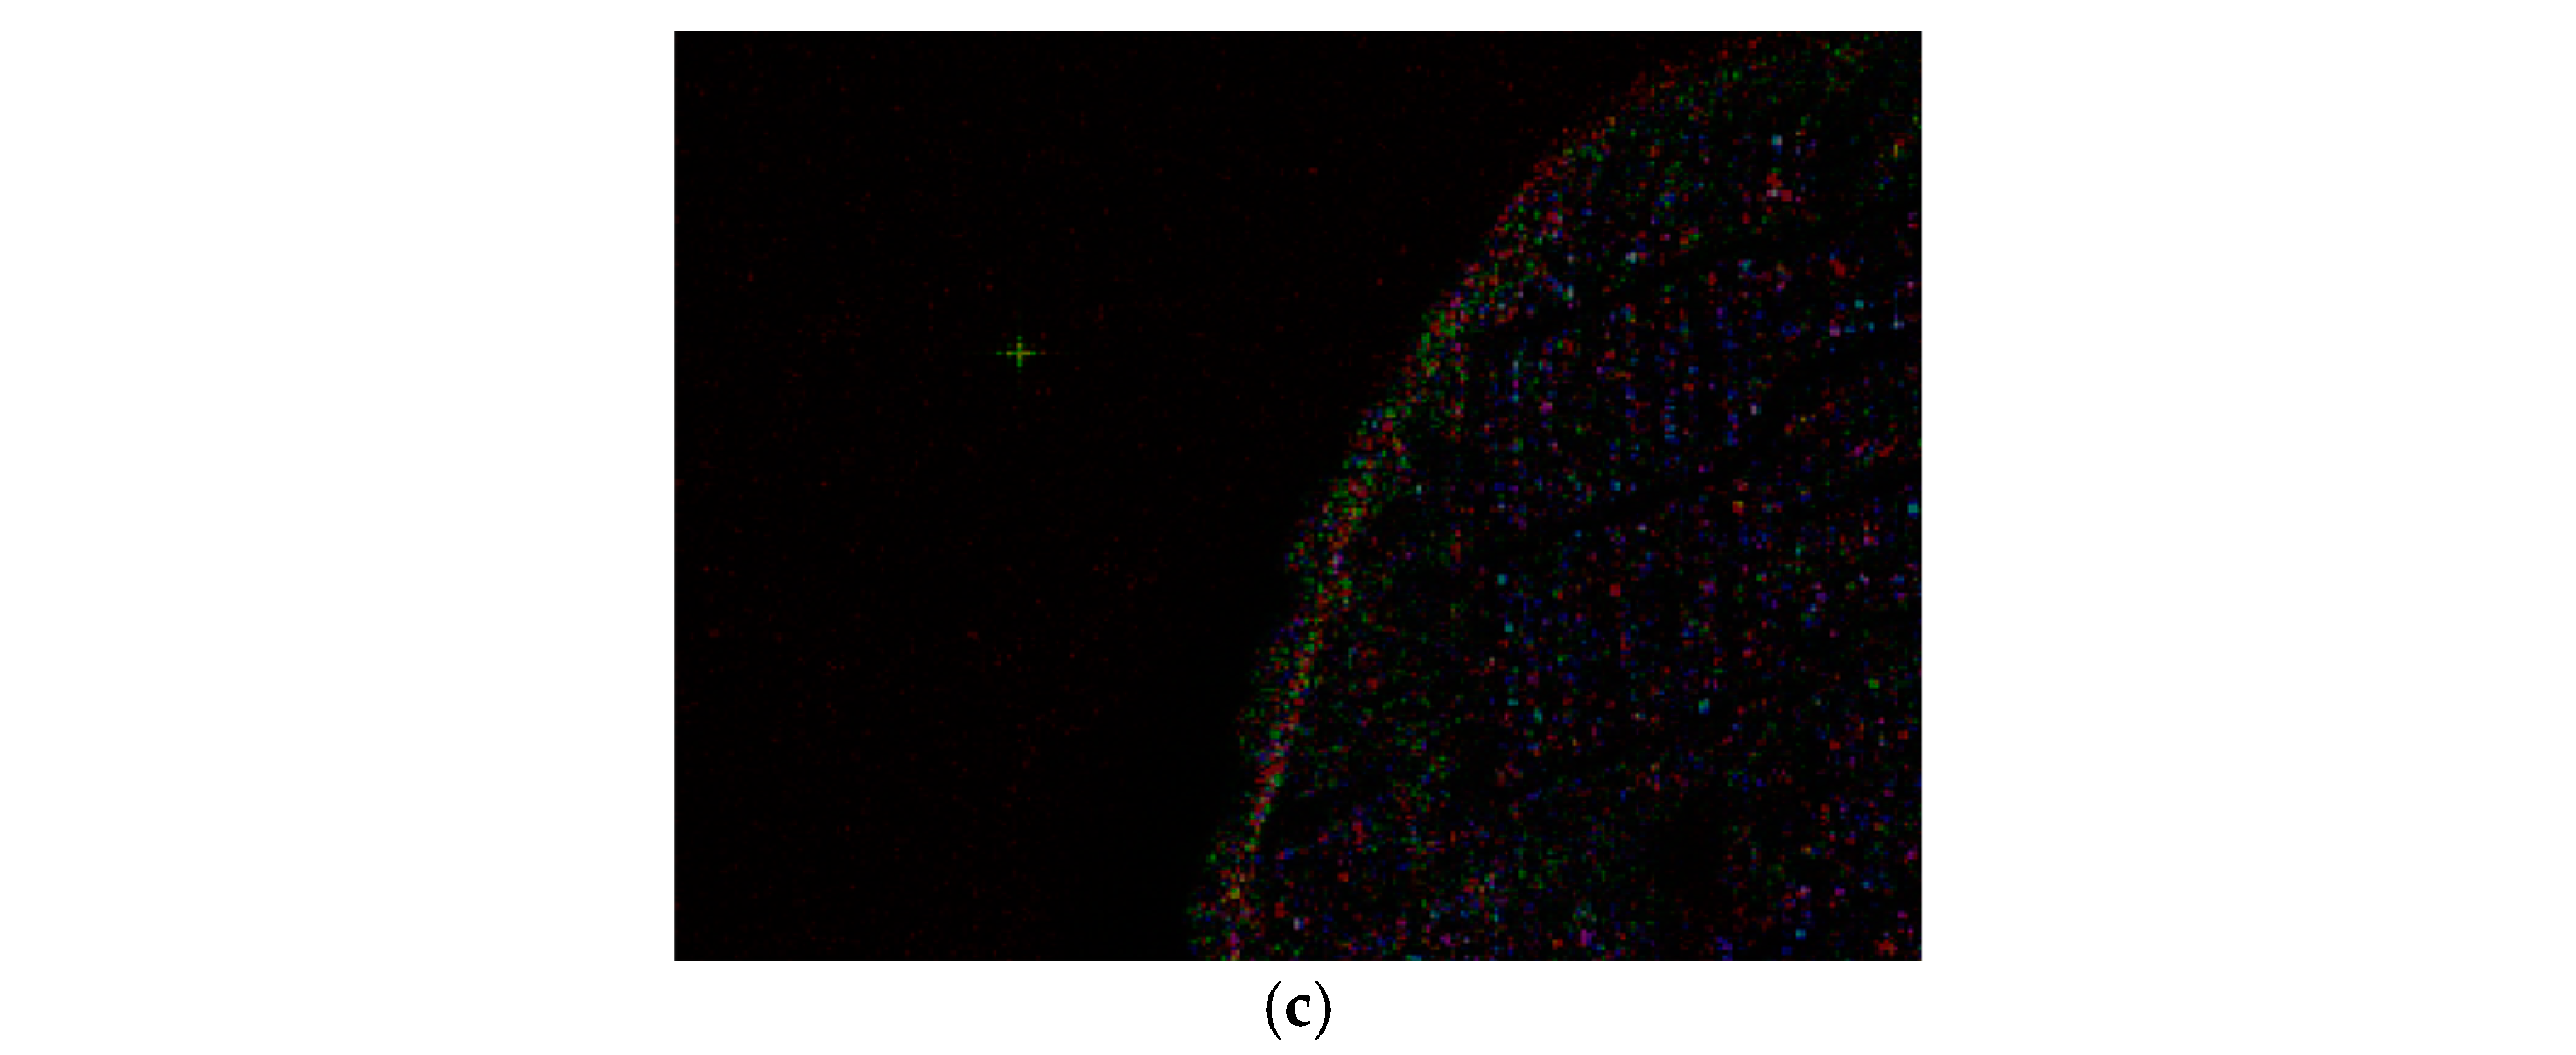
4.5. Polarization Distortions for Fully Polarimetric Radar

With the real SAR data from the ALOS-2 at Vancouver, fully polarimetric images are used as the background scene with regard to the hypersonic target. The coastal area is chosen here specifically to simulate a weak background situation (such as ISAR detection) and a complicated background (such as SAR observation). According to the perception of the scattering properties for the artificial rigid target, the hypersonic target could be presented as isolated scattering centers in the image [36], which are related to the radar system, the imaging geometry and the target itself. Besides this, the imaging results should have no effect on the analyses of polarization characteristics. Thus, a point target is simulated in the image as an alternative to simulate the hypersonic target as a scattering center for simplicity (which is pointed out with the yellow box in Figure 16).
Considering the real scenario of hypersonic target detection, several factors will affect the imaging result of the target (such as the power and the resolution of the radar, the geometry and the movement of the target and the clutter background). In order to be in better accordance with the actual circumstance, the scattering intensity of the point target is limited to simulate the weak scattering feature and the influence of the background. Meanwhile, a high-order phase error is also introduced to the point target to simulate the defocusing caused by the high speed and mobility. Note that the defocusing will not affect the polarization characteristics, which has no effect on the follow-up analyses regarding polarization distortions.
According to the simulation parameters in Table 2, PD and PD attenuation are introduced to each polarimetric channel of the point target according to the error model established in Section 3.6. The two situations with Ne = 2.5 × 10¹⁶ m−3 and Ne = 3 × 10¹⁶ m−3 representing different statuses of the plasma sheath are considered. PD and PD attenuation are here about 1.48° and 0.003 dB (situation 1) and 3.42° and 0.016 dB (situation 2), respectively, based on the Equations (19) and (21). Meanwhile, the absorption attenuation is calculated according to Equation (29) as 1.97 dB (situation 1) and 4.58 dB (situation 2), and introduced to each channel. Based on Equation (33), the fully polarimetric data affected by PD, PD attenuation, and absorption attenuation are obtained. It should be noted that the PD, PD attenuation and absorption attenuation are only added to the hypersonic target instead of the whole image, because only the hypersonic target is covered by the plasma sheath.
In order to better evaluate the impacts of polarization distortions, Structural Similarity (SSIM) is introduced here to evaluate the difference between the affected image and the original image, as [37]
SSIM = 2 μ p μ q + h 1 2 σ pq + h 2 μ p 2 + μ q 2 + h 1 σ p 2 + σ q 2 + h 2
where μp and μq represent the average values of image p and image q, σp and σq represent the standard deviation of images p and q, and σpq represents the covariance of images p and q. h1 and h2 are stability constants. The SSIM ranges from 0 to 1, with a higher value indicating greater similarity between images.
Figure 16 shows the original images of four channels for the fully polarimetric radar, which clearly displays the artificial point target, the coastal contours, and the land-based buildings. To better show polarization scattering features, Pauli decomposition is used here to display the fully polarimetric images with the pseudo-color synthesis in Figure 17. Comparing the results in Figure 17a–c, it can be seen that the magnetized plasma sheath will lead to significant distortions of polarization scattering characteristics, as well as a serious loss of image details. The SSIM values of affected SAR images with different electron densities (situation 1 with Ne = 2.5 × 10¹⁶ m−3 and situation 2 with Ne = 3 × 10¹⁶ m−3) are presented in Table 3. With the increase in the electron density, the SSIM of four channels decreases seriously, especially for the cross-polarimetric channels, which conforms to the interferences from the co-polarimetric channels HH and VV with inherently higher energies. Moreover, Figure 18 and Figure 19 display the range and azimuth profiles of the artificial target under different electron densities. It is obvious that the errors from the magnetized plasma sheath cause distortions in each polarimetric channel, especially regarding the responses to the different polarizations for targets, while the imaging quality remains good.
To better illustrate the effect of electron density and collision frequency on the fully polarimetric image, we also give the values of SSIM shown in Figure 20. For the L-band radar, the SSIM of fully polarimetric SAR images decreases as the electron density and the collision frequency increase. Specifically, the impact of collision frequency is more pronounced. When the collision frequency is 1 GHz, the SSIM seriously decreases with the change in the electron density, which illustrates the severe influence of the magnetized plasma sheath with a higher collision frequency. The SSIM values of each of the polarimetric channels are very similar, consistent with the trend indicated in Table 3.

5. Discussion

As to the previous research into the analysis of polarization characteristics related to plasma sheaths in radar signals, on one hand, the studies have conducted modeling and analyses based on non-magnetic assumptions, such as Niu et al.’s research [38], which is actually inconsistent with the actual EM environment for the radar echo in a plasma sheath, especially for spaceborne SAR platforms; on the other hand, most of the studies have treated the propagation of radar waves in the plasma sheath equivalently to its propagation in lossy microwave transmission lines, thereby performing a substitution with model equivalence, known as the equivalent transmission line method. Based on this, the change in the polarization characteristics is indirectly inferred from the comparison of the axial ratio for the incident and transmitted waves, which is essentially a kind of time-frequency analysis [11]. Thus, these studies struggle to describe the concrete behavior of the echo within the plasma, let alone the influence of the magnetic field. Currently, in terms of the research on the transmission characteristics of EM waves under a magnetized plasma sheath, some scholars have established a model for the propagation of EHF waves in a hypersonic plasma sheath under the influence of a dipole magnetic field, and analyzed the attenuation characteristics of EHF waves [12]. However, this method does not include the polarization domain transmission model of radar waves, and it also lacks analyses of the radar wave phase.
Moreover, in the related research on radar waves in magnetized plasma environments, the FR in the ionosphere has drawn much attention. Although the electron density of the ionosphere is low, the transmission distance of radar waves can reach about 1000 km, resulting in an FRA up to about 4° [39]. By contrast, the PD of the L-band radar signal is at the same level compared with the FR in the ionosphere, so it also needs to be taken into consideration. However, the analyses of FR as well as the corresponding error model are all based on the assumption that the collision frequency is ignored, using the simplified A-H formula in [13]. Owing to the neglect of the collision frequency, the PD in the ionosphere is greatly simplified, as it is only determined by the radar frequency, the magnetic field and the TEC (integration of the electron density) [15]. Besides this, its absorption into the radar waves is also weak and can be ignored [40]. On the contrary, a more common error model of the polarization for a radar signal with a magnetic field is proposed in our article, which use the original A-H formula without any approximation (see Equation (4)). Based on this, the PD, PD attenuation and absorption attenuation are derived accurately. Besides this, the PD anomaly is also discussed specifically, based on the proposed PD model, which is never mentioned in the existing research, but is quite essential in practice. Of course, the traditional FR could also be calculated using the proposed PD model (shown in Figure 21 as below). The two curves are essentially coincident, which proves the universality of the proposed method.
Relatively speaking, the analysis proposed in this article has established a precise propagation model of the radar signal in a magnetized plasma sheath, with the global geomagnetic field distribution at the flight altitude where the plasma sheath appears based on the IGRF model. According to Maxwell’s equations, the A-H formula, and the phase screen model, the propagation process of the radar echo in the plasma sheath is accurately modeled. There is no equivalent substitute during the modeling process. Then, the polarization distortions, including PD, PD attenuation, absorption attenuation, as well as the PD anomaly phenomenon, are analyzed respectively. Based on the RAM-C data, the experimental simulations found that the PD can reach 3.42° at the L-band, which is close to the FRA value caused by the ionosphere [39]. Furthermore, a measured scattering model incorporating the influence of PD is established for the L-band fully polarimetric radar to better describe the influence of the magnetized plasma sheath on each polarimetric channel. Finally, the simulation analyzes the effect of the magnetized plasma sheath on the polarization characteristics of the L-band fully polarimetric radar using various sets of experimental parameters.
Combing the theoretical analyses and simulations, it is found that the influence of the magnetized plasma sheath on the L-band fully polarimetric radar is comparable to that derived from the ionosphere. One of the differences from the ionosphere is that the collision frequency of the plasma sheath is much higher, leading to a significantly greater absorption attenuation effect. Therefore, for the space–air link analysis of the spaceborne SAR signal, the influence of the magnetized plasma sheath is extremely important and quite different from the ionosphere. Under this circumstance, traditional compensation methods for correcting polarimetric errors in fully polarimetric radar that only consider the ionosphere could fail. This article provides a more practical and comprehensive analysis of polarization distortions subject to the plasma environment for fully polarimetric radar systems.
In addition, there are still some problems that need further consideration:
(1)
The primary issue is that this article only considers the polarization distortions for an L-band fully polarimetric radar system. For spaceborne or missile-borne SAR platforms, various frequency bands are utilized, such as S-band, C-band, X-band, etc., and the variable states of the vehicle could also broaden the range of parameters for the plasma sheath, including the electron density, the collision frequency, the thickness, etc. To provide a more comprehensive and precise analysis of the impact of a magnetized plasma sheath on fully polarimetric radars, we are now conducting additional experiments considering various radar bands and a wider range of plasma sheath parameters.
(2)
The other problem concerns the error correction methods used for a fully polarimetric SAR subject to a magnetized plasma sheath. The error model established in this article and the simulation experiment provide a good reference for the follow-up compensation. For now, the decoupling processing is the key point for us, which aims to better separate the errors from the plasma sheath and the ionosphere. Based on this, the development of a comprehensive compensation process benefited by autofocus and TEC inversion is in progress.
(3)
Although the L-band fully polarimetric radar data are specifically discussed here, the derived error models of polarization distortions (including the PD, PD attenuation, and absorption attenuation) are suitable for any frequency band. In order to better illustrate the influence of the magnetized plasma sheath more intuitively, the L-band is chosen here, and the ALOS-2 data are used. This result can be compared directly with the situation in the ionosphere (another typical magnetized plasma environment, or a specific case of our proposed analyses). In future, the multiband data of a fully polarimetric radar system will be considered, such as the GaoFen-3, the latest spaceborne C-band SAR launched in 2016, with rich working modes and high resolution. According to the typical parameters of the plasma sheath, PD and absorption attenuation are both approximately less than 0.1° and 0.1 dB, respectively (lower than the L-band system), when considering the parameters of the GaoFen-3 satellite. This conforms to the analyses presented in Section 3, which highlight an inverse relationship between the polarization distortions and the radar frequency. For now, we are applying for access to the fully polarimetric SAR data of the GaoFen-3 from the Land Satellite Remote Sensing Application Center, and experiments and analyses are currently in progress.

6. Conclusions

In this article, the polarization characteristic distortions for L-band fully polarimetric radar subjected to a magnetized plasma sheath are analyzed systematically. Based on the phase screen model and the A-H formula, this study analyzes the influence of the geomagnetic field on the refractive index. It establishes a polarimetric error model for radar signals and analyzes the distortion of polarization characteristics for a fully polarimetric radar. Utilizing the proposed models, simulations are conducted based on the typical parameters of the geomagnetic field, the plasma sheath, and the radar frequency to qualitatively analyze their effects on the PD and PD attenuation. The necessary condition for their existence is the presence of the geomagnetic field, and their values are approximately linearly proportional to the intensity of the geomagnetic field. The geomagnetic field can also influence the attenuation constant. The absorption attenuation is primarily influenced by the electron density, the collision frequency, and the radar frequency. According to measured data of the plasma sheath provided by NASA, for L-band radar signals, when the geomagnetic field is 65,000 nT, the PD can reach 3.42°, and the PD attenuation can reach 0.014 dB. The increasing electron density expands the PD and the PD attenuation, while the radar frequency and the collision frequency play the opposite roles. In addition, the special phenomenon of a PD anomaly happens at a specific frequency, where the radar angular frequency is approximately numerically equal to the collision frequency, resulting in a variation in the polarization characteristics. For a fully polarimetric radar, the PD will cause errors in the measured scattering matrix, leading to a change in the polarization characteristics. Simulations with the real SAR data from ALOS-2 demonstrate the polarization distortions on radar echoes and the fully polarimetric images. Furthermore, comparisons between the analyses in this article and the previous research are discussed in detail, and the preliminary work of follow-up research is also presented.

Author Contributions

Conceptualization and methodology, W.G.; software and formal analysis, W.G. and Y.H.; validation, F.S.; writing—original draft preparation, W.G. and Y.H.; writing—review and editing, P.X. and F.S. All authors have read and agreed to the published version of the manuscript.

Funding

This research was supported by the Natural Science Basic Research Program of Shaanxi (Grant No. 2024JC-YBQN-0718) and the GuangDong Basic and Applied Basic Research Foundation (Grant No. 2023A1515110465).

Data Availability Statement

The fully polarimetric SAR data from ALOS-2 are not publicly available due to privacy restrictions.

Conflicts of Interest

The authors declare no conflicts of interest.

Appendix A

In this section, the radar angular frequency at the PD anomaly point is derived. First,
R 1 = p + 2 + q 2 X p + = ω 3 + 2 ω H ω 2 + ω H 2 + v 2 ω ω P 2 ω H + ω ω 3
R 2 = p 2 + q 2 X p = ω 3 2 ω H ω 2 + ω H 2 + v 2 ω ω P 2 ω ω H ω 3
defining the variables as
H 1 = p + 2 + q 2
H 2 = p 2 + q 2
G = x q = ω p 2 υ ω 3
where ω H = e B / m is the electron cyclotron frequency corresponding to B.
So
U 1 = 1 2 H 1 R 1 2 + G 2 + R 1
U 2 = 1 2 H 2 R 2 2 + G 2 + R 2
Figure A1 shows the relative relationships of R 1 2 , R 2 2 and G 2 to the plasma sheath parameters used in this article.
Figure A1. Numerical relationship between R 1 2 , R 2 2 and G 2 and the typical parameters (B = 65,000 nT, f = 1.6 GHz, Ne = 1 × 10¹⁶–3 × 10¹⁶ m−3). (ad) The collision frequencies are 0.1 GHz, 3 GHz, 20 GHz and 40 GHz, respectively.
Remotesensing 16 02061 g0a1
According to the simulation results, it can be seen that R 1 2 and R 2 2 are much larger than G 2 at the L-band. If G is ignored, Equations (A6) and (A7) become
U 1 s = R 1 H 1 = 1 X p + p + 2 + q 2 = 1 N e e 2 ε 0 ω m + e B ω 3 + 2 e B m ω 2 + ω e 2 B 2 + ω υ 2 m 2
U 2 s = R 2 H 2 = 1 X p p 2 + q 2 = 1 N e e 2 ε 0 ω m e B ω 3 2 e B m ω 2 + ω e 2 B 2 + ω υ 2 m 2
Letting U1s = U2s, the analytical relationship of the radar angular frequency and the collision frequency where the PD anomaly phenomenon happens is:
ω zero _ PD = m 2 υ 2 + e 2 B 2 m 2

References

  1. Li, Z.; Zhang, X.; Yang, Q.; Xiao, Y.; An, H.; Yang, H.; Wu, J. Hybrid SAR-ISAR Image Formation via Joint FrFT-WVD Processing for BFSAR Ship Target High-Resolution Imaging. IEEE Trans. Geosci. Remote Sens. 2021, 60, 5215713. [Google Scholar] [CrossRef]
  2. Ding, Y.; Bai, B.; Niu, G.; Li, X.; Liu, Y. A Radar Detection Method of Reentry Target Based on Frequency-Domain Processing. IEEE Trans. Plasma Sci. 2023, 51, 649–659. [Google Scholar] [CrossRef]
  3. Rawhouser, R. Overview of the AF Avionics Laboratory Reentry Electromagnetics Program. In Proceedings of the Entry Plasma Sheath and Its Effects on Space Vehicle Electromagnetic Systems, Hampton, VA, USA, 13–15 October 1970; pp. 3–17. [Google Scholar]
  4. Kong, J.A. Electromagnetic Wave Theory; Wiley: New York, NY, USA, 1986. [Google Scholar]
  5. Liu, Y.; Zhang, X.; Bai, B.; Ding, Y.; Li, X. A Calculation Method of Electromagnetic Wave Reflection in Plasma Sheath Environment. IEEE Trans. Plasma Sci. 2022, 50, 2030–2038. [Google Scholar] [CrossRef]
  6. Shen, F.; Zhang, Z.; Bai, B.; Li, X.; Chen, X.; Liu, Y. Research on the Reflection Characteristics of the Broadband Electromagnetic Wave in Nonuniform Plasma. IEEE Trans. Plasma Sci. 2024, 52, 657–665. [Google Scholar] [CrossRef]
  7. Song, L.; Tan, E.L.; Heh, D.Y.; Bai, B.; Li, X.; Liu, Y. Newton-ADE FDTD Method for Time-Varying Plasma. IEEE T. Microw. Theory 2023, 71, 1447–1457. [Google Scholar] [CrossRef]
  8. Huang, Z.; Feng, M.; Gao, P.; Jiang, X. FDTD Solution for Signal Transmission in Plasma Sheath. In Proceedings of the 2023 International Applied Computational Electromagnetics Society Symposium (ACES-China), Hangzhou, China, 15–18 August 2023; pp. 1–3. [Google Scholar]
  9. Laroussi, M.; Roth, J.R. Numerical Calculation of the Reflection, Absorption, and Transmission of Microwaves by a Nonuniform Plasma Slab. IEEE Trans. Plasma Sci. 1993, 21, 366–372. [Google Scholar] [CrossRef]
  10. Song, L.; Li, X.; Liu, Y. Effect of Time-Varying Plasma Sheath on Hypersonic Vehicle-Borne Radar Target Detection. IEEE Sens. J. 2021, 21, 16880–16893. [Google Scholar] [CrossRef]
  11. Bai, B.; Li, X.; Liu, Y.; Xu, J.; Shi, L.; Xie, K. Effects of Reentry Plasma Sheath on the Polarization Properties of Obliquely Incident EM Waves. IEEE Trans. Plasma Sci. 2014, 42, 3365–3372. [Google Scholar] [CrossRef]
  12. Bai, B.; Zhao, Z.; Yuan, K.; Tang, R.; Deng, X.; Mao, M.; Xiong, J.; Wang, K. Characteristics of EHF Wave Propagation in Hypersonic Plasma Sheaths Magnetized by Dipole Magnetic Fields. Appl. Sci. 2022, 12, 3105. [Google Scholar] [CrossRef]
  13. Lawrence, R.S.; Little, G.C.; Chivers, H.J.A. A Survey of Ionospheric Effects upon Earth-Space Radio Propagation. Proc. IEEE. 1964, 52, 4–27. [Google Scholar] [CrossRef]
  14. Bickel, S.H.; Bates, R.H.T. Effects of Magneto-ionic Propagation on the Polarization Scattering Matrix. Proc. IEEE. 1965, 53, 1089–1091. [Google Scholar] [CrossRef]
  15. Gail, W.B. Effect of Faraday Rotation on Polarimetric SAR. IEEE Trans. Aerosp. Electron. Syst. 1998, 34, 301–307. [Google Scholar] [CrossRef]
  16. Freeman, A.; Saatchi, S.S. On the Detection of Faraday Rotation in Linearly Polarized L-Band SAR Backscatter Signatures. IEEE Trans. Geo Remote Sens. 2004, 42, 1607–1616. [Google Scholar] [CrossRef]
  17. Belcher, D.P. Theoretical Limits on SAR Imposed by the Ionosphere. IET Radar Sonar Navig. 2008, 2, 435–448. [Google Scholar] [CrossRef]
  18. Belcher, D.P.; Rogers, N.C. Theory and Simulation of Ionospheric Effects on Synthetic Aperture Radar. IET Radar Sonar Navig. 2009, 3, 541–551. [Google Scholar] [CrossRef]
  19. Jehle, M.; Frey, O.; Small, D.; Meier, E. Measurement of Ionospheric TEC in Spaceborne SAR data. IEEE Trans. Geosci. Electron. 2010, 48, 2460–2468. [Google Scholar] [CrossRef]
  20. Bittencourt, J.A. Fundamentals of Plasma Physics; Springer: New York, NY, USA, 2004. [Google Scholar]
  21. Ouyang, W.; Jin, T.; Wu, Z.; Deng, W. Study of Terahertz Wave Propagation in Realistic Plasma Sheath for the Whole Reentry Process. IEEE Trans. Plasma Sci. 2021, 49, 460–465. [Google Scholar] [CrossRef]
  22. Grill, A. Cold Plasma Materials Fabrication: From Fundamentals to Applications; Wiley-IEEE Press: Hoboken, NJ, USA, 1994. [Google Scholar]
  23. Dubois, D.F.; Gilinsky, V.; Kivelson, M.G. Propagation of Electromagnetic Waves in Plasmas. Phys. Rev. 1963, 129, 6. [Google Scholar] [CrossRef]
  24. Beck, F.B.; Castellow, S.L.; Swift, C.T.; Thomson, J. RAM C-3 S-band Diagnostic Experiment. NASA Spec. Publ. 1970, 1, 1. [Google Scholar]
  25. Zhou, H.; Li, X.; Liu, Y.; Bai, B.; Xie, K. Effects of Nonuniform Magnetic Fields on the “Magnetic Window” in Blackout Mitigation. IEEE Trans. Plasma Sci. 2017, 45, 15–23. [Google Scholar] [CrossRef]
  26. Ding, Y.; Bai, B.; Gao, H.; Liu, Y.; Li, X.; Mao, Z. Method of Detecting a Target Enveloped by a Plasma Sheath Based on Doppler Frequency Compensation. IEEE Trans. Plasma Sci. 2020, 48, 4103–4111. [Google Scholar] [CrossRef]
  27. Ding, M.; Tong, P.; Wei, Y.; Yu, L. Multiple Phase Screen Modeling of HF Wave Field Scintillations Caused by the Irregularities in Inhomogeneous Media. Radio Sci. 2021, 56, e2020RS007239. [Google Scholar] [CrossRef]
  28. Li, J.; Yang, S.; Guo, L. Electromagnetic Waves Propagation in Hypersonic Turbulence using Fractal Phase Screen Method. J. Electromagn. Wave 2017, 31, 250–262. [Google Scholar]
  29. Chen, X.; Shen, F.; Liu, Y.; Ai, W.; Li, X. Study of Plasma-Based Stable and Ultra-Wideband Electromagnetic Wave Absorption for Stealth Application. Plasma Sci. Technol. 2018, 20, 065503. [Google Scholar] [CrossRef]
  30. Guru, B.S. Electromagnetic Field Theory Fundamentals; Cambridge University Press: Cambridge, UK, 2004. [Google Scholar]
  31. Taylor, M. The Appleton-Hartree Formula and Dispersion Curves for the Propagation of Electromagnetic Waves through an Ionized Medium in the Presence of an External Magnetic Field. Proc. Phys. Soc. 1934, 46, 245–265. [Google Scholar] [CrossRef]
  32. Pederick, L.; Harris, T.; MacKinnon, A.; Reid, I. Response of a Polarimetric Antenna to Ionospherically Propagated Signals. IEEE Trans. Antennas Propag. 2021, 69, 7846–7854. [Google Scholar] [CrossRef]
  33. Smith, D.R.; Kroll, N. Negative Refractive Index in Left-Handed Materials. Phys. Rev. Lett. 2000, 85, 2933–2936. [Google Scholar] [CrossRef] [PubMed]
  34. Xu, Z.; Wu, J.; Wu, Z. A Survey of Ionospheric Effects on Space-Based Radar. Waves Random Media 2004, 14, 189–273. [Google Scholar] [CrossRef]
  35. Ishimaru, A. Electromagnetic Wave Propagation, Radiation, and Scattering: From Fundamentals to Applications; Wiley: Hoboken, NJ, USA, 2017. [Google Scholar]
  36. Wang, Y.; Zhang, X.; Zhan, X.; Zhang, T.; Zhou, L.; Shi, J.; Wei, S. An RCS Measurement Method Using Sparse Imaging Based 3-D SAR Complex Image. IEEE Antenn. Wirel. Propag. Lett. 2021, 21, 24–28. [Google Scholar] [CrossRef]
  37. Horé, A.; Ziou, D. Image Quality Metrics: PSNR vs. SSIM. In Proceedings of the 2010 20th International Conference on Pattern Recognition, Istanbul, Turkey, 23–26 August 2010; pp. 2366–2369. [Google Scholar]
  38. Niu, G.; Liu, Y.; Bai, B.; Ding, Y.; Song, L.; Li, X. Polarization Scattering Properties of Inhomogeneous Plasma-Covered Metal Plate. IEEE Trans. Plasma Sci. 2023, 51, 1232–1238. [Google Scholar] [CrossRef]
  39. Mohanty, S.; Singh, G.; Yamaguchi, Y. Faraday rotation Correction and Total Electron Content Estimation using ALOS-2/PALSAR-2 Full Polarimetric SAR Data. In Proceedings of the 2016 IEEE International Geoscience and Remote Sensing Symposium (IGARSS), Beijing, China, 10–15 July 2016; pp. 4754–4756. [Google Scholar]
  40. Zawdie, K.A.; Drob, D.P.; Siskind, D.E.; Coker, C. Calculating the Absorption of HF Radio Waves in the Ionosphere. Radio Sci. 2017, 52, 767–783. [Google Scholar] [CrossRef]
Figure 1. Global geomagnetic field distribution maps at altitudes of 20 km, 50 km and 100 km.
Remotesensing 16 02061 g001
Figure 2. Multi-layer uniform model of plasma sheath based on electron density double Gaussian distribution.
Remotesensing 16 02061 g002
Figure 3. Diagram of electron density and plasma characteristic frequency.
Remotesensing 16 02061 g003
Figure 4. Diagram of radar wave transmission in a layered plasma sheath (ω is the radar wave angular frequency, ω p N is the characteristic frequency of the Nth layer plasma sheath).
Remotesensing 16 02061 g004
Figure 5. Effects of geomagnetic field on the phase constants and attenuation constants (Ne = 1 × 10¹⁶ m−3, υ = 0.1 GHz, f = 1.6 GHz). (a) Phase constants; (b) attenuation constants.
Remotesensing 16 02061 g005
Figure 6. Effects of geomagnetic field intensity and plasma sheath parameters on the PD. (a) Geomagnetic field intensity; (b) electron density; (c) collision frequency; (d) radar frequency. The points “A”, “B”, “C”, “D” and “E” represent the typical values of PD which are specified in the text.
Remotesensing 16 02061 g006
Figure 7. PD anomaly phenomenon at L-band.
Remotesensing 16 02061 g007
Figure 8. The PD anomaly phenomenon with different radar frequencies.
Remotesensing 16 02061 g008
Figure 9. Diagram of the PD attenuation.
Remotesensing 16 02061 g009
Figure 10. Effect of geomagnetic field on the PD attenuation.
Remotesensing 16 02061 g010
Figure 11. Effect of collision frequency on absorption attenuation.
Remotesensing 16 02061 g011
Figure 12. Effects of the geomagnetic field intensity and the plasma sheath parameters on the PD. (a) Geomagnetic field intensity; (b) electron density; (c) collision frequency; (d) radar frequency. The points “A”, “B” and “C” represent the typical values of PD which are specified in the text.
Remotesensing 16 02061 g012
Figure 13. The PD variation with different parameters for L-band radar signal (1.6 GHz). (a) Effects of the collision frequency and the geomagnetic field intensity on the PD; (b) effects of the collision frequency and the electron density on the PD.
Remotesensing 16 02061 g013
Figure 14. Effects of the geomagnetic field intensity and the plasma sheath parameters on the PD attenuation. (a) Geomagnetic field intensity; (b) electron density; (c) collision frequency; (d) radar frequency. The points “A”, “B” and “C” represent the typical values of PD attenuation which are specified in the text.
Remotesensing 16 02061 g014
Figure 15. Effects of the plasma sheath parameters on the absorption attenuation. (a) Electron density; (b) collision frequency; (c) radar frequency.
Remotesensing 16 02061 g015
Figure 16. The original fully polarimetric SAR images. (ad) HH, HV, VH and VV channel images with artificial point target.
Remotesensing 16 02061 g016
Figure 17. Pseudo-color images after Pauli decomposition. (ac) Original image, image under the influence of situation 1 with Ne = 2.5 × 10¹⁶ m−3, image under the influence of situation 2 with Ne = 3 × 10¹⁶ m−3. Red: |SHH−SVV|. Green: |SHV + SVH|. Blue: |SHH + SVV|.
Remotesensing 16 02061 g017aRemotesensing 16 02061 g017b
Figure 18. Range and azimuth profiles of artificial point target with and without the polarization distortions (situation 1). (ad) Range profiles of HH, HV, VH and VV channels; (eh) azimuth profiles of HH, HV, VH and VV channels.
Remotesensing 16 02061 g018
Figure 19. Range and azimuth profiles of artificial point target with and without the polarization distortions (situation 2). (ad) Range profiles of HH, HV, VH and VV channels; (eh) azimuth profiles of HH, HV, VH and VV channels.
Remotesensing 16 02061 g019
Figure 20. SSIM variation with electron density and collision frequency for four polarimetric channels (B = 65,000 nT, f = 1.6 GHz). (a) Collision frequency with 0.1 GHz; (b) collision frequency with 1 GHz.
Remotesensing 16 02061 g020
Figure 21. The comparison of the FR angle in the ionosphere with the traditional and proposed models. f = 1.25 GHz, B = 50,000 nT, Ne = 109–1011 m−3, and the propagation distance is 1000 km.
Remotesensing 16 02061 g021
Table 1. The experimental parameters.
ParameterValue
electron density1 × 1016–3 × 10¹⁶ m−3
geomagnetic field intensity20,000–65,000 nT
collision frequency0.1–40 GHz
radar frequency1.6–2 GHz
penetration depth40 cm
Table 2. The simulation parameters.
ParameterValue
geomagnetic field intensity65,000 nT
electron density2.5 × 1016 m−3, 3 × 10¹⁶ m−3
collision frequency0.1 GHz
radar frequency1.6 GHz
penetration depth40 cm
Table 3. The SSIM between the original and the affected SAR images.
ChannelHHHVVHVV
Situation
situation 1 with Ne = 2.5 × 10¹⁶ m−30.95020.95280.94630.9502
situation 2 with Ne = 3 × 10¹⁶ m−30.76550.77970.75390.7654
Disclaimer/Publisher’s Note: The statements, opinions and data contained in all publications are solely those of the individual author(s) and contributor(s) and not of MDPI and/or the editor(s). MDPI and/or the editor(s) disclaim responsibility for any injury to people or property resulting from any ideas, methods, instructions or products referred to in the content.

