

Three-Dimensional Surface Deformation of the 2022 Mw 6.6 Menyuan Earthquake from InSAR and GF-7 Stereo Satellite Images


Abstract
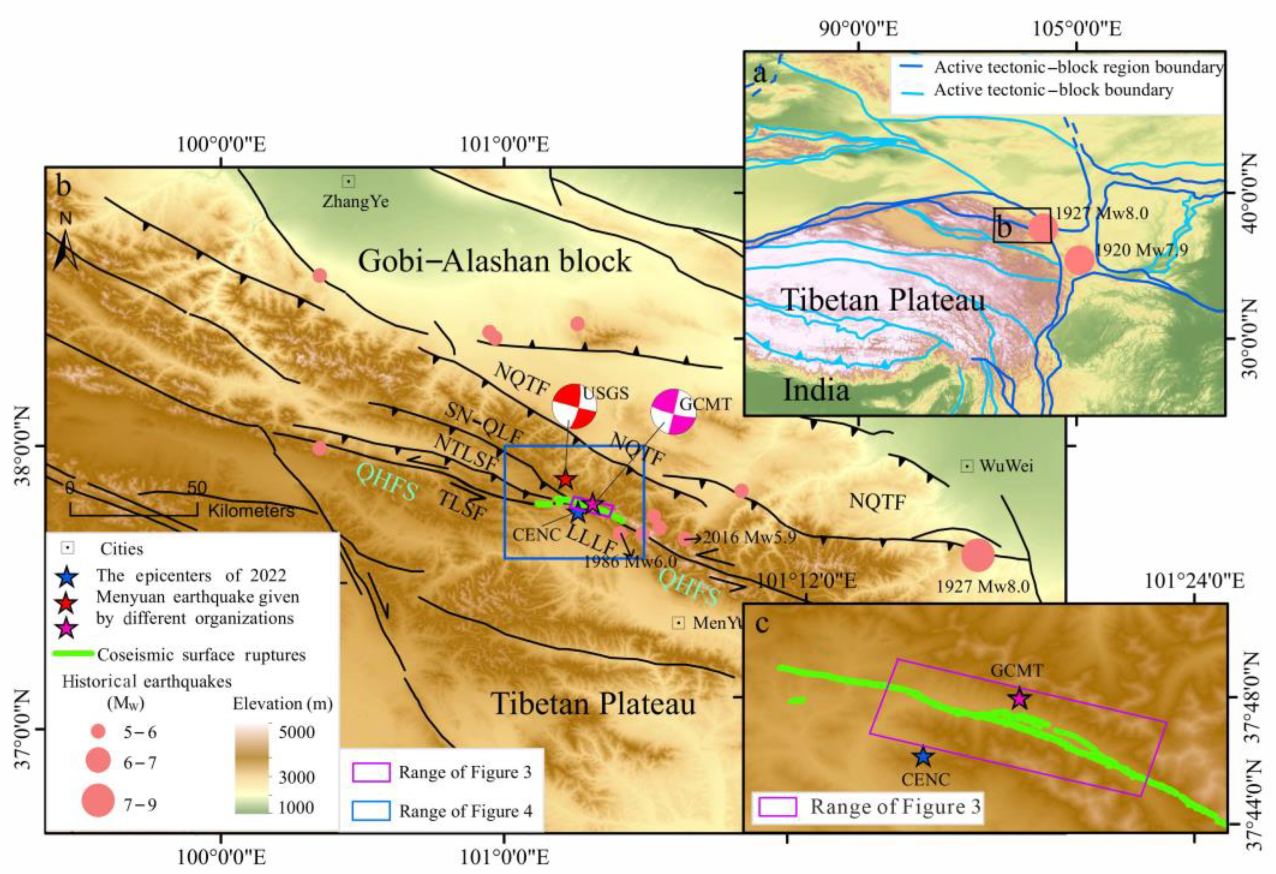
1. Introduction
2. Data and Methods
2.1. Data
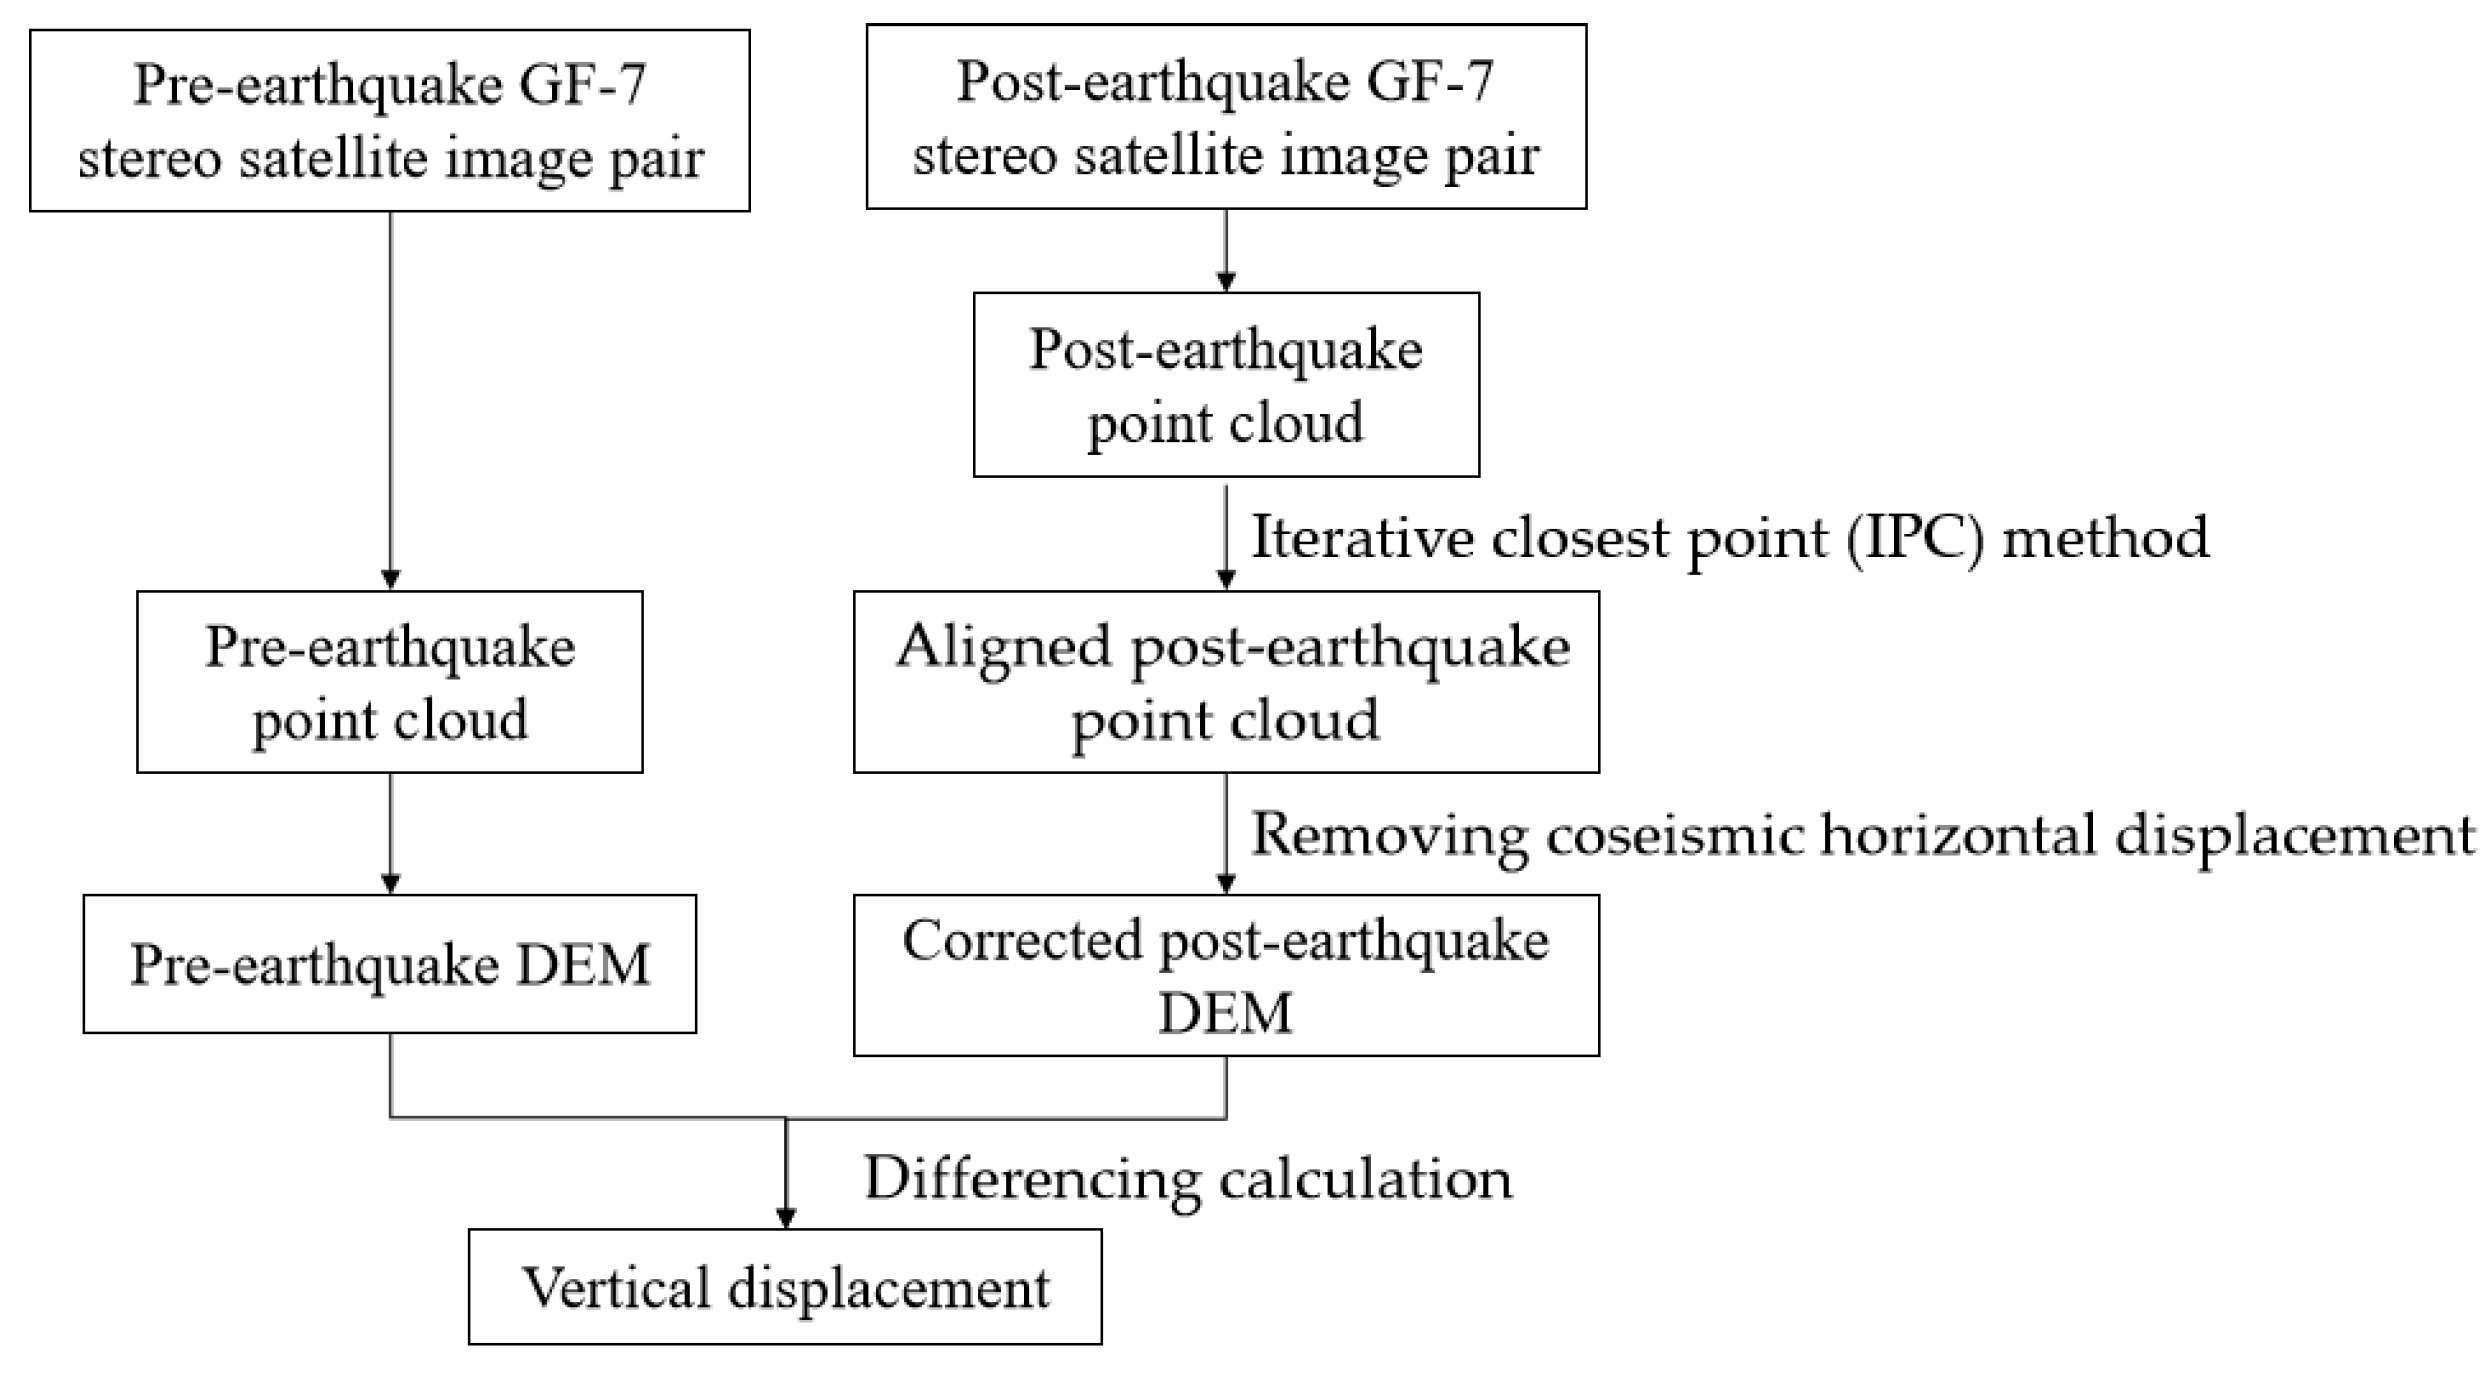
2.2. Vertical Displacement Calculation
2.3. Calculation of Three-Dimensional Coseismic Surface Deformation Fields
3. Results
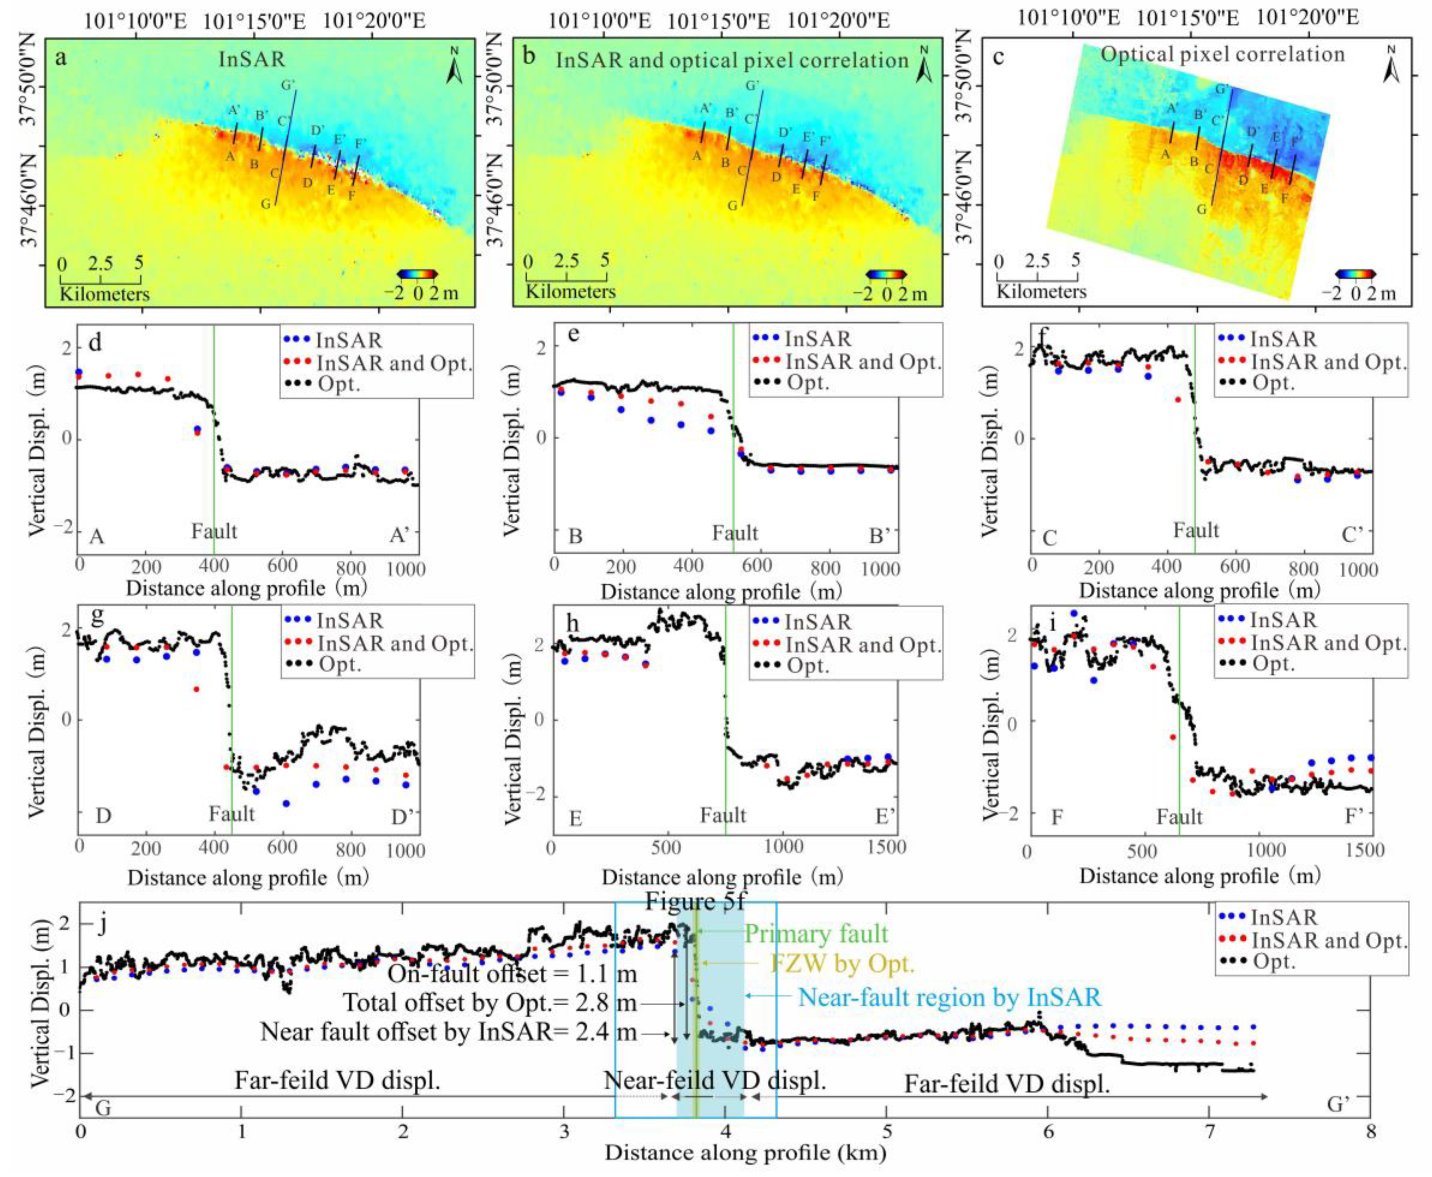
3.1. Vertical Displacement from DEM Differencing
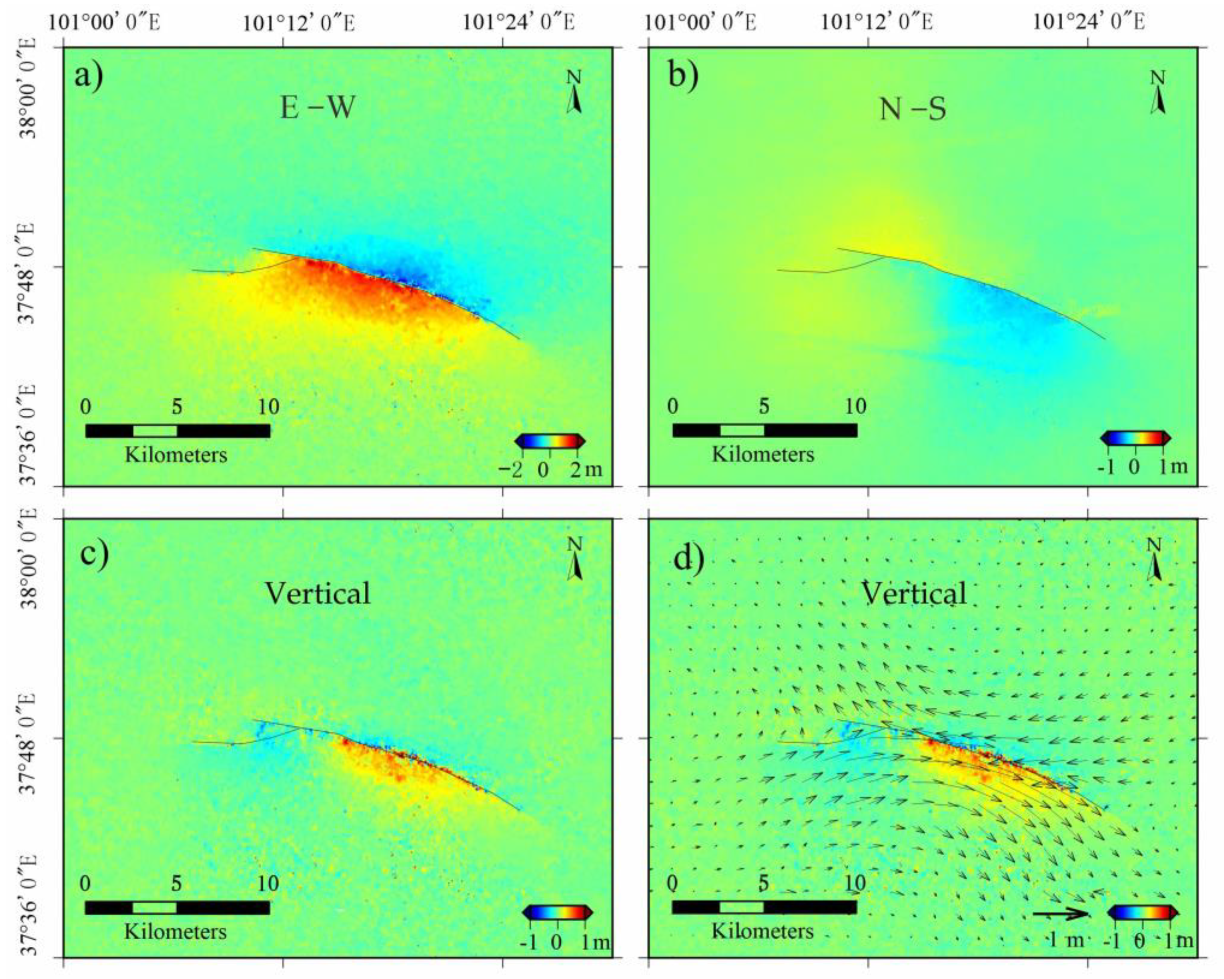
3.2. Three-Dimensional Surface Deformation Fields
4. Discussion
4.1. Characteristics of Near-Field Deformation
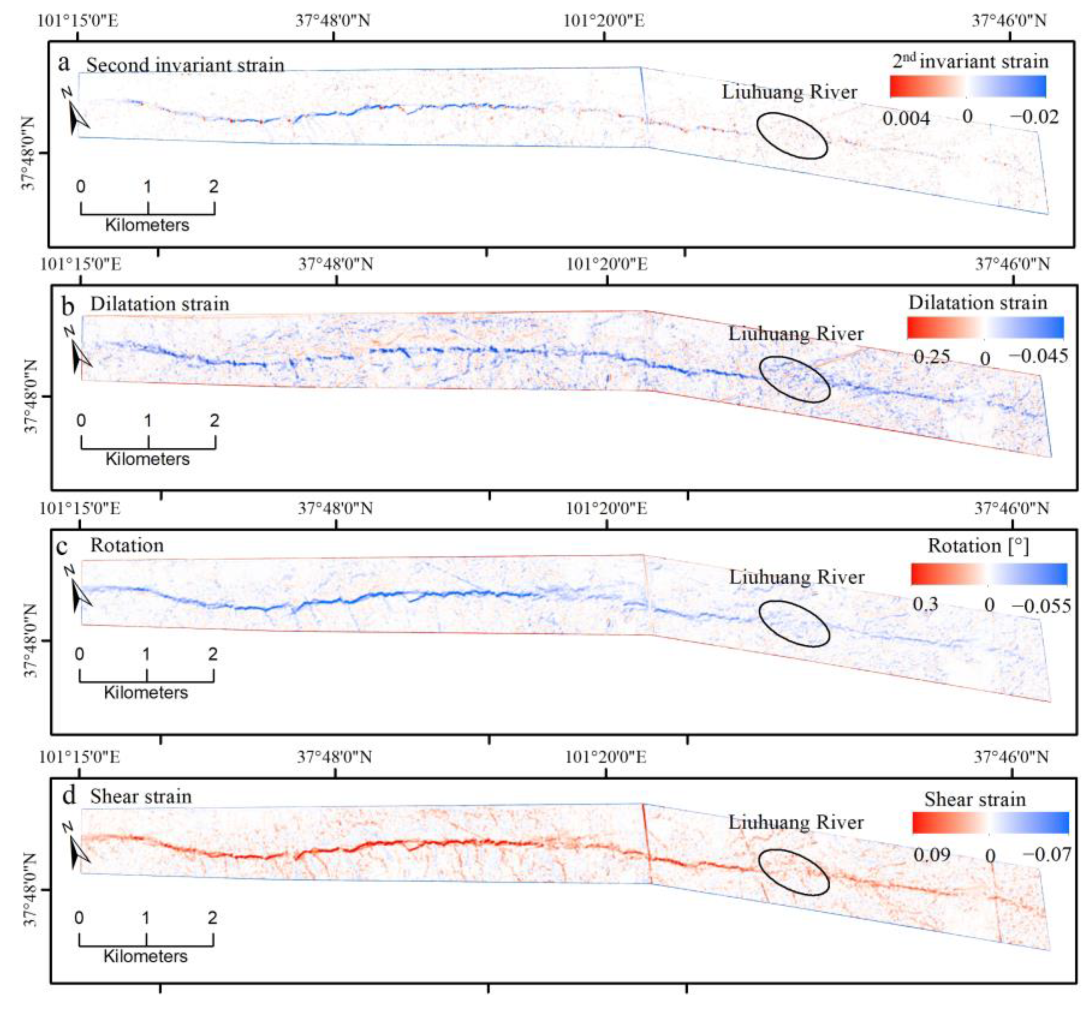
4.2. Coseismic Strain
5. Conclusions
Supplementary Materials
Author Contributions
Funding
Data Availability Statement
Acknowledgments
Conflicts of Interest
References
- Pan, J.; Li, H.; Marie-Luce, C.; Liu, D.; Li, C.; Liu, C.; Wu, Q.; Lu, H.; Jiao, L. Coseismic surface rupture and seismogenic structure of the 2022 Ms6.9 Menyuan earthquake, Qinghai Province, China. Acta Geol. Sin. 2022, 96, 215–231. (In Chinese) [Google Scholar]
- Tapponnier, P.; Xu, Z.; Roger, F.; Meyer, B.; Arnaud, N.; Wittlinger, G.; Yang, J. Oblique stepwise rise and growth of the Tibet Plateau. Science 2001, 294, 1671–1677. [Google Scholar] [CrossRef] [PubMed]
- Deng, Q.; Ran, Y.; Yang, X.; Min, W.; Chu, Q. Active Tectonic Map of China; Seismological Press: Beijing, China, 2007. [Google Scholar]
- Ou, Q.; Kulikova, G.; Yu, J.; Elliott, A.; Parsons, B.; Walker, R. Magnitude of the 1920 Haiyuan earthquake reestimated using seismological and geomorphological methods. J. Geophys. Res. Solid Earth 2020, 125, e2019JB019244. [Google Scholar] [CrossRef]
- Guo, P.; Han, Z.; Gao, F.; Zhu, C.; Gai, H. A new tectonic model for the 1927 M8. 0 Gulang earthquake on the NE Tibetan Plateau. Tectonics 2020, 39, e2020TC006064. [Google Scholar] [CrossRef]
- Wen, Y.; Yuan, D.; Xie, H.; Su, R.; Su, Q.; Li, Z.; Sun, H.; Si, G.; Yu, J.; Chen, Y.; et al. Typical Fine Structure and Seismogenic Mechanism Analysis of the Surface Rupture of the 2022 Menyuan Mw 6.7 Earthquake. Remote Sens. 2023, 15, 4375. [Google Scholar] [CrossRef]
- Han, S.; Wu, Z.; Gao, Y.; Lu, H. Surface rupture investigation of the 2022 Menyuan MS 6. 9 Earthquake, Qinghai, China: Implications for the fault behavior of the Lenglongling fault and regional intense earthquake risk. J. Geomech. 2022, 28, 155–168. (In Chinese) [Google Scholar]
- Niu, P.; Han, Z.; Li, K.; Lv, L.; Guo, P. The 2022 Mw 6.7 Menyuan Earthquake on the Northeastern Margin of the Tibetan Plateau, China: Complex Surface Ruptures and Large Slip. Bull. Seismol. Soc. Am. 2023, 113, 976–996. [Google Scholar] [CrossRef]
- Liu, J.; Hu, J.; Li, Z.; Ma, Z.; Shi, J.; Xu, W.; Sun, Q. Three-Dimensional Surface Displacements of the 8 January 2022 Mw6.7 Menyuan Earthquake, China from Sentinel-1 and ALOS-2 SAR Observations. Remote Sens. 2022, 14, 1404. [Google Scholar] [CrossRef]
- Li, Y.; Jiang, W.; Li, Y.; Shen, W.; He, Z.; Li, B.; Li, Q.; Jiao, Q.; Tian, Y. Coseismic Rupture Model and Tectonic Implications of the January 7 2022, Menyuan Mw 6.6 Earthquake Constraints from InSAR Observations and Field Investigation. Remote Sens. 2022, 14, 2111. [Google Scholar] [CrossRef]
- Li, Z.; Han, B.; Liu, Z.; Zhang, M.; Yu, C.; Chen, B.; Liu, H.; Du, J.; Zhang, S.; Zhu, W.; et al. Source Parameters and Slip Distributions of the 2016 and 2022 Menyuan, Qinghai Earthquakes Constrained by InSAR Observations. Geomat. Inf. Sci. Wuhan Univ. 2022, 47, 887–897. [Google Scholar]
- Bello, S.; Andrenacci, C.; Cirillo, D.; Scott, C.P.; Brozzetti, F.; Arrowsmith, J.R.; Lavecchia, G. High-Detail Fault Segmentation: Deep Insight into the Anatomy of the 1983 Borah Peak Earthquake Rupture Zone (Mw 6.9, Idaho, USA). Lithosphere 2022, 2022, 8100224. [Google Scholar] [CrossRef]
- Brozzetti, F.; Boncio, P.; Cirillo, D.; Ferrarini, F.; de Nardis, R.; Testa, A.; Liberi, F.; Lavecchia, G. High-Resolution Field Mapping and Analysis of the August–October 2016 Coseismic Surface Faulting (Central Italy Earthquakes): Slip Distribution, Parameterization, and Comparison with Global Earthquakes. Tectonics 2019, 38, 417–439. [Google Scholar] [CrossRef]
- Civico, R.; Pucci, S.; Villani, F.; Pizzimenti, L.; De Martini, P.M.; Nappi, R.; Open EMERGEO Working Group. Surface ruptures following the 30 October 2016 M w 6.5 Norcia earthquake, central Italy. J. Maps 2018, 14, 151–160. [Google Scholar] [CrossRef]
- Fletcher, J.M.; Teran, O.J.; Rockwell, T.K.; Oskin, M.E.; Hudnut, K.W.; Mueller, K.J.; Spelz, R.M.; Akciz, S.O.; Masana, E.; Faneros, G.; et al. Assembly of a large earthquake from a complex fault system: Surface rupture kinematics of the 4 April 2010 El Mayor–Cucapah (Mexico) Mw 7.2 earthquake. Geosphere 2014, 10, 797–827. [Google Scholar] [CrossRef]
- Testa, A.; Boncio, P.; Di Donato, M.; Brozzetti, F.; Cirillo, D. Mapping the geology of the 2016 Central Italy earth-quake fault (Mt. Vettore–Mt. Bove fault, Sibillini Mts.): Geological details on the Cupi–Ussita and Mt. Bove–Mt. Porche segments and overall pattern of coseismic surface faulting. Field Trips Maps 2019, 11, 1–13. [Google Scholar]
- Yu, Z.; Yin, N.; Xiao, P.; Chen, B. Co-Seismic Surface Ruptures of the CE 1738 M 7.6 Dangjiang Earthquake Along the NW Continuation of the Xianshuihe Fault Zone and Tectonic Implications for the Central Tibetan Plateau. Front. Earth Sci. 2022, 10, 810891. [Google Scholar] [CrossRef]
- Zielke, O.; Arrowsmith, J.R.; Ludwig, L.G.; Akciz, S.O. High-resolution Topography-derived offsets along the 1857 Fort Tejon earthquake rupture trace, San Andreas Fault. Bull. Seismol. Soc. Am. 2012, 102, 1135–1154. [Google Scholar] [CrossRef]
- Oskin, M.E.; Arrowsmith, J.R.; Corona, A.H.; Elliott, A.J.; Fletcher, J.M.; Fielding, E.J.; Gold, P.O.; Garcia, J.J.G.; Hudnut, K.W.; Liu-Zeng, J.; et al. Near-field deformation from the El Mayor–Cucapah earthquake revealed by differential LIDAR. Science 2012, 335, 702–705. [Google Scholar] [CrossRef]
- Zhang, C.; Li, Z.; Zhang, S.; Wang, J.; Zhan, W.; Li, X.; Liu, Z.; Du, J.; Peng, J. Surface Ruptures of the 2022 Mw 6.7 Menyuan Earthquake Revealed by Integrated Remote Sensing. Geomat. Inf. Sci. Wuhan Univ. 2022, 47, 1257–1270. [Google Scholar]
- Li, K.; Tapponnier, P.; Xu, X.; Kang, W. The 2022, Ms 6.9 Menyuan earthquake: Surface rupture, Paleozoic suture re-activation, slip-rate and seismic gap along the Haiyuan fault system, NE Tibet. Earth Planet. Sci. Lett. 2023, 622, 118412. [Google Scholar] [CrossRef]
- Menichetti, M.; Roccheggiani, M.; De Guidi, G.; Carnemolla, F.; Brighenti, F.; Barreca, G.; Monaco, C. Sentinel-1 Interferometry and UAV Aerial Survey for Mapping Coseismic Ruptures: Mts. Sibillini vs. Mt. Etna Volcano. Remote Sens. 2023, 15, 2514. [Google Scholar] [CrossRef]
- Gold, P.O.; Oskin, M.E.; Elliott, A.J.; Hinojosa-Corona, A.; Taylor, M.H.; Kreylos, O.; Cowgill, E. Coseismic slip variation assessed from terrestrial lidar scans of the El Mayor–Cucapah surface rupture. Earth Planet. Sci. Lett. 2013, 366, 151–162. [Google Scholar] [CrossRef]
- Wang, J.; Zhang, G.; Shan, X.; Zhang, Y. Three-dimensional deformation of the 2008 Gaize earthquakes resolved from InSAR measurements by multiple view angles and its tectonic implications. Seismol. Geol. 2016, 38, 978–986. (In Chinese) [Google Scholar]
- Brozzetti, F.; Mondini, A.C.; Pauselli, C.; Mancinelli, P.; Cirillo, D.; Guzzetti, F.; Lavecchia, G. Mainshock Anticipated by Intra-Sequence Ground Deformations: Insights from Multiscale Field and SAR Interferometric Measurements. Geosciences 2020, 10, 186. [Google Scholar] [CrossRef]
- Zhu, S.; Wen, Y.; Gong, X.; Liu, J. Coseismic and Early Postseismic Deformation of the 2020 Mw 6.4 Petrinja Earthquake (Croatia) Revealed by InSAR. Remote Sens. 2023, 15, 2617. [Google Scholar] [CrossRef]
- Jin, Z.; Fialko, Y.; Zubovich, A.; Schöne, T. Lithospheric deformation due to the 2015 M7.2 Sarez (Pamir) earthquake constrained by 5 years of space geodetic observations. J. Geophys. Res. Solid Earth 2022, 127, e2021JB022461. [Google Scholar] [CrossRef]
- Fialko, Y.; Simons, M.; Agnew, D. The complete (3-D) surface displacement field in the epicentral area of the 1999 Mw7.1 Hector Mine earthquake, Southern California, from space geodetic observations. Geophys. Res. Lett. 2001, 28, 3063–3066. [Google Scholar] [CrossRef]
- He, P.; Ding, K.; Xu, C. The 2016 Mw 6.7 Aketao earthquake in Muji range, northern Pamir: Rupture on a strike-slip fault constrained by sentinel-1 radar interferometry and GPS. Int. J. Appl. Earth Observ. Geoinform. 2018, 73, 99–106. [Google Scholar] [CrossRef]
- Leprince, S.; Musé, P.; Avouac, J.P. In-flight CCD distortion calibration for pushbroom satellites based on subpixel correlation. IEEE Trans. Geosci. Remote Sens. 2008, 46, 2675–2683. [Google Scholar] [CrossRef]
- Rosu, A.M.; Pierrot-Deseilligny, M.; Delorme, A.; Binet, R.; Klinger, Y. Measurement of ground displacement from optical satellite image correlation using the free open-source software MicMac. ISPRS J. Photogram. Rem. Sens. 2015, 100, 48–59. [Google Scholar] [CrossRef]
- Gold, R.D.; Reitman, N.G.; Briggs, R.W.; Barnhart, W.D.; Hayes, G.P.; Wilson, E. On-and off-fault deformation associated with the September 2013 Mw 7.7 Balochistan earthquake: Implications for geologic slip rate measurements. Tectonophysics 2015, 660, 65–78. [Google Scholar] [CrossRef]
- Gold, R.D.; DuRoss, C.B.; Barnhart, W.D. Coseismic surface displacement in the 2019 Ridgecrest earthquakes: Comparison of field measurements and optical image correlation results. Geochem. Geophys. Geosyst. 2021, 22, e2020GC009326. [Google Scholar] [CrossRef]
- Zinke, R.; Hollingsworth, J.; Dolan, J.F.; Dissen, R.V. Three-dimensional surface deformation in the 2016 MW 7.8 Kaikōura, New Zealand, earthquake from optical image correlation: Implications for strain localization and long-term evolution of the Pacific-Australian plate boundary. Geochem. Geophys. Geosyst. 2019, 20, 1609–1628. [Google Scholar] [CrossRef]
- Milliner, C.; Donnellan, A.; Aati, S.; Avouac, J.-P.; Zinke, R.; Dolan, J.F.; Wang, K.; Bürgmann, R. Bookshelf kinematics and the effect of dilatation on fault zone inelastic deformation: Examples from optical image correlation measurements of the 2019 Ridgecrest earthquake sequence. J. Geophys. Res. Solid Earth 2021, 126, e2020JB020551. [Google Scholar] [CrossRef]
- Scott, C.; Champenois, J.; Klinger, Y.; Nissen, E.; Maruyama, T.; Chiba, T.; Arrowsmith, R. The 2016 M7 Kumamoto, Japan, earthquake slip field derived from a joint inversion of differential lidar topography, optical correlation, and InSAR surface displacements. Geophys. Res. Lett. 2019, 46, 6341–6351. [Google Scholar] [CrossRef]
- Li, C.; Li, T.; Shan, X.; Zhang, G. Extremely Large Off-Fault Deformation during the 2021 Mw 7.4 Maduo, Tibetan Plateau. Earthquake. Seismol. Res. Lett. 2023, 94, 39–51. [Google Scholar] [CrossRef]
- Han, N.; Zhang, G.; Shan, X.; Zhang, Y.; Hetland, E.; Qu, C.; Gong, W.; Sun, G.; Li, C.; Fan, X.; et al. Coseismic Surface Horizontal Deformation of the 2022 Mw 6.6 Menyuan, Qinghai, China, Earthquake from Optical Pixel Correlation of GF-7 Stereo Satellite Images. Seismol. Res. Lett. 2023, 94, 1747–1760. [Google Scholar] [CrossRef]
- Nissen, E.; Krishnan, A.K.; Arrowsmith, J.R.; Saripalli, S. Three-dimensional surface displacements and rotations from differencing pre- and post-earthquake LiDAR point clouds. Geophys. Res. Lett. 2012, 39, L16301. [Google Scholar] [CrossRef]
- Zhou, Y.; Parsons, B.; Elliott, J.R.; Barisin, I.; Walker, R.T. Assessing the ability of Pleiades stereo imagery to determine height changes in earthquakes: A case study for the El Mayor-Cucapah epicentral area. J. Geophys. Res. Solid Earth 2015, 120, 8793–8808. [Google Scholar] [CrossRef]
- Nelson, M.R.; Jones, C.H. Paleomagnetism and crustal rotations along a shear zone, Las Vegas Range, southern Nevada. Tectonics 1987, 6, 13–33. [Google Scholar] [CrossRef]
- Shelef, E.; Oskin, M. Deformation processes adjacent to active faults: Examples from eastern California. J. Geophys. Res. Solid Earth 2010, 115, B05308. [Google Scholar] [CrossRef]
- Fialko, Y. Interseismic strain accumulation and the earthquake potential on the southern San Andreas fault system. Nature 2006, 441, 968–971. [Google Scholar] [CrossRef]
- Shen, Z.K.; Jackson, D.D.; Kagan, Y.Y. Implications of geodetic strain rate for future earthquakes, with a five-year forecast of M5 earthquakes in southern California. Seismol. Res. Lett. 2007, 78, 116–120. [Google Scholar] [CrossRef]
- Zhao, D.; Qu, C.; Chen, H.; Shan, X.; Song, X.; Gong, W. Tectonic and geometric control on fault kinematics of the 2021 Mw7. 3 Maduo (China) earthquake inferred from interseismic, coseismic, and postseismic InSAR observations. Geophys. Res. Lett. 2021, 48, e2021GL095417. [Google Scholar] [CrossRef]
- Barnhart, W.D.; Gold, R.D.; Hollingsworth, J. Localized fault-zone dilatancy and surface inelasticity of the 2019 Ridgecrest earthquakes. Nat. Geosci. 2020, 13, 699–704. [Google Scholar] [CrossRef]
- Lockner, D.A. A generalized law for brittle deformation of Westerly granite. J. Geophys. Res. Solid Earth 1998, 103, 5107–5123. [Google Scholar] [CrossRef]
- Zhao, D.; Qu, C.; Bürgmann, R.; Shan, X. Characterizing Deep, Shallow, and Surface Fault Zone Deformation of the 2021 Mw 7.4 Maduo, China, Earthquake. Seismol. Res. Lett. 2024, 95, 277–287. [Google Scholar] [CrossRef]
- Li, C.; Li, T.; Hollingsworth, J.; Zhang, Y.; Qian, L.; Shan, X. Strain threshold for the formation of coseismic surface rupture. Geophys. Res. Lett. 2023, 50, e2023GL103666. [Google Scholar] [CrossRef]


| Satellite | Date | Spatial Resolution (m) | Incidence (°) Backward/Forward |
|---|---|---|---|
| GF-7 | 20211130 | 0.68 | −5/26 |
| GF-7 | 20220108 | 0.68 | −5/26 |
| Sensor | Orbit Direction | Date | Track | Observation Technology | Deformation Direction |
|---|---|---|---|---|---|
| Sentinel-1 a | Ascending | 20211229–20220110 | T26 | DInSAR | LOS |
| Sentinel-1 a | Ascending | 20211229–20220110 | T26 | POT | LOS |
| Sentinel-1 a | Ascending | 20211229–20220110 | T26 | BOI | AZI |
| Sentinel-1 a | Ascending | 20220105–20220117 | T128 | DInSAR | LOS |
| Sentinel-1 a | Ascending | 20220105–20220117 | T128 | POT | LOS |
| Sentinel-1 a | Ascending | 20220105–20220117 | T128 | BOI | AZI |
| Sentinel-1 a | Descending | 20211229–20220110 | T33 | DInSAR | LOS |
| Sentinel-1 a | Descending | 20211229–20220110 | T33 | POT | LOS |
| Sentinel-1 a | Descending | 20211229–20220110 | T33 | BOI | AZI |
| ALOS-2 a | Descending | 20201212–20220123 | T41 | DInSAR | LOS |
| ALOS-2 a | Descending | 20201212–20220123 | T41 | POT | AZI |
| ALOS-2 a | Descending | 20201212–20220123 | T41 | MAI | AZI |
| GF-2/7 b | - | 20211124–20220201/ 20211130–20220108 | - | OPC | E-W |
| GF-7 c | - | 20211130–20220108 | - | Differencing | Vertical |
Disclaimer/Publisher’s Note: The statements, opinions and data contained in all publications are solely those of the individual author(s) and contributor(s) and not of MDPI and/or the editor(s). MDPI and/or the editor(s) disclaim responsibility for any injury to people or property resulting from any ideas, methods, instructions or products referred to in the content. |
© 2024 by the authors. Licensee MDPI, Basel, Switzerland. This article is an open access article distributed under the terms and conditions of the Creative Commons Attribution (CC BY) license (https://creativecommons.org/licenses/by/4.0/).
Share and Cite
Han, N.; Shan, X.; Zhang, Y.; Wang, J.; Chen, H.; Zhang, G. Three-Dimensional Surface Deformation of the 2022 Mw 6.6 Menyuan Earthquake from InSAR and GF-7 Stereo Satellite Images. Remote Sens. 2024, 16, 2147. https://doi.org/10.3390/rs16122147
Han N, Shan X, Zhang Y, Wang J, Chen H, Zhang G. Three-Dimensional Surface Deformation of the 2022 Mw 6.6 Menyuan Earthquake from InSAR and GF-7 Stereo Satellite Images. Remote Sensing. 2024; 16(12):2147. https://doi.org/10.3390/rs16122147
Chicago/Turabian StyleHan, Nana, Xinjian Shan, Yingfeng Zhang, Jiaqing Wang, Han Chen, and Guohong Zhang. 2024. "Three-Dimensional Surface Deformation of the 2022 Mw 6.6 Menyuan Earthquake from InSAR and GF-7 Stereo Satellite Images" Remote Sensing 16, no. 12: 2147. https://doi.org/10.3390/rs16122147
APA StyleHan, N., Shan, X., Zhang, Y., Wang, J., Chen, H., & Zhang, G. (2024). Three-Dimensional Surface Deformation of the 2022 Mw 6.6 Menyuan Earthquake from InSAR and GF-7 Stereo Satellite Images. Remote Sensing, 16(12), 2147. https://doi.org/10.3390/rs16122147