Technical Note

Accurate Mapping and Evaluation of Small Impact Craters within the Lunar Landing Area

1
College of Earth Sciences, Jilin University, Changchun 130061, China
2
Laboratory of Moon and Deep Space Exploration, National Astronomical Observatories, Chinese Academy of Sciences, Beijing 100012, China
3
College of Computer Science and Technology, Jilin University, Changchun 130012, China
*
Author to whom correspondence should be addressed.
Remote Sens. 2024, 16(12), 2165; https://doi.org/10.3390/rs16122165
Submission received: 26 April 2024 / Revised: 12 June 2024 / Accepted: 12 June 2024 / Published: 14 June 2024

Abstract

:
Impact craters, as the most distinct lunar structural unit and geological structure, are marked on the Moon’s surface. For over a decade, researchers have focused on identifying and exploring large- to medium-sized impact craters on the surface of the Moon (craters with a diameter greater than 1 km). Small impact craters have obvious statistical significance owing to their magnitude in numbers. The identification and analysis of small craters provide indispensable clues for the study of lunar geological evolution. However, such craters only remain in specific images and regions. At present, there is no comprehensive record of small impact craters in the existing lunar impact crater databases. The small impact craters on the surface of the Moon are enormous and vary in size by orders of magnitude, exhibiting small target characteristics in space. The present study focuses on the identification and spatial analysis of small impact craters on the surface of the Moon. A feature amplification strategy-based identification model was established for small impact crater detection, achieving accurate recognition of the small impact craters on the surface of the Moon (with a recall rate of 86.97% and a false-positive rate as low as 0.54% ± 0.16%). In total, 228,897, 142,872, and 42,008 new small lunar impact craters (with diameters as low as 4.5 m) were identified in the ten lunar landing areas of returned samples from the Apollo, Luna, and Chang’e-5 missions. In addition, the spatial distribution characteristics of small impact craters during different geological periods in the landing area are provided. Data on the newly identified small impact craters will provide an important basis for revealing the lunar impact fluxes and young lunar surface dating in lunar geological evolution research.

1. Introduction

The Moon’s surface is covered with impact craters of varying scales and with varying morphological features, thus providing a starting point in understanding the geological evolution of the Moon. Analyses focusing on lunar impact craters demand the comprehensive quantification of craters with different diameters. Following decades of efforts, a series of lunar impact crater databases involving both manual quantification and automatic detection have been established [1,2,3,4,5], with them focusing on large-scale craters, i.e., those >1–2 km in diameter. This limited scope of crater sizes means that analyses can only be performed for large craters on the surface of the Moon.
Small lunar impact craters with diameters from a few meters to hundreds of meters form more frequently than large craters on the Moon’s surface. Over nearly 4.5 billion years, small impact craters continue to modify the lunar topography as well as their own evolution. The formation and evolution of small lunar craters is a significant contributor to revealing the flux of impacting projectiles [6], determining erosion rates [7], estimating regolith thickness [8,9], and calculating and constraining surface and crater age [10,11,12], in addition to selecting potential landing sites. In light of the above, the quantification of small lunar craters has become a necessary step in refining lunar geological evolution.
At present, quantification carried out by experts remains the main means of identifying small craters. Around the Apollo 11, Apollo 14, Apollo 16, Apollo 17, Chang’e-4, and Chang’e-5 mission landing areas, tens of thousands of small craters ranging from roughly 0.5 m to 300 m in diameter have been counted [10,11,12,13]. However, the incredibly high number of small lunar craters on the surface of the Moon makes manual quantification only practicable for a limited area. In order to conduct wider and more rapid surveys, pattern recognition and deep learning-based automatic detection methods have been developed [14,15,16,17,18,19,20]. From the detection numbers to scale, the catalog of small lunar craters established by Cadogan [16,20] is representative, where roughly >300,000 craters over 2.5–3 m in diameter were detected at the Apollo, Luna, Lunokhod, Ranger, and Chang’e-4 sites with a calculated detection rate of 86%. However, this automated analysis was built on multiple and overlapping LROC NAC images under different illumination conditions on the lunar surface. To date, there is no comprehensive record of small-scale craters in the existing lunar impact crater database.
Compared with large-scale craters, small lunar craters show a dense distribution and small target characteristics [21]. As many as 10,000 small impact craters are distributed across each square kilometer of the lunar surface, approximately 10 times that of large- to medium-sized impact craters. At present, the identification of small impact craters is still limited to the use of specific images and regions. Due to the significant number of objects, it is not possible to fully extract the fine features of traditional impact craters, making it difficult to effectively identify the features of small impact craters. In addition, existing intelligent detection models lack sufficient visual features to fully explore the morphological features of densely distributed small lunar impact craters, resulting in a significant rate of failed detection. The LROC NAC is able to capture the 0.5–1.5 m scale spatial resolution images, where small craters with a diameter of 5 m occupy only 3–10 pixels.
Addressing the aforementioned issues is the premise for extracting features presented in small lunar craters to identify them adequately. To this end, we characterized the properties of small craters from the perspective of a spatial scale to address these issues. The hypothesis is that the target pixels of a small crater should be more distinguishable than the value of its locally neighboring pixels and reduce the spatial density of small craters. The main contributions of the present study are as follows:
(1)
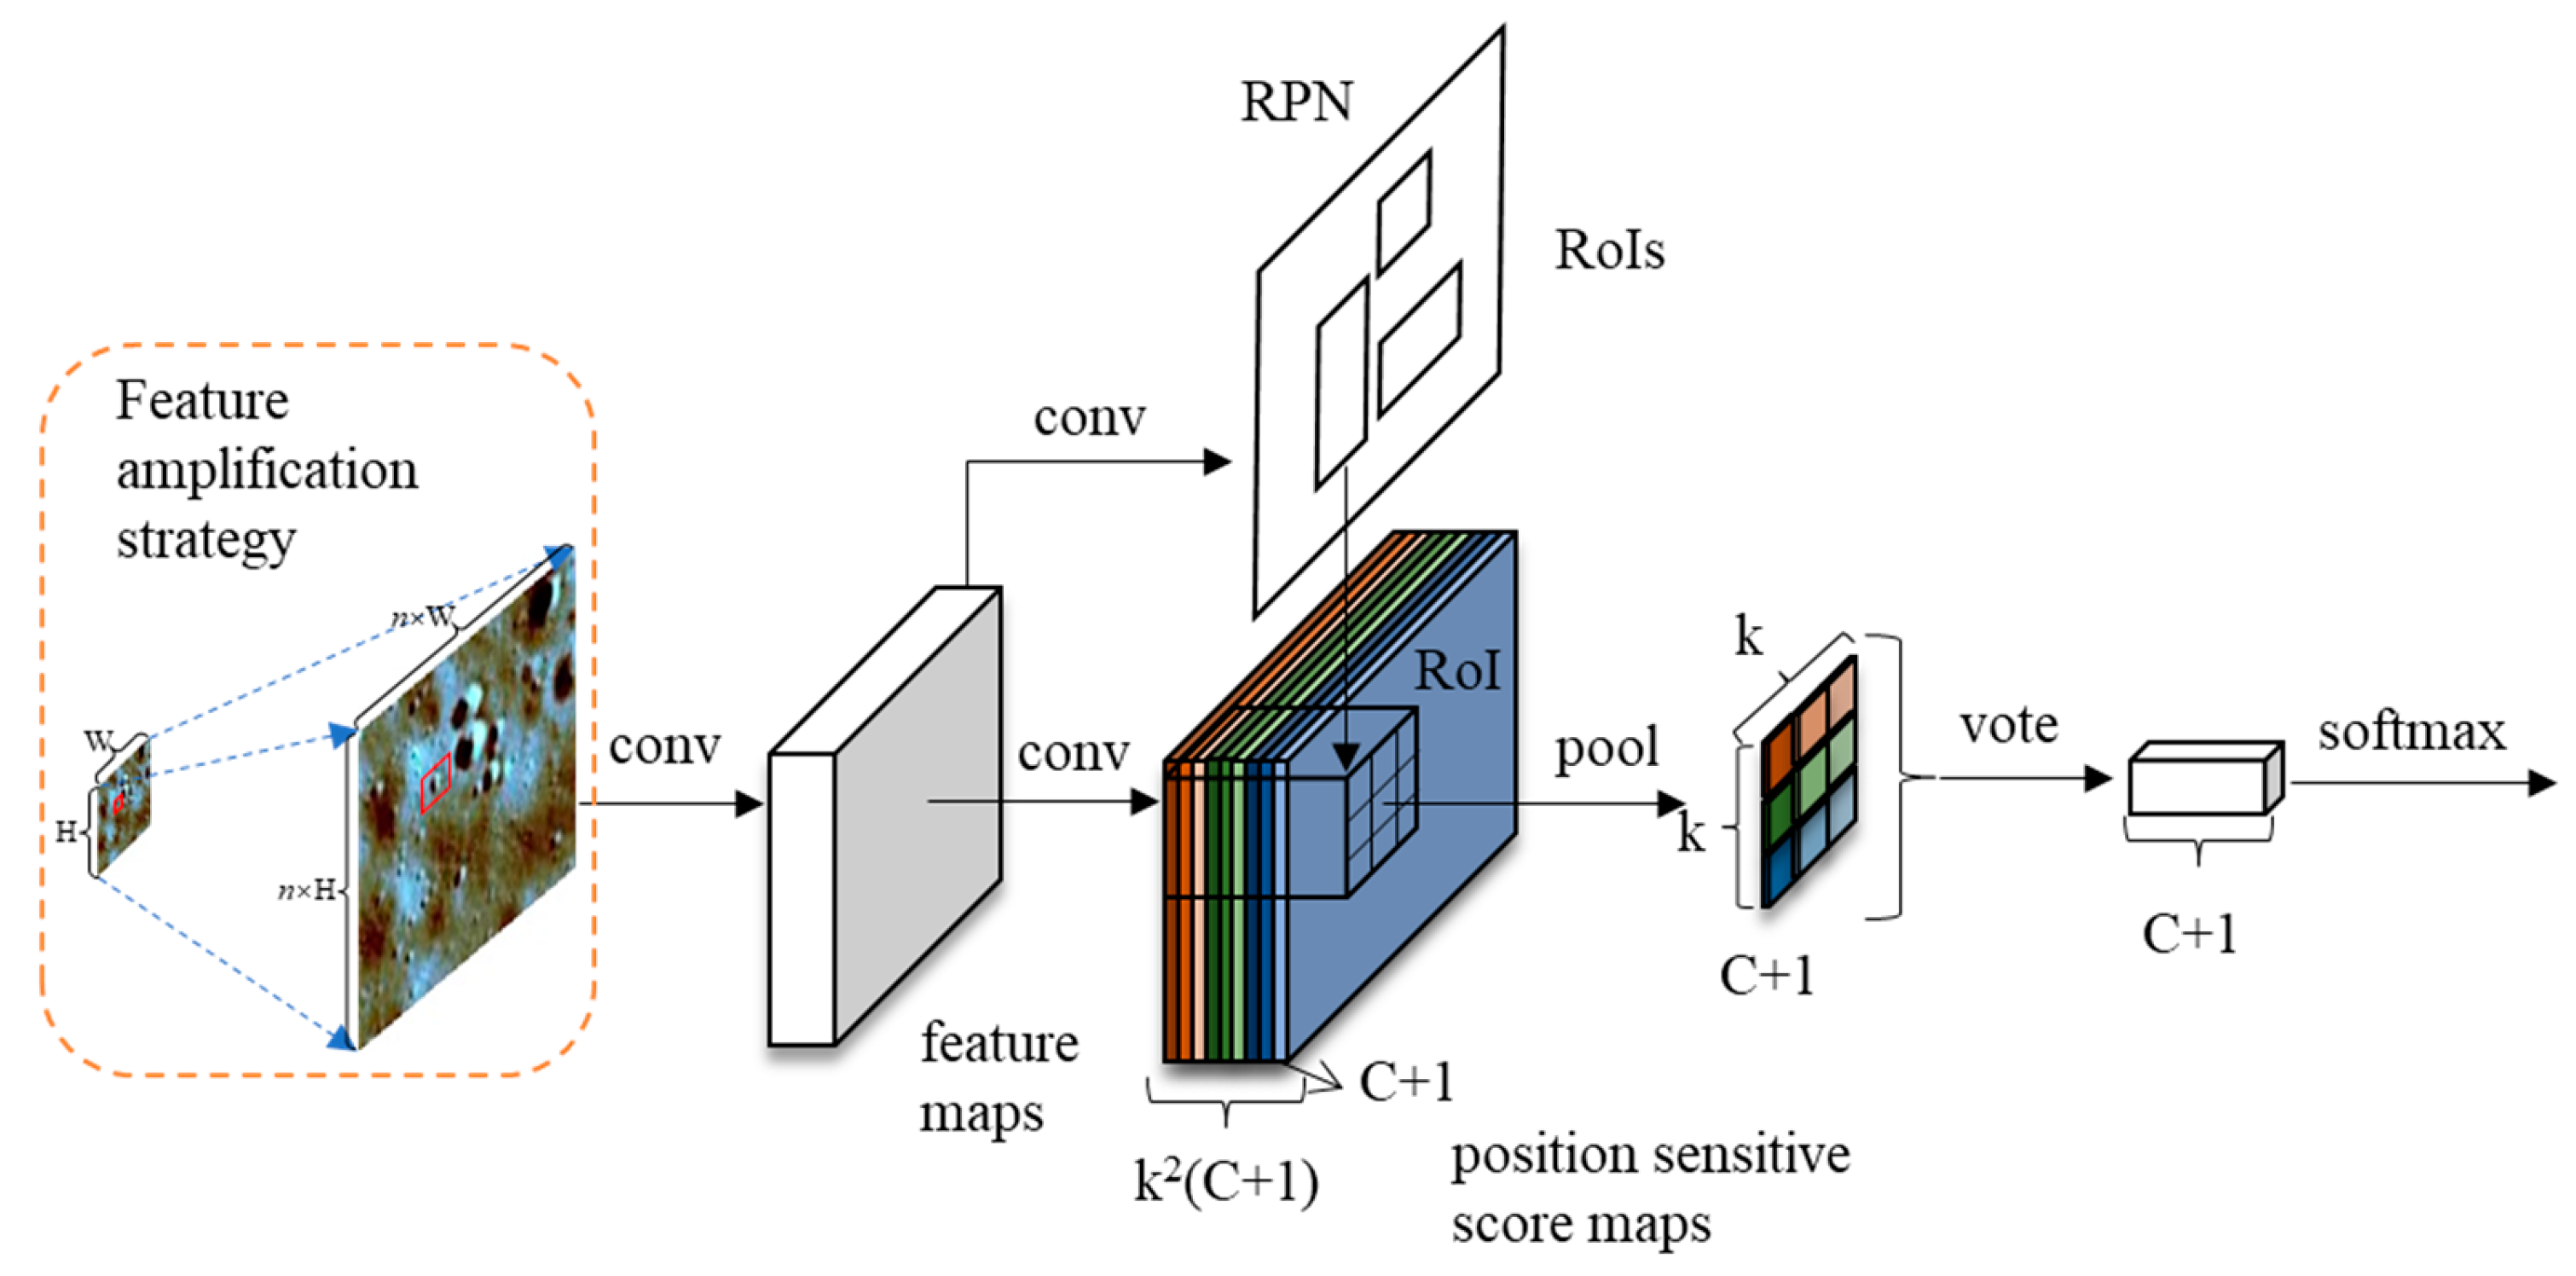
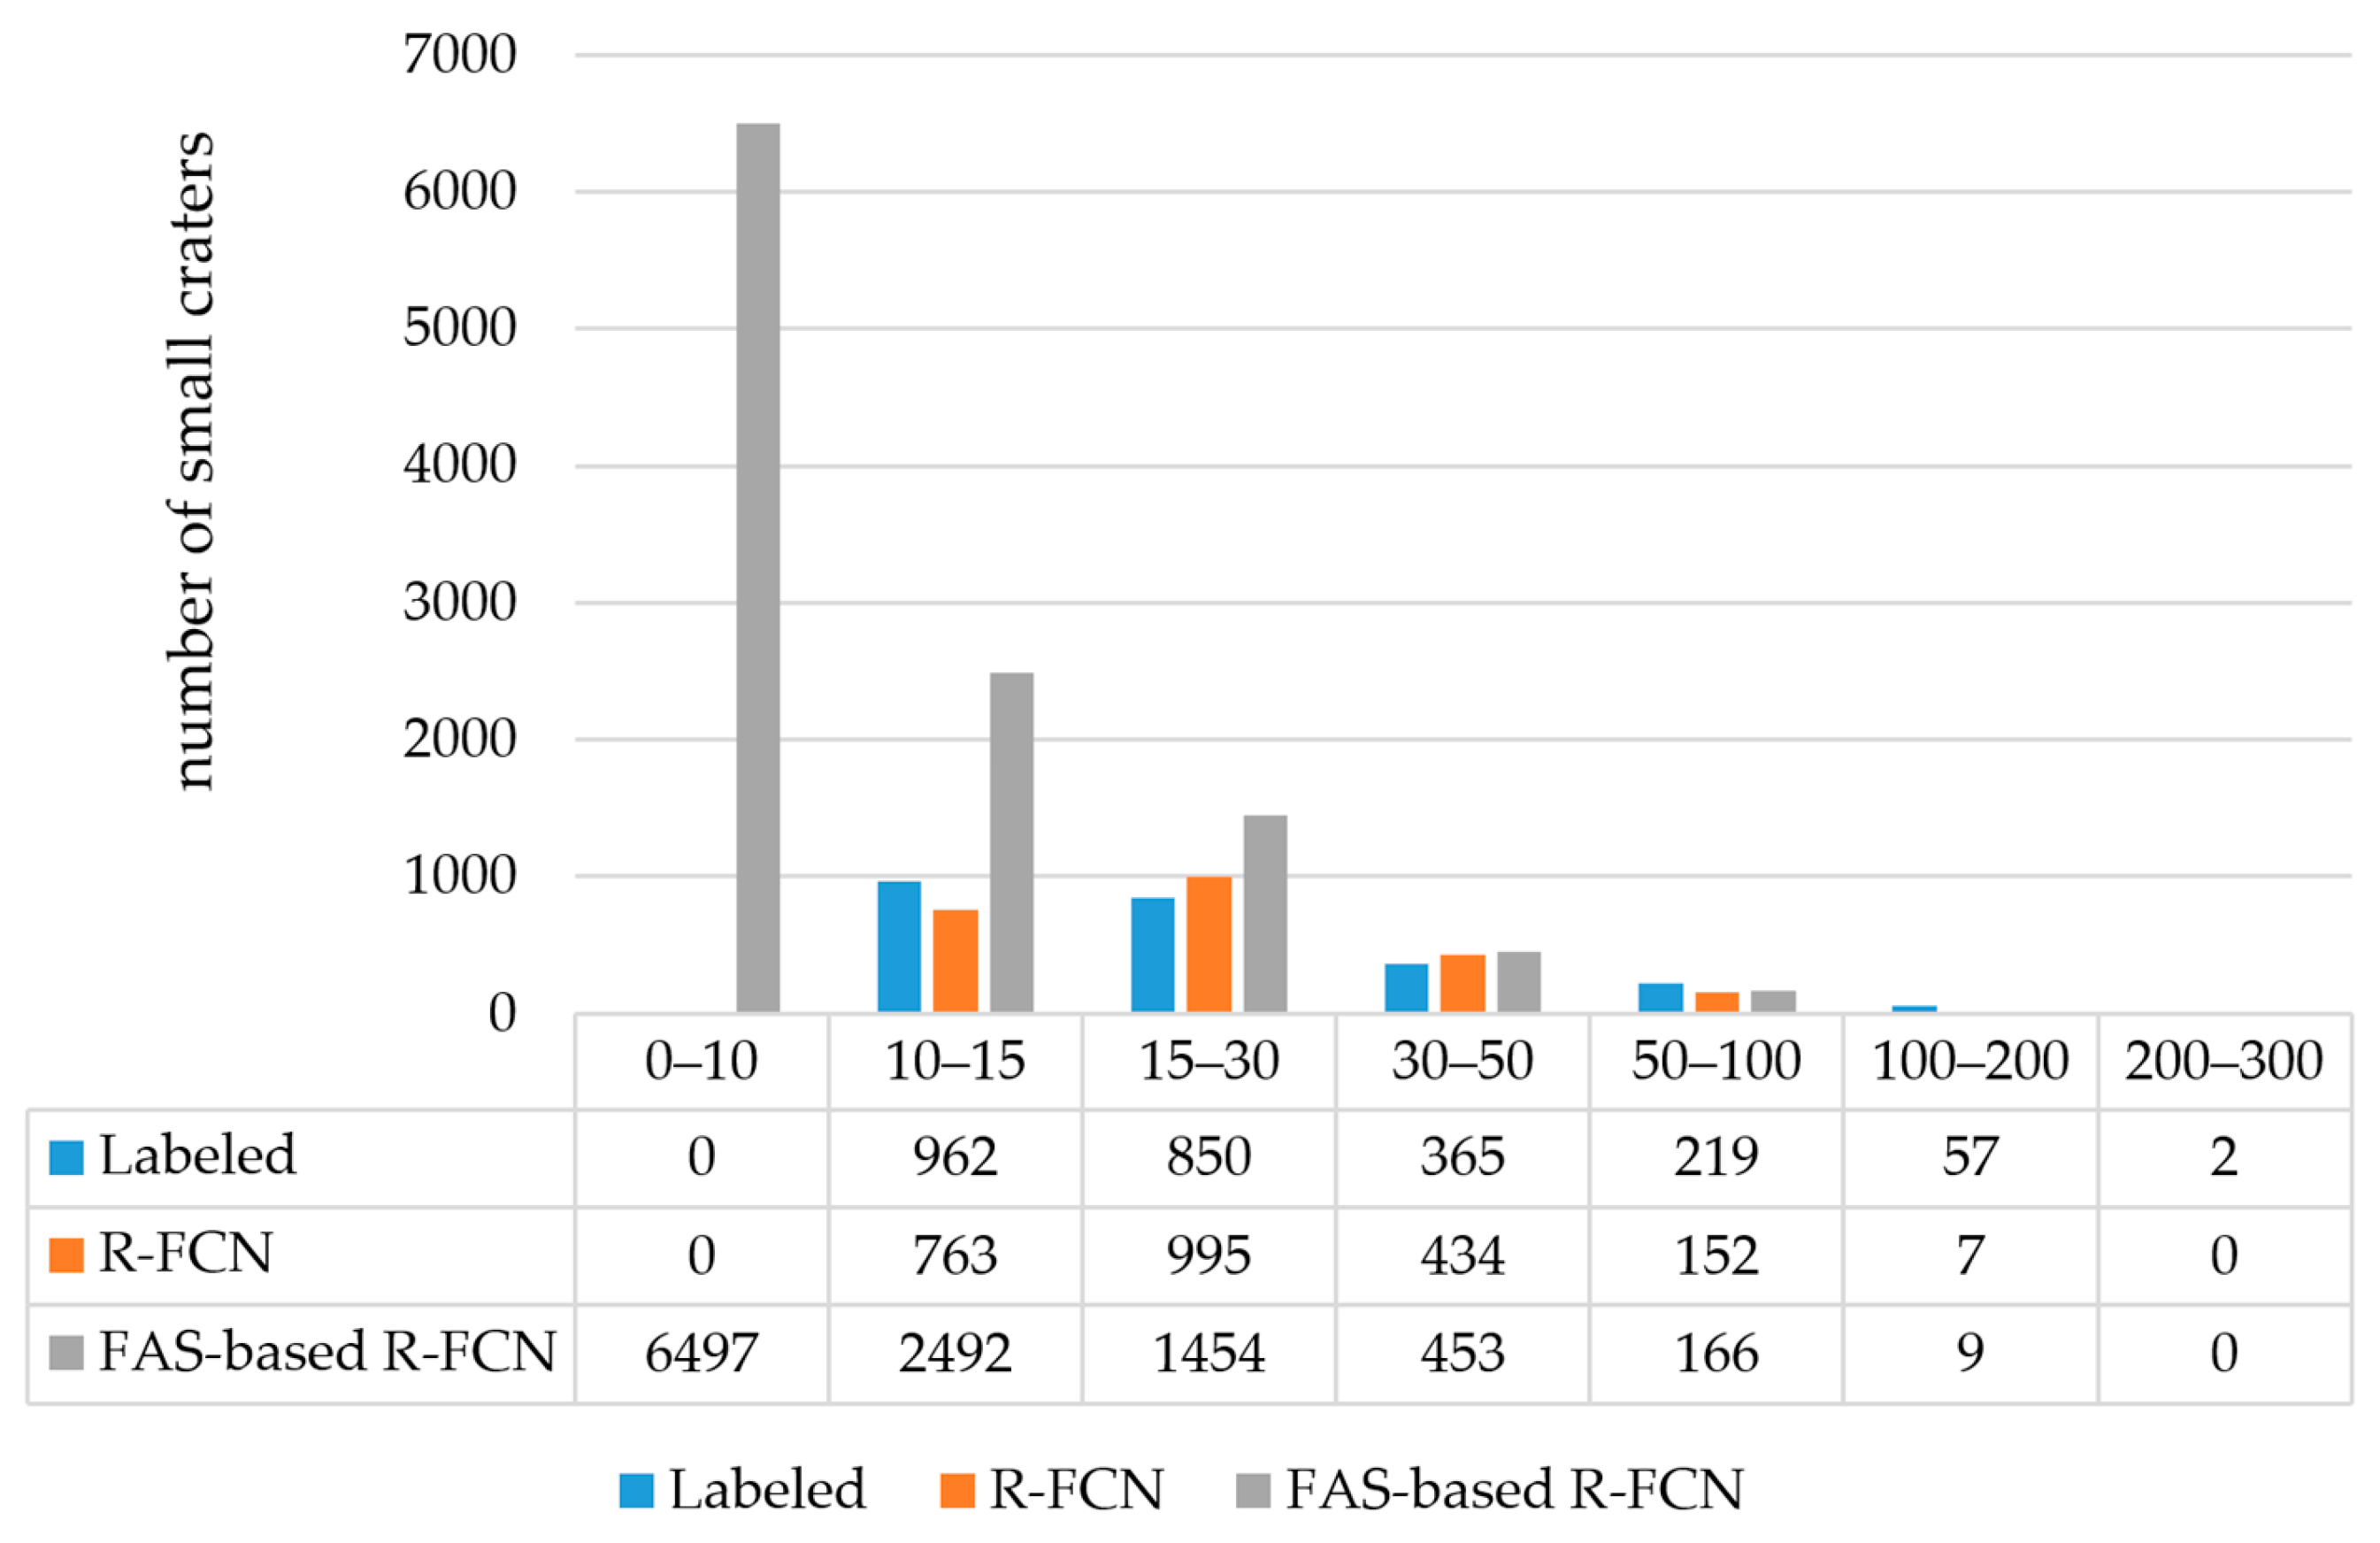
For the comprehensive identification of small lunar craters, we designed a feature amplification strategy using the original grayscale image to enhance the target pixels of small craters and decrease the impact of dense distribution. After this point, small lunar impact craters can be accurately identified through the use of deep convolutional networks [5].
(2)
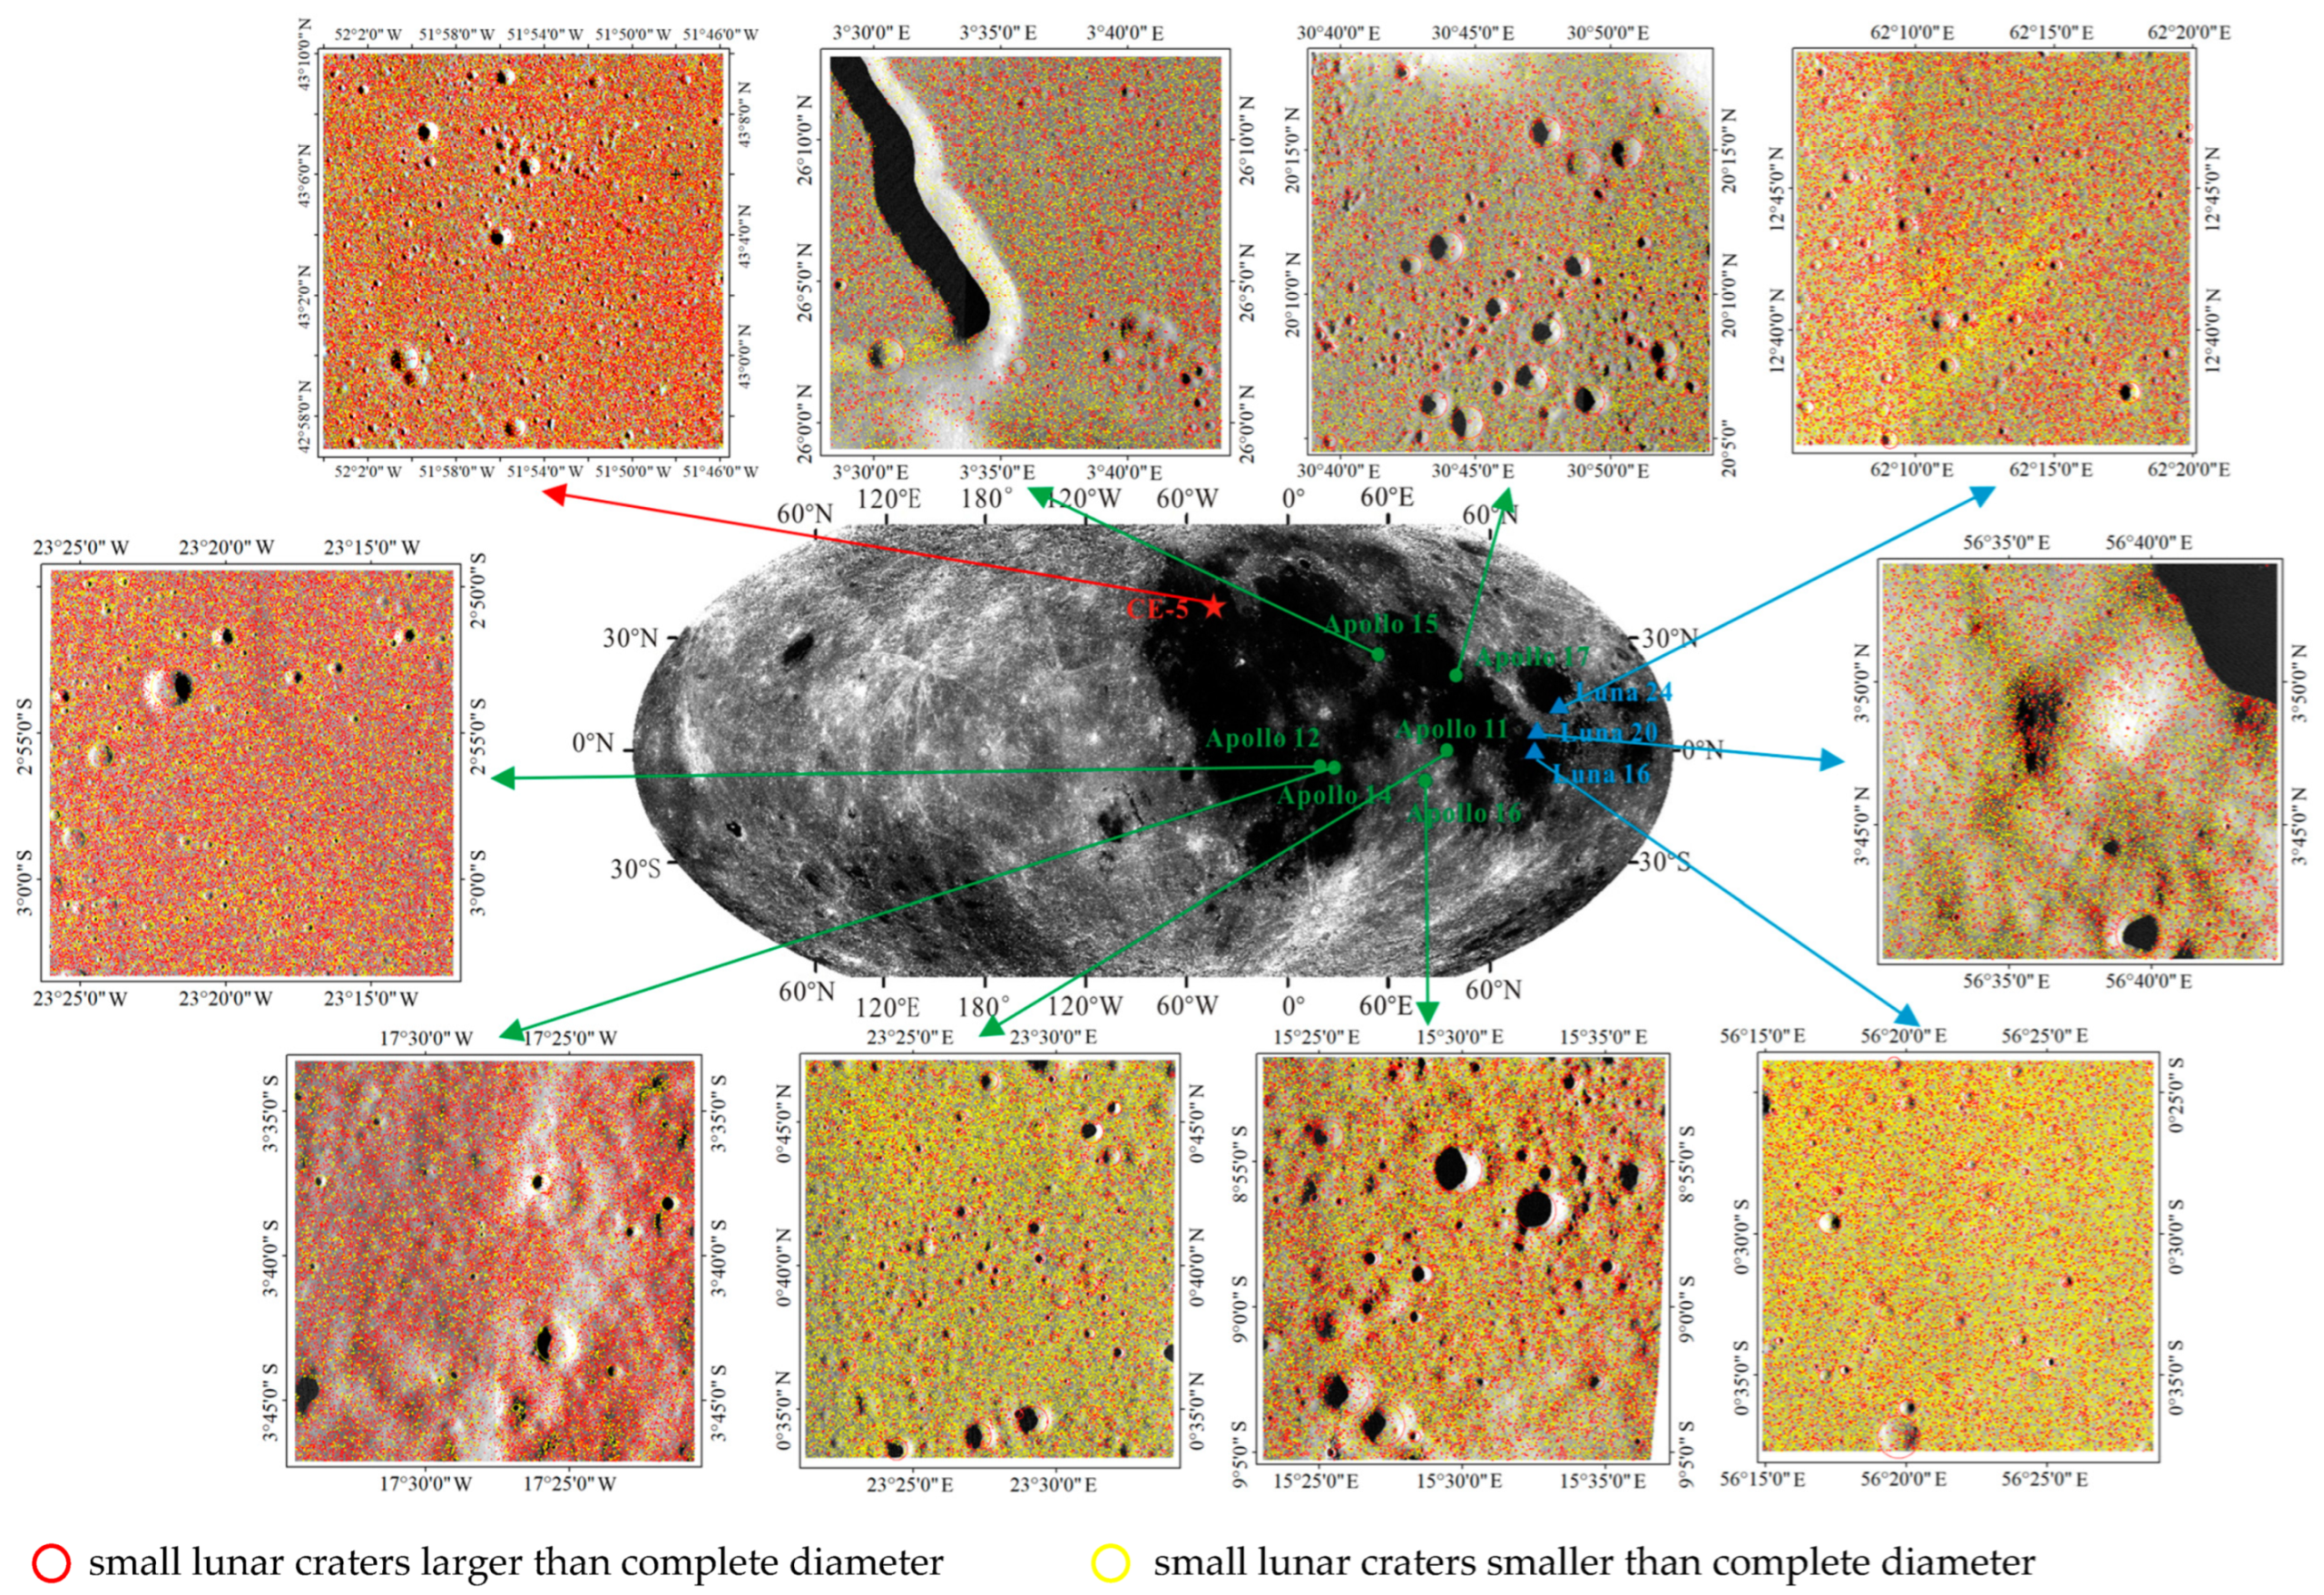
To verify the effectiveness of the identification model, ten returned samples’ lunar probe landing areas [22], including the Apollo series detectors of the United States, the Soviet Union’s Luna program, and China’s Chang’e-5 detector [23], were selected as the research area for small lunar crater recognition. These areas have significant geological significance and lack sufficient identification of small impact craters.
(3)
An intelligent recognition-based small lunar crater dataset was developed, including 413,777 craters with diameters greater than 4.5 m (the greatest quantity among the existing automatically detected small crater catalogs). According to a density distribution and random analysis, the spatial distribution characteristics of the small lunar impact craters over different geological times in the landing areas were derived. The derived data offer important evidence regarding the Moon’s geological evolution.

2. Data and Methods

2.1. Description of the Dataset

The landing areas of the ten returned lunar detectors from the Apollo series detectors of the United States, i.e., Apollo 11, Apollo 12, Apollo 14, Apollo 15, Apollo 16, and Apollo 17, the Soviet Union’s Luna program, i.e., Luna 16, Luna 20, and Luna 24, and China’s Chang’e-5, were selected as the small crater mapping area (Table 1). The LROC NAC data in the Chang’e-5 detector have a spatial resolution of 1.5 m; in contrast, the images of the other nine landing areas have a resolution of 0.5 m. The area of Chang’e-5 and Apollo 11 are 44.29 km2 and 46.67 km2, and those of Apollo 12, Apollo 14, Apollo 15, Apollo 16, Apollo 17, Luna 16, Luna 20, and Luna 24 are all about 49 km2.

2.2. Small Crater Identification Model Based on the Feature Amplification Strategy

To better extract the features of small lunar impact craters and facilitate their effective identification, we developed a feature amplification strategy (FAS) with deep convolutional networks. In the following subsection, an intelligent small crater identification method is presented based on the established feature amplification strategy. The architecture of the small lunar crater identification model based on the feature amplification strategy is shown in Figure 1.

2.2.1. Feature Amplification Strategy

For the LROC NAC, two scales of images are cropped, i.e., 128 × 128 pixels and 256 × 256 pixels for different sizes of small crater detection. After this step, the images are magnified to a specific scale, i.e., feature magnification, which can be determined by the size of the smallest crater expected to be detected by the model. It should be noted that the larger the scale of feature amplification (i.e., the parameter n in Figure 1), the higher the computational effort of the detection model. In the present study, we determined the scale of feature amplification from the following two points: first, the diameter of the lunar craters (at least 5–6 pixels in size) that can be clearly recognized in the LROC NAC image by experts; second, the size of the feature map extracted from the ResNet101 [24] model used in the detection model is one-thirty-second of the size of the input image, meaning that it cannot efficiently represent a small lunar crater with a diameter of 6 pixels. In our experiments, we set the scale of feature amplification to 12 to achieve accurate recognition of small lunar craters without necessitating more computational effort. As can be seen from Figure 1, the fine features of the small lunar craters became prominent when using the feature amplification strategy. Moreover, the presented density of small lunar craters was alleviated to some extent. This ensures the ability of subsequent deep learning detection models to extract the morphological features of small lunar impact craters.

2.2.2. Small Lunar Crater Identification Model

For the identification of small craters, a two-stage crater detection approach with the FAS was designed. The region-based fully convolutional network (R-FCN) [25] was selected as the detection model for use in this study, and the small lunar crater identification model based on the feature amplification strategy is called FAS-based R-FCN. At first, Resnet101 [24], which was pre-trained on ImageNet [26], was utilized as the backbone network of the R-FCN detection model for extracting features from the magnified images. In the first stage, the region proposal network (RPN) coarsely determines the potential regions in the image that contain targets from the feature map, i.e., the regions of interest (ROIs). In the second stage, the model first performs the corresponding pooling process on each class for the position-sensitive score maps at each position and then further adjusts the ROIs to achieve the accurate detection of craters.

3. Experiments and Results

3.1. Experiment Design

3.1.1. Training Strategy

The training samples and test data of the small lunar craters used in the detection model were provided by the Key Laboratory of Lunar and Deep Space Exploration, National Astronomical Observatories, Chinese Academy of Sciences. These small lunar craters were labeled by five domain experts, and the mean boundary of each crater was adopted as the final label to avoid subjectivity. The range of training samples is 52°40′30″W to 52°29′20″W and 45°10′40″N to 45°17′30″N, with an area of 14.8 km2. The test data have a range of 52°02′00″W to 50°34′00″W and 43°08′10″N to 43°34′00″N, covering an area of 420 km2, including four pre-selected regions labeled by domain experts for evaluating model performance. In addition, the training samples were enhanced and with 50% image overlap. The LROC NAC images were used for training and testing, both with a spatial resolution of 1.5 m (Figure 2). After sample enhancement, the number of images obtained from the training set and the test set was 3420 and 44,488, respectively, representing a ratio of approximately 1:13. In the experiments, the proposed FAS-based R-FCN and the typical R-FCN were utilized to identify small lunar impact craters.

3.1.2. Evaluation Metrics

In the present study, the quantitative criteria, i.e., the recall and false-positive rates (FPRs) of object detection, were used to evaluate the performance of the small crater identification model.
In object detection, a bounding box (bbox) is usually used to describe the target location. Recall, indicating the proportion of craters in the test data that are correctly identified, can be formulated as follows:
Recall = TP TP + FN
where TP is the number of true-positive craters, denoting the expert-labeled craters detected by the model, and FN is the number of false-negative craters, indicating that the expert-labeled craters were not identified by the model. In the experiment, if the intersection over union (IoU) values of the expert-labeled craters and the detected craters is more than 0.5, the labeled crater is considered to be detected by the model. High recall suggests that the model shows good performance.
For the FPRs criterion, the following manner was used to calculate the value of FPRs. Specifically, first, 10% of all identified small craters were randomly selected, then, five experts independently evaluated the validity of each identified crater and the number of false-positive craters, i.e., FP. Thus, the FPRs, indicating the proportion of false-positive craters among the craters examined by experts, can be calculated as follows:
F PRs = FP N
where N is the total number of craters examined by experts and FP is the false-positive craters assessed by experts. A low FPR suggests that the model shows good performance.

3.1.3. Implementation Details and Parameter Settings

For the experiments conducted in the present study, the small lunar crater identification model was developed based on the ResNet101 backbone pretrained on ImageNet. The stochastic gradient descent optimization algorithm was used to train the model, with momentum and weight decay set to 0.9 and 0.0001, respectively. The learning rate was 0.02, and the batch size was set to 2. The proposed method was implemented on a computer with an Intel(R) Core (TM) i7-5930K CPU at 3.50 GHz, an NVIDIA GeForce GTX TITAN X GPU, and 128 GB of RAM.

3.2. Results

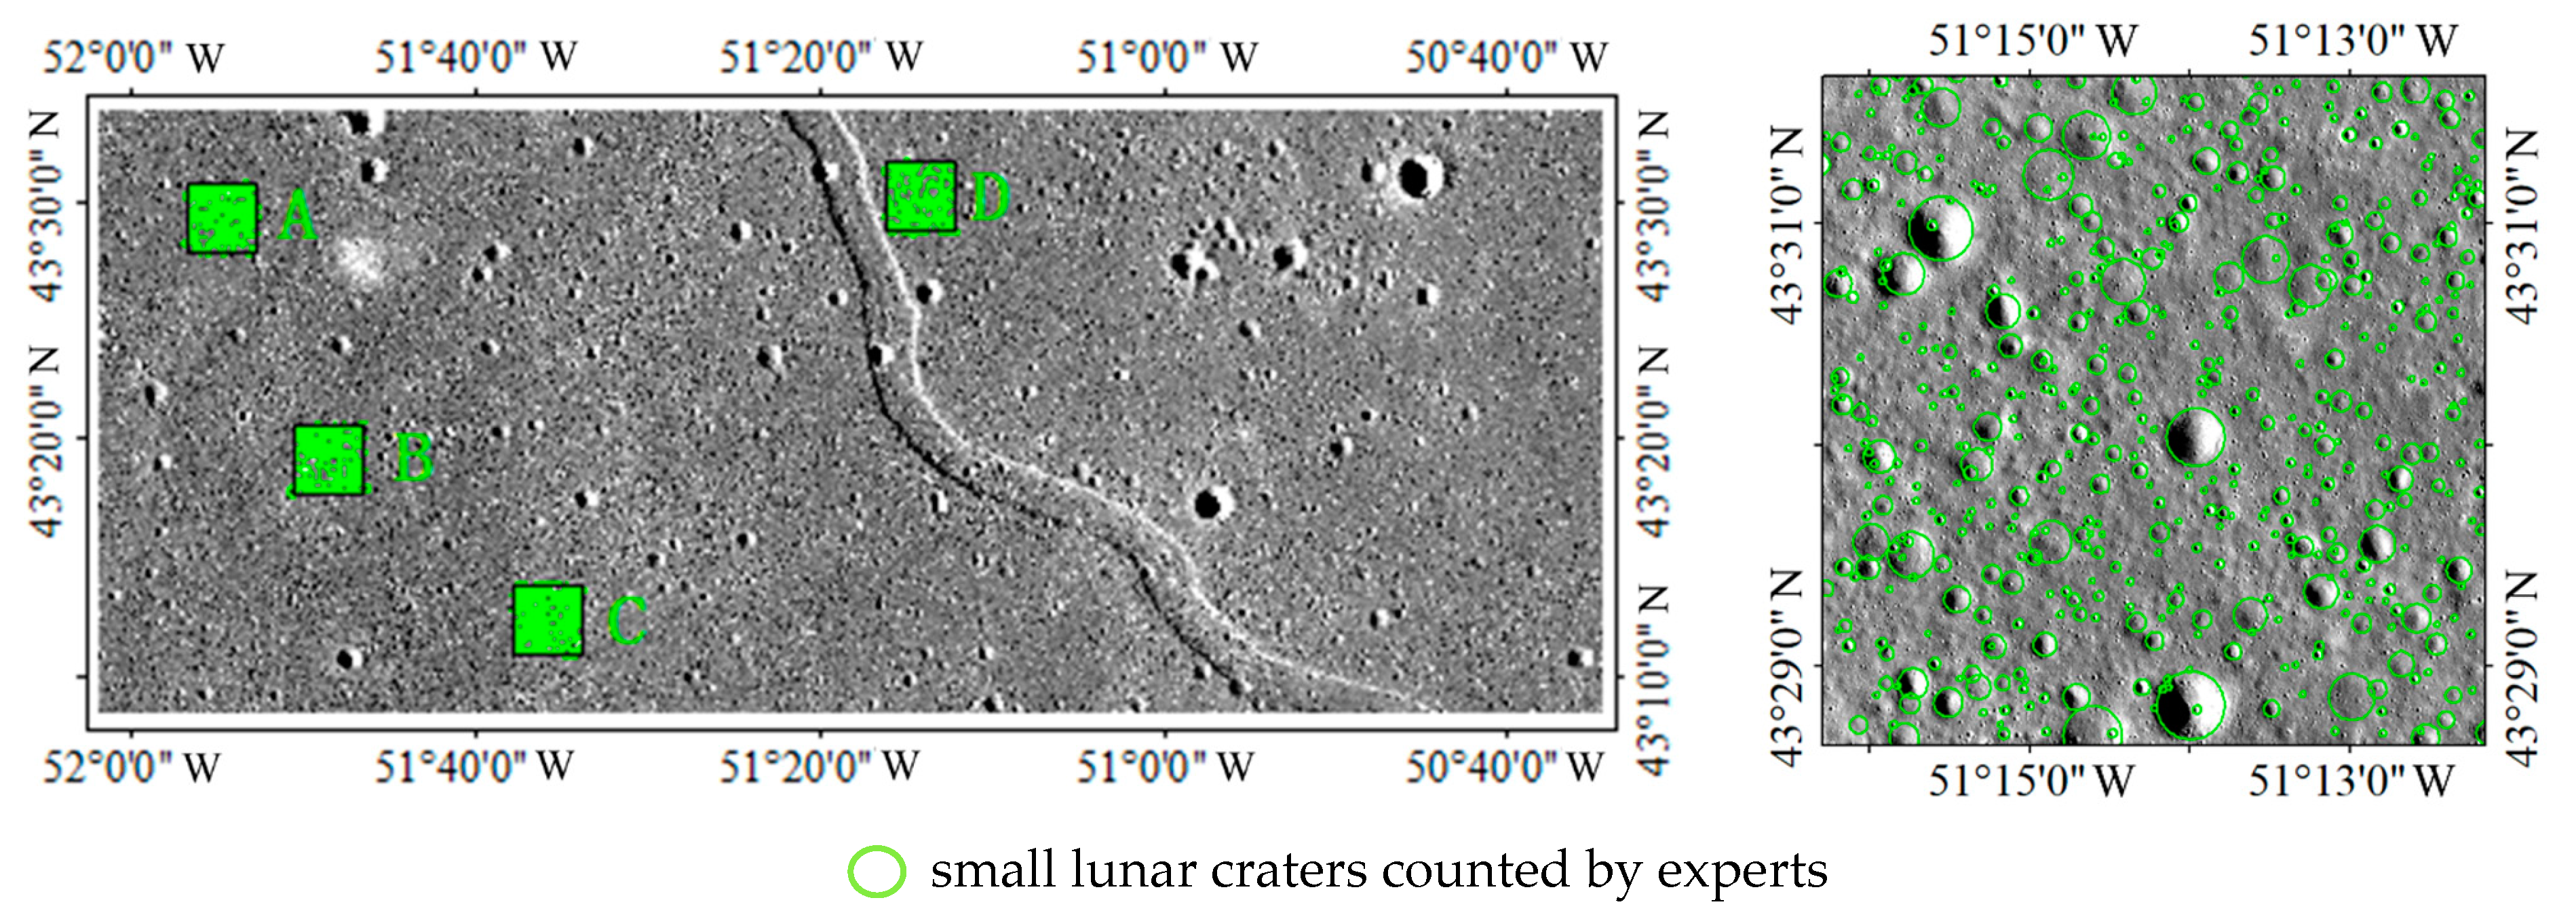
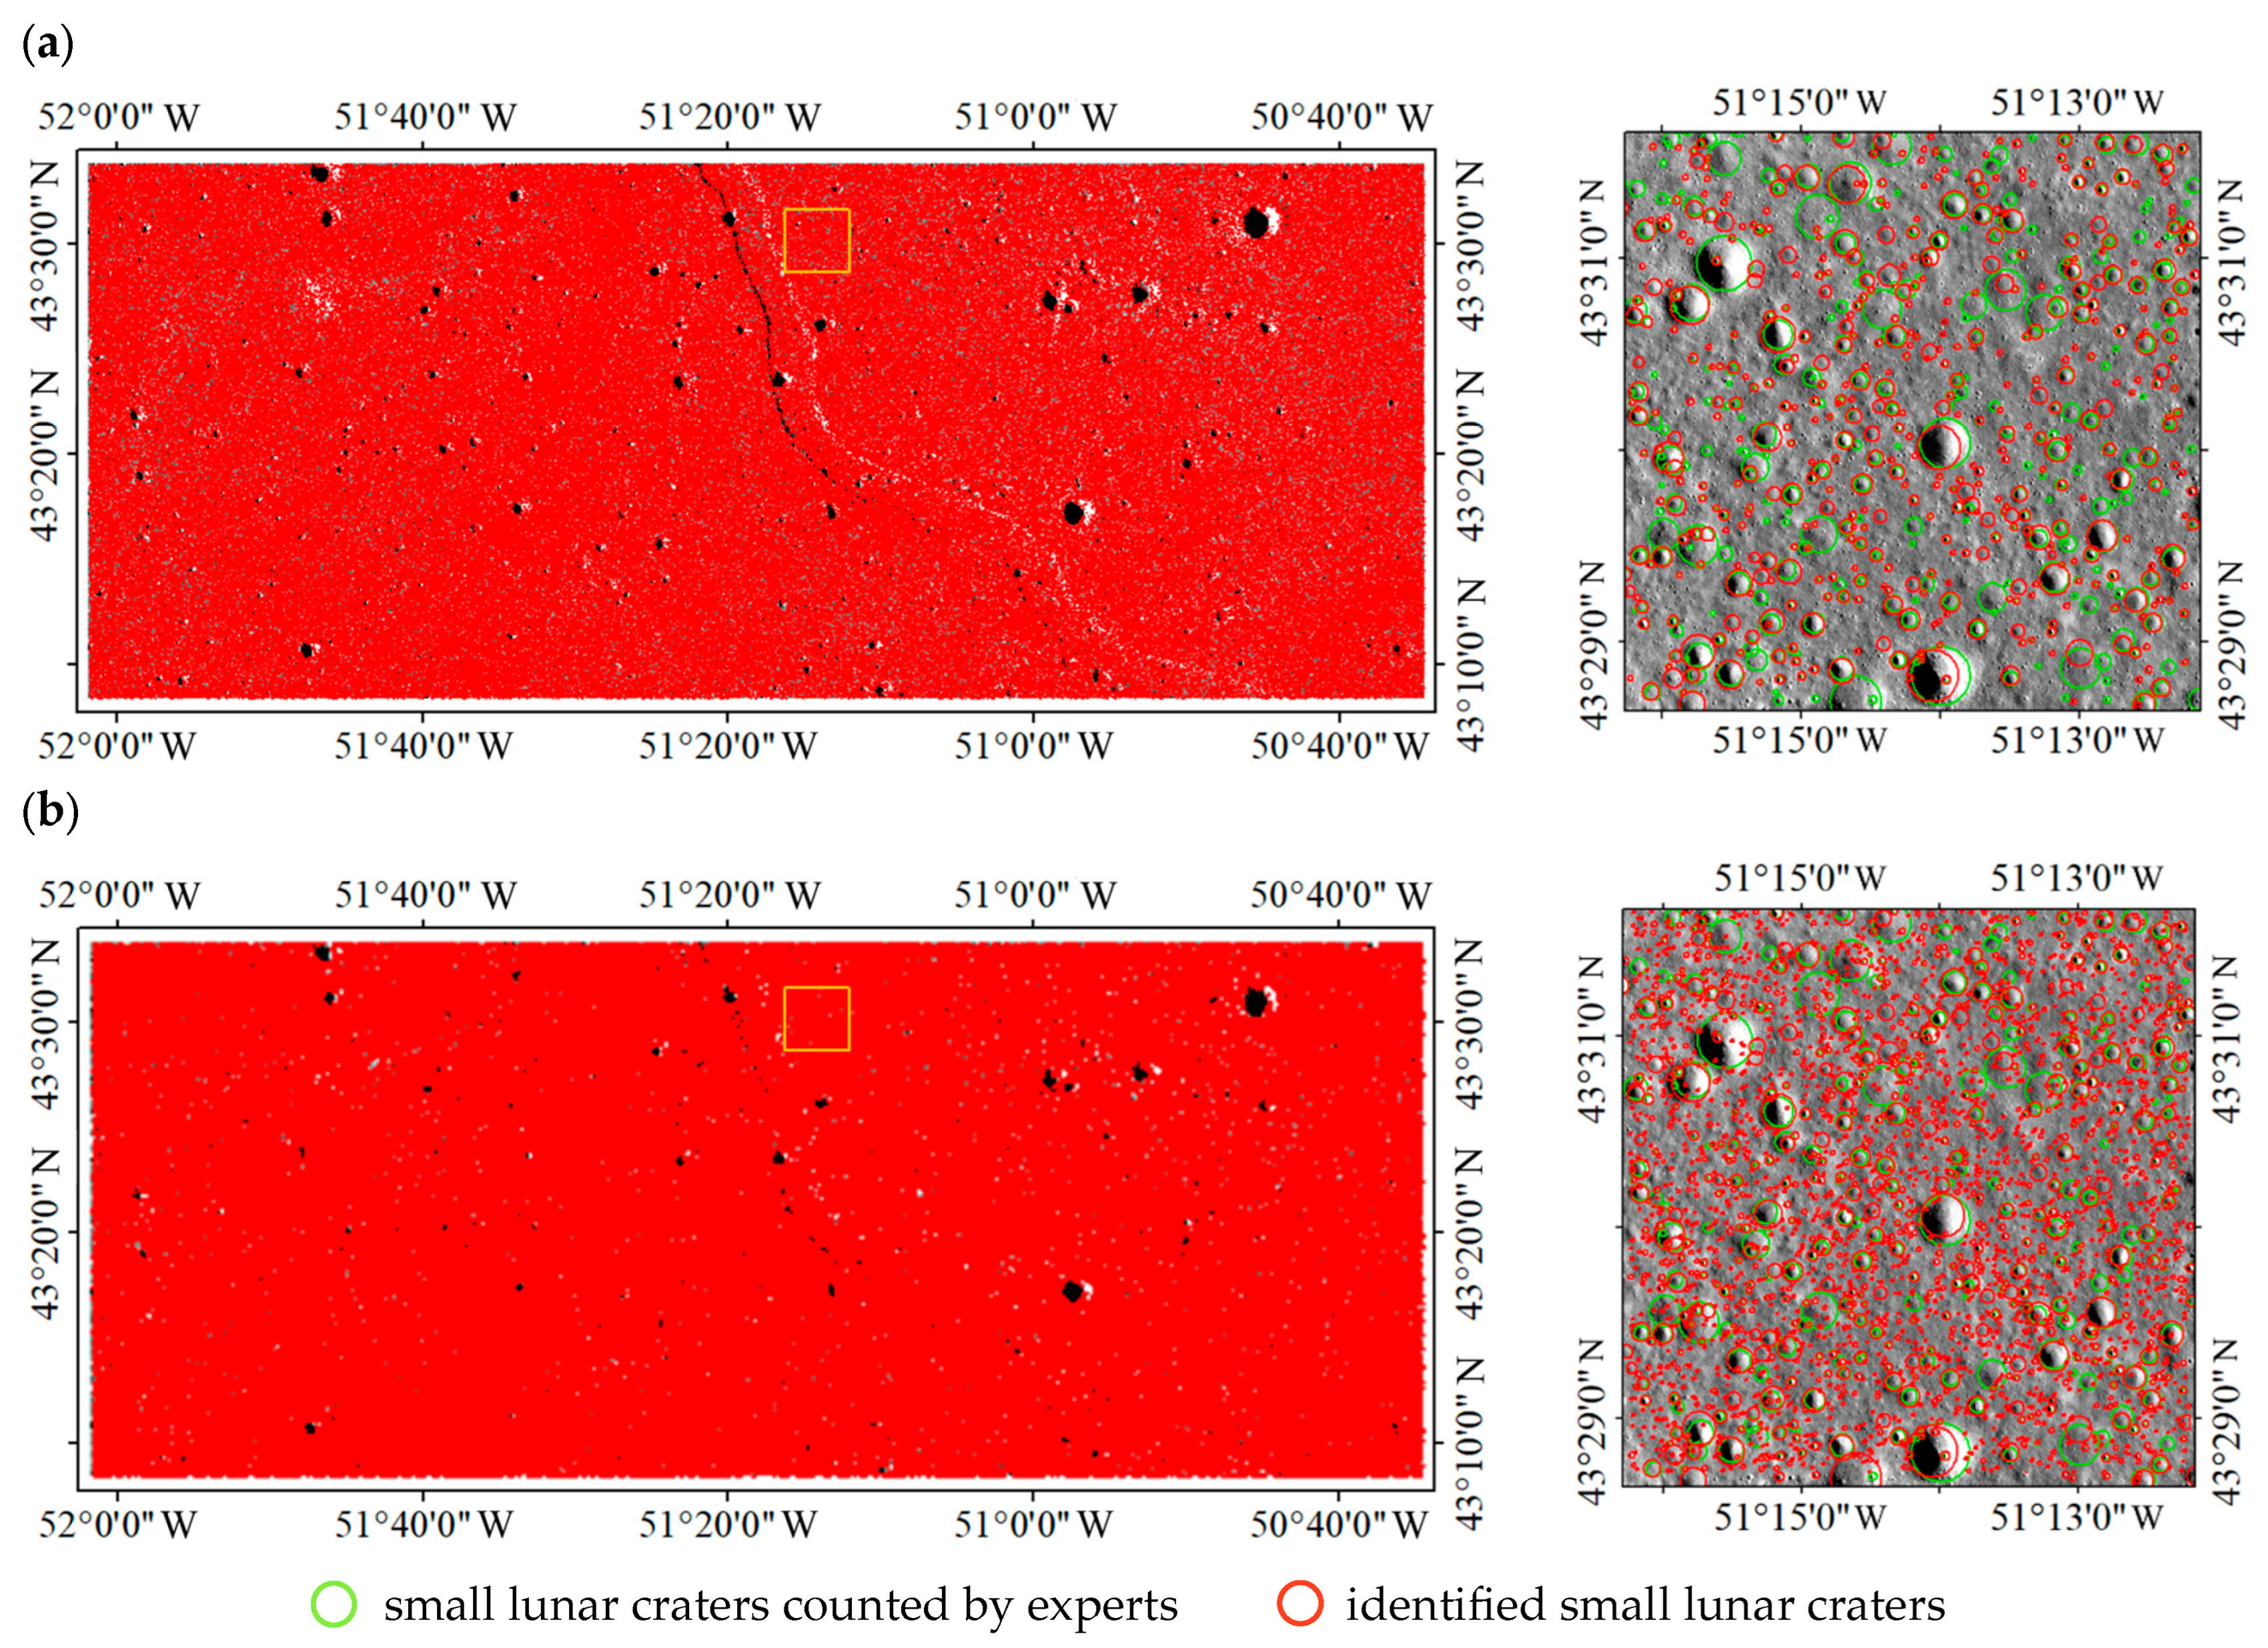
3.2.1. Identified Results in the Test Area

In the following section, the results of the FAS-based small lunar crater identification model in the test area are analyzed. Figure 3 shows the small lunar craters identified with the proposed FAS-based R-FCN and the typical R-FCN. It can be observed that the FAS-based R-FCN identifies a significantly greater number of small lunar craters than the typical R-FCN. Meanwhile, the minimum diameter of the impact craters identified by the typical R-FCN is about 12.95 m; in contrast, the minimum diameter of the impact craters identified by the FAS-based R-FCN reaches 3.05 m. The proposed FAS-based R-FCN exhibits a stronger recognition ability for small lunar impact craters.
However, the FAS-based R-FCN also shows limitations in that some small impact craters are missed. As shown in Figure 4, the unidentified small lunar craters are indicated by a blue circle. The main reasons for failed detection are as follows: first, some small craters exhibit degradation (Figure 4a). Second, there is an overlap between the impact craters (Figure 4b), resulting in the edge of the crater not being fully defined. Third, some small craters are shallow and difficult to detect (Figure 4c). Due to the influence of lighting, some small craters appear over-exposed as they are affected by the lighting conditions when the image is captured (Figure 4d), making it difficult for the model to use the learned feature to detect them.
For the evaluation metrics mentioned above, the small lunar craters from the four test areas, A, B, C, and D, counted by the experts, as well as the newly identified craters by the FAS-based R-FCN and the typical R-FCN, were used to calculate the recall and FPRs. The results of accuracy verification demonstrate that the vast majority of small lunar craters in the test data can be recognized by the FAS-based R-FCN, i.e., the recall rate is 86.97%, and the false-positive rate for the identified craters is as low as 0.54% ± 0.16% (Table 2). However, the recall rate of the typical R-FCN is roughly only 33% and shows major issues regarding the missed detection of small lunar craters.
Figure 5 shows the number of small craters identified with the FAS-based R-FCN and the typical R-FCN in the test area. In the four test areas, for small lunar craters with a diameter range of 10 m to 15 m, the number of craters identified by the FAS-based R-FCN increased by 3.3 times the number identified by the typical R-FCN and by 2.6 times compared with the number of small craters counted by experts. It is worth noting that the experts were unable to identify small lunar craters within 10 m. However, the FAS-based R-FCN has the ability to capture fine features of small-scale impact craters and can identify small lunar craters with a diameter of less than 10 m. The minimum diameter of the identified small lunar craters with the FAS-based R-FCN reached 4.5 m. For the small craters with a diameter ranging from 15 m to 50 m, the FAS-based R-FCN and the typical R-FCN both identified more craters than the number counted by experts. For craters with a diameter ranging from 50 m to 200 m, the number of small craters identified by the FAS-based R-FCN is only slightly greater than the number identified by the typical R-FCN. Two craters with a diameter greater than 200 m were not identified when using the two methods. This result relates to the LROC NAC images used for identification having a spatial resolution of 1.5 m and the size of the training set and test set being 128 × 128 pixels. Only small impact craters with a diameter of less than 192 m (1.5 × 128 = 192) can be fully displayed in the training and testing images. Therefore, the proposed FAS-based R-FCN and the typical R-FCN model cannot identify small lunar impact craters with a diameter of greater than 200 m.

3.2.2. Small Lunar Crater Dataset within the Lunar Landing Areas

Based on the proposed FAS-based R-FCN, 228,897, 142,872, and 42,008 small lunar impact craters were identified in the landing areas of the Apollo, Luna, and Chang’e-5 missions, respectively (Figure 6). In addition, the newly identified small lunar craters were analyzed in terms of quantity by diameter (Table 3). In each landing area, the diameter distribution of small impact craters shows not only varying degrees of difference but also a similar pattern. Small lunar craters with a diameter of less than 7.8 m are relatively rare and their identification is limited by image resolution. Small craters with a diameter ranging from 7.8 m to 16 m are characterized by high frequency. For craters with a diameter greater than 16 m, the number of small craters decreases as the diameter increases, i.e., there were roughly 60 on average in the ten landing areas. To ensure the completeness of small impact crater identification, any unidentified small lunar craters with a diameter greater than 200 m were manually labeled. In conclusion, an intelligent recognition-based small lunar impact crater dataset comprising 413,777 craters was derived and has been made available (see Table S1 in the Supplementary Materials).
The diameter distribution of identified small craters in the ten landing areas is shown in Figure 7. From Figure 7, it can be seen that the diameter distribution of identified small craters in the ten lunar landing areas shows significant differences. The number of small craters with diameters ranging from 4.5 m to 5.5 m accounts for 0.03% of the total number identified. Small craters with a diameter ranging from 5.5 m to 7.8 m are relatively low in frequency, accounting for approximately 6.48% of the total number identified. Small impact craters with a diameter concentrated within the range of 7.8 m to 11 m are the most frequently identified, with an enormous quantity being detected, accounting for 60.44% of the samples. There are relatively more small craters with diameters ranging from 11 m to 16 m, accounting for about 19.95% of the samples. The number of small impact craters with a diameter ranging from 16 m to 22 m is lower, accounting for 7.09% of the sample. The number of craters greater than 22 m in diameter continues to decrease, with craters with diameters ranging from 22 m to 31 m, 31 m to 44 m, 44 m to 62 m, and 62 m to 88 m representing 2.73%, 1.65%, 1.23%, and 0.25% of the total number of identified small craters, respectively. Craters with a diameter greater than 80 m are relatively rare.

4. Discussion

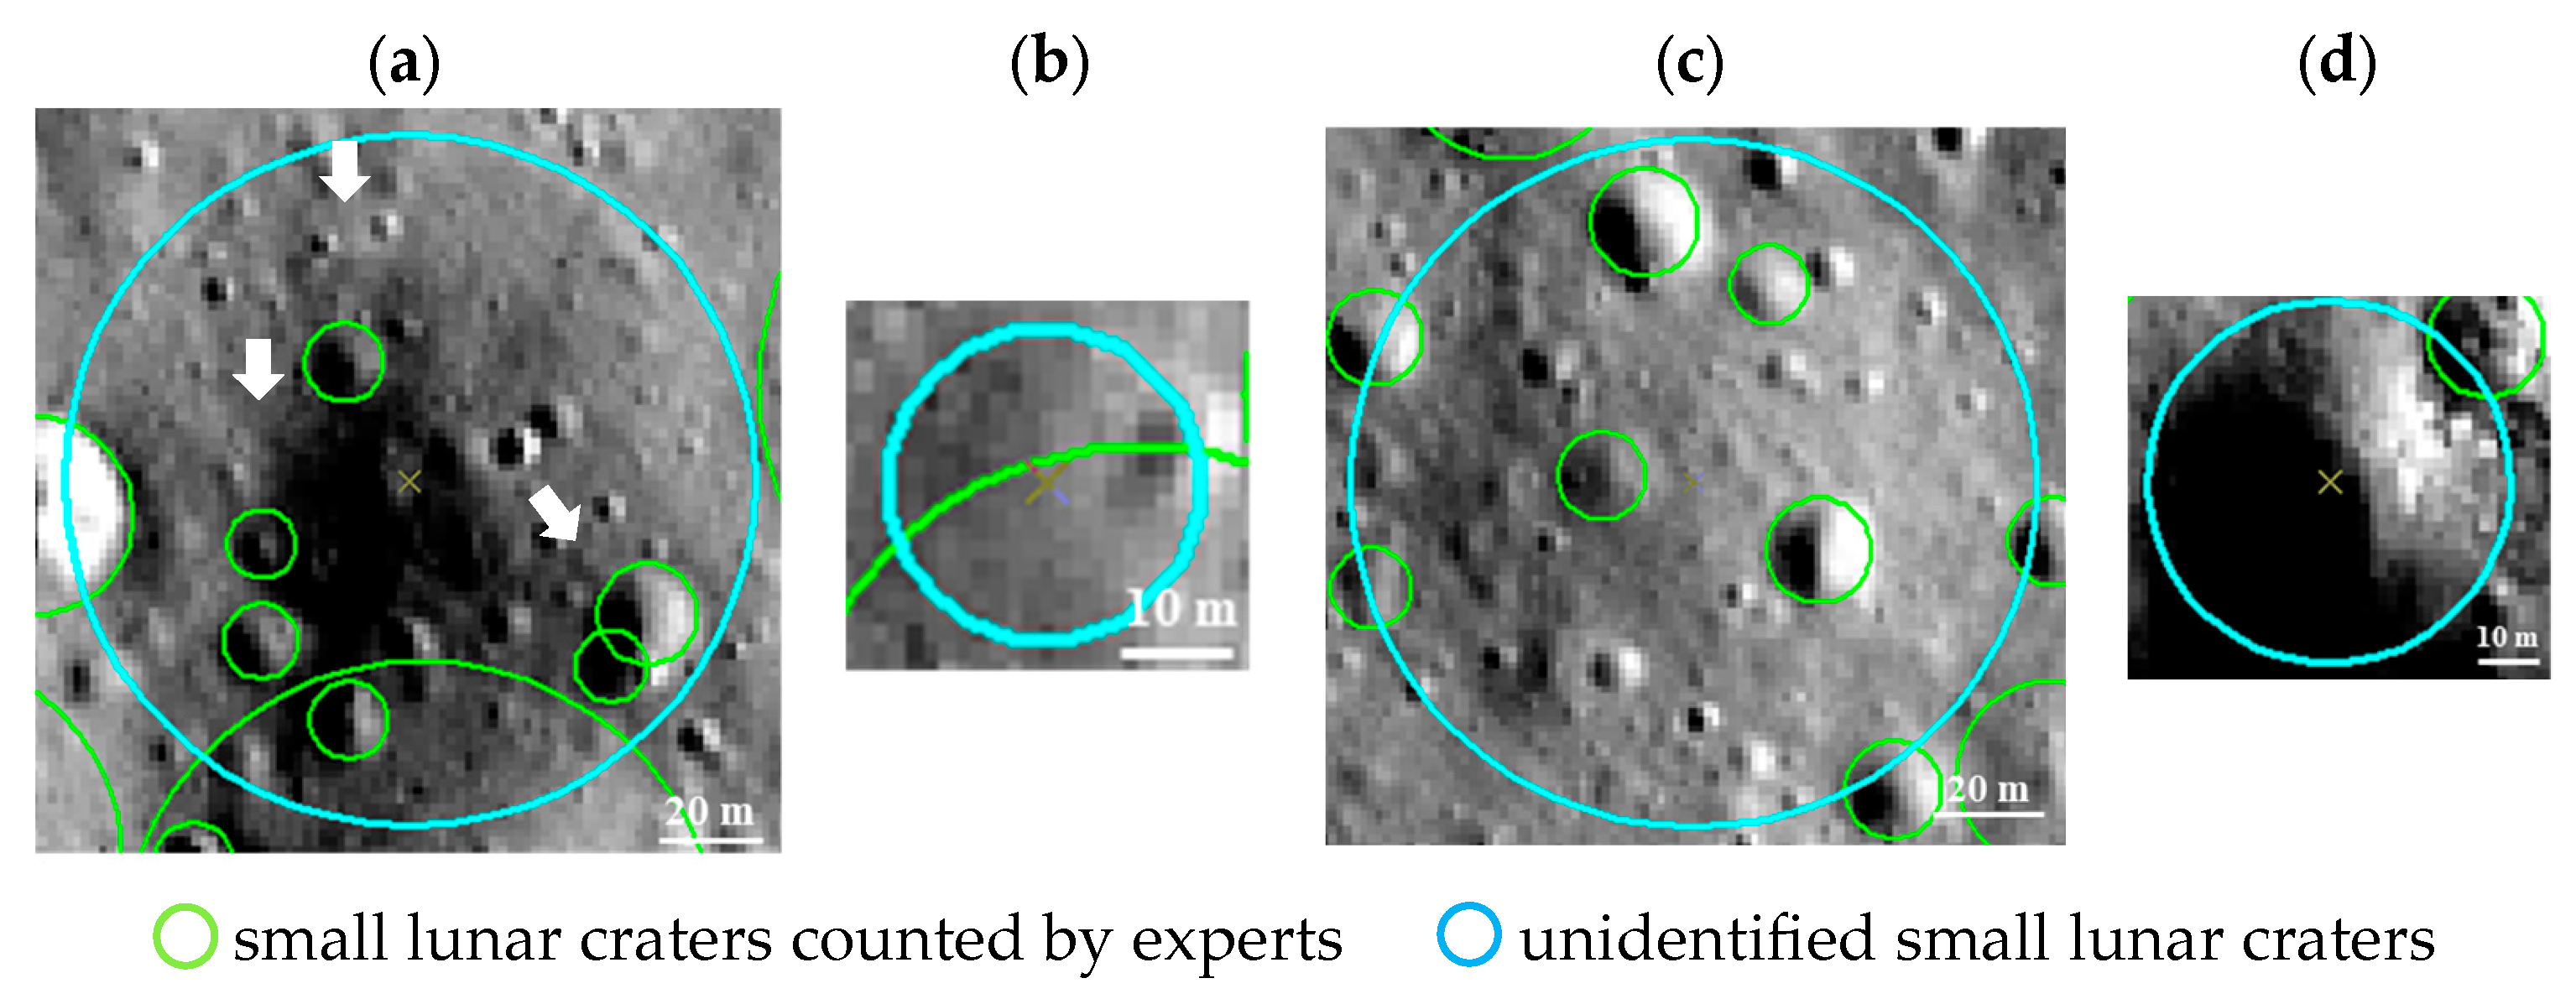
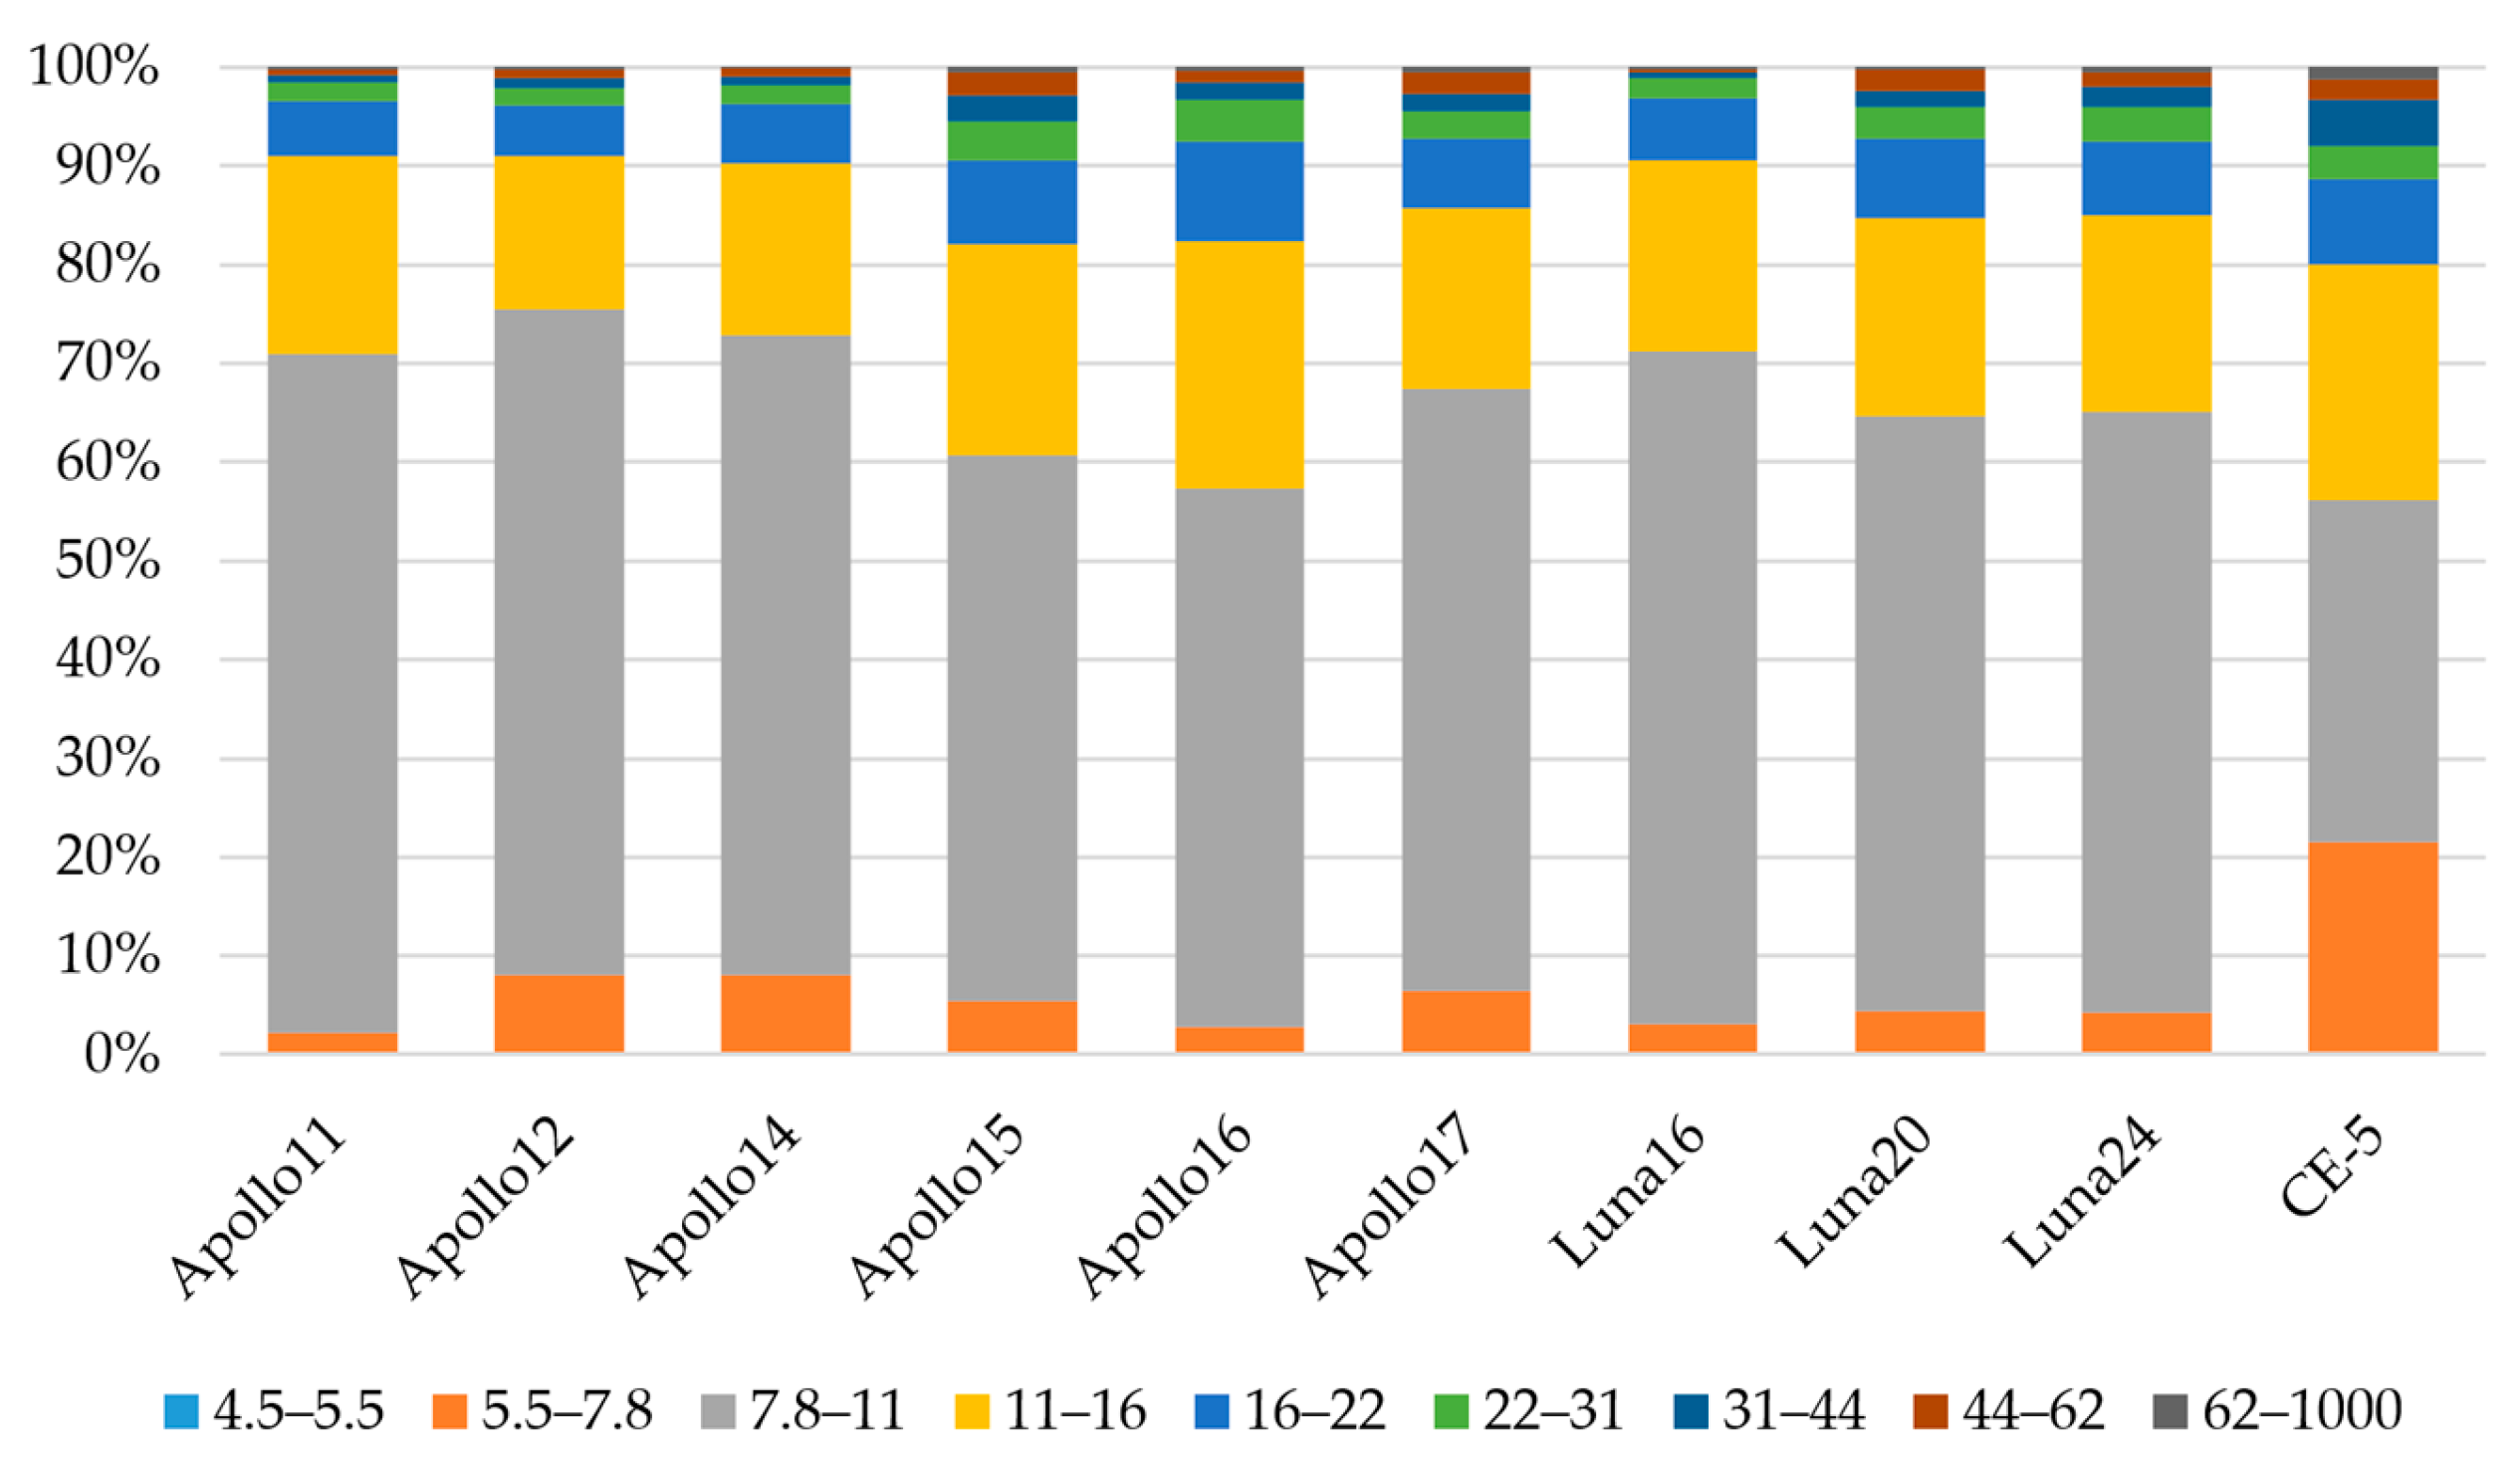
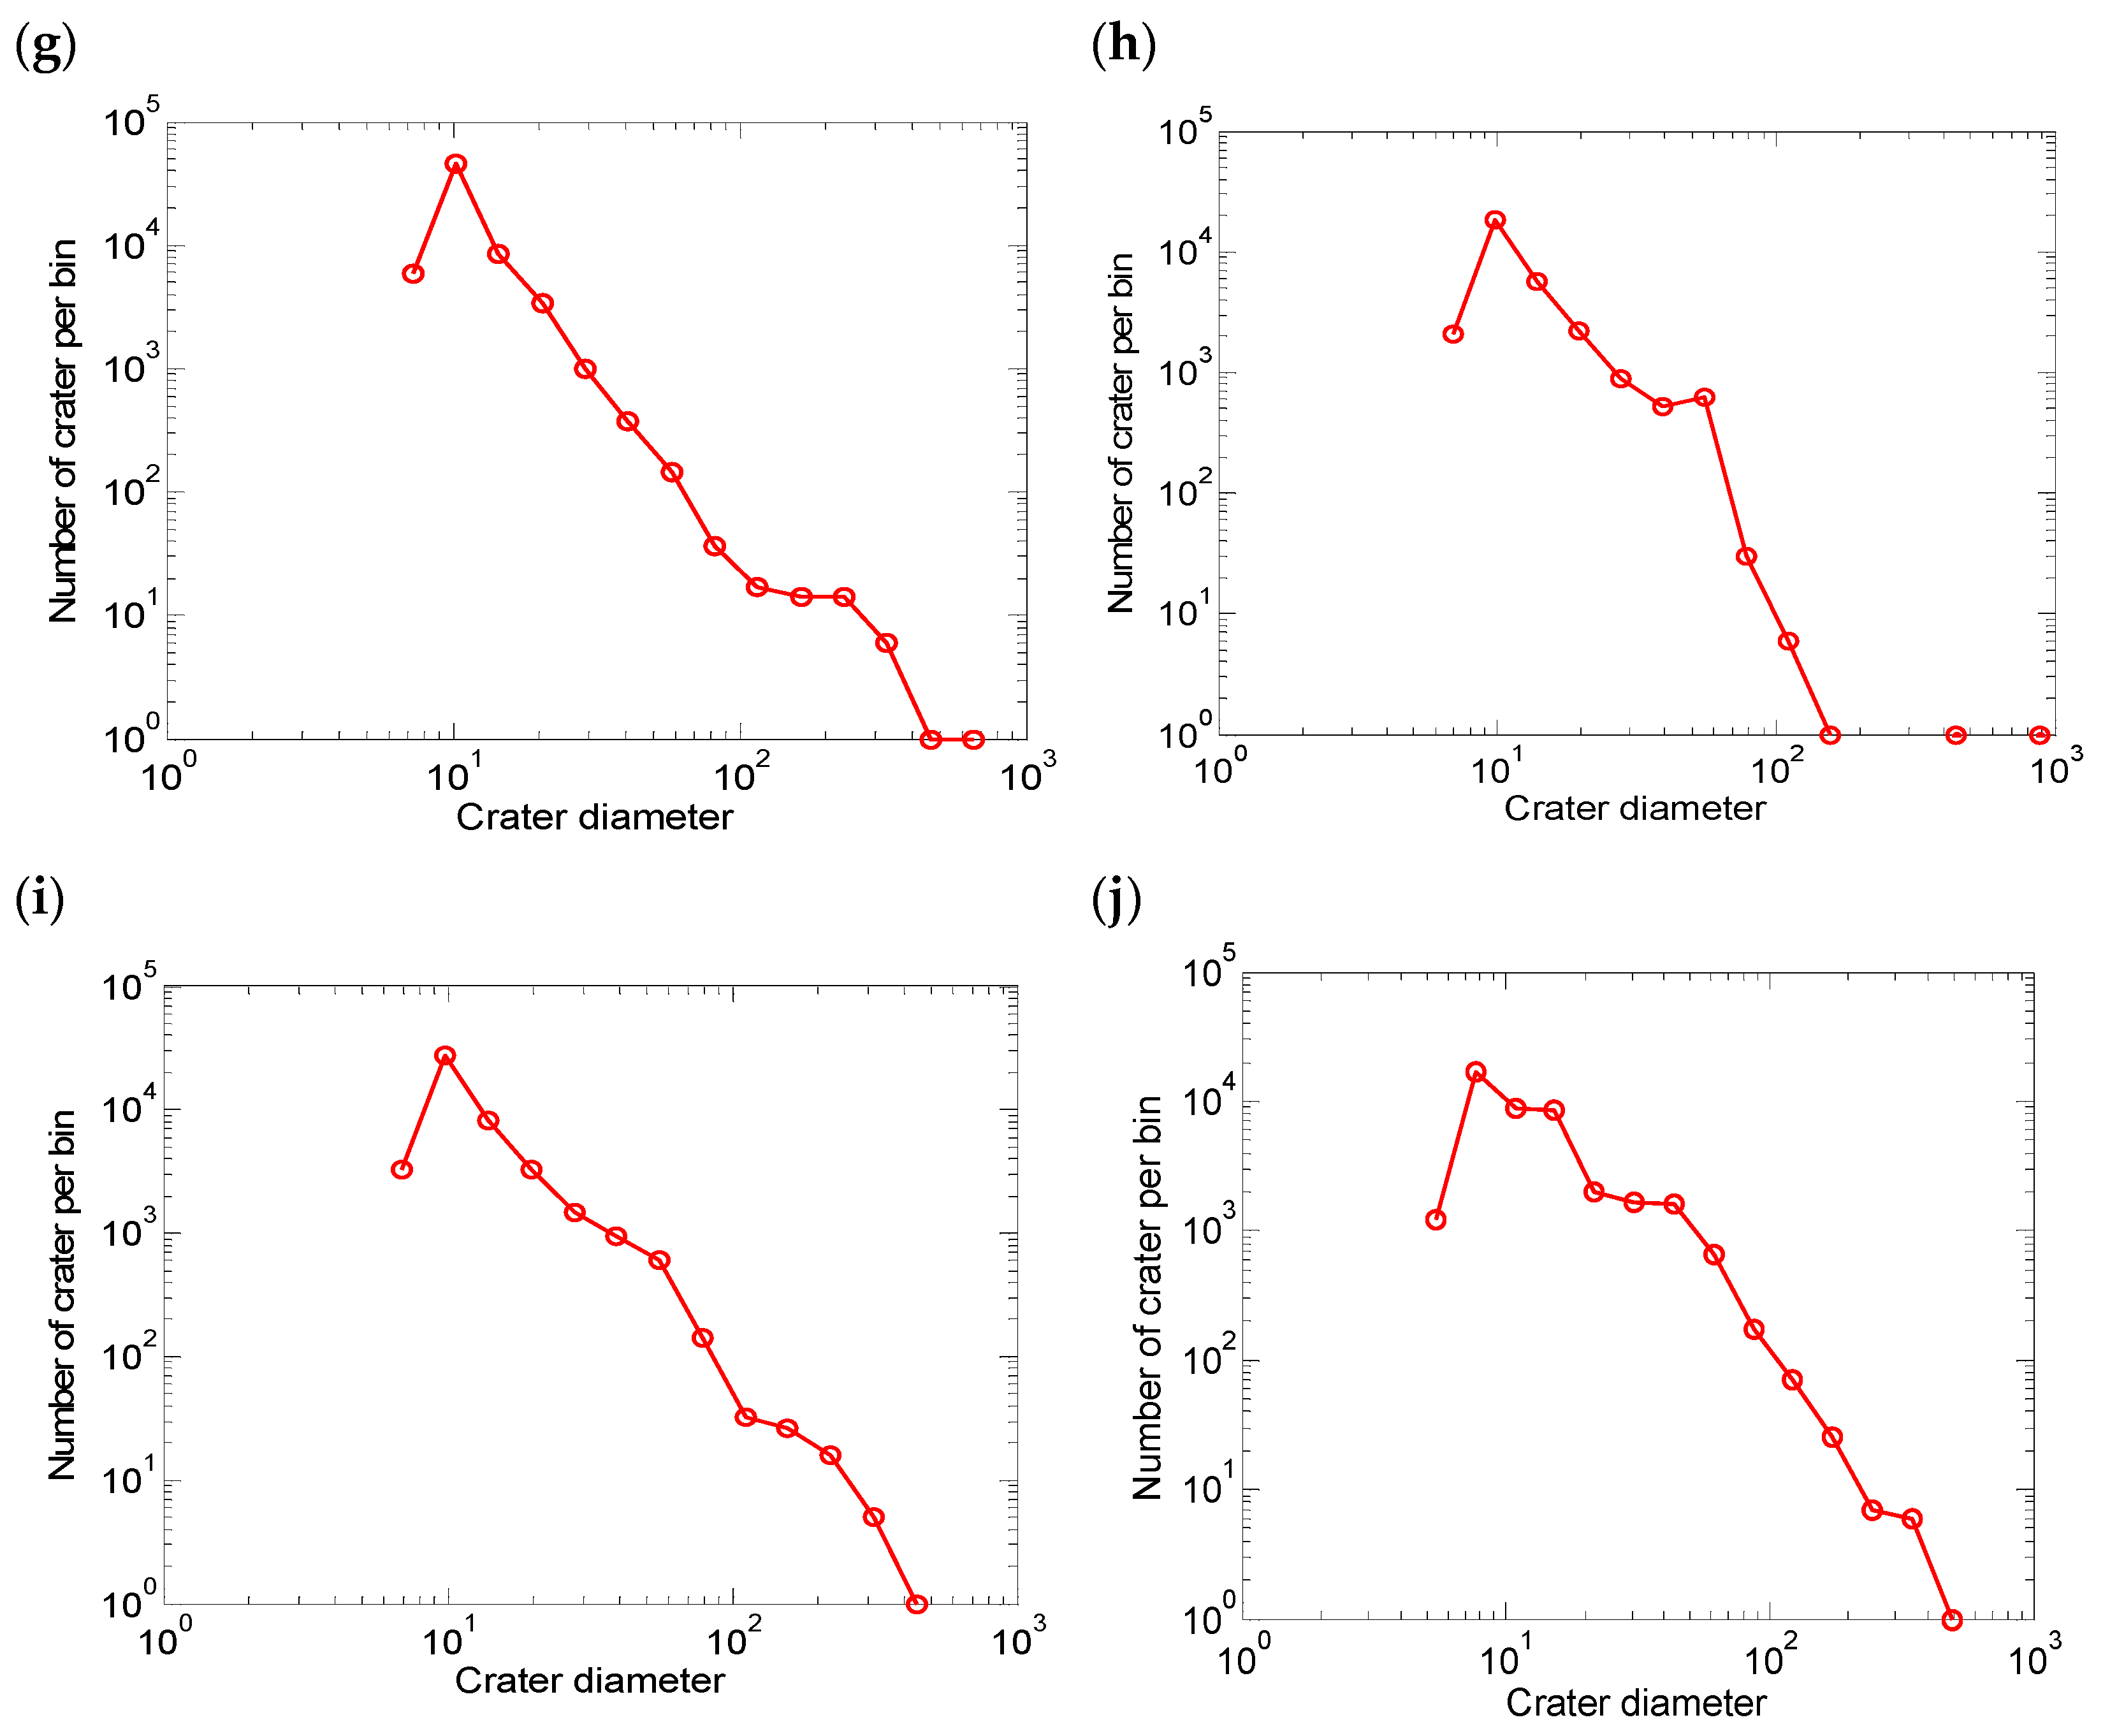
4.1. The Completeness of Small Lunar Impact Craters

Using our method, the number of newly identified small lunar impact craters is hundreds of times greater than the initial number of craters counted. However, does such a large number of small impact craters indicate that they have been comprehensively identified? The statistical completeness of the identified small impact craters in each landing area was calculated using crater size–frequency distributions, and a diameter greater than the area with the greatest number of craters is considered to be the statistical completeness size, i.e., complete diameter [27] (Table 3 and Figure 8). The complete diameter of the small impact crater in Chang’e-5 landing area was defined as 11 m; the diameter of the small impact craters in the other nine landing area ranged from 13 m to 15 m. From Figure 6, it can be seen that the identified lunar craters smaller than the complete diameter show an almost even distribution; in comparison, the larger small lunar craters are densely and randomly distributed in the ten landing areas. In the Chang’e-5 landing area, the number of identified small craters larger than the complete diameter accounts for the highest percentage, i.e., 43.84%, followed by that for Apollo 15 and Apollo 16, i.e., 22%. The number of craters larger than the complete diameter in the Apollo 11 landing area is the lowest, i.e., 10%. The proportion of small craters above the complete diameter in the other six landing areas is between 13% and 20%. The above results indicate that in older landing areas, there are numerous small impact craters that have not been fully identified.

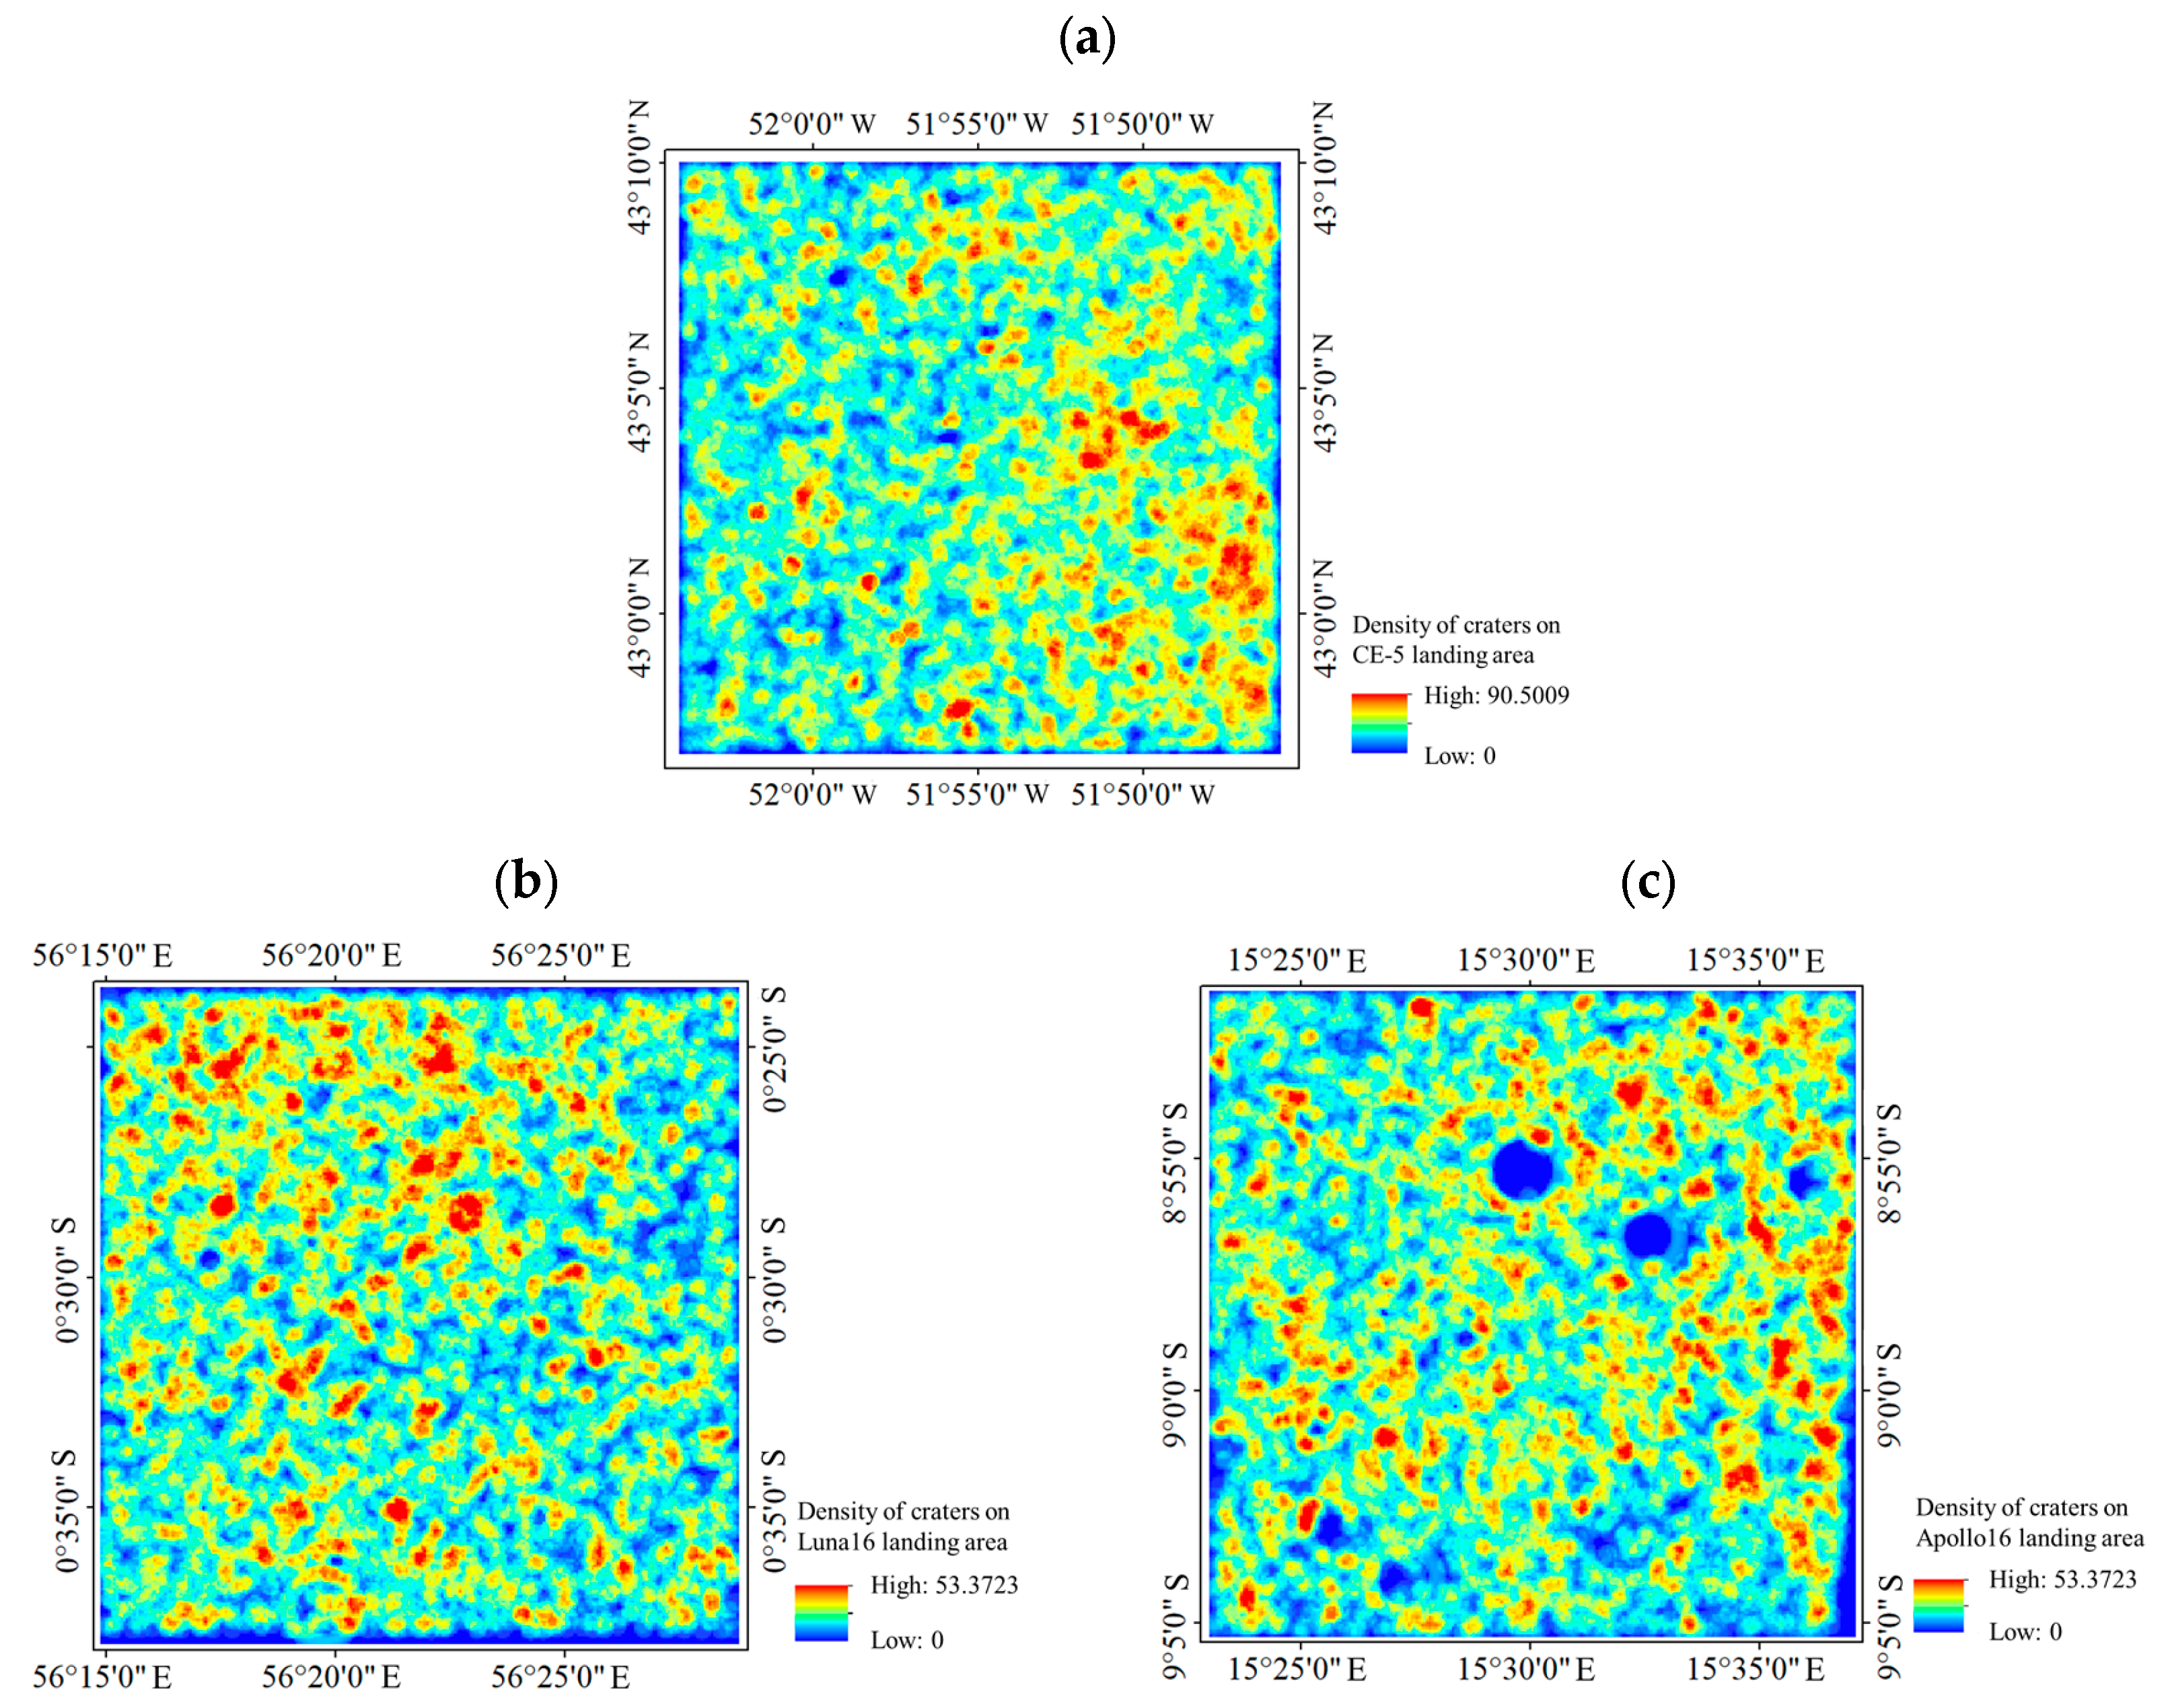
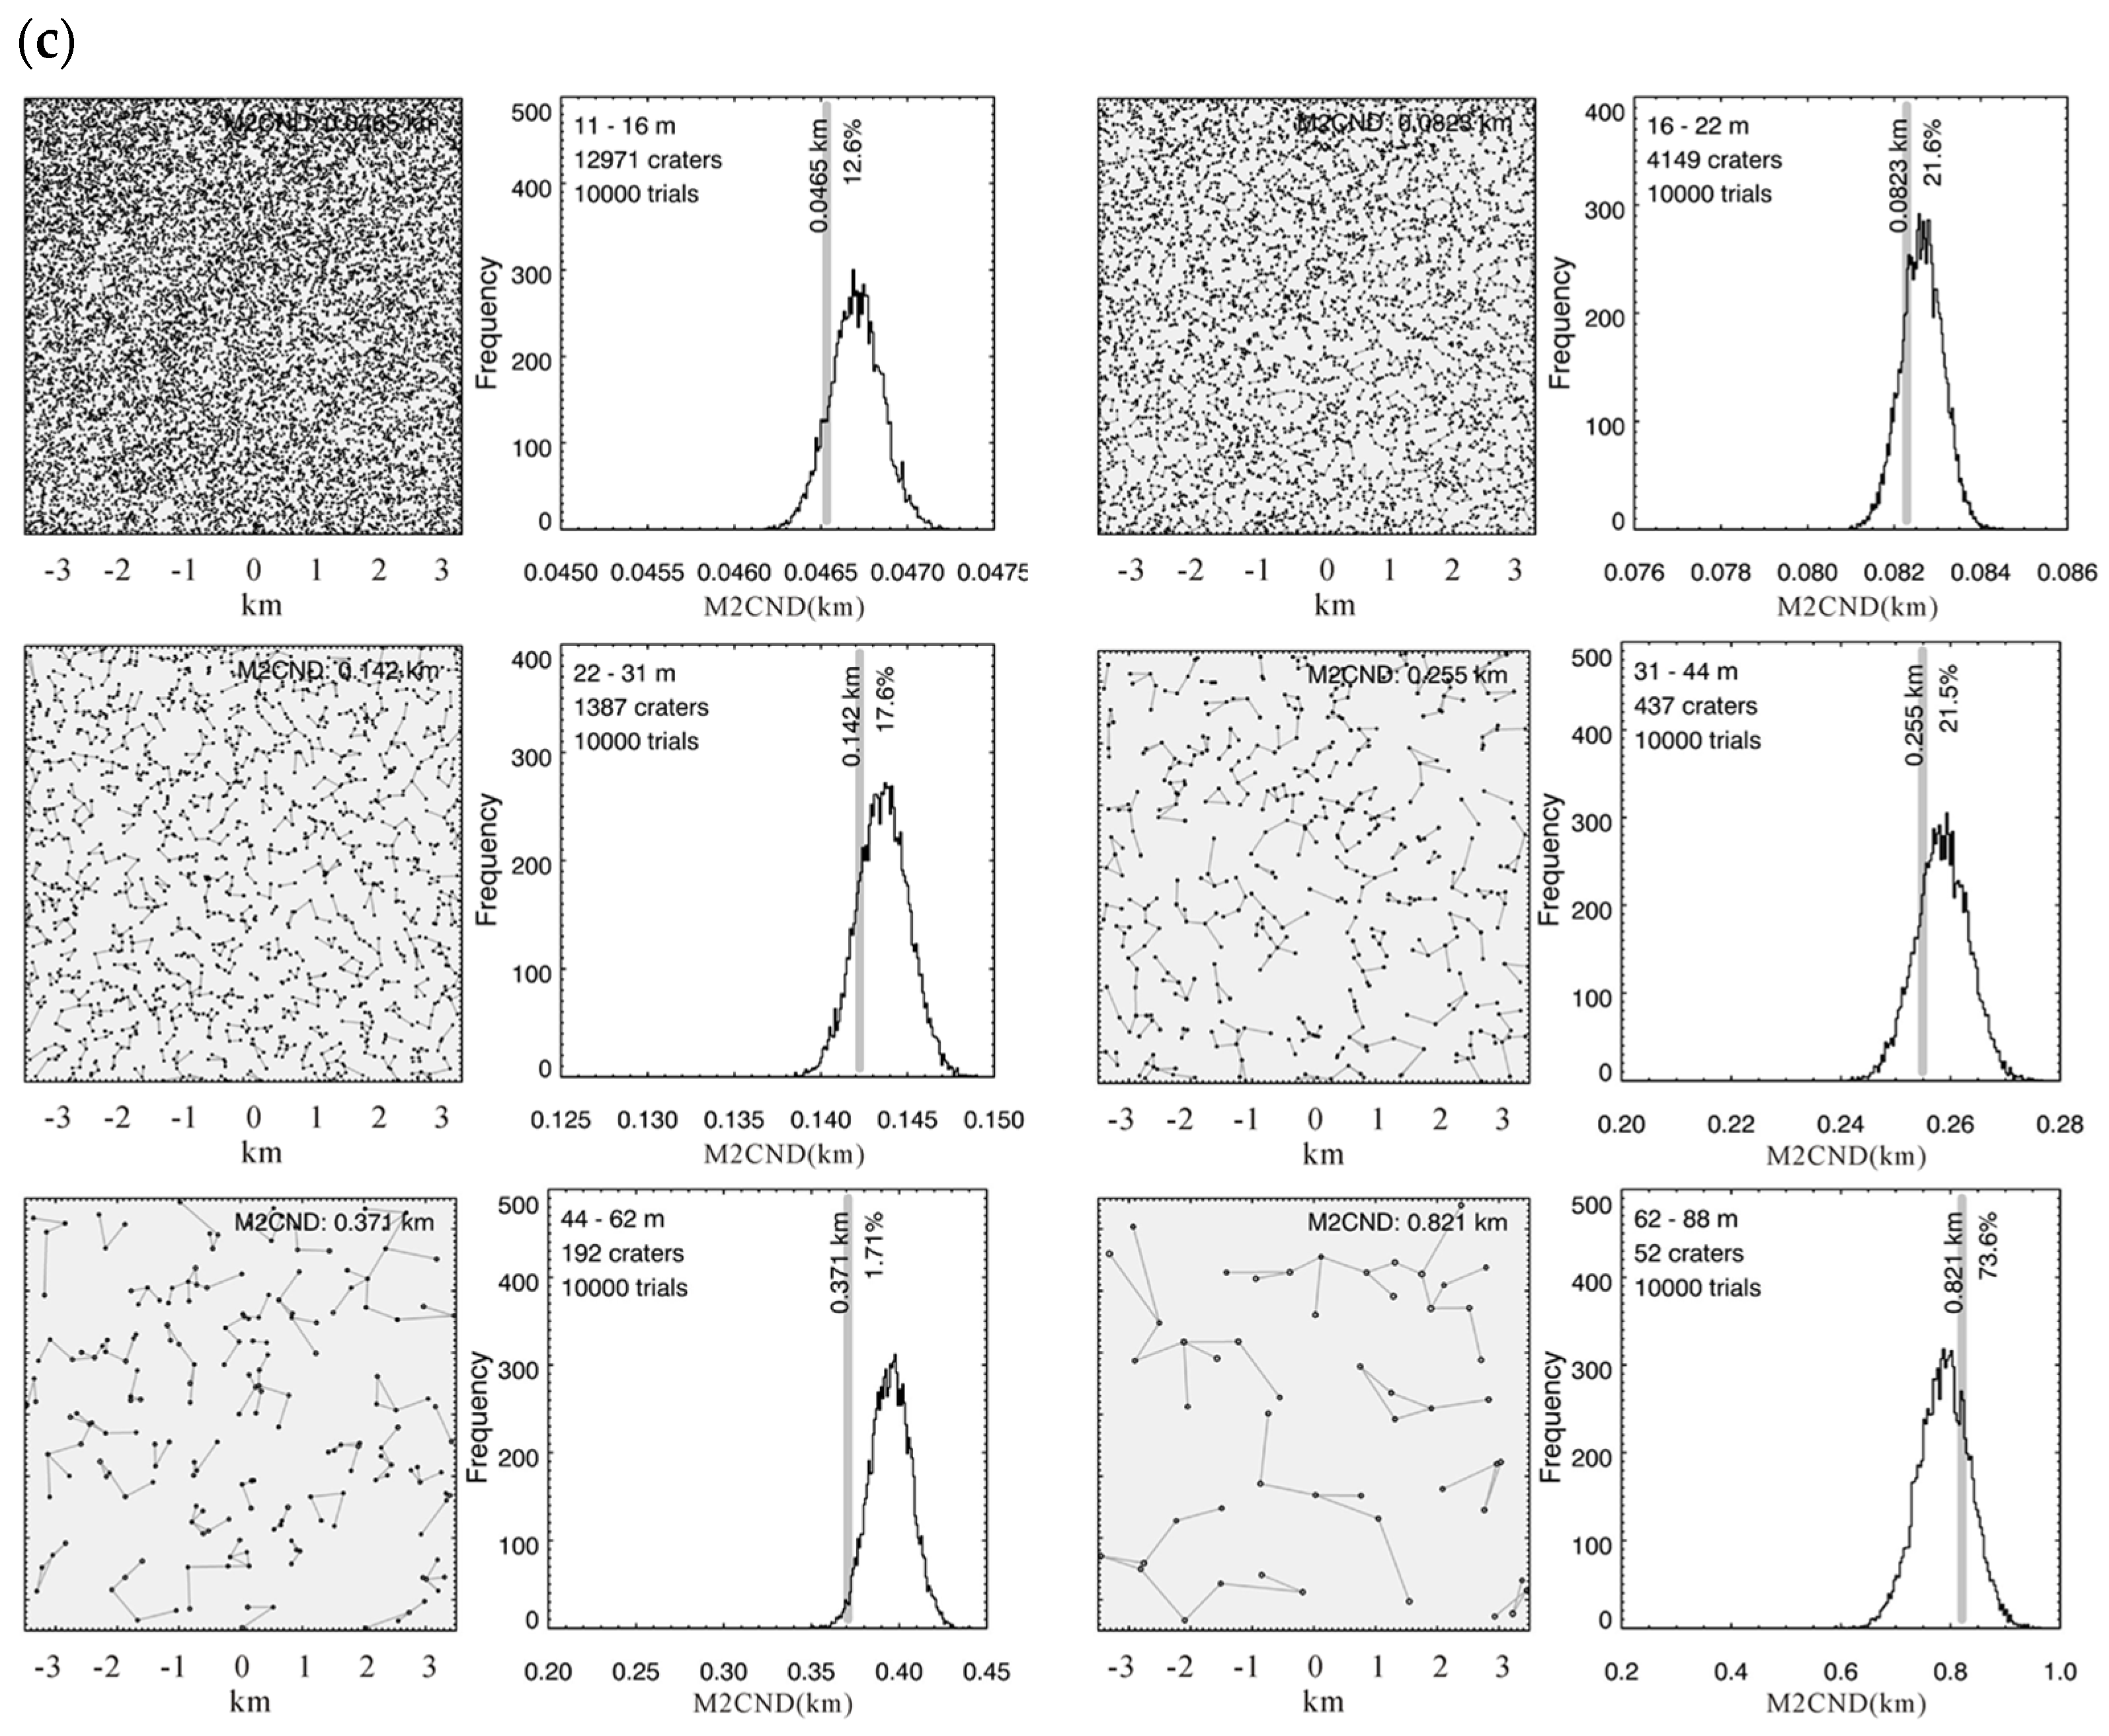
4.2. Density Distribution and Random Analysis of Small Lunar Impact Craters

The assessment of small lunar craters is inevitably a controversial topic [28]. Generally, the vast majority of small impact craters are occupied by secondary craters which should be removed during subsequent analysis. To better understand the frequency of impact events and reveal the distribution pattern of small impact craters within the ten lunar landing areas, a density distribution and randomness analysis of small impact craters in the lunar landing area was carried out. The density distribution represents the number of impact craters per square kilometer. Using a grid of 50 m × 50 m and a search radius of 100 m, the spatial density of small impact craters with a diameter greater than the complete diameter in each landing area is calculated. The randomness analysis function in the CraterStats2 [29,30] tool was used to analyze the distribution characteristics of small craters. The parameter selected in the present study was the mean second nearest neighbor distance (M2CND), and the number of iterations for the Monte Carlo simulation was set to 10,000.
Figure 9 and Figure 10 show the density distribution maps and randomness analysis for the Chang’e-5 (CE-5), Luna 16, and Apollo 16 landing areas; the results for the other landing areas, i.e., Apollo 11, Apollo 12, Apollo 14, Apollo 15, Apollo 17, Luna 20, and Luna 24, are provided in Supplementary Materials Figures S1 and S2. A commonly found phenomenon is that small craters larger than the complete diameter in the young Chang’e landing area exhibit faint randomness, i.e., acceptance of a low confidence level in randomness [29,30], within the same diameter ranges (Figure 10). In older landing areas, i.e., those of Apollo 11, Apollo 12, Luna 16, and Luna 24 (Figure 10 and Figure S2), the small craters exhibit strong randomness under the condition of no interference from large impact craters nearby. When large craters are present, such as in the Apollo 14, Apollo 15, Apollo 16, Apollo 17, and Luna 20 landing areas (Figure 10 and Figure S2), the randomness of small impact craters is almost zero. This means that, similar to the young Moon’s surface detected by Chang’e-5, small impact craters should be carefully selected in subsequent analysis. For the older surfaces, there are relatively few secondary lunar craters; however, it is important to consider whether existing small craters are produced by large impact craters.

4.3. Further Discussion on the Conducted Experiments

Using the above identification results, an intelligent recognition-based small lunar impact craters dataset was established which can act as a powerful aid in lunar geological analysis. To better understand the distribution of small craters, the ten aforementioned landing areas were selected for identification and evaluation. However, it only comprises the small impact craters within the landing areas, which account for the lunar nearside. The scope of the study area used in the present study is limited, and there may be certain limitations in the spatial analysis conducted. In 2024, China’s Chang’e-6 mission has chosen to land in the southern part of the Apollo basin that formed within the lunar farside South Pole–Aitken (SPA) basin, which will return lunar samples from the lunar farside [31]. For the comprehensive analysis of small craters, the study areas within the lunar farside, e.g., China’s Chang’e-6 landing area, will be investigated in the future. Such actions can further expand the small lunar impact crater dataset and improve the evaluation of such craters.
In addition, the identification of small lunar craters based on the feature amplification strategy has a strong detection ability for most small craters. However, there are cases of failed crater detection with complex boundaries and exposed images. Therefore, the performance of the identification model still needs to be improved and enhanced. In one sense, small targets, with a limited number of labeled small craters identified by experts, degrade the identification results. From the model perspective, the differing lighting conditions of the LROC NAC images need to be considered before crater identification to reduce the rate of failed small crater detection caused by the influence of image exposure [32]. Data on the newly identified small lunar impact craters can be supplied for a large number of training samples for utilization in machine learning models and promote the identification of more small lunar impact craters in the future.

5. Conclusions

The present study focuses on mapping small lunar craters in lunar landing areas with high-resolution images. We selected ten returned samples landing areas of lunar probes, including Apollo 11, Apollo 12, Apollo 14, Apollo 15, Apollo 16, Apollo 17, Luna 16, Luna 20, Luna 24, and China’s Chang’e-5, as the study area for small lunar impact crater recognition. To sufficiently identify small lunar craters, a feature amplification strategy-based small crater identification model, i.e., the FAS-based R-FCN, was designed. The recall rate of the small crater identification model was 86.97%, and the identified small craters showed a false-positive rate as low as 0.54% ± 0.16%. Through our efforts, a new small lunar crater database comprising 413,777 craters with D ≥ 4.5 m (the highest quantity among existing automatically detected small crater catalogs) is provided. In addition, the distribution characteristics of the small lunar impact craters over different geologic times in the landing areas were derived. The database will aid in understanding the Moon’s contemporary rate of cratering, and the younger surfaces (around the 50-million-year mark) can be age-dated through these small craters. Small craters represent a big impact, which is the mark of hundreds of millions to billions of years in duration, and offer vital evidence regarding the Moon’s geological evolution.
In the future, the scope of the study area will be expanded in order to acquire more data on small lunar craters for the exploration of spatial distribution characteristics. Additionally, we plan to use the newly identified small craters as training samples based on the small crater identification model so that it can developed to recognize small craters in other landing areas, e.g., China’s Chang’e-6 lunar mission, to facilitate future lunar exploration plans.

Supplementary Materials

The following supporting information can be downloaded at https://www.mdpi.com/article/10.3390/rs16122165/s1. Table S1: Locations and diameter information of the newly identified small lunar craters in this study. Figures S1 and S2: Density distribution and randomness analysis of small lunar impact craters in the landing areas of Apollo 11, Apollo 12, Apollo 14, Apollo 15, Apollo 17, Luna 20, and Luna 24, respectively. The original images of small lunar impact craters identification results in Figure 6 are also provided in Supplementary Materials.

Author Contributions

Conceptualization, C.Y. and H.Z.; methodology, H.Z. and D.Z.; software, H.Z. and R.G.; validation, D.Z. and X.W.; formal analysis, D.Z. and X.W.; investigation, D.Z. and X.W.; resources, C.Y. and R.G.; data curation, X.W.; writing—original draft preparation, C.Y. and H.Z.; writing—review and editing, C.Y. and X.W.; visualization, D.Z. and X.W.; supervision, C.Y. and H.Z.; funding acquisition, C.Y. and H.Z. All authors have read and agreed to the published version of the manuscript.

Funding

The following research was supported by the National Natural Science Foundation of China (Grant No. 42272340 and 42302265) and the Science-Technology Development Plan Project of Jilin Province of China (Grant No. 20230101311JC).

Data Availability Statement

The LROC NAC images used in the above paper are available at https://wms.lroc.asu.edu/lroc/search (accessed on 26 June 2020). Datasets generated or analyzed during the study are available from the corresponding author upon reasonable request.

Conflicts of Interest

The authors declare no conflicts of interest.

References

  1. Head, J.W.; Fassett, C.I.; Kadish, S.J.; Smith, D.E.; Zuber, M.T.; Neumann, G.A.; Mazarico, E. Global Distribution of Large Lunar Craters: Implications for Resurfacing and Impactor Populations. Science 2010, 329, 1504–1507. [Google Scholar] [CrossRef] [PubMed]
  2. Salamunićcar, G.; Lončarić, S.; Grumpe, A.; Wöhler, C. Hybrid Method for Crater Detection Based on Topography Reconstruction from Optical Images and the New LU78287GT Catalogue of Lunar Impact Craters. Adv. Space Res. 2014, 53, 1783–1797. [Google Scholar] [CrossRef]
  3. Wang, J.; Cheng, W.; Zhou, C. A Chang’E-1 Global Catalog of Lunar Impact Craters. Planet. Space Sci. 2015, 112, 42–45. [Google Scholar] [CrossRef]
  4. Robbins, S.J. A New Global Database of Lunar Impact Craters >1–2 km: 1. Crater Locations and Sizes, Comparisons with Published Databases, and Global Analysis. J. Geophys. Res. Planets 2009, 124, 871–892. [Google Scholar] [CrossRef]
  5. Yang, C.; Zhao, H.S.; Bruzzone, L.; Benediktsson, J.A.; Liang, Y.; Liu, B.; Zeng, X.G.; Guan, R.C.; Li, C.L.; Ouyang, Z.Y. Lunar Impact Crater Identification and Age Estimation with Chang’E Data by Deep and Transfer Learning. Nat. Commun. 2020, 11, 6358. [Google Scholar] [CrossRef] [PubMed]
  6. Robinson, M.S.; Boyd, A.K.; Denevi, B.W.; Lawrence, S.J.; McEwen, A.S.; Moser, D.E.; Povilaitis, R.Z.; Stelling, R.W.; Suggs, R.M.; Thompson, S.D.; et al. New Crater on the Moon and A Swarm of Secondaries. Icarus 2015, 252, 229–235. [Google Scholar] [CrossRef]
  7. Fassett, C.I.; Thomson, B.J. Crater degradation on the lunar Maria: Topographic Diffusion and the Rate of Erosion on the Moon: Crater Degradation on the Lunar Maria. J. Geophys. Res. Planets 2014, 119, 2255–2271. [Google Scholar] [CrossRef]
  8. Yang, X.; Fa, W.Z.; Du, J.; Xie, M.G.; Liu, T.T. Effect of Topographic Degradation on Small Lunar Craters: Implications for Regolith Thickness Estimation. Geophys. Res. Lett. 2021, 48, e2021GL095537. [Google Scholar] [CrossRef]
  9. Alfred, S.M.; Edward, B.B. The Importance of Secondary Cratering to Age Constraints on Planetary Surfaces. Annu. Rev. Earth Planet. Sci. 2006, 34, 535–567. [Google Scholar]
  10. Li, Y.; Basilevsky, A.T.; Xie, M.G.; Ip, W.-H. Correlations Between Ejecta Boulder Spatial Density of Small Lunar Craters and the Crater Age. Planet. Space Sci. 2018, 162, 52–61. [Google Scholar] [CrossRef]
  11. Mahanti, P.; Robinson, M.S.; Thompson, T.J.; Henriksen, M.J. Small Lunar Craters at the Apollo 16 and 17 Landing Sites—Morphology and Degradation. Icarus 2018, 299, 475–501. [Google Scholar] [CrossRef]
  12. Shi, K.; Yue, Z.Y.; Di, K.C.; Liu, J.Z.; Dong, Z.H. The Gardening Process of Lunar Regolith by Small Impact Craters: A Case Study in Chang’E-4 Landing Area. Icarus 2022, 377, 114908. [Google Scholar] [CrossRef]
  13. Jia, B.J.; Fa, W.Z.; Xie, M.G.; Tai, Y.S.; Liu, X.F. Regolith Properties in the Chang’E-5 Landing Region of the Moon: Results from Multi-Source Remote Sensing Observations. J. Geophys. Res. Planets 2021, 126, e2021JE006934. [Google Scholar] [CrossRef]
  14. Zuo, W.; Li, C.L.; Yu, L.J.; Zhang, Z.B.; Wang, R.W.; Zeng, X.G.; Liu, Y.X.; Xiong, Y.Y. Shadow–Highlight Feature Matching Automatic Small Crater Recognition Using High-Resolution Digital Orthophoto Map from Chang’E Missions. Acta Geophys. 2019, 38, 541–554. [Google Scholar] [CrossRef]
  15. Kang, Z.; Wang, X.; Hu, T.; Yang, J.T. Coarse-to-Fine Extraction of Small-Scale Lunar Impact Craters from the CCD Images of the Chang’E Lunar Orbiters. IEEE Trans. Geosci. Electron. 2019, 57, 181–193. [Google Scholar] [CrossRef]
  16. Cadogan, P.H. Automated Precision Counting of Very Small Craters at Lunar Landing Sites. Icarus 2020, 348, 113822. [Google Scholar] [CrossRef]
  17. Hu, Y.F.; Xiao, J.; Liu, L.P.; Zhang, L.; Wang, Y. Detection of Small Impact Craters via Semantic Segmenting Lunar Point Clouds Using Deep Learning Network. Remote Sens. 2021, 13, 1826. [Google Scholar] [CrossRef]
  18. Yang, H.; Xu, X.C.; Ma, Y.Q.; Xu, Y.M.; Liu, S.C. CraterDANet: A Convolutional Neural Network for Small-Scale Crater Detection via Synthetic-to-Real Domain Adaptation. IEEE Trans. Geosci. Remote Sens. 2022, 60, 1–12. [Google Scholar] [CrossRef]
  19. Fairweather, J.H.; Lagain, A.; Servis, K.; Benedix, G.K.; Kumar, S.S.; Bland, P.A. Automatic Mapping of Small Lunar Impact Craters Using LRO-NAC Images. Earth Space Sci. 2022, 9, 1–19. [Google Scholar] [CrossRef]
  20. Cadogan, P.H. Automated Precision Counting of Small Lunar Craters—A Broader View. Icarus 2024, 408, 115796. [Google Scholar] [CrossRef]
  21. Saxena, L. Computer Vision Metrics: Survey, Taxonomy, and Analysis. Comput. Rev. 2015, 56, 350. [Google Scholar]
  22. Wilhelms, D.E.; McCauley, J.F.; Trask, N.J. The Geologic History of the Moon; U.S. Geological Survey Professional Paper 1348; U.S. Geological Survey: Denver, CO, USA, 1987. [Google Scholar]
  23. Li, Q.L.; Zhou, Q.Y.; Liu, Y.; Xiao, Z.Y.; Lin, Y.T.; Li, J.H.; Ma, H.X.; Tang, G.Q.; Guo, S.; Tang, X.; et al. Two-billion-year-old Volcanism on the Moon from Chang’e-5 Basalts. Nature 2021, 600, 54–58. [Google Scholar] [CrossRef]
  24. He, K.; Zhang, X.; Ren, S.; Sun, J. Deep Residual Learning for Image Recognition. In Proceedings of the IEEE Conference on Computer Vision and Pattern Recognition (CVPR), Las Vegas, NV, USA, 27–30 June 2016; pp. 770–778. [Google Scholar]
  25. Dai, J.F.; Li, Y.; He, K.M. R-FCN: Object Detection via Region-based Fully Convolutional Networks. In Proceedings of the 30th Conference on Neural Information Processing Systems (NIPS), Barcelona, Spain, 5–10 December 2016; pp. 379–387. [Google Scholar]
  26. Russakovsky, O.; Deng, J.; Su, H.; Krause, J.; Satheesh, S.; Ma, S.; Huang, Z.H.; Karpathy, A.; Khosla, A.; Bernstein, M.; et al. ImageNet Large Scale Visual Recognition Challenge. Int. J. Comput. Vision 2015, 115, 211–252. [Google Scholar] [CrossRef]
  27. Robbins, S.J.; Hynek, B.M. A New Global Database of Mars Impact Craters ≥1 km: 1. Database Creation, Properties, and Parameters. J. Geophys. Res. 2012, 117, 18. [Google Scholar] [CrossRef]
  28. Strom, R.G.; Malhotra, R.; Xiao, Z.Y.; Ito, T.; Yoshida, F.; Ostrach, L.R. The Inner Solar System Cratering Record and the Evolution of Impactor Populations. Res. Astron. 2015, 15, 407–434. [Google Scholar] [CrossRef]
  29. Kneissl, T.; Van, G.S.; Neukum, G. Map-Projection-Independent Crater Size-Frequency Determination in GIS Environments—New Software Tool for ArcGIS. Planet. Space Sci. 2011, 59, 1243–1254. [Google Scholar] [CrossRef]
  30. Michael, G.G.; Platz, T.; Kneissl, T.; Schmedemann, N. Planetary Surface Dating from Crater Size–Frequency Distribution Measurements: Spatial Randomness and Clustering. Icarus 2012, 218, 169–177. [Google Scholar] [CrossRef]
  31. Zeng, X.G.; Liu, D.W.; Chen, Y.; Zhou, Q.; Ren, X.; Zhang, Z.B.; Yan, W.; Chen, W.; Wang, Q.; Deng, X.; et al. Landing Site of the Chang’e-6 Lunar Farside Sample Return Mission from the Apollo Basin. J. Nat. Astron. 2023, 7, 1188–1197. [Google Scholar] [CrossRef]
  32. Richardson, M.; Malagón, A.A.P.; Lebofsky, L.A.; Grier, J.; Gay, P.; Robbins, S.J.; Team, T.C. The CosmoQuest Moon Mappers Community Science Project: The Effect of Incidence Angle on the Lunar Surface Crater Distribution. Open J. Astrophys. 2022, 5, 13404. [Google Scholar] [CrossRef]
Figure 1. The architecture of the small lunar crater identification model based on the feature amplification strategy.
Remotesensing 16 02165 g001
Figure 2. The small lunar craters in the test region, in which four test areas, i.e., A, B, C, and D were randomly selected for the quantification of small lunar impact craters. The illustration is derived from test area D.
Remotesensing 16 02165 g002
Figure 3. The identified small lunar craters in the test regions: (a) the small craters identified with the typical R-FCN and (b) the small lunar craters mapped by the deep convolutional networks based on the feature amplification strategy (FAS-based R-FCN). The identification illustrations of the typical R-FCN and FAS-based R-FCN are denoted by the yellow rectangular boxes.
Remotesensing 16 02165 g003
Figure 4. The unidentified small lunar craters in the test region with diameters of (a) 134 m, (b) 28 m, (c) 124 m, and (d) 60 m. The white arrows indicate the degraded craters.
Remotesensing 16 02165 g004
Figure 5. Comparison of the number of identified small craters with the FAS-based R-FCN and the typical R-FCN in the test area.
Remotesensing 16 02165 g005
Figure 6. Identification results of small lunar impact craters in the returned samples’ landing areas: the United States’ Apollo 11, Apollo 12, Apollo 14, Apollo 15, Apollo 16, and Apollo 17; the Soviet Union’s Luna program’s Luna 16, Luna 20, and Luna 24; and China’s Chang’e-5 (CE-5) mission.
Remotesensing 16 02165 g006
Figure 7. The diameter distribution and comparison of the small impact craters in the ten landing areas.
Remotesensing 16 02165 g007
Figure 8. The statistical completeness of the identified small impact craters in the ten landing areas was calculated using crater size–frequency distributions: (a) Apollo 11; (b) Apollo 12; (c) Apollo 14; (d) Apollo 15; (e) Apollo 16; (f) Apollo 17; (g) Luna 16; (h) Luna 20; (i) Luna 24; and (j) Chang’e-5.
Remotesensing 16 02165 g008aRemotesensing 16 02165 g008b
Figure 9. Density distribution of small lunar impact craters in the landing areas of (a) Chang’e-5 (CE-5), (b) Luna 16, and (c) Apollo 16.
Remotesensing 16 02165 g009
Figure 10. Randomness analysis of small lunar impact craters in the landing area: (a,b) show the randomness of Chang’e-5 (CE-5) and Apollo 16. (c) shows the randomness of Luna 16.
Remotesensing 16 02165 g010aRemotesensing 16 02165 g010b
Table 1. The ranges of the selected returned samples’ landing area and training and test regions.
Landing Area/
Training and Test Regions
LongitudeLatitude
Apollo 1123°34′10′–23°21′50″E00°33′40″–00°47′10″N
Apollo 1223°12′10″–23°26′10″W02°50′50″–03°03′30″S
Apollo 1417°20′40″–17°34′40″W03°33′20″–03°47′10″S
Apollo 1503°30′10″–03°43′50″E25°59′10″–26°13′00″N
Apollo 1615°23′00″–15°37′05″W08°51′25″–09°05′10″S
Apollo 1723°21′10″–23°34′10″E00°33′20″–00°47′10″N
Luna 1656°14′50″–56°28′40″E00°23′50″–00°37′40″S
Luna 2056°30′40″–56°44′20″E03°40′20″–03°54′10″N
Luna 2462°05′40″–62°19′50″E12°36′00″–12°49′50″N
Chang’e-552°04′00″–51°45′50″W42°56′55″–43°10′00″N
Training52°40′30″–52°29′20″W45°10′40″–45°17′30″N
Test50°34′00″–53°02′00″W43°08′10″–43°34′00″N
Table 2. The small lunar craters identification results of the four test areas, A, B, C, and D.
RegionLabeled
Samples
R-FCNFAS-Based R-FCN
Identified
Craters
RecallFPRsIdentified
Craters
RecallFPRs
A57357232.41%0.72%267086.91%0.52%
B50849334.64%0.83%291488.78%0.79%
C87279933.16%0.54%297886.12%0.34%
D50248732.32%0.69%250986.06%0.52%
Total2455235133.09%0.70%11,07186.84%0.54%
Average 33.13%0.70% ± 0.10% 86.97%0.54% ± 0.16%
Table 3. The number of identified small lunar impact craters in the landing areas.
Landing
Area
Minimum
Diameter (m)
Maximum
Diameter (m)
Complete
Diameter (m)
Number of Craters
(Automatic Mapping)
Number of Craters
(>Complete Diameter)
Apollo 116.21525.41545,1024511
Apollo 125.487601352,4817458
Apollo 145.5724.031338,9925995
Apollo 155.986511422,5195017
Apollo 166840.61442,6609380
Apollo 175.75616.61427,1434781
Luna 166754.321466,9248527
Luna 205.5812.831430,1875733
Luna 245.75373.861445,7618409
Chang’e-54.55161142,00818,418
Disclaimer/Publisher’s Note: The statements, opinions and data contained in all publications are solely those of the individual author(s) and contributor(s) and not of MDPI and/or the editor(s). MDPI and/or the editor(s) disclaim responsibility for any injury to people or property resulting from any ideas, methods, instructions or products referred to in the content.

