Article

Analysis of Seismic Methane Anomalies at the Multi-Spatial and Temporal Scales

1
The National Institute of Natural Hazards, Ministry of Emergency Management of China, Beijing 100085, China
2
School of Ecological Environment, Institute of Disaster Prevention, Sanhe 065201, China
3
Satellite Application Center for Ecology and Environment, Ministry of Ecology and Environment, State Environmental Protection Key Laboratory of Satellite Remote Sensing, Beijing 100094, China
*
Author to whom correspondence should be addressed.
Remote Sens. 2024, 16(12), 2175; https://doi.org/10.3390/rs16122175
Submission received: 6 May 2024 / Revised: 10 June 2024 / Accepted: 13 June 2024 / Published: 15 June 2024
(This article belongs to the Section Environmental Remote Sensing)

Abstract

:
Relevant studies have shown that methane gas has a close relationship with seismic activity. The concentration of methane released within a tectonic zone can reflect the intensity status of tectonic activities, which is important for seismic monitoring. In this study, the January 2020 Xinjiang Jiashi earthquake was taken as the research object, and the mature Robust Satellite Technique (RST) algorithm was used to characterize the L3-level methane product data from the hyperspectral sensor, Atmospheric Infrared Sounder (AIRS), installed on the Earth Observing System (EOS) AQUA satellite at the monthly scale, 8-day scale and daily scale. An analysis of the spatial and temporal distribution of methane was carried out for before and after the earthquake based on the 3D structural condition of the gas, and the 3D structural conditions of the 8-day scale were introduced. An 8-day scale 3D structural condition was introduced and migration validation was performed, and the results showed that (1) the seismic methane anomaly-extraction process proposed in this study is feasible; (2) the 3D contour features indicated that the methane anomalies that occurred before the Jiashi earthquake were caused by geogenic emissions; (3) the anomaly-extraction algorithm from this study did not extract the corresponding anomalies in the non-seismic year, which indicated that the anomaly-extraction algorithm of this study has some degree of feasibility; and (4) the migrated validation of the Wenchuan earthquake of May 2008 further suggested that methane anomalies at the time of the Wenchuan earthquake were caused by the earthquake.

1. Introduction

Earthquakes are considered a significant natural catastrophe for humanity. China experiences among the most severe disasters globally, with mainland earthquakes accounting for approximately one-third of all quakes worldwide. Characterized by a higher frequency, wider distribution and greater intensity, these earthquakes pose a critical threat to the safety of human lives and properties. The earth’s interior comprises vast quantities of fluids that continually vent, which acts as a significant mechanism for the exchange of both material and energy between the earth’s subsurface and the atmosphere. However, should this venting exceed a certain threshold, it may trigger catastrophic events [1,2,3]. Therefore, the venting of the earth’s interior is intricately associated with seismicity and with zones characterized by tectonic weakness (such as plate tectonics and active tectonic boundaries), serving as vital pathways for emissions [4,5,6,7].
The investigation of gas geochemistry is a vital component in the study of earthquake precursors. Extensive ground-based observations and seismic case analyses have consistently demonstrated the existence of discernible gas anomalies on the epicentral surface prior to and following seismicity [8,9,10,11,12,13,14,15,16,17]. Traditional ground-based measurements offer exceptional accuracy and continuous data, enabling long-term sequence observations in critical regions. Nonetheless, these measurements, including fixed-point and mobile observations, have certain limitations, such as uneven distribution of stations, no stations in many places and high cost, which hinder the acquisition of comprehensive, real-time and continuous information across wider areas. Moreover, such methodologies primarily capture surface-level information and carry substantial maintenance costs. Satellite remote sensing technology has several benefits, including broad coverage, low cost and minimal environmental impact. Over the past three decades, the advancement of hyperspectral remote sensing and gas inversion techniques has garnered considerable interest within the international academic community regarding the application of satellite remote sensing in the study of seismic gas anomalies, making possible a new era of earthquake monitoring [18].
It has been shown that methane gas, one of the hydrocarbon gases of gas geochemistry, is closely related to seismicity, and that the concentration of methane released within the tectonic zone under study can reflect the intensity of tectonic activity, which is an important target for seismic monitoring [19]. The 12 May 2008 Wenchuan M8.0 earthquake and the 20 April 2013 Lushan M7.0 earthquake [20,21,22], the 15 April 2015 Alashanzuoqi M5.8 earthquake in Inner Mongolia [23], the 8 August 2017 Jiuzhaigou M7.0 earthquake in Sichuan, the 24 April 2019 Muotuo M6.3 earthquake in Tibet and the Xinjiang Yutian M6.4 earthquake on 26 June 2020 [24] were preceded by methane anomalies, suggesting that the occurrence of earthquakes is often accompanied by the appearance of methane anomalies.
The extraction of anomalous gas signals related to seismic activity forms the foundation for the study of seismic gas anomalies. The ability to accurately detect abnormal increases within time series data and effectively differentiate between seismic-related anomalous noises and those unrelated to seismic events is critical for the extraction of seismic anomalies. Currently, the algorithms employed for anomaly extraction can be broadly categorized into five main types: (1) visual interpretation [15,25,26,27]; (2) anomaly-extraction algorithms based on difference analysis; typical algorithms include the bright temperature difference method before and after an earthquake, the vorticity algorithm, the bright temperature difference method inside and outside the fault zone, etc. [28,29,30]; (3) anomaly-detection algorithms rooted in signal analysis encompass various methodologies, such as power spectrum analysis, wavelet analysis and night thermal gradient (NTG) analysis [31,32,33,34,35,36,37,38]; (4) anomaly-detection algorithms based on background field analysis include the RST algorithm and the time-period migration index method [39,40,41,42]; and (5) anomaly-extraction algorithms based on machine learning algorithms [43,44,45].
At present, the extraction of seismic gas anomalies is mostly based on a single time scale, and is mostly used for post-earthquake analysis [20,21,22,23,24,46,47]. The response of multiple time scales to earthquakes is rarely discussed. What is the significance of earthquake prediction on multiple time scales? Should a solitary remote sensing dataset with a limited temporal range be employed in future earthquake-monitoring endeavors? Constraints in satellite transmission and reanalysis data processing may mean that earthquake researchers cannot obtain the impending earthquake data in time, which represents a challenge to earthquake-monitoring services. Data on multiple time scales may have an impact on earthquake identification. Therefore, integrating information from multiple temporal scales could better serve earthquake-monitoring operations. In addition, in order to further investigate the anomalies in the atmosphere and ionosphere above the seismogenic region, a lithosphere–coversphere–atmosphere–ionosphere (LCAI) coupling paradigm has been proposed, which provides a basic reference paradigm for the analysis of seismic multi-parameter anomalies [48,49,50,51]. Existing studies have demonstrated that seismic gas anomalies typically occur several months before seismic events and continue throughout the seismic cycle, while those in the ionosphere are short-onset anomalies [46,47,52,53]. Hence, a multi-scale analysis and discourse on seismic gases could facilitate a deeper investigation into the potential causal relationship between atmospheric anomalies and ionospheric anomalies, leading to a deeper understanding of the multi-layer coupling mechanism.
This study took the 19th January 2020, M6.4 earthquake in Jiashi, Xinjiang, as an example to analyze the response characteristics of methane to earthquakes at multiple temporal scales. Building upon this, 3D contour structures were introduced to analyze the spatial morphological features of methane anomalies, providing a reference basis for seismic-related terrestrial methane gas emissions.

2. Study Area

In accordance with data from the China Earthquake Networks Centre (CENC), a M6.4 earthquake took place in Jiashi, Xinjiang, on 19th January 2020. The epicenter was recorded at coordinates 39.83°N and 77.21°E, with a focal depth of 16 km. Preceding the Jiashi earthquake, an M5.4 foreshock (39.83°N, 77.18°E, depth: 20 km) occurred on 18th January. Furthermore, on the day of the mainshock, an additional M5.4 earthquake (39.89°N, 77.46°E, depth: 14 km) transpired in Atush, Xinjiang. Another M5.4 earthquake (39.89°N, 77.46°E, depth: 14 km) also took place in the city of Atushi, Xinjiang, on the same day. The epicenter and aftershocks of the Jiashi earthquake, along with the regional tectonic landforms map is shown in Figure 1. The seismic activity in Jiashi primarily originated along the folded-inverse fracture tectonic zone located at the leading (southern) boundary of the Kepingtage fold-and-thrust belt The Kepingtage fold-and-thrust belt spans a length of 300 km in the east–west direction and measures approximately 65 to 75 km in width in the north–south orientation. It is characterized by multiple sets of nearly parallel NEE-oriented fold belts, comprising various intricate structural features, including compound box backslopes and inverted compound backslopes. The NE-trending Piqiang Fault separates the Keping fold-and-thrust tectonics zone into an eastern and western section. Vertically, west of the Piqiang Fault, there exist five rows of thrust-fold belts oriented from north to south, including the Kepingtage, Ozgel Itwu, Toksan Atanen Baylor, Kekbuk Sanshan and Oyibulak, among others. To the west of the Piqiang Fault, the Paleozoic and Cenozoic rock strata are arranged in sequence, creating an overall “W”-dipping nose-like structure. Situated eastward of the Piqiang Fault, there are six rows of retrograde fold belts distributed from south to north, including the Kepingtage, Tataeltag, Yimukan Taw, Piqiang Mountain, Kobuk Three Mountains and Oyibulak. Near the epicenter of the earthquake, the Jiashi strong earthquake cluster, consisting of several moderate to strong earthquakes of magnitude 6 or so, occurred in 1997 and 2003, and the tectonic activity was strong [54,55,56].

3. Data and Methods

3.1. Data

Since the early 1990s, the aeronautical departments of many countries, such as NASA and ESA, have launched a number of atmospheric sounding satellites for obtaining CH4 concentrations. The characteristics of the CH4 products produced by each atmospheric satellite vary according to the settings of the sensor bands carried on board. Compared with other CH4 satellite products, the Atmospheric InfraRed Sounder (AIRS), which is a hyperspectral sensor provided by NASA and equipped on the United States Earth observation satellite AQUA/EOS, with its earlier launch date and substantial accumulation of data, offers a higher spatial coverage and acquires global data twice a day (in ascending and descending orbits), with an ascending-orbit transit time of 13:30 PM (local time) and a descending-orbit transit time of 1:30 AM (local time), and a return period of 16 days. There are a total of 200 CH4 absorption band channels at 7.66 μm, along with 71 channels that can be used for inversion of the CH4 concentration, at a relatively high temporal and spectral resolution. Through relevant validation experiments, AIRS has demonstrated its ability to provide high-precision CH4 products. These products are instrumental in studying and analyzing the distribution, as well as the transport patterns, of atmospheric methane [57,58,59,60,61]. Moreover, seismic analyses based on CH4 products derived from AIRS have yielded significant outcomes, substantiating its utility in extracting seismic anomaly information [7,21,22,62].
In this study, the descending-orbiting data of the CH4 volume mixing ratio (hereinafter referred to as CH4 VMR) derived from NASA’s official website for version 6 of the three-level standard grid products were selected as the covariates, specifically monthly, 8-day and daily CH4 products (http://disc.gsfc.nasa.gov/AIRS/index.shtml/) (accessed on 2 March 2023), in order to reduce the effect of solar radiation during the daytime. Its spatial resolution was 1°× 1° [63,64].

3.2. Methods

Currently, there exists a multitude of seismic anomaly-extraction algorithms, each characterized by specific strengths and weaknesses. In this study, we proposed the adoption of the background field-based Robust Satellite Technique (RST) algorithm to investigate seismic anomaly extraction [65,66]. Over the past decade or so, the RST algorithm has gained widespread application and has demonstrated its efficacy in single-seismic examples [67]. Researchers have utilized this algorithm to conduct statistical analyses of long time series seismic anomalies, focusing on thermal parameters such as the Land Surface Temperature (LST) in regions including Taiwan, Greece and Sichuan. The outcomes of these analyses have received recognition within the industry [68,69,70]. Taking into account the aforementioned factors, this study utilized the RST algorithm as the basis for extracting the corresponding anomalies. The specific design formula is as follows:
G r e f ( x , y , t ) = i = 1 N G i ( x , y , t ) / N ,
σ ( x , y , t ) = s q r t { i = 1 N [ G ( x , y , t ) G r e f ( x , y , t ) ] 2 N 1 }
A l i c e ( x , y , t ) = G ( x , y , t ) G r e f ( x , y , t ) σ ( x , y , t )
where i represents the year, N denotes the total number of years under consideration, σ ( x , y , t ) is the standard deviation corresponding to the same location at the same time, G i ( x , y , t ) corresponds to the value of the CH4 at time t , latitude and longitude ( x , y ) and G r e f ( x , y , t ) refer to the background value of the CH4 at the corresponding time t and latitude and longitude ( x , y ) is mainly the average value of the corresponding historical year at the corresponding time and location. In this study, the mean value of the corresponding period of 5 years in history was selected as the background field; that is, N = 5 . The A l i c e represents the derived anomaly index. Equation (1) can be used to calculate the historical multi-year mean data and the result can reflect the average distribution of methane in the region. The regional methane distribution is mainly related to the static environment, such as the landform and underlying surface. Equation (2) is used to calculate the mean square error of multi-year data, representing the dispersion of the data, and is related to the dynamic environment, such as the climate, seasons, etc. After removing the background and dividing the square error by Equation (3), we can partially eliminate dynamic and static environmental changes. Therefore, after utilizing Equations (1) to (3), we can partially eliminate the influence of seasonal changes, surface vegetation and other natural sources, effectively capture seismic and other sudden changes in the information, to a certain extent reduce the “non-seismic anomalies”, provide a basis for seismic anomaly extraction and reduce the misjudgment and omission of seismic information [7,65,66].
Since the gas anomalies triggered by earthquakes propagate from the bottom-up, AIRS provides multi-layer gas concentration information, giving new opportunities for seismic gas research. For the multi-layer gas data, the 2D anomaly-extraction algorithm was extended to 3D, and the new 3D structural conditions were added to analyze the seismic gas anomaly characteristics. For the 3D contour structure, firstly, the single-layer data were used for the corresponding anomaly extraction based on the improved A l i c e anomaly index-extraction algorithm, and subsequently, the seismic gas anomaly analysis was carried out based on the 3D structural conditions.
Presently, two primary manifestations of 3D structural conditions exist. In the first scenario, the seismic aerothermal anomaly emerges as the most intense and extensive anomaly source, wherein energy is transmitted to adjacent layers through thermal convection. Consequently, this phenomenon exhibits a distinctive “pyramid” shape, indicative of its spatial characteristics. In the second scenario, the seismic aerothermal anomaly diffuses and spreads to adjacent layers, resulting in an intriguing geometric configuration akin to an “inverted pyramid”. The shape of the “pyramid” may be due to the large amount of methane gas spilling out of the ground to the surface as a result of increased tectonic stress, which is consistent with the geogenic distribution of methane from earthquakes. The “inverted pyramid” is consistent with the geogenic emission characteristics of seismic methane, where its lower density facilitates effortless diffusion, resulting in a distinctive top-down diffusion pattern. In both cases, the possibility of anomalous atmospheric methane concentrations in the troposphere caused by gas convection can be ruled out.

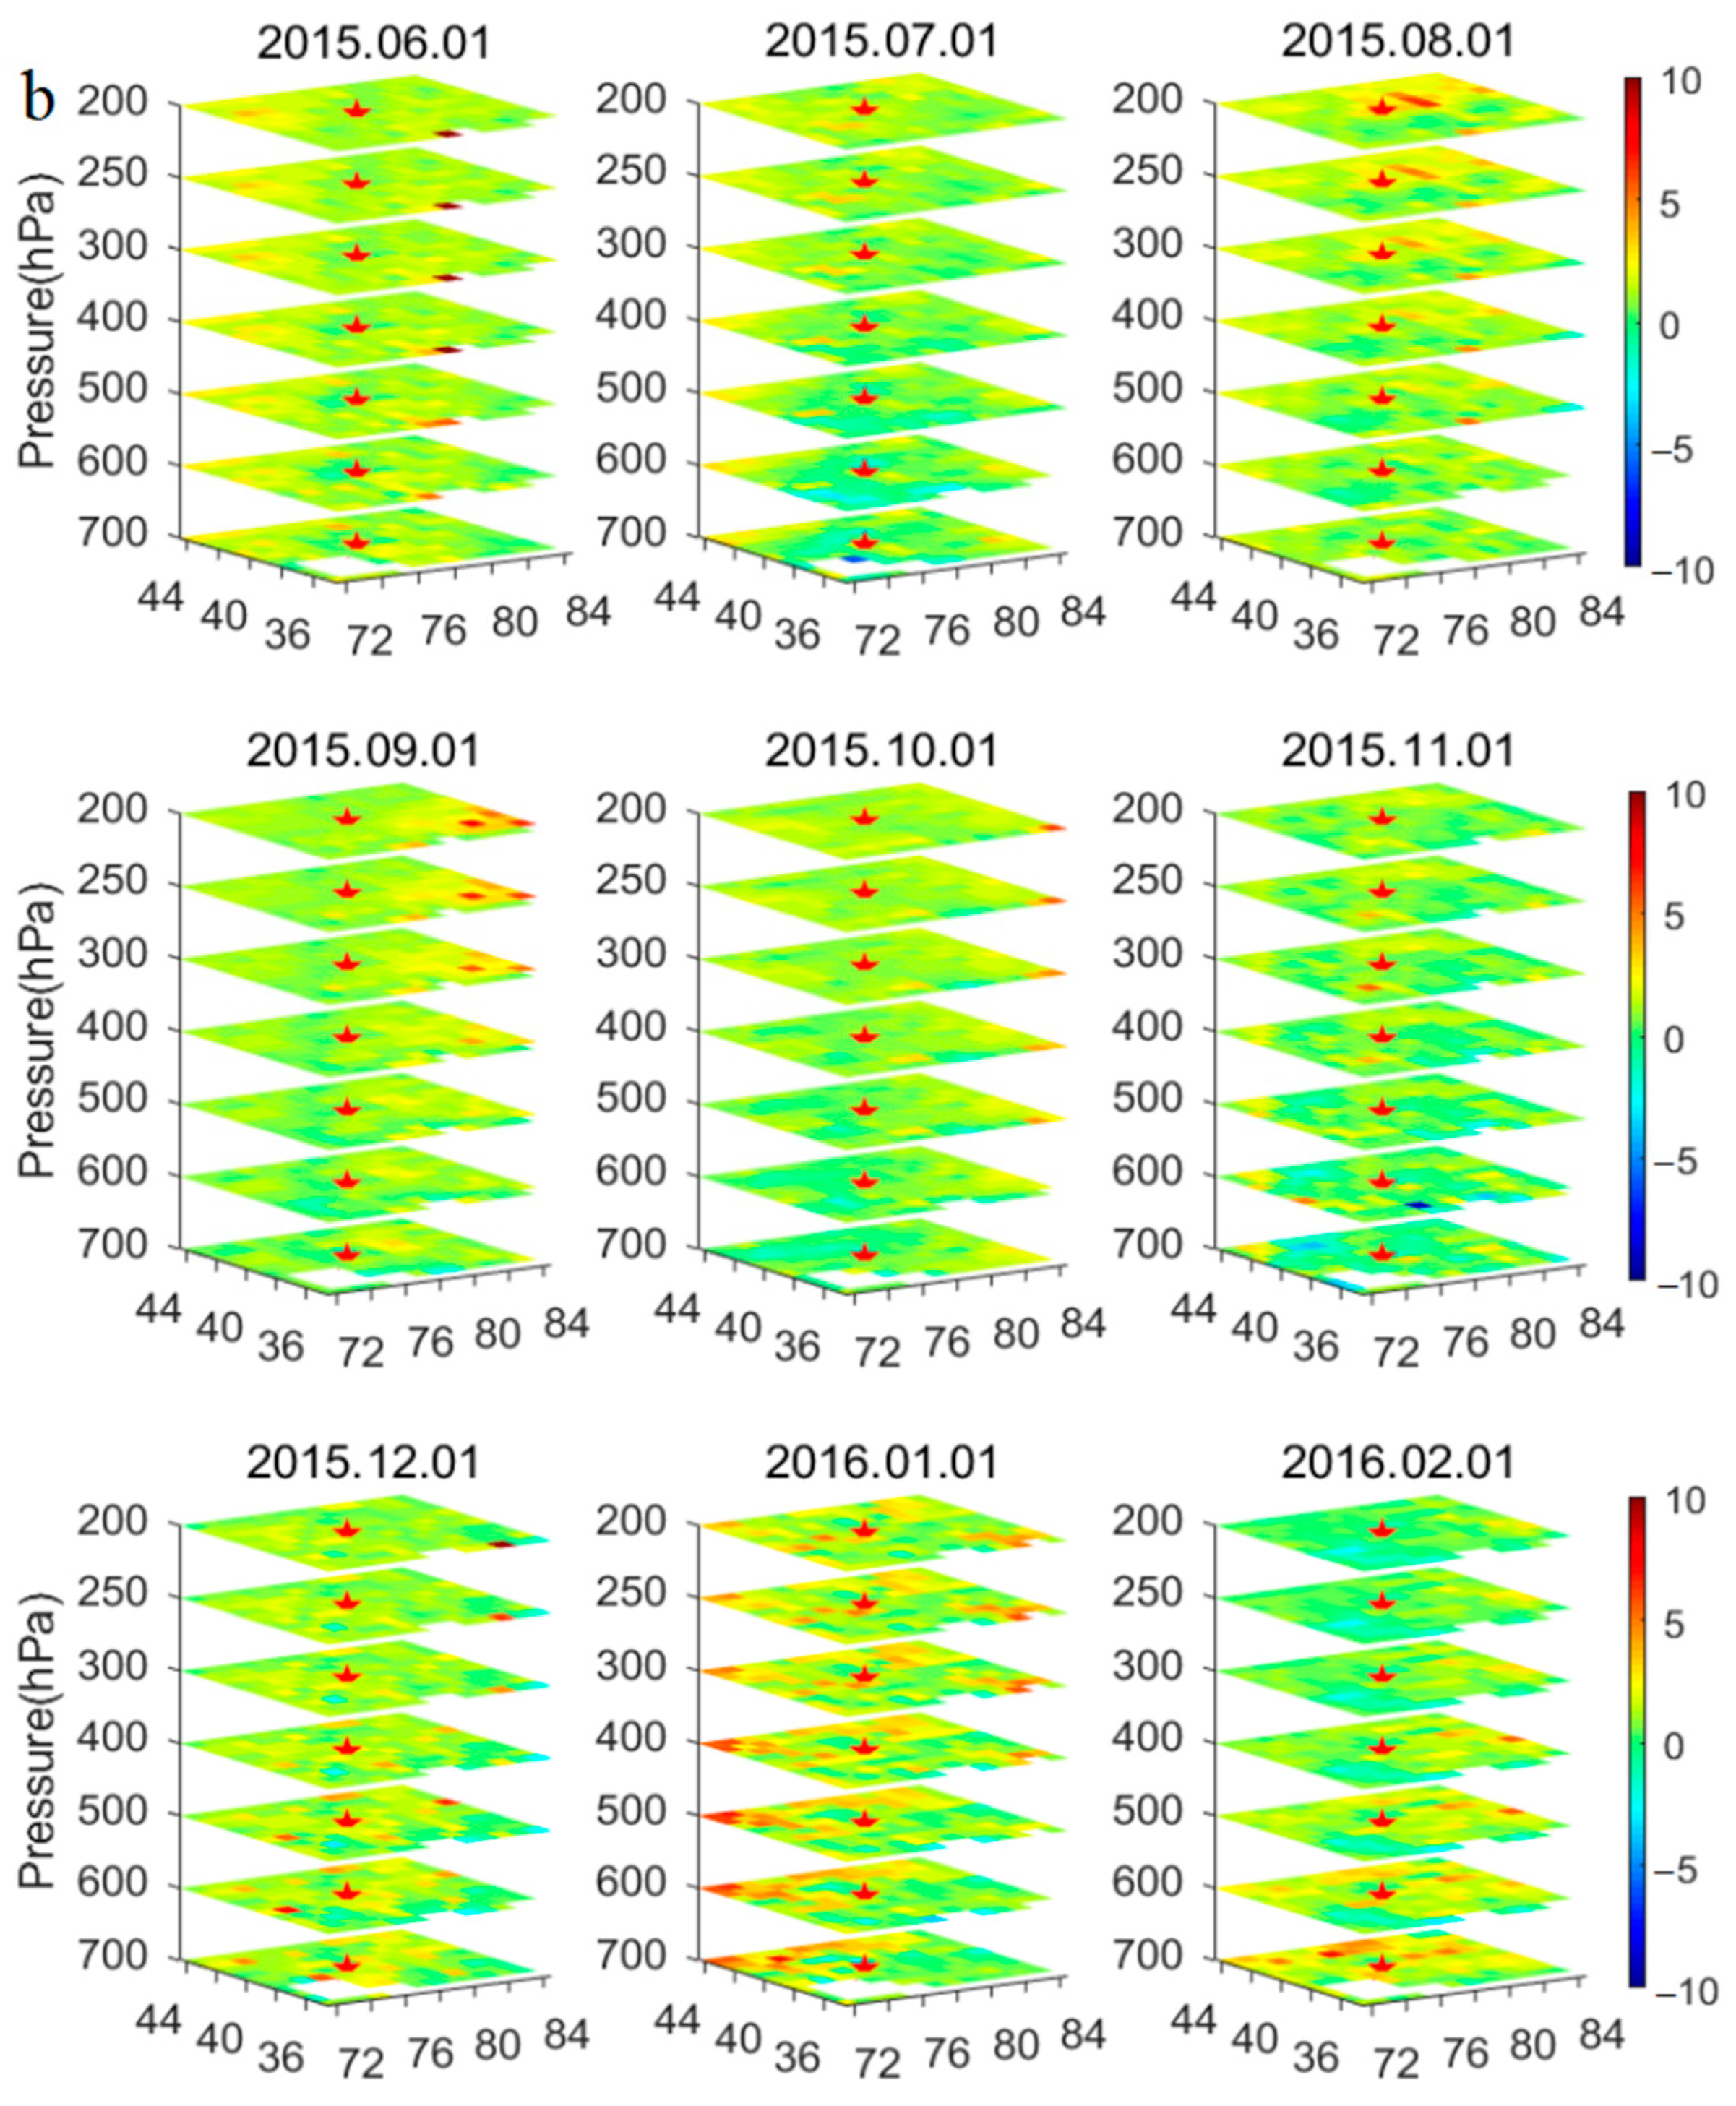
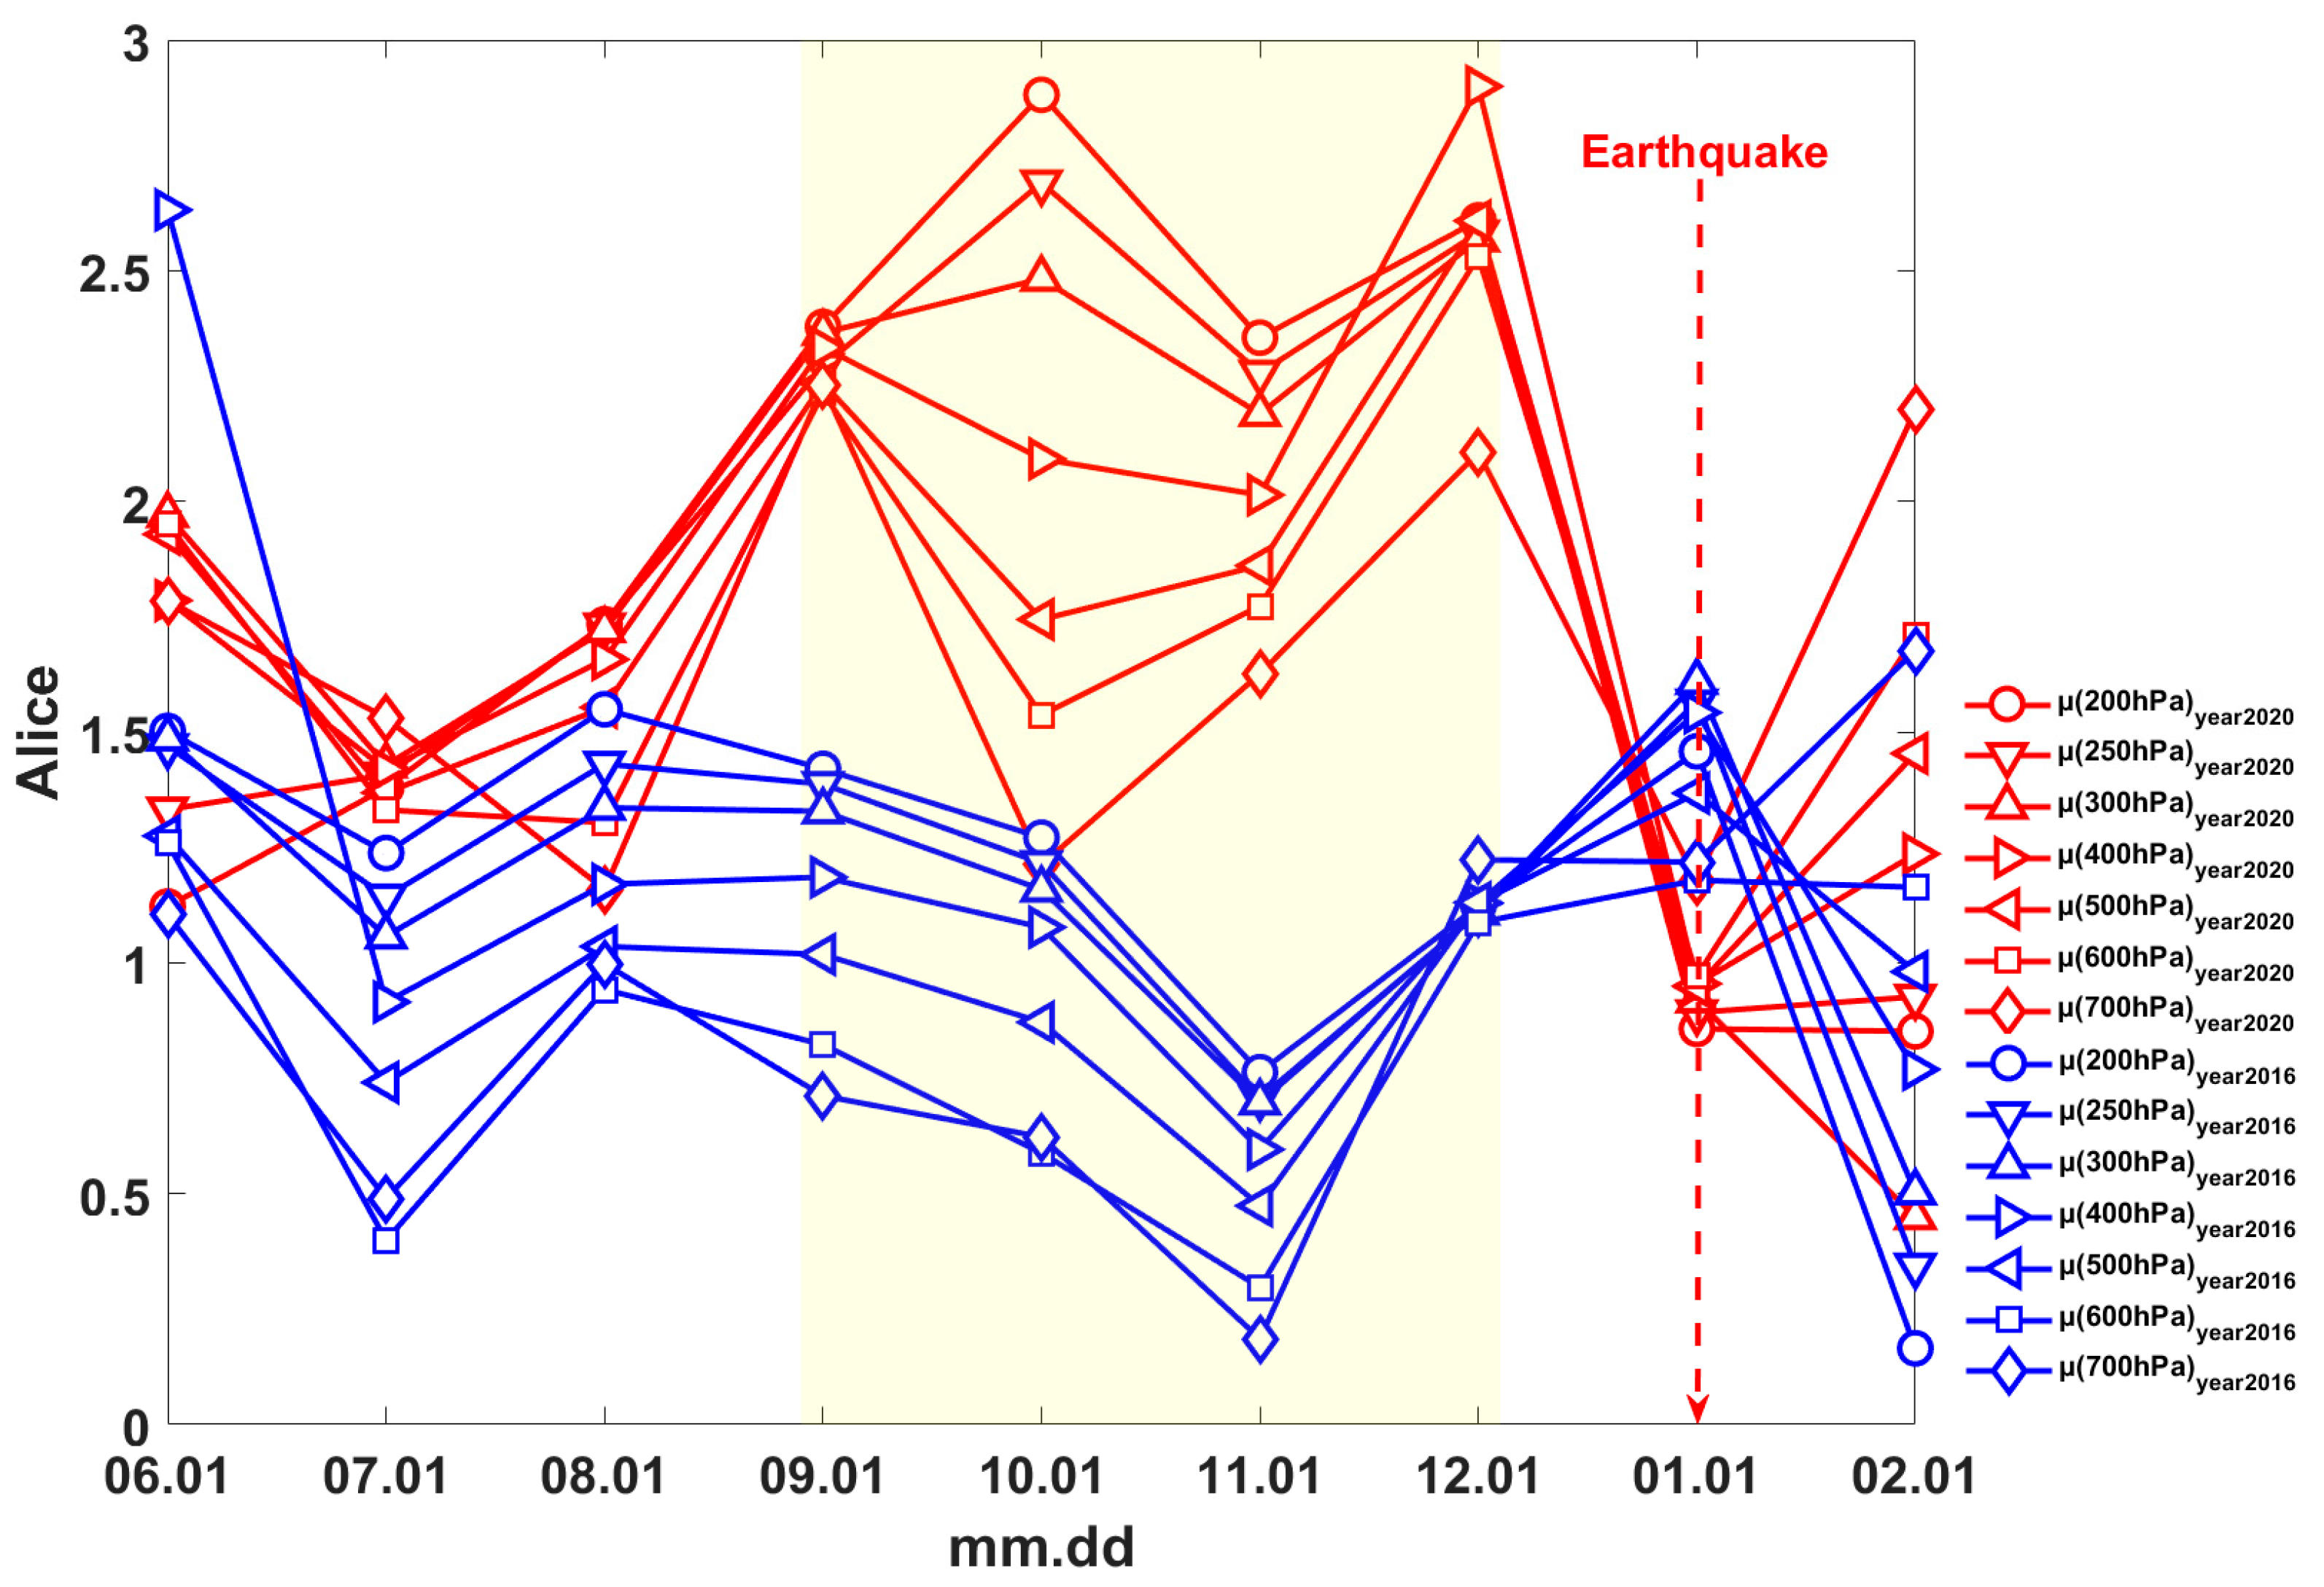
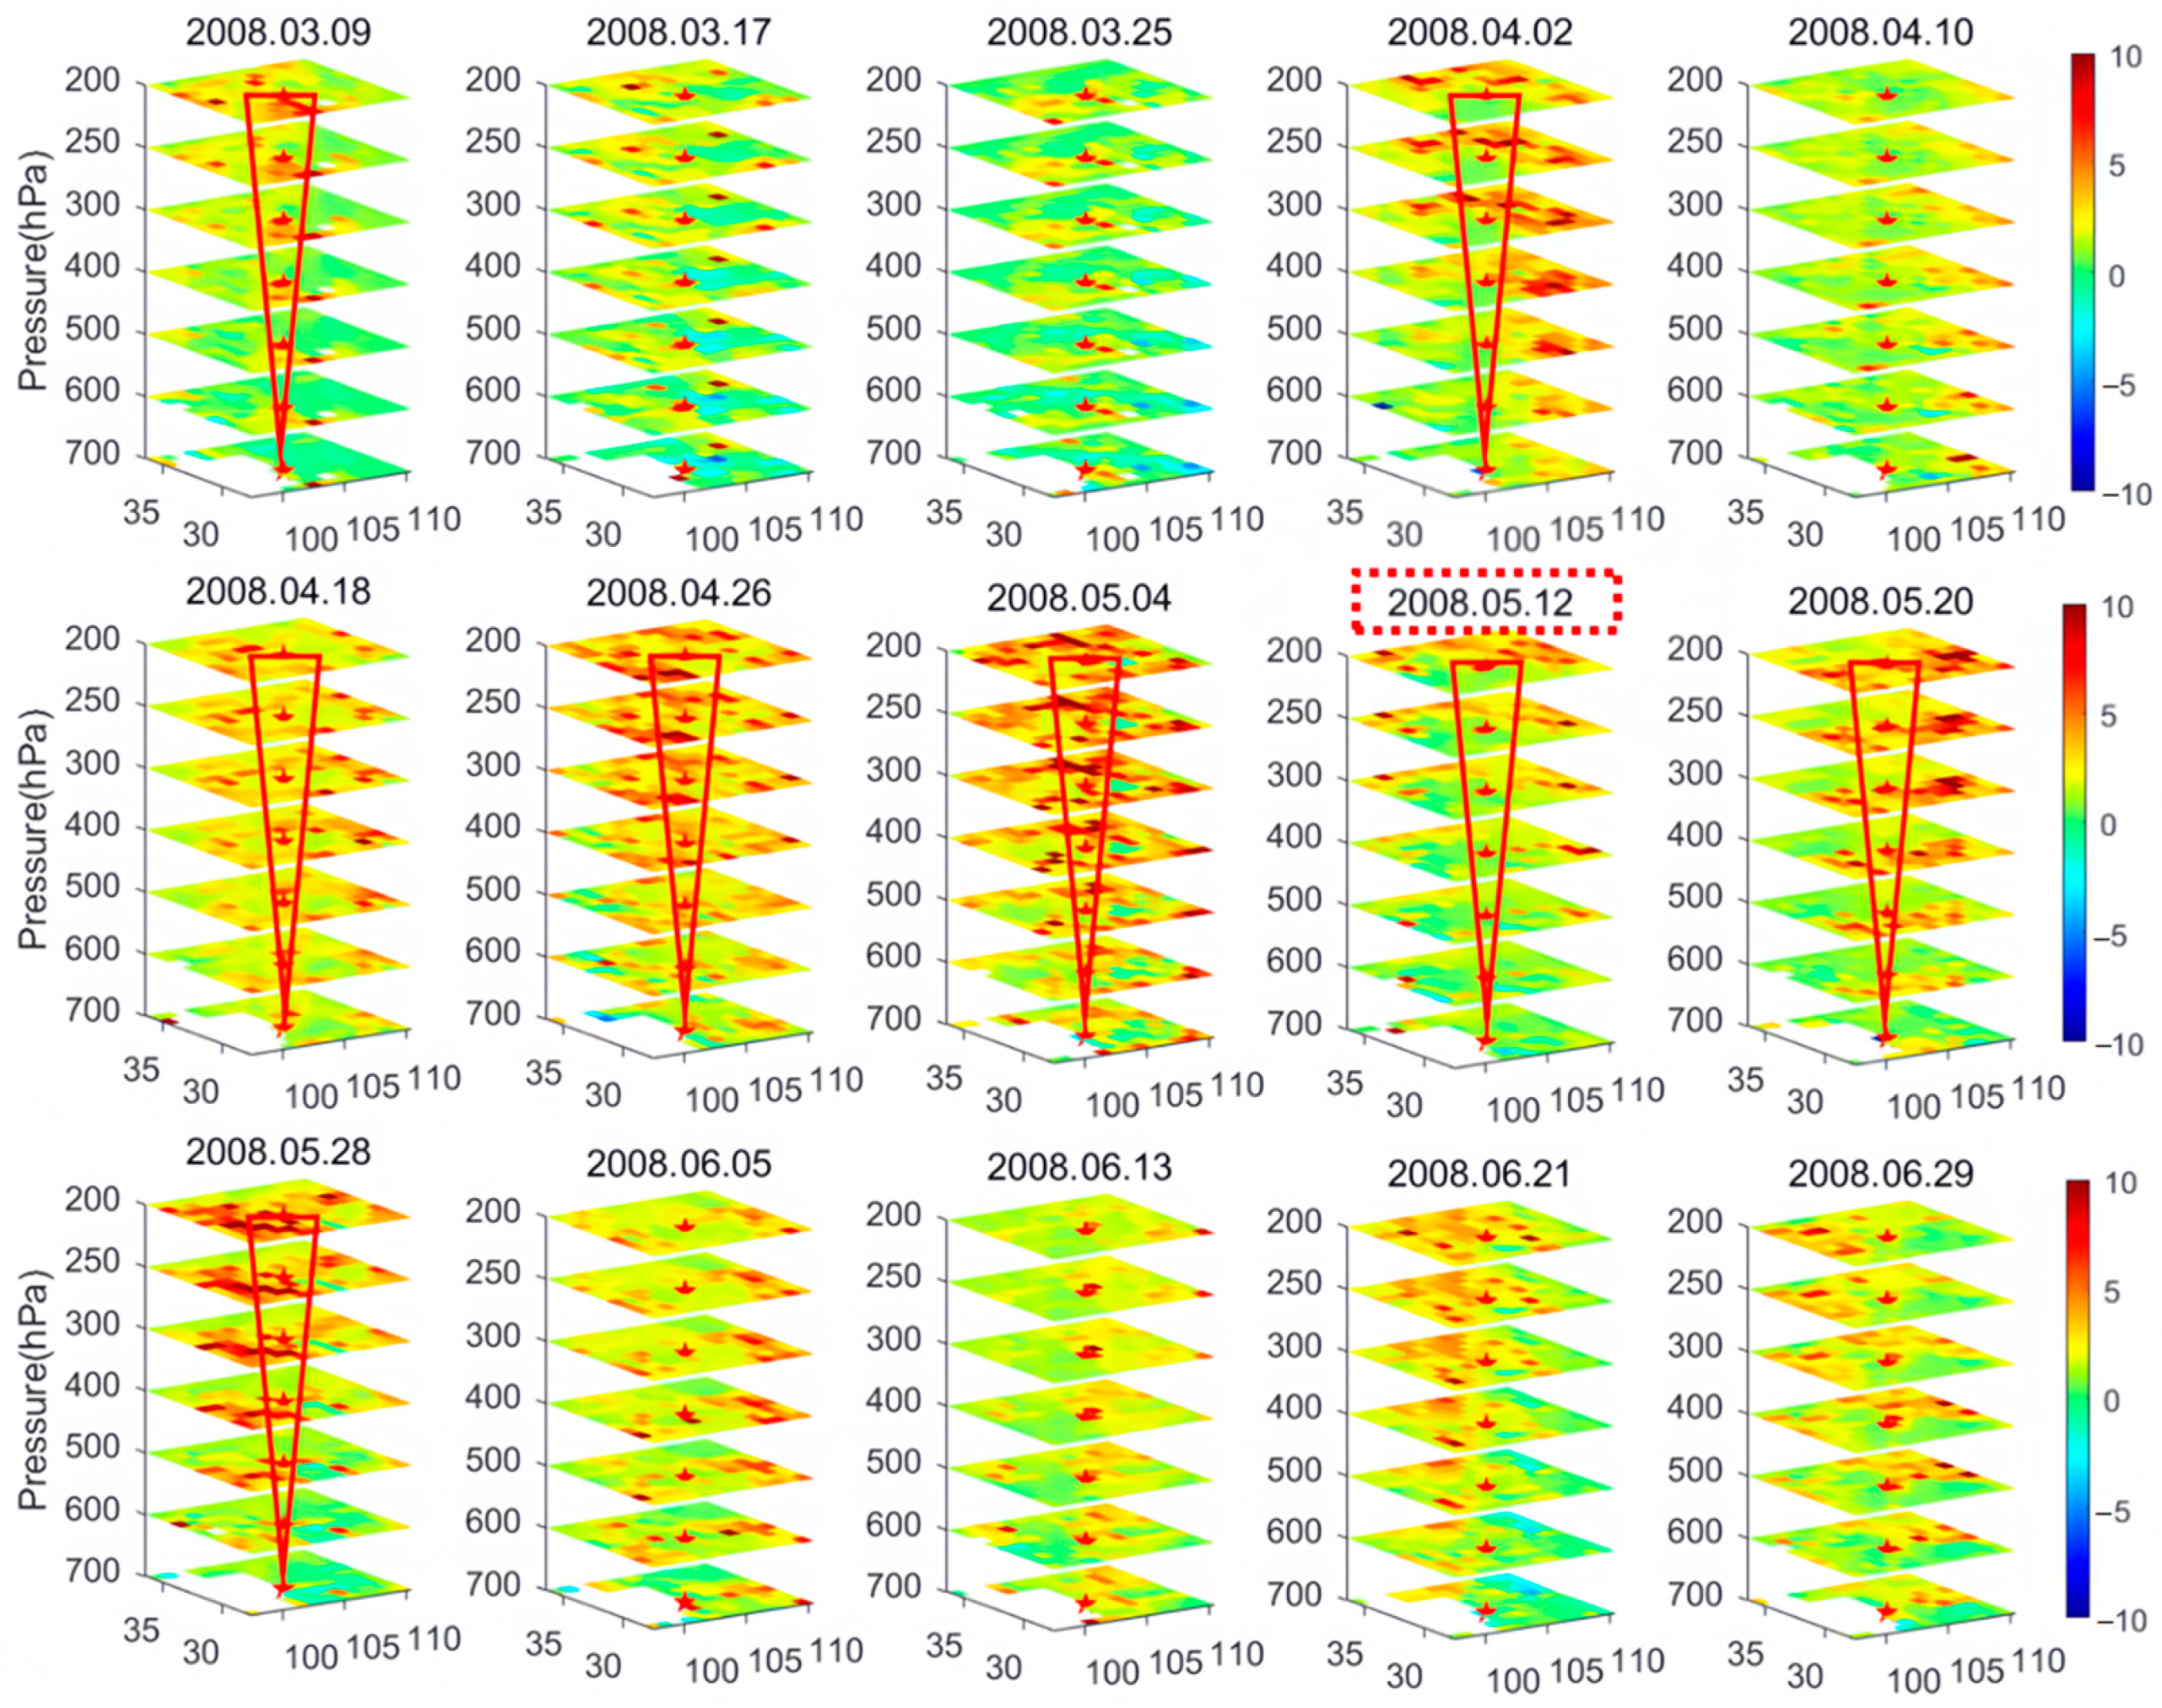
4. Analyses and Results

Based on the AIRS data, the optimized A l i c e anomaly index algorithm was used to calculate the monthly, 8-day and daily methane anomaly indices for the 2020 Xinjiang Jiashi earthquake, and the temporal and spatial distributions of the monthly methane anomaly indices are shown in Figure 2. The monthly scale results indicated that mild methane anomalies emerged in the northwestern region of the epicenter in the five months leading up to the earthquake, followed by the convergence of the anomalies towards the epicenter during the next month, with a clear tendency to intensify. During this phase, high methane anomalies were primarily concentrated at the convergence of the Keping Fault epicenter, the Maidan–Sharym Fault and the western portion of the epicenter. In October and November, the methane anomalies were chiefly located on both sides of the study area, with a weakening trend apparent in November. In the month before the earthquake, obvious methane anomalies appeared at the epicenter and its immediate vicinity, which gradually subsided to background concentrations during the earthquake and post-earthquake period.
Tracking the 8-day methane results based on monthly anomalies (Figure 3), the results revealed the emergence of a notable cluster of elevated methane anomalies in proximity to the epicenter and the Keping Fault on September 24th, 2019. Following that, there was a progressive expansion of the region, with heightened methane anomalies within the study area over the ensuing month, culminating in a peak anomaly on October 18th. Notably, the presence of methane anomalies endured at and in the vicinity of the epicenter. On October 26th, the methane anomaly propagated towards the south and northwest of the epicenter while diminishing in intensity at the epicenter. This phenomenon persisted until November 3rd. When there was a sharp increase in methane anomalies on November 11th, high values of methane were observed across almost the entire study area, after which they abruptly subsided one week later. Significantly, the heightened methane values were primarily distributed near the Maidan–Shayram rupture to the north of the epicenter and its adjacent ruptures. On November 27th, there was an additional abrupt surge in elevated methane values, predominantly concentrated within the northern region of the study area. The methane anomalies exhibited a tendency to wane in the month preceding the earthquake, eventually vanishing from the study area approximately 10 days prior to the seismic event. Subsequent to that, a faint methane anomaly emerged at the epicenter one week after the earthquake, gradually dissipating and reverting back to background concentrations by February. The pre-earthquake methane anomalies persisted in the study area for about 3 months from 24th September to the end of December, and showed the following anomalous characteristics: onset of enhancement–anomalous enhancement–anomalous decay–peak–anomalous weakening–anomalous re-enforcement–anomalous weakening again–calm.
To further investigate the temporal trends in methane concentrations before and after the Jiashi earthquake, the CH4  A l i c e time series near the epicenter was extracted as shown in Figure 4, and it was revealed that on 16th September 2019, it began surpassing a value of 2.0. Subsequently, it exhibited a rapid increase in the subsequent week, peaking at 7.394, followed by a sharp decline. The anomaly index remained consistently above 2.0 until 27th November 2019. The CH4 A l i c e near the epicenter was less than 1.0 only on 2nd October 2019 and 26th October 2019 during the study period, and there were four CH4  A l i c e peaks in the cycle from 16th September 2019 to 27th November 2019, i.e., 7.394 on 24th September 2019, 5.886 on 18th October 2019, 4.820 on 11th November 2019, and 3.900 on 27th November 2019 (purple rectangular box in Figure 4). The A l i c e peaks showed a gradual weakening trend, indicating that the anomalies near the epicenter gradually weakened. The subsequent A l i c e on 5th December 2019 weakened, but was still greater than 1.0. Afterwards, the A l i c e gradually increased, and was greater than 2.0 on 13th December 2019 and 21st December 2019 (black rectangular boxes in Figure 4), before plummeting to 0.315 two cycles before the quake, i.e., on 29th December 2019. The A l i c e gradually increased as the earthquake approached, reaching a peak in this phase during the generation cycle, which did not reach 2.0 but still reached 1.476, and gradually returned to the background concentration after the earthquake. However, it is worth noting that the A l i c e on 30th January 2020 showed a rebound, which could potentially be attributed to the presence of aftershocks. According to the China Earthquake Networks Center (CENC), an M4.3 aftershock (the epicenter was 39.93°N and 77.17°E) occurred on 31st January 2020, in the city of Artuz in the study area during the period of 30th January 2020, only 11.63 km from the epicenter.
From Figure 4, it is evident that the CH4  A l i c e values on 30th January exceeded those observed on 22nd January, and within the period until 15th February, there was a discernible trend of gradual attenuation of the CH4  A l i c e levels. As reported by the China Earthquake Networks Center (CENC), within the period of 22nd January, a solitary M4.0 earthquake event was documented within the study region. Similarly, on 30th January, a single M4.3 earthquake event was recorded. Notably, no seismic aftershocks of magnitude 4 or higher were registered between 7th February and 15th February. Based on these initial observations, it is suggested that there might be a gradual increase in CH4  A l i c e values as aftershock activity strengthens. However, further research is needed to determine whether the intensity of aftershocks correlates directly with A l i c e , to draw more precise conclusions.
The study area’s historical background methane concentrations over a 5-year period are illustrated in Figure 5. Given that the background field’s selected time scale covered the 7th of August 2019 to the 15th of February 2020, it is worth noting that Figure 5’s legend depicts methane concentrations in the study area during the same 5-year period of historical reference. Figure 5 reveals that methane concentrations exhibited their lowest levels in 2015, followed by a conspicuous upward trajectory over the subsequent five-year duration. The distribution of average methane concentrations over a historical 5-year period exhibited a relatively stable pattern, with no significant variations observed. Furthermore, the distribution of methane concentrations during non-seismic years from 2015 to 2018 aligned consistently with the distribution of historical 5-year average background methane concentrations, displaying no substantial disparities, and all falling within one standard deviation range. It is noteworthy that only the methane concentrations recorded during the non-seismic year of 2019 exceeded the average background methane concentrations, while none of the maximum methane concentrations recorded during this period surpassed 1.5 times the standard deviation threshold. The seismic year of 2020 marked a departure from the distribution trends observed in previous years, characterized by noticeably elevated methane concentrations compared to the historical period, spanning from the 31st of August 2019 to the 21st of December 2019. Subsequently, the methane concentrations gradually declined, returning closer to background levels after the 29th of December, though with a slight upward trend following the occurrence of the earthquake. It is evident that the methane concentrations recorded in 2020 surpassed both the historical five-year average methane concentrations over the same period and the methane concentrations levels documented from 2015 to 2019. Furthermore, they exceeded the standard deviation threshold of two times the historical five-year mean methane concentrations, with the minimum methane concentrations up until the end of December breaching the one-time standard deviation line (within the red dashed line). These findings provide further indications of a potential correlation between heightened methane and seismic activities.
To gain deeper insights into the geophysical characteristics of seismic methane, the 3D contour structures data on an 8-day scale were introduced. By combining these data with anomalous spatial structural features, we were able to analyze the correlation between the anomalies of methane and the earthquake. The results are presented in Figure 6 and they demonstrate that, on the vertical spatial scale, the high values from 700 hPa to 200 hPa exhibited a gradual increment from the lower to upper levels, resembling an “inverted pyramid” shape, throughout the period between 24th September and 18th October. Subsequently, a distinct weakening trend was observed from 700 hPa to 200 hPa one week later, persisting until the cycle on 3rd November. Starting from 11th November, the high values exhibited a progressive elevation in a bottom-up manner, resembling an “inverted pyramid” shape. This phenomenon persisted until mid-December, followed by a gradual attenuation observed from 700–200 hPa from late December to 14th January, resembling a “pyramid” shape. The initial analysis indicated that the observed phenomenon may have been caused by the “inverted pyramid” shape of the high-pressure to low-pressure layers during the cycle from 24th September to 18th October, due to the diffusion of geogenic methane gas. A preliminary analysis of the “pyramid” shape from 26th October to 3rd November suggested that this process may have resulted from the release of methane gas from subsurface reservoirs due to increased tectonic stress, leading to a bottom-up “pyramid” shape during the cycle. Furthermore, the persistence of the “inverted pyramid” shape from 11th November until mid-December can likely be attributed to the diffusion of methane gas. One month before the earthquake, there was a renewed surge in tectonic stress within the earth’s crust, leading to the release of subterranean methane gas. As a consequence of this pre-seismic process, a substantial quantity of methane gas was released into the atmosphere, resulting in a relatively weakened methane emission level during this period. The high values exhibited a reduction in comparison to the pre-seismic phase, yet an overall downward trend with a pyramid shape for the seismic cycle was still maintained. During the seismic cycle on 14th January, the high values exhibited a noticeable upward trend compared to the preceding week. Particularly, a prominent increase in high values was observed at 700 hPa for the epicenter, accompanied by a gradual decline in high values from 700 hPa to 200 hPa on the vertical spatial scale.
Based on the findings for both the monthly and 8-day scales, the methane anomaly during the month of the earthquake exhibited a relatively weak intensity. To further explore its short-term characteristics, a detailed analysis was conducted on the daily-scale methane distribution in January (Figure 7). The results revealed a noteworthy methane concentration anomaly in the northern region near the epicenter, specifically in the proximity of the Ozgeltau Fracture, which is recognized as a significant area associated with seismic activity. This anomaly displayed a substantial amplitude exceeding 2.0. As the earthquake approached, the high methane anomalies gradually converged towards the epicenter and disappeared on 15th January. Notably, three days prior to the earthquake, widespread methane anomalies manifested in the northern region of the study area, with conspicuous elevated methane levels detected in the vicinity of the Keping rupture and the northeastern part of its epicenter. Subsequently, the persistence of methane anomalies at the epicenter and within the study area could be attributed to potential aftershock influences following the seismic activity, with the anomalies dissipating by the 25th of January.

5. Discussion

In order to further verify the effectiveness of the anomaly-extraction algorithm and the characteristics of earthquake-induced methane emissions caused by earthquakes, the anomaly-extraction algorithm and the characterization pattern of geogenic methane anomalies used in this study were validated and analyzed accordingly, including comparisons with non-seismic years, as well as validation of the migration of the study area.
In order to verify the validity of the anomaly-extraction algorithm, the corresponding anomaly extraction of CH4 A l i c e for non-seismic years was carried out, and the 3D contour structures of CH4 A l i c e or non-seismic years in the study area corresponding to the time period from June 2019 to February 2020 were obtained, as shown in Figure 8. Figure 8a shows the three-dimensional contour structures of the seismic year scale, and Figure 8b shows the 3D contour structures of the monthly scale of the corresponding time period of the non-seismic year. Figure 8a illustrates a conspicuous elevation in methane concentration within the epicentral vicinity during the four months antecedent to the seismic event. Furthermore, a discernible diminution trend can be discerned across the vertical scale, spanning from 700–200 hPa, exhibiting a configuration reminiscent of a “positive pyramid”. In the subsequent month, the methane anomaly experienced a decline; however, a substantial region of heightened methane anomaly persisted in the northeastern sector of the study area until November 2019. During these periods, the vertical distribution characteristics of the methane concentration, spanning from the ground to the top of the atmosphere, exhibited an “inverted pyramid” configuration. The methane anomaly exhibited an increase one month preceding the earthquake, primarily localized around the epicenter, its northwest and the southeast. Notably, the methane concentration displayed conspicuous vertical distribution traits, resembling a “positive pyramid”, between 700 hPa and 200 hPa. Subsequently, the anomaly dissipated in the month of the seismic event.
Figure 8b shows that between June 2015 and February 2016, there were no notable methane anomalies near the earthquake’s center or its surroundings. Similarly, during this time, there were no earthquakes of magnitude 6 or higher recorded in the area (refer to Table 1). In January 2016, there was a noticeable spike in methane levels only in the northwest part of the research area. However, this anomaly was short-lived. By February, high methane concentrations were only present at ground level. Given that no earthquakes of magnitude 5 or higher occurred around the time of the January methane anomaly (see Table 1), it is possible to preliminarily dismiss any association between this anomaly and seismic activity. To learn more about the causes of methane anomalies over this time period, it will be necessary to analyze the meteorological and climatic conditions, anthropogenic emissions and geological and tectonic background of the study area. In this study, we only focused on the seismic methane anomalies, and therefore we did not explore the causes of methane anomalies in this time period.
The mean value of the 700–200 hPa CH4 A l i c e in the study area at the monthly scale of a seismic year and non-seismic year is shown in Figure 9. The comparative analysis revealed that the 700–200 hPa CH4 A l i c e levels from 4 months to 1 month before the 2020 earthquake were significantly higher than those observed in the same period in 2016 (highlighted by the yellow shading in Figure 9). In the month when the earthquake happened in 2020, the CH4 A l i c e levels were lower compared to those in 2016, consistent with the characteristic distribution of methane 3D contour structures shown in Figure 8. (In this context, “2020” refers to the period from June 2019 to February 2020 and “2016” refers to the period from June 2015 to February 2016.) It was further demonstrated that this study’s anomaly-extraction algorithm demonstrates a certain degree of feasibility in identifying geogenic methane emission anomalies associated with earthquakes.
Jing Cui et al. conducted a corresponding analysis of methane anomaly characteristics on an 8-day scale for the M8.0 Wenchuan, Sichuan earthquake of 12th May 2008. The results indicated a noteworthy methane anomaly manifesting both before and after the seismic event, with the anomaly appearing to be closely related to the occurrence of the earthquake [7]. This study provided a detailed investigation and exposition of the spatiotemporal distribution characteristics of methane anomalies before and after the Wenchuan earthquake, and its conclusions have been widely acknowledged within the scientific community. The three proposed indices suggested notable methane anomalies coinciding with the Wenchuan earthquake. Leveraging the introduced Alice concept, the findings revealed significant methane anomalies in the 200–400 hPa study area, both before and after the earthquake. However, this study did not delve into the three-dimensional emission characteristics of geogenic methane, detailing its findings solely on a two-dimensional scale. Building on this research, there was a need to investigate the three-dimensional emission characteristics of methane anomalies associated with the Wenchuan earthquake and to further validate that the anomaly can be attributed to ground-borne emissions. The corresponding 3D contour structures within the relevant time period were subsequently obtained, as illustrated in Figure 10 below. In order to facilitate the migration analysis, methane data from AIRS 8-day scale were also used.
The findings indicated that methane anomalies commenced across each layer of the 700–200 hPa contour on 9th March, assuming a distinct “inverted pyramid” configuration, with anomalies predominantly concentrated in the northwest and south of the epicenter. Subsequently, the anomalies exhibited a diminishing trend before resurging on 2nd April, featuring a gradual intensification of methane anomalies from the high-pressure layer to the low-pressure layer, while still maintaining the “inverted pyramid” shape. Moreover, as the altitude increased, the anomalies gradually coalesced towards the epicenter and its northern vicinity. On 10th April, the region exhibiting elevated methane values within the 700–200 hPa range, contracted in comparison to the preceding week. Subsequently, as the earthquake approached, expansive areas featuring heightened methane concentrations emerged across each layer of the study area’s contour. These elevated values gradually converged towards the epicenter and the Longmenshan fault, culminating in their peak on 4th May. Following this peak, the region characterized by anomalously high methane values underwent a sharp decline during the seismic cycle. However, approximately one-week post-earthquake, the anomalously high methane values experienced a resurgence, persisting within the study area possibly due to the influence of aftershocks. During the cycle from 18th April to 28th May, 700–200 hPa showed the shape of an “inverted pyramid”, indicating that the methane anomalies gradually increased with the gradual decrease of air pressure, reflecting the diffusion characteristics of geogenic methane, i.e., from higher to lower pressure. The “inverted pyramid” was in line with the characteristics of the geogenic methane emission from earthquakes, i.e., methane has a smaller density and can easily diffuse to form a shape of diffusion from top to bottom, and it can be ruled out that the atmospheric methane concentration anomalies in the troposphere were caused by the convection of gases. It can further be confirmed that the Wenchuan earthquake methane anomalies were due to the earthquakes. In this study, methane anomalies associated with the Wenchuan earthquake initially emerged from both ends of the study area and gradually converged towards the epicenter as the earthquake approached. Eight days prior to the earthquake, widespread methane anomalies were observed near the epicenter and its vicinity. Over time, these anomalies exhibited a pattern of enhancement–attenuation–re-enhancement, consistent with the findings from 2019.

6. Conclusions

This study examined the spatial and temporal distribution characteristics of methane emissions associated with the M6.4 earthquake in Jiashi, Xinjiang, on 19th January 2020. The A l i c e anomaly-extraction algorithm and L3 product data from AIRS were utilized to analyze the seismic methane distribution at the monthly, 8-day and daily scales. Three-dimensional contour structures of methane emissions at the 8-day scale were introduced, taking into account the 3D structural conditions of gas to determine geogenic emissions. To validate the A l i c e anomaly-extraction algorithm and geogenic emission characteristics of methane, a comparative analysis was conducted using non-seismic years and the M8.0 Wenchuan earthquake that occurred on 12th May 2008. The following conclusions were drawn from this research.
In this study, a process of seismic methane anomaly extraction was proposed including monthly scale monitoring, 8-day focused tracking (horizontal, 3D) and daily scale tracking (month of the earthquake). The results showed that the monthly, 8-day and daily scales all had corresponding high CH4 anomalies before the earthquake, and because the CH4 anomalies in the month of the earthquake are weaker on the monthly and 8-day scales, the combination of the daily scale analysis showed that there were significant high CH4 values in the northeastern part of the epicenter during the 8 days before the earthquake.
The 8-day scale 3D contour structures features suggested that the methane anomalies occurring before the Jiashi earthquake were caused by geogenic emissions. Both “pyramid” and “inverted pyramid” vertical distribution features ruled out tropospheric CH4 concentration anomalies due to gas convection, and continuous “inverted pyramid” and “ pyramid” emission features occurred from 24th September 2019 to 21st December 2019 before the Jiashi earthquake. The “inverted pyramid” and “pyramidal” emission features indicated that the anomaly was related to the occurrence of the earthquake.
The absence of corresponding methane anomalies in non-seismic years indicated the feasibility of the anomaly-extraction algorithm used in this study, and the subsequent migration validation in the Wenchuan area also showed that the anomaly-extraction algorithm was capable of extracting corresponding high methane anomalies. The combination of 3D contour structures in the Wenchuan area also suggested that the anomalies were caused by the earthquakes.
In general, the results obtained in this study provide a reference basis for the study of seismic methane anomalies; however, there were some shortcomings, such as the limitations of the AIRS data acquisition method. Although a wide range of high methane anomalies appeared in the study area in the three days before the earthquake, the daily scale methane data acquired by using AIRS were greatly affected by the natural climate and solar radiation, and the data of the descending orbit day selected to avoid solar radiation impacts were missing. Therefore, the performance of the methane anomalies on the daily scale was slightly weaker. To address the problem of missing data at the daily scale, this study will select other daily scale methane data products or multi-source remote sensing data to carry out a corresponding analysis of the problem, with a view to providing a more reliable reference for the validation of seismic methane anomalies.

Author Contributions

Conceptualization, methodology, writing—review and editing, J.C.; validation, Y.H., investigation, L.W.; writing—original draft preparation and visualization, X.W.; supervision, Z.Z., W.J., H.C. and Q.L.; project administration, J.C.; funding acquisition, J.C. All authors have read and agreed to the published version of the manuscript.

Funding

This work was supported by the National Key Research and Development Project (No. 2021YFB3901203, No. 2018YFC503505).

Data Availability Statement

The AIRS data used in the study can be download at http://disc.gsfc.nasa.gov/AIRS/index.shtml/, accessed on 1 May 2024.

Acknowledgments

The work is also supported by the the APSCO Earthquake Research Project Phase II. Thanks to the International Space Science Institute (ISSI in Bern, Switzerland and ISSI-BJ in Beijing, China) for supporting International Team 23-583 lead by Dedalo Marchetti and Essam Ghamry.

Conflicts of Interest

The authors declare no conflict of interest.

References

  1. Du, L. Five Gas-Spheres and hydrogen, hydrocarbon resources in the earth-with a discussion on geodynamics of gas. Uranium Geol. 1993, 5, 257–265. [Google Scholar]
  2. Zhang, H.; He, T.; Zhao, Y.; Qian, Y. The state of fluids deep inside the earth and its significance in the physics of earthquake sources. Physics 2009, 38, 238–247. [Google Scholar]
  3. Zhu, H.; Wang, C. Degassing of the earth and its effects on environment of mankind. J. Catastrophology 1990, 4, 84–88. [Google Scholar]
  4. Irwin, W.P.; Barnes, I. Tectonic relations of carbon dioxide discharges and earthqukes. J. Geoghys. Res. 1980, 85, 3115–3121. [Google Scholar] [CrossRef]
  5. King, C.; Zhang, W.; Zhang, Z. Earthquke-induced Groundwater and Gas changes. Pure Appl. Geophys. 2006, 163, 633–645. [Google Scholar] [CrossRef]
  6. Voltattorini, N.; Quattrocchi, F.; Gasparini, A.; Sciarra, A. Soil gas degassing during the 2009 L’Aquila earthquake: Study of the seismotectonic and fluid geochemistry relation. Ital. J. Geosci. 2012, 131, 440–447. [Google Scholar] [CrossRef]
  7. Cui, J.; Shen, X.H.; Zhang, J.F.; Ma, W.Y.; Chu, W. Analysis of spatiotemporal variations in middle-tropospheric to upper-tropospheric methane during the Wenchuan Ms8.0 earthquake by three indices. Nat. Hazards Earth Syst. Sci. 2019, 19, 2841–2854. [Google Scholar] [CrossRef]
  8. Salazar, J.M.L.; Pérez, N.M.; Hernández, P.A.; Soriano, T.; Barahona, F.; Olmos, R.; Cartagena, R.; López, D.L.; Lima, R.N.; Melián, G.; et al. Precursory diffuse carbon dioxide degassing signature related to a 5.1 magnitude earthquake in EI Salvado, Central America. Earth Planet. Sci. Lett. 2002, 205, 81–89. [Google Scholar]
  9. Zhou, X.; Du, J.; Chen, Z.; Cheng, J.; Tang, Y.; Yang, L.; Xie, C.; Cui, Y.; Liu, L.; Yang, P.; et al. Geochemistry of soil gas in the seismic fault zone produced by the Wenchuan Ms 8.0 earthquake, southwestern China. Geochem. Trans. 2010, 11, 5. [Google Scholar] [CrossRef]
  10. Wu, L.X.; Liu, S.J.; Wu, Y.H. Infrared Remote Sensing for Rock Catastrophe Due to Overloaded; China Science Publishing & Media Ltd.: Beijing, China, 2006; pp. 240–244. [Google Scholar]
  11. Zhao, H. Preliminary analysis of the phenomenon of temperature increase in the epicentre area prior to the earthquake in the east Yunnan region. North China Earthq. Sci. 1984, 2, 53–58. [Google Scholar]
  12. Mil’kis, M.R. Meteorological precursors of earthquakes. Izv. Earth Phys. 1986, 22, 195–204. [Google Scholar]
  13. Jing, F.; Singh, R.P. Satellite Observed Multi-Parameter Variations Associated with the 2020 Yutian Earthquake, China. In Proceedings of the IEEE International Geoscience and Remote Sensing Symposium IGARSS, Brussels, Belgium, 11–16 July 2021. [Google Scholar]
  14. Xu, X.; Qiang, Z.; Lin, C. Anomalous ground warming before the 1976 Tangshan earthquake. Chin. Sci. Bull. 1992, 18, 1684–1687. [Google Scholar]
  15. Xu, X.; Xu, X.M.; Wang, Y. Satellite infrared anomaly before Nantou Ms = 7.6 Earthquake in Taiwan, China. Acta Seismol. Sin. 2000, 13, 710–713. [Google Scholar] [CrossRef]
  16. Jing, F.; Singh, R.P. Changes in tropospheric ozone associated with strong earthquakes and possible mechanism. IEEE J. Sel. Top. Appl. Earth Observ. Remote Sens. 2021, 14, 5300–5310. [Google Scholar] [CrossRef]
  17. Guo, G. Atmosphere Thermal Anomaly Before Zhangbei Earthquake in 1998. Technol. Rev. 2010, 28, 98–100. [Google Scholar]
  18. Tronin, A. Remote sensing and earthquakes: A review. Phys. Chem. Earth Part A/B/C 2006, 31, 138–142. [Google Scholar] [CrossRef]
  19. Toutain, J.P.; Baubron, J.C. Gas geochemistry and seismotec-tonics: A review. Tectonophysics 1999, 304, 1–27. [Google Scholar] [CrossRef]
  20. Wang, J.; Zhang, X.; Pan, L.; Zeng, Z. Anomalies of temperature increase and methane release before Lushan earthquake (Ms7.0). Earth Sci. Front. 2013, 20, 29–35. [Google Scholar]
  21. Cui, Y.J.; Du, J.G.; Chen, Y.; Liu, L.; Liu, H.; Yi, L.; Sun, F.X. Increasing of CO and CH4 Gas Emission at Longmenshan Fault Zone before and after Wenchuan Ms8.0 Earthquake. J. Seismol. 2016, 39, 239–245+175. [Google Scholar]
  22. Cui, Y.J.; Du, J.G.; Li, Y.; Guo, Q.N. Detecting anomalies of atmospheric total column CH4 and CO Related to the 2008 Wenchuan Ms8. 0 and 2013 Lushan Ms7. 0 earthquakes. Bull. Mineral. Petrol. Geochem. 2016, 35, 1022–1027. [Google Scholar]
  23. Li, X.Y.; Cui, Y.J.; Ma, H.Q.; Wei, D.J.; Wu, K.T. Anomalies on the changes of CH4 and CO related to the 15 April 2015 Alashan Zuoqi Ms5.8 earthquake in the Inner Mongolia. Earthquake 2019, 39, 54–62. [Google Scholar]
  24. Jiang, L.; Cui, Y.J.; Du, J.G.; Ding, Z.H.; Liu, Y.M.; Liu, Y.N. Satellite hyperspectral remote sensing geochemical anomalies associated with three strong earthquakes around the Qinghai-Tibetan Plateau. Earthquake 2021, 41, 129–144. [Google Scholar]
  25. Qiang, Z.J.; Xu, X.D.; Dian, C.G. Thermal infrared anomaly precursor of impending earthquakes. Chin. Sci. Bull. 1991, 36, 319–323. [Google Scholar] [CrossRef]
  26. Qiang, Z.J.; Xu, X.D.; Dian, C.G. Satellite thermal infrared anomalous temperature increase and impending earthquake precursor. Chin. Sci. Bull. 1992, 37, 1643–1646. [Google Scholar]
  27. Ye, M.Q.; Wu, Q.Y.; Yang, Z.D. Example of research on relation between satellite thermal infrared anomaly and strong earthquake. Chin. Sci. Bull. 1995, 40, 576–579. [Google Scholar]
  28. Saraf, A.K.; Choudhury, S. NOAA-AVHRR detects thermal anomaly associated with the 26 January 2001 Bhuj earthquake, Gujarat, India. Int. J. Remote Sens. 2005, 26, 1065–1073. [Google Scholar] [CrossRef]
  29. Panda, S.K.; Choudhury, S.; Saraf, A.K.; Das, J.D. MODIS land surface temperature data detects thermal anomaly preceding 8 October 2005 Kashmir earthquake. Int. J. Remote Sens. 2006, 28, 4587–4596. [Google Scholar] [CrossRef]
  30. Chen, M.H.; Deng, Z.H.; Ma, X.J.; Tao, J.L.; Wang, Y. Relation Analysis Method in Study on Satellite Infrared Anomalies Prior to Earthquake. Seismol. Geol. 2007, 29, 863–872. [Google Scholar]
  31. Chen, S.Y. A Study on the Quantitative Thermal Infrared Remote Sensing Method for Extracting Information of Current Tectonic Activity. Ph.D. Thesis, Institude of Geology, China Earthquake Administration, Beijing, China, 2006. [Google Scholar]
  32. Chen, S.Y.; Liu, P.X.; Liu, L.Q.; Ma, J.; Chen, G.Q. Wavelet analysis of thermal infrared radiation of land surface and its implication in the study of current tectonic activitis. Chin. J. Geophys. 2006, 49, 824–830. [Google Scholar] [CrossRef]
  33. Wang, Y.L.; Chen, G.H.; Kang, C.L.; Zhang, Q. Earthquake-related thermal-infrared abnormity detection with wavelet packet decomposition. Prog. Geophys. 2008, 23, 368–374. [Google Scholar]
  34. Saradjian, M.R.; Akhoondzadeh, M. Thermal anomalies detection before strong earthquakes (M > 6.0) using interquartile, wavelet and Kalman filter methods. Nat. Hazard Earth Syst. Sci. 2011, 11, 1099–1108. [Google Scholar] [CrossRef]
  35. Zhang, X.; Zhang, Y.S.; Wei, C.X.; Tian, X.F.; Feng, H.W. Thermal Infrared Anomaly Prior to Yiliang of Yunnan Ms5.7 Earthquake. China Earthq. Eng. J. 2013, 35, 171–176. [Google Scholar]
  36. Zhang, X.; Zhang, Y.S.; Wei, C.X.; Tian, X.F.; Tang, Q.; Gao, J. Analysis of Thermal Infrared Anomoly before the Lushan Ms7.0 Earthquake. China Earthq. Eng. J. 2013, 35, 272–277. [Google Scholar]
  37. Guo, X.; Zhang, Y.S.; Wei, C.X.; Zhong, M.J.; Zhang, X. Medium Wave Infrared Brightness Anomolies of Wenchuan 8.0 and Zhongba 6.8 Earthquakes. Acta Geogr. Sin. 2014, 35, 338–344. [Google Scholar]
  38. Luca, A.D.; Mignani, R.P.; Marelli, M.; Salvetti, D.; Sartore, N.; Belfiore, A.; Parkinson, P.S.; Caraveo, P.A.; Bignami, G.F. PSR J0357+3205: A fast-moving pulsar with a very unusual X-ray trail. Astrophys. J. Lett. 2012, 765, L19. [Google Scholar] [CrossRef]
  39. Genzano, N.; Aliano, C.; Filizzola, C.; Pergola, N.; Tramutoli, V. A robust satellite technique for monitoring seismically active areas: The case of Bhuj-Gujarat earthquake. Tectonophysics 2007, 431, 197–210. [Google Scholar] [CrossRef]
  40. Genzano, N.; Aliano, C.; Corrado, R.; Filizzola, C.; Lisi, M.; Mazzeo, G.; Paciello, R.; Pergola, N.; Tramutoli, V. RST analysis of MSG-SEVIRI TIR radiances at the time of the Abruzzo 6 April 2009 earthquake. Nat. Hazards Earth Syst. Sci. 2009, 9, 2073–2084. [Google Scholar] [CrossRef]
  41. Pergola, N.; Aliano, C.; Coviello, I.; Filizzola, C.; Genzano, N.; Lacava, T.; Lisi, M.; Mazzeo, G.; Tramutoli, V. Using RST approach and EOS-MODIS radiances for monitoring seismically active regions: A study on the 6 April 2009 Abruzzo earthquake. Nat. Hazards Earth Syst. Sci. 2010, 10, 239–249. [Google Scholar] [CrossRef]
  42. Tramutoli, V.; Aliano, C.; Corrado, R.; Filizzola, C.; Genzano, N.; Lisi, M.; Martinelli, G.; Pergola, N. On the possible origin of thermal infrared radiation(TIR) anomalies in earthquake-prone areas observed using robust satellite techniques(RST). Chem. Geol. 2013, 339, 157–168. [Google Scholar] [CrossRef]
  43. Panakkat, A.; Adeli, H. Neural network models for earthquake magnitude prediction using multiple seismicity indicators. Int. J. Neural Syst. 2007, 17, 13–33. [Google Scholar] [CrossRef]
  44. Reyes, J.; Morales-Esteban, A.; Martinez-Alvarez, F. Neural networks to predict earthquakes in Chile. Appl. Soft Comput. 2013, 13, 1314–1328. [Google Scholar] [CrossRef]
  45. Martinez-Alvarez, F.; Reyes, J.; Morales-Esteban, A.; Rubio-Escudero, C. Determing the best set of seismicity indicator to predict earthquakes. Two case studies: Chile and the lberian Peninsual. Knowl. Based Syst. 2013, 50, 198–210. [Google Scholar] [CrossRef]
  46. Liu, Y.J.; Wu, L.X.; Qi, Y.; Ding, Y.F. General features of multi-parameter anomalies of six moderate earthquakes occurred near Zhangbei-Bohai fault in China during the past decades. Remote Sens. Environ. 2023, 295, 113692. [Google Scholar] [CrossRef]
  47. Wu, L.X.; Qi, Y.; Mao, W.F.; Lu, J.C.; Ding, Y.F.; Peng, B.Q.; Xie, B.S. Scrutinizing and rooting the multiple anomalies of Nepal earthquake sequence in 2015 with the deviation–time–space criterion and homologous lithosphere–coversphere–atmosphere–ionosphere coupling physics. Nat. Hazards Earth Syst. Sci. 2023, 23, 231–249. [Google Scholar] [CrossRef]
  48. Zheng, S.; Wu, L.X.; Qin, K. Multiple parameters anomalies for verifying the geosystem spheres coupling effect: A case study of the 2010 Ms7.1 Yushu earthquake in China. Ann. Geophy. 2014, 57, S0434. [Google Scholar]
  49. Jing, F.; Singh, R.P.; Shen, X.H. Land–Atmosphere–Meteorological coupling associated with the 2015 Gorkha (M7.8) and Dolakha (M7.3) Nepal earthquakes. Geomat. Nat. Hazards Risk. 2019, 10, 1267–1284. [Google Scholar] [CrossRef]
  50. Qin, K.; Zheng, S.; Wu, L.; Wang, Y. Quasi-synchronous multi parameter anomalies before Wenchuan and Yushu earthquakes in China. Eur. Phys. J. Spec. Top. 2021, 230, 263–274. [Google Scholar] [CrossRef]
  51. Xiong, P.; Tong, L.; Zhang, K.; Shen, X.; Battiston, R.; Ouzounov, D.; Iuppa, R.; Crookes, D.; Long, C.; Zhou, H. Towards advancing the earthquake forecasting by machine learning of satellite data. Sci. Total Environ. 2021, 771, 145256. [Google Scholar] [CrossRef] [PubMed]
  52. He, M.; Wu, L.X.; Cui, J.; Wang, W.; Qi, Y.; Mao, W.F.; Miao, Z.L.; Chen, B.Y.; Shen, X.H. Remote sensing anomalies of multiple geospheres before the Wenchuan earthquake and its spatiotemporal correlations. J. Remote. Sens.(Chinese) 2020, 24, 681–700. [Google Scholar] [CrossRef]
  53. Pulinets, S.; Morozova, L.; Yudin, I. Synchronization of atmospheric indicators at the last stage of earthquake preparation cycle. Res. Geophys. 2014, 4, 45–50. [Google Scholar] [CrossRef]
  54. Yang, X.P.; Ran, Y.K.; Song, F.M.; Xu, X.W.; Cheng, J.W.; Min, W.; Han, Z.J.; Chen, L.C. The analysis for crust shortening of Kalpin Thrust Tectonic Zone, South-Western Tianshn, Xinjiang, China. Seismol. Geol. 2006, 29, 194–204. [Google Scholar]
  55. Cui, R.; Zhao, C.; Zhou, L. Seismicity feature and seismogenic fault of the M6.4 earthquake sequence on January 19, 2020 in Jiashi, Xin Jiang. Seismol. Geol. 2021, 43, 329–344. [Google Scholar]
  56. Xu, X.W.; Zhang, X.K.; Ran, Y.K.; Cui, X.F.; Ma, W.T.; Shen, J.; Yang, X.P.; Han, Z.J.; Song, F.M.; Zhang, L.F. The preliminary study on seismotectonics of the 2003 Ad Bachu-Jiashi earthquake(M6.8), southern Tianshan. Seismol. Geol. 2006, 28, 161–178. [Google Scholar]
  57. Xiong, X.; Barnet, C.; Maddy, E.; Sweeney, C.; Liu, X.P.; Zhou, L.H.; Goldberg, M. Characterization and validation of methane products from the Atmospheric Infrared Sounder (AIRS). J. Geophys. Res. Biogeosci. 2008, 113. [Google Scholar] [CrossRef]
  58. Xiong, X.; Barnet, C.; Wei, J.; Maddy, E. Information-based mid-upper tropospheric methane derived from Atmospheric Infrared Sounder(AIRS) and its validation. Atmos. Chem. Phys. Discuss. 2009, 9, 16331–16360. [Google Scholar]
  59. Xiong, X.; Houweling, S.; Wei, J.; Maddy, E.; Sun, F.; Barnet, C. Methane plume over south Asia during the monsoon season: Satellite observation and model simulation. Atmos. Chem. Phys. 2009, 9, 783–794. [Google Scholar] [CrossRef]
  60. Xiong, X.; Barnet, C.; Maddy, E.; Wei, J.; Liu, X.; Pagano, T. Seven years’ observation of mid-upper tropospheric methane from atmospheric infrared sounder. Remote Sens. 2010, 2, 2509–2530. [Google Scholar] [CrossRef]
  61. Xiong, X.; Barnet, C.; Zhuang, Q.; Machida, T.; Sweeney, C.; Patra, P. Mid-upper tropospheric methane in the high northern hemisphere: Spaceborne observations by AIRS, aircraft measurements, and model simulations. J. Geophys. Res. Atmos. 2013, 115. [Google Scholar] [CrossRef]
  62. Cui, Y.; Ouzounov, D.; Hatzopoulos, N.; Sun, K.; Zou, Z.; Du, J. Satellite observation of CH4 and CO anomalies associated with the Wenchuan Ms8.0 and Lushan Ms7.0 earthquakes in China. Chem. Geol. 2017, 469, 185–191. [Google Scholar] [CrossRef]
  63. Susskind, J.; Barnet, C.D.; Blaisdell, J.M. Retrieval of atmospheric and surface parameters from AIRS /AMSU /HSB data in the presence of clouds. IEEE Trans. Geosci. Remote Sens. 2003, 41, 390–409. [Google Scholar] [CrossRef]
  64. Won, Y.I. Readme document for AIRS Level-3 version 5 standard products: Daily (AIRH3STD, AIRX3STD, AIRS3STD) 8-days (AIRH3ST8, AIRX3ST8, AIRS3ST8) & monthly (AIRH3STM, AIRX3STM, AIRS3STM). Phys. Chem. Earth. 2008, 31, 138–142. [Google Scholar]
  65. Tramutoli, V. Robust AVHRR Techniques (RAT) for environmental monitoring: Theory and applications. Earth Surf. Remote Sens. II 1998, 3496, 101–113. [Google Scholar]
  66. Tramutoli, V. Robust Satellite Techniques (RST) for Natural and Environmental Hazards Monitoring and Mitigation: Theory and Applications. In Proceedings of the International Workshop on the Analysis of Multi-Temporal Remote Sensing Images, Leuven, Belgium, 18–20 July 2007; IEEE: Piscataway, NJ, USA, 2007; pp. 1–6. [Google Scholar]
  67. Tramutoli, V.; Cuomo, V.; Filizzola, C.; Pergola, N.; Pietrapertosa, C. Assessing the potential of thermal infrared satellite surveys for monitoring seismically active areas: The case of Kocaeli (İzmit) earthquake, August 17, 1999. Remote Sens Environ. 2005, 96, 409–426. [Google Scholar] [CrossRef]
  68. Genzano, N.; Filizzola, C.; Paciello, R.; Pergola, N.; Tramutoli, V. Robust Satellite Techniques (RST) for monitoring earthquake prone areas by satellite TIR observations: The case of 1999 ChiChi earthquake (Taiwan). J. Asian Earth Sci. 2015, 114, 289–298. [Google Scholar] [CrossRef]
  69. Eleftheriou, A.; Filizzola, C.; Genzano, N.; Lacava, T.; Lisi, M.; Paciello, R.; Pergola, N.; Vallianatos, F.; Tramutoli, V. Long-Term RST analysis of anomalous TIR sequences in relation with earthquakes occurred in Greece in the period 2004–2013. Pure Appl. Geophys. 2016, 173, 285–303. [Google Scholar] [CrossRef]
  70. Zhang, Y.; Meng, Q. A statistical analysis of TIR anomalies extracted by RSTs in relation to an earthquake in the Sichuan area using MODIS LST data. Nat. Hazards Earth Syst. Sci. 2019, 19, 535–549. [Google Scholar] [CrossRef]
Figure 1. The epicenter and aftershocks of the Jiashi earthquake, along with the regional tectonic landforms map (F1: Kepingtage fault; F2: Ozgel Itwu fault; F3: Maidan–Shayram fault; F4: Tataeltag fault; F5: Oyibulak fault).
Remotesensing 16 02175 g001
Figure 2. The spatial and temporal distribution of the monthly scale CH4 A l i c e . The red five-star is the epicenter of the earthquake.
Remotesensing 16 02175 g002
Figure 3. Spatial and temporal distribution of CH4  A l i c e on the 8-day time scale. The red five-star is the epicenter of the earthquake.
Remotesensing 16 02175 g003
Figure 4. Time series of CH4 A l i c e before and after the earthquake at the epicenter.
Remotesensing 16 02175 g004
Figure 5. Comparison of CH4 VMR in the study region for the same period in history.
Remotesensing 16 02175 g005
Figure 6. Eight-day 3D contour structures. The red five-star is the epicenter of the earthquake.
Remotesensing 16 02175 g006
Figure 7. Spatial and temporal distribution of CH4 A l i c e on the daily scale. The red five-star is the epicenter of the earthquake.
Remotesensing 16 02175 g007
Figure 8. Seismic year and non-seismic year monthly 3D contour structures ((a) seismic year; (b) non-seismic year). The red five-star is the epicenter of the earthquake.
Remotesensing 16 02175 g008aRemotesensing 16 02175 g008b
Figure 9. Comparison of the monthly mean value of CH4 A l i c e in a seismogenic year and non-seismogenic year in the study area.
Remotesensing 16 02175 g009
Figure 10. The 8-day 3D contour structures. The red five-star is the epicenter of the earthquake.
Remotesensing 16 02175 g010
Table 1. Catalogue of earthquakes in time periods corresponding to non-seismic years.
Date of EarthquakeEpicenterMagnitudeLongitude (°E)Latitude
(°N)
Depth
(km)
2015 November 18Kyrgyzstan6.073.0440.387
2015 December 7Tajikistan7.472.9038.2030
2015 December 7Kyrgyzstan5.274.8741.4715
2015 December 7Tajikistan5.473.4438.817
2016 January 14Luntai County, Bayin’guoleng Prefecture, Xinjiang5.384.1242.195
Disclaimer/Publisher’s Note: The statements, opinions and data contained in all publications are solely those of the individual author(s) and contributor(s) and not of MDPI and/or the editor(s). MDPI and/or the editor(s) disclaim responsibility for any injury to people or property resulting from any ideas, methods, instructions or products referred to in the content.

