Abstract
Rooftop solar photovoltaics can significantly contribute to global energy transitions by providing clean, decentralized energy without the need for new land, thereby avoiding land-use conflicts. It serves as a valuable complement to other renewable-energy sources and is expected to play a crucial role in future electricity systems. Due to the spatiotemporal variability in the solar radiation on roof surfaces, it is essential to determine the potentials of the rooftop photovoltaics and its variations in specific regions. In Germany, this potential was assessed in 5 km × 5 km zones, as well as at the federal-state and national levels. High-quality satellite and reanalysis data were used to determine the power output of the solar photovoltaics. Additionally, high-resolution (2 m × 2 m) European Settlement Map data, calibrated with solar cadastre data, were utilized to evaluate different scenarios. The results show that the potential is concentrated in larger urban areas and the southwestern part of Germany due to the availability of rooftop space and solar radiation. Overall, the national rooftop areas are substantial across all scenarios, ranging from 2100 to 4500 km2. The applied methods and scenarios provide a straightforward way to reveal the spatiotemporal variability and define realistic ranges of the solar photovoltaic potential without requiring detailed information about each building. However, assessing the rooftop photovoltaic potential remains challenging and uncertain due to the lack of large-scale, high-resolution data on building characteristics and the complexity of the solar radiation distribution in urban environments.
Keywords:
renewable energies; solar radiation; solar energy; PV; urban; European Settlement Map; Germany 1. Introduction
The increasing share of the world population living in cities (up to 68% in 2050), expansion of urban infrastructure, high energy demands (70% of the global energy consumption), and energy-related greenhouse gas emissions of urban environments pose major challenges and require sustainable concepts [1,2,3]. Within urban areas, space for installing large-scale energy facilities is limited [1]. Solar photovoltaics (PV) is the most promising sustainable energy technology in urban environments [4], satisfying the energy demand for buildings, solving environmental problems, and contributing to net-zero-energy buildings [2,4]. Facilities can be installed decentralized on residential and large-area commercial roofs, and owners can self-generate electricity [1,5]. Several studies show that the potentials of rooftop PV exceed the electricity consumption of residential buildings [1,6].
Substantial cost reduction and technological progress in the last decades have increased the attractiveness of solar PV systems [1,2,7,8]. Rooftop PV systems use unexploited rooftop areas and can be easily integrated into existing building structures without requiring additional land [2,9,10,11]. Besides the advantages of noise protection, weatherproofing, and thermal insulation [2,12], rooftop PV also lowers the grid requirements, network congestion issues, and transmission losses [2,9] by reducing the distance between the supply and demand [10]. Rooftop solar PV is critical for the decarbonization of residential areas and is a key part of current and future renewable-energy portfolios [13,14]. By reducing fossil fuel emissions, increasing grid resilience, and lowering energy burdens, energy justice is promoted [15]. A substantial capacity expansion is expected worldwide [14] and is already occurring [6].
The optimal, efficient, and sustainable use of rooftop PV requires an accurate assessment of the potential [2]. The rooftop PV potential (RTP) is typically described using a hierarchical approach, including mainly the meteorological potential, geographical potential, technical potential, and economic potential [4,5,11]. The meteorological potential quantifies the availability of the resources relevant to rooftop PV. Available and suitable rooftop areas and their characteristics are addressed by the geographical potential. The technical potential considers the efficiency and performance parameters of the solar modules to identify the electricity production, while the economic potential focuses mainly on costs [4]. In a previous study, a potential of 0.2 million km2 of rooftop area was estimated, providing 27.0 PWh yr−1 of electricity globally at costs between USD 40 and 280 MWh−1 [13], while another study quantified a suitable rooftop area of 0.04 million km2 and a potential of 8.3 PWh yr−1 [6]. Particularly larger buildings often provide better conditions and circumstances for installations due to their flat roofs, fewer or no chimneys, and better grid connections [16].
Accurate assessment of rooftop solar PV potential has gained in importance [8] but has been a long-standing challenge due to the lack of publicly available high-resolution building, radiation, and environmental data, the complex effects, and the uncertainties related to the existing processing methods [5,6,17,18]. The urban morphology and local climate characteristics substantially affect the solar potentials of building roofs [19].
The applied methods and datasets between different rooftop PV potential analyses vary greatly [15] and include remotely sensed imagery (light detection and ranging (LiDAR), satellite, orthophotos) [1,4,5,8,10,13,18,20,21,22,23,24,25,26,27,28,29], building, surface, and terrain models [1,10,18,23,27,29,30,31,32], statistical approaches (cluster analysis, statistical data) [1,4,6,11,14,28,33,34], geographic information system (GIS)-based approaches (sampling, geostatistics, modeling, hillshade analysis) [2,4,10,11,17,20,21,26,29,31,33,34,35,36], physical models [21,29], and artificial intelligence (AI) (machine learning, deep learning) [13,17,20,21,22,24,29,37].
Methods estimating the RTP are generally divided into bottom-up approaches, top-down approaches, or a mixture of both [13]. Bottom-up approaches establish a relationship between the building footprint data and socio-economic metrics for a small set and transfer the relationship to other areas across a wider scale, while top-down methods apply aerial imagery to determine the built-up areas and building footprints. There is further differentiation between low-, medium-, and high-level spatial resolution techniques [5,7,11], or between sample methods, multivariate sampling, and complete-census methods [5].
Low-level approaches consider larger areas and rely on aggregated statistical data that are assumed to be homogeneous throughout a study area [18]. Medium-level approaches combine statistical data with spatially resolved data [7]. In the high-level category, advanced methods for rooftop digitization, insolation calculations, and accounting for the aspects and shading of buildings are used [7]. High-level approaches are usually chosen for smaller study areas such as cities and assess the potential for individual buildings [18]. High-resolution spatiotemporal assessments of the RTP need to incorporate information on the geographical variability in the building characteristics, spatiotemporal variability in the solar insolation, and technology-specific information such as the panel size or efficiency [13]. Low-level, large-scale approaches often vary widely when compared with more in-depth approaches over the same regions [7].
As roofs are spatially heterogeneous, consisting of different tilts, azimuths, superstructures, and solar irradiation, the detail-specific identification of roof parts suitable for installing rooftop PV and the accurate quantification of these areas are crucial [30]. Furthermore, the shading effects need to be quantified adequately [21].
In most cases, studies combine several methods and datasets. Studies analyzing the potential at the national or global scale, particularly at high spatiotemporal resolutions, are scarce [13,29]. In Europe, studies assessing the RTP up to the national scale focus on, for instance, the countries of Spain [9], Sweden [36], Switzerland [20,21,29], and Germany [11,18].
The majority of the studies are carried out at the building, district, or city level [1,29] using detailed remote-sensing imagery techniques such as LiDAR or 3D city models to obtain building rooftop information, which are often costly, data-intensive, and time-consuming [1,22]. A recent study integrated data from Cesium 3D tiles, Copernicus Urban Atlas Building heights, and Google Earth in an advanced Ray-Tracing-based modeling approach for the city of Athens to determine the exploitable rooftop areas and their RTPs [38]. Three-dimensional building data from Google Earth Pro were also used in a study [39] for enhancing the accuracy of building height models in the city of Bandung, Indonesia.
These and other 3D building model datasets are generally available for larger areas, but detailed 3D building models might be confidential due to policy or security issues, unavailable in some regions, or difficult to use due to a lack of budget, the considerable amounts of data, and the high computational effort [40]. So far, studies applying 3D models to the national or global scales are lacking. Current methods, including cloud computing, however, provide processing speed improvements [38], enhancing future assessments.
Significant effort is usually dedicated to estimating the existing and available roof areas for PV installations at the regional or national scales [21]. To address these on a large-scale basis, open-source satellite images, geographical building data, and deep learning provide valuable alternatives with low costs, high speeds, and intuitive results [4,22]. Statistical approaches try to predict the available rooftop areas based on building and population data, such as the number of buildings, building heights, or population density [7,34].
To assess the meteorological potential, mostly monthly or annual solar radiation data are used [29]. However, accurate input data at a high temporal resolution are crucial to assessing the seasonal and diurnal variation in the potential generation [29]. While rooftop PV estimations based on annual data can lead to overestimations of the self-consumption estimations, hourly resolution data offer more precise insights that are crucial for accurate forecasting and planning [41].
To achieve climate neutrality in 2035, Germany plans to increase its installed solar PV capacity to 215 GW by 2030. From 2026, half of the annually added solar PV capacities (11 GW) will be installed on rooftops and building surfaces [42].
This study presents a novel approach investigating the spatiotemporal variability in the German RTP at the grid-cell, federal-state, and national levels. It utilizes a medium-level approach that combines remote-sensing, reanalysis, and statistical data. The assessment of the meteorological potential incorporates hourly satellite solar radiation and reanalysis air temperature data to model the solar PV module power output. As the use of the German 3D building model presented in [18] is restricted to federal and state authorities, an open-source satellite dataset mapping urban areas is calibrated with a detailed, more precise, open-source solar cadastre covering a federal state of the study area. The properties of the roofs included in the cadastre are applied to the whole study area assuming homogeneity. This unique method allows us to assess the available rooftop area and statistically calculate the modification of the large-scale solar radiation input within urban environments. This study also employs a scenario-based approach to estimate the uncertainty, aiming to provide a plausible range of the maximum meteorological–geographical–technical potentials at different spatial scales based on a modern solar PV module type, and to help decision-makers to identify suitable regions. In Section 2, an overview of the methods used, including the study area (Section 2.1), data (Section 2.2 and Section 2.3), estimation of the rooftop area (Section 2.4), and calculation and evaluation of the RTP (Section 2.5 and Section 2.6), is provided. Section 3 contains the assessment of the rooftop areas (Section 3.1) and the spatial (Section 3.2) and temporal (Section 3.3) variabilities in the RTP. They are critically discussed regarding the limitations and results from other studies in Section 4. Section 5 summarizes the main outcomes and their implications.
2. Materials and Methods
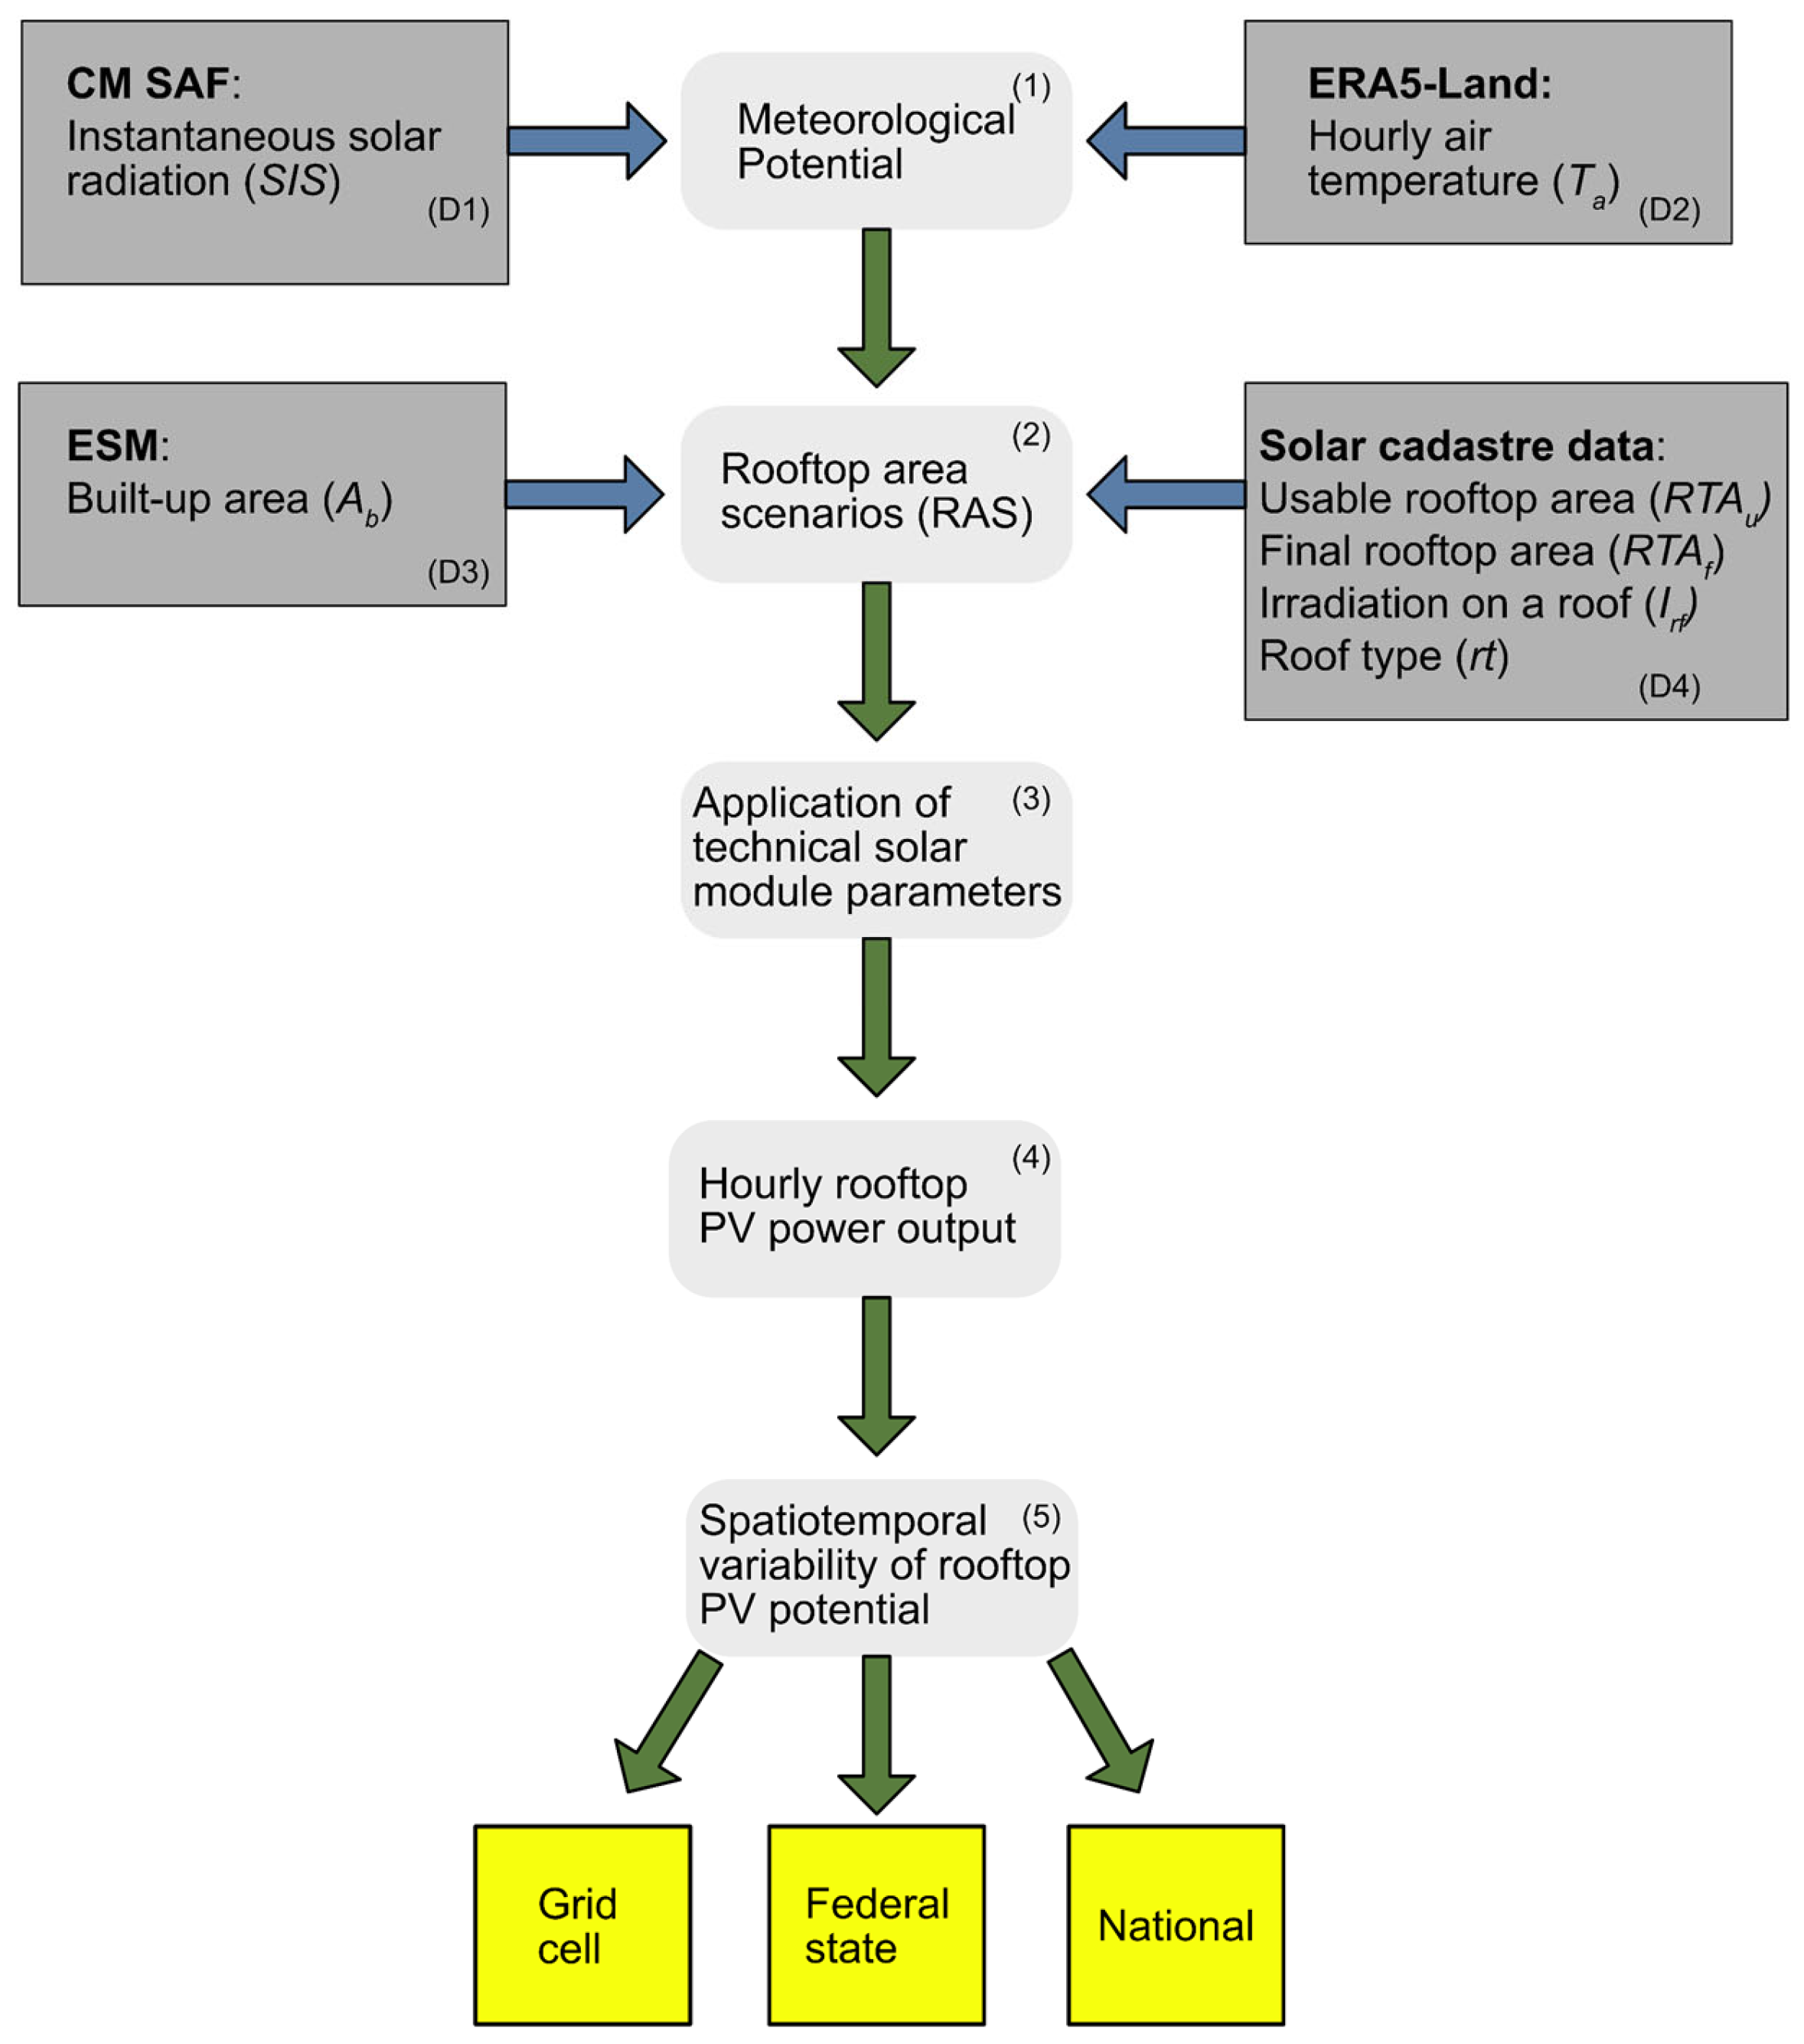
The methods to assess the spatiotemporal variability in the RTP in the study area comprise the following main steps (Figure 1): (1) the pre-processing of instantaneous solar radiation (SIS) data (dataset 1 (D1)) from the Satellite Application Facility on Climate Monitoring (CM SAF) [43,44] and the hourly near-surface air temperature (Ta) from the land component of the fifth-generation European Centre for Medium-Range Weather Forecasts (ECMWF) atmospheric reanalysis (ERA5-Land) (D2) [45] to assess the meteorological potential; (2) the estimation of the available rooftop area in the rooftop area scenarios (RASs) based on the built-up area (Ab) from the European Settlement Map (ESM) [46] (D3), the usable and final rooftop areas (RTAu, RTAf), the roof types (rt), and the irradiation of a roof (Irf) obtained from solar cadastre data [47] (D4) from a federal state in the study area; (3) the application of the solar PV module efficiency and performance parameters; (4) the modeling of the hourly rooftop solar PV power output in 5 km × 5 km grid cells; (5) the analysis and visualization of the spatiotemporal variability in the rooftop PV potential at the grid-cell, federal-state, and national levels.
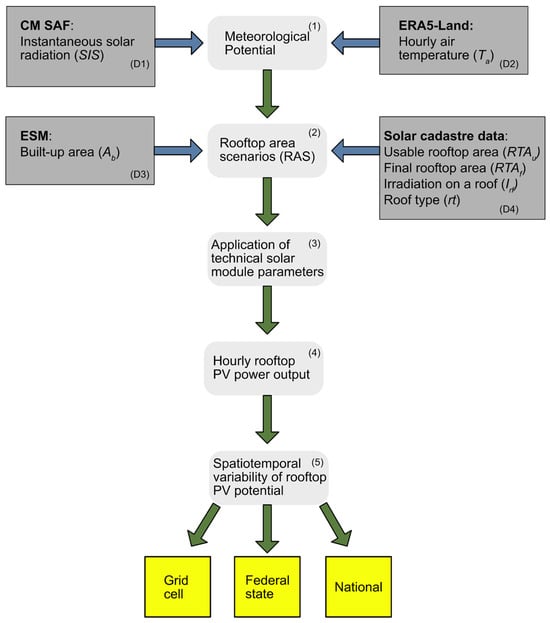
Figure 1.
Methods and datasets applied to assess the photovoltaic (PV) potential of rooftops in the study area.
The datasets from the CM SAF, ERA5-Land, and ESM that serve as the inputs (blue arrows) are widely used in the literature. The solar cadastre is provided by a federal-state authority in Germany. Steps (1), (2), and (3)–(4) refer to the meteorological, geographical, and technical potentials, respectively, which are aggregated in step (5) and evaluated at different temporal scales (yellow boxes). All analysis steps were performed using the softwares MATLAB R2024a (The Mathworks Inc., Natick, Massachusetts, USA), ArcGIS 10.8.1 (Esri, Redlands, California, USA), and QGIS 3.34.5 (QGIS Development Team).
2.1. Study Area
The study was conducted in Germany, which has a national territory of about 357,592 km2 [48]. Germany has nine neighboring countries and verges on the North Sea and Baltic Sea (Figure 2). It consists of 16 federal states, of which three are city-states. Four of the ten most populated cities are concentrated in the federal state of North Rhine-Westphalia, which has the highest population density after the three city-states.
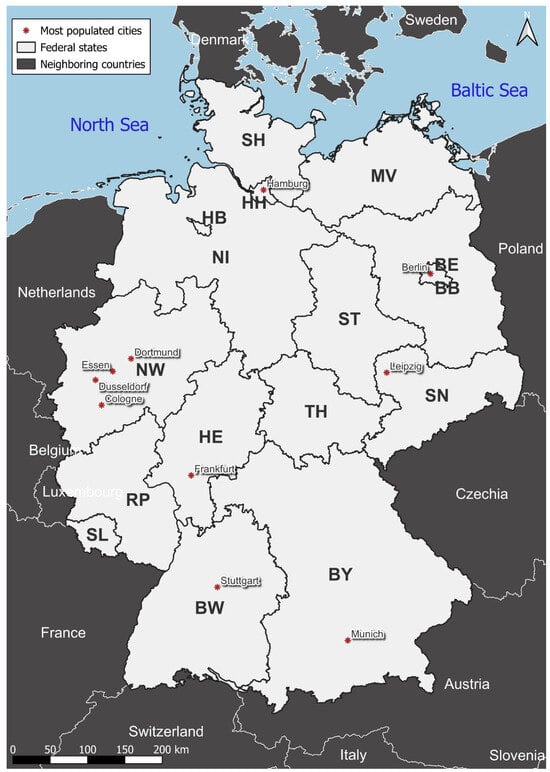
Figure 2.
Study area containing the land area of 16 federal states and the 10 most populated cities. Germany is highlighted in light gray, while neighboring countries are displayed in dark gray. The abbreviations of the federal states are explained in Table 1.
The northeastern federal states of Mecklenburg-Western Pomerania and Brandenburg exhibit the lowest population densities (Table 1). The area share of usable flat roofs (Sflt,u) per federal state, calculated based on [49], is later used as a correction factor for the rooftop area (RTA).

Table 1.
Abbreviations, full names, areas (2021), populations (Pop.) (2021), population densities (Pop. Dens) (2021), and area shares of usable flat roofs (Sflt,u) of the 16 federal states in Germany [48,49].
2.2. Solar Radiation and Air Temperature Data
Instantaneous values (half-hourly resolution) of the SIS were obtained from the Surface Solar Radiation Data Set—Heliosat (SARAH ed. 2.1) (2010–2017) [43] and Interim Climate Data Record (ICDR) Spinning Enhanced Visible and InfraRed Imager (SEVIRI) Radiation, based on SARAH-2 (2018–2021) [44] provided by the CM SAF. Both datasets use observations from instruments onboard METEOSAT satellites [50] and are available in a spatial resolution of 0.05° × 0.05°. Hourly values of the SIS were calculated as the mean of two half-hourly values, ignoring missing values, and the raster files were reprojected to the coordinate reference system EPSG:25832 and resampled to a spatial resolution of 5 km × 5 km by using bilinear resampling methods.
The Ta data with a spatial resolution of 0.1° × 0.1° for the period 2010–2021 were derived from the global reanalysis dataset ERA5-Land provided by the ECMWF [45]. Due to the initial lower spatial resolution, the raster files for the Ta were reprojected and resampled to a 10 km × 10 km cell size so that one Ta grid cell covers an area of four grid cells of the SIS. The Ta is used as a correction factor for estimating the solar PV power output.
The mean spatial distributions of both variables in the study area are illustrated in Figure 3. The SIS exhibits a gradient with values decreasing from the south to the north, modified by mountain regions in the southern part of the study area. The mean Ta is the lowest in the mountain regions and the highest in the southwest and north at low altitudes.
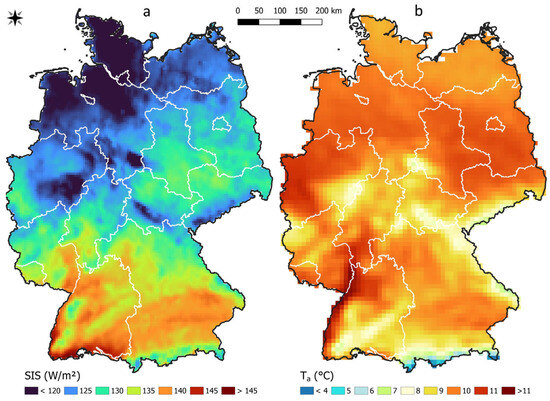
Figure 3.
Mean (a) solar radiation (SIS) (W m−2) and (b) air temperature (Ta) (°C) in the period 2010–2021 in the study area.
2.3. Built-Up Area Data
The ESM dataset is a high-resolution spatial raster dataset that maps human settlements in Europe based on satellite imagery and Global Human Settlement Layer (GHSL) technology [5], categorizing European land surfaces into land, water, and built-up area [46]. It is divided into different raster tiles, each representing an area of 10,000 km2 (100 km × 100 km), and it consists of 50,000 × 50,000 grid cells with a size of 2 m × 2 m. The small grid cells are resampled to the resolution of 5 km × 5 km, matching the solar data by summing up the number of grid cells containing the values representing the built-up area. Multiplied by 4, the values indicate the built-up area in square meters per 5 km × 5 km grid cell.
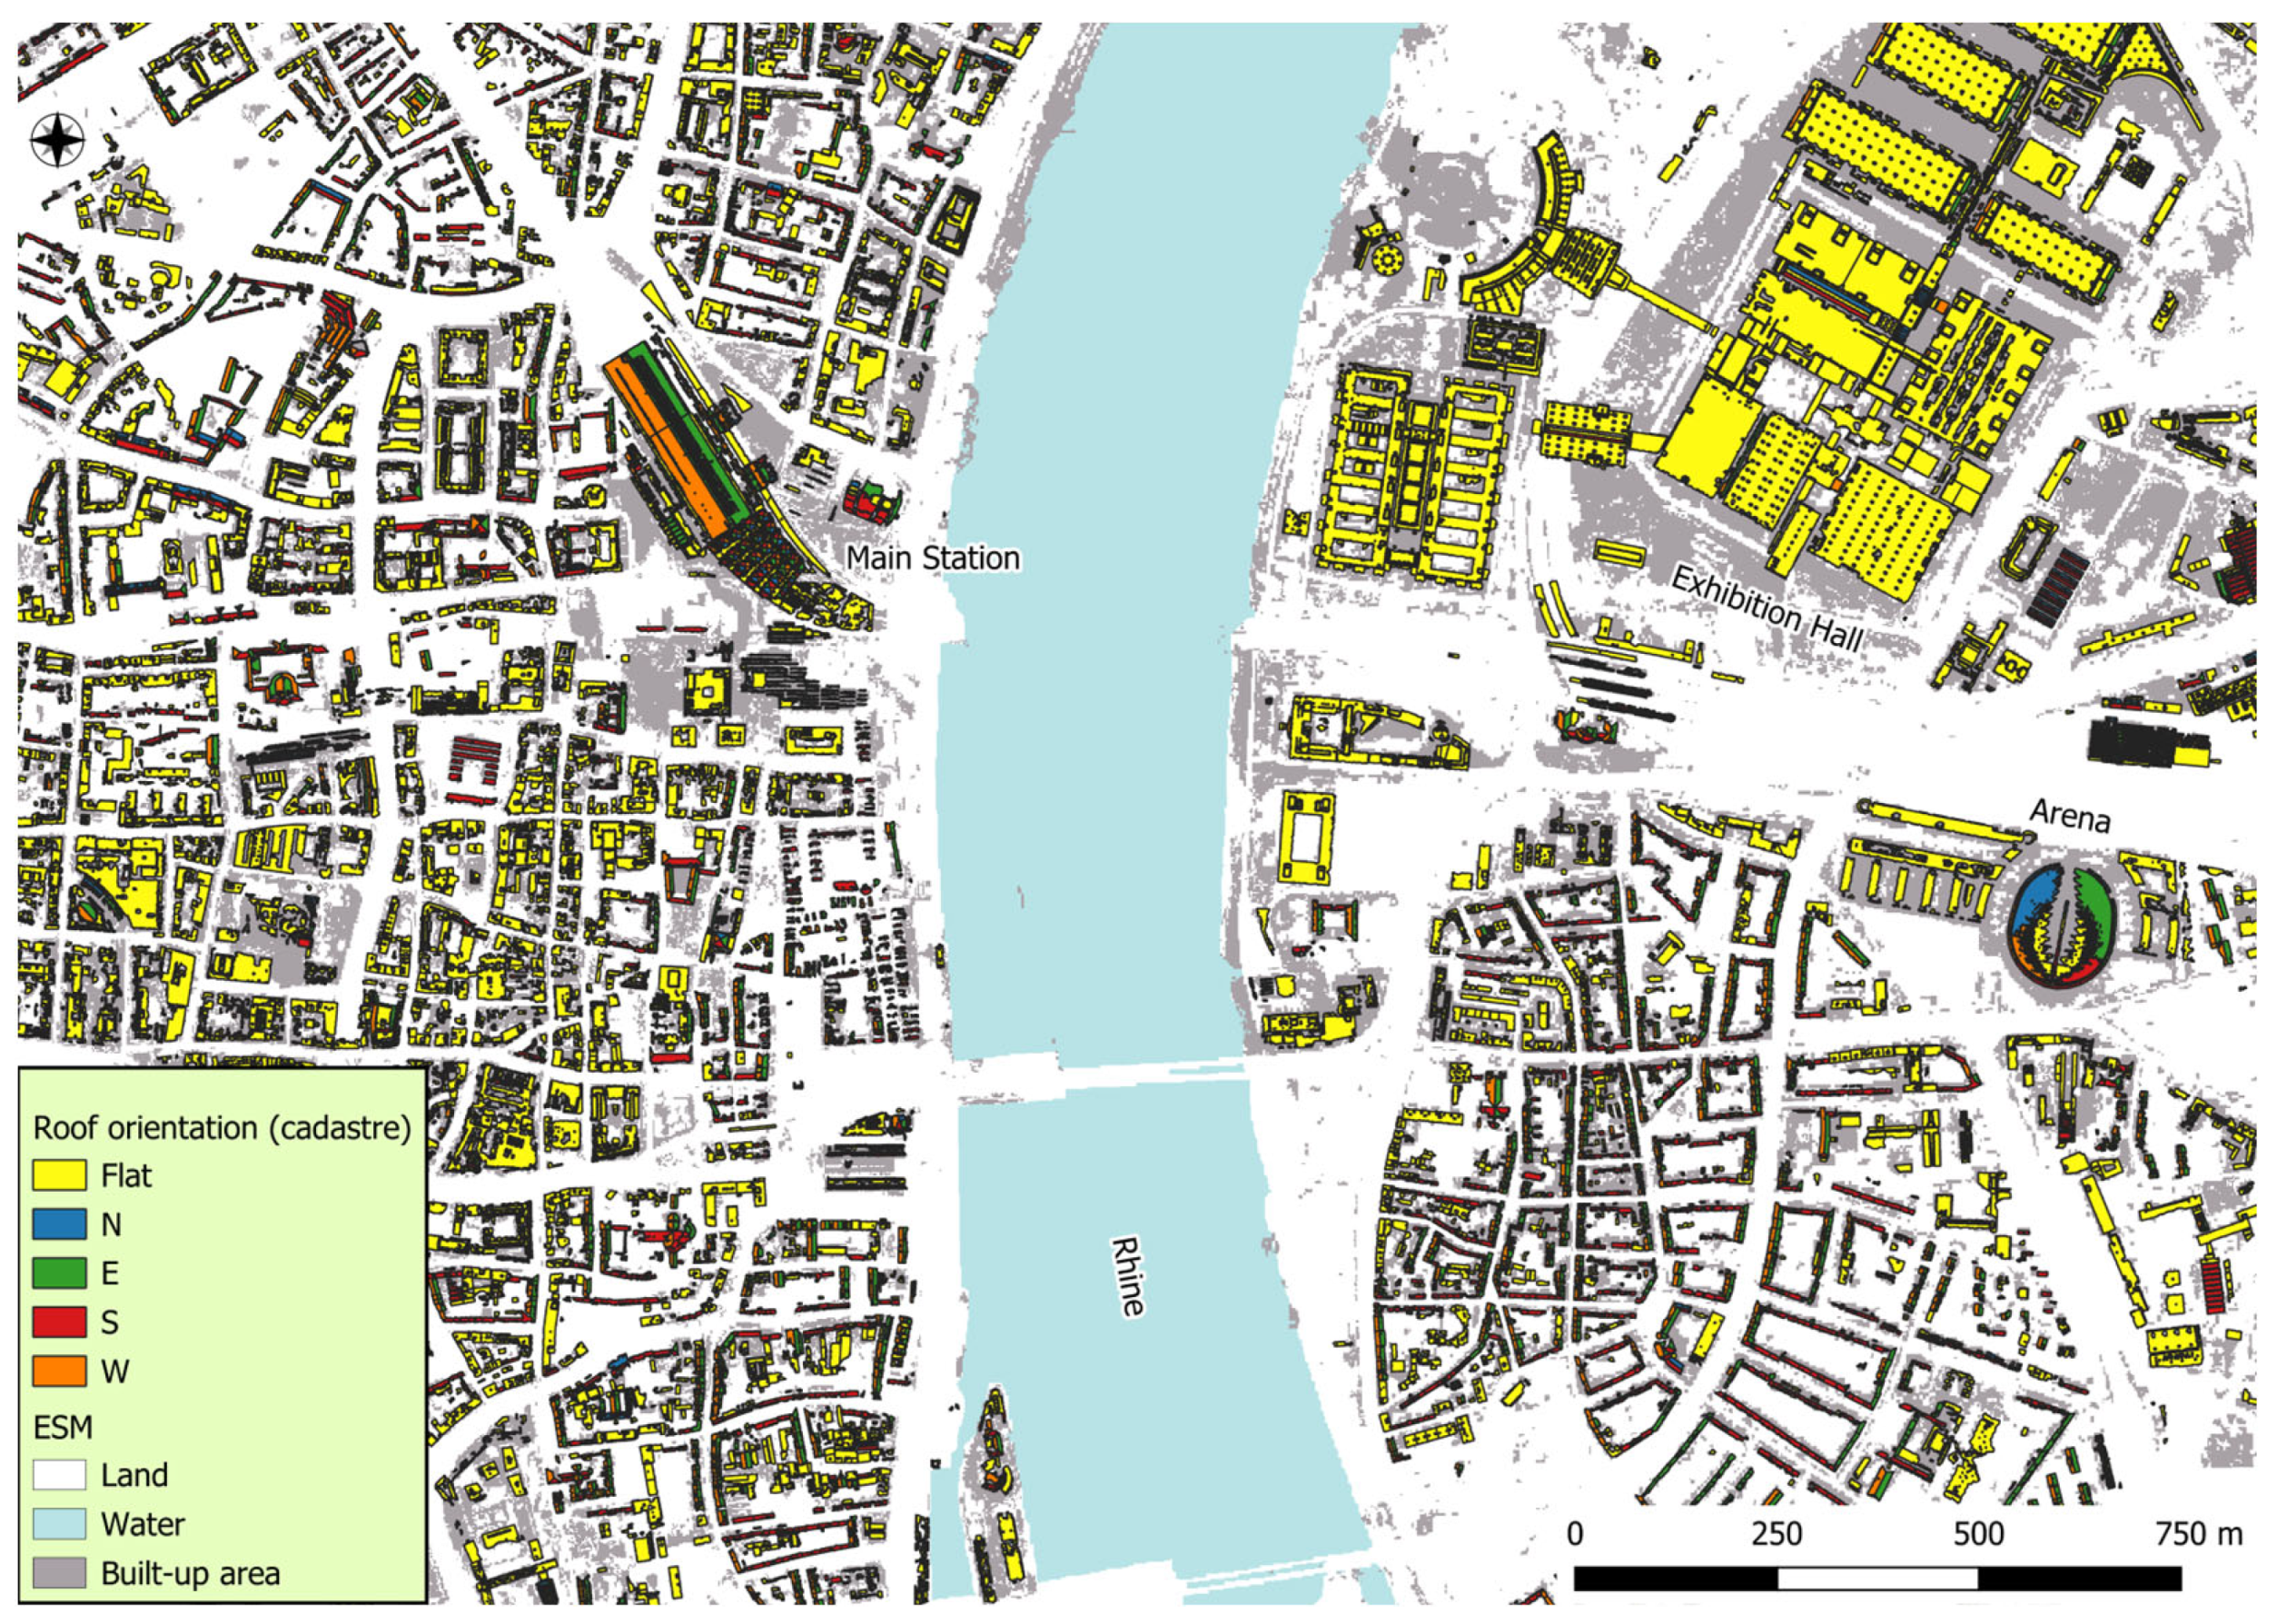
For calibrating the ESM data and estimating the rooftop area, detailed and informative rooftop solar cadastral data from the federal state of North Rhine-Westphalia are used [47]. The dataset provides building-specific information about the RTAu for solar PV installations for all cities in this federal state, including information on the roof slope and orientation. Figure 4 shows an excerpt of Cologne and emphasizes the necessity of calibrating the ESM data with the solar cadastre, as the ESM overestimates the rooftop area and does not provide information on the roof characteristics.
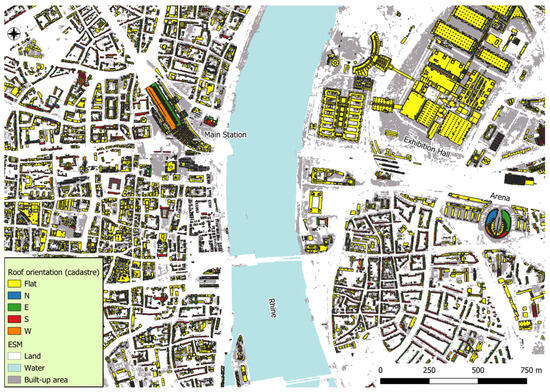
Figure 4.
Comparison of European Settlement Map (ESM) [46] estimated built-up area data and roof features and their orientations from the solar cadastre [47] data in the city of Cologne.
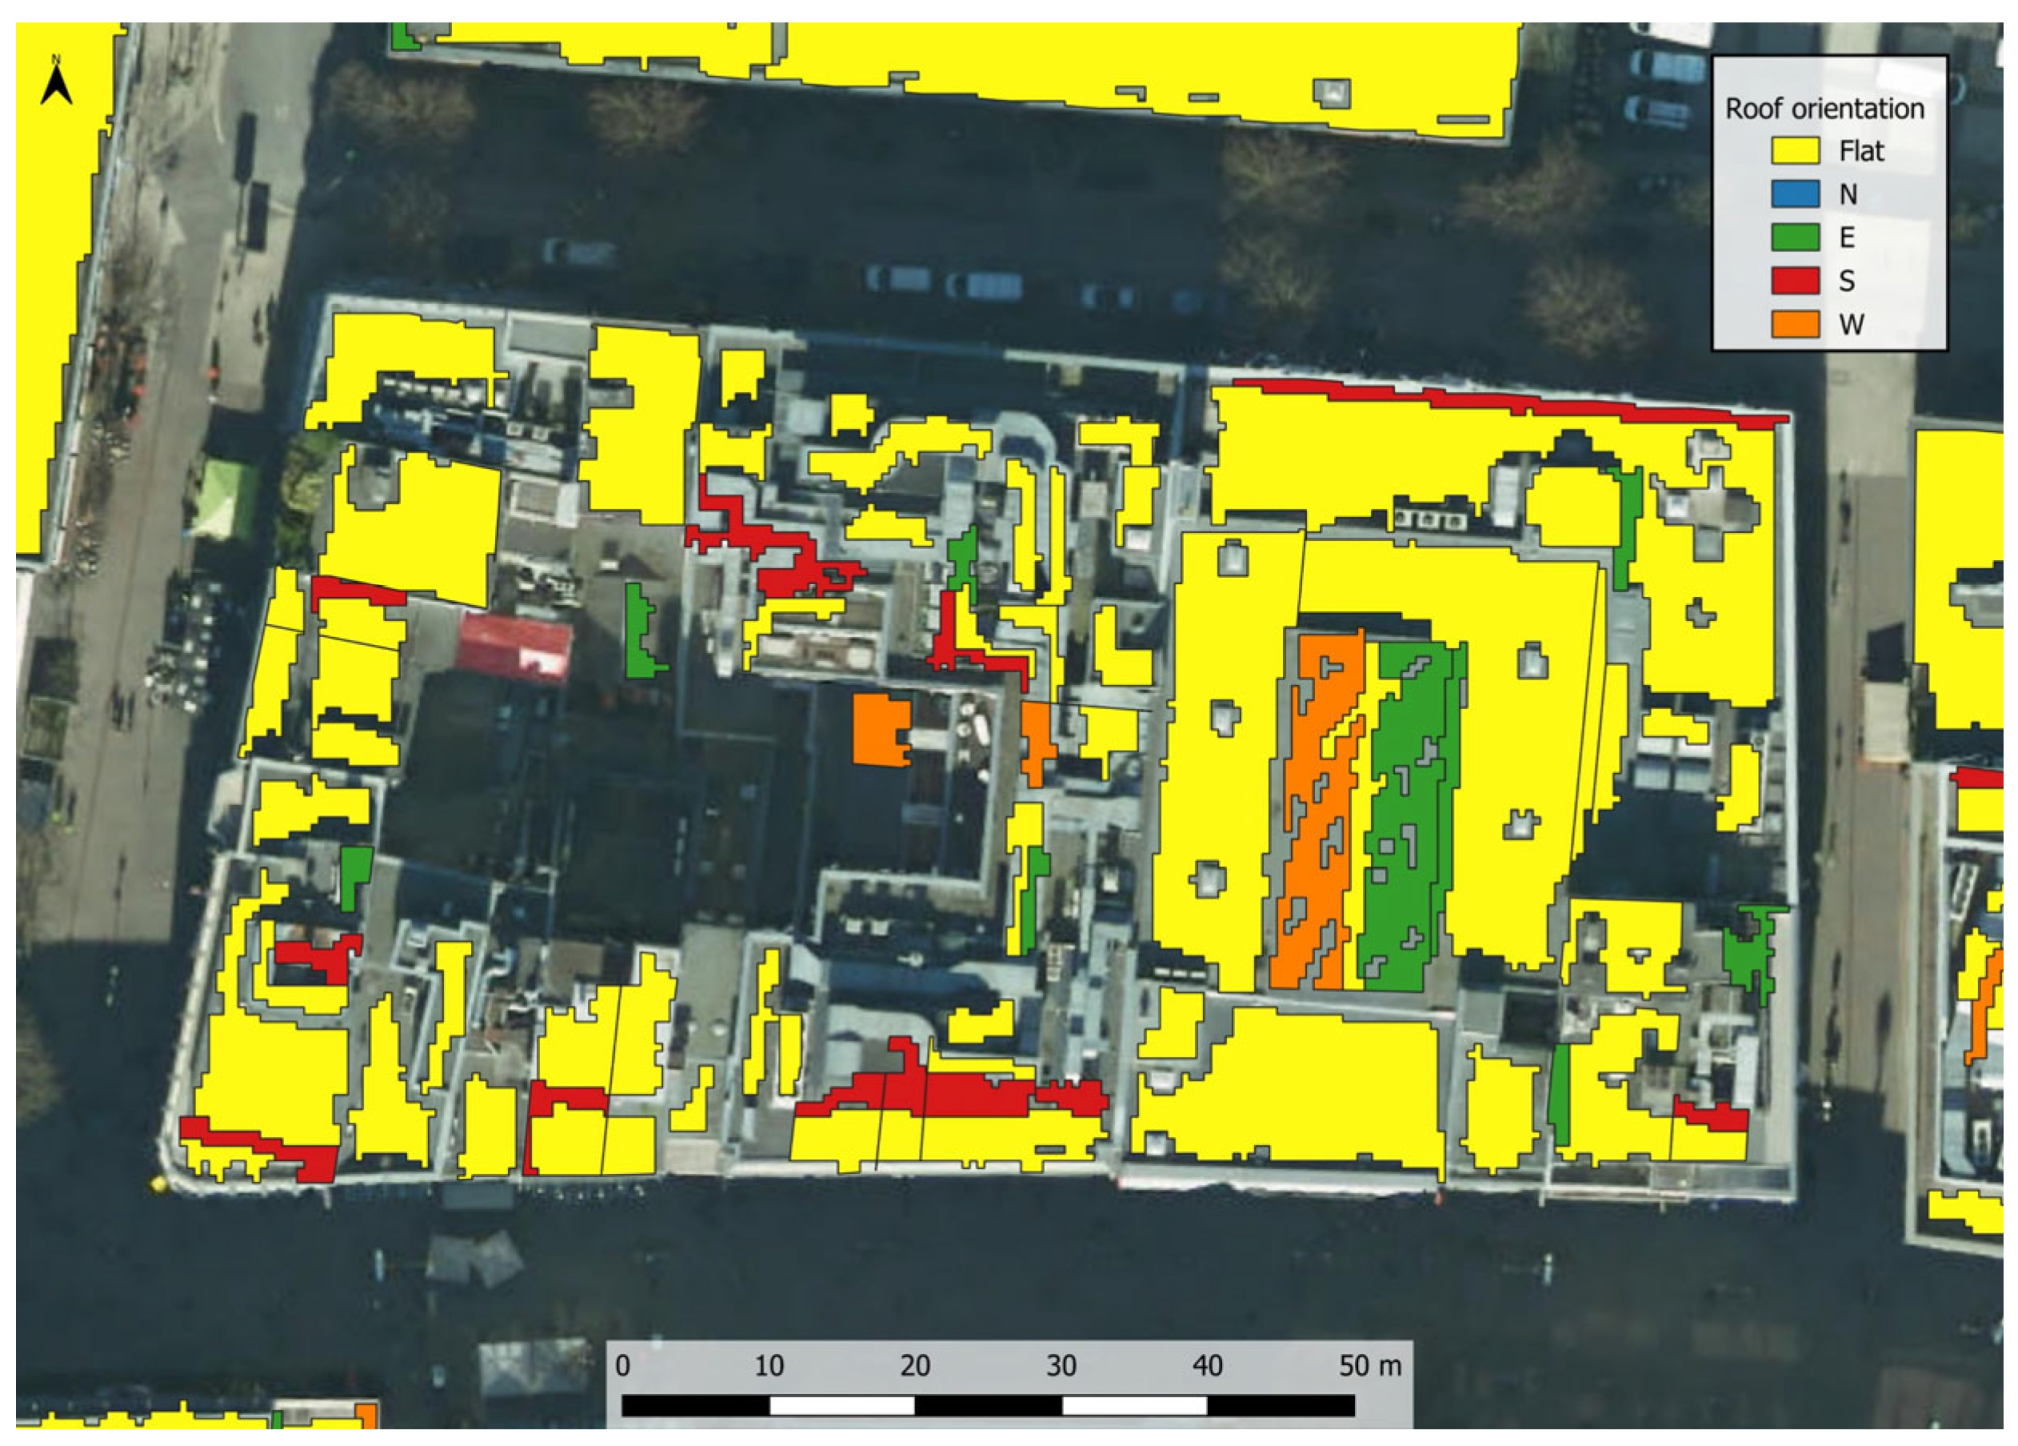
The solar cadastre was created based on high-resolution laser-scan data from the federal state of North Rhine-Westphalia [47]. These were used to generate a digital surface model at a resolution of 0.5 m × 0.5 m. By intersecting these data with a map of all the building outlines, all the roof areas could be determined. By breaking down the roof surfaces into homogeneous sub-areas, small roof elements such as chimneys could be identified and excluded (Figure 5). The dataset therefore only quantifies roof areas where PV installation is technically possible, expressed by the RTAu.
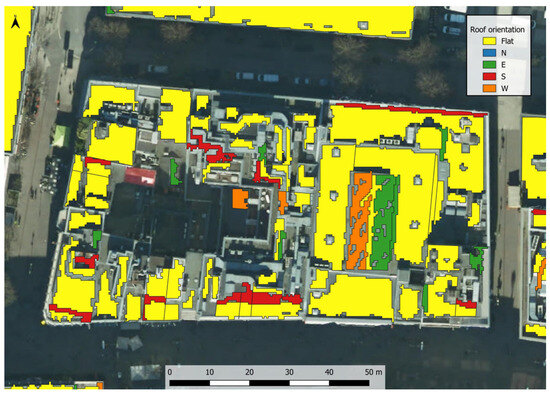
Figure 5.
Visualization of roof sub-areas and their orientations identified by the solar cadastre data compared to a satellite image (ESRI Satellite).
2.4. Estimation of Rooftop Area and Radiation Modification
The built-up area, as classified by the ESM data, does not contain only the RTAu, as shown previously. The Ab needs to be gradually reduced to the total RTA, RTAu [34] and, finally, to the net module area RTAf capable of absorbing and converting solar radiation. The ratio from the RTA to the RTAu is often implemented by utilization factors, which differ among building types and consider roof structures and features, inter-row spacing, maintenance, and the shading impact [11,17,51]. Ref. [51] determined the utilization factors for different commercial building types and found substantial variations from 0.23 (hotels) to 0.53 (shopping malls) (a mean of 0.49). Studies investigating large-scale areas of interest often use sampled rooftop utilization factors and apply them to larger areas [8]. As the total RTA is not available from the ESM or the solar cadastre, the ratio of the Ab to the RTAu is used for calibration. The ratio from the RTAu to the RTAf is described by packing factors in the literature, as performed by the authors of [14], who set the value to 0.56.
The ESM tends to overestimate rooftop areas by a factor of 2–5 [5] and requires calibration with reliable rooftop area data [28]. Due to the lack of these data throughout the study area, a sample from North Rhine-Westphalia was investigated and used for the calibration, assuming that statistics from this federal state are transferable to the whole of Germany.
The 20 most populated cities in North Rhine-Westphalia (C1–C20) were used to investigate the roof characteristics and areas [47]. As the cadastre data does not contain all the roof areas but only those usable for rooftop PV, the ratios of the RTAu (cadastre) to the ESM built-up area were determined and implemented as calibration factors (fca) (Table 2). The ratio varies between 24% and 51%, indicating that the ESM overestimates the RTAu by a factor of 2.0–4.2. Accordingly, three RASs representing the lower boundary (24%), mean (34%), and upper boundary (51%) of the fca are used to calculate the RTAu. Each grid-cell-specific Ab from the ESM is multiplied by the fca:
RTAu = Ab × fca
Table 2.
Usable rooftop area (RTAu) from the solar cadastre, calibration factor (fca) (%), final rooftop area (RTAf), area share of usable flat roofs (Sf,u), area correction factor for flat roofs (cfa,flt) and slanted roofs (cfa,slt), and mean radiation correction factor (cfrad) for each of the 20 most populated cities (C1–C20) in North Rhine-Westphalia.
The scenarios (RASs) assume that the usable rooftop area is between 24% and 51% of the built-up area classified by the ESM. It is assumed that this value range is consistent throughout the whole study area.
Based on the solar cadastre dataset from North Rhine-Westphalia [47], roofs were further categorized as types according to their combination of orientation and slope. For all 20 cities investigated, the relative area share of each rt was determined. The total area correction factor (cfa) describes the reduction from the RTAu to the RTAf and is determined based on the empirical mean of the determined areas’ correction factors for flat roofs (cfa,flt) and slanted roofs (cfa,slt) from C1–C20:
cfa = Sflt,u × cfa,flt + (1 − Sflt,u) × cfa,slt
The federal-state-specific cfa values were determined, assuming 0.65 for cfa,flt and 0.93 for cfa,slt, and including federal-state-specific Sflt,u, as presented in Table 1. Based on the solar cadastre, it is assumed that, on flat roofs, PV modules are mounted towards the south and not horizontally.
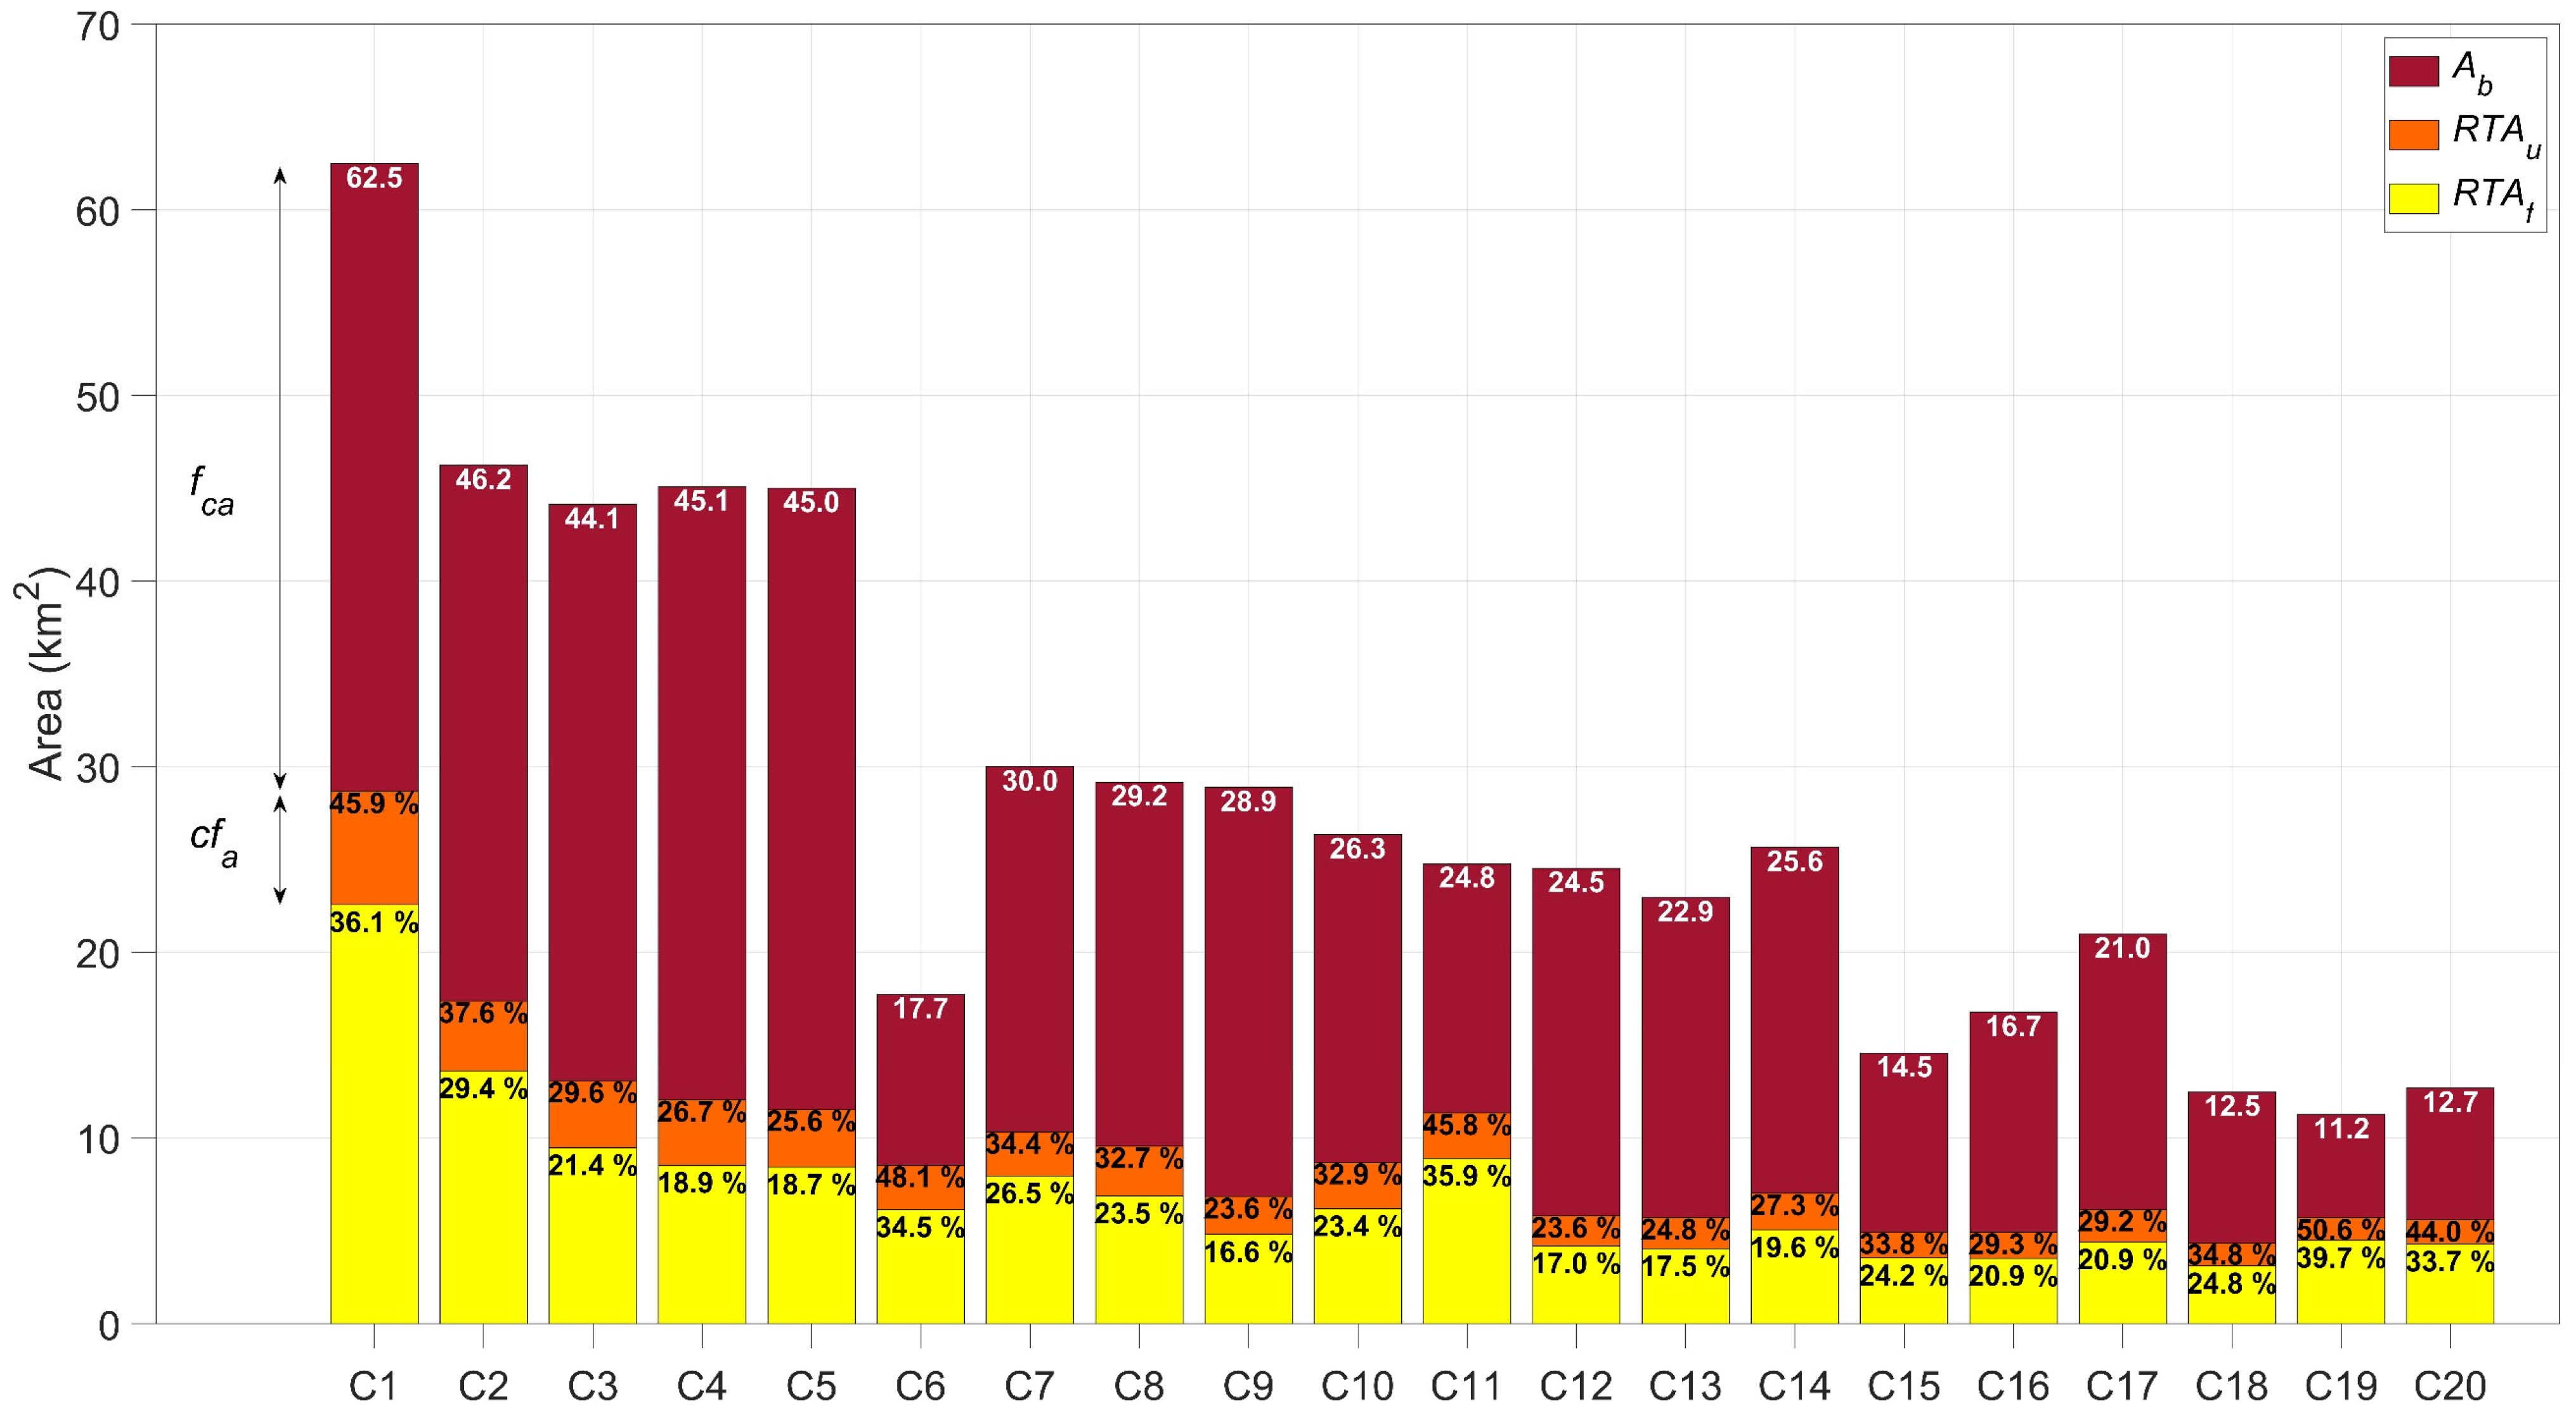
Figure 6 illustrates the step-wise reductions from the Ab to the RTAu forming the basis for the fca and from the RTAu to the RTAf described by the cfa values for the C1–C20 used for the calibration. Calculated over all the cities, the fca is 33.5% and the cfa is 74.4%, so that, in the end, 24.9% of the Ab remains as the net module area.

Figure 6.
Built-up areas (Ab), usable rooftop areas (RTAu), and final rooftop areas (RTAf) of 20 cities (C1–C20) in North Rhine-Westphalia based on the European Settlement Map and solar cadastre data. The white values in the bars represent the Ab in square kilometers, while the black values indicate the proportions of the Ab covered by the RTAu (orange bar) and RTAf (yellow bar). These values are used to determine the calibration factor (fca) and the area correction factor (cfa).
The cadastre data also include information about the irradiation on each roof object. These values are used to calculate the relative deviations of the Irf for each rt from the SIS. As the solar cadastre assumes for flat roofs that modules are optimally inclined towards the south, their mean Irf is set to 118% [11] relative to the horizontally oriented modules (corresponding to the SIS). The reference (100%) is determined based on the maximum. By multiplying the area share of each roof type () with the mean relative change in the Irf compared to the reference of each roof type (), and by summing up this product for all the roof types, a mean radiation correction factor for each city (cfrad) is calculated, which describes the relative change in the SIS in a grid cell with the built-up area due to the different roof types:
The cfrad values are very similar for all the cities (1.05–1.10), and the mean of 1.07 applies to the RTP calculations across the whole study area of Germany. It is therefore assumed that the cfrad is consistent throughout the study area.
2.5. Calculation of Hourly Solar PV Power Output
The hourly rooftop solar PV power output (in megawatt hours), representing the rooftop PV potential of each 5 km × 5 km grid cell (RTPi), is determined as follows:
where SISi is the hourly solar radiation per grid cell (i) (in watts per square meter), and Tcell,i is the grid-cell-specific PV module temperature (in degrees Celsius). The electrical efficiency under standard testing conditions (), the temperature coefficient (, the reference temperature (Tref), and the performance ratio (PR) were constants with values of 0.23, −0.0029 °C−1, 25 °C, and 0.8. The first three parameters were obtained from the product specifications of a modern rooftop solar PV module type from Longi [52], the largest PV manufacturer globally [14], while the latter was provided by the literature [53] and accounts for factors like wiring losses, shading, or the soiling of the module [4].
The Tcell,i is obtained based on the following:
where Ta,i is the mean hourly air temperature per grid cell (i) and c1, c2, and c3 are the constants with values of −3.75 °C, 1.14, and 0.0175 °C m2 W−1 [54]. This approach considers the solar module parameters of modern facilities, temperature-induced changes in the PV panel efficiency, and different disturbances reducing the energy output [54], as well as radiation and area modifications due to the different roof types and characteristics.
Tcell,i = c1 + c2 × Ta,i + c3 × SISi
2.6. Aggregation and Normalization of Rooftop Potential and Spatiotemporal Variability
The RTPi values were aggregated at the federal-state level and normalized per rooftop area (GWh km−2), per federal-state area (GWh km−2), and per capita (MWh cap−1). Due to the lower spatial resolution of the Ta data and the limitation of ERA5-Land to onshore areas, the solar PV output could not be calculated for a few grid cells on the coastlines of Lower Saxony, Schleswig-Holstein, and Mecklenburg Western-Pomerania. These areas were excluded from the overall RTP, RTA, federal-state area, and population size (for the normalization). Furthermore, ESM data are missing for some parts of the study area, mainly for Bavaria and Baden-Württemberg, which were also considered in the adjusted federal-state area and population size. Hence, the RTA might be slightly underestimated for some federal states. For the other states, the territorial areas and population sizes provided in Table 1 were used.
For the intra-annual variability of the study area, the German monthly sums of the energy yield were calculated for each month. To investigate the inter-annual variability per grid cell (i), coefficients of variation (COVi) were calculated based on the period mean of the SIS (SISperiod,i) (determined with annual means) and the associated standard deviation (SISstd,i) [50]:
COVi = (SISstd,i/SISperiod,i) × 100
3. Results
3.1. Rooftop Area
North Rhine-Westphalia, the federal state with the largest population (17.92 million), and Bavaria, the federal state with the largest area (70,542 km2), exhibit the overall largest RTAf values for solar PV installations (Table 3). The RTAf varies, depending on the scenario, between 386 and 821 km2 for North Rhine-Westphalia, and it ranges from 387 to 822 km2 in Bavaria. The two city-states of Bremen (from 8 to 18 km2) and Hamburg (from 22 to 47 km2), followed by Saarland (from 32 to 68 km2), have the smallest available RTAs in all three scenarios. Overall, Germany’s estimated RTAf amounts to 2113 km2 in the first, 2994 km2 in the second, and 4491 km2 in the third most optimistic scenarios, representing a range from 0.5 to 1.3% of the national territory.
Table 3.
Suitable rooftop areas (net module areas) (RTAf) (km2) for solar PV module installations in rooftop area scenarios 1–3 (from RAS1 to RAS3).
3.2. Spatial Variability in Solar Photovoltaic Rooftop Potential
The mean annual RTP exhibits pronounced spatial variability in Germany (Figure 7). The potential is very low in large parts of the study area, indicated by an annual energy yield (AEY) < 25 GWh yr−1 per 5 km × 5 km grid cell in RAS2. The regions with low RTPs are found mainly in northeastern Germany, while high rooftop potentials predominantly arise in southern and western Germany. The highest potential is close to the 24 cities highlighted in Figure 7. Bavaria (129.6 TWh yr−1) and North Rhine-Westphalia (119.4 TWh yr−1) show the most substantial potentials at the federal-state level, accounting for about 37% of the German RTP. The two city-states of Bremen (2.5 TWh yr−1) and Hamburg (6.5 TWh yr−1) contain the lowest potentials, followed by Mecklenburg-Western Pomerania (10.5 TWh yr−1). When comparing the ranking of the federal states based on the RTAf values with the ranking based on the RTP values, it is shown that most federal states (9) do not change their ranking position, Saarland (+2), Bavaria (+1), Saxony-Anhalt (+1), and Thuringia (+1) increase in the ranking, and North Rhine-Westphalia (−1), Schleswig-Holstein (−2), and Mecklenburg-Western Pomerania (−2) decrease in the ranking. The other scenarios (RAS1 and RAS3) do not differ from RAS2 in the distribution of the potential but only in the absolute values of each grid cell.
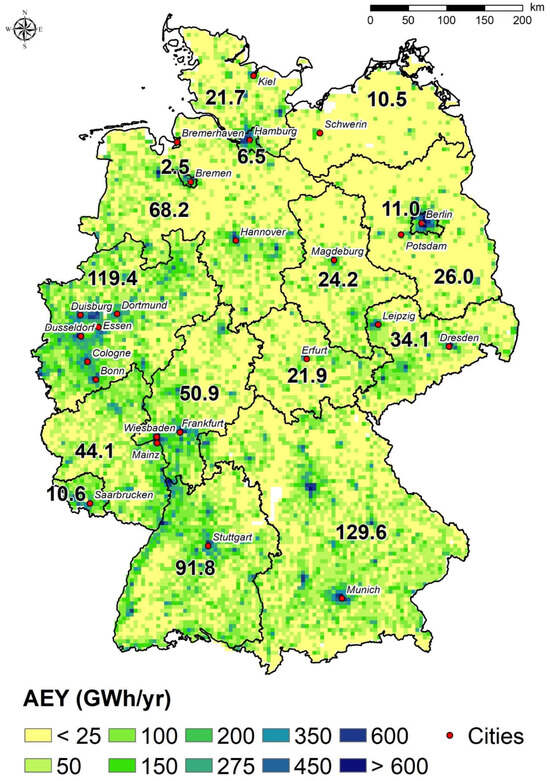
Figure 7.
Mean annual rooftop solar photovoltaic potentials in Germany based on rooftop area scenario (RAS) 2. The bold values on the map illustrate the cumulative annual energy yields (AEYs) at the federal-state level (in TWh yr−1). White areas within the boundaries of the study area represent regions where the rooftop potential could not be calculated due to the lack of data.
Table 4 summarizes the results from the other RASs at the federal-state level. Overall, the mean annual German RTP ranges from 475 to 1009 TWh yr−1, assuming modern solar modules are installed and used on all suitable rooftops. A total of 51% of the potential is concentrated in three federal states (Bavaria, North Rhine-Westphalia, and Baden-Württemberg).
Table 4.
Mean annual rooftop solar PV potentials (TWh yr−1) in rooftop area scenarios RAS1–RAS3 at the federal-state and national levels.
Dividing the RTP by the RTAf provides information on the availability of the SIS in the different federal states. Figure 8a indicates that the federal states of Baden-Württemberg, Bavaria, and Saarland are characterized by the highest mean SIS compared to all the other federal states, as the mean annual RTP per RTAf is the highest. It reveals a clear gradient, with northern federal states such as Hamburg, Schleswig-Holstein, and Mecklenburg-Western Pomerania having the lowest solar resource availabilities, as illustrated by the lowest energy yield per square kilometer RTAf. The comparison of Saxony and Saxony-Anhalt exemplifies that although Saxony’s overall RTP (34.1 TWh yr−1) is almost 10 TWh yr−1 higher than that of Saxony-Anhalt (24.2 TWh yr−1), the potential per square kilometer RTAf is slightly higher for the latter.
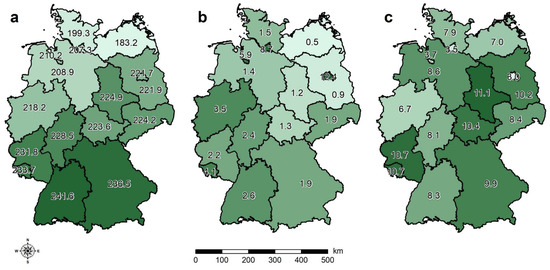
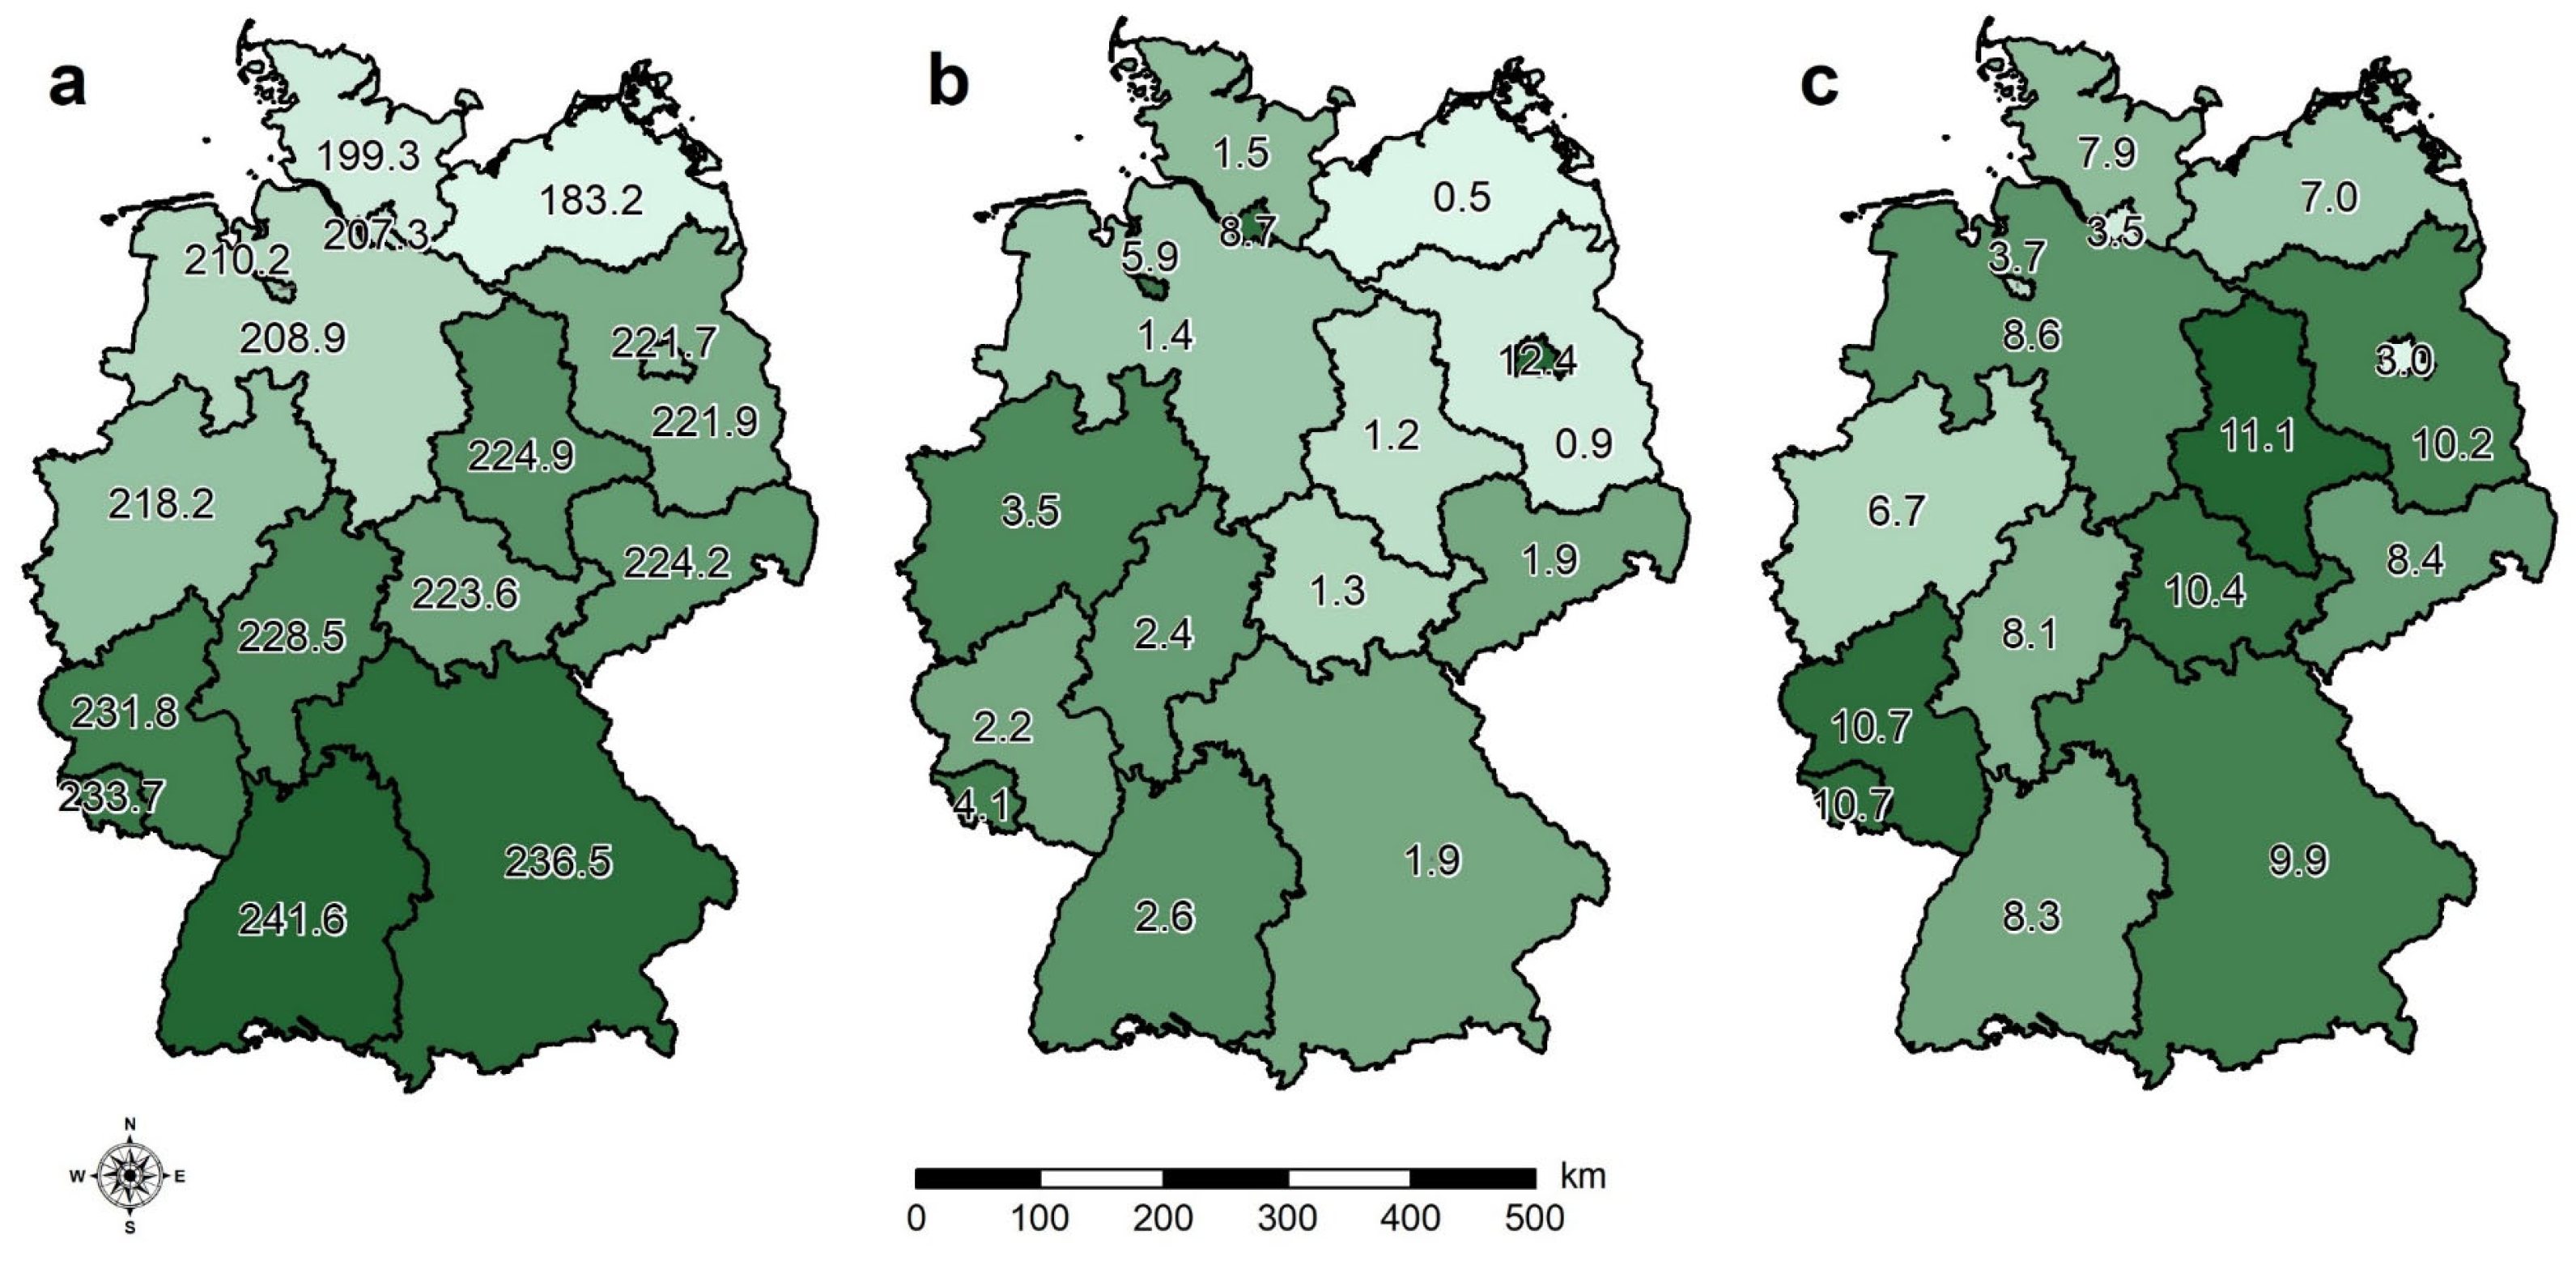
Figure 8.
Mean annual rooftop potentials (based on rooftop area scenario (RAS) 2): (a) per rooftop area (GWh km−2); (b) per federal-state area (GWh km−2), and (c) per capita (MWh cap−1) at the federal-state level. The color gradient represents the ranking of the federal states, with the highest values associated with the darkest color.
Related to the total area of each federal state, Berlin (12.4 GWh km−2), Hamburg (8.7 GWh km−2), and Bremen (5.9 GWh km−2) reveal the highest efficiencies, which emphasizes that, in these federal states, a high amount of energy can be produced in a small region (Figure 8b). The least efficient exploitation of federal-state territory is shown for Mecklenburg-Western Pomerania (0.5 GWh km−2), Brandenburg (0.9 GWh km−2), and Saxony-Anhalt (1.2 GWh km−2). Normalized by the population of each federal state, Saxony-Anhalt (11.1 MWh cap−1), Saarland (10.7 MWh cap−1), and Rhineland-Palatinate (10.7 MWh cap−1) perform the best. In comparison, the city-states of Bremen (3.7 MWh cap−1), Hamburg (3.5 MWh cap−1), and Berlin (3.0 MWh cap−1) could provide the least energy from solar rooftop PV per capita in their states (Figure 8c). Therefore, different federal states become relevant depending on the targets addressed in the installation of rooftop solar PV facilities.
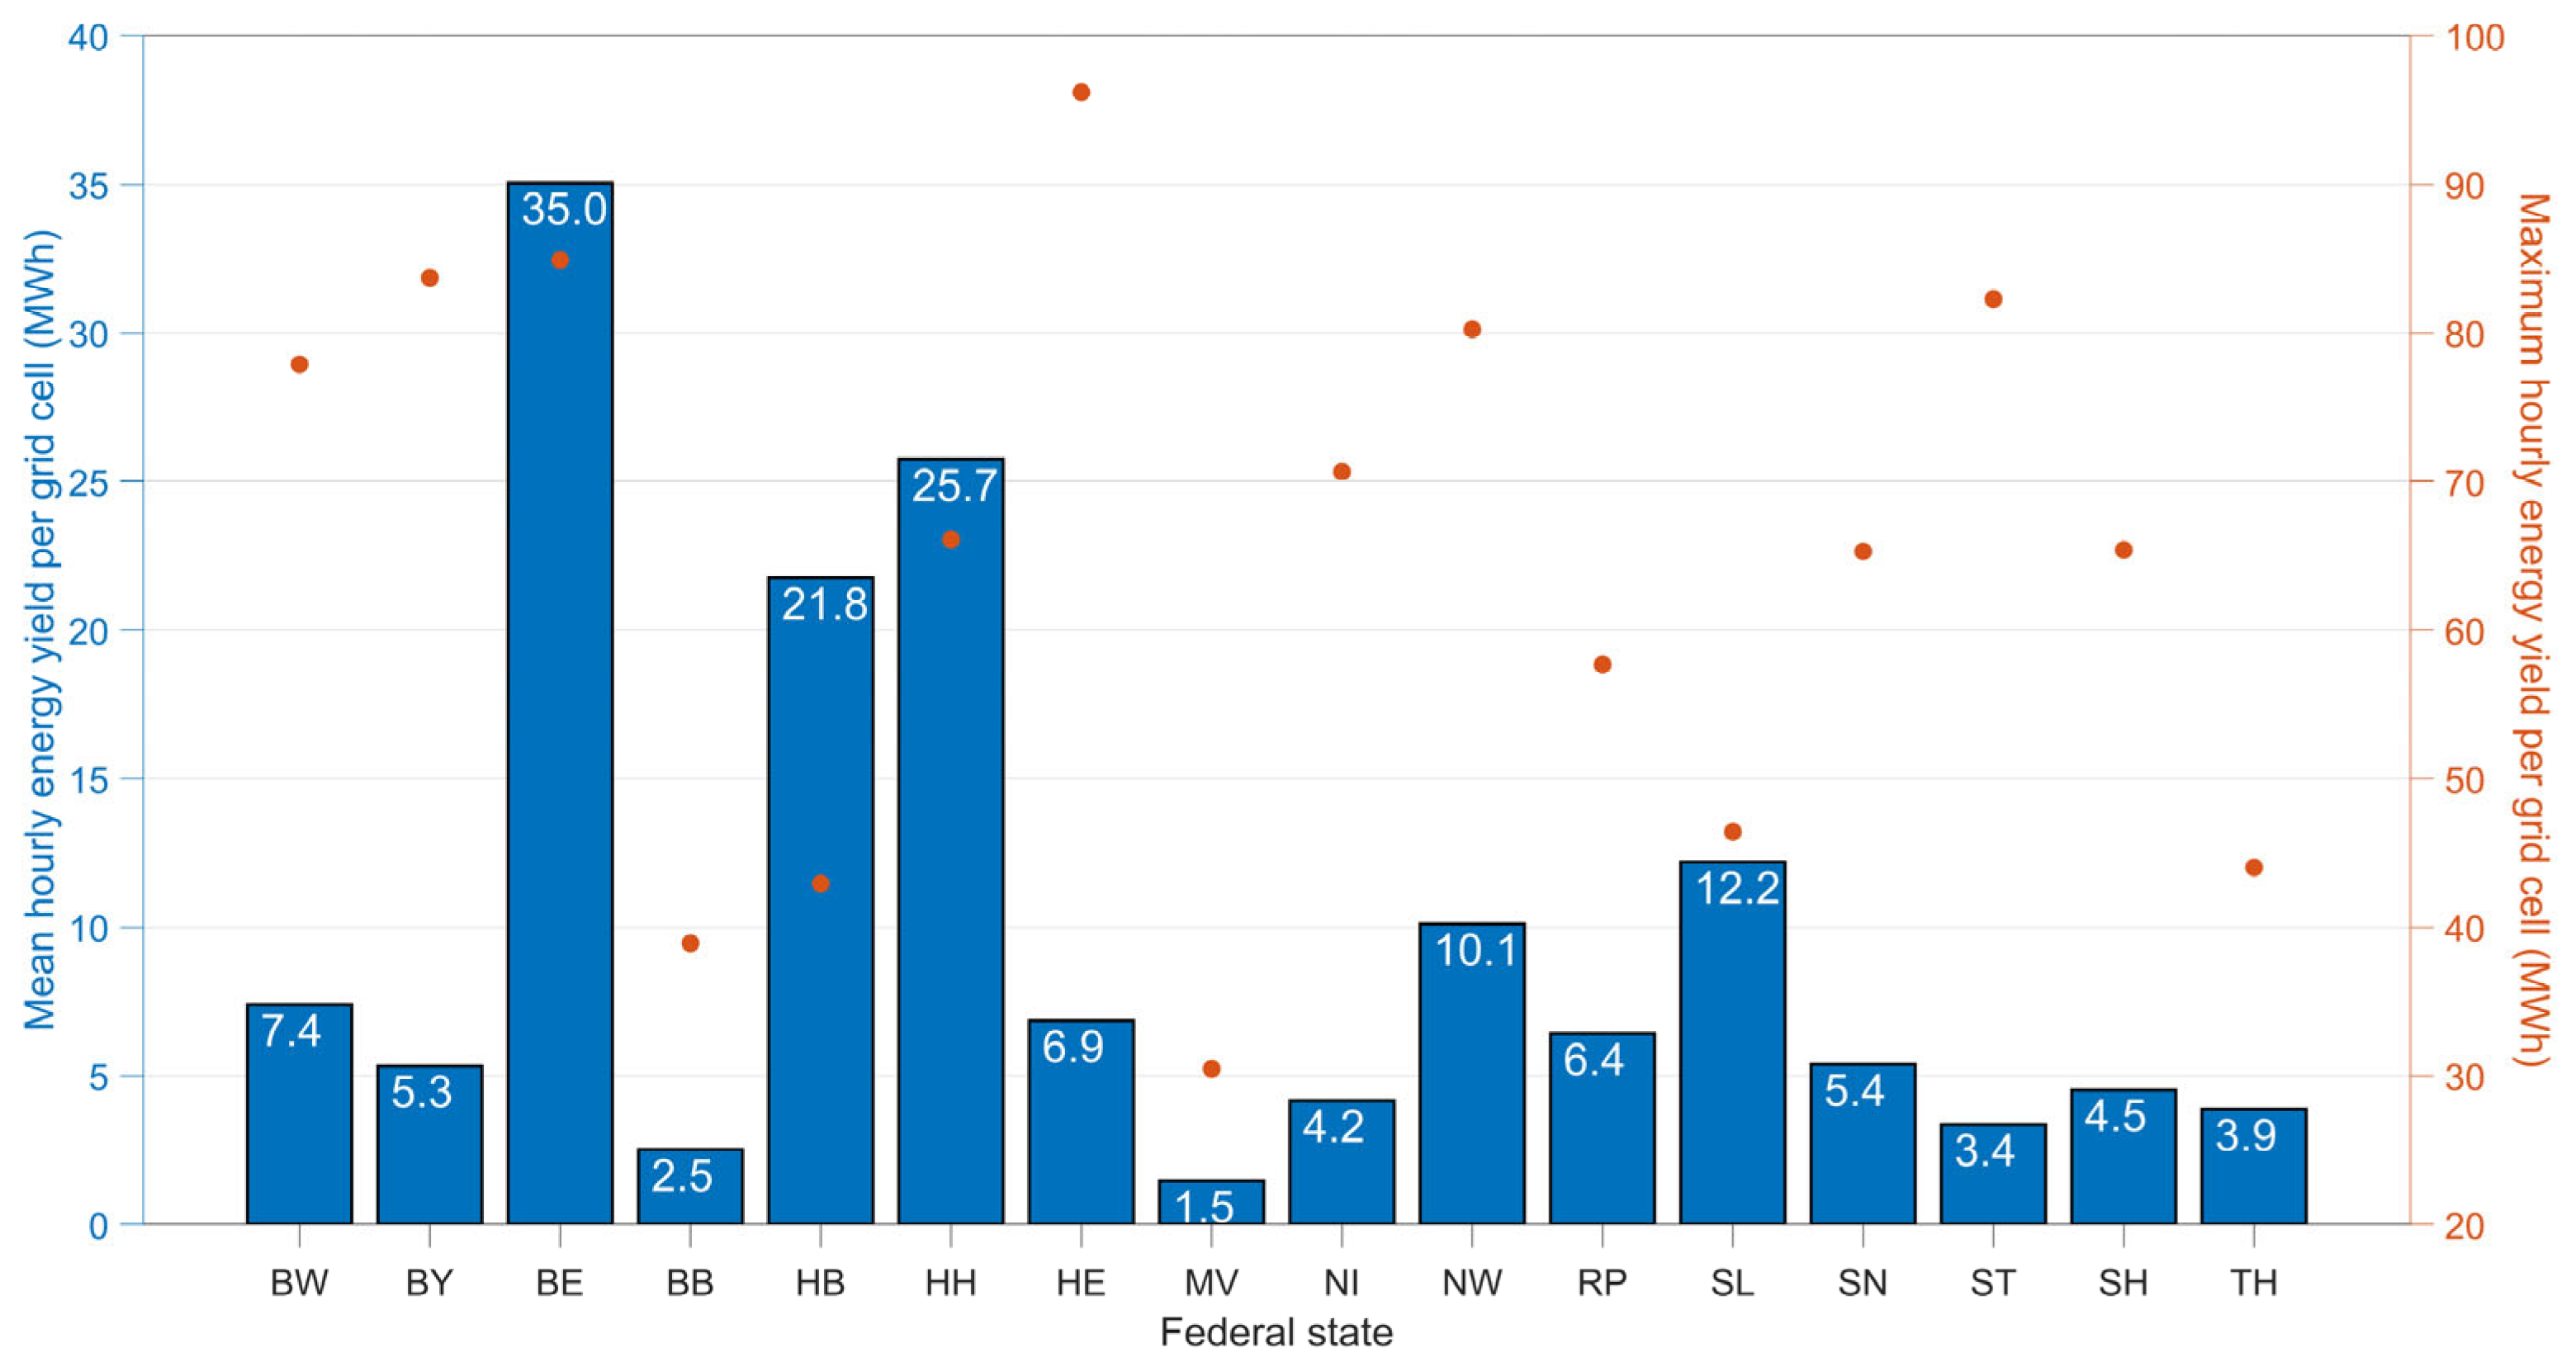
Within the federal states, the RTP variability can be substantial, driven by the availability of RTAf and solar radiation. Berlin (35.0 MWh), Hamburg (25.7 MWh), and Bremen (21.8 MWh) exhibit the highest mean hourly energy yields of all the grid cells in their federal-state territories, while, in Mecklenburg Western-Pomerania (1.5 MWh), Brandenburg (2.5 MWh), and Saxony-Anhalt (3.4 MWh), a consistent availability of RTP is lacking throughout the federal state (Figure 9). Nevertheless, federal states with overall low or moderate potentials might contain hotspots with high potential, as shown for Hesse and Saxony-Anhalt, where the grid cells with the highest mean hourly energy yields (the maximum in the federal state) of 96.2 and 82.3 MWh are associated with the urban areas of Wiesbaden/Mainz and Magdeburg, respectively. Accordingly, the consideration of the federal states as a whole is insufficient for identifying suitable sites for rooftop PV.

Figure 9.
Mean hourly energy yields of all the grid cells in the federal states (blue bars, left axis) and maximum values of the grid cells with the highest mean hourly energy yields in the federal states (red points, right axis).
3.3. Temporal Variability in Solar Photovoltaic Rooftop Potential
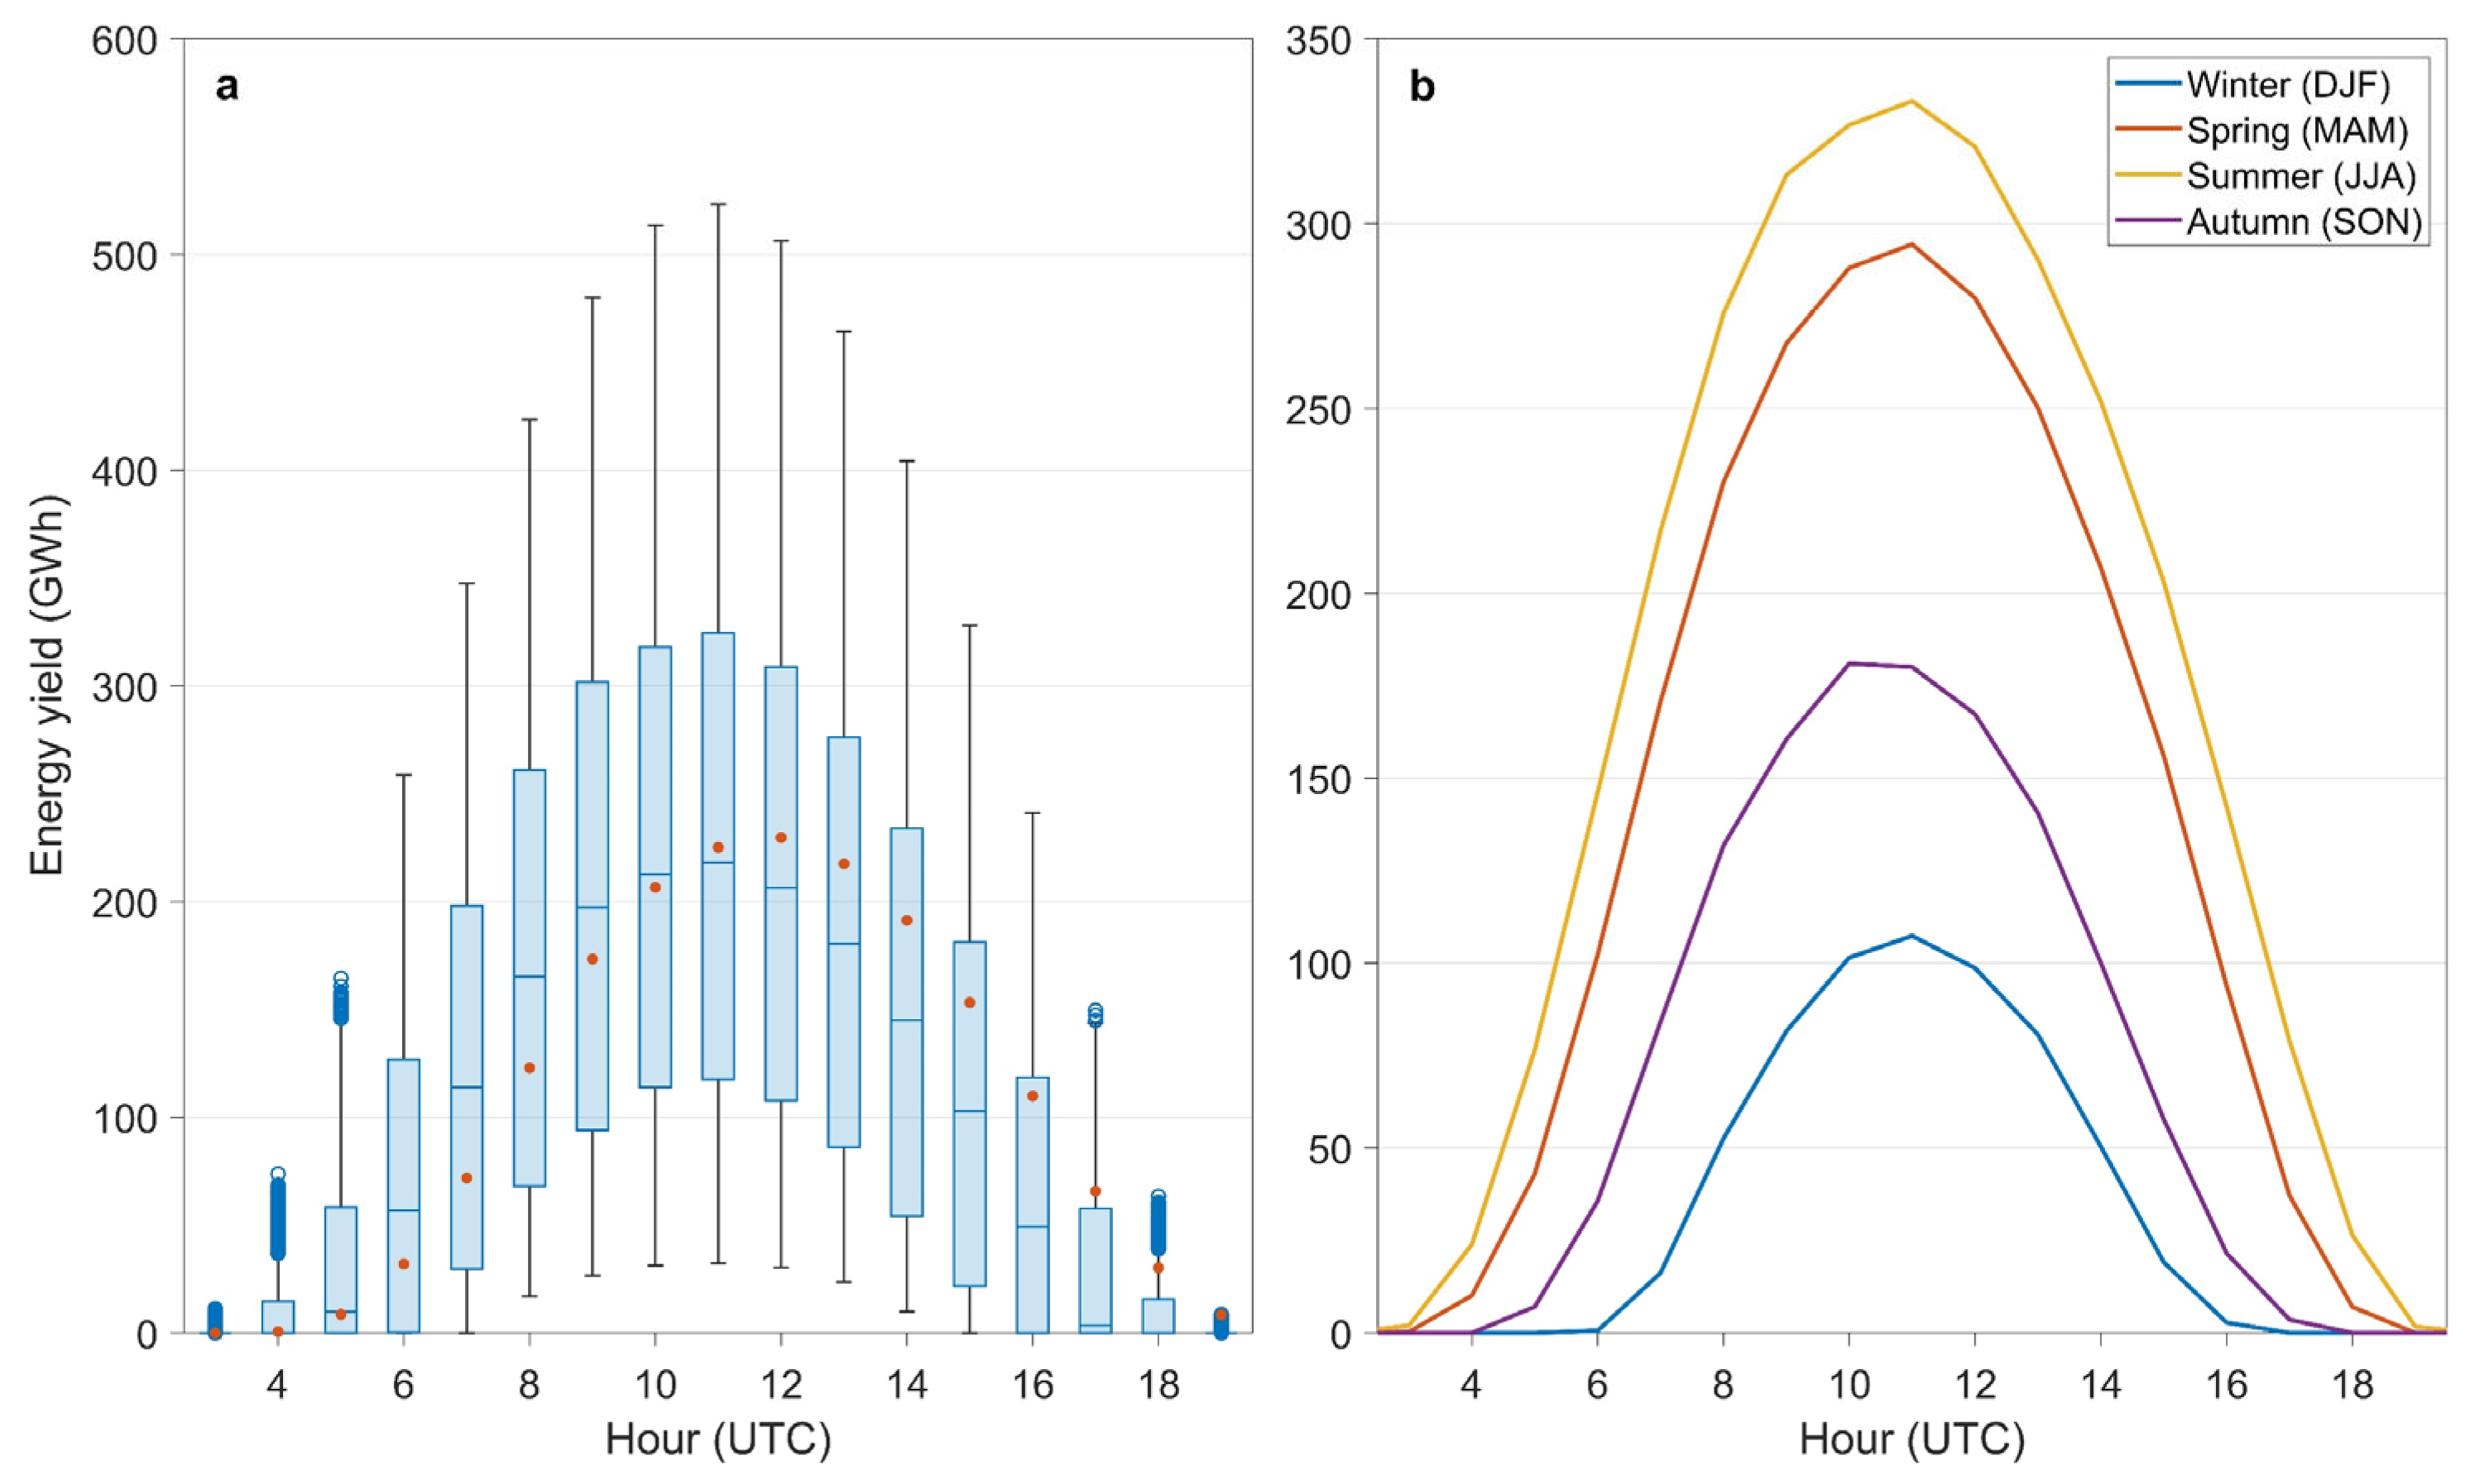
Due to the inherently intermittent and variable nature of SIS, the RTP is not consistently available. The overall German diurnal cycle of the RTP exhibits pronounced variability (Figure 10a). Outside the period between 3:00 and 19:00 UTC (Coordinated Universal Time), no potential is available due to the lack of SIS. The local time zone of Germany is UTC + 2 in summer and UTC + 1 in winter. The potential peaks around 11:00 and 12:00 UTC, when the mean and median exceed 200 GWh. However, the hourly potential can substantially deviate depending on the atmospheric conditions. A pronounced seasonal variability characterizes the mean diurnal cycle (Figure 10b). The diurnal cycle exhibits the most considerable potential in summer, indicated by the highest amplitude and the extended period between sunrise and sunset. The day length in winter is, on average, 5 h shorter than in summer and, even at noon, the potential is limited, and the peak is more than three times lower than in summer.
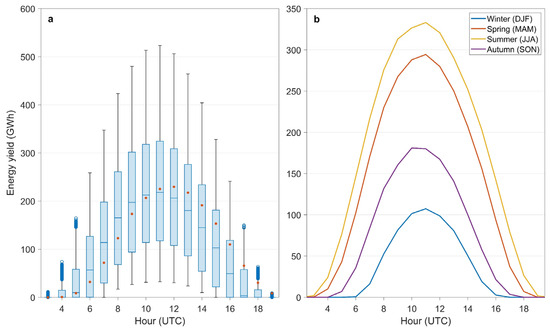
Figure 10.
Diurnal cycle of the overall German rooftop PV potential in RAS2: (a) Boxplots of all hourly energy yield values per hour of the day. Red dots indicate the mean. (b) Mean diurnal cycles in the seasons winter (December, January, February), spring (March, April, May), summer (June, July, August), and autumn (September, October, November).
Most of the annual RTP is concentrated in May, June, July, and August, when the mean and median monthly energy yields exceed 80 TWh (Figure 11a). In January and December, the potential is minimal (<20 TWh). In contrast to the winter months, May is mainly characterized by high variability, indicating substantial inter-annual variability. The inter-annual variability, quantified by the COVs, ranges from 3.3 to 6.5% and is the highest in central and southern Germany, often in low mountain ranges (Figure 11b). Figure 11a illustrates that the inter-annual variability arises particularly outside the winter season.
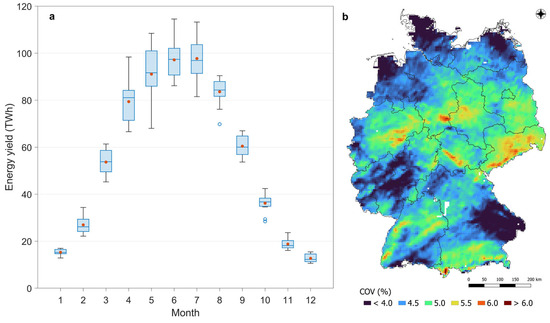
Figure 11.
(a) Boxplots of the overall monthly sums of German rooftop PV energy yield values in RAS2. Red dots indicate the mean. (b) Inter-annual variability (coefficients of variation) based on the annual means in the study area.
4. Discussion
Based on the ESM data and the calibration with solar cadastral data, the estimated German final rooftop area ranges from 2113 to 4491 km2 (from RAS1 to RAS3). As the ESM contains some data gaps and data were derived from 2014 to 2016, when potentially fewer buildings were constructed, the RTA still could be underestimated. The literature provides an even wider range of values, estimating areas between 648 km2 and 4820 km2 [5,11,13,28,55]. The various values might be due to differences in the methods, datasets, publication dates, and assumptions, such as the utilization factors or the exclusion of north-facing roofs. The solar cadastre data from North Rhine-Westphalia used for calibrating the ESM data estimate that the RTAf of North Rhine-Westphalia is 482 km2, which is within the range obtained from RAS1 (386 km2) and RAS2 (547 km2).
A recent analysis estimated the RTAu at 3916 km2 [49]. The comparison of the RTAu from this study (RAS2) with the analysis in [49] reveals that, for ten of the sixteen federal states, the absolute deviation is less than 10 km2 and the mean relative deviation is 96%, indicating that, on average, the RTAu of each federal state is underestimated by 4% in this study compared to the analysis in [49]. The highest absolute underestimations of 84 km2, 60 km2, 24 km2, and 15 km2 occur in Lower Saxony, Bavaria, Mecklenburg Western-Pomerania, and Schleswig-Holstein. In these federal states, a more significant part of the territories could not be investigated for the RTA and RTP due to missing ESM or ERA5-Land air temperature data, which explains the underestimation. Otherwise, under- and overestimation can arise due to the varying bias of the ESM in estimating suitable rooftop areas implemented from RAS1 to RAS3. For some federal states, RAS1 or RAS3 might be more plausible than RAS2. The authors of [49] estimate 1993 km2 for the installable module area, which is lower than RAS1–RAS3. They also apply a cfa,slt of 0.65 for slanted roofs; however, they use a cfa,flt of 0.35 for flat roofs, which is substantially lower than the 0.9 obtained from the solar cadastre. Instead of applying a two-step area reduction from the Ab or total RTA to the RTAu and RTAf, another study directly applies access factors accounting for technical potential losses due to roof pitch and orientation, structural inadequacy, tree shading, and other constraints [56]. These factors range from 60% to 65% for flat roofs and from 17.6% to 24.3% for slanted roofs, depending on the region. The authors of [20] determined that 81% of the total ground floor area of each building is available for rooftop PV. Other analyses go even deeper by including the building’s social function, its structural quality, or the economic costs for conversion factors [37]. Therefore, the important findings are that the reduction factors applied in different studies need to be differentiated, as they consider different area reductions, and that flat and slanted roofs should be handled differently.
The large value range of the reported RTAs obtained from the literature and reports indicates high uncertainty related to the different methods and assumptions. More publicly available, high-resolution data on the building and roof characteristics in Germany and its federal states, as well as worldwide, are needed to ensure an accurate estimation of the regional and national RTAs. The application of simplification methods is required if potentials are to be estimated for scales larger than cities. Datasets such as the ESM or GHSL could represent a good proxy for estimating a plausible range if calibrated with other datasets. However, due to data gaps in the ESM, the RTPs cannot be quantified for all regions in Europe. As a solution, the ESM could be supplemented by other datasets, such as CORINE Land Cover or the European Urban Atlas, and other calibration datasets from countries such as Switzerland [28] and the Netherlands [5], for optimization. Due to the lack of area-wide, high-resolution building and roof data, it must be assumed that the statistical properties determined in the sample during calibration can be consistently applied to the entire study area. The larger and more heterogeneous the study area, the more limited and inaccurate the analyses conducted in this way. Potential biases that arise could be mitigated in future research by, for instance, clustering regions based on their urban characteristics [1] and applying different calibration and correction factors for each cluster. The integration and combination of several reliable datasets could also help to minimize bias. For instance, open-source building footprint data and orthographic aerial images could be combined by using image-processing algorithms [24].
Studies addressing the RTAs in other regions or countries indicate that the German RTA is comparatively high. While this study estimates a mean available area of 25.4–54.0 m2 cap−1 for Germany, other studies report 14.0 4.5 m2 cap−1 for Spain [34], 4.7 m2 cap−1 globally [6], and 7.4 m2 cap−1 for Western Europe [6]. For Switzerland [20,29] and Sweden [36], usable rooftop areas similar to those of Germany (up to 41 m2 cap−1 and 48.0 m2 cap−1, respectively) are reported. A total of 354 Chinese cities together comprise 65,962 km2 of the RTAu [37].
The second major source of uncertainty in the assessment of the RTP originates from the modification of the radiation within urban environments due to shading effects and different roof geometries. The urban morphology affects the solar radiation received by individual buildings due to shading effects [31,32]. A previous study found that the annual potential of an entire building group was reduced by 35.7% due to the shading effect and reduced rooftop availability [17]. This study used a statistical approach to calculate the mean correction factor for the radiation modification, which is an adequate strategy for larger study areas. The correction factor was calculated based on the solar cadastre and the mean annual radiation received by each roof object included in this dataset. A validation with the approach from [11], which assumes a fixed percentage deviation for different roof types, applied to the shares of different inclinations and slopes of the solar cadastre resulted in the same mean correction factor. The correction factor used in this study was subject to the assumption that modules on flat roofs are optimally inclined towards the south (receiving 118% of the SIS) and would be smaller than 1.0 assuming horizontally oriented modules on flat roofs. However, these approaches do not consider the substantial intra-annual variations in solar irradiance for different orientations of tilted roofs [32]. To capture these adequately, high-resolution, three-dimensional urban morphology and solar radiation models or measurements would be required. To determine an optimal tilt angle, shadow effects should be further compared and tested at different locations [19]
Other studies estimate a German RTP from 104 to 739 TWh yr−1 [11,13,28]. Besides the uncertainties related to the SIS and RTA, differences arise from applying different PV module parameters. This study estimates an optimistic potential from 475 to 1009 TWh yr−1 based on a modern and efficient module type. The estimation that rooftop PV in the European Union could potentially produce 680 TWh yr−1 seems rather low in comparison [5]. For Switzerland, RTPs of 24 ± 9 TWh yr−1 [29], 17.86 TWh yr−1 [20], and 16.29 TWh yr−1 [21] are estimated. An increase in the PV module efficiency and PR could enhance the potential to 32.15 yr−1 in 2050 [20]. For Taiwan, an RTP of 15.4 TWh yr−1 has been determined [35]. An earlier study identified the assumptions on the module efficiency and usable areas of roofs as the most sensitive parameters for RTP estimation [11].
Generally, considerable discrepancies in the estimated RTPs are found when comparing the high- and low-level approaches [7]. As reliable high-level approaches are currently unavailable at the national and federal-state scales, the approach chosen in this study cannot be evaluated in terms of accuracy. Sampling, as performed with the solar cadastre, is the most appropriate way of accounting for large-scale rooftop characteristics.
The highest mean RTPs are found in larger urban areas and regions with abundant solar resources. Urban areas and settlement agglomerations can provide the highest capacity densities due to their high building densities [16,18]. In accordance with [11], the federal states of North Rhine-Westphalia, Bavaria, and Baden-Württemberg exhibit the highest RTPs, while Hamburg, Bremen, and Saarland exhibit the lowest. Compared to the gross electricity consumption of each federal state in 2020 [57], two federal states (Bavaria: 110%; Rhineland-Palatinate: 109%) could provide an annual surplus generation in RAS1, two federal states (Thuringia and Baden-Württemberg) could cover their demand, and twelve federal states would have deficiencies, with Hamburg and Bremen covering only 40% of the consumption. In RAS2, four federal states (Berlin, Hamburg, Bremen, and North Rhine-Westphalia) still have lower RTPs than electricity consumption. In RAS3, fourteen federal states could cover their annual consumption with rooftop PV, mostly with substantial surplus generation. Assuming an increasing electricity demand in the following decades of up to 800 TWh yr−1 in Germany [58], only RAS3 might cover the overall German electricity demand when assuming rooftop PV as the sole energy source.
Even if the annual electricity demand could potentially be fulfilled by rooftop PV, a constant supply could not be guaranteed due to the spatial dynamics of the resource, such as daily and seasonal variations [11]. To minimize the supply–demand mismatches [23] of systems relying exclusively on rooftop PV, very costly seasonal storage would be required, while with additional flexibility measures, daily storage would be sufficient [9]. To handle the intermittency and strengthen the self-sufficiency of rooftop PV, innovative smart-grid technologies, including customer-sited electrical battery storage, are required [56,59]. Energy management systems and demand-side management are also crucial strategies to increase the energy efficiency and self-sufficiency and minimize the costs for residential customers [60,61,62]. They require an accurate PV forecast for the optimal load and resource scheduling [60] and highlight the need for temporally high-resolution power output data.
Selecting sites where rooftop solar PV can be exploited most efficiently requires multi-criteria considerations, including meteorological, geographical, technical, and economic considerations. Efficiency can be achieved by engrossing (1) a few rooftop areas for high energy yields (using regions with abundant solar resources) and (2) little federal-state territory (using regions with high densities of suitable buildings), or (3) by provisioning electricity where the population is concentrated (using highly populated regions). In federal states with high populations and building densities and abundant solar resources, a high amount of energy can be obtained in a small region, maximizing the energy yield and reducing the electricity transmission infrastructure requirements and costs.
The quantification of the spatiotemporal variability in the rooftop PV helps identify locations for cost-effective PV installations, integrating rooftop PV, designing energy systems and their management, and retrofitting existing building structures [21]. It can also help to show the population the great potential and thereby promote citizens’ participation as energy prosumers, which favors energy security, independence, and the resilience and cleanliness of the energy system [63]. To achieve energy justice, attention should be paid to an equitable deployment of rooftop PV despite prioritized areas with high potentials [15]. During implementation, care must be taken to consider the infrastructural challenges, such as the building’s social function [37], the building conditions, or the building’s historic preservation. Even if a vast expansion of rooftop PV is desired, it is questionable whether it is applicable due to the dependence on solar PV module components and their raw materials [64]. The temporal patterns of the RTP highlight that capacity expansion no longer makes sense after a certain point because, on the one hand, the surplus is substantial at certain times, and on the other hand, deficits cannot be paid off.
Studies focusing on future RTPs should incorporate socio-economic and policy factors, which might be more important than physical factors for the deployment of rooftop PV [6]. Although climate change-driven changes in solar radiation and the ambient air temperature will probably reduce the meteorological PV potentials across parts of the world, an increase in the cooling demand could enhance the value of rooftop PV [14]. Focusing on large, non-residential rooftop PV could require fewer individual decisions and less effort [16], strengthen resilience, and accelerate the local deployment of clean energy resources to promote energy justice [59]. Future research should also incorporate analyses of rural regions, as single-family dwellings might offer higher PV generation compared to multi-story buildings in urban areas [41].
Future technical improvements (increasing the module efficiency and PR) could increase the technical potential [11], while an increase in the building stock due to urbanization could drive an expansion of the geographical potential. Changes in the shares of different roof types should be taken into account. Several studies recommend reinforcing multi-factor-, AI-, and GIS-based methods based on high-resolution, open-data sources to provide an accurate and less computationally demanding assessment [2,4]. Machine learning algorithms can be used for predicting solar radiation and power generation and for spatial environmental data modeling [19,21]. Recent studies applied the Support Vector Machine and Random Forest algorithms to estimate the available roof areas based on predictors such as the built-up area, building characteristics, and population size [20,21,37]. Deep learning methods, including image recognition, objection detection, and object segmentation self-learn through existing samples, self-optimize, identify, and segment complex objects [22]. They can be used to detect and classify building rooftops [21].
5. Conclusions
Rooftop solar PV is a valuable addition to other renewable-energy sources, like open-field PV, as it utilizes existing infrastructure, reduces land consumption, and supplies electricity where it is needed. An accurate assessment of the rooftop solar PV potential is essential for efficient and sustainable resource use. However, due to the lack of high-resolution data on rooftop areas and characteristics and small-scale solar radiation variability, this assessment remains challenging, especially at high temporal resolutions and for large study areas. National or international assessments of the rooftop PV potential are rare and cannot depend on accurate but time-consuming and costly LiDAR data.
This study leveraged satellite and reanalysis products of open-source meteorological, geographical, and technical data to evaluate the spatiotemporal rooftop PV potential of Germany and its regions (5 km × 5 km) and federal states. In Germany, up to 4500 km2 of rooftop area could be available for PV modules, potentially generating up to 1009 TWh of electricity annually with modern module technology. In the intermediate scenario (673 TWh yr−1), 12 out of the 16 federal states cover their annual electricity demands self-sufficiently, partly with substantial surplus generation. Despite this high annual potential, the temporal and spatial dynamics of the rooftop potential highlight the risk of supply–demand mismatch and the need for storage capacity, energy management, flexibility, and modern transmission infrastructure [58]. Rooftop PV can result in net-zero grid electricity consumption when combined with energy efficiency measures and efficient technical systems [63]. High-resolution power output data are crucial for these assessments.
As shown in previous studies, the rooftop area and potential vary widely based on different assumptions, reflecting the significant uncertainty at each stage of the potential hierarchy. These uncertainties pertain to small-scale variations in the urban solar radiation, total rooftop area, fraction usable for solar PV, and technical performance and efficiency of the modules. This study used the European Settlement Map to estimate the usable rooftop areas, which, like the Global Human Settlement Layer, can be applied to other regions and countries for large-scale assessments. However, to ensure reliability and accuracy, these datasets should be calibrated with high-quality solar cadastres and statistical data. Calibration data enhance rooftop area estimation by linking built-up areas to usable rooftop areas based on roof types and characteristics.
Future studies on the European rooftop PV potential could use the European Settlement Map and available solar cadastres for different countries. The more region- or country-specific correction and calibration factors obtained, the more accurate the analysis. Future research could also explore the impact of socio-economic parameters, climate change, and technological developments in PV modules on the rooftop PV potential. The temporal dynamics of the rooftop PV potential should consider the large-scale solar radiation availability and the varying effects of the urban morphology, such as shading. Rooftop utilization factors, which quantify the ratio of the usable rooftop area to the total rooftop area, should be specified with the highest possible temporal resolution.
Accurate assessments are essential for establishing regional and national carbon reduction policies and informing investment decisions [21]. Following the concept of renewable-energy priority zones [54], this study serves as a starting point for future research by identifying the regions and federal states with the highest potentials.
This methodology can be adapted to other study areas by adjusting the calibration factors and using region-specific cadastre and statistical data. In regions or states with the highest potentials, more advanced approaches, including artificial intelligence, building models, geographic information systems, or LiDAR data, can be used to derive a more accurate representation of the most suitable roofs and their potentials. This top-down approach avoids the complexity and time consumption of investigating unsuitable areas, helping decision-makers focus on the most promising sites and develop appropriate targets and strategies.
Author Contributions
Conceptualization, L.S., D.S. and C.J.; methodology, L.S. and C.J.; software, L.S.; validation, L.S., D.S. and C.J.; formal analysis, L.S.; resources, L.S.; data curation, L.S.; writing—original draft preparation, L.S.; writing—review and editing, L.S., D.S. and C.J.; visualization, L.S. All authors have read and agreed to the published version of the manuscript.
Funding
This research received no external funding.
Data Availability Statement
Raw data can be accessed from the links provided in the References Section. Derived data supporting the findings of this study are available from the authors upon request.
Conflicts of Interest
The authors declare no conflicts of interest.
Nomenclature
| β | Temperature coefficient (°C−1) |
| ηref | Reference electrical module efficiency under standard testing conditions |
| Ab | Built-up area (km2) |
| AEY | Annual energy yield (TWh yr−1) |
| c1, c2, c3 | Constants for calculating the Tcell |
| cfa | Total area correction factor |
| cfa,flt | Area correction factor for flat roofs |
| cfa,slt | Area correction factor for slanted roofs |
| cfrad | Radiation correction factor |
| cfrad,rt | Roof-type-specific radiation correction factor |
| COV | Coefficient of variation (%) |
| fca | Calibration factor |
| i | Grid cell |
| Irf | Irradiation on a roof (kWh m−2 a−1) |
| PR | Performance ratio |
| rt | Roof type (combination of inclination and orientation) |
| RTA | Rooftop area (km2) |
| RTAu | Usable rooftop area (km2) |
| RTAf | Final rooftop area (net module area) (km2) |
| RTP | Rooftop potential (MWh yr−1) |
| Sflt,u | Area share of usable flat roofs |
| Srt,u | Area share of a roof type |
| SIS | Surface incoming solar radiation (W m−2) |
| SISperiod | Period mean of SIS calculated based on annual means (W m−2) |
| SISstd | Standard deviation of annual means of SIS (W m−2) |
| Ta | Near-surface air temperature (°C) |
| Tcell | Solar photovoltaic cell temperature (°C) |
| Tref | Reference temperature under standard testing conditions (25 °C) |
| AI | Artificial intelligence |
| CM SAF | Satellite Application Facility on Climate Monitoring |
| ECMWF | European Centre for Medium-Range Weather Forecasts |
| ERA5-Land | Reanalysis product derived by running the land component of the fifth-generation ECMWF atmospheric reanalysis |
| ESM | European Settlement Map |
| GHSL | Global Human Settlement Layer |
| GIS | Geographic information system |
| ICDR | Interim Climate Data Record |
| LiDAR | Light detection and ranging |
| Pop | Population |
| Pop Dens | Population density |
| PV | Photovoltaics |
| RAS | Rooftop area scenario |
| SARAH | Surface Solar Radiation Data Set—Heliosat |
| SEVIRI | Spinning Enhanced Visible and InfraRed Imager |
| UTC | Coordinated Universal Time |
References
- Bernasconi, D.; Guariso, G. Rooftop PV: Potential and Impacts in a Complex Territory. Energies 2021, 14, 3687. [Google Scholar] [CrossRef]
- Gassar, A.A.A.; Cha, S.H. Review of geographic information systems-based rooftop solar photovoltaic potential estimation approaches at urban scales. Appl. Energy 2021, 291, 116817. [Google Scholar] [CrossRef]
- United Nations Human Settlements Programme. World Cities Report. 2022. Available online: https://unhabitat.org/sites/default/files/2022/06/wcr_2022.pdf (accessed on 10 May 2024).
- Fakhraian, E.; Alier, M.; Valls Dalmau, F.; Nameni, A.; Casañ Guerrero, M.J. The urban rooftop photovoltaic potential determination. Sustainability 2021, 13, 7447. [Google Scholar] [CrossRef]
- Bódis, K.; Kougias, I.; Jäger-Waldau, A.; Taylor, N.; Szabó, S. A high-resolution geospatial assessment of the rooftop solar photovoltaic potential in the European Union. Renew. Sustain. Energy Rev. 2019, 114, 109309. [Google Scholar] [CrossRef]
- Gernaat, D.E.; de Boer, H.S.; Dammeier, L.C.; van Vuuren, D.P. The role of residential rooftop photovoltaic in long-term energy and climate scenarios. Appl. Energy 2020, 279, 115705. [Google Scholar] [CrossRef]
- Castellanos, S.; Sunter, D.A.; Kammen, D.M. Rooftop solar photovoltaic potential in cities: How scalable are assessment approaches? Environ. Res. Lett. 2017, 12, 125005. [Google Scholar] [CrossRef]
- Koch, H.; Lechner, S.; Erdmann, S.; Hofmann, M. Assessing the Potential of Rooftop Photovoltaics by Processing High-Resolution Irradiation Data, as Applied to Giessen, Germany. Energies 2022, 15, 6991. [Google Scholar] [CrossRef]
- Gomez-Exposito, A.; Arcos-Vargas, A.; Gutierrez-Garcia, F. On the potential contribution of rooftop PV to a sustainable electricity mix: The case of Spain. Renew. Sustain. Energy Rev. 2020, 132, 110074. [Google Scholar] [CrossRef]
- Kodysh, J.B.; Omitaomu, O.A.; Bhaduri, B.L.; Neish, B.S. Methodology for estimating solar potential on multiple building rooftops for photovoltaic systems. Sustain. City Soc. 2013, 8, 31–41. [Google Scholar] [CrossRef]
- Mainzer, K.; Fath, K.; McKenna, R.; Stengel, J.; Fichtner, W.; Schultmann, F. A high-resolution determination of the technical potential for residential-roof-mounted photovoltaic systems in Germany. Sol. Energy 2014, 105, 715–731. [Google Scholar] [CrossRef]
- Albatayneh, A.; Albadaineh, R.; Juaidi, A.; Abdallah, R.; Montoya, M.D.G.; Manzano-Agugliaro, F. Rooftop photovoltaic system as a shading device for uninsulated buildings. Energy Rep. 2022, 8, 4223–4232. [Google Scholar] [CrossRef]
- Joshi, S.; Mittal, S.; Holloway, P.; Shukla, P.R.; Ó Gallachóir, B.; Glynn, J. High resolution global spatiotemporal assessment of rooftop solar photovoltaics potential for renewable electricity generation. Nat. Commun. 2021, 12, 5738. [Google Scholar] [CrossRef] [PubMed]
- Shi, M.; Lu, X.; Craig, M.T. Climate change will impact the value and optimal adoption of residential rooftop solar. Nat. Clim. Change 2024, 14, 482–489. [Google Scholar] [CrossRef]
- Castellanos, S. Equitable rooftop photovoltaics deployment. Nat. Energy 2024. [Google Scholar] [CrossRef]
- Mikovits, C.; Schauppenlehner, T.; Scherhaufer, P.; Schmidt, J.; Schmalzl, L.; Dworzak, V.; Hampl, N.; Sposato, R.G. A spatially highly resolved ground mounted and rooftop potential analysis for photovoltaics in austria. ISPRS Int. J. Geo-Inf. 2021, 10, 418. [Google Scholar] [CrossRef]
- Ren, H.; Xu, C.; Ma, Z.; Sun, Y. A novel 3D-geographic information system and deep learning integrated approach for high-accuracy building rooftop solar energy potential characterization of high-density cities. Appl. Energy 2022, 306, 117985. [Google Scholar] [CrossRef]
- Risch, S.; Maier, R.; Du, J.; Pflugradt, N.; Stenzel, P.; Kotzur, L.; Stolten, D. Potentials of renewable energy sources in Germany and the influence of land use datasets. Energies 2022, 15, 5536. [Google Scholar] [CrossRef]
- Yao, H.; Zhou, Q. Research status and application of rooftop photovoltaic Generation Systems. Clean. Energy Syst. 2023, 5, 100065. [Google Scholar] [CrossRef]
- Assouline, D.; Mohajeri, N.; Scartezzini, J.L. Quantifying rooftop photovoltaic solar energy potential: A machine learning approach. Sol. Energy 2017, 141, 278–296. [Google Scholar] [CrossRef]
- Assouline, D.; Mohajeri, N.; Scartezzini, J.L. Large-scale rooftop solar photovoltaic technical potential estimation using Random Forests. Appl. Energy 2018, 217, 189–211. [Google Scholar] [CrossRef]
- Huang, Z.; Mendis, T.; Xu, S. Urban solar utilization potential mapping via deep learning technology: A case study of Wuhan, China. Appl. Energy 2019, 250, 283–291. [Google Scholar] [CrossRef]
- Jurasz, J.K.; Dąbek, P.B.; Campana, P.E. Can a city reach energy self-sufficiency by means of rooftop photovoltaics? Case study from Poland. J. Clean. Prod. 2020, 245, 118813. [Google Scholar] [CrossRef]
- Mainzer, K.; Killinger, S.; McKenna, R.; Fichtner, W. Assessment of rooftop photovoltaic potentials at the urban level using publicly available geodata and image recognition techniques. Sol. Energy 2017, 155, 561–573. [Google Scholar] [CrossRef]
- Ninsawat, S.; Hossain, M.D. Identifying potential area and financial prospects of rooftop solar photovoltaics (PV). Sustainability 2016, 8, 1068. [Google Scholar] [CrossRef]
- Singh, R.; Banerjee, R. Estimation of rooftop solar photovoltaic potential of a city. Sol. Energy 2015, 115, 589–602. [Google Scholar] [CrossRef]
- Song, X.; Huang, Y.; Zhao, C.; Liu, Y.; Lu, Y.; Chang, Y.; Yang, J. An approach for estimating solar photovoltaic potential based on rooftop retrieval from remote sensing images. Energies 2018, 11, 3172. [Google Scholar] [CrossRef]
- Tröndle, T.; Pfenninger, S.; Lilliestam, J. Home-made or imported: On the possibility for renewable electricity autarky on all scales in Europe. Energy Strategy Rev. 2019, 26, 100388. [Google Scholar] [CrossRef]
- Walch, A.; Castello, R.; Mohajeri, N.; Scartezzini, J.L. Big data mining for the estimation of hourly rooftop photovoltaic potential and its uncertainty. Appl. Energy 2020, 262, 114404. [Google Scholar] [CrossRef]
- Aslani, M.; Seipel, S. Automatic identification of utilizable rooftop areas in digital surface models for photovoltaics potential assessment. Appl. Energy 2022, 306, 118033. [Google Scholar] [CrossRef]
- Hong, T.; Lee, M.; Koo, C.; Kim, J.; Jeong, K. Estimation of the available rooftop area for installing the rooftop solar photovoltaic (PV) system by analyzing the building shadow using Hillshade analysis. Energy Procedia 2016, 88, 408–413. [Google Scholar] [CrossRef]
- Lau, K.K.L.; Lindberg, F.; Johansson, E.; Rasmussen, M.I.; Thorsson, S. Investigating solar energy potential in tropical urban environment: A case study of Dar es Salaam, Tanzania. Sustain. City Soc. 2017, 30, 118–127. [Google Scholar] [CrossRef]
- Groppi, D.; de Santoli, L.; Cumo, F.; Garcia, D.A. A GIS-based model to assess buildings energy consumption and usable solar energy potential in urban areas. Sustain. City Soc. 2018, 40, 546–558. [Google Scholar] [CrossRef]
- Izquierdo, S.; Rodrigues, M.; Fueyo, N. A method for estimating the geographical distribution of the available roof surface area for large-scale photovoltaic energy-potential evaluations. Sol. Energy 2008, 82, 929–939. [Google Scholar] [CrossRef]
- Ko, L.; Wang, J.C.; Chen, C.Y.; Tsai, H.Y. Evaluation of the development potential of rooftop solar photovoltaic in Taiwan. Renew. Energy 2015, 76, 582–595. [Google Scholar] [CrossRef]
- Yang, Y.; Campana, P.E.; Stridh, B.; Yan, J. Potential analysis of roof-mounted solar photovoltaics in Sweden. Appl. Energy 2020, 279, 115786. [Google Scholar] [CrossRef]
- Zhang, Z.; Chen, M.; Zhong, T.; Zhu, R.; Qian, Z.; Zhang, F.; Yan, J. Carbon mitigation potential afforded by rooftop photovoltaic in China. Nat. Commun. 2023, 14, 2347. [Google Scholar] [CrossRef]
- Kosmopoulos, P.; Dhake, H.; Kartoudi, D.; Tsavalos, A.; Koutsantoni, P.; Katranitsas, A.; Lavdakis, N.; Mengou, E.; Kashyap, Y. Ray-Tracing modeling for urban photovoltaic energy planning and management. Appl. Energy 2024, 369, 123516. [Google Scholar] [CrossRef]
- Sakti, A.D.; Ihsan, K.T.N.; Anggraini, T.S.; Shabrina, Z.; Sasongko, N.A.; Fachrizal, R.; Aziz, M.; Aryal, J.; Yuliarto, B.; Hadi, P.O.; et al. Multi-criteria assessment for city-wide rooftop solar PV deployment: A case study of Bandung, Indonesia. Remote Sens. 2022, 14, 2796. [Google Scholar] [CrossRef]
- Yan, L.; Zhu, R.; Kwan, M.P.; Luo, W.; Wang, D.; Zhang, S.; Feng, L. Estimation of urban-scale photovoltaic potential: A deep learning-based approach for constructing three-dimensional building models from optical remote sensing imagery. Sustain. City Soc. 2023, 93, 104515. [Google Scholar] [CrossRef]
- Saez, R.; Boer, D.; Shobo, A.B.; Vallès, M. Techno-economic analysis of residential rooftop photovoltaics in Spain. Renew. Sustain. Energy Rev. 2023, 188, 113788. [Google Scholar] [CrossRef]
- Bundesministerium für Wirtschaft und Klimaschutz. Photovoltaik-Strategie. Handlungsfelder und Maßnahmen für Einen Beschleunigten Ausbau der Photovoltaik. 2023. Available online: https://www.bmwk.de/Redaktion/DE/Publikationen/Energie/photovoltaik-stategie-2023.pdf?__blob=publicationFile&v=8 (accessed on 16 April 2024). (In German).
- Pfeifroth, U.; Kothe, S.; Trentmann, J.; Hollmann, R.; Fuchs, P.; Kaiser, J.; Werscheck, M. Surface Radiation Data Set—Heliosat (SARAH)—Edition 2.1, Satellite Application Facility on Climate Monitoring. 2019. Available online: https://wui.cmsaf.eu/safira/action/viewDoiDetails?acronym=SARAH_V002_01 (accessed on 15 September 2022).
- Pfeifroth, U.; Trentmann, J.; Hollmann, R.; Selbach, N.; Werscheck, M.; Meirink, J.F. ICDR SEVIRI Radiation—Based on SARAH-2 Methods, Satellite Application Facility on Climate Monitoring. 2018. Available online: https://wui.cmsaf.eu/safira/action/viewICDRDetails?acronym=SARAH_V002_ICDR (accessed on 15 September 2022).
- Muñoz Sabater, J. ERA5-Land Hourly Data from 1950 to Present. Copernicus Climate Change Service (C3S) Climate Data Store (CDS). 2019. Available online: https://cds.climate.copernicus.eu/cdsapp#!/dataset/10.24381/cds.e2161bac?tab=overview (accessed on 15 September 2022).
- Corbane, C.; Sabo, F. ESM R2019—European Settlement Map from Copernicus Very High Resolution Data for Reference Year 2015. European Commission, Joint Research Centre (JRC) 2019. Available online: https://data.jrc.ec.europa.eu/dataset/8bd2b792-cc33-4c11-afd1-b8dd60b44f3b (accessed on 22 November 2022).
- OpenGeodata.NRW: Potentialdaten Photovoltaik—Dachflächen. Available online: https://www.opengeodata.nrw.de/produkte/umwelt_klima/klima/solarkataster/photovoltaik/ (accessed on 10 November 2022).
- Statistische Ämter des Bundes und der Länder. Gemeinsames Statistikportal: Fläche und Bevölkerung nach Ländern. Available online: https://www.statistikportal.de/de/bevoelkerung/flaeche-und-bevoelkerung (accessed on 1 April 2024). (In German).
- Agora Energiewende: Solarstrom vom Dach. Photovoltaikpotenzial auf Dachflächen in Deutschland. Available online: https://www.agora-energiewende.de/publikationen/solarstrom-vom-dach#downloads (accessed on 23 April 2024). (In German).
- Behr, H.D.; Jung, C.; Trentmann, J.; Schindler, D. Using satellite data for assessing spatiotemporal variability and complementarity of solar resources—A case study from Germany. Meteorol. Z. 2021, 30, 515–532. [Google Scholar] [CrossRef]
- Ghaleb, B.; Asif, M. Assessment of solar PV potential in commercial buildings. Renew. Energy 2022, 187, 618–630. [Google Scholar] [CrossRef]
- Longi: Hi-MO X6 Scientist. LR5-54HTH 445~455 M. Available online: https://static.longi.com/L_Gi_LE_PM_T_PMD_059_F131_LR_5_54_HTH_445_455_M_30_30_and_15_Frame_Scientist_V19_9e6db880ac.pdf (accessed on 25 April 2024).
- Idoko, L.; Anaya-Lara, O.; McDonald, A. Enhancing PV modules efficiency and power output using multi-concept cooling technique. Energy Rep. 2018, 4, 357–369. [Google Scholar] [CrossRef]
- Sander, L.; Jung, C.; Schindler, D. New concept of renewable energy priority zones for efficient onshore wind and solar expansion. Energy Convers. Manag. 2023, 294, 117575. [Google Scholar] [CrossRef]
- Jacobson, M.Z.; Delucchi, M.A.; Cameron, M.A.; Coughlin, S.J.; Hay, C.A.; Manogaran, I.P.; Shu, Y.; Von Krauland, A.K. Impacts of green new deal energy plans on grid stability, costs, jobs, health, and climate in 143 countries. One Earth 2019, 1, 449–463. [Google Scholar] [CrossRef]
- Kurdgelashvili, L.; Li, J.; Shih, C.H.; Attia, B. Estimating technical potential for rooftop photovoltaics in California, Arizona and New Jersey. Renew. Energy 2016, 95, 286–302. [Google Scholar] [CrossRef]
- Agentur für Erneuerbare Energien: Föderal Erneuerbar. Bruttostromverbrauch. Available online: https://www.foederal-erneuerbar.de/uebersicht/bundeslaender/BW|BY|B|BB|HB|HH|HE|MV|NI|NW|RP|SL|SN|ST|SH|TH|D/kategorie/strom/auswahl/739-bruttostromverbrauch/#goto_739 (accessed on 10 May 2024). (In German).
- Schindler, D.; Sander, L.; Jung, C. Importance of renewable resource variability for electricity mix transformation: A case study from Germany based on electricity market data. J. Clean. Prod. 2022, 379, 134728. [Google Scholar] [CrossRef]
- Wussow, M.; Zanocco, C.; Wang, Z.; Prabha, R.; Flora, J.; Neumann, D.; Majumdar, A.; Rajagopal, R. Exploring the potential of non-residential solar to tackle energy injustice. Nat. Energy 2024. [Google Scholar] [CrossRef]
- El-Baz, W.; Tzscheutschler, P.; Wagner, U. Day-ahead probabilistic PV generation forecast for buildings energy management systems. Sol. Energy 2018, 171, 478–490. [Google Scholar] [CrossRef]
- Müller, T.; Möst, D. Demand response potential: Available when needed? Energy Policy 2018, 115, 181–198. [Google Scholar] [CrossRef]
- Srikranjanapert, M.; Junlakarn, S.; Hoonchareon, N. How an integration of home energy management and battery system affects the economic benefits of residential PV system owners in Thailand. Sustainability 2021, 13, 2681. [Google Scholar] [CrossRef]
- Kapsalis, V.; Maduta, C.; Skandalos, N.; Wang, M.; Bhuvad, S.S.; D’Agostino, D.; Ma, T.; Raj, U.; Parker, D.; Peng, J.; et al. Critical assessment of large-scale rooftop photovoltaics deployment in the global urban environment. Renew. Sustain. Energy Rev. 2024, 189, 114005. [Google Scholar] [CrossRef]
- Hyvönen, J.; Koivunen, T.; Syri, S. Possible bottlenecks in clean energy transitions: Overview and modelled effects–case Finland. J. Clean. Prod. 2023, 410, 137317. [Google Scholar] [CrossRef]


Disclaimer/Publisher’s Note: The statements, opinions and data contained in all publications are solely those of the individual author(s) and contributor(s) and not of MDPI and/or the editor(s). MDPI and/or the editor(s) disclaim responsibility for any injury to people or property resulting from any ideas, methods, instructions or products referred to in the content. |
© 2024 by the authors. Licensee MDPI, Basel, Switzerland. This article is an open access article distributed under the terms and conditions of the Creative Commons Attribution (CC BY) license (https://creativecommons.org/licenses/by/4.0/).