Article

Assessing Ecological Impacts and Recovery in Coal Mining Areas: A Remote Sensing and Field Data Analysis in Northwest China

1
College of Geoscience and Surveying Engineering, China University of Mining & Technology (Beijing), Beijing 100083, China
2
School of Environment Science & Spatial Informatics, China University of Mining & Technology, Xuzhou 221116, China
3
Institute of Land Reclamation & Ecological Restoration, China University of Mining & Technology (Beijing), Beijing 100083, China
*
Author to whom correspondence should be addressed.
Remote Sens. 2024, 16(12), 2236; https://doi.org/10.3390/rs16122236
Submission received: 11 March 2024 / Revised: 29 May 2024 / Accepted: 10 June 2024 / Published: 19 June 2024

Abstract

:
In the coal-rich provinces of Shanxi, Shaanxi, and Inner Mongolia, the landscape bears the scars of coal extraction—namely subsidence and deformation—that disrupt both the terrain and the delicate ecological balance. This research delves into the transformative journey these mining regions undergo, from pre-mining equilibrium, through the tumultuous phase of extraction, to the eventual restoration of stability post-reclamation. By harnessing a suite of analytical tools, including sophisticated remote sensing, UAV aerial surveys, and the meticulous ground-level sampling of flora and soil, the study meticulously measures the environmental toll of mining activities and charts the path to ecological restoration. The results are promising, indicating that the restoration initiatives are effectively healing the landscapes, with proactive interventions such as seeding, afforestation, and land rehabilitation proving vital in the swift ecological turnaround. Remote sensing technology, in particular, emerges as a robust ally in tracking ecological shifts, supporting sustainable practices and guiding ecological management strategies. This study offers a promising framework for assessing geological environmental shifts, which may guide policymakers in shaping the future of mining rehabilitation in arid and semi-arid regions.

Graphical Abstract

1. Introduction

Coal continues to dominate global energy production and consumption, with its status as the primary energy source in China remaining unchallenged for the foreseeable future. Consequently, a profound understanding of the environmental impacts of coal mining activities, particularly in ecologically fragile regions, is of paramount importance for mitigating the effects of mining and fostering sustainable development. More than 92% of China’s coal mining methods are underground mining. It is estimated that the national subsidence area will increase by 2 × 10⁴ hectares [1] and the total coal reserves in northwest China account for about 72% of the total national resources [2]. Northwest China is a typical arid and semi-arid region, with sparse vegetation, s lack of water resources, and an extremely fragile ecological environment. The total area of deserts in this region accounts for 96% of China’s sandy land area [3,4]. The mining of underground coal will cause a series of disturbances to the surface, such as surface subsidence, cracks, collapse pits, and other types of surface deformation, which will change the infiltration of rainfall, the evaporation of soil moisture, the collection of surface runoff, and the change in groundwater level [5,6], thereby impacting the growth environment of plant root systems and affecting vegetation growth [7,8,9]. As a result, underground mining may exacerbate the already fragile ecological issues in the region.
Monitoring and assessing the subsidence phenomena in the northwest coal mining areas and their potential impacts on vegetation are of significant importance for guiding ecological restoration, preventing further ecological degradation, and reducing environmental management costs. Remote sensing technology, with its advantages of efficiency, non-destructiveness, and large-scale monitoring [10,11], has become an effective method for ecological monitoring in land reclamation areas [12]. By analyzing multi-scale, multi-temporal, and multi-spectral remote sensing images, we can extract quantitative data, including vegetation coverage and leaf area index, for remote sensing vegetation monitoring [13] and use spectral feature space methods to invert soil moisture and calculate the soil moisture index [14]. Additionally, we can monitor soil nutrient content, such as organic matter, total nitrogen, available phosphorus, and available potassium [15,16].
In order to gain a comprehensive understanding of the ecological impacts of vegetation restoration and land reclamation, various remote sensing indicators are being utilized to assess the state and alterations in the ecosystem. The Normalized Difference Vegetation Index (NDVI) is widely used due to its clear physical meaning and simple calculation method [17] and is closely related to surface variables associated with vegetation activity. Vegetation Fractional Coverage (VFC), derived from NDVI, describes the degree of surface vegetation coverage and indicates vegetation growth, making it a key tool for analyzing the historical dynamics of surface vegetation, monitoring current conditions, and predicting future changes [18,19]. The Remote Sensing Ecological Index (RSEI), by combining multiple ecological parameters such as vegetation cover, surface temperature, and surface moisture, is widely used to assess the resilience of ecosystems after disturbances [20,21]. These ecological indicators play a crucial role in evaluating and monitoring the effectiveness of land reclamation and provide guidance for the efficient implementation of reclamation management [22]. Although previous studies have explored the impacts of coal mining on surface vegetation in semi-arid regions using remote sensing imagery [23,24,25,26], most research has focused on the mining area scale, lacking detailed investigations that integrate with actual mining faces. Furthermore, these studies have not sufficiently incorporated remote sensing indicators, on-site soil, and topographic changes, as well as the distribution of ground fissures, into a systematic analysis.
This study aims to elucidate the long-term impacts of underground coal mining on vegetation cover in ecologically fragile areas and to assess whether artificial restoration measures can effectively mitigate the resulting environmental impacts. The Erlintu Coal Mine, located in an arid and semi-arid region, was selected as the study area. The analysis combined multi-source data with the mining conditions of underground working faces. Based on long-term remote sensing imagery, this study comprehensively applied ecological indicators such as NDVI, VFC, and the RSEI to conduct a detailed analysis of the surface ecological disturbance effects caused by mining activities. Additionally, the study evaluated the distribution and management of ground fissures during underground mining by integrating unmanned aerial vehicle (UAV) aerial photography technology and ground fissure extraction techniques. Through the collection of on-site soil samples and the detection of their physical and chemical properties, a comprehensive quantitative assessment was conducted of the specific impacts of underground mining on the ecological environment of arid and semi-arid regions and the restoration process. The findings of this research will provide strong scientific support and practical guidance for water and soil conservation, desertification control, vegetation restoration, and ecological environment construction in mining subsidence areas of northwest China’s arid and semi-arid regions.

2. Materials and Methods

2.1. Study Area

The Erlin Rabbit Mine is situated within the Xinjie Mining District of the Dongsheng Coalfield, part of the large coal base in China—the Shenfu-Dongsheng Coal Base. The mine is administratively governed by Wulanmulun Town, Yijinhuoluo Banner, Ordos City, in the Inner Mongolia. The location of the trial region is shown in Figure 1. The production scale of the mine is 10 million tons per year, utilizing a highwall mining method for full-seam extraction with a retreat mining approach. The main forms of land disturbance in this region due to mining activities are the creation of subsidence basins and ground fissures. The mine area is located on the southern side of the “Dongsheng Liang”, an eastern regional surface watershed on the Ordos Plateau. The terrain is characterized by plateau erosion hills, with most areas consisting of low hills. The majority of the area consists of low hills, with extensive Quaternary deposits and large-scale exposure of the Zhidan Group bedrock. Vegetation is sparse, and the topography is complex. The average temperature ranges between 6.2 °C and 8.7 °C, with an average annual precipitation of 379 to 420 mm. Most of the precipitation occurs from June to August, with the total rainfall during these summer months accounting for 64% of the total annual rainfall. Within the mine area, the development of gullies is quite prominent, and there is no perennial surface runoff in the gullies, only brief flash floods during heavy rainstorms.
Within the Erlintu Mine, five areas were selected for data analysis. Based on the timing of mining activities, two regions, A1 and B1, were selected as trial regions affected by mining operations. Following the First Law of Geography, which states that all things are related, with closer things being more closely related [27], the neighboring areas A2 and B2, which were undisturbed by mining activities, were chosen as control areas. The locations of these four areas are depicted in the figures, and region C represents the currently active mining face. An overview of these five areas is presented in Table 1.

2.2. Data Sources

2.2.1. Satellite Imagery

  • DEM: The Shuttle Radar Topography Mission (SRTM) DEM was generated using radar instruments that were mounted on the Space Shuttle Endeavour, which during an 11-day mission in February 2000, emitted radar pulses to map the Earth’s land elevations. This research utilizes DEMs from SRTM, specifically collected during this February 2000 mission, prior to the mining activities, alongside the 2022 UAV DEM for terrain assessment. These DEMs are vital for calculating slopes, aspects, surface roughness [28], and terrain relief [29], serving as analytical parameters to explore the topographic changes pre- and post-extraction activities.
  • Landsat Data: The study utilizes multi-temporal Landsat 8 imagery, supplemented by Landsat 7 as needed, covering the period from 2013 to 2022. To minimize seasonal effects on vegetation status, images were collected during the peak vegetation growth season, from July to September. A Google Earth Engine (GEE)-based cloud detection algorithm was used to filter out images with over 10% cloud cover, resulting in the selection of up to 54 images with minimal cloud interference. These images offer a 16-day temporal resolution and a 30-m spatial resolution. All data were sourced from the USGS website (https://glovis.usgs.gov/, accessed on 1 January 2024). Given that the Landsat 7 Enhanced Thematic Mapper Plus (ETM+) sensor experienced a scan line corrector (SLC) malfunction in 2003, leading to data gaps and reduced usability, the study primarily relies on Landsat 8 imagery. However, in instances where Landsat 8 data encountered issues, data fusion techniques were employed to combine Landsat 7 and Landsat 8 imagery. This approach leveraged the higher quality and continuity of Landsat 8 data to supplement and correct the Landsat 7 data, ensuring consistency and reliability in the combined dataset.

2.2.2. Unmanned Aerial Vehicle (UAV) Data

UAV data collection was carried out over the mining operation area. The DJI M210 RTK UAV, equipped with an X5S camera featuring a 15 mm focal length capable of capturing RGB bands, was utilized for this purpose. A flight altitude of 80 m was established, with a 70% overlap for both the flight path and adjacent passes, resulting in a ground sampling distance (GSD) of 1.8 cm. The flight speed was kept below 6 m/s to minimize motion blur, taking into account the variable local lighting conditions. Given the sufficient density of ground control points and considering the findings of Meinen and Robinson [30], which indicated that oblique photogrammetry does not significantly improve 3D reconstruction accuracy in agricultural landscapes, and the minimal surface fluctuation in the mining area, oblique photogrammetry was not employed in this experiment.
UAVs were dispatched to collect surface data from regions A1, B1, and C. Following data acquisition, Pix4Dmapper 4.5.6 software was utilized for image processing, which encompassed feature detection and matching [31], Stereo Matching [32], and Bundle Adjustment [33], resulting in the generation of a Digital Surface Model (DSM) [34]. Subsequent orthorectification [35], Mosaicking, and Blending [36] provided orthophoto imagery from the UAV photography.

2.2.3. Soil Data

Soil data were meticulously gathered on-site within the UAV’s operational region. Sampling points were systematically arranged in an S-shaped pattern at intervals of about 10 m. At each point, the surface debris was cleared before collecting soil samples from depths ranging from 3 to 20 cm.

2.3. Methods

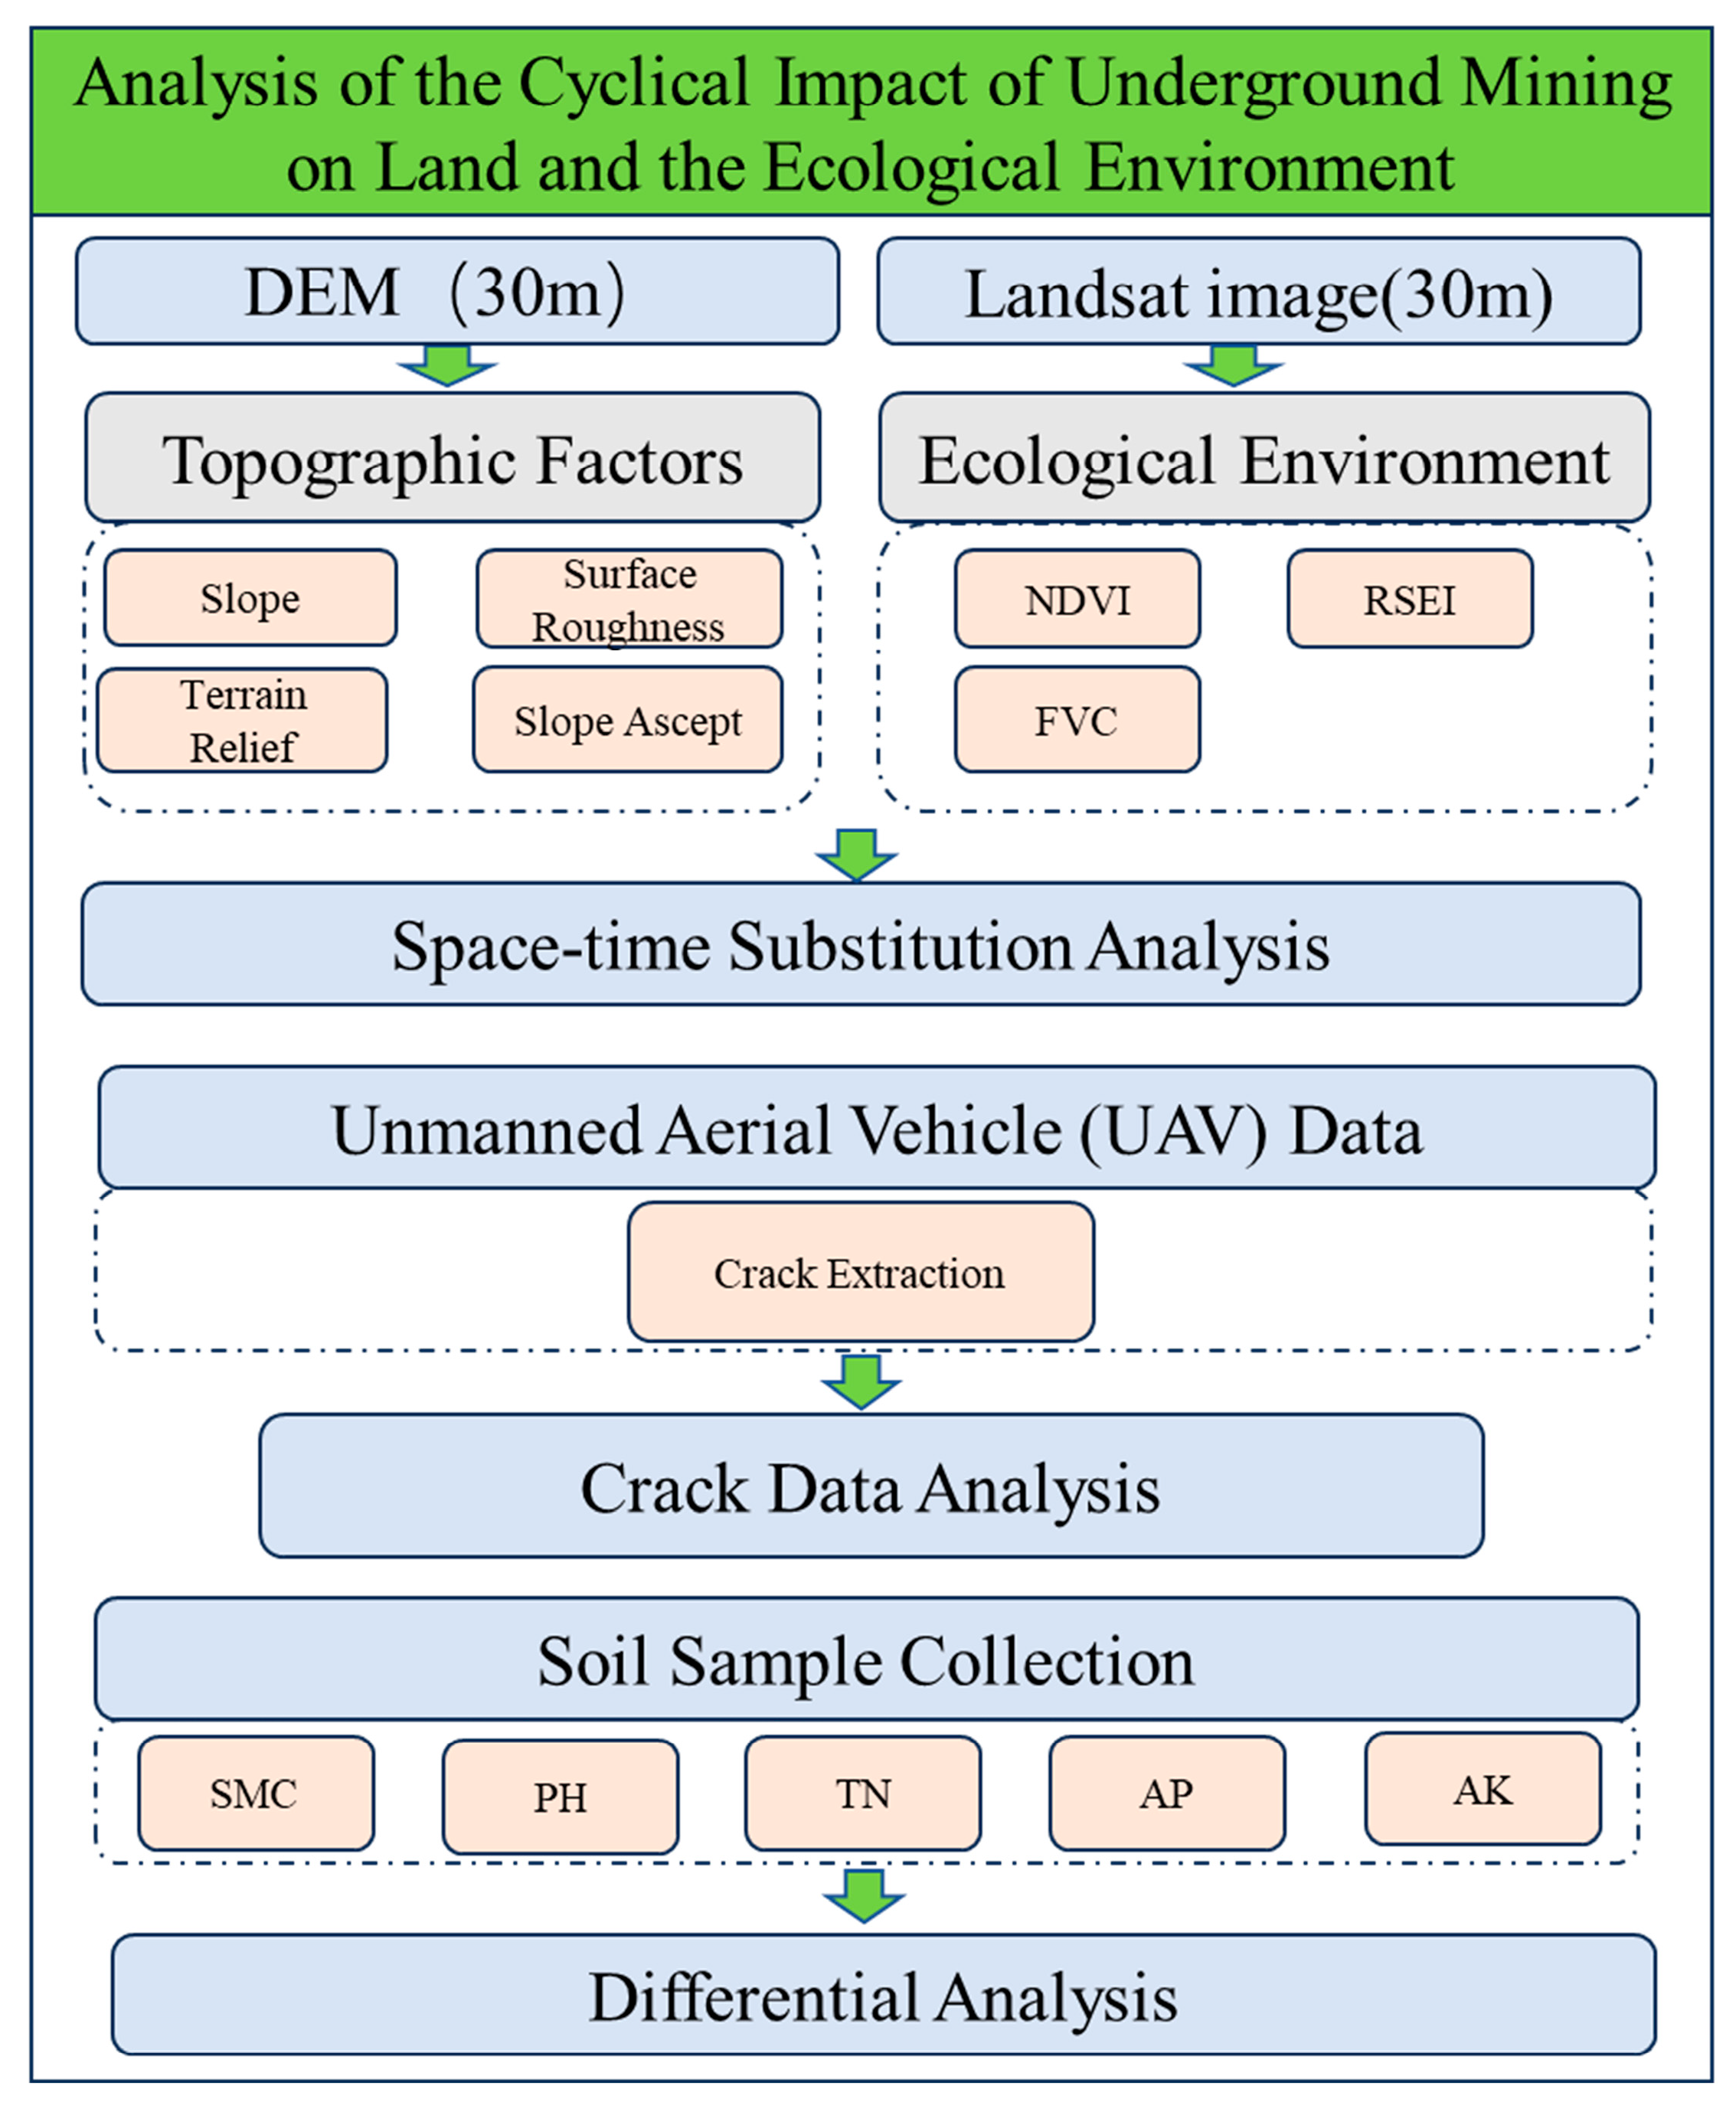
The research combined long-term sequences of remote sensing images, the results from UAV aerial photography, and onsite-collected soil data. This integrative method aims to preliminarily unveil the spatial distribution patterns of terrain features, as well as surface degradation, to evaluate the impacts caused by subsurface coal mining activities. Subsequently, a quantitative analysis of the periodic impact of coal mine shaft exploitation on the surface ecological environment was performed through the juxtaposition of long-term remote sensing data against the empirically collected information. The methodological framework of this study is depicted in Figure 2.

2.3.1. The Impact of Erlintu Coal Mine Exploitation on Topographic Factors

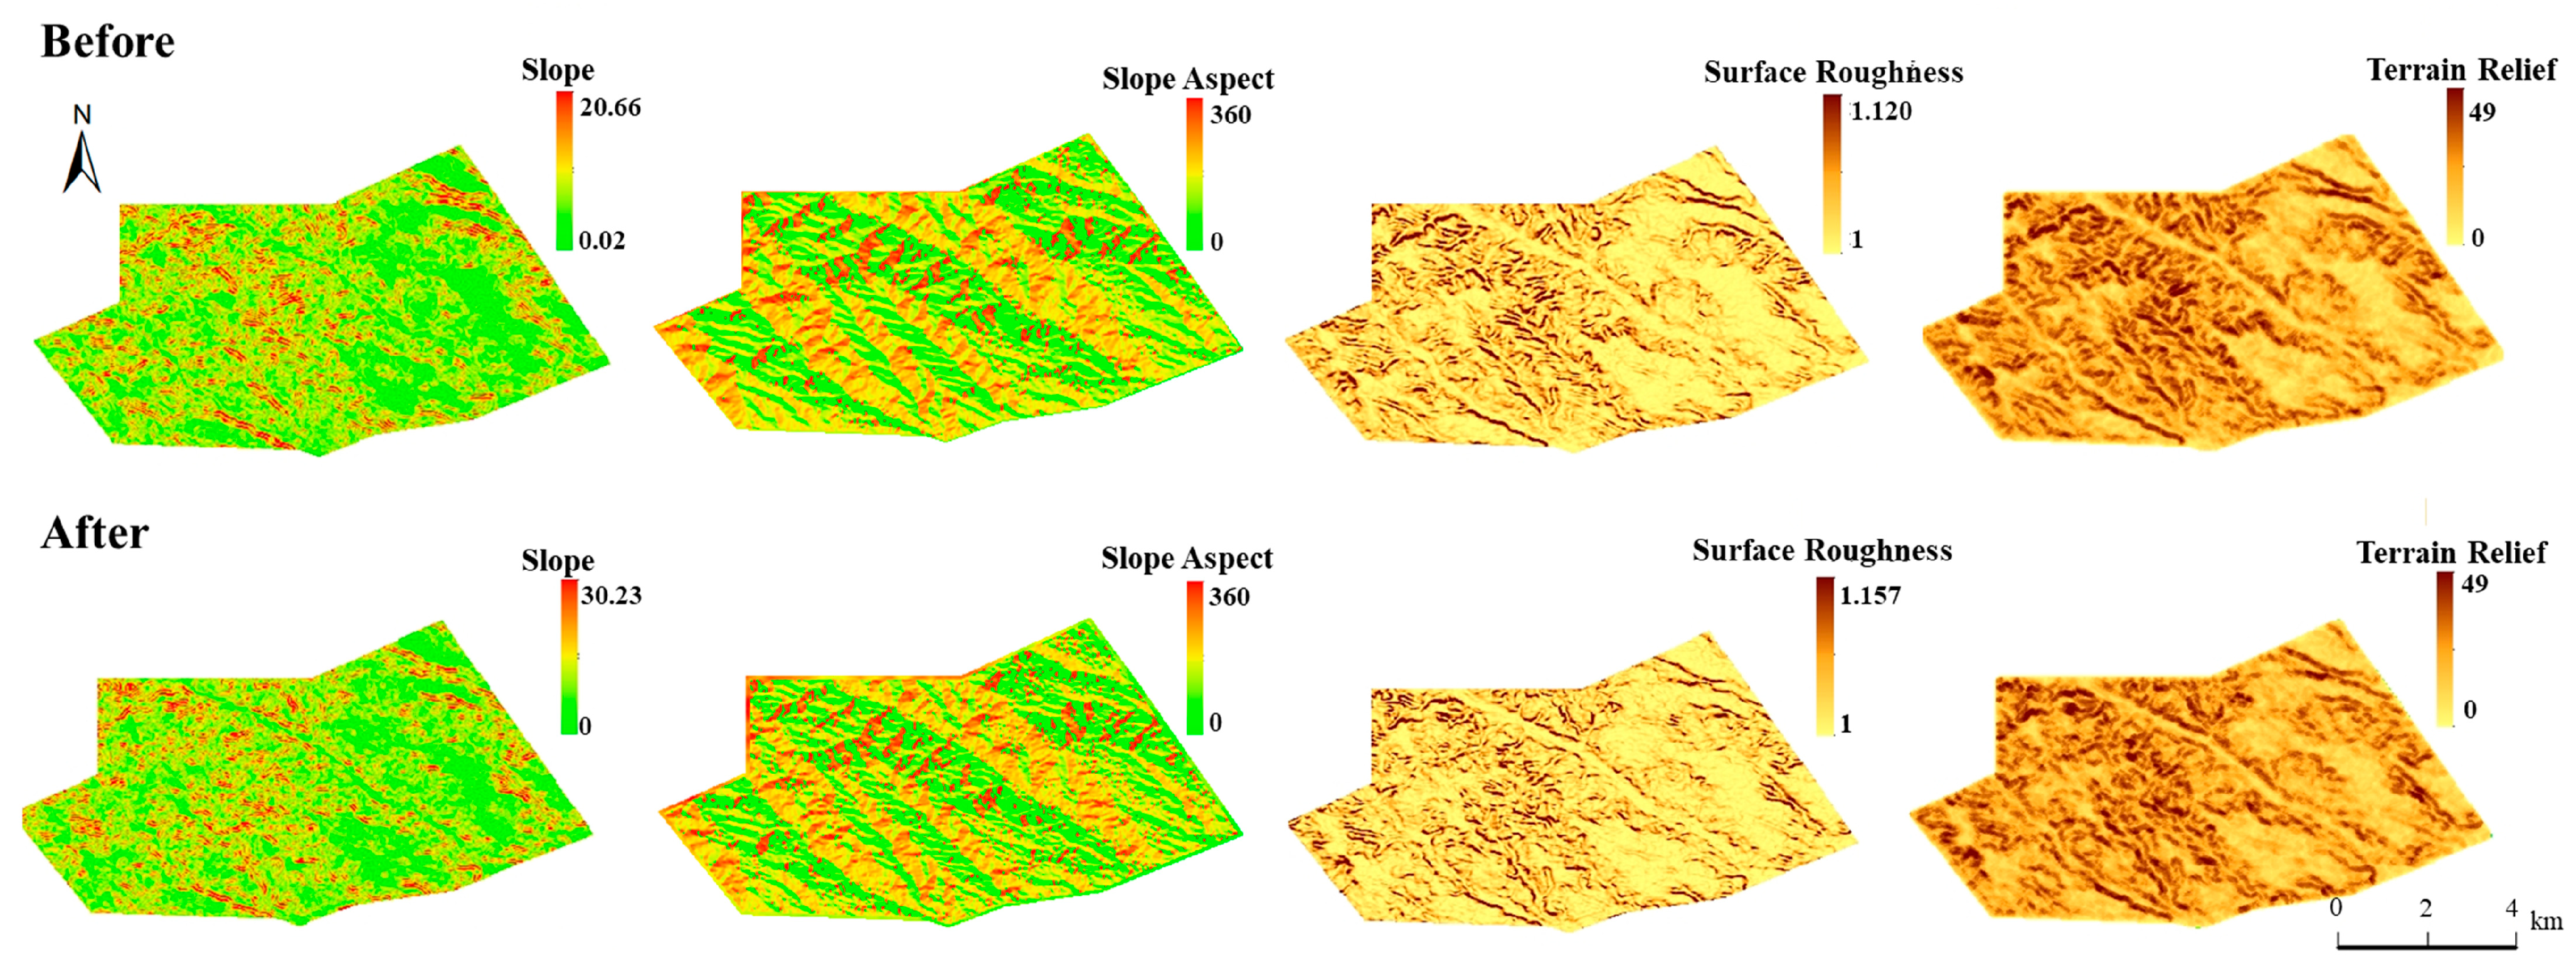
This study utilizes the pre-mining SRTM DEM and the 2022 UAV-derived DEM to compute slope, aspect, surface roughness, and topographic relief, which are pivotal indicators in comprehensive terrain analyses. These metrics, computed using ArcGIS 10.0 software, are employed to analyze the topographic changes in areas A1 and B1 before and after coal mining activities. Slope reflects the degree of soil and water loss, with steeper slopes generally being associated with more severe erosion. Additionally, varying slopes receive different amounts of solar radiation, influencing forest distribution. Slope is categorized into low (0–15°), medium (15–35°), and high (>35°) gradients. Aspect, indicating the direction of maximum slope variation, regulates soil temperature and moisture, primarily through sunlight exposure, leading to significant vegetation cover differences across aspects. Flat areas with slopes less than 3° are defined by their slope, with north as the 0° reference. Aspects are classified as sunny (157.5–337.5°), shady (0–157.5° and 337.5–360°), and flat. Surface roughness, indicative of terrain unevenness, significantly impacts environmental and ecological processes. Greater micro-relief and surface detail complexity facilitate soil water infiltration and habitat diversity. Terrain is classified by roughness into flat (1–1.02), low roughness (1.02–1.05), and high roughness (>1.05). Topographic relief describes the elevation variation between points, reflecting surface elevation differences and undulation. Terrain is categorized by relief into flat (0–2°), low relief (2–15°), and high relief (>15°).

2.3.2. Crack Extraction

The initial procedure segmented UAV imagery into 50 × 50-pixel sub-images. The derived datasets pinpointed the distinctions among bare earth, soil crust, and vegetation. In the subsequent phase, a training sample set was created from 400 selected images representing either the presence or absence of fissures, employing the RGB spectral values as distinguishing features. The fourth step exploited a machine learning scheme applying Support Vector Machine (SVM) [37] in conjunction with a dimensionality reduction through F-score feature selection [38]. This facilitated the dichotomous sorting of sub-images into cracked and intact categories. Model validation was executed using leave-one-out cross-validation and permutation tests [39] to ensure precision. In the fifth, cracks are extracted from the sub-images identified as containing them using thresholding techniques while the remaining sub-images undergo background processing by setting the RGB channels to zero, thus converting these sub-images into pure black backgrounds. Ultimately, the crack extraction results based on the 50 × 50-pixel sub-images are stitched together to yield the outcome of crack extraction from UAV imagery.

2.3.3. The Construction of NDVI, VFC, and RSEI

The NDVI is the most extensively employed index for the extraction of the biophysical properties of vegetation canopies in remote sensing applications, as it capitalizes on the spectral reflectance traits of vegetation, exhibiting high reflectivity in the near-infrared band and strong absorption in the red band [40,41,42]. VFC is quantified using the pixel dichotomy model, which postulates that the NDVI value for each pixel represents a blend of both vegetation and soil components [18,43]. The mathematical formulation for this estimation is outlined in Table 2. In this research, the shift in vegetation coverage is computed employing ArcGIS 10.0 software. The Google Earth Engine (GEE) platform is further utilized to compute the mean value of images that meet the specified criteria, captured annually between July and September. The mean function in GEE calculates the average value of pixel intensities across a collection of images, providing a single representative value for each pixel over the specified time period. Subsequently, the NDVI, VFC, and RSEI for that particular year were calculated based on this averaged imagery.
The RSEI [21] is an integrated ecological index based on remote sensing technology, using natural factors to evaluate the regional ecological state. It is derived from the NDVI, Wetness (WET), Normalized Differential Build-up and Bare Soil Index (NDBSI), and Land Surface Temperature (LST) and reflects the ecological environment quality. Its conceptual formula is as follows:
RSEI = f ( V NDVI , V wet , V LST , V NDBSI )
Within RSEI, NDVI can indicate how human activity affects ecological quality, while the LST and WET indices reflect the impact of natural environmental changes. As the typical range of NDVI, NDBSI, and WET values is [–1, 1] and the values of LST are generally larger, the indices must be normalized before RSEI computation. The formulas for computing WET, NDBSI, and LST are as detailed in Table 2:

2.3.4. Classification Method of Evolution Trend of VFC

The progression of the vegetation coverage is numerically established by the variable D, which signifies the difference in the VFC between an earlier year, denoted as (year j), and a subsequent year, indicated as (year i).
D = V F C i V F C j
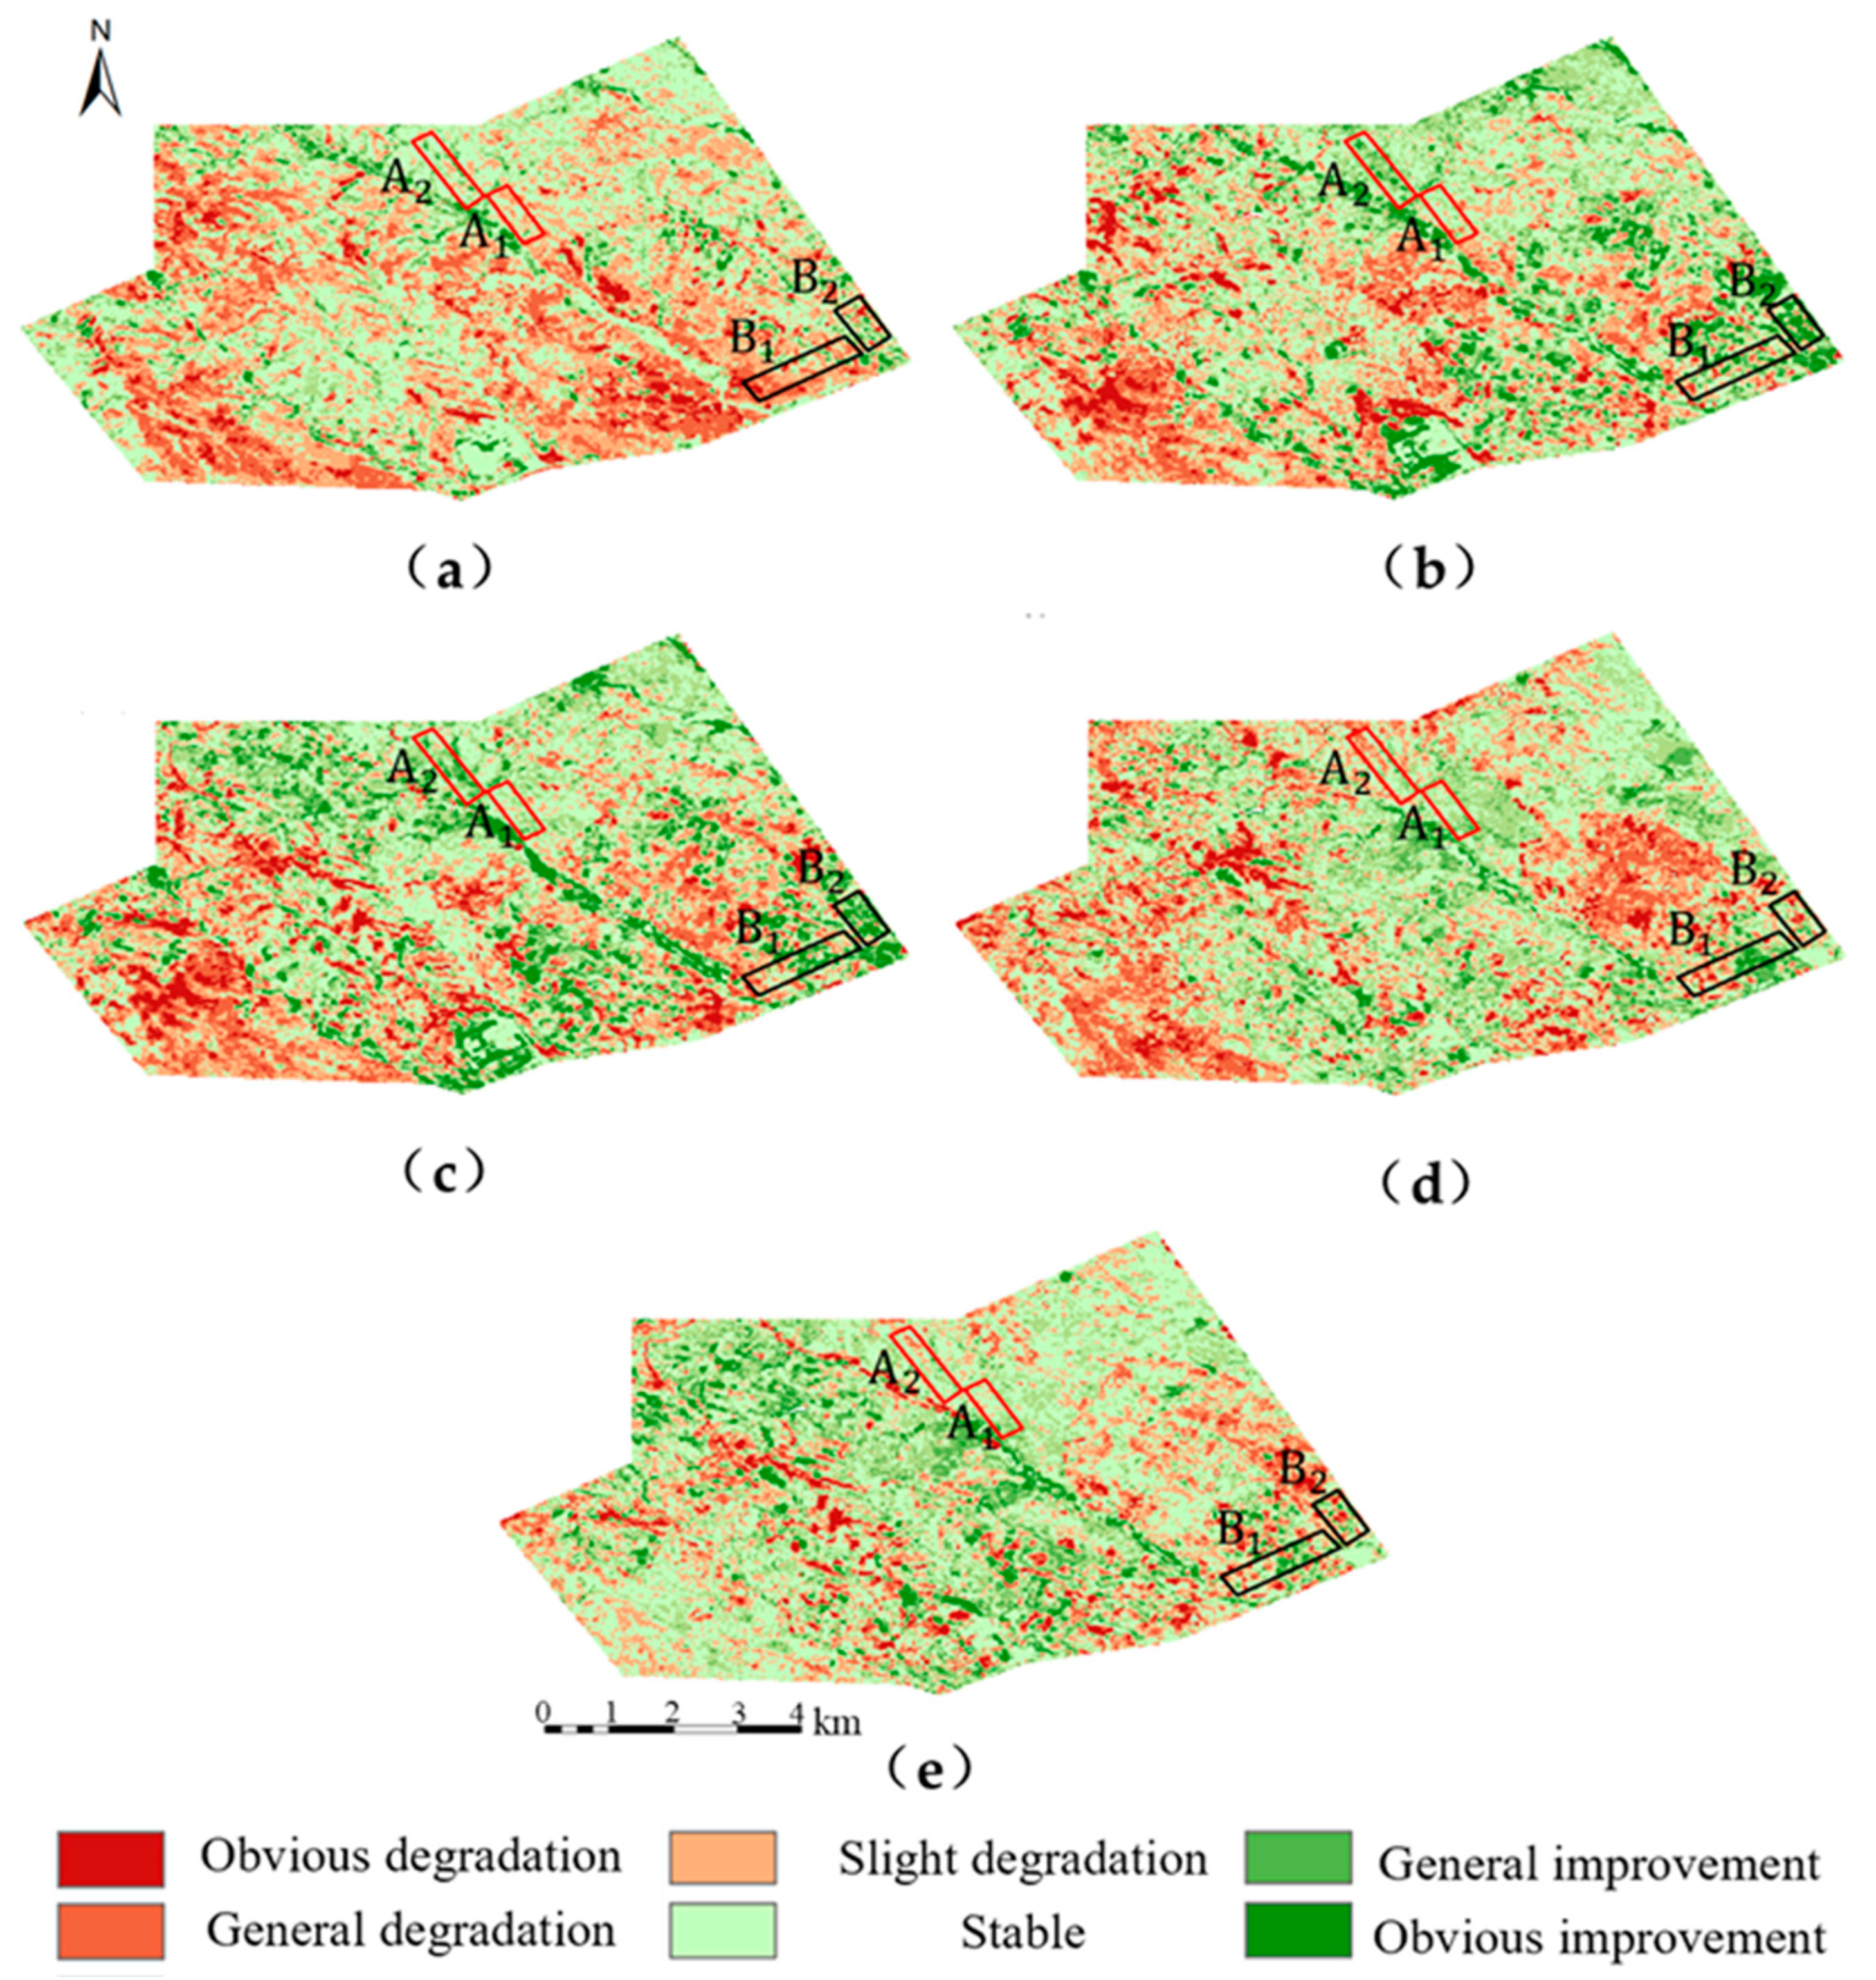
After performing grid calculations, the Reclassify tool in ArcGIS is utilized to aggregate contiguous areas sharing the same attribute values, thus enabling the generation of a dynamic evolution map for vegetation coverage within the study region. Thereafter, based on the updated attribute values, dynamic evolution is classified into seven categories, as outlined in Table 3, to depict the final trend of vegetation coverage evolution.

2.3.5. Collection and Detection of Soil Samples

In this study, we designed a systematic approach to soil sampling. To ensure comprehensive coverage of the diverse landforms within the experimental area, we established a serpentine network of soil sampling points at 10-meter intervals across the experimental zone. At each sampling location, we meticulously cleared away surface debris before collecting soil samples from depths ranging between 3 and 20 cm. Through this method, we amassed a total of 170 samples from soil layers extending from 0 to 20 cm. To create composite samples, we blended the soil gathered within an approximate radius of 50 m in each designated area, ensuring that each constituent sample was of equal weight. This procedure yielded 39 composite soil samples, with A1, A2, and B1 each comprising 10 samples, and B2 consisting of 9 samples. We identified SMC, pH, TN, AP, and AK as the pivotal soil parameters for our analysis. The specific detection methods for each parameter are outlined in Table 4.
Given that the sampled soils were from different landforms, it is possible that they are of different soil types. However, since all soil samples were collected from the same soil layer (0 to 20 cm deep) and analyzed for the same set of soil parameters, it can be assumed that these soil samples are comparable when considering the broader soil characteristics. That is to say, even if there are differences in soil types at a micro level, by analyzing the same set of key parameters, we can still compare the soil quality and fertility status of different samples to some extent.

3. Results

3.1. Periodic Impact of Erlintu Coal Mine Exploitation on Topographic Factors

The analysis factors used in this study, including slope, aspect, surface roughness, and terrain relief (Figure 3), were all derived from a Digital Elevation Model (DEM). Aspect raster maps created through surface analysis were subsequently reclassified.
Slope gradient analysis (Figure 4a) shows that, before mining, 95.17% of Area A1 had gentle slopes, indicating a mostly flat terrain. After mining, the proportion of gentle slopes rose to 97.25%, suggesting significant terrain smoothing due to mining activities. Moderately steep slopes decreased from 4.69% to 2.58%, while steep slopes saw a minimal increase from 0.14% to 0.17%.
Slope aspect analysis (Figure 4b) indicates a slight reduction in flat areas from 0.8% to 0.7% and an expansion of south-facing slopes from 47.82% to 48.52%. Conversely, north-facing slopes decreased from 51.38% to 50.78%.
Surface roughness analysis (Figure 4c) reveals a small increase in flat terrain from 28.01% to 28.32% and a slight decrease in low roughness areas from 63.47% to 63.43%. High roughness areas reduced from 8.52% to 8.25%, indicating a decrease in overall terrain roughness post-mining.
Terrain relief analysis (Figure 4d) shows a significant increase in flat regions from 0.34% to 0.68%, reflecting a reduction in surface undulations due to mining. Areas with low undulation slightly decreased from 36.21% to 36.04%, and high-undulation areas reduced from 63.45% to 63.28%.

3.2. Using UAVs to Monitor Ground Fissures and Ecological Recovery Processes in Mining Areas

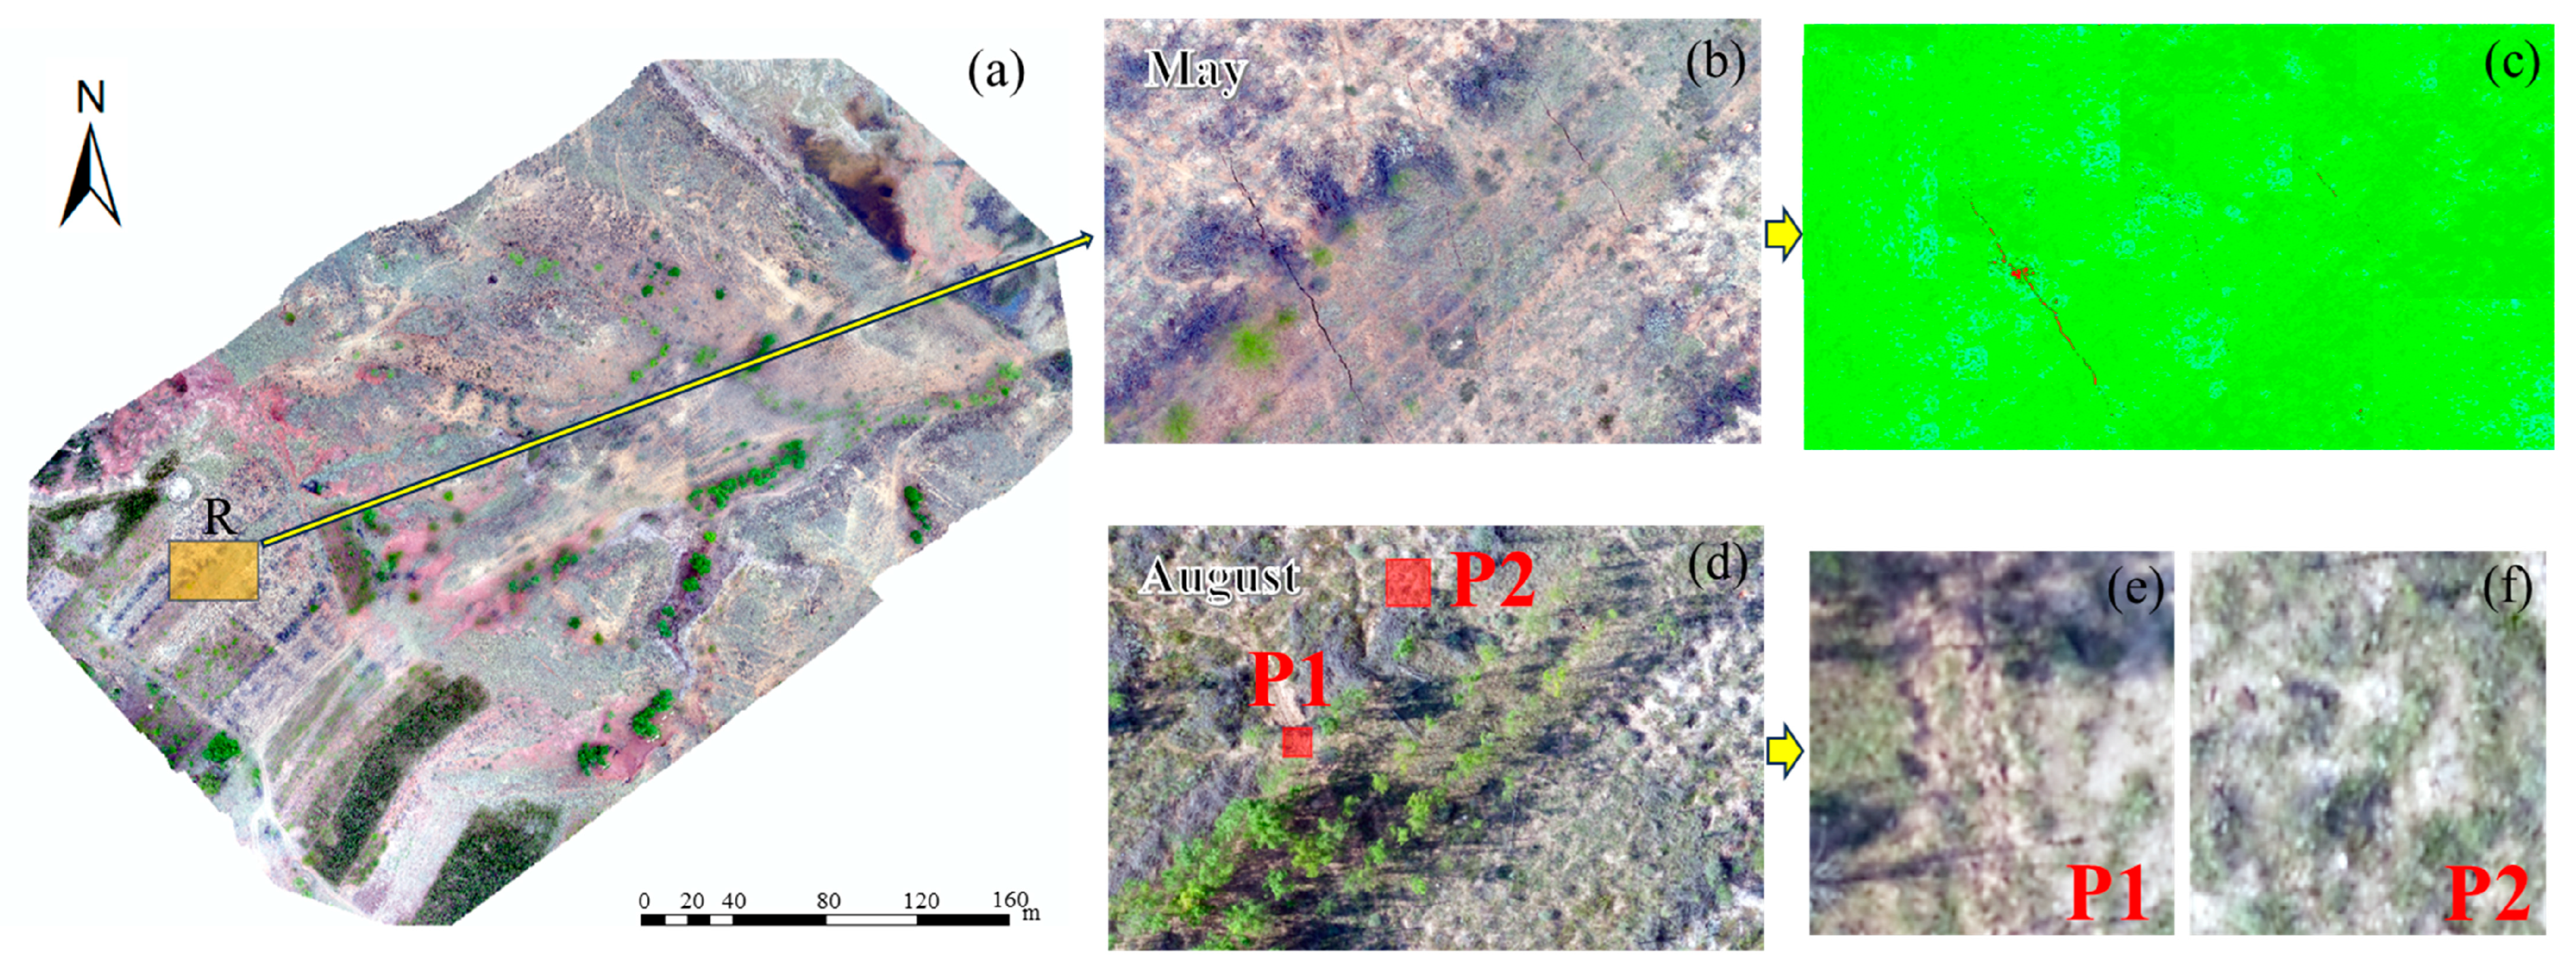
In May 2023, a considerable number of surface fractures resulting from underground mining activities were identified within the operational area of Zone C through the application of UAV (Figure 5). During the subsequent mining operations, these fractures did not exhibit natural self-healing. In August of the same year, we redeployed UAVs to collect data from the regions affected by mining disturbances. Smaller fractures had achieved a state of environmental congruence with their surroundings within a period of several months. However, for regions with larger fractures, despite the application of filling treatments, these areas had not yet attained a state of environmental consistency with their surroundings within the short-term timeframe.
Figure 6 illustrates the fissure extraction process in the mining-disturbed area in the year 2014. This area represents the pre-consolidation mining face of the Erlintu coal mine and did not undergo any ecological restoration, such as fissure infilling, after the mining disturbance. The persistent presence of numerous fissures upon extraction indicates that, even eight years after experiencing mining-induced disturbances and under natural conditions, the fissures had not significantly healed.

3.3. Assessing Vegetation Dynamics in Response to Mining Activities through Satellite Imagery

3.3.1. Analysis of NDVI Variations in the Trial Region

Landsat imagery captured between the months of July and September from 2013 to 2022 was procured for analysis. The average NDVI values for the trial regions A1, A2, B1, and B2 were compiled and are presented in Figure 7.
The NDVI time series indicates that, from 2013 to 2014, the NDVI value in Area A1 increased from 0.39 to 0.44, suggesting a favorable vegetation condition at the beginning of the year. Following the mining disturbance in 2014, the NDVI value in Area A1 dropped to 0.38 in 2015, indicating a significant impact of mining activities on the vegetation in the area. In 2016, the NDVI value in Area A1 increased, which coincided with the afforestation activities conducted that year. However, the decline in NDVI values in 2017 suggests that the initial effectiveness of ecological restoration was not sustained. Subsequently, the vegetation cover showed a trend of fluctuating increases followed by decreases, and then a significant rise followed by a drop to near-2019 levels between 2019 and 2020. There was another significant growth in NDVI values in 2021 and 2022, with Area A1 exhibiting a more pronounced fluctuation compared to Area A2.
Prior to the mining disturbance in 2019, the NDVI value in Area B1 showed a year-on-year growth. This reflects the natural growth of vegetation and the inter-annual variations in the area. After the mining disturbance in 2019, the NDVI value in Area B1 significantly decreased, but the NDVI value in Area B2 also experienced a noticeable decline, with both areas showing similar magnitudes of decrease. This suggests that the phenomenon may be due to fluctuations in climate. In 2020, the NDVI value in Area B1 showed signs of recovery, indicating the beginning of vegetation restoration. The subsequent decline in NDVI value in Area B1 in 2021 suggests instability in the ecological restoration process or possibly the influence of other environmental stress factors in the region, such as fluctuations in climatic conditions. In 2022, the NDVI value rose again to a level close to that of 2018, indicating further consolidation of the vegetation recovery trend.

3.3.2. Analysis of Changes in VFC in the Trial Region

As shown in Figure 8, for Area A1, which was mined in 2014, the vegetation cover of 2013 prior to the mining disturbance was selected as the baseline to track the evolution of vegetation at 1 year, 4 years, and 8 years post-disturbance. In Area B1, mined in 2019, the baseline was established using the vegetation cover from 2018, before the mining disturbance, and assessments were made of the vegetation evolution at 1 year and 3 years after the disturbance.
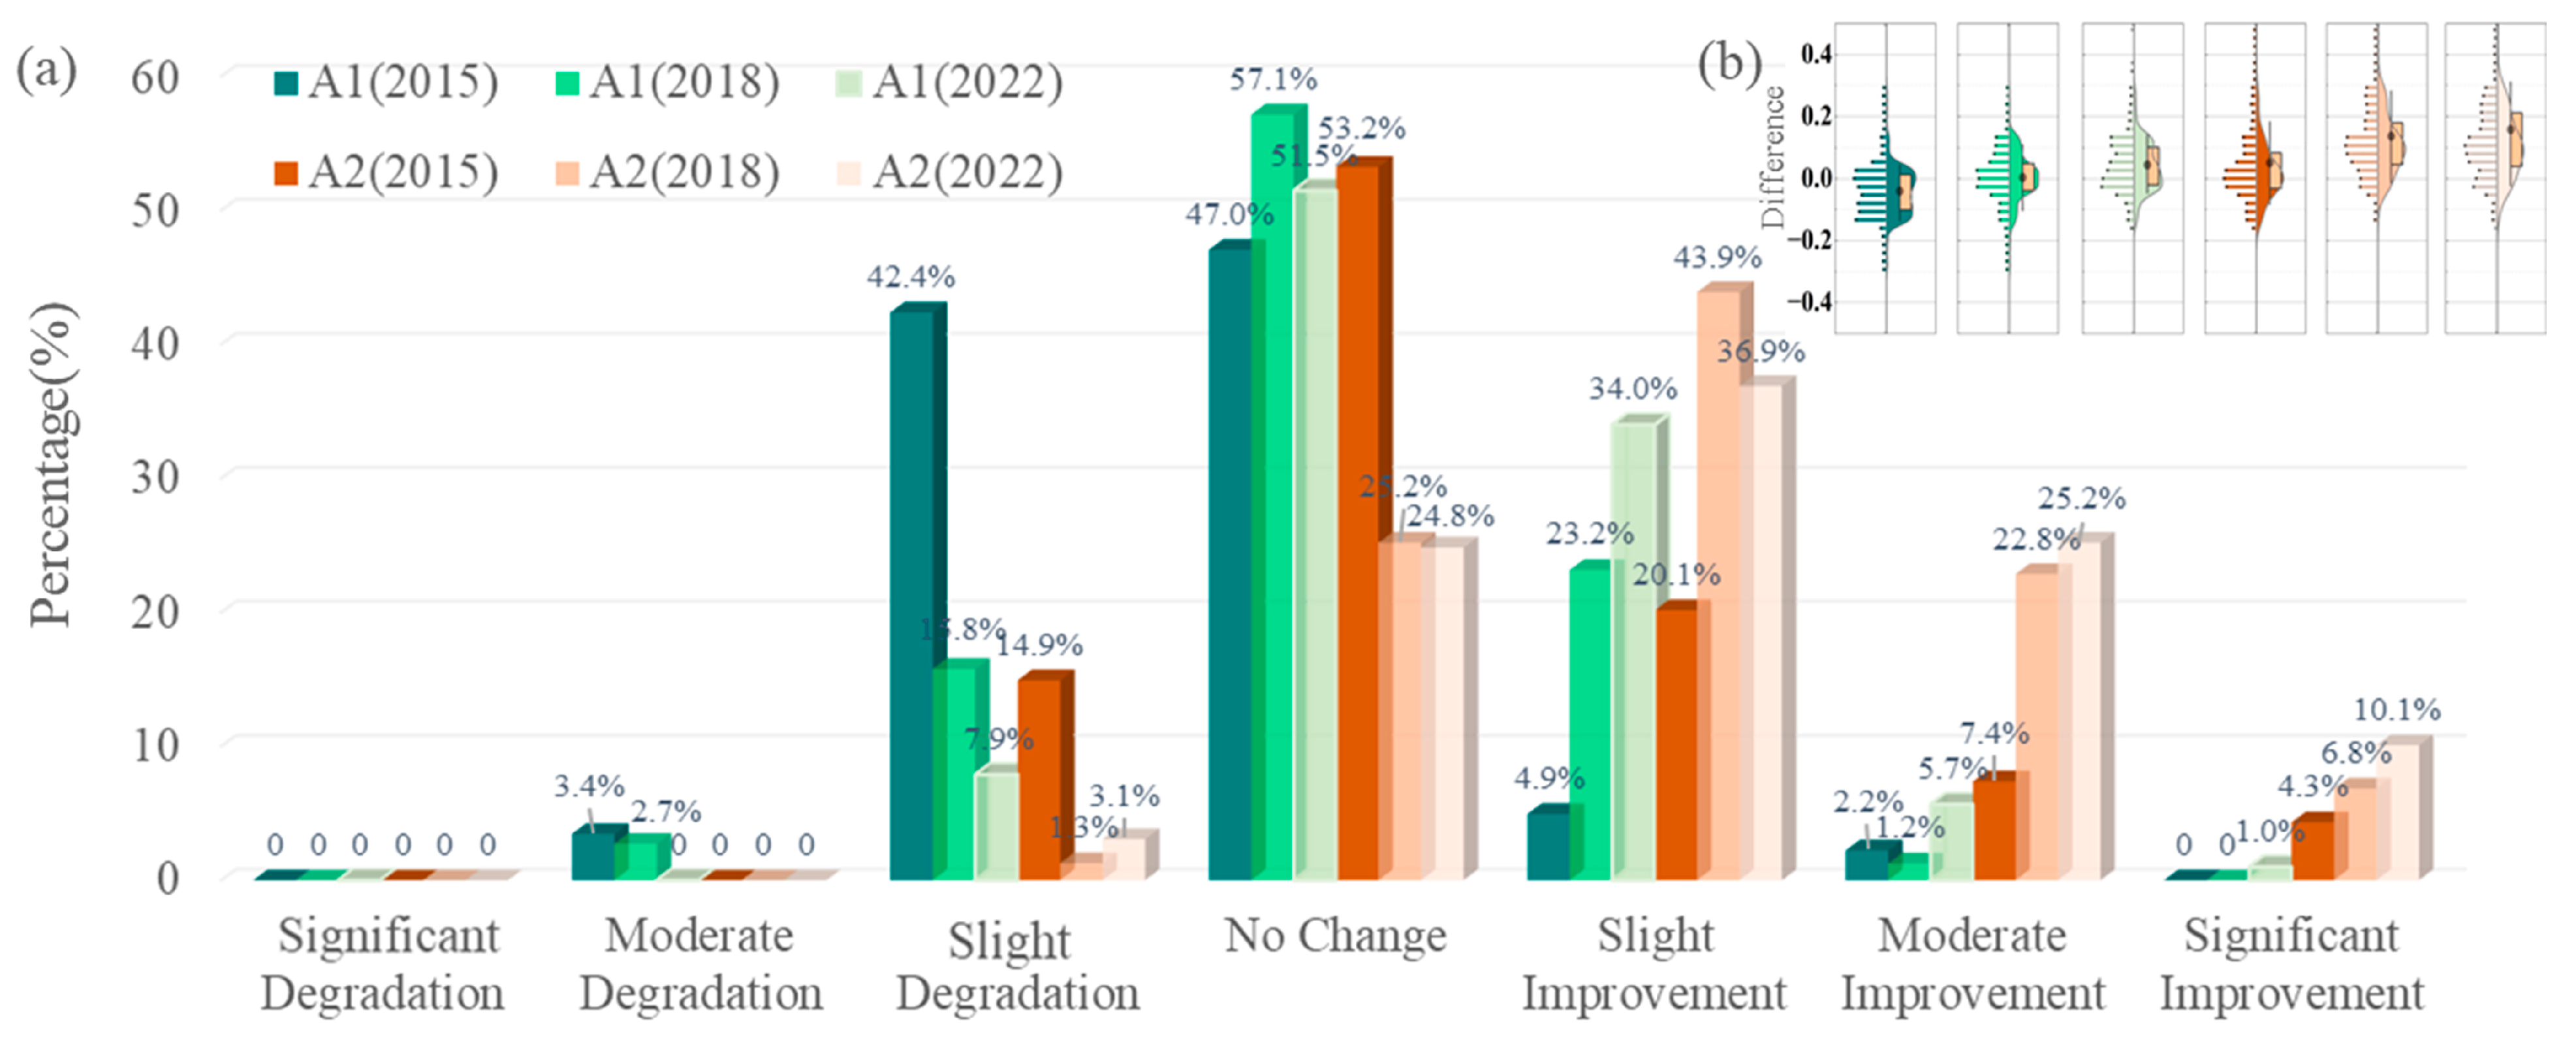
As shown in Figure 9, in the year 2015, following the mining disturbance, 42.4% of the area in A1 experienced a slight vegetation degradation, while only 14.9% of A2 showed a slight degradation. However, only 3.4% of A1 showed moderate degradation and no significant degradation. A2 showed no moderate or significant degradation. A total of 47.0% of A1 showed no change, and 53.2% of A2 showed no change, with a relatively small difference in the proportion of no change areas between the two. A1 saw a slight improvement in only 4.9% of its area, with 2.2% showing moderate improvement and no significant improvement, while the undisturbed area showed a slight improvement in 20.1% of the total area, moderate improvement in 7.4%, and significant improvement in 4.3%.
In the year 2018, four years after the mining disturbance, the area in A1 with slight degradation significantly decreased from 42.4% to 15.8%. The stable area increased from 47.0% to 57.1%, and the area with slight improvement rose from 4.9% to 23.2%. The vegetation in A1 showed an overall improvement, with the proportion of no change areas surpassing that of A2. The vegetation in A2 also showed an overall improvement, but there was a significant difference in the area with slight improvement, with 23.2% of the disturbed area showing a slight improvement and 43.9% of A2.
In the year 2022, eight years after the disturbance, only 7.9% of A1 showed degradation, with no significant or moderate degradation being observed. The area with slight improvement increased from 23.2% to 34.0%, showing a significant increase. The area with moderate improvement rose from 1.23% to 5.60%, and there was a significant 1% improvement. Overall, A1 surpassed its pre-mining vegetation coverage level, but still lagged significantly behind A2 in terms of moderate and significant improvements.
As shown in Figure 10, in the year 2020, following the mining disturbance, Area B1 did not experience significant degradation compared to Area B2. The proportions of significant and moderate degradation were slightly lower than those observed in the control area. The proportion of slight degradation was 20.5%, which was marginally higher than the control area’s 19.1%. The proportion of slight degradation was 20.5%, marginally higher than the control area’s 19.1%. The proportion of no change areas within the disturbed zone was 20.8%, significantly lower than the control area’s 36.0%. However, the proportions of moderate and significant improvement were notably higher than those in Area B2. The vegetation coverage changes from 2020 to 2022 showed that the proportion of improved vegetation coverage in the disturbed area was higher than that in the control area.
In the year 2022, three years after the mining disturbance, the vegetation coverage of Area B1 and Area B2 exhibited significant degradation, with proportions of moderate, slight, and significant degradation all higher than those in B1. The proportions of no change areas, as well as those with slight, moderate, and significant improvement, were slightly lower in B2 compared to B1.

3.3.3. Analysis of RSEI Variations in the Erlintu Coal Mine-Affected Area

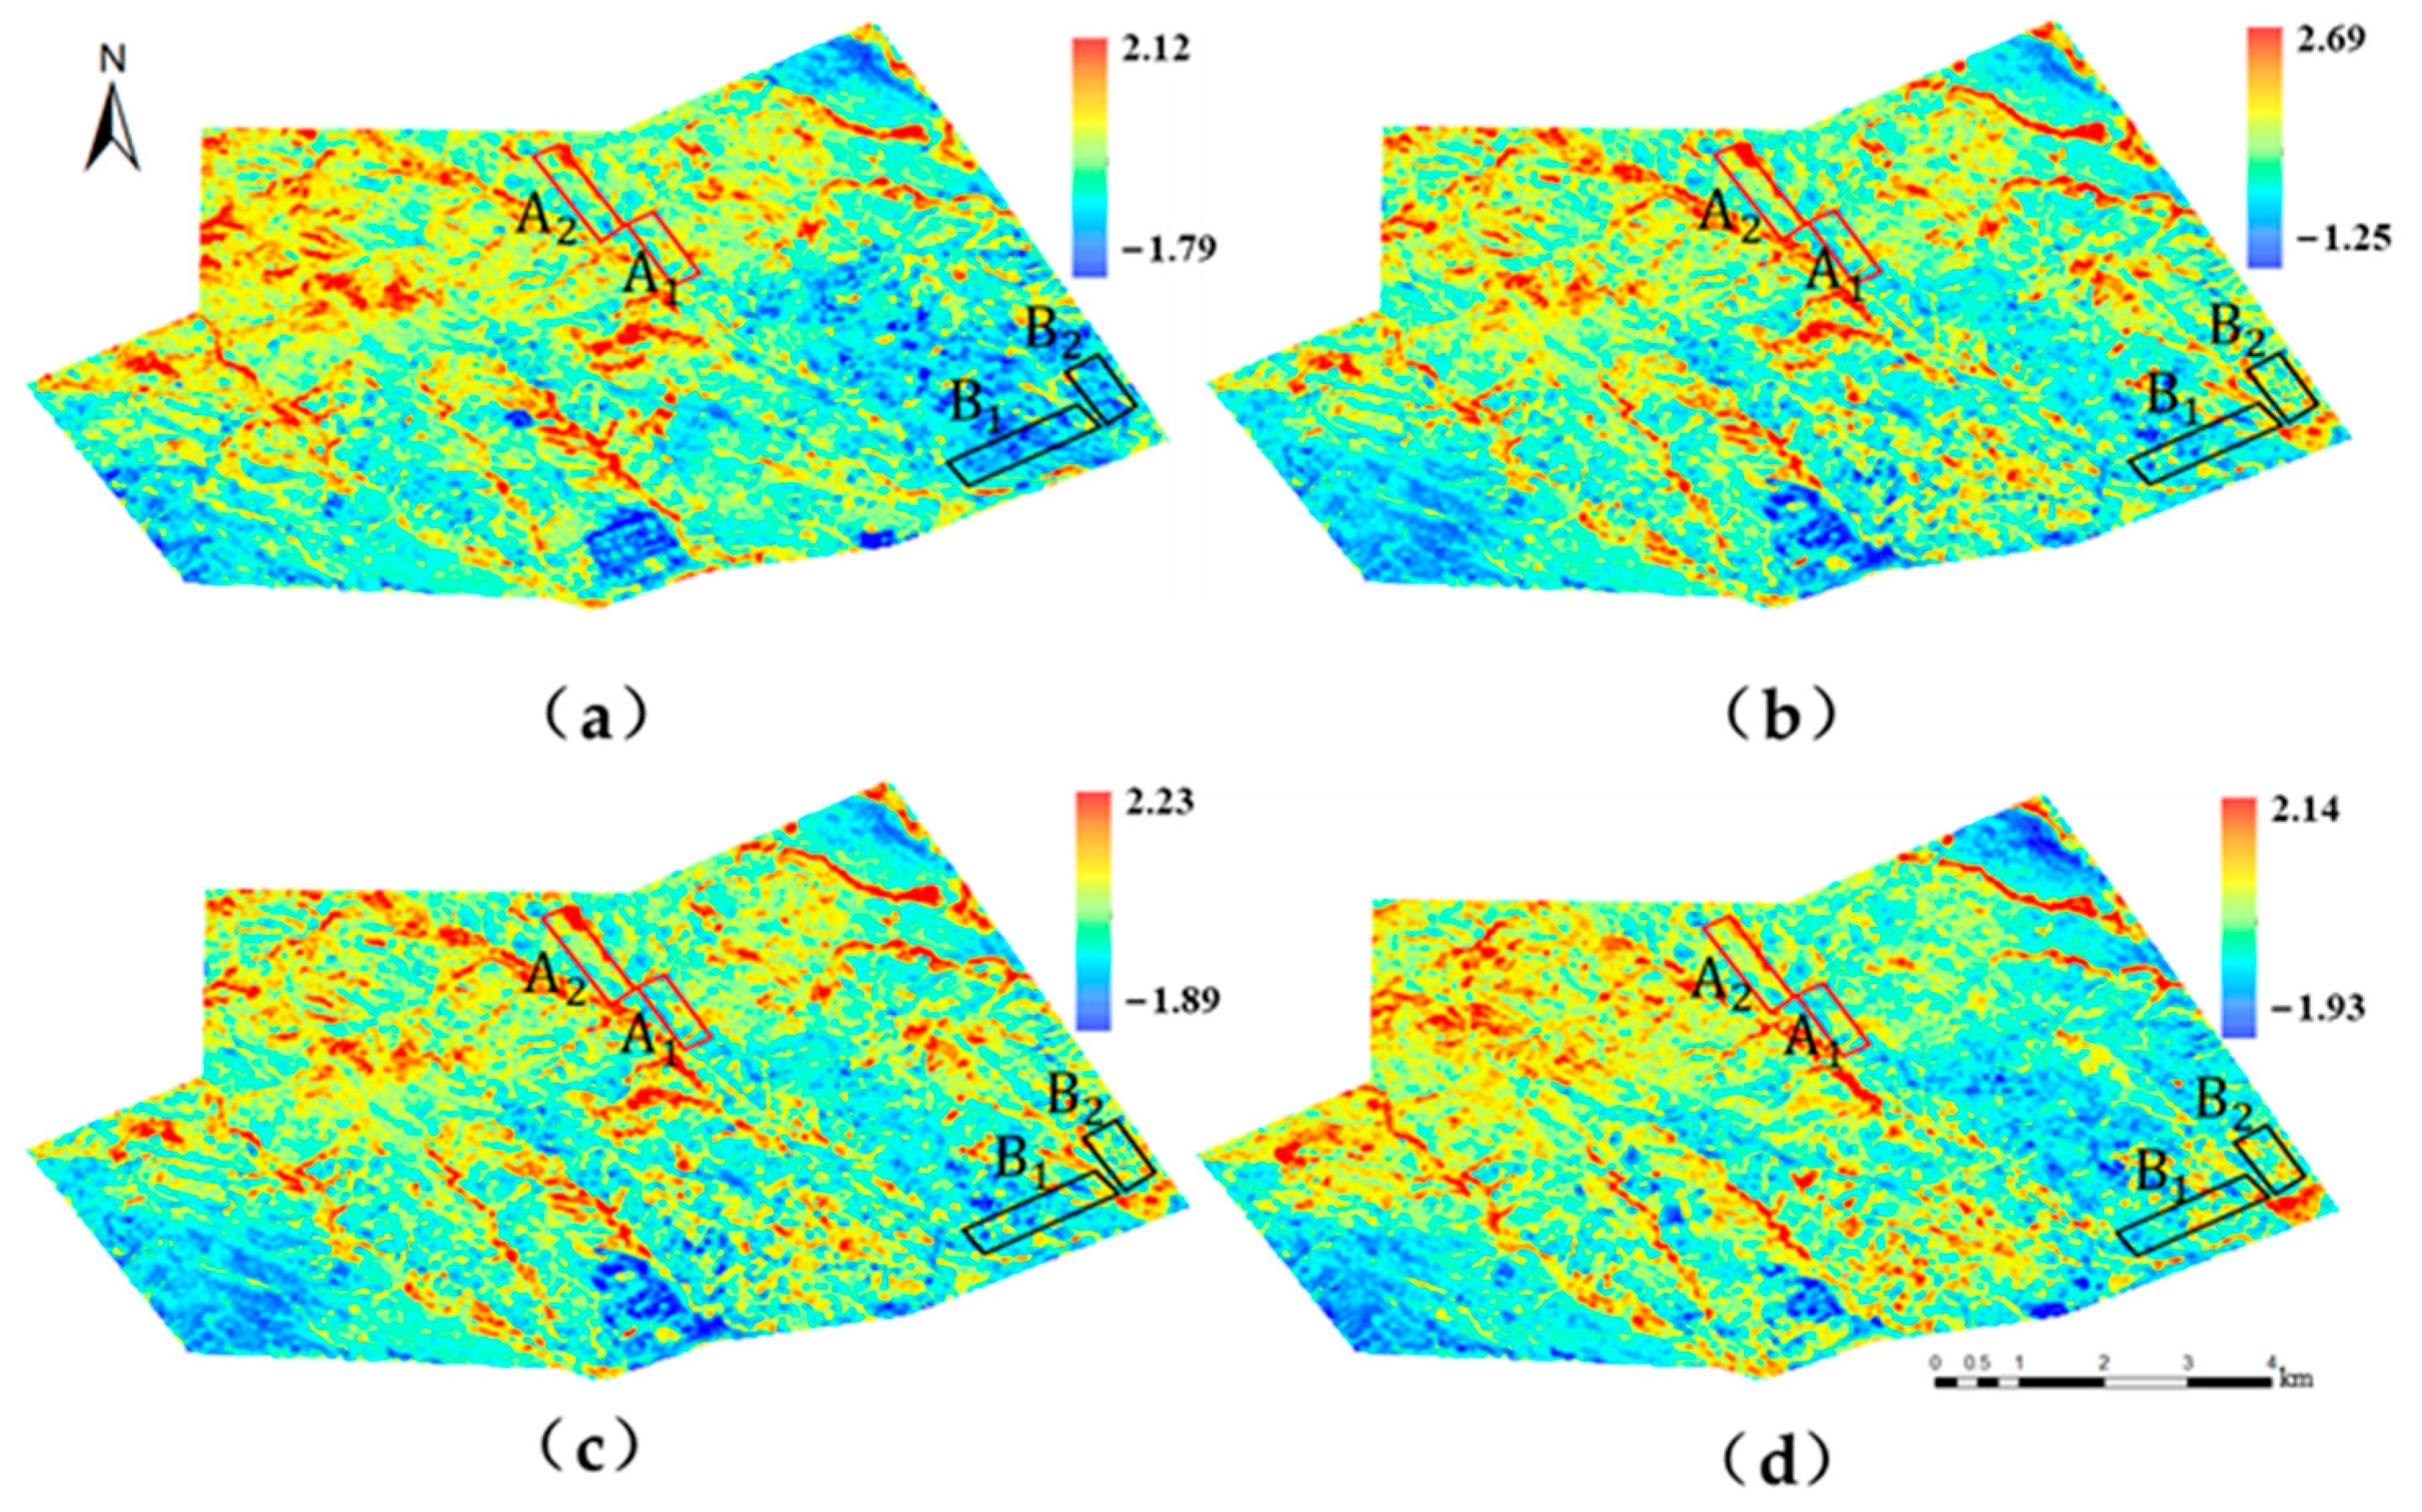
For the A1 region, which commenced mining in 2014, data from 1, 4, and 8 years post-mining disturbance were selected, corresponding to the years 2015, 2018, and 2022, respectively. In the B1 region, which began mining operations in 2019, remote sensing data from 1 and 3 years after the mining disturbance were chosen for the calculation of RSEI values. To ensure comparability across different years and to account for local vegetation growth cycles, this study focused on computing the RSEI values using data from June to September. The results are displayed in Figure 11.
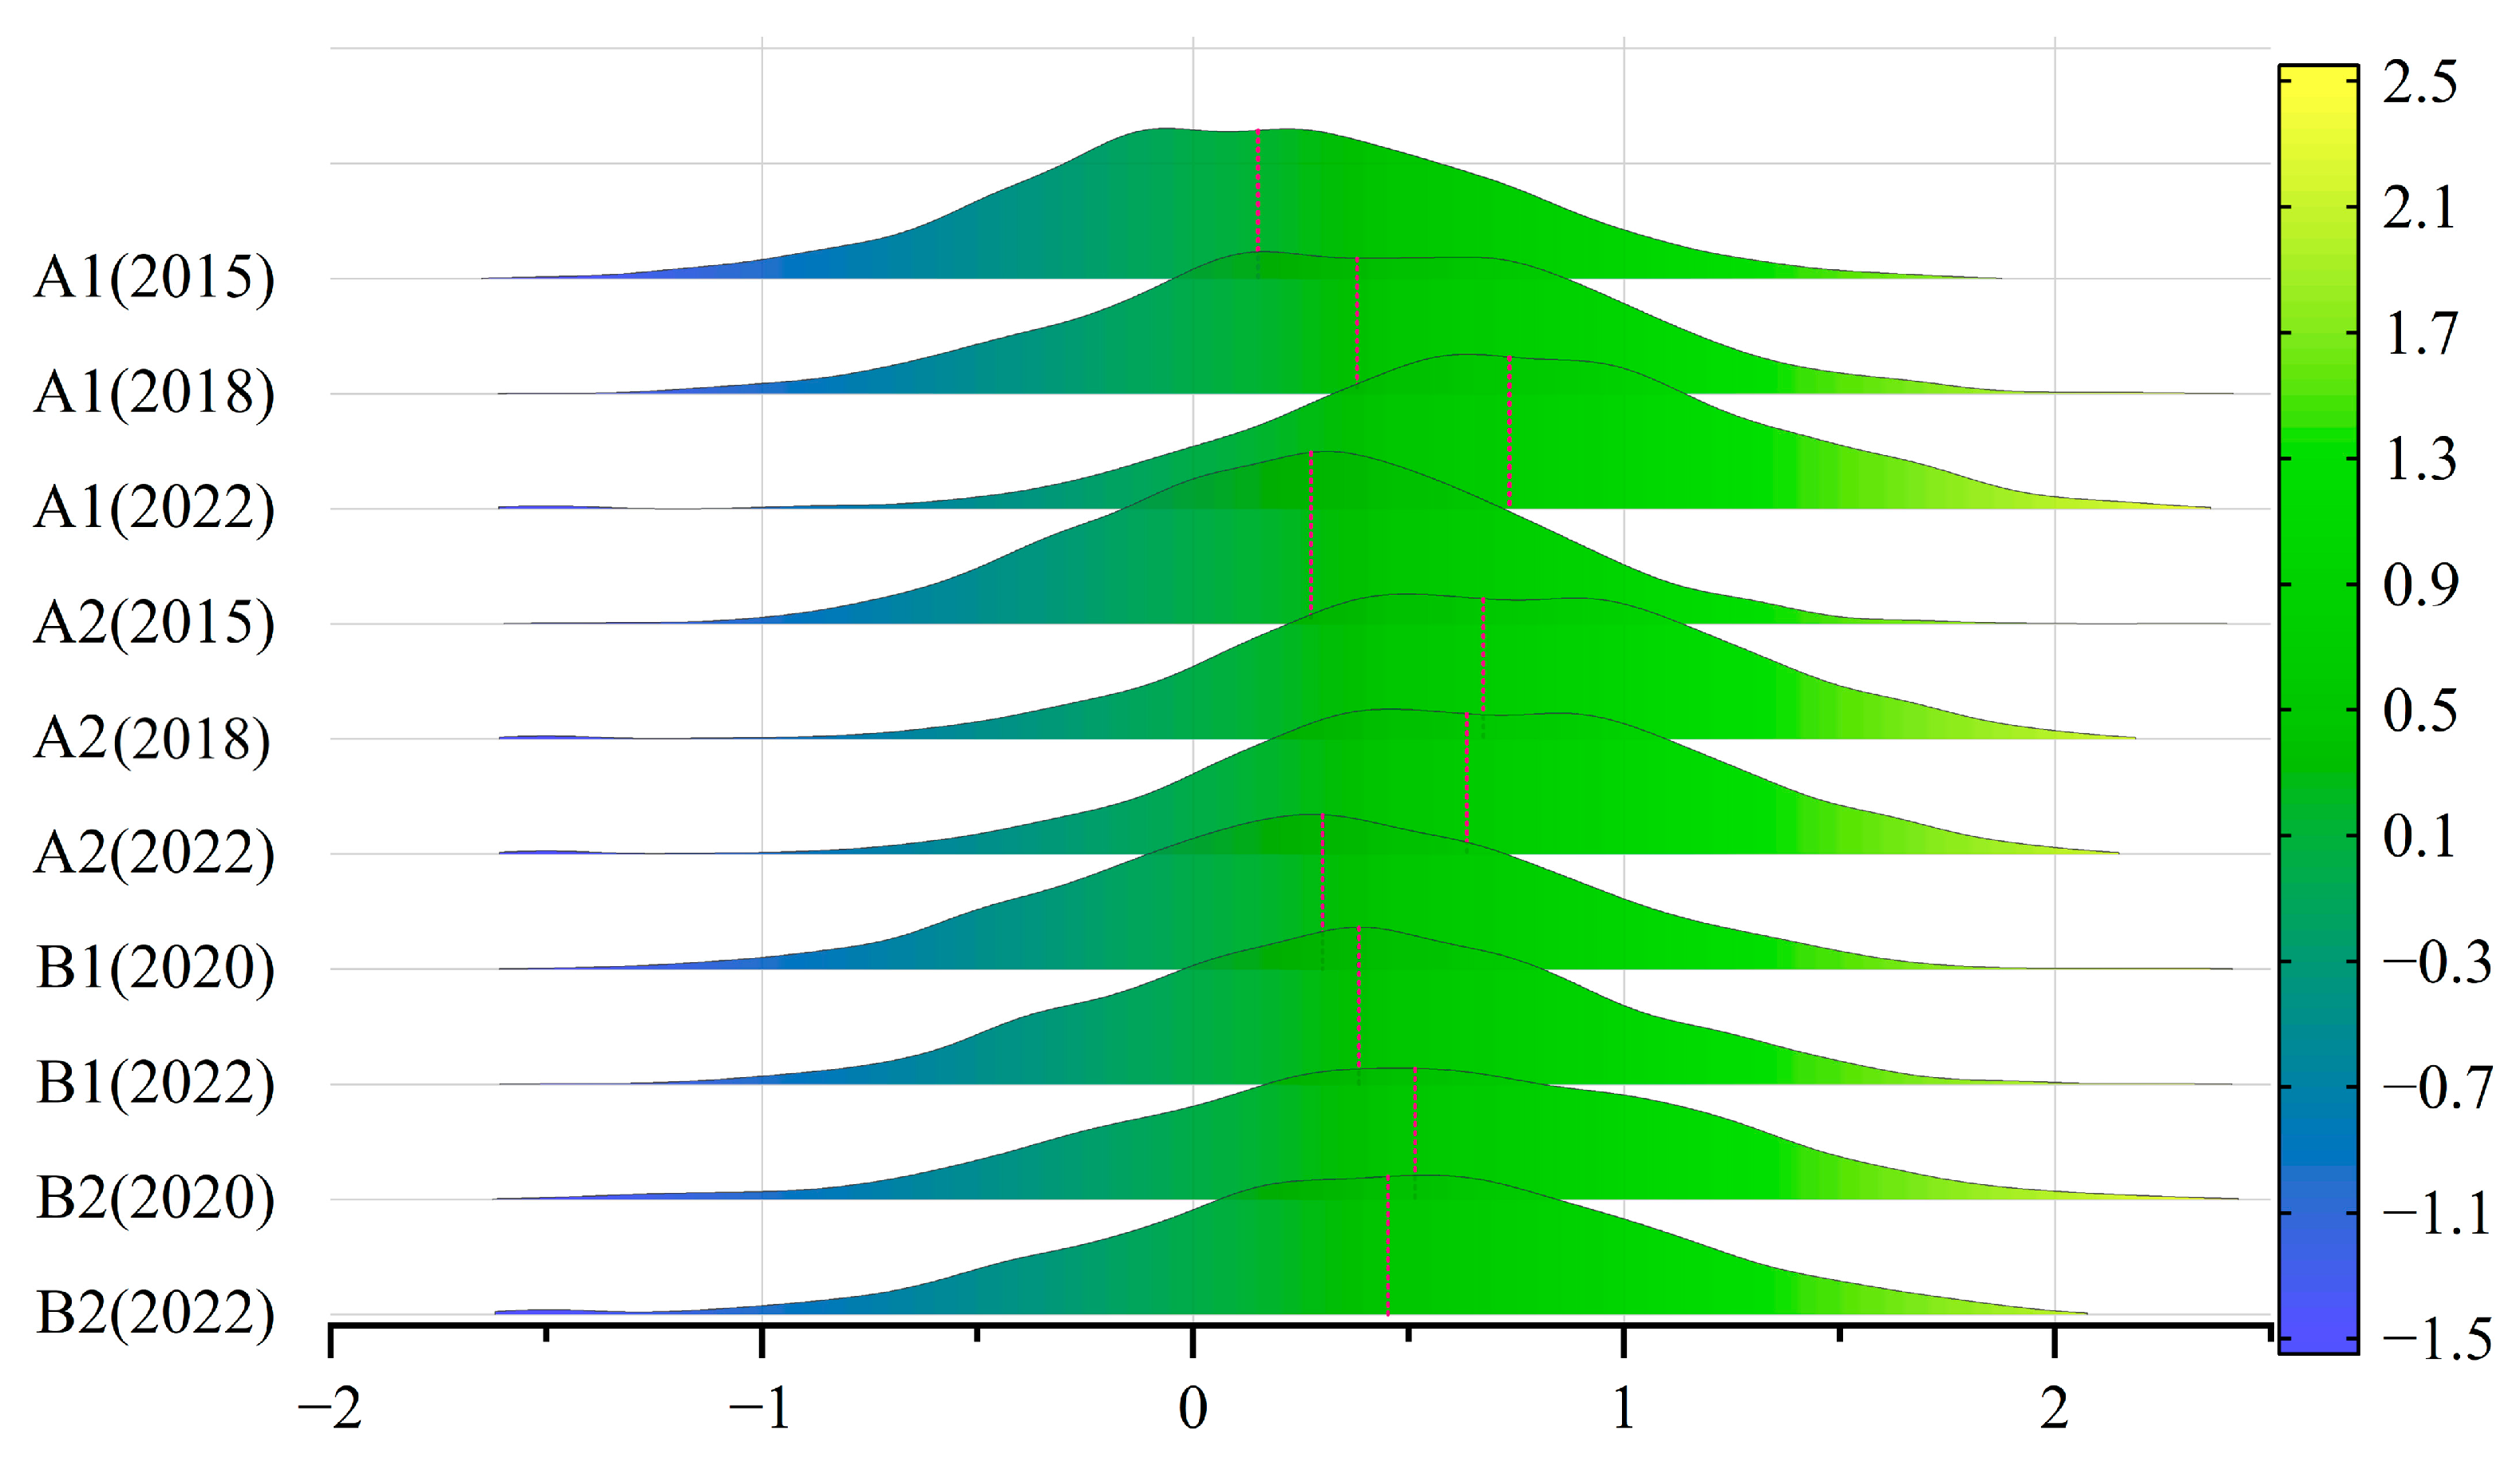
Upon calculation of the RSEI, a statistical analysis was conducted of the RSEI values for each pixel within the test areas. The results of this analysis are presented in Figure 12.
The statistical analysis of the RSEI values for selected mining areas provided significant insights into the ecological impacts of extraction activities and the subsequent restoration efforts. In Area A1, the average RSEI value recorded one year after the mining disturbance in 2014 was 0.15. This value significantly increased to 0.37 by 2018 and further improved to 0.74 by 2022, demonstrating a clear trajectory of ecological improvement due to reforestation and other restoration measures. In Area B1, which experienced a disturbance in 2019, the RSEI value slightly increased from 0.30 in 2020 to 0.38 in 2022. This suggests that restoration efforts such as fracture infilling and grass seeding, although having a modest immediate impact, may provide long-term benefits for soil stability and vegetation recovery. The undisturbed control area, A2, observed a peak in 2018 followed by a slight decline, likely reflecting natural vegetation cycles and environmental changes. Area B2 showed a slight decrease.

3.4. Impact Characteristics of Coal Shaft Mining on Soil’s Physicochemical Properties

In accordance with the soil physicochemical properties grading criteria provided in the literature [53,54], we conducted a detailed statistical analysis of the soil samples from the trial region and categorized the results based on the standards. The specific data presented in Table 5 reveal that AP is predominantly extremely deficient, while AK ranges from mostly deficient to moderately deficient, and TN is concentrated in the deficient range. The soil pH values are mainly in the alkaline to strongly alkaline range, and SMC is mostly at a moderate drought level. Overall, soil fertility grades in the area are low, the land is alkaline, and the surface moisture content is low, all of which adversely affect the vegetation cover and the soil ecosystem in the region.
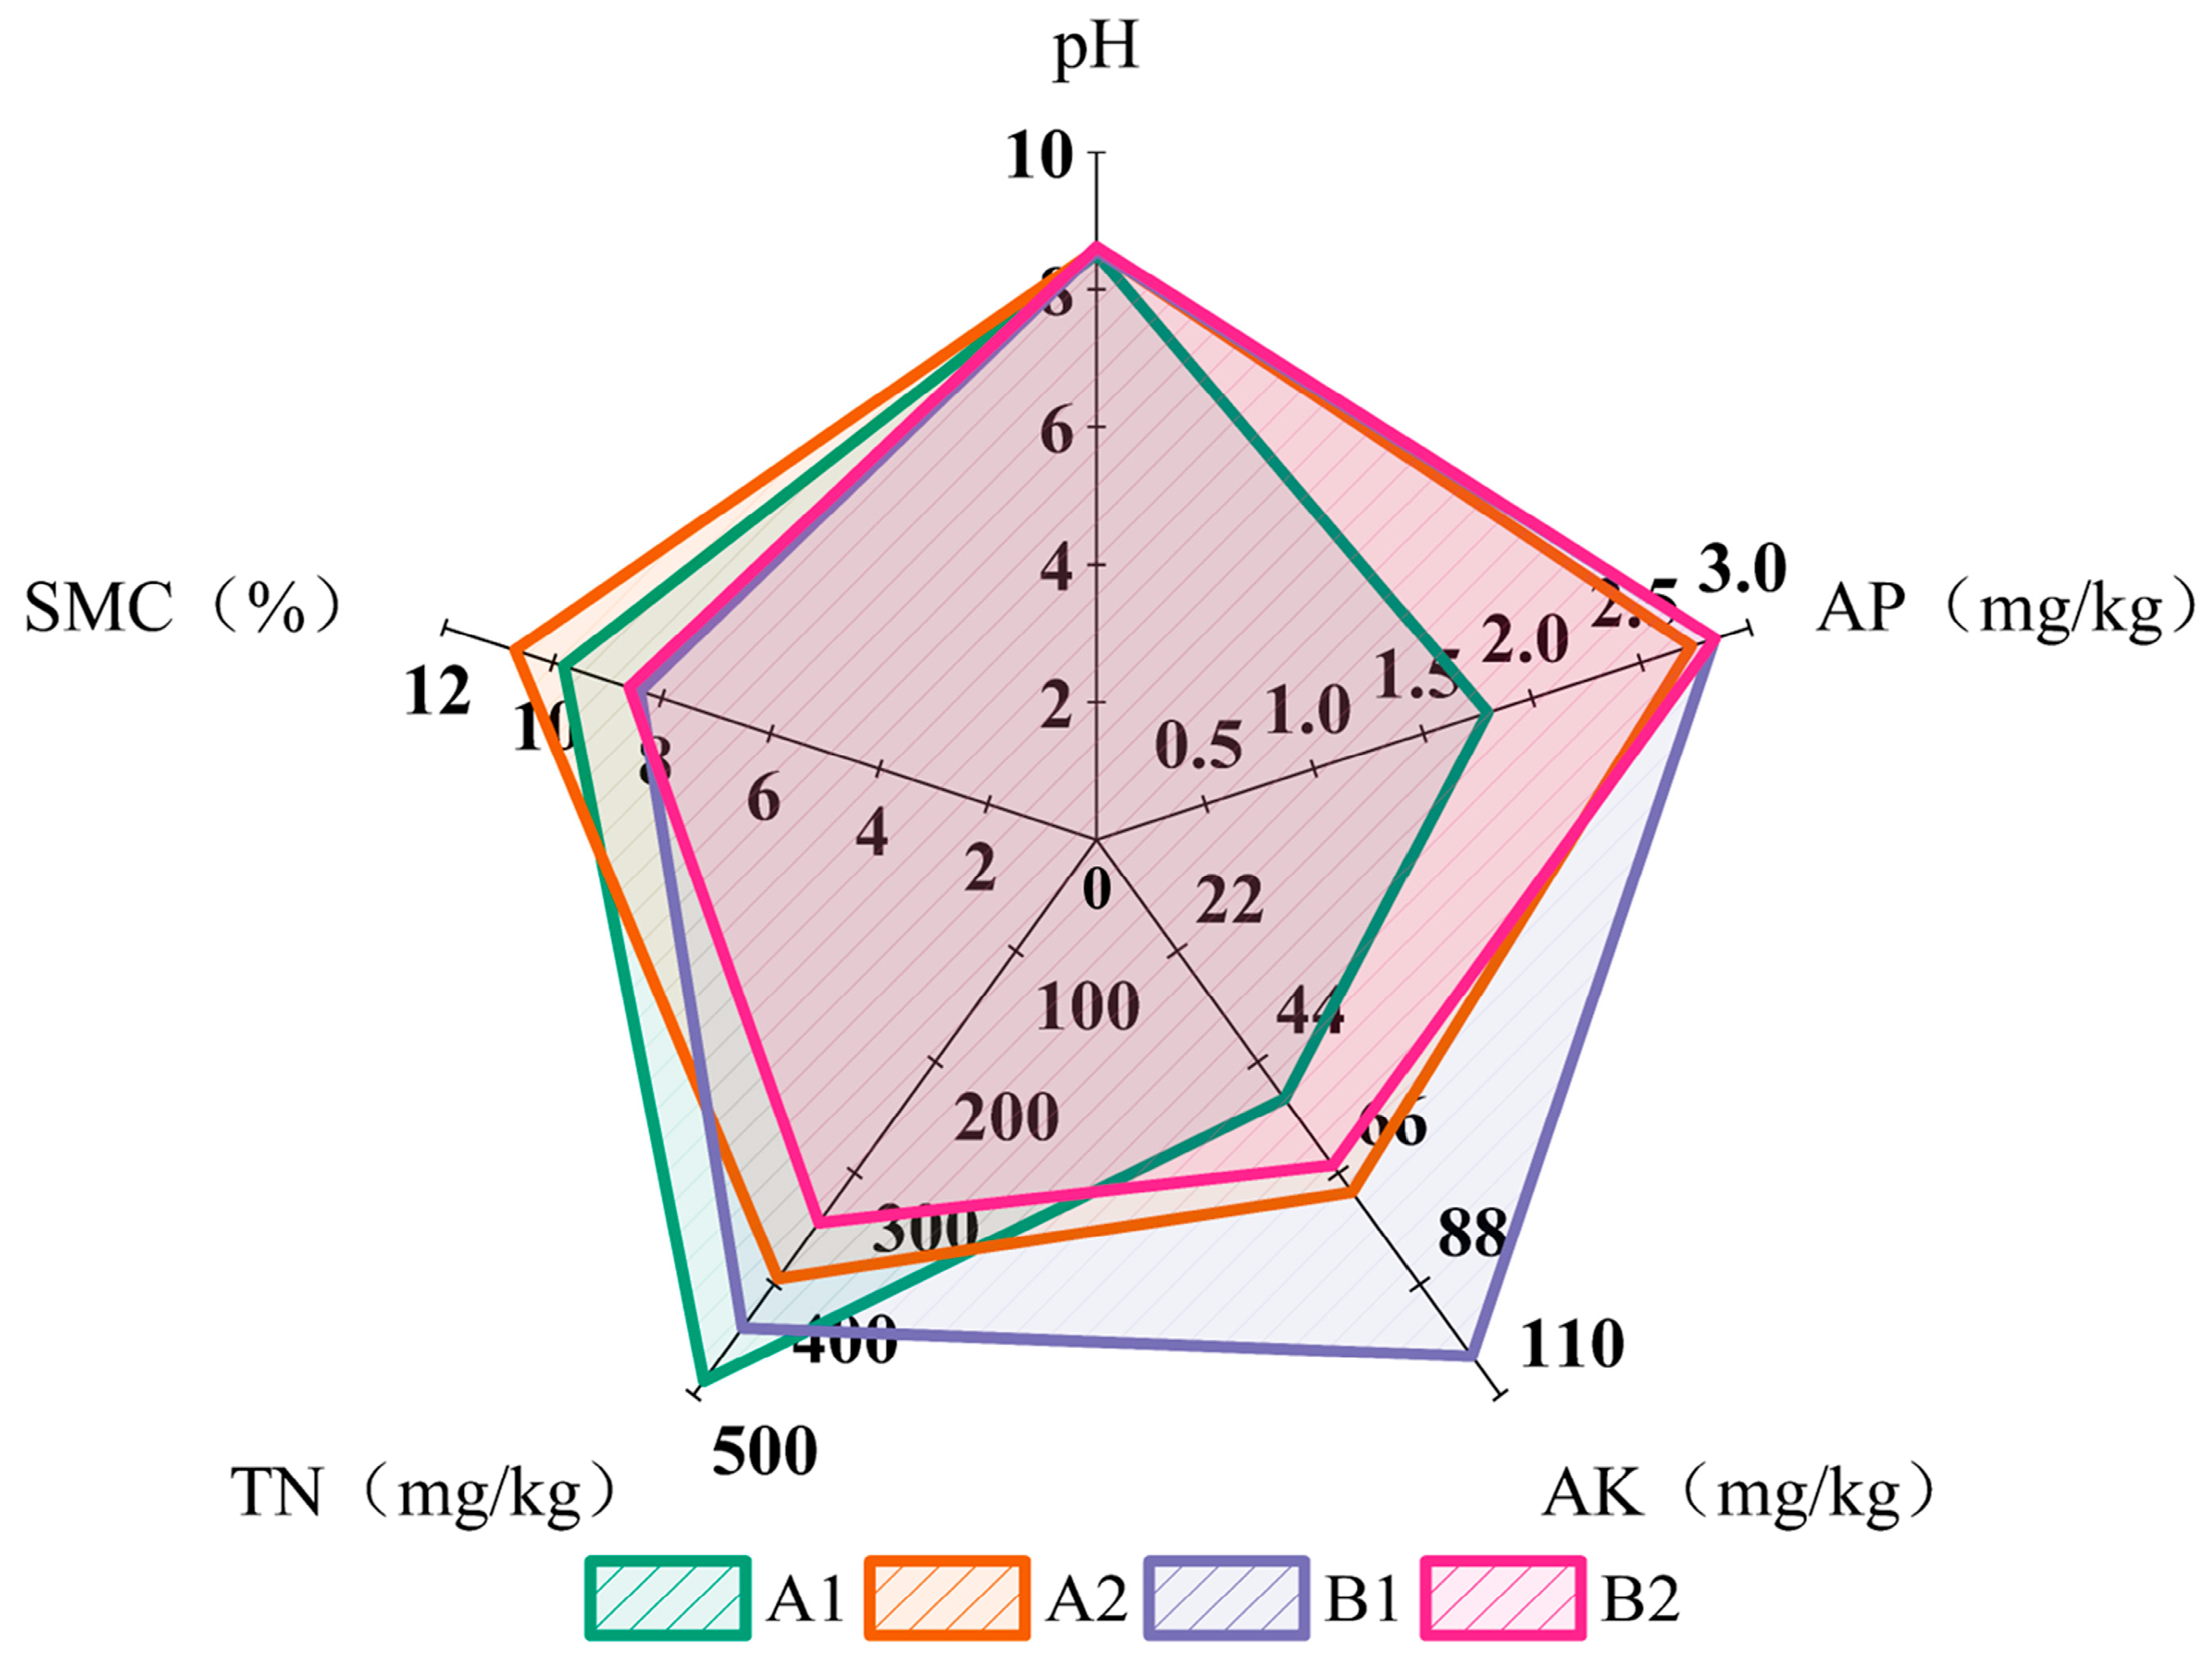
In the soil sample test results, as shown in Figure 13, the pH values of A2 and B2 were slightly higher than those of A1 and B1, indicating that coal mining disturbances can cause changes in soil properties, although the differences were not significant. The available phosphorus content in Area A2 was slightly lower than that in control area B2, but comparable to B1. This suggests that since the disturbance in 2014, the available phosphorus content in Area A1 has decreased, while in Area B1, due to the shorter time since the disturbance, the available phosphorus content is similar to the control area, indicating no significant impact in the short term. The comparison of available potassium content showed that although the potassium content in Area A1 was lower than in Area A2, that in Area B1 was significantly higher than B2. This indicates that the soil structure and potassium cycling in Area A were affected over the long term, while in Area B, the soil potassium content did not decrease after the mining disturbance in the short term, and even increased. Area A1 (disturbed in 2014) saw an increase in total nitrogen content after a longer period, but with less available potassium. In contrast, in Area B1 (disturbed in 2019), although the time was shorter, the available phosphorus and potassium contents did not significantly decrease, and the total nitrogen content slightly increased compared to the control area. The soil moisture in Area A2 was higher than in Area A1, while the soil moisture in Area B1 was comparable to the control area, B2.

4. Discussion

4.1. Analysis of Cyclical Vegetation Response to Mining Disturbances

This study employed ecological indices such as the NDVI, VFC, and RSEI to provide a comprehensive analysis of the specific disturbances to the ecology caused by mining activities. Notably, regarding vegetation degradation, we observed a significant decline in NDVI in the A1 area, which experienced mining disturbances in 2014, as compared to the control area, A2. The area of slight degradation in A1 reached 42.4%, considerably higher than the 14.9% in the control area, indicating that the region primarily suffered from mild degradation, a finding that aligns with the perspectives of Liu and Song [55,56], who posited that mining activities may trigger environmental degradation. Our findings resonate with the existing literature on the impact of mining on vegetation in semi-arid regions, shedding light on the adverse effects of mining disturbances on the ecological quality of the surface. However, the vegetation recovery dynamics presented in this study are more intricate. In the B1 area, the post-mining decline in NDVI mirrored that of the control area, suggesting that natural environmental fluctuations may have been a decisive factor. The B1 area did not exhibit significant degradation in VFC, which could be attributed to the inherent resilience of plant species within the region or the positive effects of human restoration measures. Particularly, in the 2022 observation, the NDVI in the B1 area saw a significant increase compared to the control area. This growth may be attributable to the implementation of ecological management and restoration strategies that fostered vegetation regeneration [57].
Nevertheless, after four years of natural succession and human intervention, the ecological degradation in the area was mitigated to some extent and showed signs of recovery. By the eighth year, the vegetation cover in the disturbed area had significantly improved, with some areas even exhibiting overcompensation effects due to artificial restoration measures, not only returning to natural levels but also demonstrating enhancements. This finding supports the arguments of Harwood and Marttila [58,59], who suggested that ecological restoration measures can create habitats superior to their original state. This conclusion not only confirms the long-term impact of ecological restoration but also echoes the research of Rasim Latifovic [60] on the cyclical effects of mining activities on vegetation cover. In summary, this study not only complements the existing literature in terms of vegetation degradation, recovery processes, and long-term ecological restoration outcomes but also provides new perspectives and data through comparative analysis, enriching our understanding of the cyclical responses of vegetation in semi-arid regions to mining activities.

4.2. Impact of Mining Activities on Terrain and Crack

This study, through a statistical analysis of slope, aspect, surface roughness, and relief, reveals the significant impact of mining activities on topographic features. The slope analysis indicates that mining leads to a more flattened surface, enhancing water infiltration and groundwater recharge while increasing the risk of localized erosion and soil loss. The aspect analysis shows that mining activities increase the area of sunny slopes and decrease the area of shady slopes, reflecting their impact on aspect and the changes in natural erosion and deposition processes. The reduction in surface roughness suggests that the surface becomes more level post-mining, and the relief analysis indicates that mining significantly reduces surface undulation, increasing the area of flat terrain.
The accuracy of digital elevation models (DEMs) significantly affects the calculation results of topographic factors [61]. Due to the lack of high-resolution pre-mining terrain data, using 30-meter resolution DEMs to detect changes in topographic factors before and after mining has certain limitations. The existing data suggest that mining activities have impacted topographic features, which has important implications for land management, vegetation restoration plans, and soil and water conservation strategies. These landscape alterations may have long-term effects on ecological processes such as soil moisture retention, water flow erosion, vegetation distribution, and biodiversity [62,63].
As shown in Figure 5f, UAV-monitored surface crack data indicate that after several months of ecological restoration management, small crack areas significantly integrate into the surrounding natural environment, suggesting the effectiveness of restoration measures for small cracks. However, for larger crack areas, as shown in Figure 5e, the restoration process is more complex and protracted. Despite restoration measures such as filling, vegetation recovery in larger crack areas remains limited. In regions without filling measures, as depicted in Figure 6, cracks failed to heal naturally over eight years, consistent with the findings of Amare [64].
These findings highlight the effectiveness of ecological restoration measures, particularly the rapid recovery of small crack areas. However, larger crack areas may require longer restoration periods, indicating that future ecological restoration efforts should consider the impact of crack size on recovery speed and may need more persistent or intensive restoration strategies. Long-term monitoring and evaluation are crucial to ensuring the sustainability of restoration outcomes. As emphasized by Weintraub, continuous ecological monitoring can help managers adjust their strategies to accommodate changing environmental conditions and long-term fluctuations in restoration results [65]. Despite the significant disturbances caused by mining activities to topography and ecosystems, these impacts can be partially mitigated through effective ecological restoration measures. Particularly for minor topographical changes, ecological restoration can quickly restore the region to its original state, while more extensive damage may require more comprehensive and prolonged restoration strategies.

4.3. Impact of Mining Activities on Soil

In the present study, the data on available phosphorus content revealed that the phosphorus levels in areas A2 and B2, which were unaffected by coal mining activities, were higher than those in areas A1 and B1, which were subjected to mining disturbances. This finding suggests that mining activities may lead to the loss of phosphorus or attenuate the soil’s ability to retain phosphorus. Particularly, the phosphorus content in area A1 was significantly lower than that in A2, which could be attributed to the mining disturbances in 2014. As for available potassium content, it was higher in area A2 compared to A1, while area B1 exhibited significantly higher levels than B2. This indicates that mining disturbances in area A led to a decrease in available potassium content, while the opposite occurred in area B. Such disparities could be due to variations in soil texture, organic matter content, or the status of surface vegetation recovery, among others.
Interestingly, the total nitrogen content in area A1 was the highest among the four areas, which could possibly be ascribed to certain soil recovery mechanisms [66] (e.g., the accumulation of organic matter) that caused an accumulation of nitrogen after the mining disturbance in 2014. In area B, the total nitrogen content in the coal mining face (B1) was also higher than the control area (B2), suggesting that mining disturbances have a certain impact on the nitrogen cycle. On the whole, areas on top of the coal mining faces (A1 and B1) exhibited significant differences in the physicochemical properties of the soil compared to their respective control areas (A2 and B2). These changes include variations in phosphorus and potassium content, as well as in total nitrogen content. Despite minimal changes in pH values, the nutritional status of the soil was affected, which in turn could impact the ecological functions of the soil and vegetation recovery.
These findings align with the research of Ma, which suggests that fractures caused by underground mining activities can alter the physicochemical properties of soil, thereby affecting soil fertility and vegetation growth [25]. These changes not only affect the short-term fertility of the soil but could also have profound implications on long-term ecological restoration and biodiversity. Consequently, ecological restoration and management of coal mining areas should consider these changes in the soil’s physicochemical properties and adopt corresponding measures to promote soil health and vegetation recovery.

5. Conclusions

The extraction of coal from shaft mines, while inevitably inflicting ecological damage, also opens the door to opportunities for ecological restoration. Through the interplay of natural recovery and targeted reclamation efforts, these compromised ecosystems have the potential not only to return to their pre-disturbance levels but, in certain areas treated with human intervention, to surpass their original ecological quality. Mining activities have led to more flattened and gentle terrain, which plays a positive role in reducing soil erosion and promoting vegetation recovery. However, the analysis of subtle changes in slope and surface roughness reveals the need for the careful consideration of topographical variations when formulating ecological restoration and land management strategies. The overall stability of surface roughness and undulation provides solid support for subsequent ecological restoration works.
Drone technology has proven especially effective in monitoring cracks caused by coal mining activities. Small fissures, after being filled and seeded, integrate quickly into the surrounding environment, whereas larger cracks require a longer period for vegetation recovery, particularly those left untreated over the long term, which often struggle to heal naturally. Soil analysis has further confirmed the profound impact of coal mining on the ecological environment, particularly in terms of changes in soil chemical properties. Increases in phosphorus and potassium content, along with a decrease in soil pH, have dual effects on plant growth and soil fertility. While changes in total nitrogen content are not significant, the potential impacts in areas severely affected by mining should not be overlooked.
Synthesizing these findings, we can conclude that despite the array of ecological challenges presented by shaft mine coal extraction, carefully designed restoration plans and strategies demonstrate that ecosystems have significant resilience and adaptability. They are not only capable of repairing damaged ecological environments but also, under certain conditions, of enhancing ecological quality, illustrating the possibility of harmonious coexistence between humans and nature.

Author Contributions

Conceptualization, D.S. and Z.H.; methodology, D.S.; software, D.S; validation, D.S., Y.Y. and F.Z.; formal analysis, H.S.; investigation, D.S.; resources, Z.H.; data curation, Z.H.; writing—original draft preparation, D.S.; writing review and editing, Z.H.; visualization, Z.H. and F.Z.; supervision, Z.H.; project administration, Z.H.; funding acquisition, Z.H. All authors have read and agreed to the published version of the manuscript.

Funding

Supported by the Programme of Introducing Talents of Discipline to Universities (Grant No. B20046).

Data Availability Statement

Data are contained within the article.

Acknowledgments

We thank our partners who provided all the help during the research process and the team for their great support.

Conflicts of Interest

The authors declare no conflicts of interest.

References

  1. Hu, Z.; Xiao, W. Optimization of concurrent mining and reclamation plans for single coal seam: A case study in northern Anhui, China. Environ. Earth Sci. 2013, 68, 1247–1254. [Google Scholar] [CrossRef]
  2. Li, S. Countermeasures for the Main Ecological Problems Resulted from Western Coal Development. In Coal Preparation Technology; Springer: Cham, Switzerland, 2003; pp. 1–3. [Google Scholar]
  3. Li, W. Metallogenic geological characteristics and newly discovered orebodies in Northwest China. Geol. China 2015, 42, 365–380. [Google Scholar]
  4. Tang, Q.; Wang, J.; Jing, Z.; Yan, Y.; Niu, H. Response of ecological vulnerability to land use change in a resource-based city, China. Resour. Policy 2021, 74, 102324. [Google Scholar] [CrossRef]
  5. Cui, F.; Du, Y.; Ni, J.; Zhao, Z.; Peng, S. Effect of Shallow-Buried High-Intensity Mining on Soil Water Content in Ningtiaota Minefield. Water 2021, 13, 361. [Google Scholar] [CrossRef]
  6. Du, Y.; Yan, S.; Zhao, F.; Chen, D.; Zhang, H. DS-InSAR Based Long-Term Deformation Pattern Analysis in the Mining Region with an Improved Phase Optimization Algorithm. Front. Environ. Sci. 2022, 10, 799946. [Google Scholar] [CrossRef]
  7. Boldy, R.; Santini, T.; Annandale, M.; Erskine, P.D.; Sonter, L.J. Understanding the impacts of mining on ecosystem services through a systematic review. Extr. Ind. Soc. 2021, 8, 457–466. [Google Scholar] [CrossRef]
  8. Omuto, C.T.; Vargas, R.R.; Alim, M.S.; Paron, P. Mixed-effects modelling of time series NDVI-rainfall relationship for detecting human-induced loss of vegetation cover in drylands. J. Arid Environ. 2010, 74, 1552–1563. [Google Scholar] [CrossRef]
  9. Zhang, Q.; Ma, J.; Yang, Y.; Luo, Z.; Wang, Y.; Chen, F. Mining Subsidence-Induced Microtopographic Effects Alter the Interaction of Soil Bacteria in the Sandy Pasture, China. Front. Environ. Sci. 2021, 9, 656708. [Google Scholar] [CrossRef]
  10. Jones, H.G.; Vaughan, R.A. Remote Sensing of Vegetation: Principles, Techniques, and Applications; Oxford University Press: Oxford, MS, USA, 2010. [Google Scholar]
  11. Xiao, W.; Ren, H.; Sui, T.; Zhang, H.; Zhao, Y.; Hu, Z. A drone- and field-based investigation of the land degradation and soil erosion at an opencast coal mine dump after 5 years’ evolution of natural processes. Int. J. Coal Sci. Technol. 2022, 9, 42. [Google Scholar] [CrossRef]
  12. Li, J.; Pei, Y.; Zhao, S.; Xiao, R.; Sang, X.; Zhang, C. A review of remote sensing for environmental monitoring in China. Remote Sens. 2020, 12, 1130. [Google Scholar] [CrossRef]
  13. Dronova, I.; Taddeo, S. Remote sensing of phenology: Towards the comprehensive indicators of plant community dynamics from species to regional scales. J. Ecol. 2022, 110, 1460–1484. [Google Scholar] [CrossRef]
  14. Musick, H.B.; Pelletier, R.E. Response to soil moisture of spectral indexes derived from bidirectional reflectance in thematic mapper wavebands. Remote Sens. Environ. 1988, 25, 167–184. [Google Scholar] [CrossRef]
  15. Abah, R.C.; Petja, B.M. Evaluation of organic carbon, available phosphorus, and available potassium as a measure of soil fertility. Merit Res. J. Agric. Sci. Soil Sci. 2015, 3, 159–167. [Google Scholar]
  16. Xu, Y.; Wang, X.; Bai, J.; Wang, D.; Wang, W.; Guan, Y. Estimating the spatial distribution of soil total nitrogen and available potassium in coastal wetland soils in the Yellow River Delta by incorporating multi-source data. Ecol. Indic. 2020, 111, 106002. [Google Scholar] [CrossRef]
  17. Yengoh, G.T.; Dent, D.; Olsson, L.; Tengberg, A.E.; Tucker, C.J., III. Use of the Normalized Difference Vegetation Index (NDVI) to Assess Land Degradation at Multiple Scales: Current Status, Future Trends, and Practical Considerations; Springer: Berlin/Heidelberg, Germany, 2015. [Google Scholar]
  18. Gillies, R.R.; Carlson, T.N. Thermal Remote Sensing of Surface Soil Water Content with Partial Vegetation Cover for Incorporation into Climate Models. J. Appl. Meteorol. 1995, 34, 745–756. [Google Scholar] [CrossRef]
  19. Xu, H.; Xu, F.; Lin, T.; Xu, Q.; Yu, P.; Wang, C.; Aili, A.; Zhao, X.; Zhao, W.; Zhang, P.; et al. A systematic review and comprehensive analysis on ecological restoration of mining areas in the arid region of China: Challenge, capability and reconsideration. Ecol. Indic. 2023, 154, 110630. [Google Scholar] [CrossRef]
  20. Xu, H.; Wang, Y.; Guan, H.; Shi, T.; Hu, X. Detecting Ecological Changes with a Remote Sensing Based Ecological Index (RSEI) Produced Time Series and Change Vector Analysis. Remote Sens. 2019, 11, 2345. [Google Scholar] [CrossRef]
  21. Hu, X.; Xu, H. A new remote sensing index for assessing the spatial heterogeneity in urban ecological quality: A case from Fuzhou City, China. Ecol. Indic. 2018, 89, 11–21. [Google Scholar] [CrossRef]
  22. Zheng, Z.; Wu, Z.; Chen, Y.; Guo, C.; Marinello, F. Instability of remote sensing based ecological index (RSEI) and its improvement for time series analysis. Sci. Total Environ. 2022, 814, 152595. [Google Scholar] [CrossRef]
  23. He, Y.; He, X.; Liu, Z.; Zhao, S.; Bao, L.; Li, Q.; Yan, L. Coal Mine Subsidence has Limited Impact on Plant Assemblages in an Arid and Semi-Arid Region of Northwestern China. Ecoscience 2017, 24, 91–103. [Google Scholar] [CrossRef]
  24. Liu, S.; Li, W.; Qiao, W.; Wang, Q.; Hu, Y.; Wang, Z. Effect of natural conditions and mining activities on vegetation variations in arid and semiarid mining regions. Ecol. Indic. 2019, 103, 331–345. [Google Scholar] [CrossRef]
  25. Ma, K.; Zhang, Y.; Ruan, M.; Guo, J.; Chai, T. Land Subsidence in a Coal Mining Area Reduced Soil Fertility and Led to Soil Degradation in Arid and Semi-Arid Regions. Int. J. Environ. Res. Public Health 2019, 16, 3929. [Google Scholar] [CrossRef] [PubMed]
  26. Mi, J.; Yang, Y.; Hou, H.; Zhang, S.; Raval, S.; Chen, Z.; Hua, Y. The long-term effects of underground mining on the growth of tree, shrub, and herb communities in arid and semiarid areas in China. Land Degrad. Dev. 2021, 32, 1412–1425. [Google Scholar] [CrossRef]
  27. Miller, H.J. Tobler’s first law and spatial analysis. Ann. Assoc. Am. Geogr. 2004, 94, 284–289. [Google Scholar] [CrossRef]
  28. Stout, K.J. Surface roughness ∼ measurement, interpretation and significance of data. Mater. Des. 1981, 2, 260–265. [Google Scholar] [CrossRef]
  29. Pike, R.J.; Wilson, S.E. Elevation-Relief Ratio, Hypsometric Integral, and Geomorphic Area-Altitude Analysis. Geol. Soc. Am. Bull. 1971, 82, 1079–1084. [Google Scholar] [CrossRef]
  30. Meinen, B.U.; Robinson, D.T. Mapping erosion and deposition in an agricultural landscape: Optimization of UAV image acquisition schemes for SfM-MVS. Remote Sens. Environ. 2020, 239, 111666. [Google Scholar] [CrossRef]
  31. Lowe, D.G. Distinctive image features from scale-invariant keypoints. Int. J. Comput. Vis. 2004, 60, 91–110. [Google Scholar] [CrossRef]
  32. Hirschmuller, H. Stereo Processing by Semiglobal Matching and Mutual Information. IEEE Trans. Pattern Anal. Mach. Intell. 2008, 30, 328–341. [Google Scholar] [CrossRef]
  33. Triggs, B.; Mclauchlan, P.F.; Hartley, R.I.; Fitzgibbon, A.W. Bundle Adjustment: A Modern Synthesis; Springer: Berlin, Germany, 2000; pp. 298–372. [Google Scholar]
  34. Smith, M.J.; Pain, C.F. Applications of remote sensing in geomorphology. Prog. Phys. Geogr. Earth Environ. 2009, 33, 568–582. [Google Scholar] [CrossRef]
  35. Toutin, T. Review article: Geometric processing of remote sensing images: Models, algorithms and methods. Int. J. Remote Sens. 2004, 25, 1893–1924. [Google Scholar] [CrossRef]
  36. Szeliski, R. Image Alignment and Stitching: A Tutorial. Found. Trends® Comput. Graph. Vis. 2007, 2, 1–104. [Google Scholar] [CrossRef]
  37. Wang, Y.; Zhu, X.; Wu, B. Automatic detection of individual oil palm trees from UAV images using HOG features and an SVM classifier. Int. J. Remote Sens. 2019, 40, 7356–7370. [Google Scholar] [CrossRef]
  38. Zhang, F.; Hu, Z.; Yang, K.; Fu, Y.; Feng, Z.; Bai, M. The Surface Crack Extraction Method Based on Machine Learning of Image and Quantitative Feature Information Acquisition Method. Remote Sens. 2021, 13, 1534. [Google Scholar] [CrossRef]
  39. Zhang, F.; Hu, Z.; Liang, Y.; Li, Q. Evaluation of Surface Crack Development and Soil Damage Based on UAV Images of Coal Mining Areas. Land 2023, 12, 774. [Google Scholar] [CrossRef]
  40. Tucker, C.J. Red and photographic infrared linear combinations for monitoring vegetation. Remote Sens. Environ. 1979, 8, 127–150. [Google Scholar] [CrossRef]
  41. Jiang, Z.; Huete, A.R.; Chen, J.; Chen, Y.; Li, J.; Yan, G.; Zhang, X. Analysis of NDVI and scaled difference vegetation index retrievals of vegetation fraction. Remote Sens. Environ. 2006, 101, 366–378. [Google Scholar] [CrossRef]
  42. Pettorelli, N.; Vik, J.O.; Mysterud, A.; Gaillard, J.; Tucker, C.J.; Stenseth, N.C. Using the satellite-derived NDVI to assess ecological responses to environmental change. Trends Ecol. Evol. 2005, 20, 503–510. [Google Scholar] [CrossRef] [PubMed]
  43. Carlson, T.N.; Ripley, D.A. On the relation between NDVI, fractional vegetation cover, and leaf area index. Remote Sens. Environ. 1997, 62, 241–252. [Google Scholar] [CrossRef]
  44. Zawadzki, J.; Przeździecki, K.; Miatkowski, Z. Determining the area of influence of depression cone in the vicinity of lignite mine by means of triangle method and LANDSAT TM/ETM+ satellite images. J. Environ. Manag. 2016, 166, 605–614. [Google Scholar] [CrossRef]
  45. Xu, H. A new index for delineating built-up land features in satellite imagery. Int. J. Remote Sens. 2008, 29, 4269–4276. [Google Scholar] [CrossRef]
  46. Essa, W.; Verbeiren, B.; van der Kwast, J.; Van de Voorde, T.; Batelaan, O. Evaluation of the DisTrad thermal sharpening methodology for urban areas. Int. J. Appl. Earth Obs. Geoinf. 2012, 19, 163–172. [Google Scholar] [CrossRef]
  47. Jimenez-Munoz, J.C.; Cristobal, J.; Sobrino, J.A.; Soria, G.; Ninyerola, M.; Pons, X.; Pons, X. Revision of the Single-Channel Algorithm for Land Surface Temperature Retrieval from Landsat Thermal-Infrared Data. IEEE Trans. Geosci. Remote Sens. 2009, 47, 339–349. [Google Scholar] [CrossRef]
  48. Lide, D.R. CRC Handbook of Chemistry and Physics; CRC Press: Boca Raton, FL, USA, 2004. [Google Scholar]
  49. Ahluwalia, V.K. Instrumental Methods of Chemical Analysis; Springer: Berlin/Heidelberg, Germany, 2023. [Google Scholar]
  50. Brabson, J.A. The Kjeldahl Method for Organic Nitrogen; Oxford University Press: Oxford, UK, 1966. [Google Scholar]
  51. Olsen, P.S.; Cole, C.V.; Watanabe, F.S.; Dean, L.A. Estimation of Available Phosphorus in Soils by Extraction with Sodium Bicarbonate; USDA Circular No. 939; US Department of Agriculture: Washington, DC, USA, 1954.
  52. Christian, G.D.; Epstein, M.S. Atomic Absorption Spectroscopy; Springer: Berlin/Heidelberg, Germany, 1980. [Google Scholar]
  53. Black, C.A. Soil Fertility Evaluation and Control; CRC Press: Boca Raton, FL, USA, 2013. [Google Scholar]
  54. Carter, M.R.; Gregorich, E.G. Soil Sampling and Methods of Analysis; CRC Press: Boca Raton, FL, USA, 2007. [Google Scholar]
  55. Liu, Y.; Lei, S.; Chen, X.; Chen, M.; Zhang, X.; Long, L. Study of plant configuration pattern in guided vegetation restoration: A case study of semiarid underground mining areas in Western China. Ecol. Eng. 2021, 170, 106334. [Google Scholar] [CrossRef]
  56. Song, D.; Hu, Z.; Zeng, J.; Sun, H. Influence of mining on vegetation in semi-arid areas of western China based on the coupling of above ground and below ground—A case study of Daliuta coalfield. Ecol. Indic. 2024, 161, 111964. [Google Scholar] [CrossRef]
  57. Agboola, O.; Babatunde, D.E.; Isaac Fayomi, O.S.; Sadiku, E.R.; Popoola, P.; Moropeng, L.; Yahaya, A.; Mamudu, O.A. A review on the impact of mining operation: Monitoring, assessment and management. Results Eng. 2020, 8, 100181. [Google Scholar] [CrossRef]
  58. Harwood, T.D.; Donohue, R.J.; Williams, K.J.; Ferrier, S.; McVicar, T.R.; Newell, G.; White, M. Habitat Condition Assessment System: A new way to assess the condition of natural habitats for terrestrial biodiversity across whole regions using remote sensing data. Methods Ecol. Evol. 2016, 7, 1050–1059. [Google Scholar] [CrossRef]
  59. Marttila, M.; Louhi, P.; Huusko, A.; Mäki Petäys, A.; Yrjänä, T.; Muotka, T. Long-term performance of in-stream restoration measures in boreal streams. Ecohydrology 2016, 9, 280–289. [Google Scholar] [CrossRef]
  60. Latifovic, R.; Fytas, K.; Chen, J.; Paraszczak, J. Assessing land cover change resulting from large surface mining development. Int. J. Appl. Earth Obs. Geoinf. 2005, 7, 29–48. [Google Scholar] [CrossRef]
  61. Thompson, J.A.; Bell, J.C.; Butler, C.A. Digital elevation model resolution: Effects on terrain attribute calculation and quantitative soil-landscape modeling. Geoderma 2001, 100, 67–89. [Google Scholar] [CrossRef]
  62. Monger, C.; Sala, O.E.; Duniway, M.C.; Goldfus, H.; Meir, I.A.; Poch, R.M.; Throop, H.L.; Vivoni, E.R. Legacy effects in linked ecological–soil–geomorphic systems of drylands. Front. Ecol. Environ. 2015, 13, 13–19. [Google Scholar] [CrossRef] [PubMed]
  63. Swanson, F.J.; Kratz, T.K.; Caine, N.; Woodmansee, R.G. Landform effects on ecosystem patterns and processes. Bioscience 1988, 38, 92–98. [Google Scholar] [CrossRef]
  64. Amare, S.; Keesstra, S.; van der Ploeg, M.; Langendoen, E.; Steenhuis, T.; Tilahun, S. Causes and controlling factors of Valley bottom Gullies. Land 2019, 8, 141. [Google Scholar] [CrossRef]
  65. Weintraub, L. To Life! Eco Art in Pursuit of a Sustainable Planet; University of California Press: Berkeley, CA, USA, 2012. [Google Scholar]
  66. Wick, A.F. Soil Aggregate and Organic Matter Dynamics in Reclaimed Mineland Soils; University of Wyoming: Laramie, WY, USA, 2007. [Google Scholar]
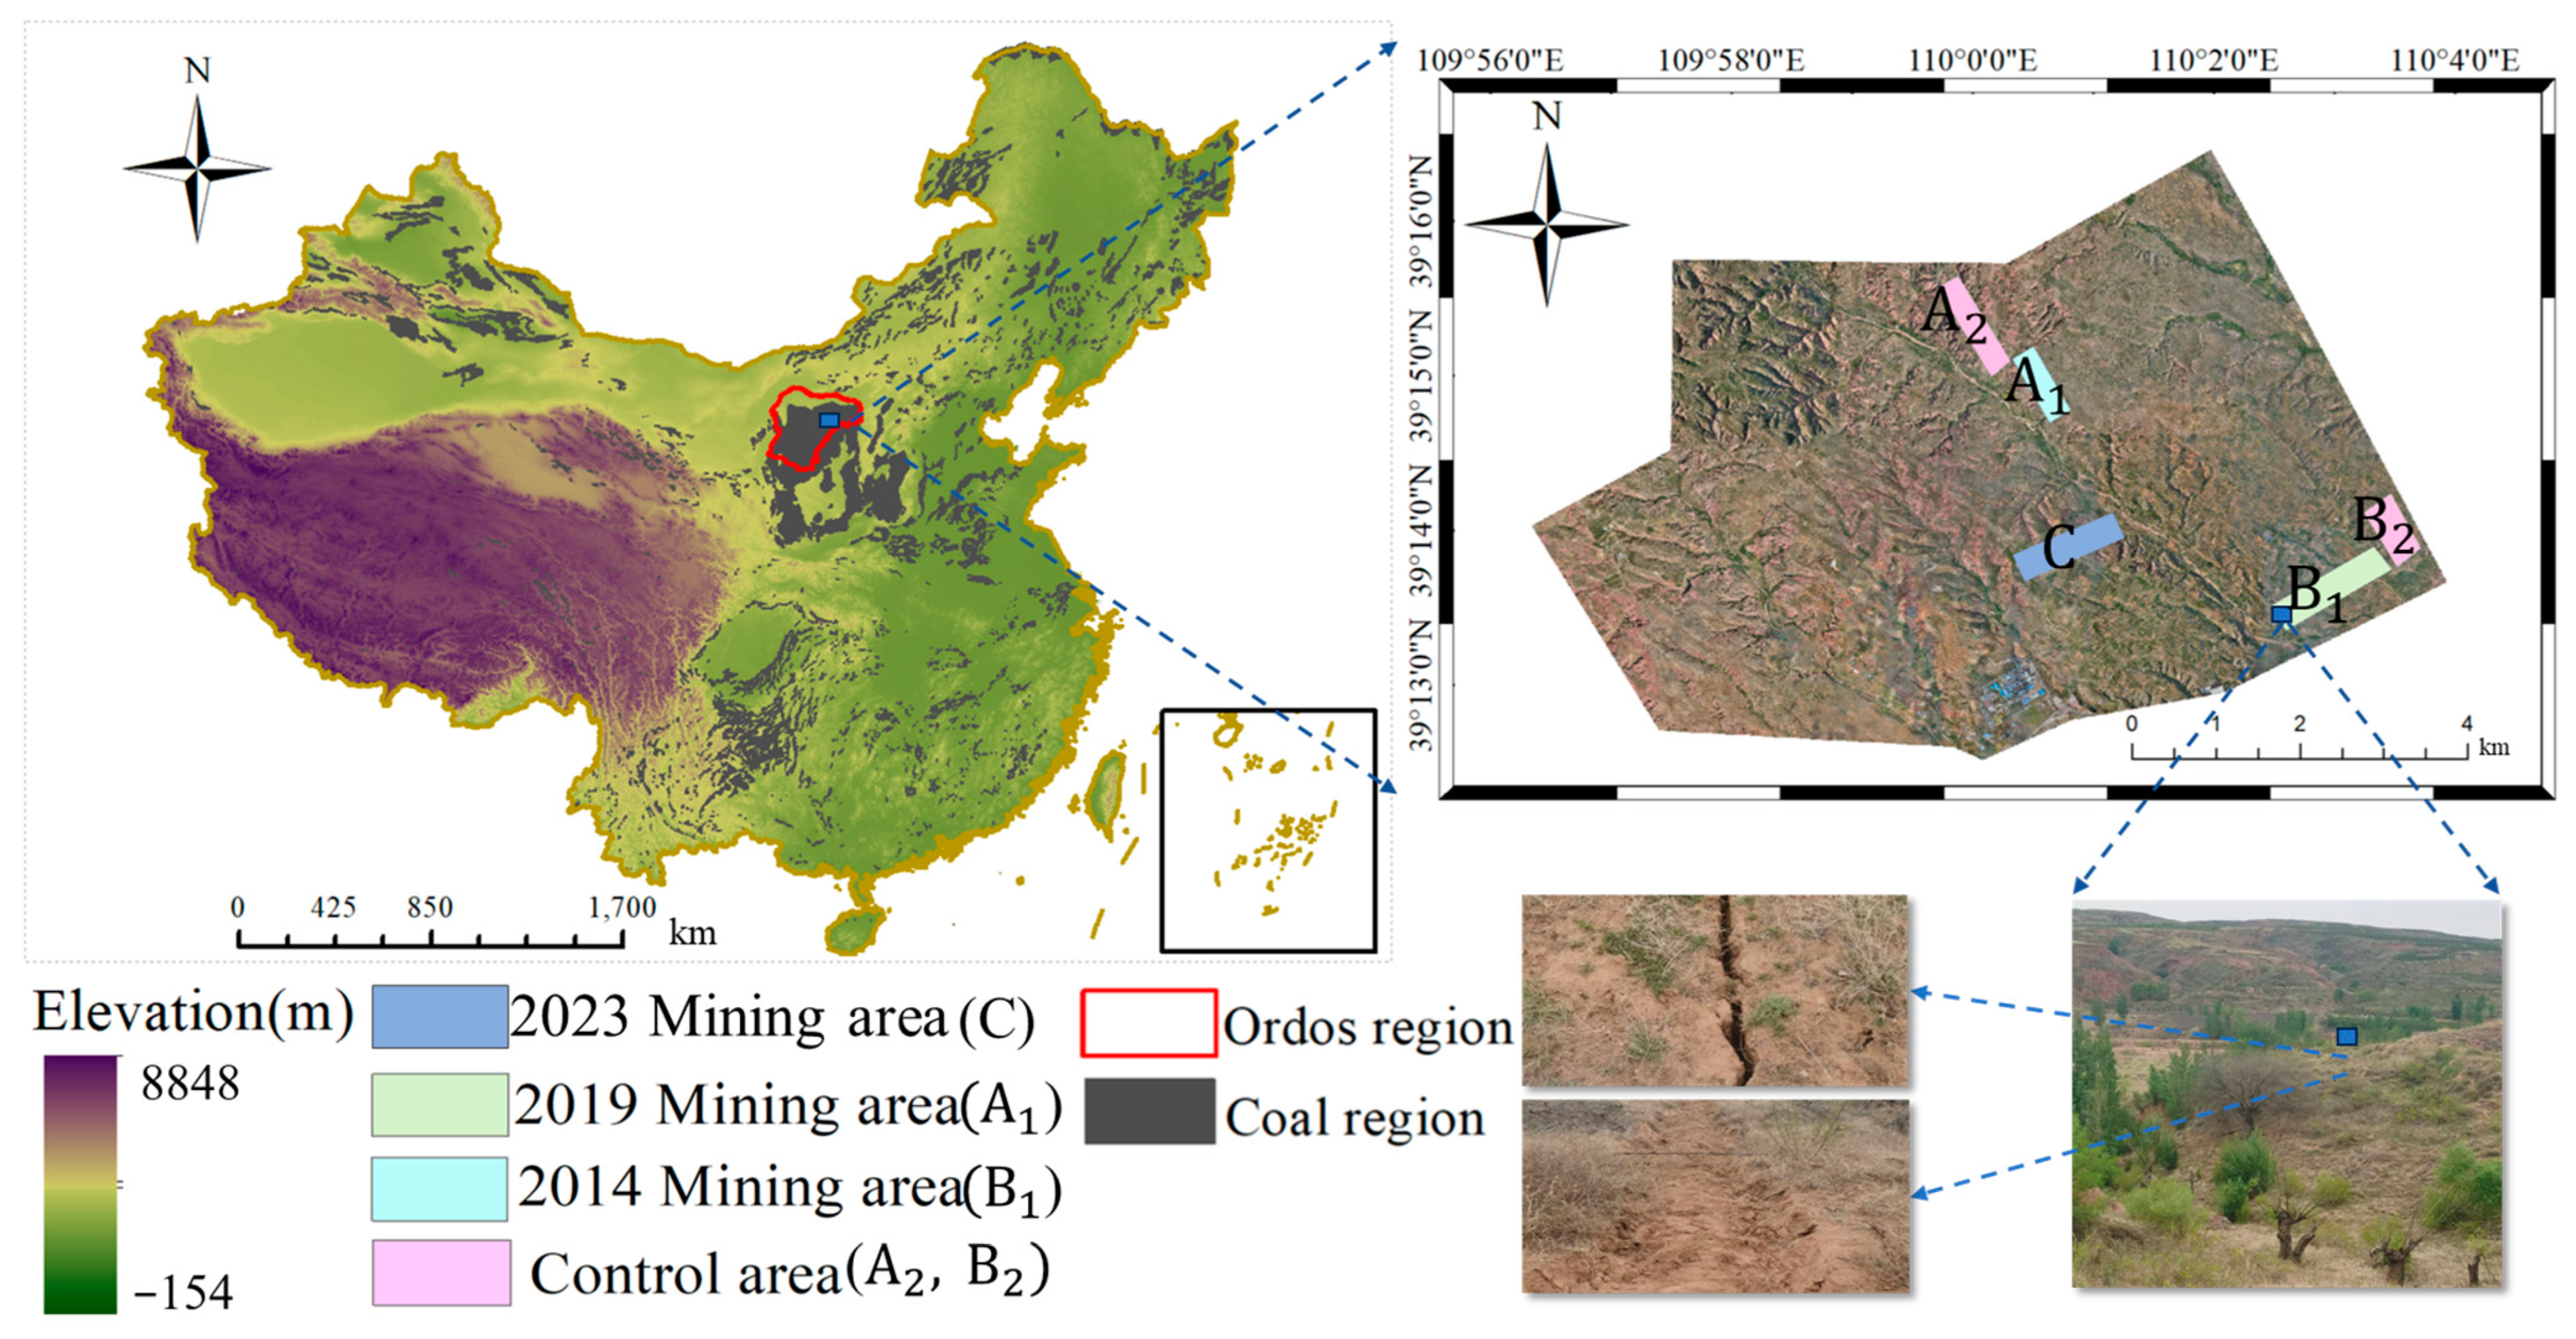
Figure 1. Location of the trial region.
Remotesensing 16 02236 g001
Figure 2. Methodological framework of this study. (Soil moisture content (SMC), pH level, total nitrogen (TN), available phosphorus (AP), and available potassium (AK)).
Remotesensing 16 02236 g002
Figure 3. Indices for various topographic factors before and after mining at the Erlintu coal mine.
Remotesensing 16 02236 g003
Figure 4. Topographic factors’ distribution before and after mining: (a) slope distribution before and after mining; (b) aspect distribution before and after mining; (c) surface roughness distribution before and after mining; (d) terrain relief distribution before and after mining.
Remotesensing 16 02236 g004
Figure 5. Extraction of ground fissures in a mining-disturbed area in 2023: (a) UAV data of the mining area in Region R in 2023, with dense fissures. (b) Surface conditions in Region R in May. (c) Extracted distribution of ground fissures in Region R based on May imagery. (d) Surface conditions in Region R in August with the locations of large fissure areas (width > 15 cm) P1 and small fissure areas (width < 15 cm) P2. (e) Surface conditions in P1 area. (f) Surface conditions in P2 area.
Remotesensing 16 02236 g005
Figure 6. Extraction of ground fissures in mining-disturbed area in 2014: (a) Surface image of the mining area in Region Q in 2014, with dense fissures. (b) Surface conditions in the dense fissure area Q. (c) Extracted distribution of ground fissures in Region Q.
Remotesensing 16 02236 g006
Figure 7. Long-term NDVI value change in the trial region.
Remotesensing 16 02236 g007
Figure 8. The evolution of VFC in the Erlintu mining area: (a) evolution in VFC: 2013–2015; (b) evolution in VFC: 2013–2018; (c) evolution in VFC: 2013–2022; (d) evolution in VFC: 2018–2020; (e) evolution in VFC: 2018–2022.
Remotesensing 16 02236 g008
Figure 9. Vegetation dynamics in areas A1 and A2: (a) proportions of each category; (b) numerical distribution of VFC changes.
Remotesensing 16 02236 g009
Figure 10. Vegetation dynamics in area B1 and B2: (a) proportions of each category; (b) numerical distribution of VFC changes.
Remotesensing 16 02236 g010
Figure 11. Transformation of RSEI: (a) 2015 RSEI map; (b) 2018 RSEI map; (c) 2020 RSEI map; (d) 2022 RSEI map.
Remotesensing 16 02236 g011
Figure 12. Contrasts the change in RSEI values between the mining-affected area and the control area.
Remotesensing 16 02236 g012
Figure 13. Soil element analysis of different trial regions in Erlintu coal mine.
Remotesensing 16 02236 g013
Table 1. Overview of the test area.
Test AreaMining Disturbance TimeAreaEcological Restoration Measures
A12014 disturbance26.45 km2Tree planting
A2Undisturbed35.44 km2None
B12019 disturbance40.97 km2Fissure infilling; grass seeding
B2Undisturbed27.33 km2None
C2023 disturbance41.97 km2Fissure infilling; grass seeding
Table 2. Calculation formulas for indices.
IndicatorCalculation FormulaReference
NDVI N D V I = ρ N I R ρ R ρ N I R + ρ R Tucker et al. (1979) [40]
VFC V F C = N D V I N D V I m i n N D V I m a x N D V I m i n Carlson et al. (1997) [43]
WET W E T = 0.0315 B b l u e + 0.2021 B g r e e n + 0.3102 B r e d + 0.1594 B n i r 0.6806 B s w i r 1 0.6109 B s w i r 2 Zawadzki et al. (2016) [44]
NDBSI I B I = 2 B s w i r 1 B s w i r 1 + B n i r B n i r B n i r + B r e d + B g r e e n B g r e e n + B s w i r l 2 B s w i r 1 B s w i r 1 + B n i r + B n i r B n i r + B r e d + B g r e e n B g r e e n + B s w i r l Xu et al. (2008) [45]
Essa et al. (2012) [46]
S I = ( B s w i r 1 + B r e d ) ( B n i r + B b l u e ) ( B s w i r 1 + B r e d ) + ( B n i r + B b l u e )
N D B S I = S I + I B I / 2
LST L S T = γ × [ 1 ε × ( ψ 1 × L s e n + ψ 2 ) + ψ 3 ] + δ Jimenez-Munoz et al. (2009) [47]
ρ N I R is the near-infrared channel reflectance, ρ R is the red channel reflectance. N D V I m a x , the maximum NDVI during the vegetation growth season, and N D V I m i n , the minimum NDVI. The Landsat 7 TM and Landsat 8 OLI satellites’ bands B_blue, B_green, B_red, B_nir, B_swirl, and B_swir2 correspond to reflectance values in blue, green, red, near-infrared, shortwave infrared 1, and shortwave infrared 2 spectrums.
Table 3. Classification of vegetation coverage’s dynamic evolution.
DifferenceEvolution Type
D ≤ −30%Obvious degradation
−30% < D ≤ −15%General degradation
−15% < D ≤ −5%Slight degradation
−5% < D ≤ 5%Stable
5% < D ≤ 15%Slight improvement
15% < D ≤ 30%General improvement
30% ≥ DObvious improvement
Table 4. Soil indicator detection methodologies.
IndicatorMeasurement MethodReference
Soil Moisture Content (SMC)Gravimetric MethodLide, David R. (2004) [48]
PH ValuePotentiometric MethodAhluwalia, V.K. (2023) [49]
Total Nitrogen (TN)Semi-micro Kjeldahl MethodBrabson, John A. (1966) [50]
Available Phosphorus (AP)Olsen MethodOlsen, P.S. et al. (1954) [51]
Available Potassium (AK)Flame Atomic Absorption SpectrophotometryChristian, Gary D. et al. (1980) [52]
Table 5. Physicochemical properties grading frequency of soil samples from the trial region.
IndicatorGrading Criteria and Frequency
AP (mg/kg)Abundance-DeficiencyRichRelatively RichModerateRelatively DeficientDeficientExtremely Deficient
Grading Criteria>4020~4010~205~103~5<3
Frequency0102729
AK (mg/kg)Grading Criteria>200150~200100~15050~10030~50<30
Frequency0092460
TN (g/kg)Grading Criteria>2.01.5~2.01.0~1.50.75~1.00.5–0.75<0.5
Frequency00012018
pHAcidity–AlkalinityStrongly AcidicAcidicNeutralAlkalineStrongly AlkalineExtremely Strong Alkalinity
Grading Criteria4.5~5.55.5~6.56.5~7.57.5~8.58.5~9.5>9.5
Frequency00014232
SMC (%)Degree of DroughtSlightly WetAppropriateMild DroughtModerate DroughtSevere Drought
Grading Criteria>2015–2012~155~12<5
Frequency002343
Disclaimer/Publisher’s Note: The statements, opinions and data contained in all publications are solely those of the individual author(s) and contributor(s) and not of MDPI and/or the editor(s). MDPI and/or the editor(s) disclaim responsibility for any injury to people or property resulting from any ideas, methods, instructions or products referred to in the content.