Article

Spatiotemporal Evolution Disparities of Vegetation Trends over the Tibetan Plateau under Climate Change

by
Jieru Ma
1,
Hong-Li Ren
1,*,
Xin Mao
1,
Minghong Liu
1,
Tao Wang
2 and
Xudong Ma
3
1
State Key Laboratory of Severe Weather, and Institute of Tibetan Plateau Meteorology, Chinese Academy of Meteorological Sciences, Beijing 100081, China
2
Earth System Modeling and Prediction Centre, China Meteorological Administration, Beijing 100081, China
3
Pratacultural College, Gansu Agricultural University, Lanzhou 730070, China
*
Author to whom correspondence should be addressed.
Remote Sens. 2024, 16(14), 2585; https://doi.org/10.3390/rs16142585
Submission received: 4 June 2024 / Revised: 8 July 2024 / Accepted: 12 July 2024 / Published: 14 July 2024
(This article belongs to the Special Issue Cropland and Yield Mapping with Multi-source Remote Sensing)

Abstract

:
The Tibetan Plateau has experienced profound climate change with significant implication for spatial vegetation greenness. However, the spatiotemporal disparities of long-term vegetation trends in response to observed climate change remain unclear. Based on remote-sensing vegetation images indicated by the normalized difference vegetation index (NDVI) from two long-term combined datasets, GIMMS and MODIS, we identified two spatiotemporal evolution patterns (SEPs) in long-term vegetation anomalies across the Tibetan Plateau. This new perspective integrates spatial and temporal NDVI changes during the growing seasons over the past four decades. Notably, the dipole evolution pattern that rotates counterclockwise from May to September accounted for 62.8% of the spatial mean amplitude of vegetation trends, dominating the spatiotemporal disparities. This dominant pattern trend is attributed to simultaneous effects of spatial warming and rising CO2, which accounted for 75% and 15%, respectively, along with a lagged effect of dipole precipitation, accounting for 6%. Overall, wetting and warming promote greening evolution in the northern Tibetan Plateau, while slight drying and warming favor browning evolution in the southern Tibetan Plateau. These findings provide insights into the combined effects of climate change on spatiotemporal vegetation trends and inform future adaptive strategies in fragile regions.

1. Introduction

Variations in terrestrial vegetation play a crucial role in the exchange of water and energy between the atmosphere and the land [1,2], influencing biodiversity, carbon storage, soil productivity, and livelihoods [3,4]. The normalized difference vegetation index (NDVI) has been widely used as a valuable indicator for tracking vegetation greenness, coverage, and growth activity at both global and regional scales [5,6]. Satellite remote-based NDVI datasets have shown a global greening in vegetation cover since 1980, with notable spatial disparities at regional scales [7]. The vegetation greening is largely attributed to climate change [8] and anthropogenic activities [9,10]. Simulation results suggest that climate change has had a positive effect on vegetation variability, contributing to the greening trend in more than 55% of the northern high latitudes and on the Tibetan Plateau [9]. The impact of recent climate change on terrestrial vegetation is one of the important issues discussed in the Intergovernmental Panel on Climate Change Sixth Assessment Report [11]. Most studies have concentrated on large-scale vegetation greenness, such as that at global and northern high latitudes [12,13], with less attention paid to the spatiotemporal divergences of vegetation trends in crucial vulnerable areas under climate change.
The Tibetan Plateau is a unique high-elevation region with an average elevation more than 4000 m above sea level. It is nicknamed the “Asian Water Tower” and “Earth’s Third Pole” because its mountain glaciers and snowfields contain the largest volume of fresh water outside the Arctic and Antarctic polar regions, acting as a regulator for East Asian and even global climates [14,15,16,17,18]. The Tibetan Plateau primarily consists of grasslands, open shrublands, and bare soil or rocky areas, extending from the southeast to the northwest (Figure 1). Grasslands and open shrublands together cover more than half of the plateau’s land area. The average NDVI during the growing season from 1982 to 2020 highlights the clear spatial heterogeneity of vegetation cover, transitioning from dense grasslands in the southeastern plateau to spare open shrublands and bare soil and rocks in the northwestern plateau (Figure 1 and Figure 2). Meanwhile, a decreasing gradient in both precipitation and temperature during the same period has been observed from the southeast to the northwest (Figure 2b,c). Due to the influence of the Asian monsoon, there is a clear seasonal climate variation, with approximately 90% of the total precipitation occurring during the rainy season (May–September). The snow cover average across the plateau peaks in winter and progressively decreases, reaching a minimum of about 1–5% in the summer. Spatial snow cover also varies with increases in terrain elevation [19]. The regional mean temperature on the plateau ranges from 7 °C to 15 °C in the warm summer and from 1 °C to 7 °C in the cold winter [20]. Previous studies have demonstrated that the climate regime patterns align with the spatial distribution of NDVI across the plateau, with wetter and warmer regions favoring higher NDVI values [21].
Due to its unique landscape and lack of human activity, the Tibetan Plateau is particularly sensitive to climate change and ecologically fragile, and is often regarded as a “natural laboratory” for investigating vegetation responses to climate change [22,23,24]. Over the past four decades, the regional mean NDVI has shown an overall increasing trend on the plateau, but with substantial spatiotemporal disparities in greening and browning patterns [25,26]. Meanwhile, climate factors over the Tibetan Plateau, derived from meteorological observations, have changed dramatically in recent decades. For example, the temperature on the Tibetan Plateau has increased at a rate higher than that observed in China and at nearly twice the global average [27,28,29,30,31]. Additionally, there has been a shift in precipitation regimes, with a wetting tendency in the northern Tibetan Plateau and a drying tendency in the southern parts of the plateau [32,33,34,35,36].
As the climate in the northern plateau has become warmer and wetter, vegetation has become greener in recent years [37,38,39,40,41]. The summer NDVI exhibited a one-month lag in response to precipitation variability [26,41]. Since 1961, changes in precipitation have played an important role in increasing vegetation net primary production on the central and southwestern Tibetan Plateau [41]. Co-regulation of warming and precipitation anomalies also play a significant role in the spatial greening of vegetation on the plateau [24,42]. In addition, the global atmospheric CO2 concentration increased from 341 mm in 1982 to 404 ppm in 2016, acting as a principal driver of climate change and influencing vegetation productivity and carbon balance on the Tibetan Plateau [22]. The rise in atmospheric CO2 has facilitated vegetation growth on the plateau by regulating water-use efficiency and photosynthesis [26]. The warmer and wetter conditions in a high CO2 world provide a supportive environment for the regional greening of the Tibetan Plateau [21]. These notable changes in moisture and thermal conditions, accompanied by a steady increase in atmospheric CO2 concentration, have important implications for the spatial and temporal vegetation trends across the Tibetan Plateau [25,26].
The effects and interactions of various climatic factors have led to diverse spatial and temporal vegetation responses [22,42,43]. Consequently, regional and area-mean NDVI trends showed inconsistent responses to climate change [26]. However, previous analyses of NDVI have primarily focused on annual or seasonal means or regional averages over the Tibetan Plateau, with less attention given to the coherent and continuous evolution patterns of vegetation variations and trends across both spatial and temporal scales during the growing season. The causal linkages of spatiotemporal NDVI variations with the combined climate effects of observed climate factors remain unclear, particularly when using long-term remote sensing and meteorological observations. Therefore, the purpose of this study was to reveal the dominant spatiotemporal evolution patterns (SEPs) in long-term vegetation trends, based on a new perspective that considers NDVI changes across the spatiotemporal domain or map. This study focuses on exploring the potential mechanisms underlying the spatiotemporal disparities in vegetation trends in response to observed climate change under global warming.
The remainder of the paper is organized as follow: Section 2 describes the remote sensing and meteorological datasets and the methods utilized in this study. Section 3 presents the main results: Section 3.1 displays the identified spatiotemporal evolution patterns (SEPs) intrinsic to long-term vegetation evolution during the growing season over the Tibetan Plateau, and further quantifies the contribution of different SEPs to vegetation evolution trends from 1982 to 2020. Section 3.2 investigates the spatiotemporal disparities of vegetation trends in response to observed spatial precipitation, temperature, and atmospheric CO2 concentration. This paper is expected to provide insights into the spatiotemporal responses and disparities of regional ecosystems to ongoing climate change.

2. Materials and Methods

2.1. Area of Research

The Tibetan Plateau, located in southwest China between 25–40°N and 70–105°E, covers about one-quarter of China’s territory (Figure 1). It has an average elevation exceeding 4000 m above sea level with significant elevation changes in different regions. Grasslands and open shrublands are the main vegetation types in this region (Figure 1 and Figure 2). The climate is characterized by large seasonal precipitation variation and low daily temperature variation over the plateau. During the main growing season, precipitation (Figure 2b) and temperature (Figure 2c) decrease from southeast to northwest, except for at the northern edge, where temperatures are higher, which aligns with the spatial NDVI distribution (Figure 2a) over the Tibetan Plateau.

2.2. Materials of Observation Datasets

The long-term remote sensing datasets of NDVI integrated from two remote-sensing datasets and climate datasets derived from meteorological stations over the Tibetan Plateau were used to explore the spatiotemporal responses of vegetation variations to climate change. Specifically, the long-term NDVI data were integrated from two datasets covering different periods. One was the Global Inventory Modeling and Mapping Studies (GIMMS) NDVI3g, measured by the advanced very high-resolution radiometer (AVHRR) sensor at an 8 km spatial resolution [44,45]. The GIMMS NDVI was provided by the Ecological Forecasting Lab at the NASA Ames Research Center (https://poles.tpdc.ac.cn/en/data/9775f2b4-7370-4e5e-a537-3482c9a83d88/, accessed on 29 November 2020). The other was MCD19A3CMG NDVI from the Moderate Resolution Imaging Spectroradiometer (MODIS) products at a spatial resolution of 500 m, measured by both Terre and Aqua sensors [46,47,48,49]. These MODIS NDVI data were obtained from the National Aeronautics and Space Administration (NASA) website (http://ladsweb.modaps.eosdis.nasa.gov/, accessed on 6 July 2023). The GIMMS NDVI data starts in January 1982 and ends in December 2014, while the MODIS NDVI data spans from February 2000 to December 2020. Therefore, the integrated NDVI dataset in this study covered the period from January 1982 to December 2020.
Firstly, a linear regression equation was established using the standardized MODIS and GIMMS NDVI datasets for the main growing season (May–September) from 2002 to 2014. There was a significant correlation coefficient of 0.87 (p < 0.05) between the GIMMS and MODIS NDVIs during the main growing season for the overlapping period of 2002–2014 over the Tibetan Plateau [41]. The good agreement and continuity between two datasets support integrating them into a longer dataset covering the period from 1982 to 2020. Then, the established equation was used to fit and splice the 2015–2020 MODIS NDVI to the standardized 1982–2014 GIMMS NDVI. Finally, the standardized NDVI over the Tibetan Plateau for the entire study period from 1982 to 2020 was obtained. More detailed information on the integration of these two datasets used in this study can be found in Mao et al. [41]. In addition, previous studies demonstrated that their integrated long-term data were suitable for studying the spatiotemporal vegetation characteristics [41,42,47,50]. These include research on the interannual variability of NDVI anomalies over the Tibetan Plateau [41,50] and trends in the start of the vegetation growing season [42].
The daily precipitation and temperature datasets from 1982 to 2020 were provided by the National Meteorological Information Center of China Meteorological Administration (CMA) and obtained from the CMA website at http://data.cma.cn/ (accessed on 12 January 2024). As shown in Figure 2b,c, the spatial precipitation and temperature datasets were collected from 136 meteorological stations (gray dots) across the Tibetan Plateau. These daily datasets were then processed into the monthly grid datasets at a 1° spatial resolution, using daily accumulation and Cressman spatial interpolation [50,51]. The relative root mean square error of regional and annual average mean precipitation and temperature in the interpolated grid data was less than 20% over the Tibetan Plateau. The error in the gridded data for the eastern plateau was smaller than that for the western plateau, likely due to the significant spatial variations at the western edge of the plateau and the insufficient number of stations for interpolation. Overall, the interpolated meteorological grid data exhibited good agreement with station observations. The monthly time series of atmospheric CO2 concentration for the same period were obtained from NOAA. To filter out weather noises and focus on seasonal and spatial evolution, we applied a 3-month running mean to the monthly means of NDVI, precipitation, and temperature datasets [36,51].

2.3. Methods

Conventional empirical orthogonal function (EOF) analysis serves as a data reduction method to distinguish “signal” from “noise” and is increasingly utilized in climate and environment variability studies. EOF is often used to capture potential spatial patterns in climate variability and their temporal changes, with the first few patterns typically explaining a significant portion of the total variance in the study domain. Since the identified EOF patterns were independent of each other, each pattern could be interpreted separately and attributed to different physical process. Previous studies have skillfully employed conventional EOF to identify the dominant patterns of climate and vegetation changes over the Tibetan Plateau, which has proved to be useful in the study area [36,41]. EOF analysis can be performed on two or more fields of the same variable in a monthly sequence by forming a joint vector in the space–time domain. This method, often referred to as season-dependent EOF [52] or combined space–time EOF analysis [51], has been used to identify the seasonal evolution of the dominant precipitation mode over the Tibetan Plateau and East Asia [36,51]. Therefore, the combined space–time EOF method is beneficial for analyzing the dominant spatiotemporal patterns of NDVI variations at multiple scales in response to climate change across the Tibetan Plateau.
To identify the spatiotemporal evolution patters in long-term NDVI variations, we adopted combined EOF analysis that considers the space–time domain of monthly NDVI anomalies during the main growing season on the Tibetan Plateau over the period of 1982–2020. In contrast to conventional EOF analysis, which captures spatial patterns and temporal variability of vegetation variables separately, this method rearranges the monthly NDVI anomaly, denoted as N (s, t) where s is spatial grid and t is monthly series, into the new format of N (s, month, year). It reflects both spatial and monthly NDVI variations collectively from year to year. After conducting EOF analysis on N (s, month, year), where (s, month) is the space–month domain while (year) is the temporal domain, the resulting EOF pattern in a space–month domain and corresponding PC variations were obtained by
N ( s , m o n t h , y e a r ) = j = 1 E O F j ( s , m o n t h ) P C j ( y e a r ) ,   where   ( P C j ( y e a r ) ) 2 ¯ 1 ,
where the overbar denotes the 39-year mean of the study period. Here, the leading two EOF modes represent the spatiotemporal evolution patterns (SEPs) of NDVI anomalies over the Tibetan Plateau, and the corresponding principal components (PCs) represent the temporal variations of SEPs. The explained variance percentage (EVj) of each SEP variation relative to the total NDVI variability was calculated by
E V j = < [ E O F j ( s , d a y ) ] 2 > / < [ N ( s , d a y , y e a r ) ] 2 > ,
where j = 1, 2, and “< >” represents the average over the domain of s and month.
To quantify the relative contributions of the spatial and monthly trend amplitudes of individual SEP to the corresponding amplitude of the spatiotemporal trend in total NDVI over the Tibetan Plateau, the pattern–amplitude projection (PAP) was used, following Deng et al. [53]. The PAP coefficient was obtained from
P A P j = < Δ N > × < Δ N j Δ N > < ( Δ N ) 2 > ,
where N is the spatial pattern of total NDVI trends in each month; PAPj and N j are the spatial PAP coefficients and partial NDVI trends of each SEP; “< >” here represents the regional average of the study area. Additionally, least squares regression was used to investigate the spatial patterns of climate change during the growing season associated with the dominant SEP trend from 1982 to 2020. The multi-regression method was employed to calculate the explained variances of trends in three climate indices relative to the dominant SEP trend. The statistical significance of the NDVI trend over the Tibetan Plateau was evaluated by a two-tailed Student’s t-test. In addition, the Pettitt test is widely used in climate change and hydrological analyses, which is a rank-based, nonparametric statistical test to detect potential change points in the time series of variables [54]. The null hypothesis (H0) states that there is no change in the distribution of a sequence of variables. The alternative hypothesis suggests that the distribution function F1(x) for variables from X1 to Xt is different from the distribution function F2(x) for variables from Xt+1 to Xn. To detect the change point, the Pettitt test used was the same as the Mann–Whitney statistic. A change point occurs at the time t when the statistic test is significantly different from zero at a given significance level [54].

3. Results

3.1. Spatiotemporal Evolution Patterns of NDVI Trends over the Tibetan Plateau

Figure 3a shows that the regional mean NDVI anomaly over the entire Tibetan Plateau increased significantly at a rate of 0.00015 per year (p < 0.1) from 1982 to 2020, according to a two-tailed Student’s t-test. This indicates a dominant greening trend in vegetation across the plateau over the past four decades, although this trend slowed down around 2000, consistent with previous studies [22,25,55]. In addition, the Pettitt test results revealed a possible change point in the regional mean NDVI time series in 1987 at a significance level of 0.01. This indicates that the regional mean NDVI anomaly on the plateau significantly increased from 1982 to 1987, followed by fluctuations around a relatively stable average. Despite the overall greening trend at the regional average scale, vegetation variations display significant spatial and temporal discrepancy during the growing season over the Tibetan Plateau [26,41]. Using a combined space–time EOF analysis (see Methods), we identified two spatiotemporal patterns (SEPs) from Tibetan Plateau vegetation evolution in the growing season (Figure 4) and the corresponding year-to-year variations of principle components from 1982 to 2020 (Figure 3b,c). Specifically, SEP1 reflects characteristics of a relatively uniform pattern of the spatial vegetation evolution (Figure 4a), displaying greater (smaller) NDVI variations in areas with dense (sparse) vegetation coverage in the southeastern (northwestern) Tibetan Plateau. Thus, we named SEP1 as the uniform evolution pattern of growing season vegetation, which is similar the multi-year average NDVI distribution in each month (Figure 4c). In contrast, SEP2 exhibits dipole evolution patterns that rotate counterclockwise from May to September. Initially, it forms an east–west dipole during the early growing season (May to June). As the season progresses, it gradually rotates into a north–south dipole in July, and then into a northwest–southeast dipole during August–September (Figure 4b). Thus, SEP2 is referred to as the rotated evolution pattern of growing season vegetation over the Tibetan Plateau.
Collectively, the variations of these two SEPs account for 21.5% of the total variance in both spatial and temporal variations of the growing season NDVI across the Tibetan Plateau, with interannual to interdecadal amplitude variations and long-term trends (Figure 3b,c). The PC1 anomaly of the uniform evolution pattern in NDVI primarily reflects interannual to interdecadal variability, with no significant trend throughout the entire period of 1982–2020 (Figure 3b). Notably, the PC2 variation related to the rotated evolution pattern of vegetation shows a significant long-term trend at a rate of 0.0817 per year (p < 0.01), consistent with the trend of the regional average of the NDVI anomaly over the entire plateau (Figure 3). These two SEPs capture the major evolution characteristics of the spatiotemporal vegetation anomaly over the Tibetan Plateau during the growing season. The uniform evolution pattern in SEP1 dominates spatial vegetation variations at interannual to interdecadal time scales, while the rotational evolution pattern in SEP2 governs the spatial and temporal trends of growing season vegetation evolution throughout the entire study period (Figure 3 and Figure 4).
As shown in Figure 5a, the vegetation trends over the Tibetan Plateau exhibit spatiotemporal heterogeneity and discrepancy in the growing season over the past 40 years, which may stem from the changes of two SEP patterns. Figure 5b,c display the spatiotemporal trends derived from the two SEPs over the same period. SEP1 shows a weak trend signal across the entire Tibetan Plateau, with slight greening only in the southeastern plateau. In contrast, the rotated evolution features in SEP2 trends (Figure 5c) closely resemble those in the total NDVI trend (Figure 5a). The greening trends were more pronounced in the northern parts where vegetation coverage is sparse, while browning trends were observed in the southern regions of the Tibetan Plateau where vegetation coverage is dense. Overall, greening areas in the northern Tibetan Plateau were larger than browning areas in the southern Tibetan Plateau, resulting in a greening trend in terms of the regional average NDVI anomaly over the Tibetan Plateau. Moreover, the spatial distribution of greening and browning in total NDVI and SEP2 is consistent with that revealed by other vegetation indices [26], confirming the robustness of these spatial trends in vegetation of the plateau.
To further quantify the relative contributions of the two SEP trends to the overall NDVI trend across both spatial and temporal dimensions over the Tibetan Plateau, we compared the monthly pattern–amplitude projection (PAP) of spatial trends between the total NDVI and the two SEPs. As illustrated in Figure 5d, the SEP2 trends explain about 62.8% of the spatial mean amplitude of the total NDVI trend during the growing season over the Tibetan Plateau, whereas the SEP1 trends contribute no more than 6%. As the season progresses from May to September, the relative contributions of the SEP2 trends gradually increase, peaking at 66.7% in late summer before weakening to 58.8% by the end of the growing season. This indicates that the long-term trend of the rotated SEP2 patterns dominated the spatiotemporal evolution of vegetation trends across the Tibetan Plateau during 1982–2020.

3.2. The Divergent Effects of Climate Change on Vegetation Evolution Trends

The spatial vegetation trends on the Tibetan Plateau are sensitive to climate change under global warming. Since the 1970s, the Tibetan Plateau has experienced enhanced warming and a north-wetting–south-drying trend under global warming. This makes the Tibetan Plateau a natural laboratory for exploring the spatiotemporal responses of terrestrial ecosystems to climate change over the past four decades [22]. Thus, we further examined the climatic anomalies in precipitation, temperature, and atmospheric CO2 associated with the long-term variability of the dominant SEP2 pattern evident in the plateau vegetation during the growing season. Shown in Figure 6a, the seasonal precipitation changes associated with the NDVI evolution trend exhibit characteristics similar to the dipole evolution patterns observed in total NDVI and SEP2 trends. Specifically, the spatial patterns of precipitation anomalies that rotate counterclockwise from May to August (Figure 6a) correspond to those of the total NDVI (Figure 5a) and SEP2 trends (Figure 5c) from June to September, except for an inconsistent response in the southeastern Tibetan Plateau during July and August. This indicates that the spatial dipole changes of precipitation during May–August have a one-month lag effect on the trend evolution of vegetation during June–September over the Tibetan Plateau.
In contrast, the spatial NDVI trend evolution demonstrates a clear simultaneous relationship with spatial temperature increases across the entire Tibetan Plateau, with varying amplitudes in different regions and months (Figure 6b). Enhanced warming patterns are associated with greening trends on the central and northern Tibetan Plateau, while regions experiencing relatively slight warming correspond to browning trends on the southern Tibetan Plateau. This suggests that spatial warming patterns may have a greater influence on the spatiotemporal evolution of greening areas compared to browning areas over the Tibetan Plateau. Similarly, rising CO2 concentration shows a relatively uniform effect on vegetation SEP2 trends throughout the growing season over the Tibetan Plateau, with slight variations in amplitude (Figure 6c).
To assess the relative contribution of the three climate factors to vegetation evolution trends over the Tibetan Plateau, we defined three climate indices based on the regression maps between vegetation SEP2 trends and observed climate change shown in Figure 6. These indices were (1) the regional and seasonal mean difference in precipitation anomalies between the northern (31–40°N, 90–105°E) and southern (25–31°N, 90–105°E) parts of the Tibetan Plateau from May to July, (2) the regional and seasonal mean temperature anomaly across the entire Tibetan Plateau during the growing season, and (3) the seasonal mean anomaly of atmospheric CO2 concentration in the growing season. Figure 7a–c displays the temporal variations of these three climate indices, revealing that the rising trends of the dipole precipitation, warming, and atmospheric CO2 indices from 1982 to 2020 align with that in the PC2 variability of the rotated evolution pattern (Figure 3c). Moreover, the multidecadal signals observed in the dipole precipitation index resemble those in the PC2 variation, while consistent increasing trends are more pronounced in temperature and atmospheric CO2 changes.
As expected from the results in Figure 6, the spatial NDVI patterns associated with the dipole precipitation index (Figure 7d) closely resemble those of spatiotemporal patterns in the total NDVI and SEP2 trends (Figure 5a,c), indicating that this index effectively captures the one-month lag effect of spatial precipitation change on the rotated evolution of vegetation trends. The warming and rising CO2 indices also reflect their simultaneous effect on spatial greening trends on the central and northern Tibetan Plateau, as well as slight browning trends on the southeastern Tibetan Plateau (Figure 7e,f). We next established a regression model using three climate indices to simulate the PC2 long-term trend (variability) of the dominant vegetation pattern on the Tibetan Plateau. The multi-regression analysis revealed that the observed dipole precipitation, temperature, and CO2 changes contributed 6%, 76%, and 15% to the PC2 trend of the rotated vegetation pattern over the Tibetan Plateau from 1982 to 2020.
Overall, the intensified wetting and warming in the northern plateau were conducive to greening evolution, whereas the slight drying and warming in the southern Tibetan Plateau were favorable for browning evolution over the past four decades (Figure 6 and Figure 7). These results demonstrate that the combined climate effects of spatial precipitation, temperature, and atmospheric CO2 variations play an important role in the spatiotemporal disparities of vegetation evolution trends over the Tibetan Plateau under global warming.

4. Discussion

The Tibetan Plateau, the largest and highest plateau in the world, hosts a unique set of terrestrial ecosystems. Grasslands and open shrublands are dominant vegetation types on the Tibetan Plateau, covering more than half of its terrestrial area. Grasslands and open shrublands in the northern part of the plateau mainly showed a greening trend in recent decades, while those in the southern part exhibited a browning trend. The spatial vegetation evolution on the Tibetan Plateau is highly sensitive to recent observed climate change [56,57]. Investigating the spatial and temporal changes in vegetation and their underlying causes has been a crucial focus since the 1970s [58,59]. At the regional average scale over the entire Tibetan Plateau, the generally increased NDVI from 1982 to 2020 (Figure 3) is consistent with the results of previous studies based on different vegetation indices [26]. However, the trend becomes more variable when the study period is divided into different segments. The NDVI increased from 1982 to 2020, decreased from 2005 to 2015, and then increased again from 2015 to 2020 [25]. This variability stems from the complex interaction of spatial NDVI anomalies across interannual to interdecadal variations and long-term trends. To investigate the complex characteristics and disparities of spatial and temporal vegetation evolution from a new perspective that considers vegetation changes in a space–time image or context during the growing season [36], we decomposed NDVI anomalies into two spatiotemporal patterns with different long-term signals: one was a uniform pattern with interannual variability, and the other was a rotated evolution pattern reflecting long-term trend signals. These spatiotemporal patterns captured the most crucial signals of NDVI trends. In particular, the rotated evolution pattern dominated the NDVI evolution trends across the Tibetan Plateau (Figure 5). Our findings highlight the importance of spatial disparities in NDVI trends during the growing season across the Tibetan Plateau over the past four decades.
Considering the spatiotemporal pattern variability may enhance our understanding of the discrepancies in the relative contributions of climate change and anthropogenic activities to vegetation changes [22,60]. In this study, we found that the trend of the rotated evolution pattern was linked to preceding precipitation and simultaneous temperature variations under rising atmospheric CO2 concentration. Previous studies suggested that rising atmospheric CO2 concentration is the main cause of increased vegetation productivity in the grasslands of the eastern plateau [22], consistent with the greening signals observed from May to June in Figure 7. Rising atmospheric CO2 tended to simulate vegetation growth by affecting water-use efficiency and photosynthesis on the plateau [26]. Figure 7 also indicates that as the season progresses, vegetation exhibits spatial and temporal disparities in response to rising atmospheric CO2. After removing the overlapping increase of signals between CO2 and temperature, regression analysis indicated that CO2 change contributed 15% to the dominant trend of spatiotemporal vegetation on the plateau. The complex interaction mechanisms of climate factors and rising CO2 in the spatial disparities of vegetation dynamics deserve future investigation.
As shown in Figure 3c and Figure 7, despite the overall greening trend, the decreasing NDVI trend during 2005–2015 stemmed from a decreased PC2 trend in the rotated evolution pattern, which is linked to the slowdown of dipole precipitation and warming trends. This finding is consistent with previous studies suggesting that the NDVI in the grasslands across the Tibetan Plateau decreased from 2000 to 2015, although this trend was spatially heterogeneous. In the northern grasslands, where annual precipitation is less than 100 mm, warmer temperature tended to intensify water deficiency in the relatively dry zone, exacerbating the NDVI decline [25,26]. Additionally, the relative uniform NDVI pattern (Figure 4a) is similar to that identified using the conventional EOF method, which also exhibits interannual variability signals primarily modulated by the precipitation and sunshine duration [41]. These findings demonstrate that spatiotemporal NDVI changes are highly complex and influenced by multiple climatic factors and their interactions [25]. Understanding how these factors interact and influence regional vegetation changes over the Tibetan Plateau requires in-depth investigation.
In addition to precipitation, temperature, and rising CO2, other factors have influenced spatial vegetation trends over the Tibetan Plateau. Snow cover, soil melting and freezing processes, and atmospheric circulation changes have been found to regulate the regional vegetation changes over the Tibetan Plateau [56,61,62,63,64,65]. Moreover, overgrazing and land cover change have been suggested as the primary causes for grassland degradation on the southern Tibetan Plateau due to the increased domestic animal population affecting livestock carrying capacity. However, the effects of grazing on vegetation growth depend on intensity and duration, which are difficult to quantify due to limited observations [66,67]. Therefore, further studies are needed to explore the role of land use change in regional vegetation variations, using spatially and temporally explicit historical degradation datasets [60,67,68]. Meanwhile, increased atmospheric wet nitrogen deposition through rainfall, primarily transported from anthropogenic aerosols in the Middle East and Central Asia via the Asian summer monsoon, has been identified as having impacts on vegetation growth activity [69,70,71]. To achieve a fundamental understanding of spatial and temporal vegetation disparities and the underlying mechanisms, further investigations into the combined effects of various factors on spatiotemporal vegetation evolution over the Tibetan Plateau are necessary.
Note that the vegetation greenness detected by NDVI in this study suffers from measurement limitations, such as the effects of soil moisture, anisotropy, spectral responses of the sensor, and atmospheric aerosols, which may lead to systematic errors in assessing spatial vegetation variability [72,73,74]. For example, NDVI measurements can vary due to soil moisture changes rather than actual vegetation changes; high soil moisture can increase near-infrared reflectance, making vegetation appear greener than it is [74]. NDVI values may also be affected by the anisotropy of vegetation types and the sun–sensor geometry during measurements, causing the same area to have different NDVI values at different times of the day or year due to changing sun angles [72]. Although the spatial greening and browning trends detected by the NDVI showed good agreement with other vegetation indices, such as the leaf area index (LAI), enhanced vegetation index (EVI), and near-infrared reflectance vegetation index (NIRv) during the overlapping period of 2001–2016 from various data sources [26], there is still a need for more satellite-based vegetation indices and enhanced long-term ground observations to validate and analyze the spatiotemporal variations of vegetation greenness in response to climate change at a regional scale [1].
Overall, our findings provide a scientific basis for understanding the spatial and temporal patterns of long-term vegetation evolution and developing targeted conservation strategies for terrestrial ecosystems over the Tibetan Plateau under global warming. Simulation results suggest that the climate on the Tibetan Plateau is projected to be warmer and wetter compared to other regions at the same latitude [75,76,77]. Vegetation trends, manifested in spatiotemporal patterns associated with projected changes in precipitation and temperature as well as rising CO2, may serve as a reference framework for predicting long-term vegetation evolution in response to future climate change [78,79,80]. Further investigation is required to understand the potential mechanisms underlying the spatiotemporal evolution of vegetation indices in various vulnerable areas [24,25,81,82,83], affected by meteorological factors, using more extensive long-term remote sensing and observational datasets.

5. Conclusions

Based on multiple station-observed meteorological datasets and long-term remote-sensing NDVI datasets, this study reveals the characteristics of the two spatiotemporal evolution patterns intrinsic to Tibetan Plateau vegetation anomalies and highlights the combined effects of observed climate change on the spatiotemporal disparities of vegetation trends over the Tibetan Plateau over the past four decades.
Despite a greening trend observed at the regional average scale, the NDVI variation exhibits notable spatial and temporal discrepancy during the growing season across the Tibetan Plateau. Two significant spatiotemporal patterns (SEPs) of long-term vegetation evolution over the Tibetan Plateau from 1982 to 2020 were identified. SEP1 captures a uniform evolution pattern of Tibetan Plateau vegetation characterized by interannual to interdecadal variability, while SEP2 represents dipole evolution patterns that rotate counterclockwise and are dominated by a long-term trend. Notably, the SEP2 trends contributed 62.8% to the spatial mean amplitude of the total NDVI trend, whereas the contribution of the SEP1 trends did not exceed 6%. The long-term trend of the rotated evolution pattern has dominated the spatiotemporal disparities of vegetation evolution trends on the Tibetan Plateau during the entire study period.
The Tibetan Plateau serves as a natural laboratory for investigating the distinct responses of vegetation trends to observed climate change under global warming. Spatial precipitation changes exhibit a one-month lag effect on the rotated evolution patterns of vegetation trends during the growing season. In contrast, warming and rising CO2 display simultaneous positive effects on the divergent vegetation trends, having a greater impact on the spatial greening evolution over the central and northern Tibetan Plateau than the browning evolution over the southern Tibetan Plateau. Defined indices of precipitation, temperature, and CO2 contributed 6%, 76%, and 15% to the trend of the dominant vegetation pattern over the Tibetan Plateau from 1982 to 2020. Overall, the wetting and warming in the northern region promoted spatial greening evolution, whereas the slight drying and warming in the southern region favored spatial browning evolution across the Tibetan Plateau. This indicates that the combined climatic effects of spatial precipitation, temperature, and atmospheric CO2 changes play an important role in the spatiotemporal evolution disparities of vegetation trends over the Tibetan Plateau under global warming. The main conclusions were obtained as follows.
  • The dipole evolution pattern that rotates anticlockwise during the growing season dominated the spatiotemporal disparities of vegetation trends on the Tibetan Plateau from 1982 to 2020.
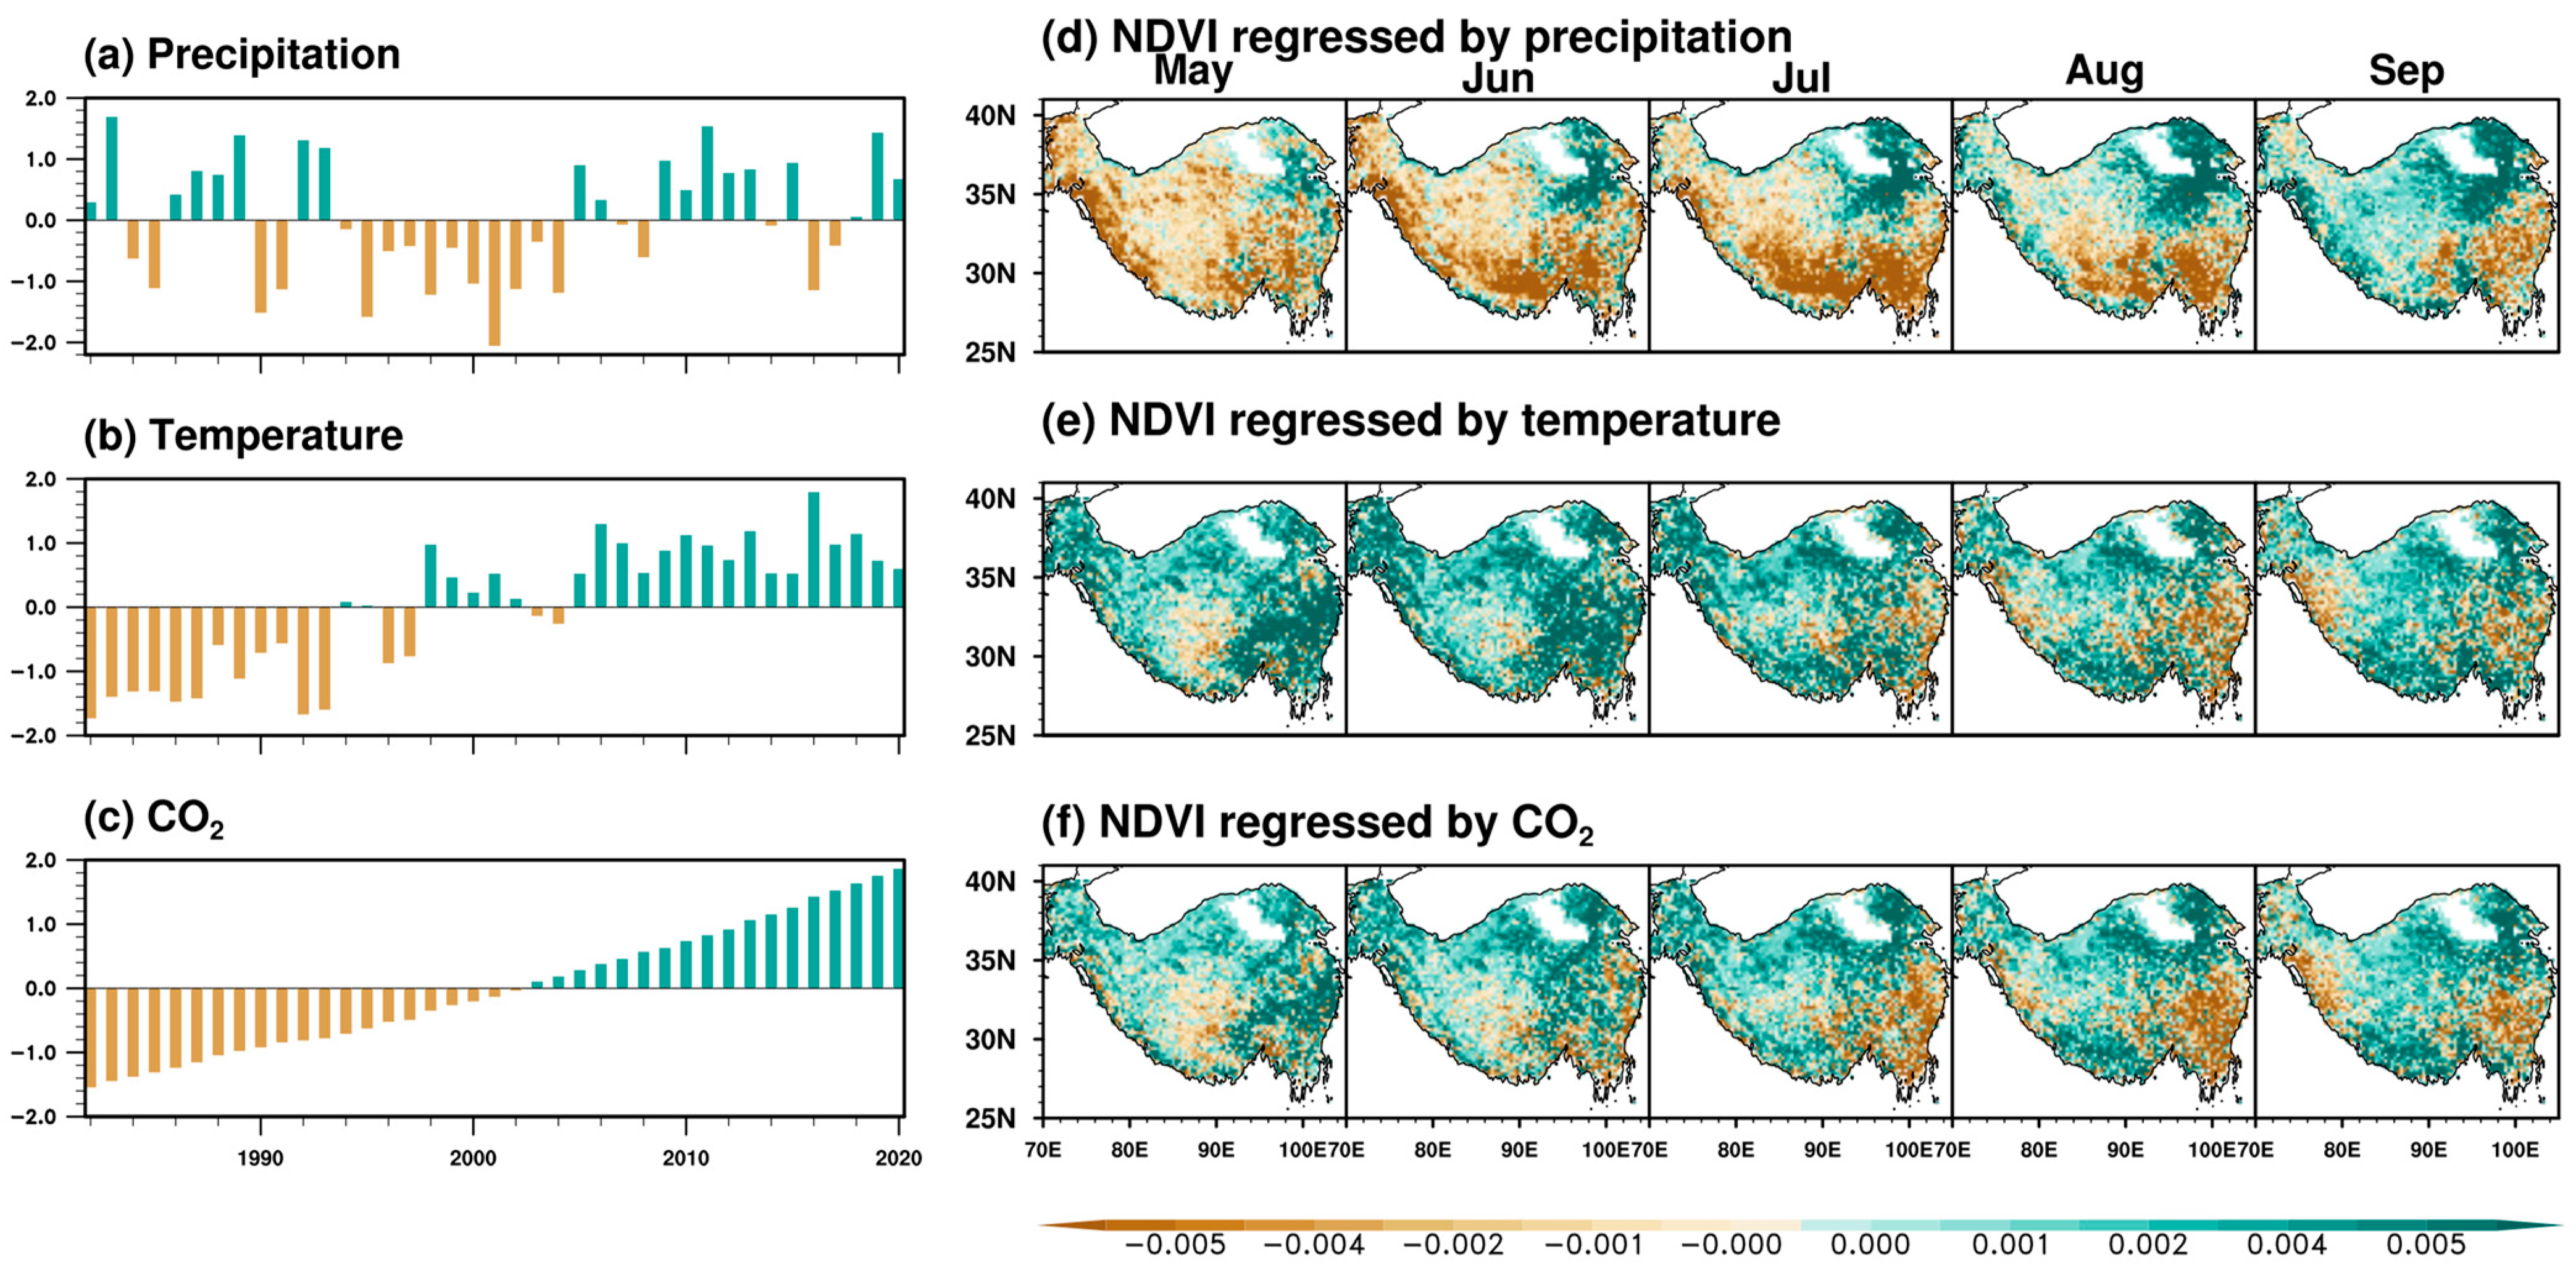
  • The spatial precipitation pattern exhibited a one-month lag effect, while warming and rising CO2 displayed simultaneous positive effects on the divergent vegetation trends.
  • Wetting and warming promoted greening evolution over the northern Tibetan Plateau, while weak drying and warming favored browning evolution over the southern Tibetan Plateau.

Author Contributions

Conceptualization, H.-L.R. and J.M.; methodology, J.M. and X.M. (Xudong Ma); software, J.M.; validation, J.M. and X.M. (Xin Mao); formal analysis, J.M. and T.W.; investigation, J.M., H.-L.R., X.M. (Xin Mao) and M.L.; writing—original draft preparation, J.M.; writing—review and editing, J.M., X.M. (Xin Mao), H.-L.R., X.M. (Xudong Ma), M.L. and T.W.; supervision, H.-L.R.; funding acquisition, H.-L.R. and J.M. All authors have read and agreed to the published version of the manuscript.

Funding

This research was jointly supported by the National Key Research and Development Program of China (Grant number 2023YFC3007503), the China National Natural Science Foundation (Grant number 42305044), the Innovation and Development Special Project of China Meteorological Administration (Grant number CXFZ2023J050), and the Basic Research and Operational Special Projects (Grant number 2023Z003) of Chinese Academy of Meteorological Sciences.

Data Availability Statement

In this study, GIMMS NDVI datasets were obtained from the ECOCAST, which can be downloaded from the website at https://poles.tpdc.ac.cn/en/data/9775f2b4-7370-4e5e-a537-3482c9a83d88/ (accessed on 29 November 2020). MODI NDVI datasets were provided by the LADDS DAAC/NASA, which can be obtained from the website at https://ladsweb.modaps.eosdis.nasa.gov/ (accessed on 6 July 2023). The monthly meteorological datasets of in situ precipitation and temperature were provided by the National Meteorological Information Center, downloaded from the website at http://data.cma.cn/ (assessed on 12 January 2024). The monthly time series of atmospheric CO2 concentration data is available at http://www.esrl.noaa.gov/gmd/ccgg/trends/ (accessed on 5 May 2024). The vegetation classification is derived from the Climate Data Guide: Clouds and Earth’s Radiant Energy System (CERES) Land Classification. Retrieved from https://climatedataguide.ucar.edu/climate-data/ceres-igbp-land-classification (accessed on 30 June 2024).

Acknowledgments

We really appreciate ECOCAST, LADDS DAAC/NASA, and NOAA for providing the long-term time-series of NDVI and CO2 datasets. We also thank National Meteorological Information Center for providing the meteorological precipitation and temperature datasets. We also appreciate CERES for providing the vegetation classification datasets.

Conflicts of Interest

The authors declare no conflicts of interest.

References

  1. Piao, S.L.; Wang, X.H.; Park, T.; Chen, C.; Lian, X.; He, Y.; Bjerke, J.W.; Chen, A.P.; Ciais, P.; Tømmervik, H.; et al. Characteristics, drivers and feedbacks of global greening. Nat. Rev. Earth Environ. 2020, 1, 14–27. [Google Scholar] [CrossRef]
  2. Forzieri, G.; Miralles, D.G.; Ciais, P.; Alkama, R.; Ryu, Y.; Duveiller, G.; Zhang, K.; Robertson, E.; Kautz, M.; Martens, B.; et al. Increased control of vegetation on global terrestrial energy fluxes. Nat. Clim. Chang. 2020, 10, 356–362. [Google Scholar] [CrossRef]
  3. Keeling, C.D.; Chin, J.F.S.; Whorf, T.P. Increased activity of northern vegetation inferred from atmospheric CO2 measurements. Nature 1996, 382, 146–149. [Google Scholar] [CrossRef]
  4. Chen, J.M.; Ju, W.M.; Ciais, P.; Viovy, N.; Liu, R.; Liu, Y.; Lu, X.H. Vegetation structural change since 1981 significantly enhanced the terrestrial carbon sink. Nat. Commun. 2019, 10, 4259. [Google Scholar] [CrossRef]
  5. Sobrino, J.A.; Julien, Y. Global trends in NDVI-derived parameters obtained from GIMMS data. Int. J. Remote Sens. 2011, 32, 4267–4279. [Google Scholar] [CrossRef]
  6. Liu, Y.L.; Lei, H.M. Responses of Natural Vegetation Dynamics to Climate Drivers in China from 1982 to 2011. Remote Sens. 2015, 7, 10243–10268. [Google Scholar] [CrossRef]
  7. Chen, J.H.; Yan, F.; Lu, Q. Spatiotemporal Variation of Vegetation on the Qinghai–Tibet Plateau and the Influence of Climatic Factors and Human Activities on Vegetation Trend (2000–2019). Remote Sens. 2020, 12, 3150. [Google Scholar] [CrossRef]
  8. Xu, L.; Myneni, R.B.; Chapin III, F.S.; Callaghan, T.V.; Pinzon, J.E.; Tucker, C.J.; Zhu, Z.; Bi, J.; Ciais, P.; Tømmervik, H.; et al. Temperature and vegetation seasonality diminishment over northern lands. Nat. Clim. Chang. 2013, 3, 581–586. [Google Scholar] [CrossRef]
  9. Zhu, Z.C.; Piao, S.L.; Myneni, R.B.; Huang, M.T.; Zeng, Z.Z.; Canadell, J.G.; Ciais, P.; Sitch, S.; Friedlingstein, P.; Arneth, A.; et al. Greening of the Earth and its drivers. Nat. Clim. Chang. 2016, 6, 791–795. [Google Scholar] [CrossRef]
  10. Chen, C.; Park, T.; Wang, X.H.; Piao, S.L.; Xu, B.D.; Chaturvedi, R.K.; Fuchs, R.; Brovkin, V.; Ciais, P.; Fensholt, R.; et al. China and India lead in greening of the world through land-use management. Nat. Sustain. 2019, 2, 122–129. [Google Scholar] [CrossRef]
  11. Masson-Delmotte, V.; Zhai, P.; Pirani, A.; Connors, S.L.; Péan, C.; Berger, S.; Caud, N.; Chen, Y.; Goldfarb, L.; Gomis, M.I.; et al. IPCC, 2021: Climate Change 2021: The Physical Science Basis. Contribution of Working Group I to the Sixth Assessment Report of the Intergovernmental Panel on Climate Change; Cambridge University Press: Cambridge, UK; New York, NY, USA, 2021; p. 2391. [Google Scholar] [CrossRef]
  12. Arneth, A.; Barbosa, H.; Benton, T.; Calvin, K.; Calvo, E.; Connors, S.; Cowie, A.; Davin, E.; Denton, F.; Diemen, R.; et al. IPCC Special Report on Climate Change and Land. Intergovernmental Panel on Climate Change (IPCC). 2019. Available online: https://www.ipcc.ch/report/srccl/ (accessed on 10 October 2023).
  13. Myers-Smith, I.H.; Kerby, J.T.; Phoenix, G.K.; Bjerke, J.W.; Epstein, H.E.; Assmann, J.J.; John, C.; Andreu-Hayles, L.; Angers-Blondin, S.; Beck, P.S.A.; et al. Complexity revealed in the greening of the Arctic. Nat. Clim. Chang. 2020, 10, 106–117. [Google Scholar] [CrossRef]
  14. Xu, X.D.; Lu, C.G.; Shi, X.H.; Gao, S.T. World water tower: An atmospheric perspective. Geophys. Res. Lett. 2008, 35, L20815. [Google Scholar] [CrossRef]
  15. Kang, S.C.; Xu, Y.W.; You, Q.L.; Flügel, W.A.; Pepin, N.; Yao, T.D. Review of climate and cryospheric change in the Tibetan Plateau. Environ. Res. Lett. 2010, 5, 015101. [Google Scholar] [CrossRef]
  16. Immerzeel, W.W.; Lutz, A.F.; Andrade, M.; Bahl, A.; Biemans, H.; Bolch, T.; Hyde, S.; Brumby, S.; Davies, B.J.; Elmore, A.C.; et al. Importance and vulnerability of the world’s water towers. Nature 2020, 577, 364–369. [Google Scholar] [CrossRef] [PubMed]
  17. Wu, G.X.; Zhou, X.J.; Xu, X.D.; Huang, J.P.; Duan, A.M.; Yang, S.; Hu, W.T.; Ma, Y.M.; Liu, Y.M.; Bian, J.C.; et al. An Integrated Research Plan for the Tibetan Plateau Land–Air Coupled System and Its Impacts on the Global Climate. Bull. Am. Meteor. Soc. 2023, 104, E158–E177. [Google Scholar] [CrossRef]
  18. Huang, J.P.; Zhou, X.J.; Wu, G.X.; Xu, X.D.; Zhao, Q.Y.; Liu, Y.M.; Duan, A.M.; Xie, Y.K.; Ma, Y.M.; Zhao, P.; et al. Global Climate Impacts of Land-Surface and Atmospheric Processes Over the Tibetan Plateau. Rev. Geophys. 2023, 61, e2022RG000771. [Google Scholar] [CrossRef]
  19. Pu, Z.; Xu, L.; Salomonson, V.V. MODIS/Terra observed seasonal variations of snow cover over the Tibetan Plateau. Geophys. Res. Lett. 2007, 34, L06706. [Google Scholar] [CrossRef]
  20. Zhong, L.; Ma, Y.; Salama, M.S.; Su, Z.B. Assessment of vegetation dynamics and their response to variations in precipitation and temperature in the Tibetan Plateau. Clim. Chang. 2010, 103, 519–535. [Google Scholar] [CrossRef]
  21. Ehlers, T.A.; Chen, D.; Appel, E.; Bolch, T.; Chen, F.; Diekmann, B.; Dippold, M.A.; Giese, M.; Guggenberger, G.; Lai, H.W.; et al. Past, present, and future geo-biosphere interactions on the Tibetan Plateau and implications for permafrost. Earth-Sci. Rev. 2022, 234, 104197. [Google Scholar] [CrossRef]
  22. Piao, S.L.; Tan, K.; Nan, H.J.; Ciais, P.; Fang, J.Y.; Wang, T.; Vuichard, N.; Zhu, B. Impacts of climate and CO2 changes on the vegetation growth and carbon balance of Qinghai–Tibetan grasslands over the past five decades. Glob. Planet. Chang. 2012, 98–99, 73–80. [Google Scholar] [CrossRef]
  23. Yang, K.H.; Wu, J.Q.; Lin, C.G.; Tang, W.J.; Chen, Y.Y. Recent climate changes over the Tibetan Plateau and their impacts on energy and water cycle: A review. Glob. Planet. Chang. 2014, 112, 79–91. [Google Scholar] [CrossRef]
  24. Wang, C.P.; Huang, M.T.; Zhai, P.M. Co-influence of the start of thermal growing season and precipitation on vegetation spring green-up on the Tibetan Plateau. Adv. Clim. Chang. Res. 2024, 15, 327–337. [Google Scholar] [CrossRef]
  25. Wang, Y.F.; Lv, W.W.; Xue, K.; Wang, S.P.; Zhang, L.R.; Hu, R.H.; Zeng, H.; Xu, X.L.; Li, Y.M.; Jiang, L.L.; et al. Grassland changes and adaptive management on the Qinghai–Tibetan Plateau. Nat. Rev. Earth Environ. 2022, 3, 668–683. [Google Scholar] [CrossRef]
  26. Zhu, Z.Q.; Wang, H.; Harrison, S.P.; Prentice, I.C.; Qiao, S.C.; Tan, S. Optimality principles explaining divergent responses of alpine vegetation to environmental change. Glob. Chang. Biol. 2023, 29, 126–142. [Google Scholar] [CrossRef] [PubMed]
  27. Piao, S.L.; Ciais, P.; Huang, Y.; Shen, Z.H.; Peng, S.S.; Li, J.S.; Zhou, L.P.; Liu, H.Y.; Ma, Y.C.; Ding, Y.H.; et al. The impacts of climate change on water resources and agriculture in China. Nature 2010, 467, 43–51. [Google Scholar] [CrossRef] [PubMed]
  28. Duan, A.M.; Xiao, Z.X. Does the climate warming hiatus exist over the Tibetan Plateau? Sci. Rep. 2015, 5, 13711. [Google Scholar] [CrossRef] [PubMed]
  29. Ma, J.R.; Zhang, T.H.; Guan, X.D.; Hu, X.M.; Duan, A.M. The dominant role of snow/ice albedo feedback strengthened by black carbon in the enhanced warming over the Himalayas. J. Clim. 2019, 32, 5883–5899. [Google Scholar] [CrossRef]
  30. Ma, J.R.; Guan, X.D.; Guo, R.X.; Gan, Z.W.; Xie, Y.K. Mechanism of non-appearance of hiatus in Tibetan Plateau. Sci. Rep. 2017, 7, 4421. [Google Scholar] [CrossRef]
  31. Hansen, J.; Ruedy, R.; Sato, M.; Lo, K. Global surface temperature change. Rev. Geophys. 2010, 48, 4. [Google Scholar] [CrossRef]
  32. Yao, T.D.; Bolch, T.; Chen, D.L.; Gao, J.; Immerzeel, W.; Piao, S.L.; Su, F.G.; Thompson, L.; Wada, Y.; Wang, L.; et al. The imbalance of the Asian water tower. Nat. Rev. Earth Environ. 2022, 3, 618–632. [Google Scholar] [CrossRef]
  33. Yao, T.; Thompson, L.; Yang, W.; Yu, W.; Gao, Y.; Guo, X.; Yang, X.; Duan, K.; Zhao, H.; Xu, B.; et al. Different glacier status with atmospheric circulations in Tibetan Plateau and surroundings. Nat. Clim. Chang. 2012, 2, 663–667. [Google Scholar] [CrossRef]
  34. Hu, S.; Zhou, T.J. Skillful prediction of summer rainfall in the Tibetan Plateau on multiyear time scales. Sci. Adv. 2021, 7, eabf9395. [Google Scholar] [CrossRef] [PubMed]
  35. Jiang, J.; Zhou, T.J.; Qian, Y.; Li, C.; Song, F.F.; Li, H.M.; Chen, X.L.; Zhang, W.X.; Chen, Z.M. Precipitation regime changes in High Mountain Asia driven by cleaner air. Nature 2023, 623, 544–549. [Google Scholar] [CrossRef] [PubMed]
  36. Ma, J.R.; Ren, H.L.; Cai, M.; Huang, J.P. Seasonally Evolving Trends Explain the North-South Dipole Pattern Observed in Tibetan Plateau Precipitation. Geophys. Res. Lett. 2023, 50, e2023GL104891. [Google Scholar] [CrossRef]
  37. Hua, W.; Fan, G.Z.; Zhou, D.W.; Ni, C.J.; Li, X.M.; Wang, Y.L.; Liu, Y.Q.; Huang, X.L. Preliminary analysis on the relationships between Tibetan Plateau NDVI change and its surface heat source and precipitation of China. Sci. China. Ser. D-Earth Sci. 2008, 51, 677–685. [Google Scholar] [CrossRef]
  38. Wang, Y.X.; Zhao, P.; Yu, R.C.; Rasul, G. Inter-decadal variability of Tibetan spring vegetation and its associations with eastern China spring rainfall. Int. J. Climatol. 2009, 30, 856–865. [Google Scholar] [CrossRef]
  39. Zuo, Z.Y.; Zhang, R.H.; Zhao, P. The relation of vegetation over the Tibetan Plateau to rainfall in China during the boreal summer. Clim. Dyn. 2011, 36, 1207–1219. [Google Scholar] [CrossRef]
  40. Huang, X.L.; Zhang, T.B.; Yi, G.H.; He, D.; Zhou, X.B.; Li, J.J.; Bie, X.J.; Miao, J.Q. Dynamic Changes of NDVI in the Growing Season of the Tibetan Plateau during the Past 17 Years and Its Response to Climate Change. Int. J. Environ. Res. Public Health 2019, 16, 3452. [Google Scholar] [CrossRef]
  41. Mao, X.; Ren, H.-L.; Liu, G. Primary Interannual Variability Patterns of the Growing-Season NDVI over the Tibetan Plateau and Main Climatic Factors. Remote Sens. 2022, 14, 5183. [Google Scholar] [CrossRef]
  42. Zhang, G.L.; Zhang, Y.J.; Dong, J.W.; Xiao, X.M. Green-up dates in the Tibetan Plateau have continuously advanced from 1982 to 2011. Proc. Nat. Acad. Sci. USA 2013, 110, 4309–4314. [Google Scholar] [CrossRef]
  43. Ukkola, A.M.; Prentice, I.C.; Keenan, T.F.; van Dijk, A.I.J.M.; Viney, N.R.; Myneni, R.B.; Bi, J. Reduced streamflow in water-stressed climates consistent with CO2 effects on vegetation. Nat. Clim. Chang. 2015, 6, 75–78. [Google Scholar] [CrossRef]
  44. Fensholt, R.; Rasmussen, K.; Nielsen, T.T.; Mbow, C. Evaluation of earth observation based long term vegetation trends—Intercomparing NDVI time series trend analysis consistency of Sahel from AVHRR GIMMS. Terra MODIS and SPOT VGT data. Remote Sens. Environ. 2009, 113, 1886–1898. [Google Scholar] [CrossRef]
  45. Alcaraz-Segura, D.; Liras, E.; Tabik, S.; Paruelo, J.; Cabello, J. Evaluating the consistency of the 1982–1999 NDVI trends in the Iberian Peninsula across four time-series derived from the AVHRR sensor. LTDR, GIMMS, FASIR, and PAL-II. Sensors 2010, 10, 1291–1314. [Google Scholar] [CrossRef] [PubMed]
  46. Lyapustin, A.; Wang, Y.J.; Korkin, S.; Huang, D. MODIS Collection 6 MAIAC Algorithm. Atmos. Meas. Tech. 2018, 11, 5741–5765. [Google Scholar] [CrossRef]
  47. Chen, Y.L.; Long, B.J.; Pan, X.B.; Zhong, S.Q.; Mo, W.H. Differences between MODIS NDVI and AVHRR NDVI in monitoring grasslands change. J. Remote Sens. 2011, 15, 831–845. [Google Scholar] [CrossRef]
  48. Tucker, C.J.; Pinzon, J.E.; Brown, M.E.; Slayback, D.A.; Pak, E.W.; Mahoney, R.; Vermote, E.F.; Saleous, N.E. An extended AVHRR 8-km NDVI dataset compatible with MODIS and SPOT vegetation NDVI data. Int. J. Remote Sens. 2005, 26, 4485–4498. [Google Scholar] [CrossRef]
  49. Park, H.S.; Sohn, B.J. Recent trends in changes of vegetation over East Asia coupled with temperature and rainfall variations. J. Geophys. Res.-Atmos. 2010, 115, D14101. [Google Scholar] [CrossRef]
  50. Mao, X.; Ren, H.-L.; Liu, G.; Su, B.H.; Sang, Y.H. Influence of the Indian summer monsoon on inter-annual variability of the Tibetan-plateau NDVI in its main growing season. Remote Sens. 2023, 15, 3612. [Google Scholar] [CrossRef]
  51. Ma, J.R.; Sun, J.; Wu, Z.H.; Huang, J.P.; Xu, X.F.; Deng, Y.; Cai, M. Pushing the boundary of seasonal prediction with the lever of varying annual cycles. Sci. Bull. 2023, 68, 105–116. [Google Scholar] [CrossRef]
  52. Wang, B.; An, S. A method for detecting season-dependent modes of climate variability: S-EOF analysis. Geophys. Res. Lett. 2005, 32, L15710. [Google Scholar] [CrossRef]
  53. Deng, Y.; Park, T.W.; Cai, M. Process-based decomposition of the global surface temperature response to El Niño in boreal winter. J. Atmos. Sci. 2012, 69, 1706–1712. [Google Scholar] [CrossRef]
  54. Pettitt, A.N. A non-parametric approach to the change-point problem. J. R. Stat. Soc. C-Appl. 1979, 28, 126–135. [Google Scholar] [CrossRef]
  55. Xu, H.J.; Wang, X.P.; Zhang, X.X. Alpine grasslands response to climatic factors and anthropogenic activities on the Tibetan Plateau from 2000 to 2012. Ecol. Eng. 2016, 92, 251–259. [Google Scholar] [CrossRef]
  56. Du, J.Q.; Zhao, C.X.; Shu, J.M.; Jiaerheng, A.; Yuan, X.J.; Yin, J.Q.; Fang, S.F.; He, P. Spatiotemporal changes of vegetation on the Tibetan Plateau and relationship to climatic variables during multiyear periods from 1982–2012. Environ. Earth Sci. 2016, 75, 1–18. [Google Scholar] [CrossRef]
  57. Yu, Y.R.; Fang, S.B.; Zhuo, W. Revealing the Driving Mechanisms of Land Surface Temperature Spatial Heterogeneity and Its Sensitive Regions in China Based on GeoDetector. Remote Sens. 2023, 15, 2814. [Google Scholar] [CrossRef]
  58. Shen, B.; Fang, S.B.; Li, G. Vegetation coverage changes and their response to meteorological variables from 2000 to 2009 in Naqu, Tibet, China. Can. J. Remote Sens. 2014, 40, 67–74. [Google Scholar] [CrossRef]
  59. Fang, S.B.; Zhang, X.S. Control of vegetation distribution: Climate, geological substrate, and geomorphic factors. A case study of grassland in Ordos, Inner Mongolia. China. Can. J. Remote Sens. 2013, 39, 167–174. [Google Scholar] [CrossRef]
  60. Ye, S.; Liu, D.; Yao, X.; Tang, H.; Xiong, Q.; Zhuo, W.; Du, Z.; Huang, J.; Su, W.; Shen, S.; et al. RDCRMG: A Raster Dataset Clean & Reconstitution Multi-Grid Architecture for Remote Sensing Monitoring of Vegetation Dryness. Remote Sens. 2018, 10, 1376. [Google Scholar] [CrossRef]
  61. Dong, W.H.; Lin, Y.Y.; Wright, J.; Ming, Y.; Xie, Y.Y.; Wang, B.; Luo, Y.; Huang, W.Y.; Huang, J.B.; Wang, L.; et al. Summer rainfall over the southwestern Tibetan Plateau controlled by deep convection over the Indian subcontinent. Nat. Commun. 2016, 7, 10925. [Google Scholar] [CrossRef]
  62. Wang, Z.Q.; Duan, A.M.; Yang, S.; Ullah, K. Atmospheric moisture budget and its regulation on the variability of summer precipitation over the Tibetan Plateau. J. Geophys. Res. Atmos. 2017, 122, 614–630. [Google Scholar] [CrossRef]
  63. You, Q.L.; Wu, T.; Shen, L.C.; Pepin, N.; Zhang, L.; Jiang, Z.L.; Wu, Z.W.; Kang, S.C.; Aghakouchak, A. Review of snow cover variation over the Tibetan Plateau and its influence on the broad climate system. Earth-Sci. Rev. 2020, 201, 103043. [Google Scholar] [CrossRef]
  64. Zhang, Y.; Li, T.; Wang, B. Decadal change of the spring snow depth over the Tibetan Plateau: The associated circulation and influence on the East Asian summer monsoon. J. Clim. 2004, 17, 2780–2793. [Google Scholar] [CrossRef]
  65. Chen, H.; Zhu, Q.; Wu, N.; Wang, Y.F.; Peng, C.H. Delayed spring phenology on the Tibetan Plateau may also be attributable to other factors than winter and spring warming. Proc. Nat. Acad. Sci. USA 2011, 108, E93. [Google Scholar] [CrossRef] [PubMed]
  66. Bardgett, R.D.; Bullock, J.M.; Lavorel, S.; Manning, P.; Schaffner, U.; Ostle, N.; Chomel, M.; Durigan, G.; Fry, E.L.; Johnson, D.; et al. Combatting global grassland degradation. Nat. Rev. Earth Environ. 2021, 2, 720–735. [Google Scholar] [CrossRef]
  67. Zhu, Q.; Chen, H.; Peng, C.; Liu, J.X.; Piao, S.L.; He, J.; Wang, S.; Zhao, X.; Zhang, J.; Fang, X.; et al. An early warming signal for grassland degradation on the Qinghai-Tibetan Plateau. Nat. Commun. 2023, 14, 6406. [Google Scholar] [CrossRef] [PubMed]
  68. Zhang, Y.; Yin, P.; Li, X.; Niu, Q.; Wang, Y.; Cao, W.; Huang, J.; Chen, H.; Yao, X.; Yu, L.; et al. The divergent response of vegetation phenology to urbanization: A case study of Beijing city, China. Sci. Total Environ. 2022, 803, 150079. [Google Scholar] [CrossRef]
  69. Jia, Y.L.; Yu, G.R.; He, N.P.; Zhan, X.Y.; Fang, H.J.; Sheng, W.P.; Zuo, Y.; Zhang, D.Y.; Wang, Q.F. Spatial and decadal variations in inorganic nitrogen wet deposition in China induced by human activity. Sci. Rep. 2014, 4, 3763. [Google Scholar] [CrossRef]
  70. Liu, Y.W.; Xu, R.; Wang, Y.S.; Pan, Y.P.; Piao, S.L. Wet deposition of atmospheric inorganic nitrogen at five remote sites in the Tibetan Plateau. Atmos. Chem. Phys. 2015, 15, 11683–11700. [Google Scholar] [CrossRef]
  71. Wang, W.; Guan, L.X.; Wen, Z.; Ma, X.; Fang, J.P.; Liu, X.J. Atmospheric nitrogen deposition to a southeast Tibetan Forest ecosystem. Atmosphere 2020, 11, 1331. [Google Scholar] [CrossRef]
  72. Baret, F.; Guyot, G. Potentials and limits of vegetation indices for LAI and APAR assessment. Remote Sens. Environ. 1991, 35, 161–173. [Google Scholar] [CrossRef]
  73. Jackson, R.D.; Huete, A.R. Interpreting vegetation indices. Prev. Vet. Med. 1991, 11, 185–200. [Google Scholar] [CrossRef]
  74. Bannari, A.; Morin, D.; Bonn, F.; Huete, A. A Review of Vegetation Indices. Remote Sens. Rev. 1995, 13, 95–120. [Google Scholar] [CrossRef]
  75. Moss, R.H.; Edmonds, J.A.; Hibbard, K.A.; Manning, M.R.; Rose, S.K.; van Vuuren, D.P.; Carter, T.R.; Emori, S.; Kainuma, M.; Kram, T.; et al. The next generation of scenarios for climate change research and assessment. Nature 2010, 463, 747–756. [Google Scholar] [CrossRef] [PubMed]
  76. Zhang, R.H.; Su, F.G.; Jiang, Z.H.; Gao, X.J.; Guo, D.L.; Ni, J.; You, Q.L.; Lan, C.; Zhou, B.T. An overview of projected climate and environmental changes across the Tibetan Plateau in the 21st century [in Chinese]. Chin. Sci. Bull. 2015, 60, 3036–3047. [Google Scholar] [CrossRef]
  77. You, Q.L.; Wu, F.Y.; Shen, L.C.; Pepin, N.; Jiang, Z.H.; Kang, S.C. Tibetan Plateau amplification of climate extremes under global warming of 1.5 °C, 2 °C and 3 °C. Glob. Planet. Chang. 2020, 192, 103261. [Google Scholar] [CrossRef]
  78. Xie, Y.; Wang, P.X.; Bai, X.J.; Khan, J.; Zhang, S.Y.; Li, L.; Wang, L. Assimilation of the leaf area index and vegetation temperature condition index for winter wheat yield estimation using Landsat imagery and the CERES-Wheat model. Agric. For. Meteorol. 2017, 246, 194–206. [Google Scholar] [CrossRef]
  79. Zhuo, W.; Fang, S.B.; Wu, D.; Wang, L.; Li, M.Q.; Zhang, J.S.; Gao, X.R. Integrating remotely sensed water stress factor with a crop growth model for winter wheat yield estimation in the North China Plain during 2008–2018. Crop J. 2022, 10, 1470–1482. [Google Scholar] [CrossRef]
  80. Zhuo, W.; Huang, J.X.; Gao, X.R.; Ma, H.Y.; Huang, H.; Su, W.; Meng, J.H.; Li, Y.; Chen, H.L.; Yin, D.Q. Prediction of winter wheat maturity dates through assimilating remotely sensed leaf area index into crop growth model. Remote Sens. 2020, 12, 2896. [Google Scholar] [CrossRef]
  81. Zhuo, W.; Fang, S.B.; Ma, Y.P.; Zhang, R.; Wang, L.; Li, M.; Zhang, J.S.; Gao, X.R. Effects of climate warming on the potential northern planting boundaries of three main grain crops in China. Agriculture 2022, 12, 746. [Google Scholar] [CrossRef]
  82. Mao, Y.M.; Ma, W.Q.; Dai, H.G.; Zhang, L.; Sun, F.L.; Zhang, J.Q.; Yao, N.; He, J.N.; Bai, Z.X.; Xuan, Y.J.; et al. Earth Summit Mission 2022: Scientific Expedition and Research on Mt. Qomolangma helps reveal the synergy between westerly winds and monsoon and the resulting climatic and environmental effects. Adv. Atmos. Sci. 2023, 40, 187–193. [Google Scholar] [CrossRef]
  83. Yao, J.Y.; Liu, H.P.; Huang, J.P.; Gao, Z.M.; Wang, G.Y.; Li, D.; Yu, H.P.; Chen, X.Y. Accelerated dryland expansion regulates future variability in dryland gross primary production. Nat. Commun. 2020, 11, 1165. [Google Scholar] [CrossRef] [PubMed]
Figure 1. Spatial distribution of vegetation cover types over the Tibetan Plateau. Grasslands, open shrublands, and bare soil and rocks are distributed from southeast to northwest. The vegetation classification is derived from the Climate Data Guide: Clouds and Earth’s Radiant Energy System (CERES) Land Classification. The black contour lines indicate the study area, which has an elevation of 2800 m.
Remotesensing 16 02585 g001
Figure 2. Spatial distributions of (a) normalized difference vegetation index (NDVI), (b) precipitation (mm/day), and (c) temperature (°C) averages during the growing season from 1982 to 2020 over the Tibetan Plateau. Maps in (b,c) display 136 meteorological stations (gray dots) over the Tibetan Plateau.
Remotesensing 16 02585 g002
Figure 3. (a) The regional and seasonal mean anomaly (solid green line) of normalized difference vegetation index (NDVI) over the Tibetan Plateau during the growing season from 1982 to 2020. The dashed line indicates the corresponding trend. (b,c) The variability of principal components (PCs) corresponding to the two spatiotemporal evolution patterns (SEP) of NDVI anomalies over the Tibetan Plateau. The green lines indicate the PC trends. Green bars represent positive values and yellow bars indicate negative values.
Remotesensing 16 02585 g003
Figure 4. (a,b) The spatiotemporal evolution patterns (SEPs, shading) of the normalized difference vegetation index (NDVI) anomalies on the Tibetan Plateau during the growing season from 1982 to 2020. Panels (a,b) represent SEP1 and SEP2, respectively. Dashed lines in panel (b) indicate the approximate boundary between greening and browning, and arrows represent the direction of rotation. (c) The multi-year average NDVI for each month during 1982–2020, with darker (lighter) colors indicating more (less) vegetation cover.
Remotesensing 16 02585 g004
Figure 5. Spatiotemporal patterns of vegetation trends using the (a) total variability and (b,c) two seasonal evolution patterns (SEPs) of the normalized difference vegetation index (NDVI) over the Tibetan Plateau during 1982–2020, respectively. (d) The relative contributions of monthly pattern–amplitude projection (PAP) coefficients of SEP trends relative to those of the total NDVI trend over the Tibetan Plateau.
Remotesensing 16 02585 g005
Figure 6. The regressed spatial and temporal patterns of (a) precipitation, (b) temperature, and (c) atmospheric CO2 changes against the variability of the second principal component (PC2) corresponding to the rotated evolution pattern of vegetation variation over the Tibetan Plateau.
Remotesensing 16 02585 g006
Figure 7. The temporal variations of climate indices of (a) dipole precipitation difference in May–July, (b) temperature average in May–September, and (c) atmospheric CO2 concentration average in May–September for the long-term period of 1982–2020. Green bars represent positive values of the indices and yellow bars indicate negative values of the indices. The spatiotemporal patterns of vegetation greening and browning regressed by the variability of (d) dipole precipitation, (e) temperature, and (f) atmospheric CO2 indices.
Remotesensing 16 02585 g007
Disclaimer/Publisher’s Note: The statements, opinions and data contained in all publications are solely those of the individual author(s) and contributor(s) and not of MDPI and/or the editor(s). MDPI and/or the editor(s) disclaim responsibility for any injury to people or property resulting from any ideas, methods, instructions or products referred to in the content.

