

Analysis of Urbanization-Induced Land Subsidence in the City of Recife (Brazil) Using Persistent Scatterer SAR Interferometry

 ,
,  , , , , and
Abstract
1. Introduction
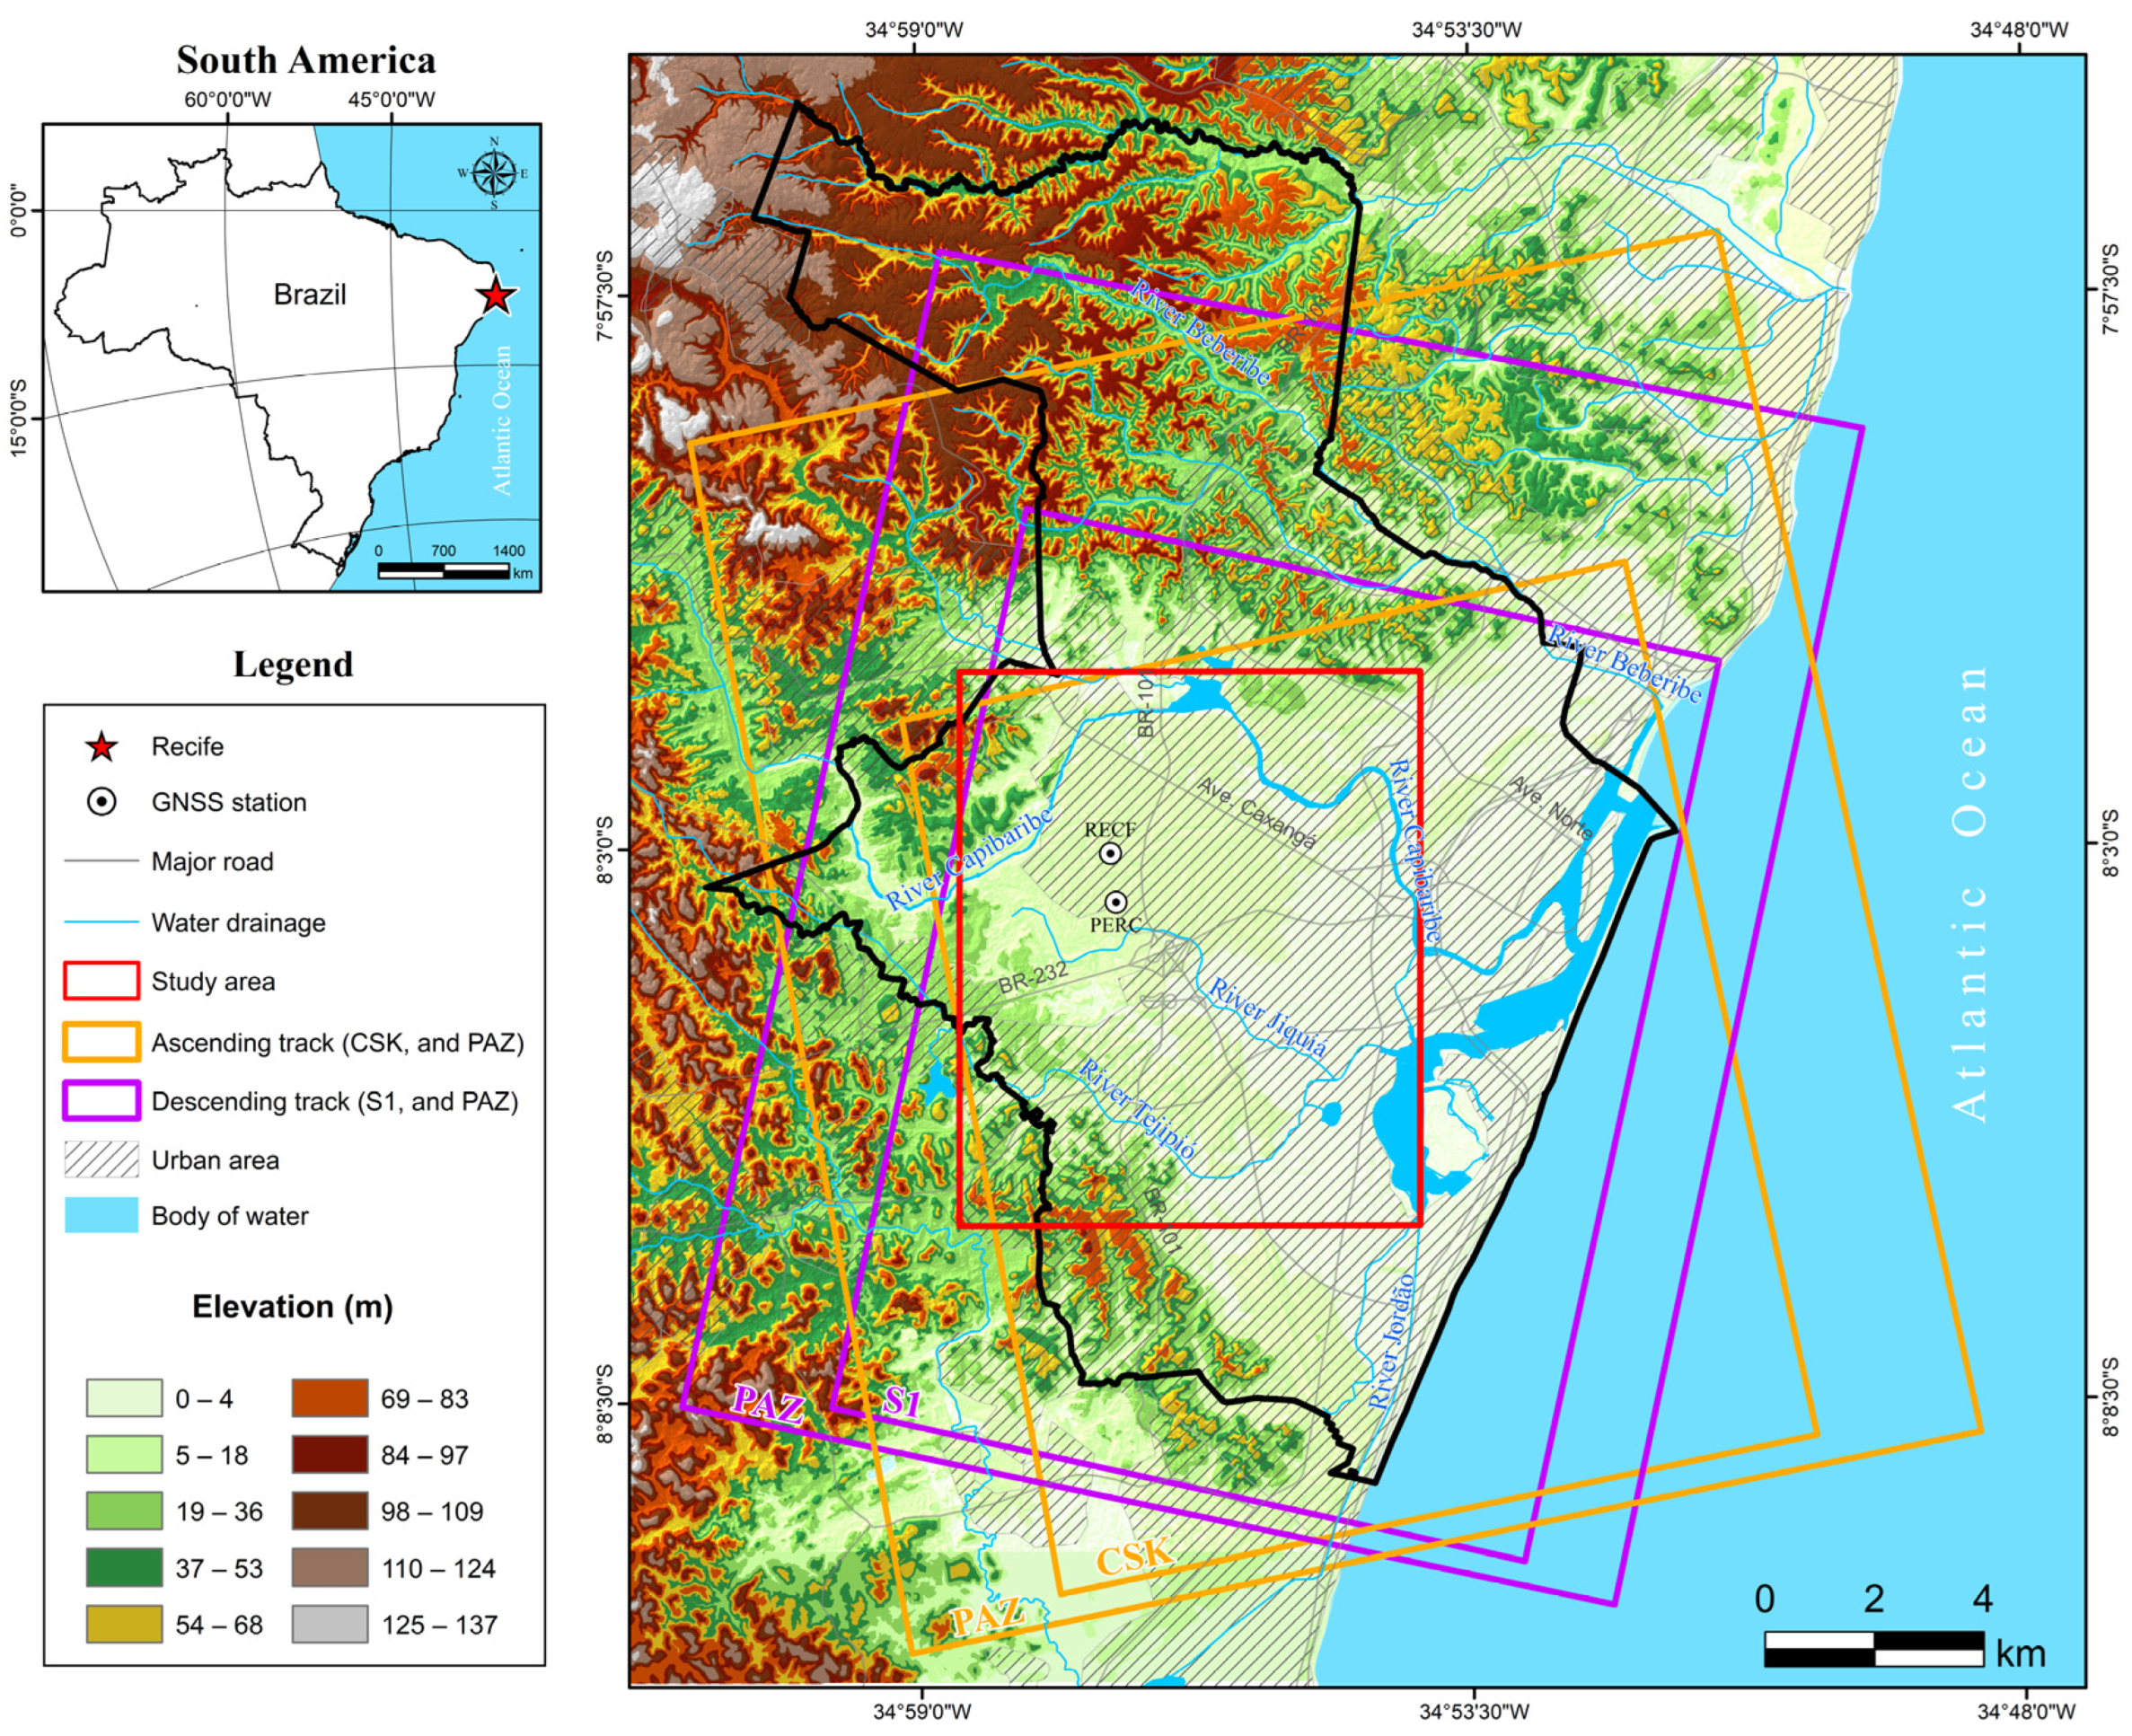
2. Study Area
2.1. Geographic and Topographic Setting
2.2. Geological and Geomorphological Features
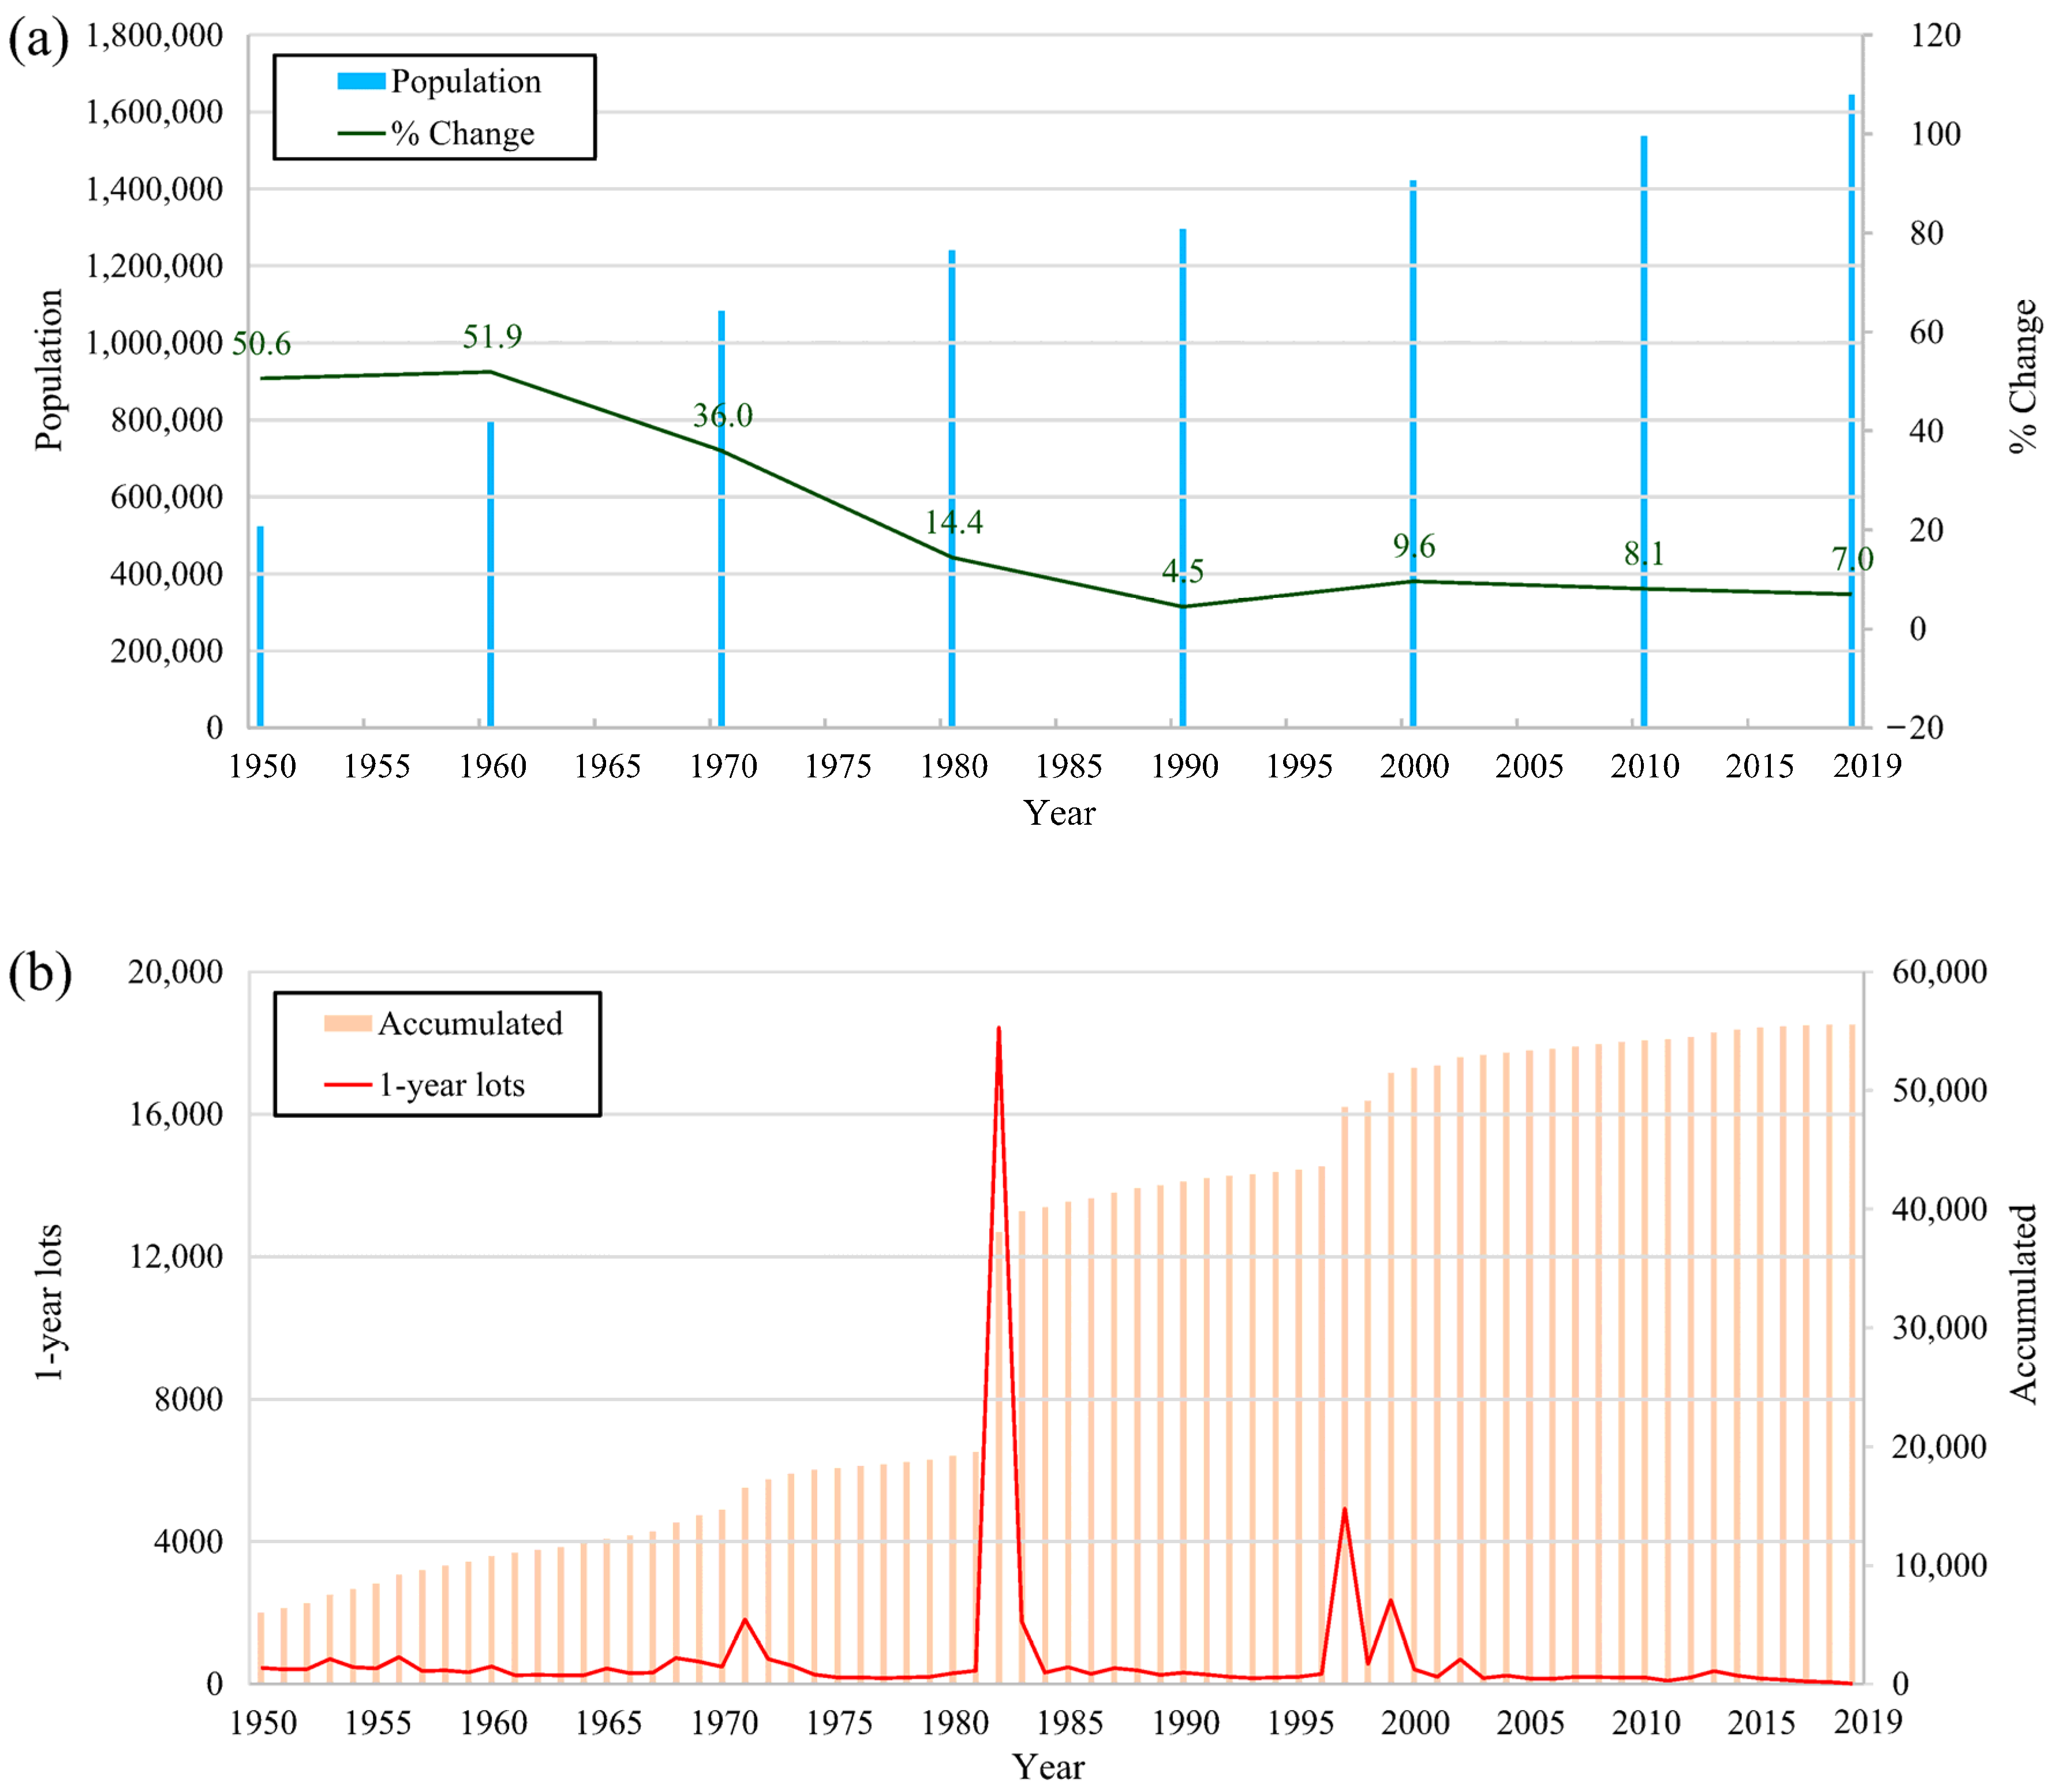
2.3. Urban Development

3. Data and Methods
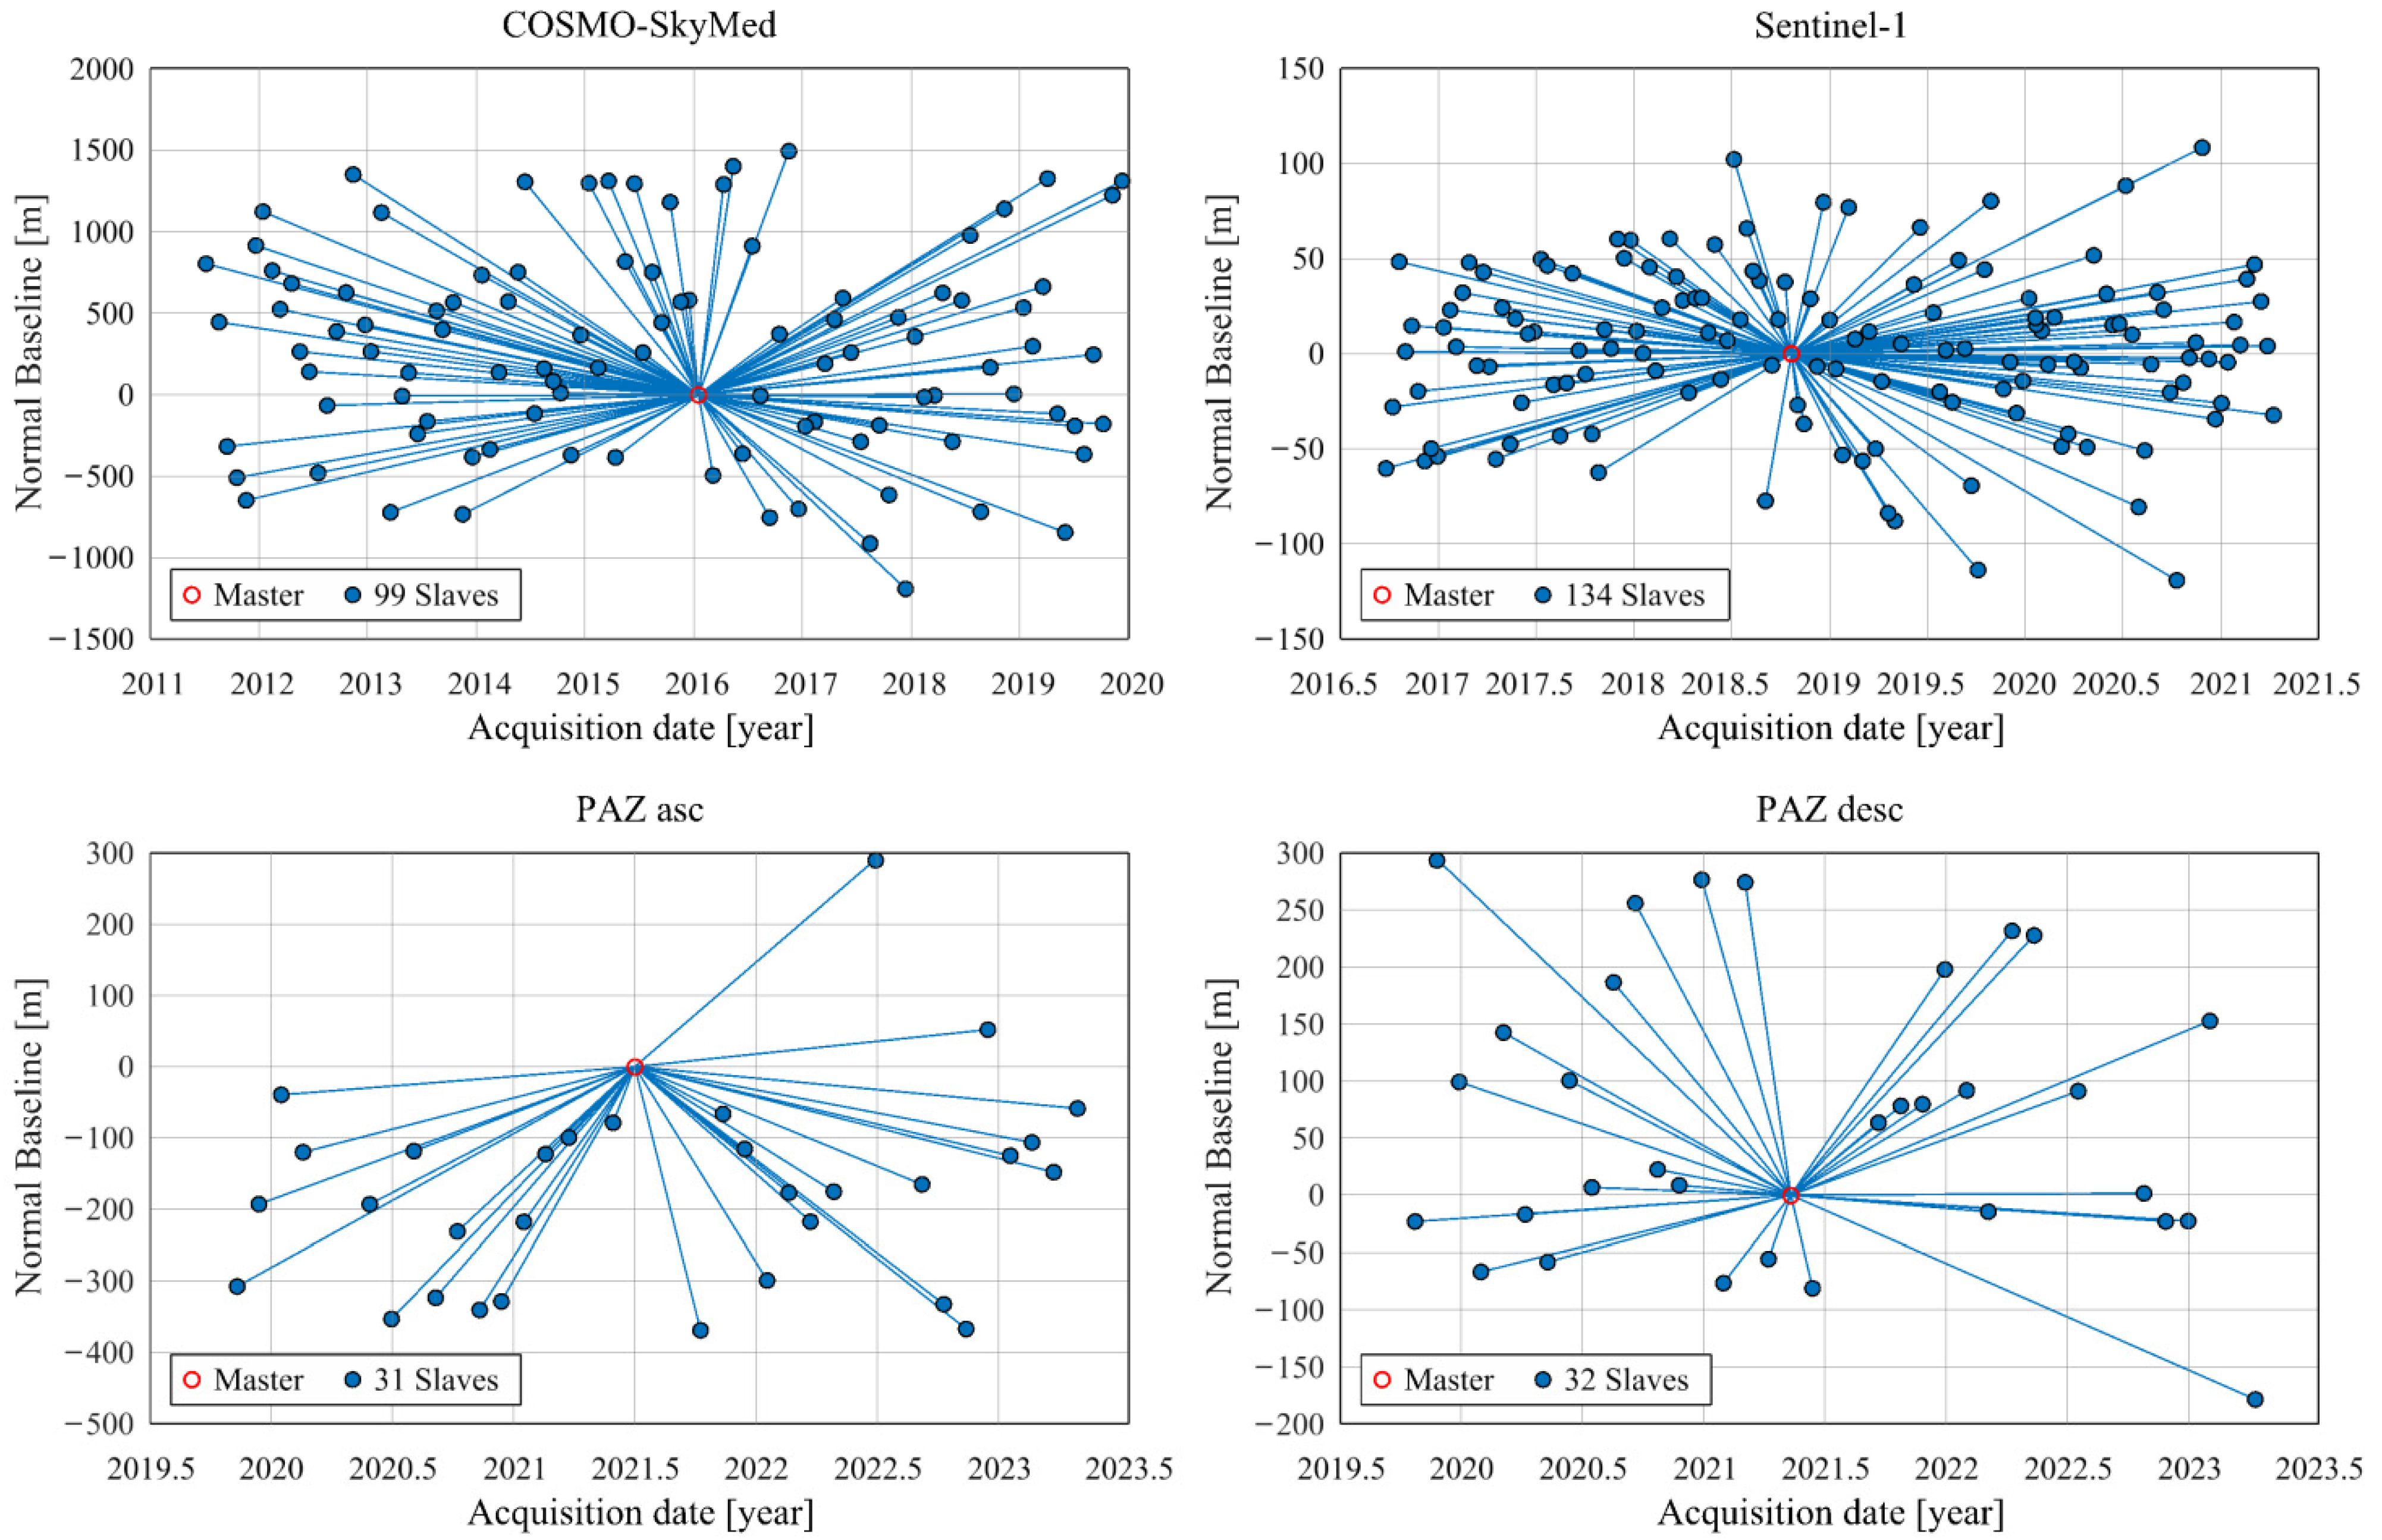
3.1. SAR Dataset
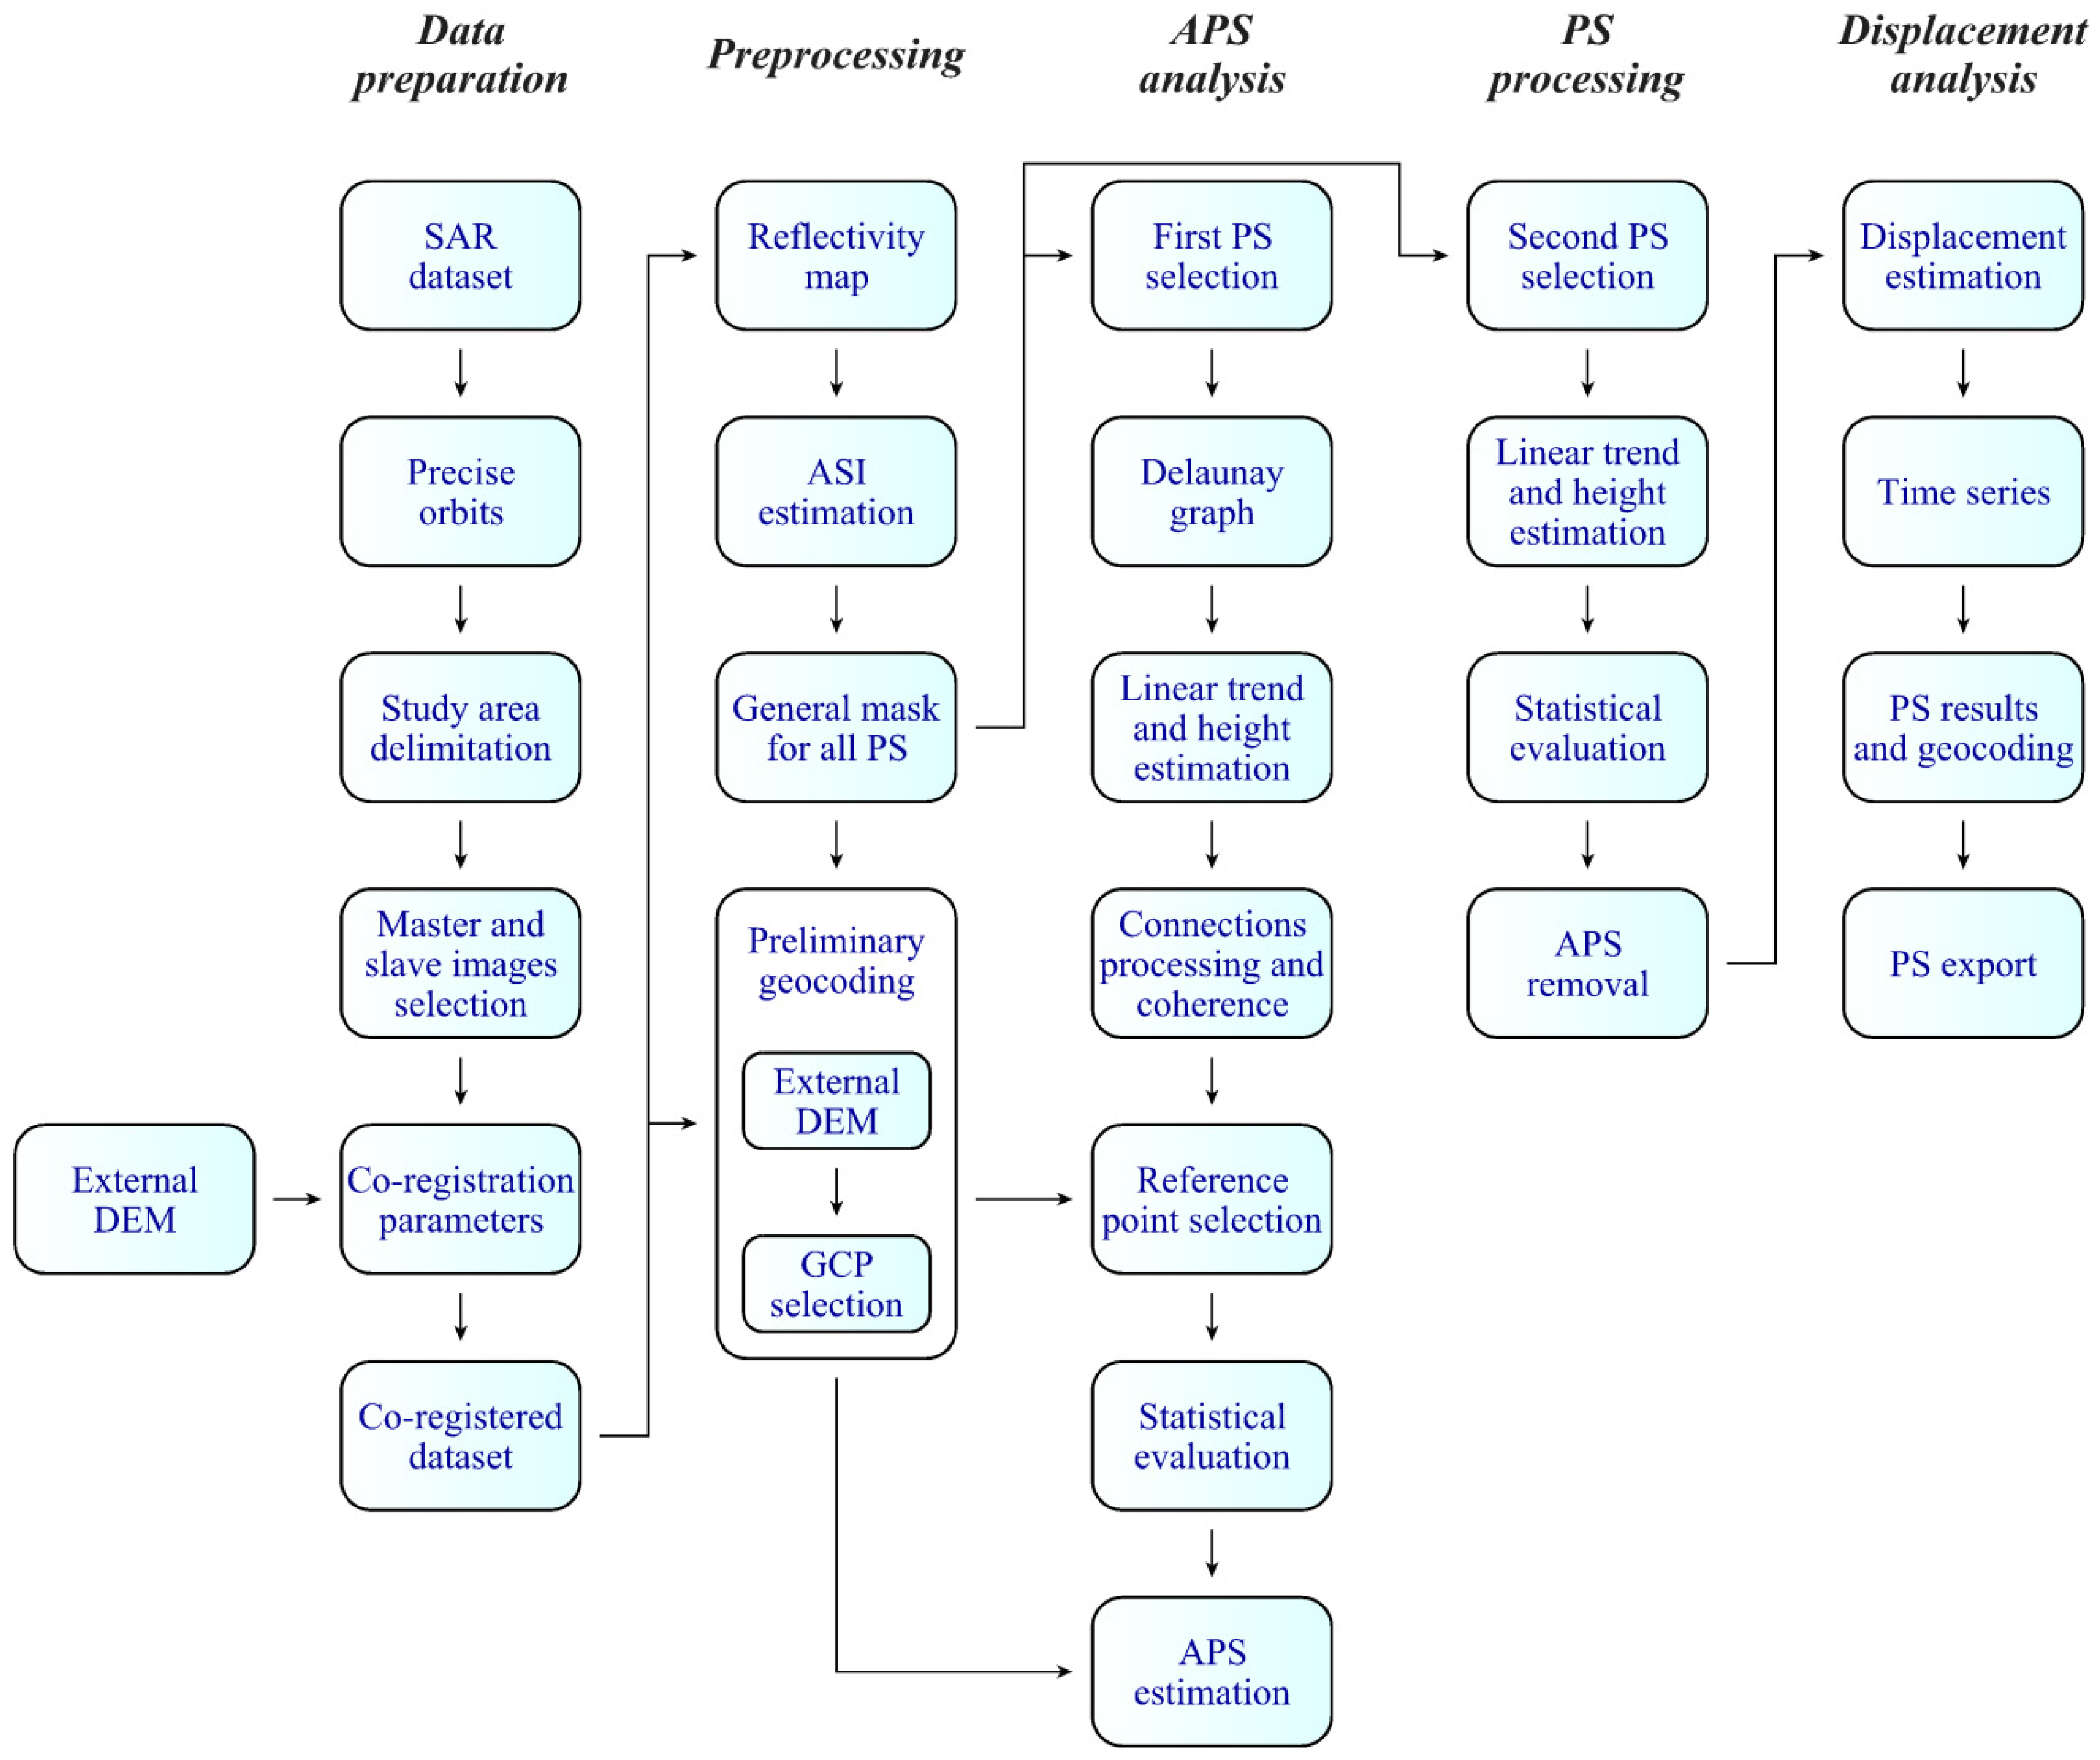
3.2. PS-InSAR Processing
3.3. Land Cover Data
3.4. Geotechnical Profiles
3.5. GNSS Data
4. Results
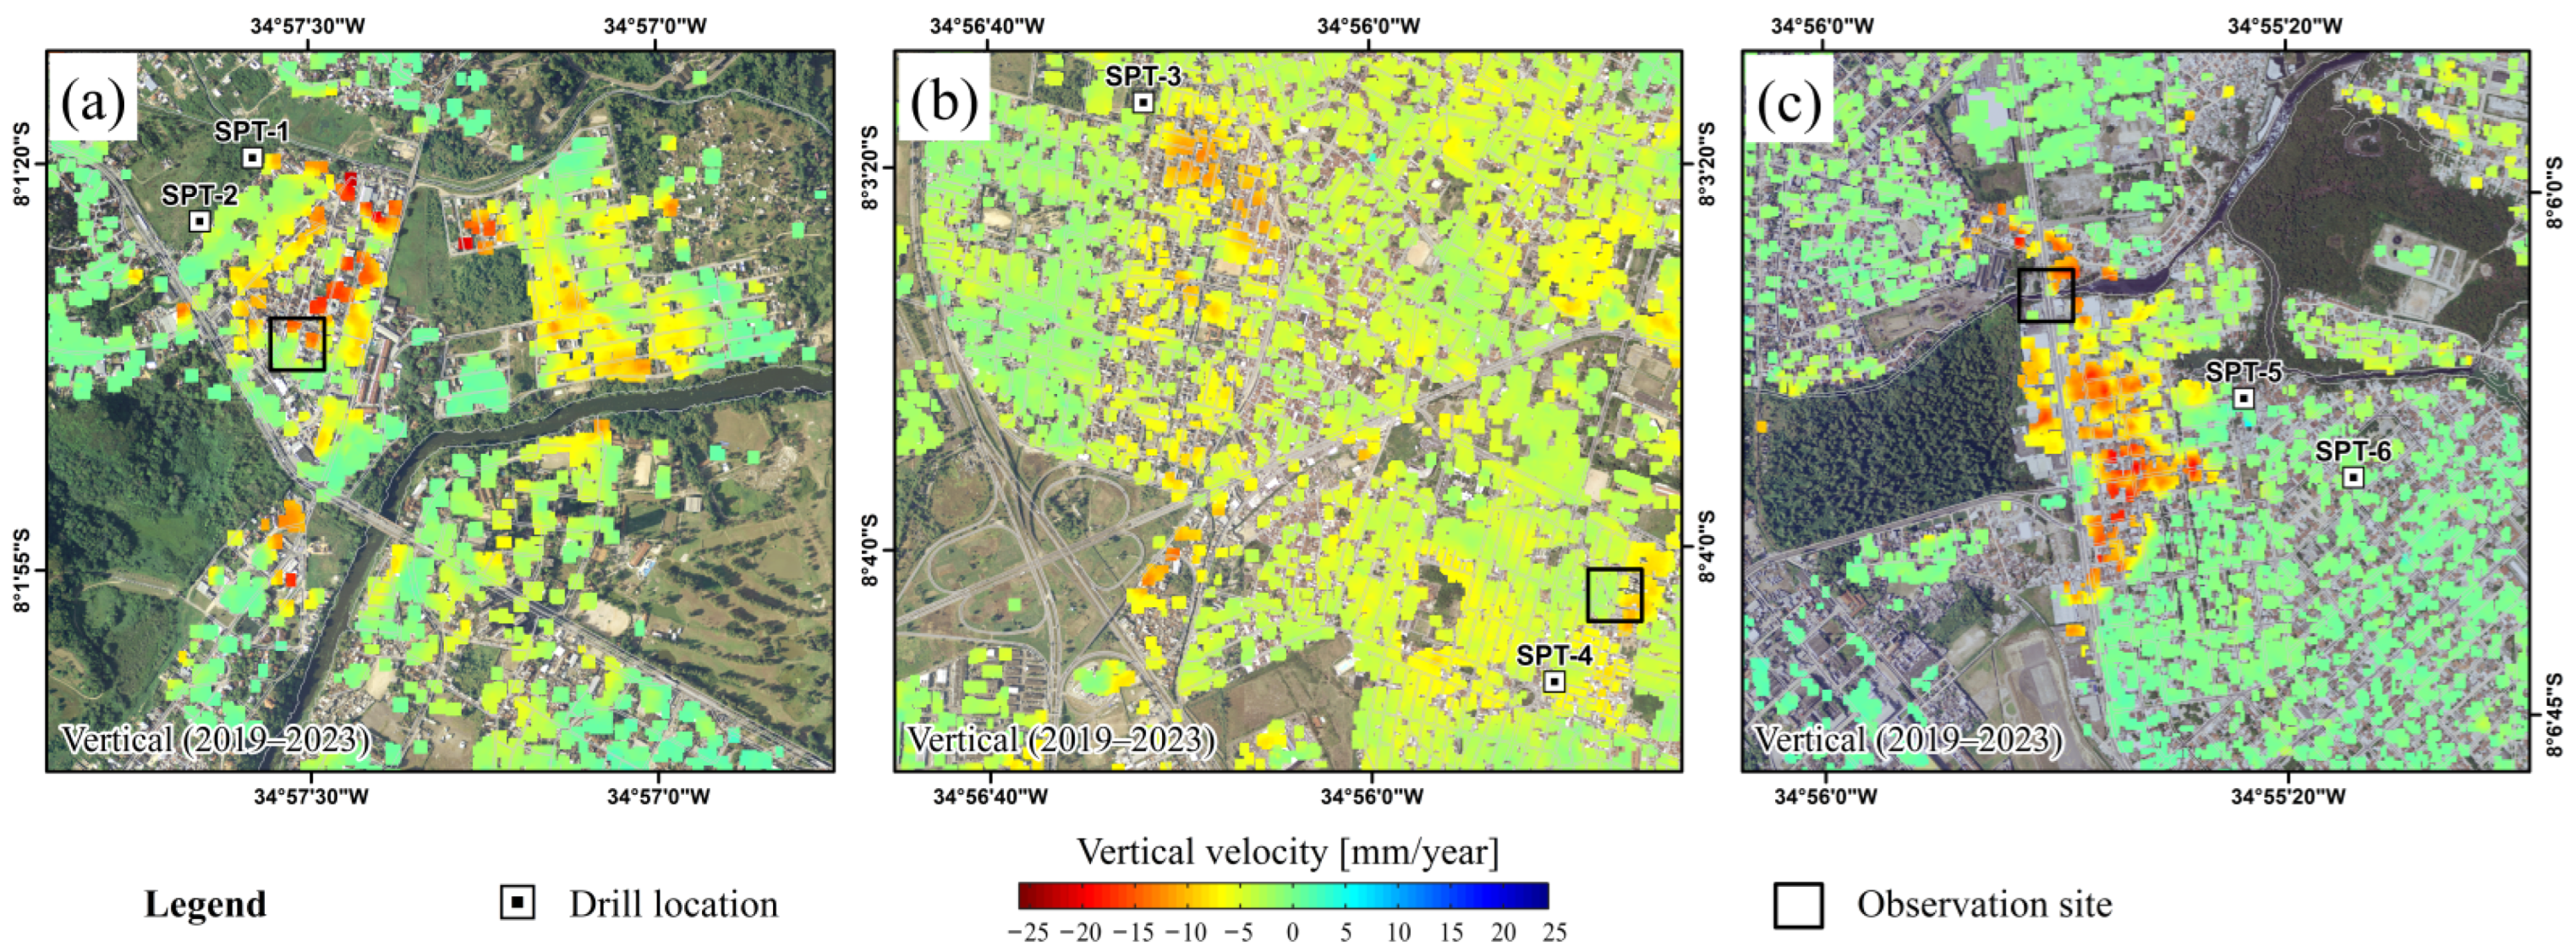
4.1. PS-InSAR Deformation Maps and Time Series
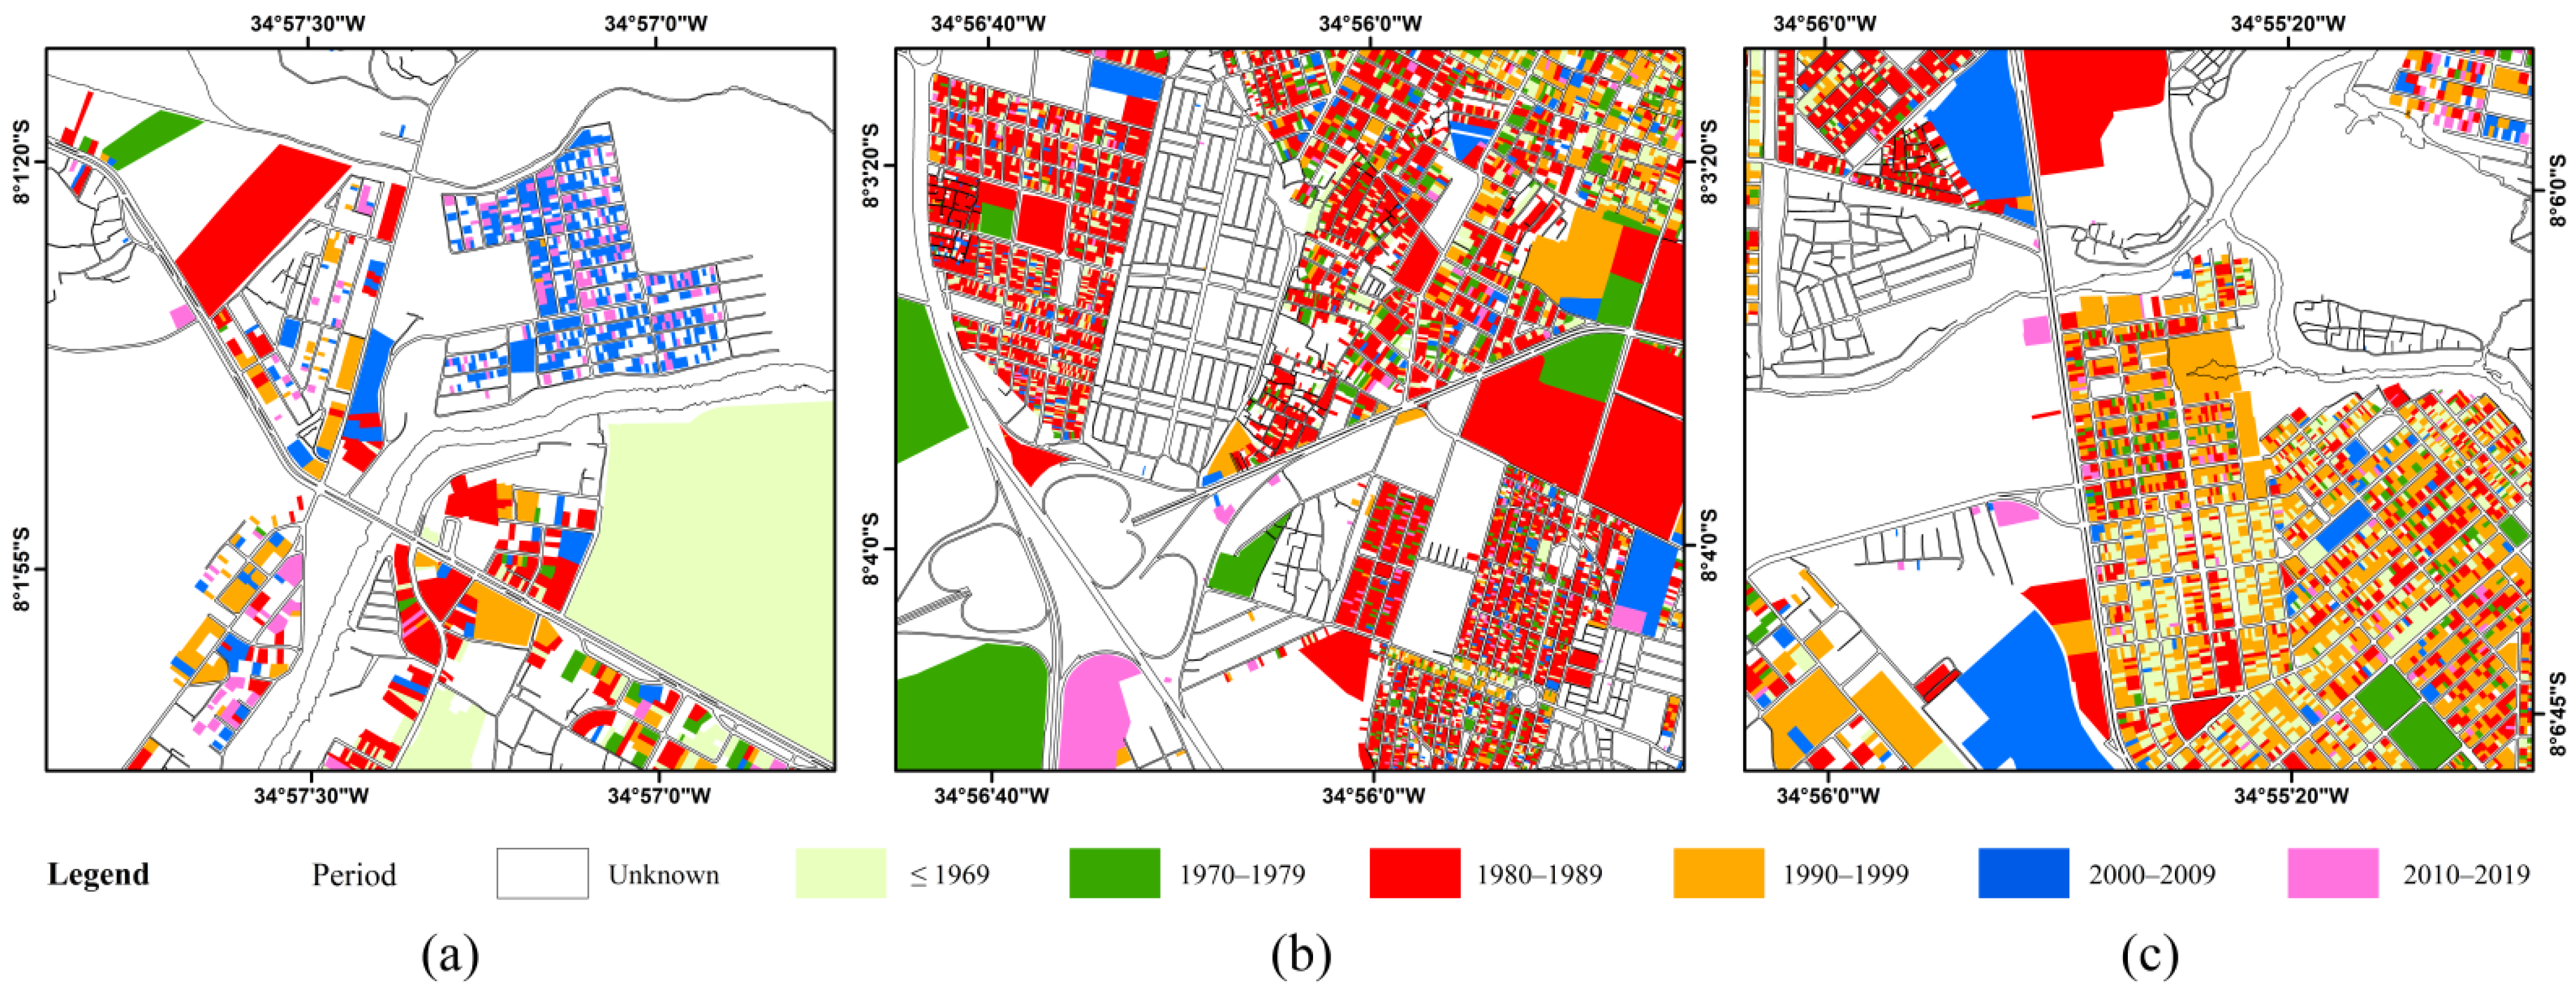
4.2. Land Cover Change Analysis
4.3. Geotechnical Profiles Analysis
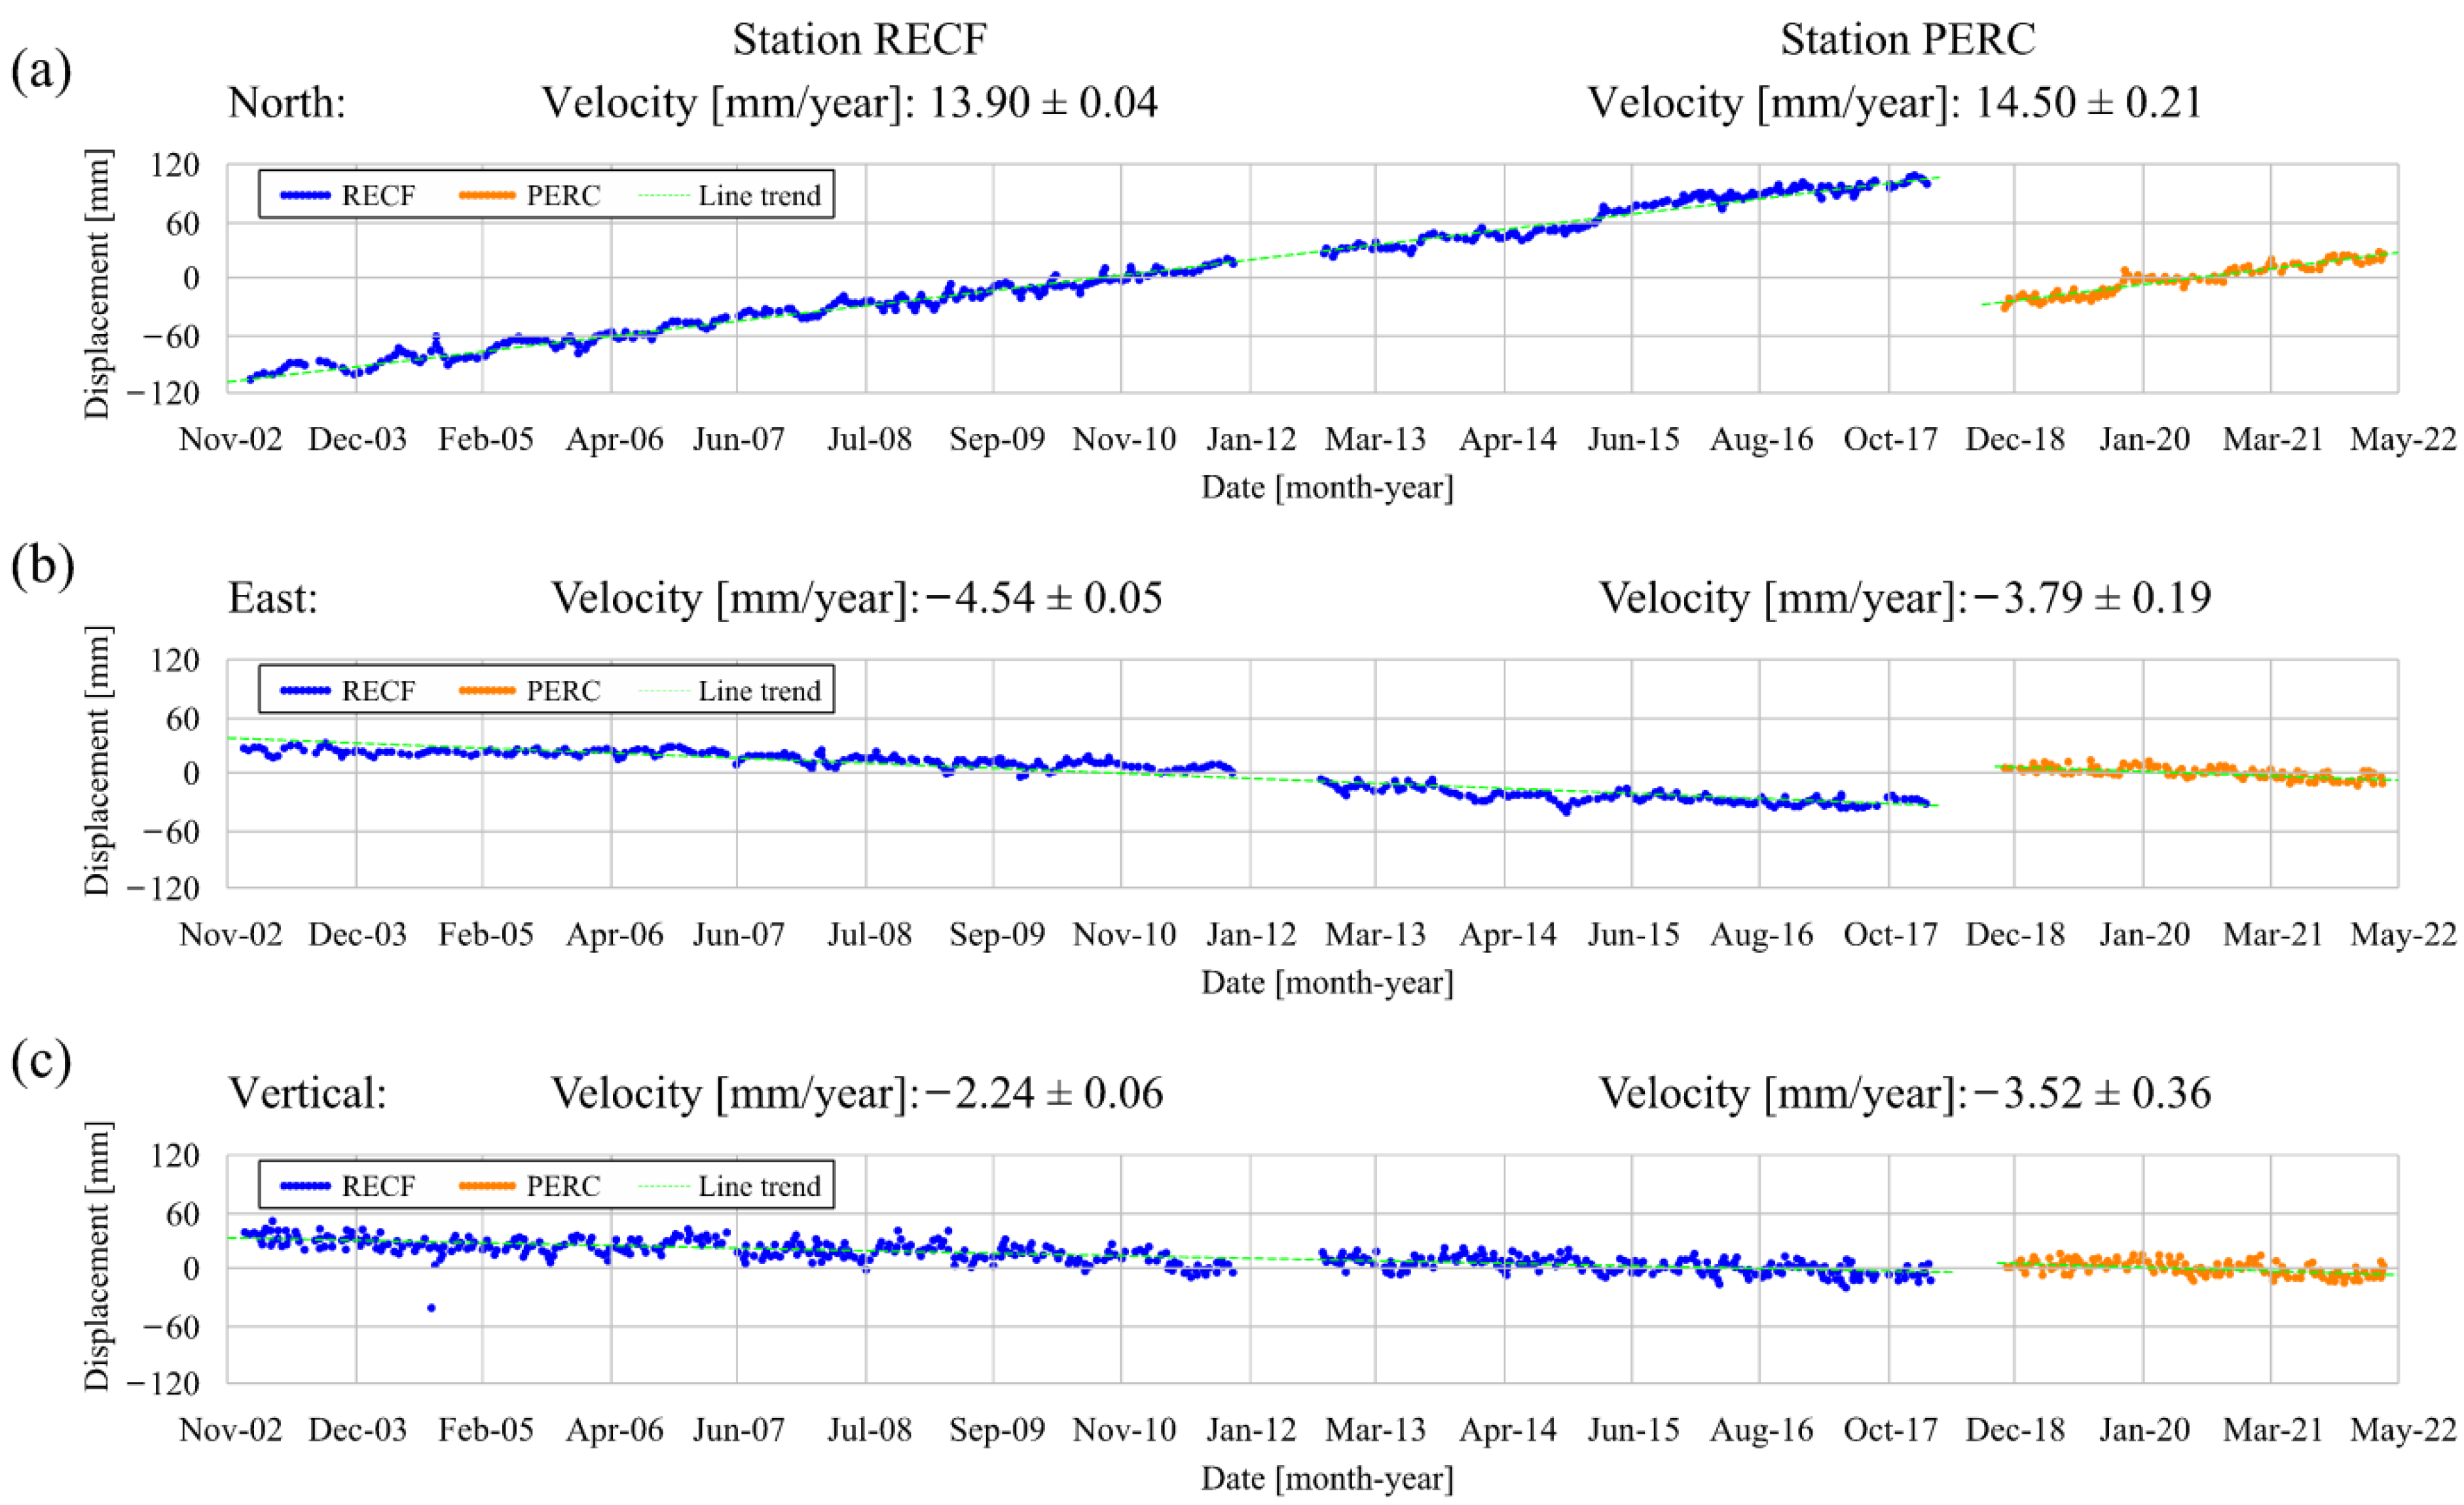
4.4. GNSS Data Analysis
5. Discussion
5.1. Correlation between Subsidence Zones and Geotechnical Profiles
5.2. Validation of the Results with GNSS Data and Previous Research in the WZR
5.3. Urbanization and Land Subsidence
5.4. Geodetic Monitoring and Land Subsidence
5.5. Flooded Areas and Land Subsidence
6. Conclusions
- The use of PAZ data acquired in ascending and descending orbits presents advantages in relation to the other SAR datasets used and acquired with only one orbit. It allows for a greater understanding and perception of displacement by obtaining the vertical and E–W components;
- The combined analysis of InSAR images and continuous GNSS data presents relevant uses in the interpretation of displacement. This enables the identification of the spatial pattern and temporal dynamics of deformation;
- The GNSS data acquisition must be positioned over an area where there is greater ground movement, as determined by the PS-InSAR results. This is useful for analyzing the correlation with PS points;
- The West Zone of Recife is susceptible to subsidence due to its geotechnical characteristics and the presence of a thick soft-clay layer. However, other factors, such as the proper treatment (or absence) of the geotechnical foundations, control the settlement process and hence subsidence rates;
- It is crucial to consider soil subsidence when developing plans to mitigate flood hazards and build resilient cities;
- SAR technology is an invaluable tool in urban planning, regardless of the purpose or phase of the study. It is employed in the design of urban infrastructure and the prospecting of scenarios under climate change.
Author Contributions
Funding
Institutional Review Board Statement
Informed Consent Statement
Data Availability Statement
Acknowledgments
Conflicts of Interest
References
- Abidin, H.Z.; Andreas, H.; Gumilar, I.; Brinkman, J.J. Study on the risk and impacts of land subsidence in Jakarta. Proc. IAHS 2015, 372, 115–120. [Google Scholar] [CrossRef]
- Abidin, H.Z.; Andreas, H.; Gumilar, I.; Fukuda, Y.; Pohan, Y.E.; Deguchi, T. Land subsidence of Jakarta (Indonesia) and its relation with urban development. Nat. Hazards 2011, 59, 1753. [Google Scholar] [CrossRef]
- UNESCO. Guidebook to Studies of Land Subsidence Due to Ground-Water Withdrawal; Prepared for the International Hydrological Programme, Working Group 8.4; Poland, J.F., Ed.; UNESCO: Paris, France, 1984. [Google Scholar]
- Corapcioglu, M.Y. Land Subsidence—A. A State-of-the-Art Review. In Fundamentals of Transport Phenomena in Porous Media; Bear, J., Corapcioglu, M.Y., Eds.; Springer: Dordrecht, The Netherlands, 1984; pp. 369–444. [Google Scholar]
- Cabral, J.; SANTOS, S.d.; Pontes Filho, I. Bombeamento intensivo de água subterrânea e riscos de subsidência do solo. Rev. Bras. Recur. Hídricos 2006, 11, 147–157. [Google Scholar]
- Galloway, D.L.; Burbey, T.J. Review: Regional land subsidence accompanying groundwater extraction. Hydrogeol. J. 2011, 19, 1459–1486. [Google Scholar] [CrossRef]
- Cigna, F.; Tapete, D. Present-day land subsidence rates, surface faulting hazard and risk in Mexico City with 2014–2020 Sentinel-1 IW InSAR. Remote Sens. Environ. 2021, 253, 112161. [Google Scholar] [CrossRef]
- Abidin, H.Z.; Djaja, R.; Darmawan, D.; Hadi, S.; Akbar, A.; Rajiyowiryono, H.; Sudibyo, Y.; Meilano, I.; Kasuma, M.A.; Kahar, J.; et al. Land Subsidence of Jakarta (Indonesia) and its Geodetic Monitoring System. Nat. Hazards 2001, 23, 365–387. [Google Scholar] [CrossRef]
- Ruiz-Armenteros, A.M.; Lazecky, M.; Ruiz-Constán, A.; Bakoň, M.; Delgado, J.M.; Sousa, J.J.; Galindo-Zaldívar, J.; de Galdeano, C.S.; Caro-Cuenca, M.; Martos-Rosillo, S.; et al. Monitoring continuous subsidence in the Costa del Sol (Málaga province, southern Spanish coast) using ERS-1/2, Envisat, and Sentinel-1A/B SAR interferometry. Procedia Comput. Sci. 2018, 138, 354–361. [Google Scholar] [CrossRef]
- Cigna, F.; Osmanoğlu, B.; Cabral-Cano, E.; Dixon, T.H.; Ávila-Olivera, J.A.; Garduño-Monroy, V.H.; DeMets, C.; Wdowinski, S. Monitoring land subsidence and its induced geological hazard with Synthetic Aperture Radar Interferometry: A case study in Morelia, Mexico. Remote Sens. Environ. 2012, 117, 146–161. [Google Scholar] [CrossRef]
- Stramondo, S.; Bozzano, F.; Marra, F.; Wegmuller, U.; Cinti, F.R.; Moro, M.; Saroli, M. Subsidence induced by urbanisation in the city of Rome detected by advanced InSAR technique and geotechnical investigations. Remote Sens. Environ. 2008, 112, 3160–3172. [Google Scholar] [CrossRef]
- Ciampalini, A.; Solari, L.; Giannecchini, R.; Galanti, Y.; Moretti, S. Evaluation of subsidence induced by long-lasting buildings load using InSAR technique and geotechnical data: The case study of a Freight Terminal (Tuscany, Italy). Int. J. Appl. Earth Obs. Geoinf. 2019, 82, 101925. [Google Scholar] [CrossRef]
- Xu, Y.-S.; Ma, L.; Du, Y.-J.; Shen, S.-L. Analysis of urbanisation-induced land subsidence in Shanghai. Nat. Hazards 2012, 63, 1255–1267. [Google Scholar] [CrossRef]
- Chen, B.; Gong, H.; Li, X.; Lei, K.; Ke, Y.; Duan, G.; Zhou, C. Spatial correlation between land subsidence and urbanization in Beijing, China. Nat. Hazards 2015, 75, 2637–2652. [Google Scholar] [CrossRef]
- Fryksten, J.; Nilfouroushan, F. Analysis of Clay-Induced Land Subsidence in Uppsala City Using Sentinel-1 SAR Data and Precise Leveling. Remote Sens. 2019, 11, 2764. [Google Scholar] [CrossRef]
- Aljammaz, A.; Sultan, M.; Izadi, M.; Abotalib, A.Z.; Elhebiry, M.S.; Emil, M.K.; Abdelmohsen, K.; Saleh, M.; Becker, R. Land Subsidence Induced by Rapid Urbanization in Arid Environments: A Remote Sensing-Based Investigation. Remote Sens. 2021, 13, 1109. [Google Scholar] [CrossRef]
- IBGE. População Residente. Available online: https://censo2022.ibge.gov.br/panorama/indicadores.html (accessed on 9 February 2024).
- Cabral, J.J.S.P.; Farias, V.P.; Sobral, M.d.C.; de Paiva, A.L.R.; Santos, R.B. Groundwater management in Recife. Water Int. 2008, 33, 86–99. [Google Scholar] [CrossRef]
- De Assunção Montenegro, A.A.; De Paiva, A.L.R.; Cavalcanti, G.L.; Da Silva Pereira Cabral, J.J.; Demetrio, J.G.A.; Montenegro, S.M.G.L. Águas subterrâneas na zona costeira da planície do Recife (PE): Evolução da salinização e perspectivas de gerenciamento. Rev. Bras. Recur. Hídricos 2009, 14, 81–93. [Google Scholar]
- Santos, S.M. Investigações Metodológicas Sobre o Monitoramento da Subsidência do Solo devido à Extração de Água Subterrânea—Caso da Região Metropolitana de Recife (English: Methodological Investigations about Landsubsidence Due to Groundwater Exploitation—Case of Metropolitan Region of Recife); Federal University of Pernambuco: Recife, Brazil, 2006. [Google Scholar]
- Luna, R.M.R.; Garnés, S.J.d.A.; Cabral, J.J.d.S.P.; dos Santos, S.M. Groundwater overexploitation and soil subsidence monitoring on Recife plain (Brazil). Nat. Hazards 2017, 86, 1363–1376. [Google Scholar] [CrossRef]
- Luna, R.M.R.; Garnés, S.J.d.A.; Cabral, J.J.d.S.P.; dos Santos, S.M. Suitability of GNSS for analysis of soil subsidence in Recife in a highly urbanized coastal area. Nat. Hazards 2021, 106, 1821–1837. [Google Scholar] [CrossRef]
- Bedini, E. Persistent Scatterer Interferometry of Sentinel-1 time series to detect ground subsidence in the city of Recife, Brazil. J. Hyperspectral Remote Sens. 2020, 10, 1–9. [Google Scholar] [CrossRef]
- IBGE. Cidades e Estados. Recife. Available online: https://www.ibge.gov.br/cidades-e-estados/pe/recife.html (accessed on 31 October 2022).
- Melo, M.L. Metropolitan Expansion and Underdevelopment: The Case of Recife; UFPE: Recife, Brazil, 1978; p. 257. [Google Scholar]
- Map. Available online: https://rigeo.cprm.gov.br/jspui/handle/doc/20596 (accessed on 12 December 2021).
- Gusmão Filho, J.A. Fundações do Conhecimento Geológico à Prática da Engenharia (In English: Foundations of Geological Knowledge to Engineering Practice); Editora Universitária UFPE: Recife, Brazil, 2002; p. 345. [Google Scholar]
- Condepe. Orthophoto obtained from an aerial photogrammetric survey. 1974. [Google Scholar]
- Google Earth Pro: Use of satellite imagery, USA, 2021.
- Ferretti, A.; Prati, C.; Rocca, F. Permanent scatterers in SAR interferometry. IEEE Trans. Geosci. Remote Sens. 2001, 39, 8–20. [Google Scholar] [CrossRef]
- Crosetto, M.; Monserrat, O.; Cuevas-González, M.; Devanthéry, N.; Crippa, B. Persistent Scatterer Interferometry: A review. ISPRS J. Photogramm. Remote Sens. 2016, 115, 78–89. [Google Scholar] [CrossRef]
- Ruiz-Armenteros, A.M.; Lazecky, M.; Hlaváčová, I.; Bakoň, M.; Delgado, J.M.; Sousa, J.J.; Lamas-Fernández, F.; Marchamalo, M.; Caro-Cuenca, M.; Papco, J.; et al. Deformation monitoring of dam infrastructures via spaceborne MT-InSAR. The case of La Viñuela (Málaga, southern Spain). Procedia Comput. Sci. 2018, 138, 346–353. [Google Scholar] [CrossRef]
- Fárová, K.; Jelének, J.; Kopačková-Strnadová, V.; Kycl, P. Comparing DInSAR and PSI Techniques Employed to Sentinel-1 Data to Monitor Highway Stability: A Case Study of a Massive Dobkovičky Landslide, Czech Republic. Remote Sens. 2019, 11, 2670. [Google Scholar] [CrossRef]
- Perissin, D.; Wang, Z.; Wang, T. The SARPROZ InSAR tool for urban subsidence/manmade structure stability monitoring in China. In Proceedings of the 34th International Symposium for Remote Sensing of the Environment (ISRSE), Sydney, Australia, 10–15 April 2011. [Google Scholar]
- Zebker, H.A.; Villasenor, J. Decorrelation in interferometric radar echoes. IEEE Trans. Geosci. Remote Sens. 1992, 30, 950–959. [Google Scholar] [CrossRef]
- Pepe, A.; Calò, F. A Review of Interferometric Synthetic Aperture RADAR (InSAR) Multi-Track Approaches for the Retrieval of Earth’s Surface Displacements. Appl. Sci. 2017, 7, 1264. [Google Scholar] [CrossRef]
- Map. Lotes. Available online: http://dados.recife.pe.gov.br/pt_BR/dataset/area-urbana (accessed on 15 December 2021).
- Coutinho, R.Q. Estudo da Caracterização Geotécnica da Argila Orgânica do Recife; Conselho Nacional de Desenvolvimento Científico e Tecnológico: Recife, Brasil, 1980. [Google Scholar]
- Coutinho, R.Q. Estudos Recentes da Caracterização Geológica-Geotécnica da Argila Orgânica do Recife; Conselho Nacional de Desenvolvimento Científico e Tecnológico: Recife, Brasil, 2020. [Google Scholar]
- IBGE. SIRGAS—Centro de Análise—IBGE. Downloads. Graficos. RECF. Available online: https://geoftp.ibge.gov.br/informacoes_sobre_posicionamento_geodesico/sirgas/graficos/RECF.png (accessed on 2 May 2022).
- IBGE. SIRGAS—Centro de Análise—IBGE. Downloads. Graficos. PERC. Available online: https://geoftp.ibge.gov.br/informacoes_sobre_posicionamento_geodesico/sirgas/graficos/PERC.png (accessed on 2 May 2022).
- IBGE. Solução Multianual das Estações da Rede Brasileira de Monitoramento Contínuo dos Sistemas GNSS no Período de 2000 a 2019; IBGE: Rio de Janeiro, Brazil, 2021; p. 117. [Google Scholar]
- Santamaría-Gómez, A. SARI: Interactive GNSS position time series analysis software. GPS Solut. 2019, 23, 52. [Google Scholar] [CrossRef]
- Hanssen, R.F. Radar Interferometry: Data Interpretation and Error Analysis; Kluwer Academic Publishers: Dordrecht, The Netherlands, 2001; Volume 2, p. 308. [Google Scholar]
- Chen, Y.; Remy, D.; Froger, J.-L.; Peltier, A.; Villeneuve, N.; Darrozes, J.; Perfettini, H.; Bonvalot, S. Long-term ground displacement observations using InSAR and GNSS at Piton de la Fournaise volcano between 2009 and 2014. Remote Sens. Environ. 2017, 194, 230–247. [Google Scholar] [CrossRef]
- Sánchez, L.; Drewes, H. Geodetic Monitoring of the Variable Surface Deformation in Latin America. In Beyond 100: The Next Century in Geodesy; Springer: Cham, Switzerland, 2023; pp. 197–208. [Google Scholar]
- Waltham, T. Foundations of Engineering Geology, 3rd ed.; CRC Press: Boca Raton, FL, USA, 2009; p. 98. [Google Scholar]
- Recife. Geodetic Station Monograph: V-15. Available online: https://esigportal2.recife.pe.gov.br/arcgis/rest/services/Planejamento/BASES_REDE_REFERENCIA_CADASTRAL/MapServer/0/15/attachments/33 (accessed on 4 June 2023).
- Recife. Geodetic Station Monograph: V-15AZ. Available online: https://esigportal2.recife.pe.gov.br/arcgis/rest/services/Planejamento/BASES_REDE_REFERENCIA_CADASTRAL/MapServer/0/41/attachments/34 (accessed on 4 June 2023).
- Recife. Geodetic Station Monograph: V-37. Available online: https://esigportal2.recife.pe.gov.br/arcgis/rest/services/Planejamento/BASES_REDE_REFERENCIA_CADASTRAL/MapServer/0/73/attachments/73 (accessed on 4 June 2023).
- Recife. Geodetic Station Monograph: V-37AZ. Available online: https://esigportal2.recife.pe.gov.br/arcgis/rest/services/Planejamento/BASES_REDE_REFERENCIA_CADASTRAL/MapServer/0/74/attachments/74 (accessed on 4 June 2023).
- Recife. Geodetic Station Monograph: V-35. Available online: https://esigportal2.recife.pe.gov.br/arcgis/rest/services/Planejamento/BASES_REDE_REFERENCIA_CADASTRAL/MapServer/0/69/attachments/69 (accessed on 4 June 2023).
- Recife. Geodetic Station Monograph: V-35AZ. Available online: https://esigportal2.recife.pe.gov.br/arcgis/rest/services/Planejamento/BASES_REDE_REFERENCIA_CADASTRAL/MapServer/0/70/attachments/70 (accessed on 4 June 2023).
- Recife. Geodetic Station Monograph: V08. Available online: https://esigportal2.recife.pe.gov.br/arcgis/rest/services/Planejamento/BASES_REDE_REFERENCIA_CADASTRAL/MapServer/0/8/attachments/20 (accessed on 4 June 2023).
- Recife. Geodetic Station Monograph: AZ08. Available online: https://esigportal2.recife.pe.gov.br/arcgis/rest/services/Planejamento/BASES_REDE_REFERENCIA_CADASTRAL/MapServer/0/34/attachments/21 (accessed on 4 June 2023).
- IBGE. Geodetic Station Monograph: 9320A. Available online: http://www.bdg.ibge.gov.br/bdg/pdf/relatorio.asp?L1=9320A (accessed on 4 June 2023).
- IBGE. Geodetic Station Monograph: 3640P. Available online: http://www.bdg.ibge.gov.br/bdg/pdf/relatorio.asp?L1=3640P (accessed on 4 June 2023).
- IBGE. Geodetic Station Monograph: 393Y. Available online: http://www.bdg.ibge.gov.br/bdg/pdf/relatorio.asp?L1=393Y (accessed on 4 June 2023).
- IBGE. Geodetic Station Monograph: 3641C. Available online: http://www.bdg.ibge.gov.br/bdg/pdf/relatorio.asp?L1=3641C (accessed on 4 June 2023).
- IBGE. Geodetic Station Monograph: 3640N. Available online: http://www.bdg.ibge.gov.br/bdg/pdf/relatorio.asp?L1=3640N (accessed on 4 June 2023).
- Nóbrega, R.S.; Coutinho, C.D.; Lino, A.P.; de Albuquerque Wanderley, L.S. Flood Events in the City of Recife, Northeastern Brazil: History and Contemporary Risks. In Urban Flooding in Brazil; Mendonça, F., Farias, A., Buffon, E., Eds.; Springer International Publishing: Cham, Switzerland, 2023; pp. 171–192. [Google Scholar]
- EMLURB. Plano Diretor de Drenagem e Manejo das Águas Urbanas do Recife: Relatório do Diagnóstico do Sistema de Drenagem Existente; EMLURB: Recife, Brazil, 2016; p. 333. [Google Scholar]
- ICLEI. Plano Local de Ação Climática da Cidade do Recife 2020; ICLEI: São Paulo, Brazil, 2020; pp. 1–42. [Google Scholar]
- Zachariah, M.; Junior, F.V.; Silva, T.; Santos, E.; Coelho, C.; Alves, L.; Martins, E.; Köberle, A.; Singh, R.; Vahlberg, M. Climate Change Increased Heavy Rainfall, Hitting Vulnerable Communities in Eastern Northeast Brazil; World Weather Attribution: London, UK, 2022; pp. 1–31. [Google Scholar]
- Marengo, J.A.; Alcantara, E.; Cunha, A.P.; Seluchi, M.; Nobre, C.A.; Dolif, G.; Goncalves, D.; Assis Dias, M.; Cuartas, L.A.; Bender, F.; et al. Flash floods and landslides in the city of Recife, Northeast Brazil after heavy rain on May 25–28, 2022: Causes, impacts, and disaster preparedness. Weather Clim. Extrem. 2023, 39, 100545. [Google Scholar] [CrossRef]


| Parameters | COSMO-SkyMed | Sentinel-1 | PAZ |
|---|---|---|---|
| Wavelength | 3.4 cm (X-band) | 5.6 cm (C-band) | 3.4 cm (X-band) |
| Sensor mode | StripMap HIMAGE | IW1 | StripMap |
| Polarization | Single (HH) | Single (VV) | Single (HH) |
| Pass direction | Ascending | Descending | Ascending and Descending |
| Spatial resolution | 2.6 m × 2.6 m | 2.3 m × 14.1 m | 1.76 m × 3.01 m |
| Incidence angle | 19.93°–20.11° | 37°–39° | 38° (asc)–22° (desc) |
| Swath width | 40 km | 240 km × 170 km | 30 km × 50 km |
| Temporal resolution | 30 days | 12 days | 33 days |
| Source | Velocity [mm/year] | Period | ||||||
|---|---|---|---|---|---|---|---|---|
| North | East | Vertical | LOS CSK | LOS S1 | LOS PAZ asc | LOS PAZ desc | ||
| RECF | 0.5 | −0.1 | −2.1 | −1 * | −1 * | - | - | 2003–2018 |
| PERC | 1.0 | 1.1 | −2.4 | - | - | −2 * | −1 * | 2018–2022 |
| CSK | - | - | - | −0.7 ± 0.3 ** | - | - | - | 2011–2019 |
| S1 | - | - | - | - | −0.8 ± 0.6 ** | - | - | 2016–2021 |
| PAZ asc | - | - | - | - | - | 0.9 ± 0.4 *** | - | 2019–2023 |
| PAZ desc | - | - | - | - | - | - | 0.5 ± 0.4 *** | |
| Vertical | - | - | −0.4 *** | - | - | - | - | |
| E–W | - | 0.9 *** | - | - | - | - | - | |
| Code | Station | Agency | Updated | Vertical (mm/year) | E–W (mm/year) |
|---|---|---|---|---|---|
| 9320A | BM | IBGE | 2018 | −3.5 | 0.3 |
| 3640P | −1.5 | −2.5 | |||
| 3641C | −0.8 | 0.2 | |||
| 3641M | 2021 | −1.7 | −2.2 | ||
| V-15 | Cadastral | Recife | 2013 | −6.1 | −2.7 |
| V-15AZ | −2.5 | −1.9 | |||
| V-37 | −4.5 | −0.2 | |||
| V-37AZ | −3.6 | −0.1 | |||
| V-35 | −3.9 | −0.8 | |||
| V-35AZ | −3.7 | −1.0 |
Disclaimer/Publisher’s Note: The statements, opinions and data contained in all publications are solely those of the individual author(s) and contributor(s) and not of MDPI and/or the editor(s). MDPI and/or the editor(s) disclaim responsibility for any injury to people or property resulting from any ideas, methods, instructions or products referred to in the content. |
© 2024 by the authors. Licensee MDPI, Basel, Switzerland. This article is an open access article distributed under the terms and conditions of the Creative Commons Attribution (CC BY) license (https://creativecommons.org/licenses/by/4.0/).
Share and Cite
Souza, W.d.O.; de Moura Reis, L.G.; da Silva Pereira Cabral, J.J.; Ruiz-Armenteros, A.M.; Quental Coutinho, R.; da Penha Pacheco, A.; Ramos Aragão Junior, W. Analysis of Urbanization-Induced Land Subsidence in the City of Recife (Brazil) Using Persistent Scatterer SAR Interferometry. Remote Sens. 2024, 16, 2592. https://doi.org/10.3390/rs16142592
Souza WdO, de Moura Reis LG, da Silva Pereira Cabral JJ, Ruiz-Armenteros AM, Quental Coutinho R, da Penha Pacheco A, Ramos Aragão Junior W. Analysis of Urbanization-Induced Land Subsidence in the City of Recife (Brazil) Using Persistent Scatterer SAR Interferometry. Remote Sensing. 2024; 16(14):2592. https://doi.org/10.3390/rs16142592
Chicago/Turabian StyleSouza, Wendson de Oliveira, Luis Gustavo de Moura Reis, Jaime Joaquim da Silva Pereira Cabral, Antonio Miguel Ruiz-Armenteros, Roberto Quental Coutinho, Admilson da Penha Pacheco, and Wilson Ramos Aragão Junior. 2024. "Analysis of Urbanization-Induced Land Subsidence in the City of Recife (Brazil) Using Persistent Scatterer SAR Interferometry" Remote Sensing 16, no. 14: 2592. https://doi.org/10.3390/rs16142592
APA StyleSouza, W. d. O., de Moura Reis, L. G., da Silva Pereira Cabral, J. J., Ruiz-Armenteros, A. M., Quental Coutinho, R., da Penha Pacheco, A., & Ramos Aragão Junior, W. (2024). Analysis of Urbanization-Induced Land Subsidence in the City of Recife (Brazil) Using Persistent Scatterer SAR Interferometry. Remote Sensing, 16(14), 2592. https://doi.org/10.3390/rs16142592