Technical Note

Impact Analysis of Vegetation FVC Changes and Drivers in the Ring-Tarim Basin from 1993 to 2021

1
Institute of Desertification Studies, Chinese Academy of Forestry, Beijing 100091, China
2
Institute of Ecological Protection and Restoration, Chinese Academy of Forestry, Beijing 100091, China
3
Key Laboratory of State Forestry and Grassland Administration on Desert Ecosystem and Global Change, Beijing 100091, China
*
Author to whom correspondence should be addressed.
Remote Sens. 2024, 16(14), 2625; https://doi.org/10.3390/rs16142625
Submission received: 20 June 2024 / Revised: 15 July 2024 / Accepted: 17 July 2024 / Published: 18 July 2024

Abstract

:
As an ecologically sensitive area with significant desertification problems, the Ring-Tarim Basin has a fragile ecological environment that is vulnerable to both natural and anthropogenic factors. Accurate long-term vegetation observations are ecologically, socially, and economically important for desertification control. In this study, based on the ground-measured data and the fractional vegetation cover (FVC) inversion dataset obtained by the image element dichotomy method, we used the methods of slope-trend analysis and multiple-regression residual analysis to analyze the spatial and temporal characteristics of the vegetation cover in the desertified area of the Ring-Tarim Basin. At the same time, we assessed the impacts of climate change and human activities on vegetation changes and the contribution of driving forces. The results showed that (1) The annual mean value of FVC in the growing season in the Ring-Tarim Basin generally showed a fluctuating and increasing trend during the period of 1993–2021; a decreasing trend during 1993–1999, with a change rate of −0.13 × 10⁻²a−1; and the fastest increasing trend during 2010–2021, with a change rate of 0.23 × 10⁻²a−1. (2) The effects of climate change and human activities on FVC changes in the growing season had great spatial heterogeneity. The areas where climate change and human activities had no significant effect on FVC changes in the growing season accounted for 86.25% and 77.91%, respectively, the areas where climate and human activities promoted FVC increase in the growing season accounted for 10.53% and 16.37%, respectively, and the areas where climate and human activities inhibited FVC increase in the growing season accounted for 3.22% and 5.72%, respectively. (3) About 76.9% of the FVC changes in the area around the Ring-Tarim Basin were caused by climate change and human activities. In addition to the eastern part of the study area, the vegetation cover of the oases in the west, north, and south generally showed an increasing trend, and the increasing area was proportional to the distribution density of the oasis cities. The trend of vegetation change in the area of the oasis and the fringes of the oasis was drastic. The contribution and inhibition of human activities to FVC, and the driving force of FVC change were greater than that of climate change. More than half of the area had an anthropogenic contribution of more than 60%, indicating that China’s ecological projects have had a significant effect on vegetation change in the extreme arid regions.

1. Introduction

In the context of increasing global climate change, global ecosystems are facing great challenges [1]. Forests occupy a significant proportion of terrestrial ecosystems and play an important mediating role in the water–heat cycle, material flow, and energy exchange [2]. Vegetation not only regulates the local microclimate but also serves as an indicator of regional drought [3]. Fractional vegetation cover (FVC) is the vertical projection of plant bodies in the horizontal plane, and is an important indicator for characterizing ground cover [4]. Changes in vegetation cover are closely related to ecosystem service functions and also affect the evolution of the local climate and ecological environment [3,5]. Accurate monitoring of vegetation cover and its dynamic changes is extremely important for ecological restoration and biodiversity maintenance [6].
Climate elements closely related to the growth and development of vegetation are temperature and precipitation. Some studies have shown that rising temperatures in the Northern Hemisphere have led to a decrease in vegetation cover in some high-latitude regions [7]. In China, the sustained climatic rise over the last 30 years had caused some inhibition of vegetation recovery in the northwestern region [8]. The topographic and climatic conditions in southern Xinjiang determine its ecosystem to be single and low-functioning, making material exchange and ecosystem equilibrium more likely to be disrupted [9]. Human activities also affect vegetation cover. The growth of oasis populations increases the demand for water resources, and the irrational use of water resources can degrade the land, leading to a significant decline in vegetation cover. Ecological restoration projects, such as converting farmland to grassland, the Three-North Shelter Forest Program, and ecological water-transfer projects, are conducive to increasing vegetation cover [10]. Therefore, climate change and human activities will create differences in the degree of vegetation cover in different regions. With the development of remote sensing technology in forest resource monitoring, scholars in various countries have used different remote sensing images to select a variety of remotely sensed vegetation indices for analyzing vegetation cover. These indices mainly including the normalized difference vegetation index (NDVI) [11], ratio vegetation index (RVI) [12], leaf area index (LAI) [13], fraction of photosynthetically active radiation (FPAR) [14], and net primary productivity (NPP) [14]. In addition to remotely sensed vegetation indices that can analyze FVC, machine learning has an integral role in the estimation of FVC [15]. Using the spatial and temporal trends were analyzed using linear regression, Sen-MK, and the Hurst index [16]. Further, their drivers and driving contributions were quantified based on models and parameters such as correlation analysis, residual analysis [17], structural equation modeling [18], and geodetector [19].
As an ecologically sensitive area with prominent desertification problems, the Tarim Basin is of great ecological, social, and economic significance. The study area surrounded the Taklamakan Desert, which has a fragile ecological environment and is susceptible to both natural and anthropogenic factors [9,20]. Therefore, this study analyzed the spatial and temporal variation characteristics of vegetation and the impacts of climate change and anthropogenic activities on vegetation in the Ring-Tarim Basin region based on ground-measured data and a long time-series dataset of FVC inversion. It evaluated the contribution of driving forces using methods such as slope-trend analysis and multivariate regression residual analysis. This study is of practical significance for analyzing the trend of vegetation change and its driving mechanisms in the extreme arid zone, and subsequently formulating effective measures against desertification.

2. Materials and Methods

2.1. The Study Area

The study area was selected as the Ring-Tarim Basin, located in the southern part of the Xinjiang Uygur Autonomous Region, China. The northern, northeastern, and southwestern parts of the region border the Tian Shan, Altun Shan, and Kunlun Mountains, respectively [21]. The study area spanned between 74°18′53″E and 91°24′15″E and 35°59′24″N and 42°1′34″N, as shown in Figure 1. It fell within a continental arid climate zone, characterized by an average temperature of 10.7 °C, significant annual and daily temperature variations, dry weather, scarce precipitation (17.4–42.8 mm per year), and high evapotranspiration intensity (1800–2900 mm) [21]. Simultaneously, climate change and human activities have turned the region into a frequent site for dust storms and sandstorms, resulting in a relatively high risk of desertification [22]. The focus of this study was a desertified area, leading to a total study area of 3.294 × 10⁷ hectares after excluding the primary desert area of the Taklamakan Desert.

2.2. Dataset Description

Temperature and precipitation data were obtained from the monthly spatially interpolated dataset of meteorological elements in China, published by the Institute of Geographic Sciences and Natural Resources Research, Chinese Academy of Sciences (https://www.resdc.cn, accessed on 1 July 2024). The dataset was based on daily observations from more than 2400 meteorological stations in China and was interpolated using Anusplin version 4.3 software. The independent variables for the interpolation were longitude and latitude, and the covariate was elevation, with results under strict quality control. The time range was from 1 January 1993 to 31 December 2021, and the spatial resolution was 1 km. In this study, the annual mean data were derived from the monthly data of temperature and precipitation. The spatial resolution was 30 m, obtained using cubic convolution resampling.
The study was based on the GEE remote sensing cloud platform, and the NDVI was calculated from cloud-free remote sensing images of the LANDSAT satellite during the vegetation growing season (April to October) from 1993 to 2021. The spatial distribution of the mean NDVI values for the years 1993–1999 is shown in Figure 2a, and the spatial distribution of the mean NDVI values for the years 2000–2021 is shown in Figure 2b. The upper and lower thresholds of the NDVI were set at a 0.5% confidence level to obtain the NDVI values of pure vegetation cover and pure soil cover image elements. This approach was used to eliminate the influence of inter-annual climatic differences on the calculation of vegetation cover and to ensure consistency in the calculation of vegetation cover each year. Finally, the annual FVC dataset for the Ring-Tarim Basin from 1993 to 2021 was obtained [23], with a spatial resolution of 30 m. For the missing data and the gaps in the time-series data due to de-clouded snow, this study used linear interpolation for refinement to ensure data integrity. All data sources and the time statistics for each data source are shown in Table 1.

2.3. FVC Inversion

There have been increasing studies on inversion methods for FVC, including regression models, image element dichotomous models, machine-learning methods, physical models, spectral gradient difference, and forest canopy density mapping models [24,25]. The binary pixel model of the image element mixture decomposition model is widely used due to its simple form and physical significance [24]. The study was primarily based on the annual NDVI dataset and used the image element dichotomous model to calculate FVC [23]. The image element dichotomous model assumes that the information observed through remote sensing sensors can be expressed as two parts: the information contributed by the green vegetation and the information contributed by the bare soil (non-vegetated areas). Therefore, the expression for calculating vegetation cover is as follows:
F V C = N D V I N D V I s o i l N D V I v e g N D V I s o i l
where NDVI represents the vegetation index of the current image; N D V I s o i l represents the vegetation index of the image with pure bare soil cover; and N D V I v e g represents the vegetation index of the image with pure vegetation cover. The upper and lower thresholds of NDVI were determined using a 0.5% confidence level, with the cumulative 5% of NDVI representing N D V I s o i l and the cumulative 95% of NDVI representing N D V I v e g .

2.4. Trend Analysis of Time-Series Changes

The inter-annual trend of FVC in the growing season from 1993 to 2021 in the Ring-Tarim Basin area was calculated using a one-way linear regression method [26]. The slope obtained from fitting the linear regression equation was defined as the inter-annual trend rate of change (slope) of FVC. The trend rate of change was calculated as follows:
slope = n × i = 1 n   i × F V C i i = 1 n   i i = 1 n   F V C i n × i = 1 n   i 2 i = 1 n   i
where slope is the slope of the univariate linear regression equation of FVC fitted with time during the growing season; i is the time variable, an integer from 1 to n; n is the number of years of the time-series data, which was 29 in this study; and F V C i is the average FVC value of the growing season in the ith year. The positive and negative signs of the slope value indicate the direction of change in FVC over time in the growing season, and the absolute value indicates the speed and degree of change; the larger the absolute value of the slope, the more drastic the change in FVC in the growing season.

2.5. Multiplicative Residual Analysis

It has been shown that inter-annual variability in climate, especially precipitation, has a strong influence on the NDVI, and that the climate signal needs to be removed from the time series before it can be attributed to human activities [27]. This study used multiple-regression residual analysis to determine the effects and relative contributions of human activities and climate change on changes in FVC [17,28]. It mainly included the following steps: (1) Based on the growing season FVC and air temperature and precipitation time-series data, the model was fitted with FVC as the dependent variable, and air temperature and precipitation as the independent variables, to obtain the fitting constant term of this regression model, as shown in Equation (3). (2) The air temperature and precipitation time-series data were brought into the fitted multiple linear regression model, and the predicted value of FVC (FVCCC) was obtained. FVCCC was used to represent the effect of climatic factors on FVC. (3) The climate signals were removed and we calculated the FVC residual (FVCHA), which is the difference between the observed values of FVC (FVCabs) and the predicted values of FVC (FVCCC), as shown in Equation (4). FVCHA is used to express the effect of human activities on FVC:
F V C c c = a × T e m + b × P r e + c
F V C H A = F V C a b s F V C c c
where FVCCC is the predicted value of FVC fitted by the multiple-regression model; FVCabs is the observed value of FVC obtained by the inversion of Equation (1); a, b, and c are the constant terms of the regression model; Tem is the mean annual temperature in °C; Pre is the mean annual precipitation in mm; and FVCHA is the residual of the multiple-regression model Equation (3). Equation (3) can determine the proportion of impacts caused by changes in FVC due to climate change (temperature, precipitation), and Equation (4) can represent the positive or negative deviation of FVC from this relationship, i.e., the extent to which impacts are attributed to human activities [27,29].

2.6. Drivers of FVC Change and Contribution Determination

In this study, the drivers of vegetation-cover change were categorized into two types: climate change and human activities [30]. The linear trend rates of FVCCC and FVCHA (Slope) in the study area from 1993 to 2021 were calculated using Equations (1)–(4). A positive slope value indicates an increase in FVC, meaning that climate change or human activities have contributed to the FVC, leading to vegetation improvement. A negative slope value indicates a decrease in FVC, meaning that climate change or human activities are inhibiting FVC, resulting in poorer vegetation and relative ecological degradation. To accurately quantify the effects of climate change and human activities on FVC, the study referred to the thresholds of the NDVI trend rate grading system by Jin Kai et al. [17], and categorized the trends of FVCCC and FVCHA into seven classes: obviously inhibited, moderately inhibited, mildly inhibited, basically unaffected, slightly facilitated, moderately facilitated, and obviously facilitated (Table 2). To quantify the contribution of the two types of influence, climate change and human activities, the drivers leading to changes in FVC during the growing season in the study area were calculated and classified according to the table of drivers of vegetation-cover change and determination of contribution rate (Table 3), and the relative contribution rates of climate change and human activities were obtained.

3. Results

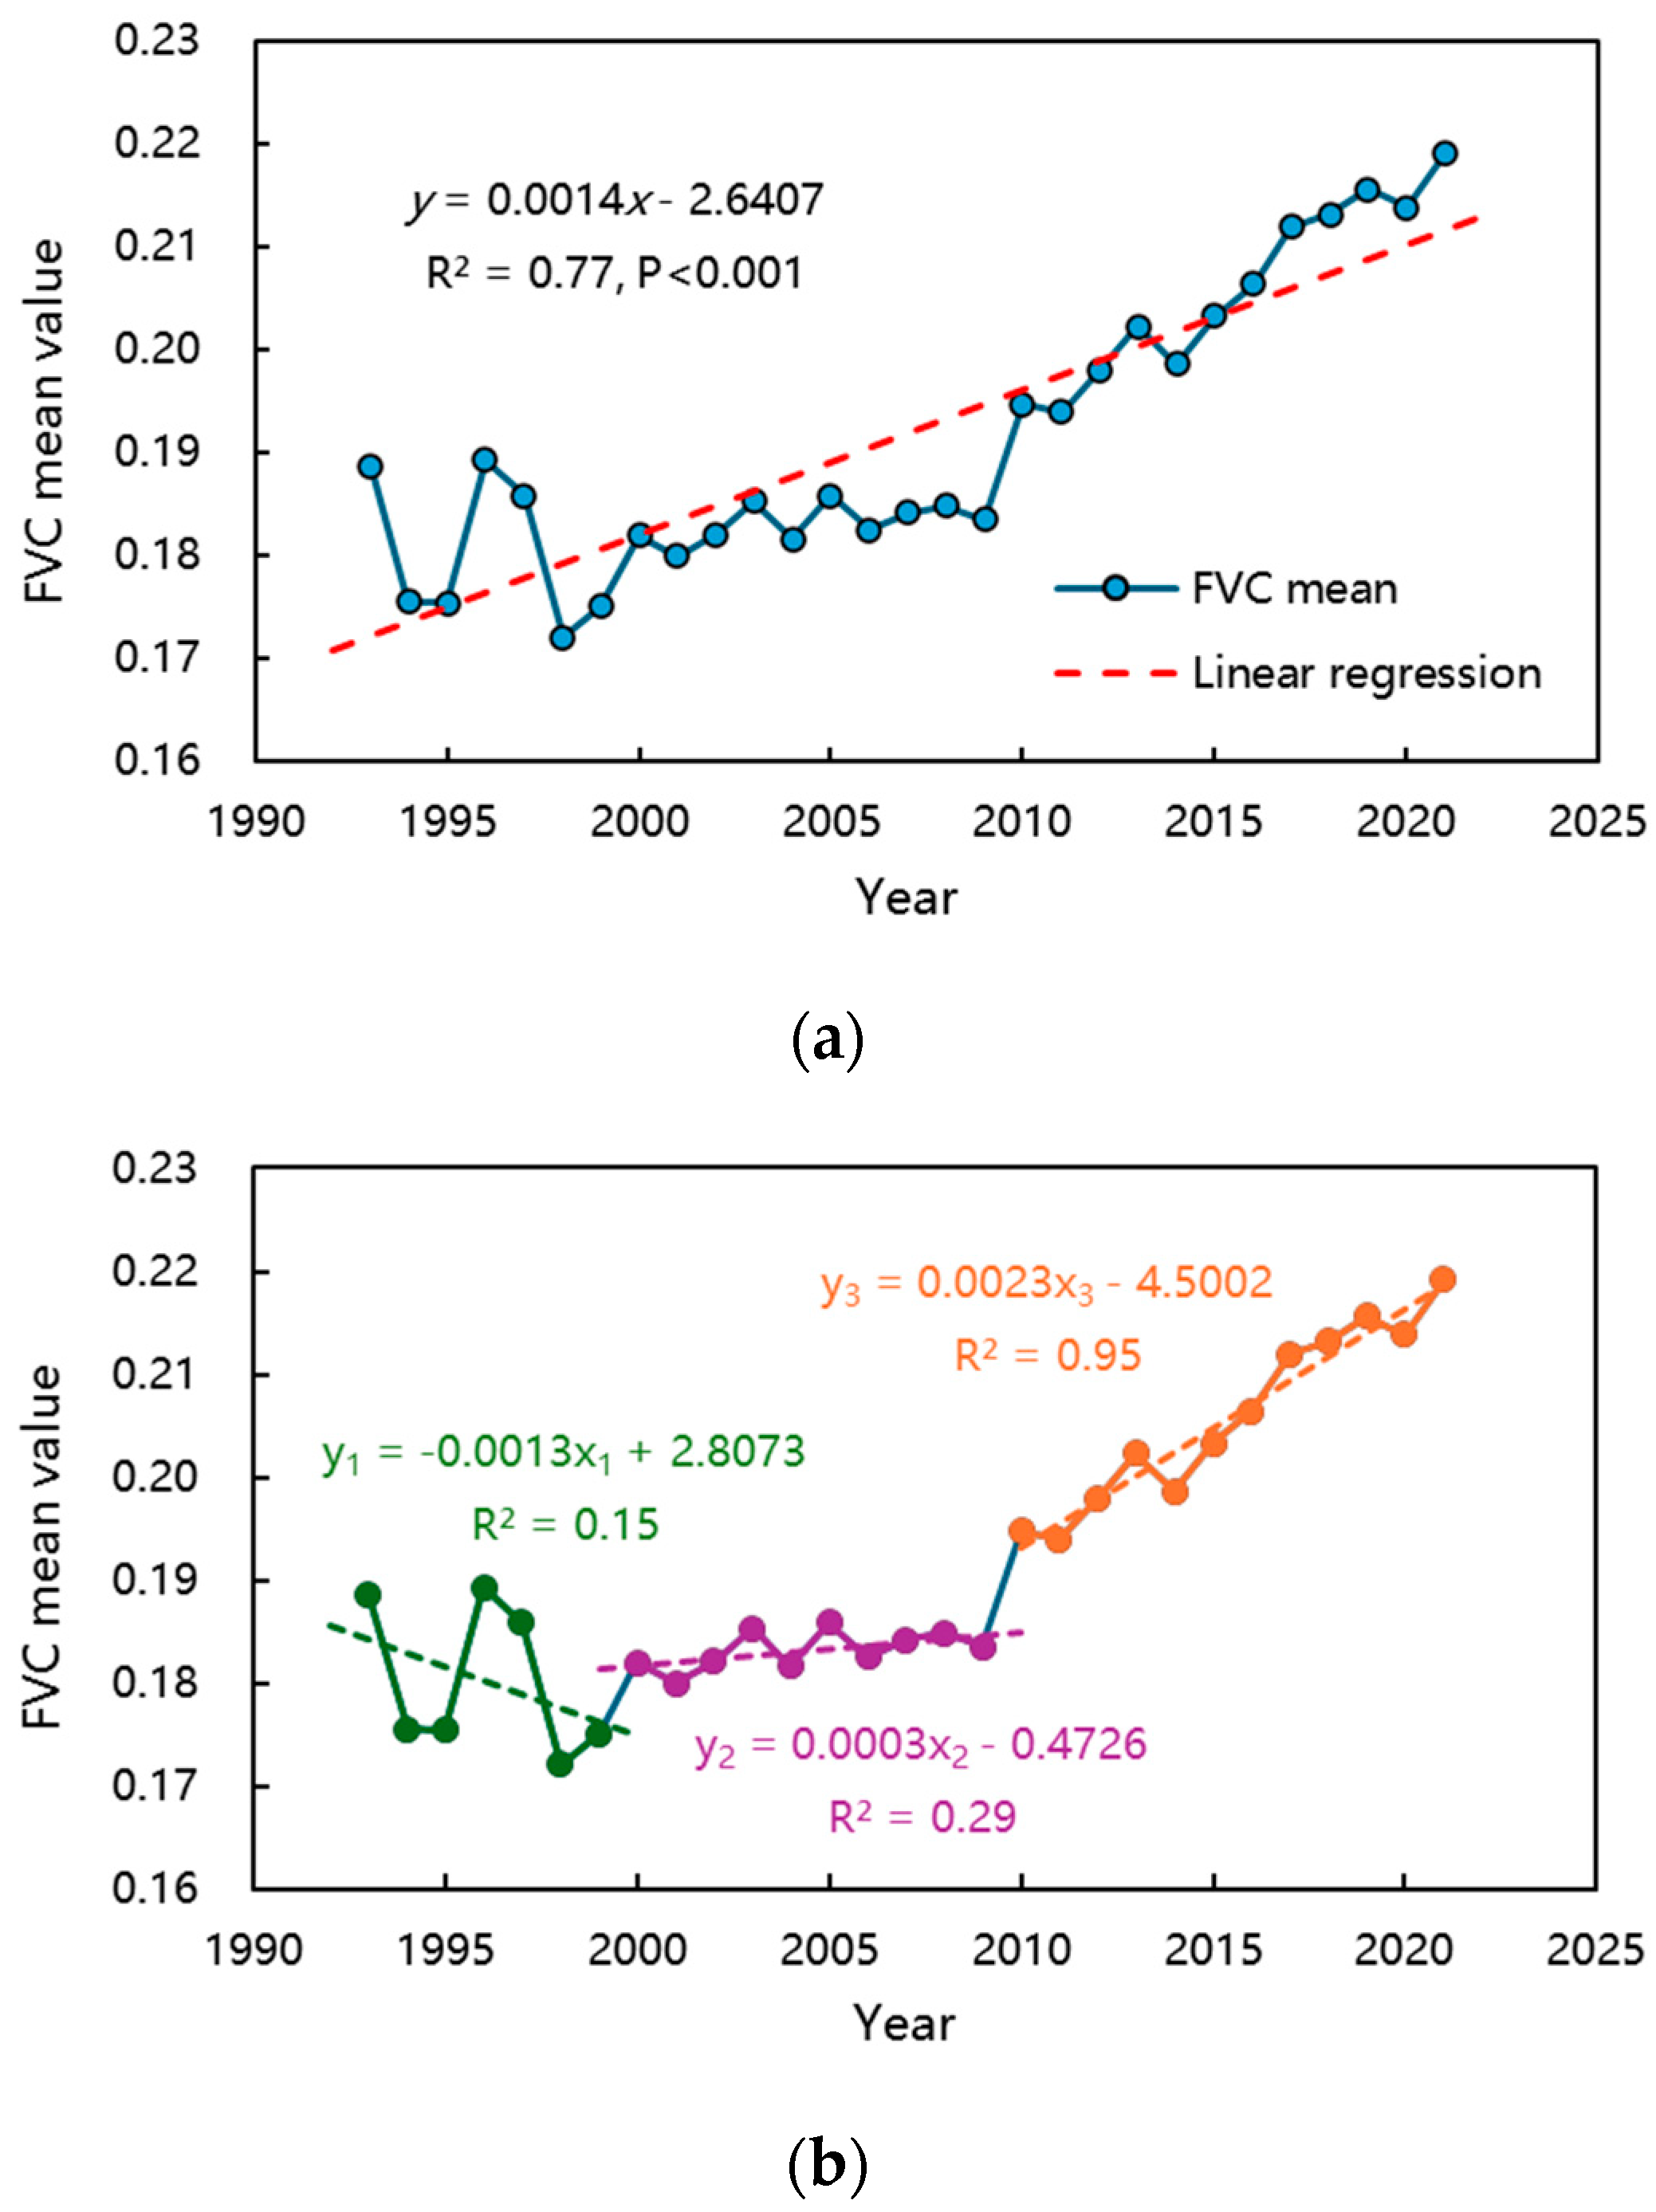
3.1. Spatial and Temporal Changes in FVC

In terms of temporal changes, the year-to-year average FVC for the growing season in the Ring-Tarim Basin from 1993 to 2021 showed a general fluctuating and increasing trend. The regional average growing season FVC varied from 0.172 to 0.219, with the minimum and maximum values occurring in 1998 and 2021, respectively. The degree of fluctuation was greater before 2000, showing a decreasing trend; after 2000, the overall trend showed a continuous fluctuating increasing trend, with relatively large fluctuations in 2009–2010 (Figure 3a). Changes by time period (Figure 3b) showed that 1993–2021 can be divided into three time periods. From 1993 to 1999, there was a downward trend, with a trend rate of change of −0.13 × 10⁻²a−1, indicating a stronger degree of change but the largest fluctuation among the three time periods. From 2000 to 2009, there was a slow upward trend, with a trend rate of change of 0.03 × 10⁻²a−1, indicating the smallest degree of change and the smallest fluctuation among the three time periods. From 2010 to 2021, there was an accelerating upward trend, with a trend rate of change of 0.23 × 10⁻²a−1, indicating the largest degree of change and the largest fluctuation among the three time periods. Overall, the average trend rate of FVC in the growing season of the Ring-Tarim Basin from 1993 to 2021 was 0.14 × 10⁻²a−1 (p < 0.001), indicating that the recovery of vegetation in the Ring-Tarim Basin area was more significant and that desertification control had achieved some success.
In terms of spatial variation, the overall trend of FVC during the growing season in the Ring-Tarim Basin from 1993 to 2021 showed significant spatial heterogeneity, as shown in Figure 4. Based on the positive and negative values of the slope trend rate to determine the increase or decrease in FVC (Figure 4a), the area with an increasing trend accounted for about 36.2% of the total area, while the area with a decreasing trend accounted for about 63.8% of the total area. Vegetation in the western, northern, and some parts of the southern study area showed an overall increasing trend, whereas vegetation in the eastern part showed an overall decreasing trend, which corresponded with the distribution of oasis cities. Figure 4b shows that vegetation in the oasis and the oasis edge areas changed drastically. The areas where the overall trend of FVC showed a significant increase were mainly located around the oases in Aksu, Aral, Korla, and Atushi cities. In contrast, areas with a significant decrease were mainly in the urban area of Kashgar city, along the eastern part of Hotan, and to the southern edge of Korla, exhibiting smaller clusters and strip distributions. FVC in areas other than the oases and those mentioned above showed smaller decreasing trends.

3.2. Analysis of Drivers of FVC Change

Figure 5 shows that the effects of both climate change and human activities on the changes in FVC during the growing season from 1993 to 2021 in the Ring-Tarim Basin exhibited significant spatial heterogeneity. In a specific area (e.g., between Aral and Korla), the degree of influence of the two drivers on FVC changes varied greatly. Approximately 86.25% of the study area showed no significant effect of climate change on FVC variation during the growing season, while approximately 77.91% showed no significant effect of human activities on FVC variation during the growing season.
The area of the Ring-Tarim Basin where climate change contributed to the increase in FVC during the growing season was about 10.53%, with areas of slight, moderate, and significant contributions being 8.30%, 2.03%, and 0.20%, respectively. The areas of moderate and significant contributions were mainly located between Aksu and Aral and in the southeastern part of Kashgar City (Figure 5a). The area of the Ring-Tarim Basin where human activities contributed to the increase in FVC during the growing season was about 16.37%, which was larger than the area where climate change contributed to the increase in FVC. The areas with slight, moderate, and significant contributions were 11.67%, 3.39%, and 1.31%, respectively. The areas of moderate and significant contributions were mainly located in the western and northern parts of the study area, specifically between Aral and Korla cities, around Atushi city, and around Tumushuke city (Figure 5b).
The area of the region where climate change in the Ring-Tarim Basin inhibited the increase in FVC during the growing season was about 3.22%, with areas of slight, moderate, and significant inhibition being 3.16%, 0.06%, and 0.001%, respectively. The areas with moderate and significant inhibition were mainly concentrated in the southwestern corner of the study area (Shache County), while the areas of slight inhibition were concentrated in Hotan city in the east, southern Korla city, and southeastern Kashgar city (Shache County), and sparsely distributed at the oasis edge (Figure 5a). The area of the Ring-Tarim Basin where human activities inhibited the increase in FVC during the growing season was about 5.72%, which was larger than the area where climate change inhibited the increase in FVC. The areas that played a slight, moderate, and significant inhibitory role were 5.46%, 0.25%, and 0.01%, respectively. The areas of moderate and significant inhibition were mainly distributed in clusters or long strips around the periphery of the oasis area, with significant inhibitory areas mainly in the southeastern corner of the study area (Ruoqiang County) and a smaller area between the central part of Aral city and Korla city (Figure 5b). In conclusion, the effects of human activities on FVC changes were greater than those of climate change.
Figure 6 shows that about 76.9% of the area in the Ring-Tarim Basin with changes in vegetation cover was the result of the combined effects of climate change and human activities. Among these, approximately 26.7% of the areas where climate change and human activities jointly led to an increase in FVC were mainly located in the oasis areas in the west and north and the northern edge of the Kunlun Mountains in the extreme south. About 50.2% of the area where climate change and human activities jointly caused a decrease in FVC was primarily located in the eastern region, the outermost parts of the oasis, and the periphery of the Taklamakan Desert. Climate change alone affected 7.8% of the areas with changes in vegetation cover, including 2.3% where climate change caused an increase in vegetation cover, which was generally sparsely distributed, with a notable concentration only in the western part of the study area (Shache County). Additionally, 5.5% of the areas experienced a decrease in vegetation cover due to climate change, primarily around the eastern part of Hotan City. In 15.3% of areas, human activities alone affected the change in vegetation cover. Of these, 7.3% experienced an increase in vegetation cover due to human activities, mainly distributed along rivers in the southern part of the Huanta Basin and clustered along the line from Aral to Korla. On the other hand, 8.0% of the areas saw a decrease in vegetation cover caused by human activities, generally located in the southeastern corner of the study area (Ruoqiang County), the western part of Hotan City (Pishan County), and northern Tumushuke City (Kuqa City). In summary, the area affected by changes in vegetation cover due to human activities alone was larger than that affected by climate change alone. However, changes in vegetation cover were predominantly the result of the combined effects of climate change and human activities.

3.3. Contribution of Different Drivers to the Change in FVC

The contribution of climate change and human activities to the study area was equally divided into five categories, from 0 to 100%, and their spatial distribution is shown in Figure 7. Figure 7a shows that the largest proportion of climate-change contribution to FVC change was in the 0~20% interval, with the smallest in the 60~80% interval; the largest proportion of human activity contribution to FVC change was in the 80~100% interval, with the smallest in the 20~40% interval. There were three main areas where the contribution of climate change to FVC change was greater than 60%. These were the eastern part of Kashgar city, the eastern extension of Hotan, and the easternmost part of the study area. There were five main areas where the contribution of human activities to FVC changes was greater than 60%: Tumxuk city, the central part of Aral city to Korla city, the western part of Hotan, the southern part of the study area bordering the Taklamakan Desert, and the southeastern part of the study area. The areas where the contribution of climate change and human activities to FVC changes was between 40% and 60% were mainly located around Aksu and Aral cities, and the northeastern part of the study area.

4. Discussion

4.1. Analysis of Drivers of Spatio-Temporal and Multi-Temporal Changes in FVC

This study shows that the vegetation cover in the Ring-Tarim Basin generally increased from 1993 to 2021 and can be categorized into three stages: decreasing, slowly increasing, and accelerating (Figure 3). From 1953 to 2020, the total population size of Xinjiang nearly trebled, and this population growth also heightened the demand for water resources [31,32]. The uncontrolled use of water resources prior to 2000 lowered the groundwater table and vegetation cover in the extreme arid zone, exacerbating land desertification in the Ring-Tarim Basin [32]. The water diversion system within the oasis, in turn, flooded the area at a rate of 25.6 × 10⁸ m3 per year, leading to a surge in the groundwater table and causing land salinization [33,34]. The most typical case in the study area was the Tarim River Basin, where uncontrolled diversion of water for irrigation in the upper reaches from the 1970s to 2000 resulted in only about 17% of the downstream water volume. The groundwater level dropped from 1–4 m to 6–12 m, causing vegetation die-off and land degradation, ultimately turning the tailrace of Lop Nor in the southeastern part of the study area into a salt desert [32].
Since 2000, the Chinese government had initiated an ecological water-transfer project with a total cost of RMB 10.7 × 10⁹, aiming to restore the ecological environment of the Tarim River Basin [9]. The ecological water-transfer project has had a positive effect on the recovery of vegetation in the Tarim River Basin. Some studies had shown that after four water transfers from 2000 to 2002, the response range of natural vegetation expanded from 200–250 m to 800 m with the increase in groundwater level in the Tarim River Basin [35,36]. Some studies had also evaluated the ecological water-transfer project based on remote sensing techniques in terms of land-use-type changes, showing that unused land was the main land type converted to natural vegetation [36,37]. Human activities have had a positive effect on the restoration of natural vegetation. Some studies [38] also analyzed the spatial pattern and center of gravity changes of Xinjiang’s vegetation cover from 2000 to 2019, and the results were consistent with this study.
Climate change and human activities can jointly drive increases in vegetation cover, in addition to acting as inhibitors (Figure 6). There was strong spatial heterogeneity in the effects of both on FVC change, but the overall area showing inhibition was less than 6% (Figure 5). Since 1990, the spatial and temporal variations of mean surface air temperature in northern China have been large, with temperature changes in the Ring-Tarim Basin region ranging from 0.3 to 0.4 °C [39]. Climate warming accelerates soil decomposition through various mechanisms, and the prolonged vegetation growth period is favorable for vegetation growth [17]. Meanwhile, since China implemented the fifth phase of the Three North Project (2011–2020), the study area has experienced accelerated vegetation-cover growth [10,40]. In summary, climate change and human activities play an important role in vegetation recovery in the Ring-Tarim Basin region.

4.2. Limitations

The study analyzed the FVC change situation in the Ring-Tarim Basin region, quantified the impact of climate change and human activities on vegetation, and evaluated its driving force contribution rate. However, there were still certain limitations. There is a certain degree of uncertainty in determining the contribution rates of driving factors at different scales, and the separation of climate change and human activities at large scales can easily overlook the spatial differentiation within the region [10]. The selection and determination of climate factors are also directly related to their contribution rate. In later research on climate driving factors in extreme arid areas, climate factors such as wind speed were also considered [41,42]. At the same time, there are many factors affecting human activities, including socio-economic and policy factors. This article only considers the overall degree of using multiple-regression residuals as the influencing factors of human activities, without considering specific factors.
Second, regression residual analysis usually assumes a linear relationship between changes in FVC and time, but in reality, changes in FVC may be nonlinear. This, in turn, may lead to large residuals, affecting the accuracy of the analysis. Therefore, in this study, while analyzing the overall trend, segmented regression analysis was conducted to further mitigate this impact. Machine-learning regression can also be used to address nonlinear relationships. Finally, there may have been some autocorrelation of residuals in time-series data, especially if the data exhibited seasonal or long-term trends. If autocorrelation is strong, it can lead to biased estimates and invalid hypothesis tests. One can try using a covariance estimation method that accounts for autocorrelation and heteroskedasticity [43], or employ a time-series model (e.g., ARIMA [44]) to address autocorrelation.

5. Conclusions

Based on time-series meteorological data and fractional vegetation cover inversion datasets, this study used methods such as slope-trend analysis and multiple-regression residual analysis to investigate the spatiotemporal changes of vegetation in the Ring-Tarim Basin desertification area, as well as the impact of climate change and human activities on vegetation, and evaluated their driving force contribution rates. The main conclusions are as follows:
The annual average FVC during the growing season of the Ring-Tarim Basin from 1993 to 2021 showed a fluctuating and increasing trend, with an average trend rate of 0.14 × 10⁻²a−1 (p < 0.001). Climate change and human activities jointly promoted vegetation restoration in the Ring-Tarim Basin region. The fastest upward trend of FVC was observed from 2010 to 2021, with significant vegetation restoration in the Ring-Tarim Basin area, closely related to the implementation of ecological protection projects. Except for the eastern part, the vegetation coverage of oases in the western, northern, and southern parts of the research area showed an overall increasing trend. The spatial distribution of the increased areas was consistent with the distribution of oases. The vegetation change trend in oases and the edge areas of oases was significant, with both increases and decreases coexisting.
The impact of climate change and human activities on the FVC changes during the growing season in the Ring-Tarim Basin showed significant spatial heterogeneity. The change in vegetation coverage was the result of the combined effects of climate change and human activities. Human activities had a greater promoting and inhibiting effect on the increase in FVC than climate change, and the area driven by human activities was greater than that driven by climate change.

Author Contributions

Conceptualization, X.C. and M.C.; writing—original draft preparation, L.X.; writing—review and editing, L.X., Z.Q. and Y.F.; visualization, Z.Q.; software, J.Z.; project administration, Y.F. All authors have read and agreed to the published version of the manuscript.

Funding

This research was funded by the Third Xingjiang Scientific Expedition and Research Program (Grant NO. 2021xjkk0304) and the National Forestry and Grassland Science Data Center Desert Sub-Center (Grant NO. 2005DKA32200).

Data Availability Statement

The raw data supporting the conclusions of this article will be made available by the authors on request.

Conflicts of Interest

The authors declare no conflicts of interest.

References

  1. Mori, A.S.; Lertzman, K.P.; Gustafsson, L. Biodiversity and ecosystem services in forest ecosystems: A research agenda for applied forest ecology. J. Appl. Ecol. 2017, 54, 12–27. [Google Scholar] [CrossRef]
  2. Jiang, N.; Zhang, Q.; Zhang, S.; Zhao, X.; Cheng, H. Spatial and temporal evolutions of vegetation coverage in the Tarim River Basin and their responses to phenology. CATENA 2022, 217, 106489. [Google Scholar] [CrossRef]
  3. Amuti, T.; Luo, G. Analysis of land cover change and its driving forces in a desert oasis landscape of Xinjiang, northwest China. Solid Earth 2014, 5, 1071–1085. [Google Scholar] [CrossRef]
  4. Cao, M.; Chen, Y.; Wang, X.; Ding, J. Temporal and spatial variation of vegetation coverage in Tarim River Basin. In Proceedings of the IGARSS 2019—2019 IEEE International Geoscience and Remote Sensing Symposium, Yokohama, Japan, 28 July–2 August 2019; pp. 6614–6617. [Google Scholar]
  5. Gao, S.; Castellazzi, P.; Vervoort, R.W.; Doody, T.M. Fine scale mapping of fractional tree canopy cover to support river basin management. Hydrol. Process. 2021, 35, e14156. [Google Scholar] [CrossRef]
  6. Zribi, M.; Dridi, G.; Amri, R.; Lili-Chabaane, Z. Analysis of the effects of drought on vegetation cover in a Mediterranean region through the use of SPOT-VGT and TERRA-MODIS long time series. Remote Sens. 2016, 8, 992. [Google Scholar] [CrossRef]
  7. Zhou, L.; Tucker, C.J.; Kaufmann, R.K.; Slayback, D.; Shabanov, N.V.; Myneni, R.B. Variations in northern vegetation activity inferred from satellite data of vegetation index during 1981 to 1999. J. Geophys. Res. Atmos. 2001, 106, 20069–20083. [Google Scholar] [CrossRef]
  8. Sun, W.; Song, X.; Mu, X.; Gao, P.; Wang, F.; Zhao, G. Spatiotemporal vegetation cover variations associated with climate change and ecological restoration in the Loess Plateau. Agric. For. Meteorol. 2015, 209, 87–99. [Google Scholar] [CrossRef]
  9. Yu, X.; Lei, J.; Gao, X. An over review of desertification in Xinjiang, Northwest China. J. Arid Land 2022, 14, 1181–1195. [Google Scholar] [CrossRef]
  10. Wang, L.; Cao, W.; Huang, L. Integrated analysis of ecological effectiveness of major ecological projects in China over the past 40 years. Acta Ecol. Sin. 2024, 44, 2673–2687. (In Chinese) [Google Scholar]
  11. Kattimani, J.M.; Prasad, T. Normalised differenciative vegetation index (NDVI) analysis in south-east dry agro-climatic zones of Karnataka using RS and GIS techniques. Int. J. Adv. Res. 2016, 4, 1952–1957. [Google Scholar] [CrossRef]
  12. Sun, Z.; Chang, N.-B.; Opp, C. Using SPOT-VGT NDVI as a successive ecological indicator for understanding the environmental implications in the Tarim River Basin, China. J. Appl. Remote Sens. 2010, 4, 043554. [Google Scholar]
  13. Bai, J.; Li, J.; Bao, A.; Chang, C. Spatial-temporal variations of ecological vulnerability in the Tarim River Basin, Northwest China. J. Arid Land 2021, 13, 814–834. [Google Scholar] [CrossRef]
  14. Chen, L.; Halike, A.; Yao, K.; Wei, Q. Spatiotemporal variation in vegetation net primary productivity and its relationship with meteorological factors in the Tarim River Basin of China from 2001 to 2020 based on the Google Earth Engine. J. Arid Land 2022, 14, 1377–1394. [Google Scholar] [CrossRef]
  15. Chen, J.; Liu, Y.; Liu, R.; Wei, X. Estimation of high-resolution fractional tree cover using Landsat time-series observations. IEEE Trans. Geosci. Remote Sens. 2023, 61, 4409411. [Google Scholar] [CrossRef]
  16. Yan, Z.; Zhang, S.; Wang, Y. Spatiotemporal dynamics of fractional vegetation cover and climate response in Inner Mongolia during 1982–2021 based on GEE. Trans. Chin. Soc. Agric. Eng. 2023, 39, 94–102. (In Chinese) [Google Scholar]
  17. Jin, K.; Wang, F.; Han, J.; Shi, S.; Ding, W. Contribution of climatic change and human activities to vegetation NDVI change over China during 1982–2015. Acta Geogr. Sin. 2020, 75, 961–974. (In Chinese) [Google Scholar]
  18. Qian, K.; Ma, X.; Yan, W.; Li, J.; Xu, S.; Liu, Y.; Luo, C.; Yu, W.; Yu, X.; Wang, Y. Trade-offs and synergies among ecosystem services in Inland River Basins under the influence of ecological water transfer project: A case study on the Tarim River basin. Sci. Total Environ. 2024, 908, 168248. [Google Scholar] [CrossRef]
  19. Ding, H.; Xingming, H. Spatiotemporal change and drivers analysis of desertification in the arid region of northwest China based on geographic detector. Environ. Chall. 2021, 4, 100082. [Google Scholar] [CrossRef]
  20. Wang, F.; Wu, Z.; Wang, Y.; Jiao, W.; Chen, Y. Dynamic monitoring of desertification in the Tarim Basin based on RS and GIS techniques. Chin. J. Ecol. 2017, 36, 1029–1037. (In Chinese) [Google Scholar]
  21. Hou, Y.; Chen, Y.; Li, Z.; Li, Y.; Sun, F.; Zhang, S.; Wang, C.; Feng, M. Land use dynamic changes in an arid inland river basin based on multi-scenario simulation. Remote Sens. 2022, 14, 2797. [Google Scholar] [CrossRef]
  22. Xu, H.; Chen, Y. Hazard assessment of wind sand disaster in Tarim Basin. J. Nat. Disasters 2003, 12, 35–39. (In Chinese) [Google Scholar]
  23. Feng, Y.; Qiao, K.; Feng, S.; Xi, L.; Qi, Z.; Lan, L. A dataset of temporal-spatial FVC in the Ring Tarim Basin from 1990 to 2021. China Sci. Data 2023, 8, 312–319. (In Chinese) [Google Scholar] [CrossRef]
  24. Gao, L.; Wang, X.; Johnson, B.A.; Tian, Q.; Wang, Y.; Verrelst, J.; Mu, X.; Gu, X. Remote sensing algorithms for estimation of fractional vegetation cover using pure vegetation index values: A review. ISPRS J. Photogramm. Remote Sens. 2020, 159, 364–377. [Google Scholar] [CrossRef] [PubMed]
  25. Jia, K.; Yao, Y.; Wei, X.; Gao, S.; Jiang, B.; Zhao, X. A review on fractional vegetation cover estimation using remote sensing. Adv. Earth Sci. 2013, 28, 774. [Google Scholar]
  26. Tottrup, C.; Rasmussen, M.S. Mapping long-term changes in savannah crop productivity in Senegal through trend analysis of time series of remote sensing data. Agric. Ecosyst. Environ. 2004, 103, 545–560. [Google Scholar] [CrossRef]
  27. Evans, J.; Geerken, R. Discrimination between climate and human-induced dryland degradation. J. Arid Environ. 2004, 57, 535–554. [Google Scholar] [CrossRef]
  28. Liu, X.; Zhu, X.; Pan, Y.; Li, S.; Ma, Y.; Nie, J. Vegetation dynamics in Qinling-Daba Mountains in relation to climate factors between 2000 and 2014. J. Geogr. Sci. 2016, 26, 45–58. [Google Scholar] [CrossRef]
  29. Wessels, K.J.; Prince, S.D.; Malherbe, J.; Small, J.; Frost, P.E.; Van Zyl, D. Can human-induced land degradation be distinguished from the effects of rainfall variability? A case study in South Africa. J. Arid Environ. 2007, 68, 271–297. [Google Scholar] [CrossRef]
  30. Liu, Y.; Li, Y.; Li, S.; Motesharrei, S. Spatial and temporal patterns of global NDVI trends: Correlations with climate and human factors. Remote Sens. 2015, 7, 13233–13250. [Google Scholar] [CrossRef]
  31. Feimin, Z.; Zhifeng, J.; Fei, L.; Xu, M. Soil salinization in Xinjiang Production and Construction Corps: Current situation and prevention and control countermeasures. J. Agric. 2020, 10, 36. [Google Scholar]
  32. Leiwen, J.; Yufen, T.; Zhijie, Z.; Tianhong, L.; Jianhua, L. Water resources, land exploration and population dynamics in arid areas-the case of the Tarim River basin in Xinjiang of China. Popul. Environ. 2005, 26, 471–503. [Google Scholar] [CrossRef]
  33. Tian, C.; Song, Y.; Hu, M. Status, Causes and Countermeasures of Desertification in Xinjiang. J. Desert Res. 1999, 19, 214–218. (In Chinese) [Google Scholar]
  34. Wang, R.; Zhou, X.; Zhang, H. Desertification Disasters and Their Countermeasures in Xinjiang. J. Nanjing For. Univ. Nat. Sci. Ed. 2002, 26, 32–36. (In Chinese) [Google Scholar]
  35. Chen, Y.; Li, W.; Xu, H.; Liu, J.; Zhang, H.; Chen, Y. The Influence of Groundwater on Vegetation in the Lower Reaches of Tarim River, China. Acta Geogr. Sin. 2003, 58, 542–549. (In Chinese) [Google Scholar]
  36. Chen, Y.; Cui, W.; Li, W.; Zhang, Y. Utilization of Water Resources and Ecological Protection in the Tarim River. Acta Geogr. Sin. 2003, 58, 215–222. (In Chinese) [Google Scholar]
  37. Bao, A.; Huang, Y.; Ma, Y.; Guo, H.; Wang, Y. Assessing the effect of EWDP on vegetation restoration by remote sensing in the lower reaches of Tarim River. Ecol. Indic. 2017, 74, 261–275. [Google Scholar] [CrossRef]
  38. Wang, J.; Zhang, F. Spatial-temporal pattern and gravity center change of fractional vegetation cover in Xinjiang, China from 2000 to 2019. Trans. Chin. Soc. Agric. Eng. 2020, 36, 188–194. (In Chinese) [Google Scholar]
  39. Jin, K.; Wang, F.; Yu, Q.; Gou, J.; Liu, H. Varied degrees of urbanization effects on observed surface air temperature trends in China. Clim. Res. 2018, 76, 131–143. [Google Scholar] [CrossRef]
  40. Lu, Q.; Xiao, C.; Bao, Y.; Cui, M.; Cao, X.; Que, X.; Yang, L.; Cui, G. Implementation path and strategic planning of winning the battle of “Three-North” and reconstructing “New Three-North”. Bull. Chin. Acad. Sci. 2023, 38, 956–965. (In Chinese) [Google Scholar]
  41. Mao, D.; Lei, J.; Li, S.; Zeng, F.; Wang, C.; Zhou, J. Characteristics of meteorological factors over different landscape types during dust storm events in Cele, Xinjiang, China. J. Meteorol. Res. 2014, 28, 576–591. [Google Scholar] [CrossRef]
  42. Dong, Q.; Wang, W.; Shao, Q.; Xing, W.; Ding, Y.; Fu, J. The response of reference evapotranspiration to climate change in Xinjiang, China: Historical changes, driving forces, and future projections. Int. J. Climatol. 2020, 40, 235–254. [Google Scholar] [CrossRef]
  43. Andrews, D.W. Heteroskedasticity and autocorrelation consistent covariance matrix estimation. Econom. J. Econom. Soc. 1991, 59, 817–858. [Google Scholar] [CrossRef]
  44. Shumway, R.H.; Stoffer, D.S.; Shumway, R.H.; Stoffer, D.S. ARIMA models. In Time Series Analysis and Its Applications: With R Examples; Springer: Cham, Switzerland, 2017; pp. 75–163. [Google Scholar]
Figure 1. Location of the study area.
Remotesensing 16 02625 g001
Figure 2. Spatial distribution of growing season NDVI in the study area. (a) 1993–1999, (b) 2000–2021.
Remotesensing 16 02625 g002
Figure 3. Seasonal annual changes in FVC during the growing season in the Ring-Tarim Basin, 1993–2021. (a) Overall, (b) over time.
Remotesensing 16 02625 g003
Figure 4. Spatial schematic of FVC trends during the growing season in the Ring-Tarim Basin, 1993–2021. (a) Schematic of trends; (b) schematic of trend rates.
Remotesensing 16 02625 g004
Figure 5. Spatial distribution of impacts of climate change and human activities on vegetation restoration in the Ring-Tarim Basin, 1993–2021. (a) climate change; (b) human activities.
Remotesensing 16 02625 g005
Figure 6. Spatial distribution of drivers of growing season FVC changes in the Ring-Tarim Basin, 1993–2021. (CC and HA refer to climate change and human activities, respectively).
Remotesensing 16 02625 g006
Figure 7. Spatial distribution of the contribution of climate change and human activities to FVC changes in the Ring-Tarim Basin. (a) Climate change; (b) human activities.
Remotesensing 16 02625 g007
Table 1. Statistics on data source information.
TypeNameTimeSourcesResolution
Remote sensing vegetation indexNDVI1993–1999LANDSAT/LT05/C02/T1_L230 m
NDVI2000–2021LANDSAT/LE07/C02/T1_L2
LANDSAT/LC08/C02/T1_L2
30 m
FVC1993–1999NDVI 1993–199930 m
FVC2000–2021NDVI 2000–202130 m
Meteorological dataTemperature1993–2021Dataset products1 km
Precipitation1993–2021Dataset products1 km
Table 2. Graduated scale of impacts of climate change and human activities on FVC (10−2a−1).
Slope (FVCCC) 1Slope (FVCHA) 2Degree of Impact
Slope ≤ −0.2Slope ≤ −0.2Significant inhibition
−0.2 ˂ Slope ≤ −0.1−0.2 ˂ Slope ≤ −0.1Moderate inhibition
−0.1 ˂ Slope ≤ −0.02−0.1 ˂ Slope ≤ −0.02Slightly inhibition
−0.02 ˂ Slope ≤ 0.02−0.02 ˂ Slope ≤ 0.02Basically no impact
0.02 ˂ Slope ≤ 0.10.02 ˂ Slope ≤ 0.1Slightly promotion
0.1 ˂ Slope ≤ 0.20.1 ˂ Slope ≤ 0.2Moderate promotion
Slope ≥ 0.2Slope ≥ 0.2Significant promotion
1 Slope (FVCCC) indicates the trend rate of climate change impacts on FVC; 2 slope (FVCHA) indicates the trend rate of human activities impacts on FVC.
Table 3. Drivers of FVC change and contribution rate determination table.
Slope (FVCabs) 1Driving Factors 4Criteria for ClassifyingRelative Contribution of d Driving Factors (%)
Slope (FVCCC) 2Slope (FVCHA) 3Climate ChangeHuman Activities
>0CC and HA>0>0Slope (FVCCC)/slope (FVCabs)Slope (FVCHA)/slope (FVCabs)
CC>0<01000
HA<0>00100
<0CC and HA<0<0Slope (FVCCC)/slope (FVCabs)Slope (FVCHA)/slope (FVCabs)
CC<0>01000
HA>0<00100
1 Slope (FVCabs) is the trend rate of change in the FVC observations obtained from the inversion of Equation (1); 2 slope (FVCCC) indicates the trend rate of climate change impacts on FVC; 3 slope (FVCHA) indicates the trend rate of human activities impacts on FVC; 4 CC and HA stand for climate change and human activities, respectively.
Disclaimer/Publisher’s Note: The statements, opinions and data contained in all publications are solely those of the individual author(s) and contributor(s) and not of MDPI and/or the editor(s). MDPI and/or the editor(s) disclaim responsibility for any injury to people or property resulting from any ideas, methods, instructions or products referred to in the content.

