Article

Quantification and Driving Factors of Cultivated Land Fragmentation in Rapidly Urbanizing Area: A Case Study in Guangdong Province

1
Department of Land Management, School of Public Affairs, Zhejiang University, Hangzhou 310058, China
2
Land Academy for National Development, Zhejiang University, Hangzhou 310058, China
*
Author to whom correspondence should be addressed.
Remote Sens. 2024, 16(14), 2633; https://doi.org/10.3390/rs16142633
Submission received: 5 June 2024 / Revised: 15 July 2024 / Accepted: 15 July 2024 / Published: 18 July 2024

Abstract

:
Cultivated land resources are crucial for food security and economic and social development. However, with the acceleration of urbanization and shifts in land use, cultivated land fragmentation (CLF) has emerged as a significant factor constraining the sustainable development of agriculture in China. As the most urbanized region, optimizing cultivated land resources and coordinating urban and rural development has become an urgent issue for rural sustainable development in Guangdong Province. This study analyzes the spatiotemporal characteristics of CLF in Guangdong Province from 2000 to 2020 using landscape pattern indices, CRITIC empowerment, and a multiscale geographically weighted regression (MGWR) model. The cultivated land fragmentation index (CLFI) for Guangdong Province reveals a fluctuating trend from 2000 to 2012, increasing from 0.453 in 2012 to 0.641 in 2020. The CLFI is notably high in the Pearl River Delta region, as well as in Meizhou and Maoming. The results show the dynamic changes of the driving factors of CLF at the county scale in 2000, 2010, and 2020. Slope and grain output consistently emerge as key driving factors of CLF. Furthermore, agricultural benefits played a significant role in 2000 and 2020, whereas the coefficient for social economic development was more pronounced in 2010. By identifying the heterogeneity of the driving factors, this study suggests that strategies to address CLF should comprehensively consider aspects such as the optimization of cultivated land resources, farmers’ interests, industrial restructuring, and the multifunctional development of farmland. The study findings can assist government policy-making for rural sustainable development, addressing CLF and food insecurity, and alleviating the regional development imbalance and urban–rural income gap, with the ultimate aim of achieving common prosperity.

1. Introduction

With the changing climate and burgeoning population, food security and sustainable land use have emerged as focal points within the realm of land science [1,2,3]. Cultivated land, being a paramount means of production, is a pivotal element in ensuring food security [4]. Moreover, it serves as a crucial conduit for ecosystem services, providing sustenance, energy, fiber, and various ancillary functions. It also regulates natural disaster risks, offers cultural and spiritual amenities, and is an indispensable resource for socio-economic sustainable development [5,6,7]. As one of the most populous nations globally, China’s cultivated land resources play a pivotal role in national food security, economic development, and social progress [8,9]. Nonetheless, rapid urbanization and industrialization, along with significant rural labor migration, have led to changes in the use of cultivated land [10]. Non-agricultural and non-food usage, marginalization, fragmentation, and abandonment, and other challenges, have become increasingly severe, intensifying the discord between human activities and land utilization [11,12]. Consequently, it is particularly important to maintain the sustainability of cultivated land under the influence of urbanization.
The impact of urbanization on cultivated land is significant and widespread [13]. This is evidenced by the continuous expansion of urban areas, leading to a substantial conversion of agricultural land into urban development sites, resulting in a drastic reduction in arable land area [14]. The diverse and uncertain expansion of development land during the urbanization process leads to the continual division and encroachment of cultivated land, in terms of space [15,16]. This process forms irregularly shaped patches of land of varying sizes, thus rendering previously contiguous cultivated land fragmented, which is called cultivated land fragmentation (CLF). Current research on CLF primarily unfolds along two dimensions: landscape fragmentation and land ownership fragmentation [17,18]. In comparison to land ownership fragmentation, landscape fragmentation, as a tangible resource holds significant importance for understanding changes in cultivated land use within the context of urbanization [19]. Therefore, assessing the degree of CLF and exploring its spatial distribution pattern is of great significance.
CLF is characterized by many spatially separated small patches of cultivated land [20], which are irregular in shape and are spatially unconnected [21]. By comprehensively considering factors such as the spatial distribution, patch size, and quantity of cultivated land, the cultivated land fragmentation index (CLFI) effectively quantifies the degree of CLF [22]. Quantifying regional CLF and studying the spatial and temporal characteristics are helpful in optimizing the spatial pattern of regional cultivated land, improving the utilization rate of farmland, and providing guidance for the agricultural industry and regional coordinated development [23]. This quantification method not only aids in providing a deeper understanding of the characteristics and causes of CLF, but also facilitates further exploration of its positive and negative impacts on food production [24,25]. On one hand, moderate CLF may positively influence food production by enhancing land use flexibility and diversity [16,26]. On the other hand, excessive fragmentation may lead to inefficient land use and increased production costs, exerting a negative impact on food production [27]. Therefore, a comprehensive investigation into the spatiotemporal evolution patterns of CLF is crucial for optimizing cultivated land use and promoting its sustainable development.
Quantitative measurement of regional CLF can effectively explore its driving factors. The primary factors influencing CLF include natural, economic, and policy-related elements. Natural factors, such as the topography and climatic conditions, directly impact CLF [23]. Economic factors, such as agricultural output and farmers’ income, indirectly influence CLF through their impact on farmers’ land use behavior [28,29]. Policy factors, such as land and agricultural policies, also significantly affect CLF [30]. These factors interact and collectively constitute the driving mechanism behind land fragmentation. By analyzing these driving factors in depth, we can better comprehend the causes and evolutionary processes of CLF, providing a scientific basis for the formulation of effective governance measures. However, there are few studies focusing on the long-term spatial characteristics of CLF [19], as well as exploring its potential driving factors and spatial heterogeneity on the regional scale.
China is currently experiencing rapid economic development. The accelerated expansion of urban construction land and transportation networks has led to a substantial amount of conversion of farmland into construction land, increasing CLF [31,32]. Especially in Guangdong Province, which has the highest degree of urbanization in the country, CLF has become a significant factor constraining food security. The development of Guangdong Province is extremely unbalanced, with a large gap between urban and rural development. Rural areas in the Pearl River Delta region (PRDR), owing to their exceptional geographical location and policy advantages, have undergone rapid economic development. This growth has fostered the flourishing of diversified development models, such as modern agriculture and rural tourism. However, in the eastern region of Guangdong (ERGD), the rural industrial structure remains relatively traditional and economic development lags behind, due to population pressures and limited cultivated land resources. Conversely, the western region of Guangdong (WRGD) possesses abundant agricultural resources, yet rural economic development remains comparatively low, resulting in slow increases in farmers’ incomes. In the northern region of Guangdong (NRGD), characterized by mountainous terrain and challenging natural conditions, economic development encounters numerous obstacles. Here, the rural industrial structure is predominantly focused on traditional agriculture, lacking modern agricultural technology and industrial support. Optimizing the limited cultivated land resources and improving the agricultural output value and farmers’ income are important for the sustainable development of rural areas in Guangdong Province. Therefore, the purpose of this study is to: (1) analyze the spatial and temporal evolution characteristics of CLF in Guangdong Province; (2) determine hot and cold spots of CLF in Guangdong Province and their spatiotemporal variation; and (3) explore the driving factors and spatial heterogeneity of CLF in Guangdong Province from 2000 to 2020. This study will provide a scientific basis for understanding the formation of CLF, offer policy suggestions for optimizing cultivated land resources, and has important implications for realizing regional coordinated development strategies and rural revitalization strategies.

2. Materials and Methods
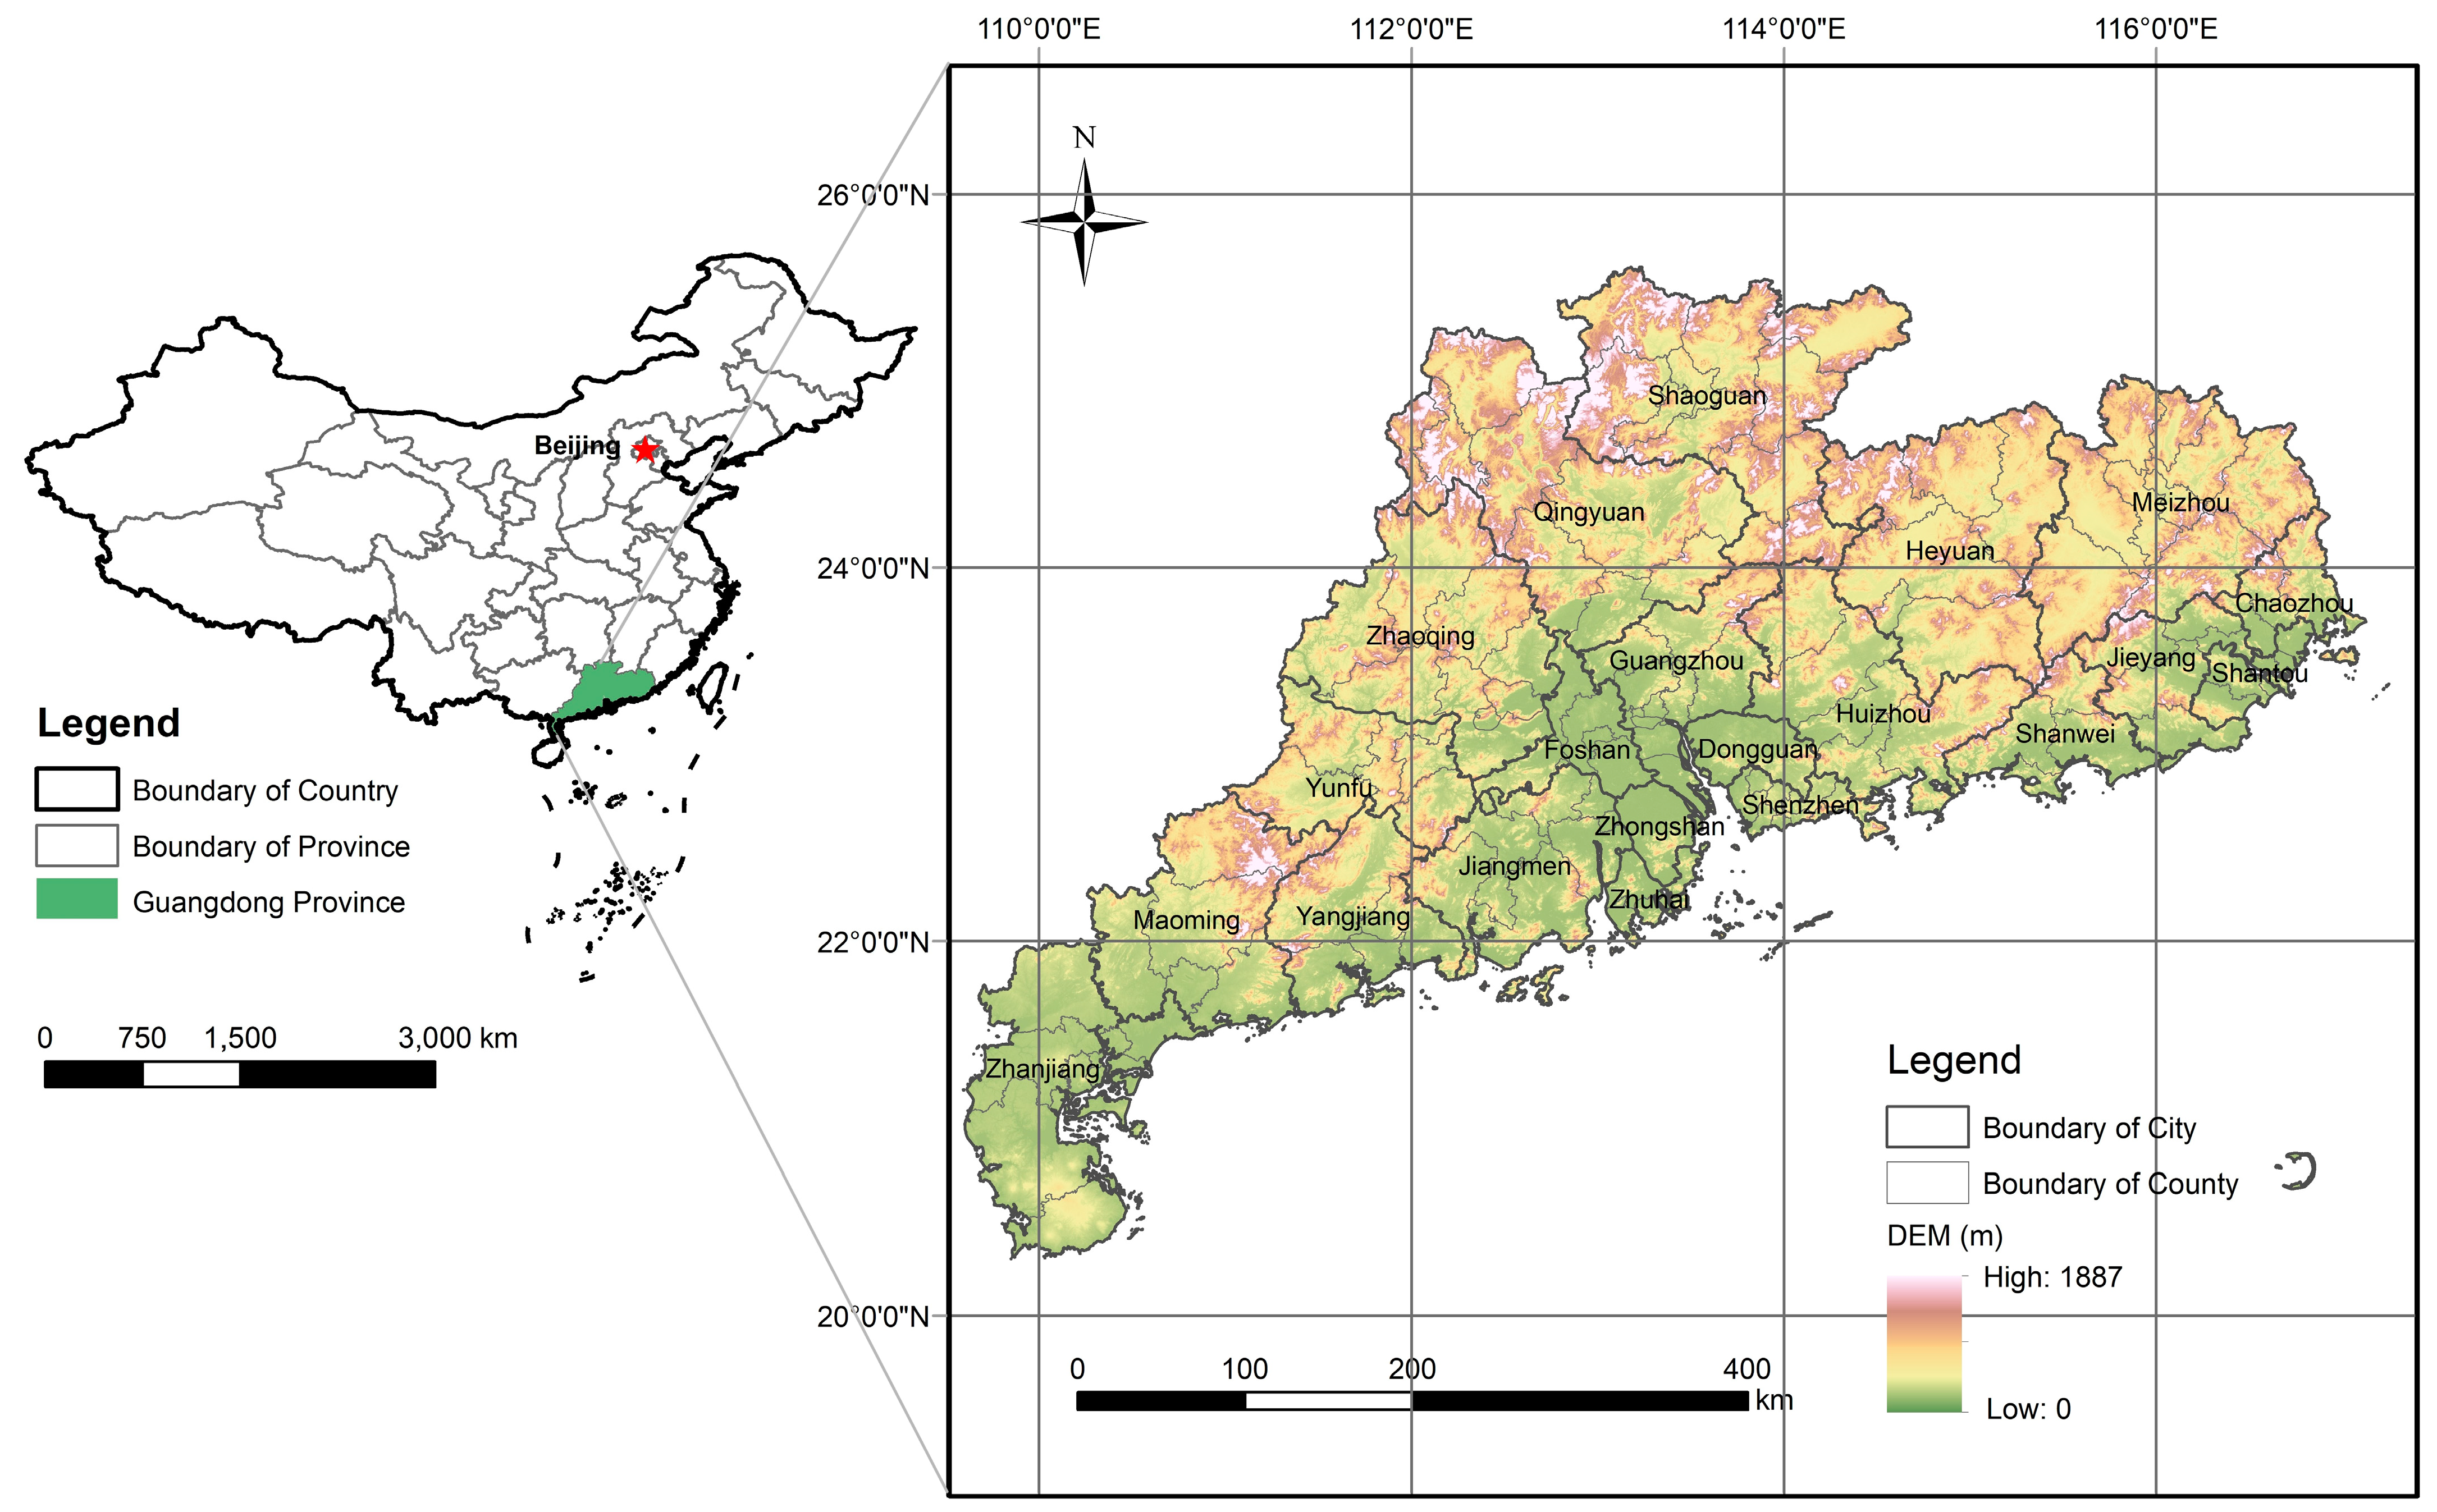
2.1. Study Area

Guangdong Province (20°09′–25°31′N, 109°45′–117°20′E) is located in the southern part of China (Figure 1). The total area of Guangdong Province is 17.98 × 10⁴ km2, with different terrain and geomorphic conditions. The topography of Guangdong Province varies markedly, with the Pearl River Delta in the center, mountainous areas in the north, and coastal plains and hills on the east and west flanks. Guangdong Province has a predominantly subtropical monsoon climate, with a small part in the south having a tropical monsoon climate. The climatic conditions are favorable, with warm winters and little rain, and hot and rainy summers.
Guangdong Province, one of the most economically developed and densely populated regions in China, has witnessed rapid economic growth and accelerated urbanization. This has led to the continuous expansion of construction land, resulting in significant changes to the land use structure, as a large portion of the cultivated land resources has been occupied. Throughout this process, human activities in Guangdong Province have been frequent and diverse. While these activities have driven economic development, they have also caused varying degrees of damage and pollution to farmland resources. The urbanization process in Guangdong Province has been swift, with a substantial influx of the rural population into cities, leading to the continuous expansion of urban areas. Urbanization has not only altered the land use structure but has also profoundly impacted farmland resources. On one hand, urban construction has occupied a considerable amount of high-quality arable land; on the other hand, changes in lifestyle brought about by urbanization have transformed agricultural production methods, further exacerbating the fragmentation of cultivated land resources. As a province with a large population and high food consumption, food security in Guangdong Province is particularly crucial. However, the fragmentation and reduction of farmland resources, along with the transformation of agricultural production methods, pose a serious threat to food production in Guangdong Province. Safeguarding the quantity and quality of farmland resources has become a significant challenge.
As a frontier of reform and opening-up, Guangdong Province has an urbanization rate well above the Chinese average (Figure 2). Guangdong province includes two of China’s first-tier cities, Guangzhou and Shenzhen, and 19 cities. The region has an unbalanced level of urbanization and large differences in socio-economic development. The development of regional socio-economic disparities has also brought about an imbalance in terms of the development between urban and rural areas. The great regional socio-economic differences also lead to differences in cultivated land use efficiency and landscape fragmentation. Therefore, it is of great significance to explore the formation mechanism of cultivated land fragmentation in areas with unbalanced regional development for the sustainable development of rural areas.
To better assess the degree of CLF in Guangdong Province and investigate the driving factors behind this fragmentation, this study takes the county-level administrative divisions of Guangdong Province as a research unit. Reflecting the varying levels of social and economic development, Guangdong Province is categorized into four sub-regions: (1) PRDR, including 50 counties (districts) in Guangzhou, Shenzhen, Zhuhai, Foshan, Jiangmen, Zhongshan, Dongguan, Zhaoqing, and Huizhou; (2) ERGD, encompassing 19 counties (districts) in Shantou, Shanwei, Jieyang, and Chaozhou; (3) WRGD, spanning 18 counties (districts) in Yangjiang, Zhanjiang, and Maoming; and (4) NRGD comprising 37 counties (districts) in Qingyuan, Shaoguan, Heyuan, Meizhou, and Yunfu.

2.2. Data Sources

The sources of the land cover, DEM, precipitation, temperature, water network, road network, and socio-economic data for this study are listed in Table 1. The land cover data for 2000, 2010, and 2020, derived from remote sensing image interpretation data provided by the China Land Cover Dataset [33], were selected to be the data source for calculating cultivated land fragmentation. It is a 30 m spatial resolution dataset developed in China and the overall accuracy of this dataset reaches 80%. In this study, the data includes 7 land cover types: cultivated land, forest, shrub, grassland, water body, barren land, and impervious surface. The DEM data (spatial resolution of 30 m × 30 m) was from the Geospatial Data Cloud. The 2020 road network and water network data from OpenStreetMap [34] serve as the foundational basis for the 2000 and 2010 road network and water network datasets. These earlier datasets are derived in reverse from the “Guangdong Statistical Yearbook”. The county-level socio-economic data for driver analysis were collected from the Rural Statistics Yearbooks for Guangdong Province and Statistical Yearbooks for Guangdong Province from 2000 to 2020. The data from different sources were resampled and transformed by projection in ArcGIS. The projected coordinates were normalized to Krasovsky_1940_Albers coordinates, with a 30 m unified resolution.

2.3. Research Methods

2.3.1. Quantitative Indicators of Cultivated Land Fragmentation

By comprehensively considering factors such as the spatial distribution, patch size, and quantity of cultivated land, the CLFI effectively quantifies the degree of CLF [22]. This quantification method not only aids in gaining a deeper understanding of the characteristics and causes of CLF, but also facilitates further exploration of its positive and negative impacts on food production [24,25]. Landscape pattern indices have been widely used to analyze changes in CLF. Nine landscape pattern indices were selected in this research to evaluate CLF in Guangdong Province using the Fragstats 4.2 software (Table 2). The percentage of the landscape (PLAND), as a key indicator of changes in the scale of cultivated land, profoundly influences the stability of agricultural production [16]. The patch density (PD) quantifies the extent to which cultivated land is fragmented into smaller patches, indirectly reflecting changes in the average patch size. The edge density (ED) effectively assesses the degree of separation and dispersion in the pattern of land types. The area-weighted mean patch area (AREA_MN), as a fundamental characteristic of cultivated land spatial patterns, can be used to characterize the impact of CLF on the level of agricultural mechanization [35]. The area-weighted mean fractal dimension (FRAC_AM) quantifies the degree of folding in cultivated land and can be used to reveal the impact on mechanical tillage, irrigation, and fertilization techniques, as well as the reduction in the actual proportion of cultivated area [36,37]. The landscape shape index (LSI) and the aggregation index (AI) comprehensively characterize the spatial structural features of cultivated land from the perspectives of internal patch complexity and patch clustering [38]. Finally, the mean Euclidean nearest-neighbor distance (ENN_AM) and the landscape division index (DIVISION) further enrich our understanding of the complexity of internal patch composition and overall landscape complexity. These indicators collectively form a multidimensional, comprehensive evaluation system, allowing for an in-depth assessment of cultivated land fragmentation in Guangdong Province from 2000 to 2020.

2.3.2. CRITIC Empowerment

The CRITIC weighting method utilizes the objective attributes of indicator data, considers the magnitude of indicator variability, and accounts for the interrelationships between indicators to measure objective weights, based on the contrast strength and conflict between the indicators [39]. The contrast strength is represented using the standard deviation. A larger standard deviation indicates greater variability, leading to a higher weight. Conflict is represented using the correlation coefficient. A higher correlation coefficient between indicators indicates lower conflict, resulting in a lower weight. For the comprehensive evaluation of multiple indicators, the CRITIC method eliminates the influence of some strongly correlated indicators, reducing the information overlap between the indicators, thus facilitating the attainment of reliable evaluation results. In order to obtain the CLFI for each county in Guangdong Province in 2000, 2010, and 2020, the study used the CRITIC weighting method to determine the weights of each indicator. First, the above 9 indicators were normalized by positive and reverse data processing to obtain standardized dimensionless data. Then, the contrast intensity and conflict of each index were calculated to determine the information carrying capacity and weight coefficient of each index (Table 2). Based on the evaluation index system, this study introduces the cultivated land fragmentation index (CLFI) to quantify the extent of cultivated land fragmentation. A higher value indicates a greater degree of CLF. The calculation formula for the CLFI is as follows:
C L F I i = j = 1 n w j · x i j
where C L F I i is the degree of CLF, w j is the weight coefficient corresponding to each indicator, and x i j is the standardized value of each indicator.

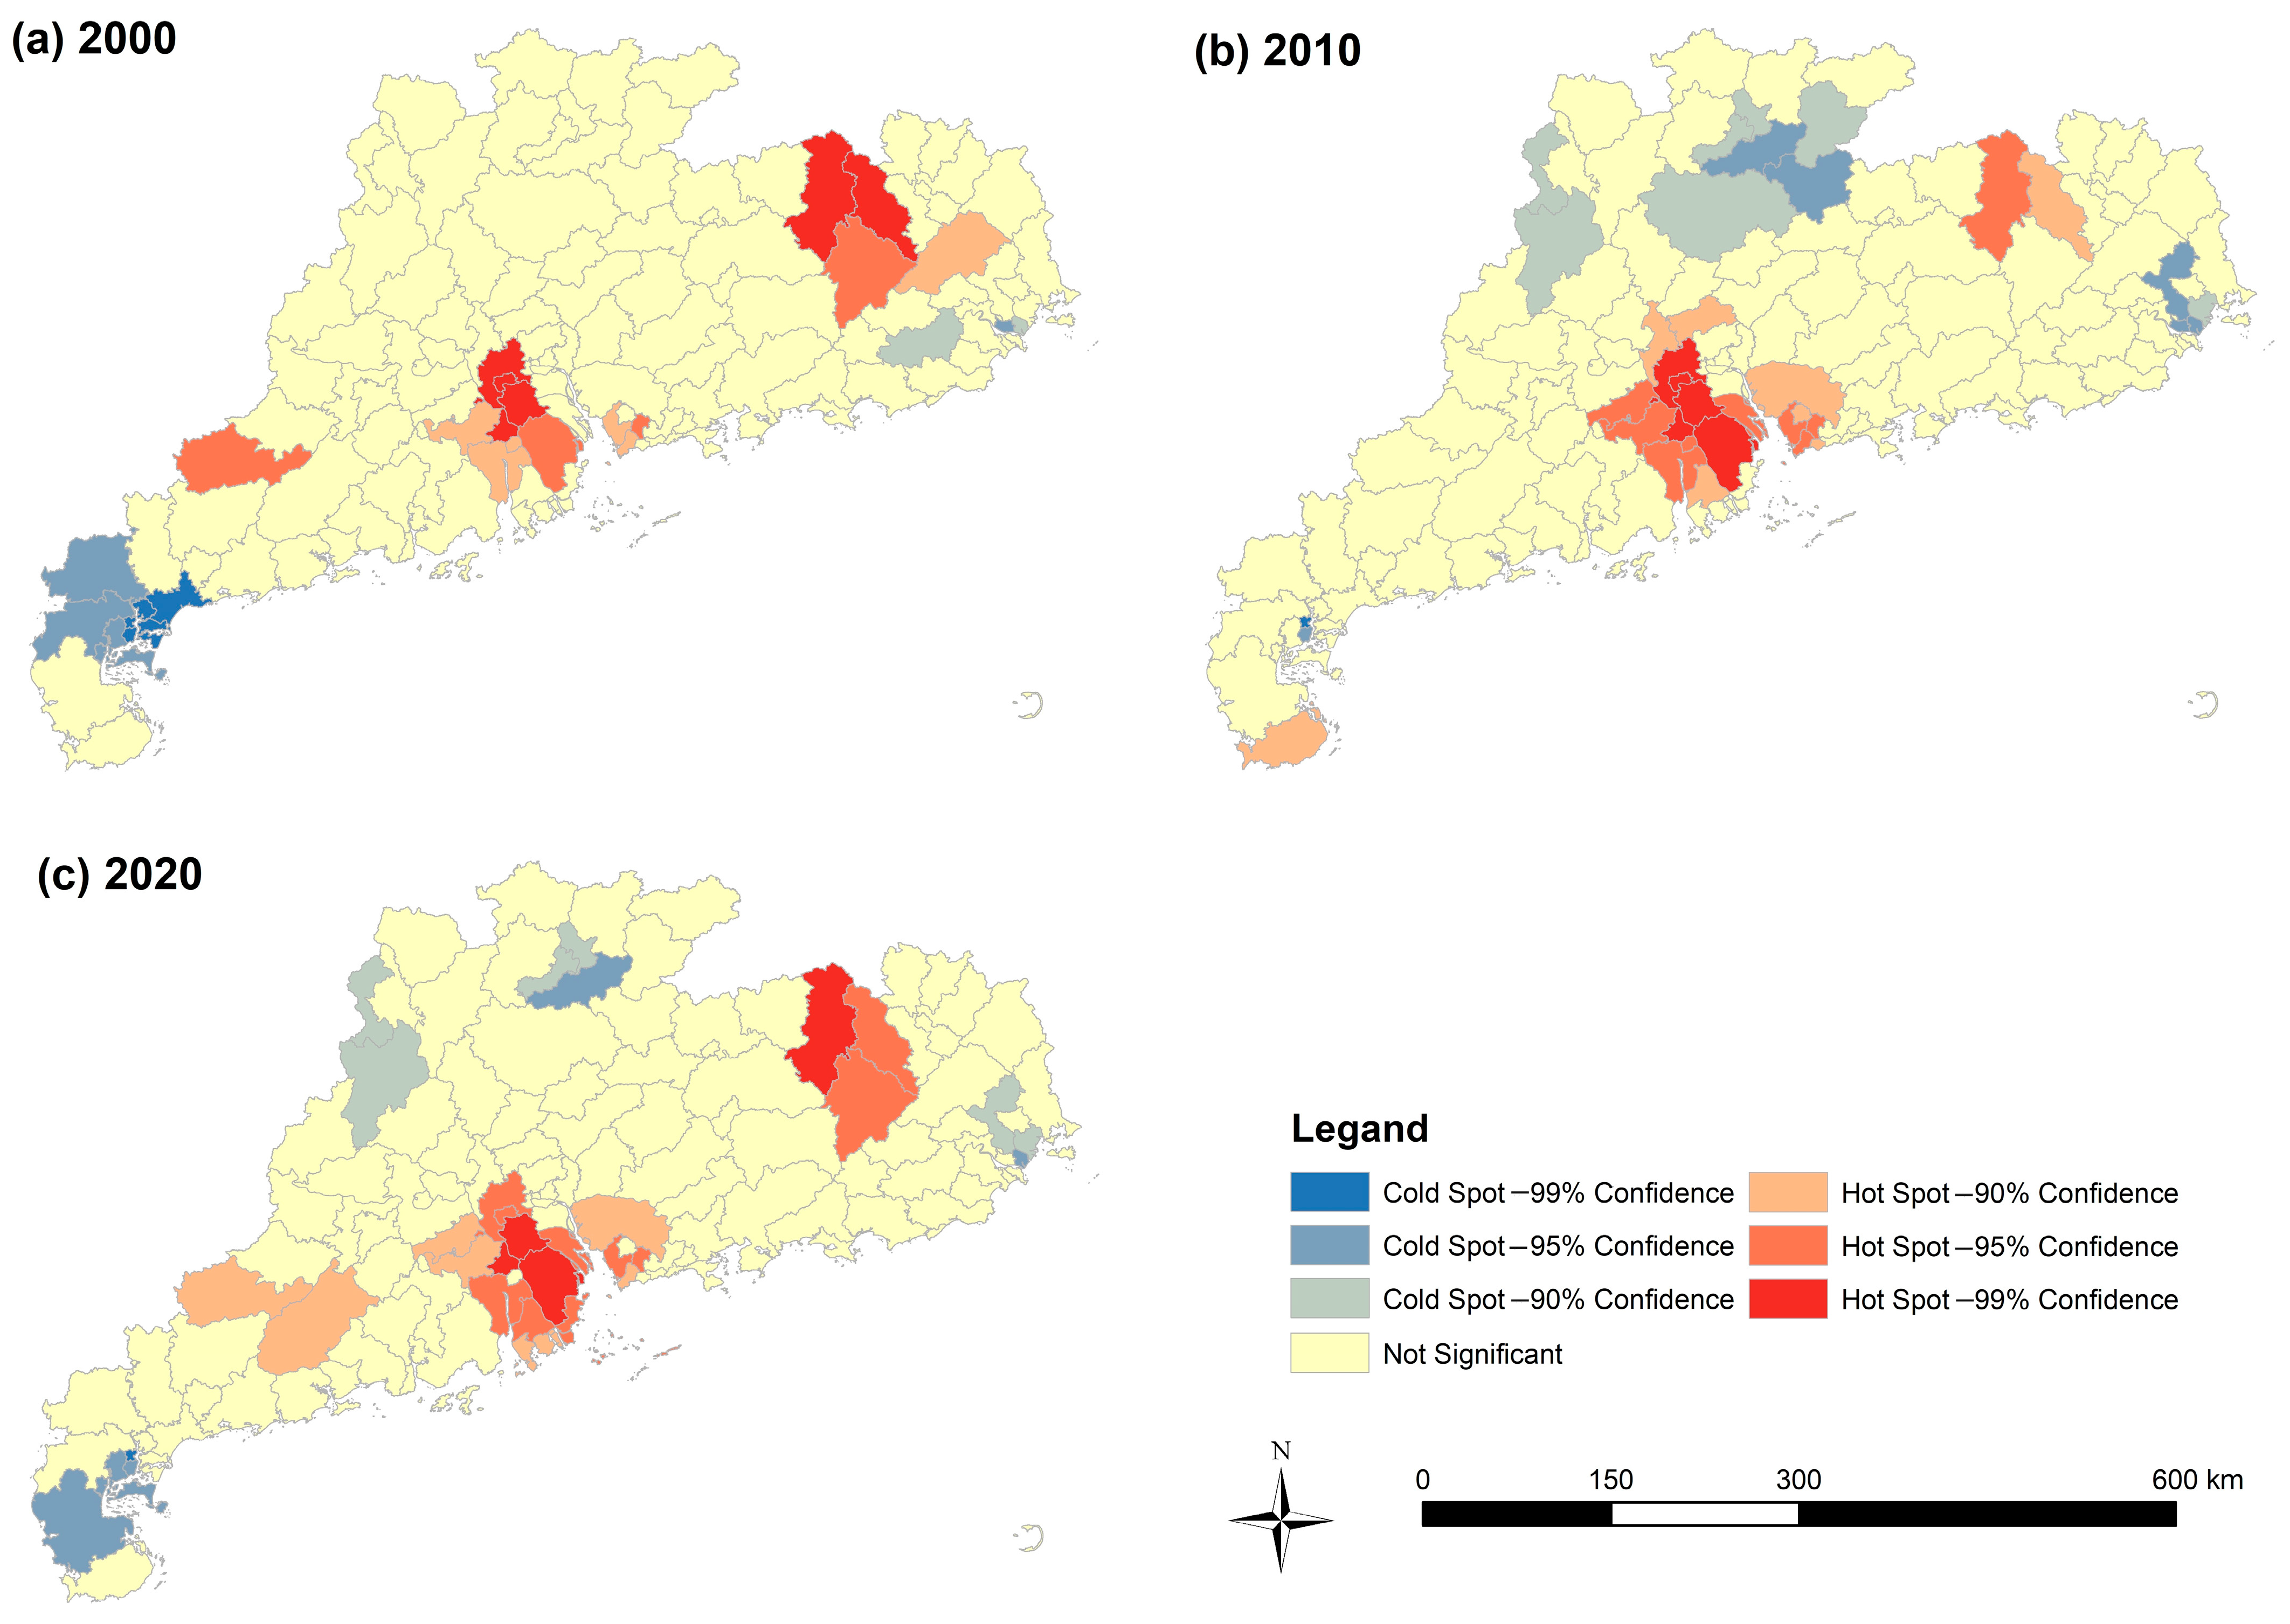
2.3.3. Identification of Hot Spots and Cold Spots

The CLF can be spatially aggregated in certain regions within the study area. Consequently, hot spot analysis (Getis-Ord Gi*) was employed to pinpoint statistically significant hot spots. Hot spots specifically delineate spatial clusters of high values (hot spots) and low values (cold spots) within the grid [40].

2.3.4. Driver Analysis of Cultivated Land Fragmentation

CLF is a complex feature caused by multiple factors [25] and has become a key issue affecting food security, the sustainable use of land resources, and agricultural development [24]. In this study, the driving factors were selected in regard to three aspects: the natural environment, agricultural benefits, and social economic development (Table 3). The selection of DEM, slope, water network density, annual average temperature, and annual precipitation, as focal variables for investigating the driving factors of cultivated land fragmentation, is predicated upon the profound and direct impact of these natural elements on the morphology and structure of cultivated land. The variation in elevation and slope not only shapes the topography, but also determines the distribution, contiguity, and suitability of cultivated land. Water network density serves as a direct reflection of the hydrological characteristics of cultivated land, which exert significant effects on the morphology and distribution of cultivated land. The annual average temperature and annual precipitation ascertain the climatic classification of cultivated land, consequently influencing the growth cycle, crop growth rate, and land use. Furthermore, agricultural income is also an important aspect affecting the fragmentation of cultivated land [27]. Factors related to agricultural benefits, such as the gross output value of agriculture, grain output, grain yield per mu, and per capita disposable income of rural households, serve as direct indicators of the economic benefits of cultivated land use, exerting significant economic impetus on cultivated land fragmentation. Social economic development is also an important aspect affecting cultivated land cultivation [41,42]. Socio-economics can reflect the income of urban and rural residents and the distance from the city to determine whether people choose to engage in agriculture or go to the city for employment [43]. In regard to the socio-economic factor, the per capita GDP, per capita disposable income of urban households, local government budgetary expenditure, and the ratio of disposable income per urban household to the disposable income per rural household, reflect the level of regional economic development and policy orientation, exerting profound influences on land use and the agricultural structure.
Linear regression analysis is the most commonly employed statistical method in the social sciences for assessing the relationships between two or more attributes. Both GWR and MGWR are linear regression models, but they operate at different spatial scales and make different assumptions about the spatial heterogeneity of a dataset. GWR is a local linear regression method based on modeling spatially varied relationships, producing a regression model describing local relationships at each location within the study area [44]. However, in GWR, the assumption is that all the local relationships operate at the same spatial scale by requiring all the explanatory variables to use the same bandwidth. MGWR allocates different bandwidths to each variable. MGWR accomplishes this by employing distinct bandwidths for each explanatory variable, rather than a unified global bandwidth [45]. Consequently, through estimating the parameters of MGWR for each observation, the spatial correlations between the CLFI and the diverse driving indices can be visually illustrated. This study utilized MGWR 2.2 software to investigate the driving factors of CLF in Guangdong Province. Both GWR and MGWR models are suitable for exploring the driving factors of cultivated land fragmentation in the existing literature. The calculation formula for the global regression model is as follows:
z j = β 0 u i , v i + i = 1 k β k u i , v i y i j + ε i
where β 0 u i , v i is the interruption in the model, β k u i , v i is the regression coefficient of county i , and ε i is the error term of the regression model.
The calculation formula for the MGWR model is as follows:
z j = β b w 0 u i , v i + i = 1 k β b w k u i , v i y i j + ε i
where β b w 0 u i , v i is the interruption in the model with optimal bandwidth, β b w k u i , v i is the regression coefficient of county i with optimal bandwidth, and ε i is the error term of the regression model.

3. Results

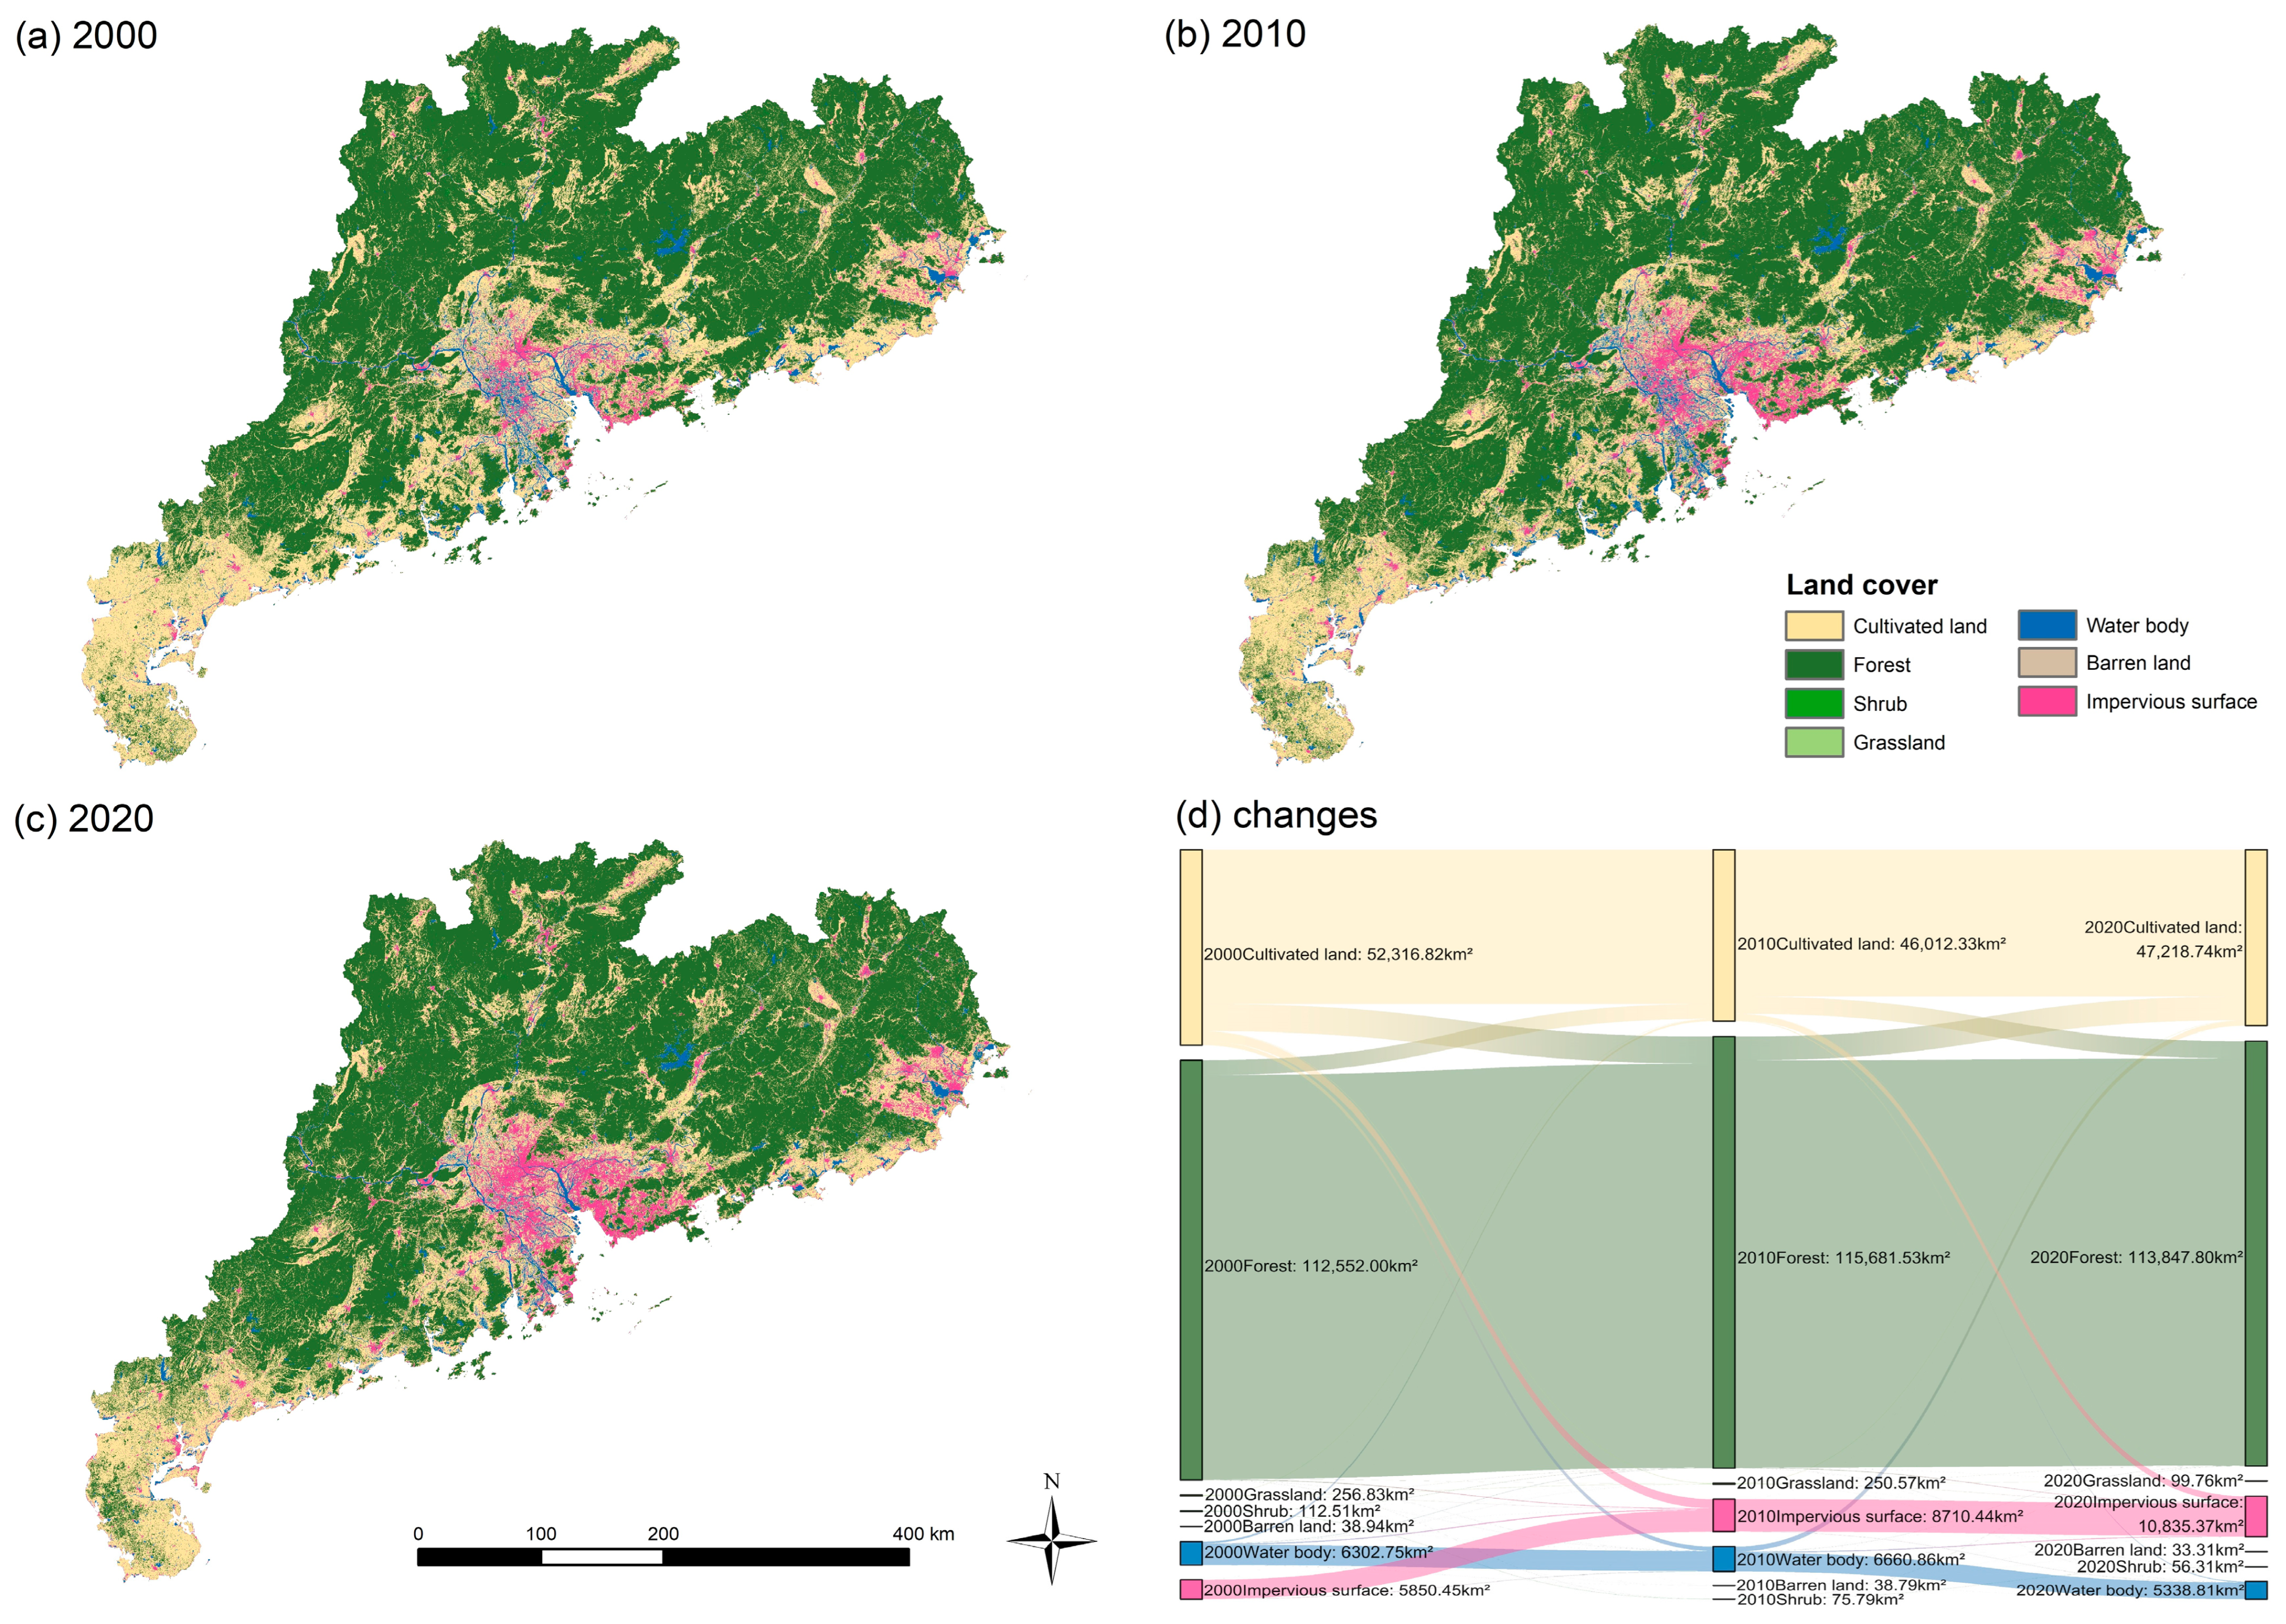
3.1. Land Cover Changes in Guangdong Province from 2000 to 2020

The land cover changes in Guangdong Province are primarily triggered by urbanization and adjustments in the agricultural structure. Owing to the rapid development of the provincial economy and urban areas, substantial transformations in land cover have occurred, notably the conversion of cultivated land into impervious surfaces and forests. Between 2000 and 2020, approximately 9.7% of cultivated land in Guangdong Province transitioned to other land use types (Figure 3). Specifically, during the period of 2000–2010, 2427.87 km2 of cultivated land transitioned into impervious surfaces, and 3229.3 km2 into forests. Conversely, between 2010 and 2020, 1721.29 km2 of cultivated land was converted into impervious surfaces, while 1748.59 km2 of forest transitioned into cultivated land. Over the past two decades, the study area has undergone rapid urbanization, leading to a significant expansion of impervious surfaces, particularly evident in the Pearl River Delta region (PRDR) and coastal cities. Newly formed forests are predominantly distributed in the western and eastern regions of Guangdong Province.

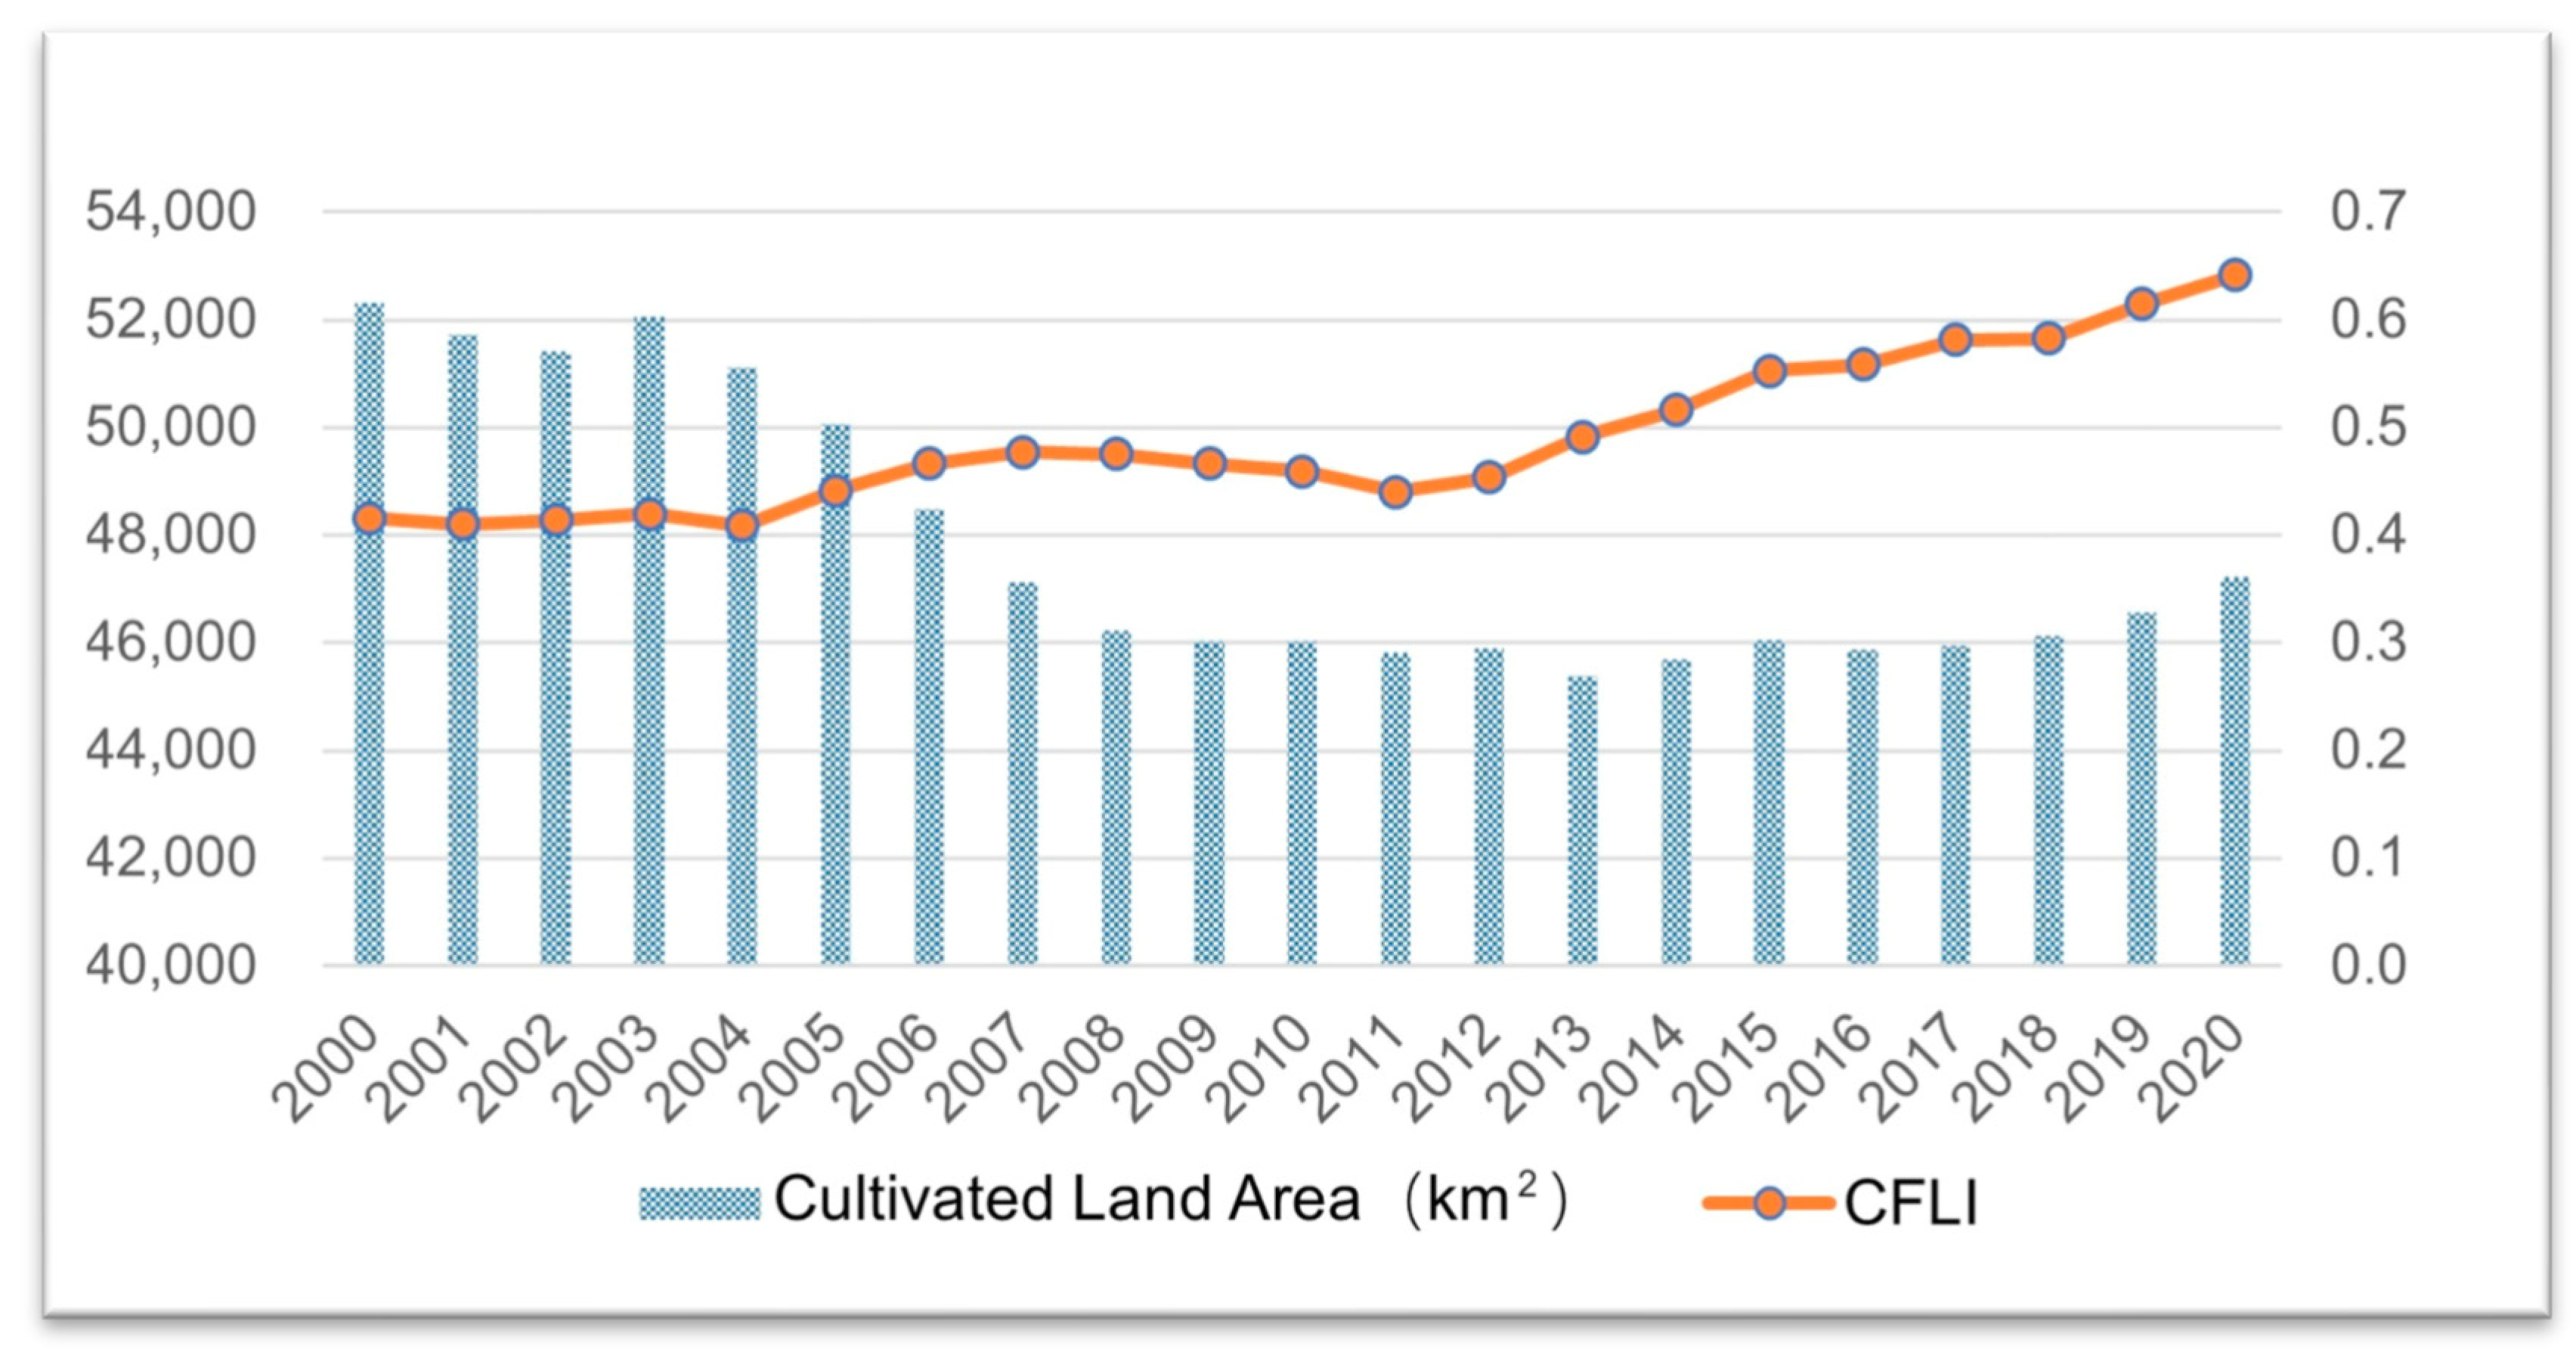
3.2. Temporal Characteristics of Cultivated Land Area and Cultivated Land Fragmentation in Guangdong Province

The cultivated land area in Guangdong Province decreased gradually from 52,316.82 km2 in 2000 to 47,218.74 km2 in 2020, a total reduction of 5098.08 km2 (an average of 254.9 km2 per year) (Figure 4). Therefore, it is imperative for the implementation of more stringent farmland protection policies. The cultivated land area reached its lowest point in 2013, at 45,378.47 km2. Starting from 2016, the cultivated land area in Guangdong Province has experienced a slow increase, totaling 1352.85 km2. The range of the CLFI obtained by normalization and weight calculation is 0 to 1. The CLFI in Guangdong Province changed significantly, rising from 0.415 in 2000 to 0.641 in 2020. Additionally, there was a slight decrease in the CLFI from 2007 to 2011. Overall, the cultivated land area has decreased substantially, coupled with an intensification of cultivated land fragmentation, which may be due to the occupation of a significant amount of cultivated land by urban developments and agricultural structural adjustments.

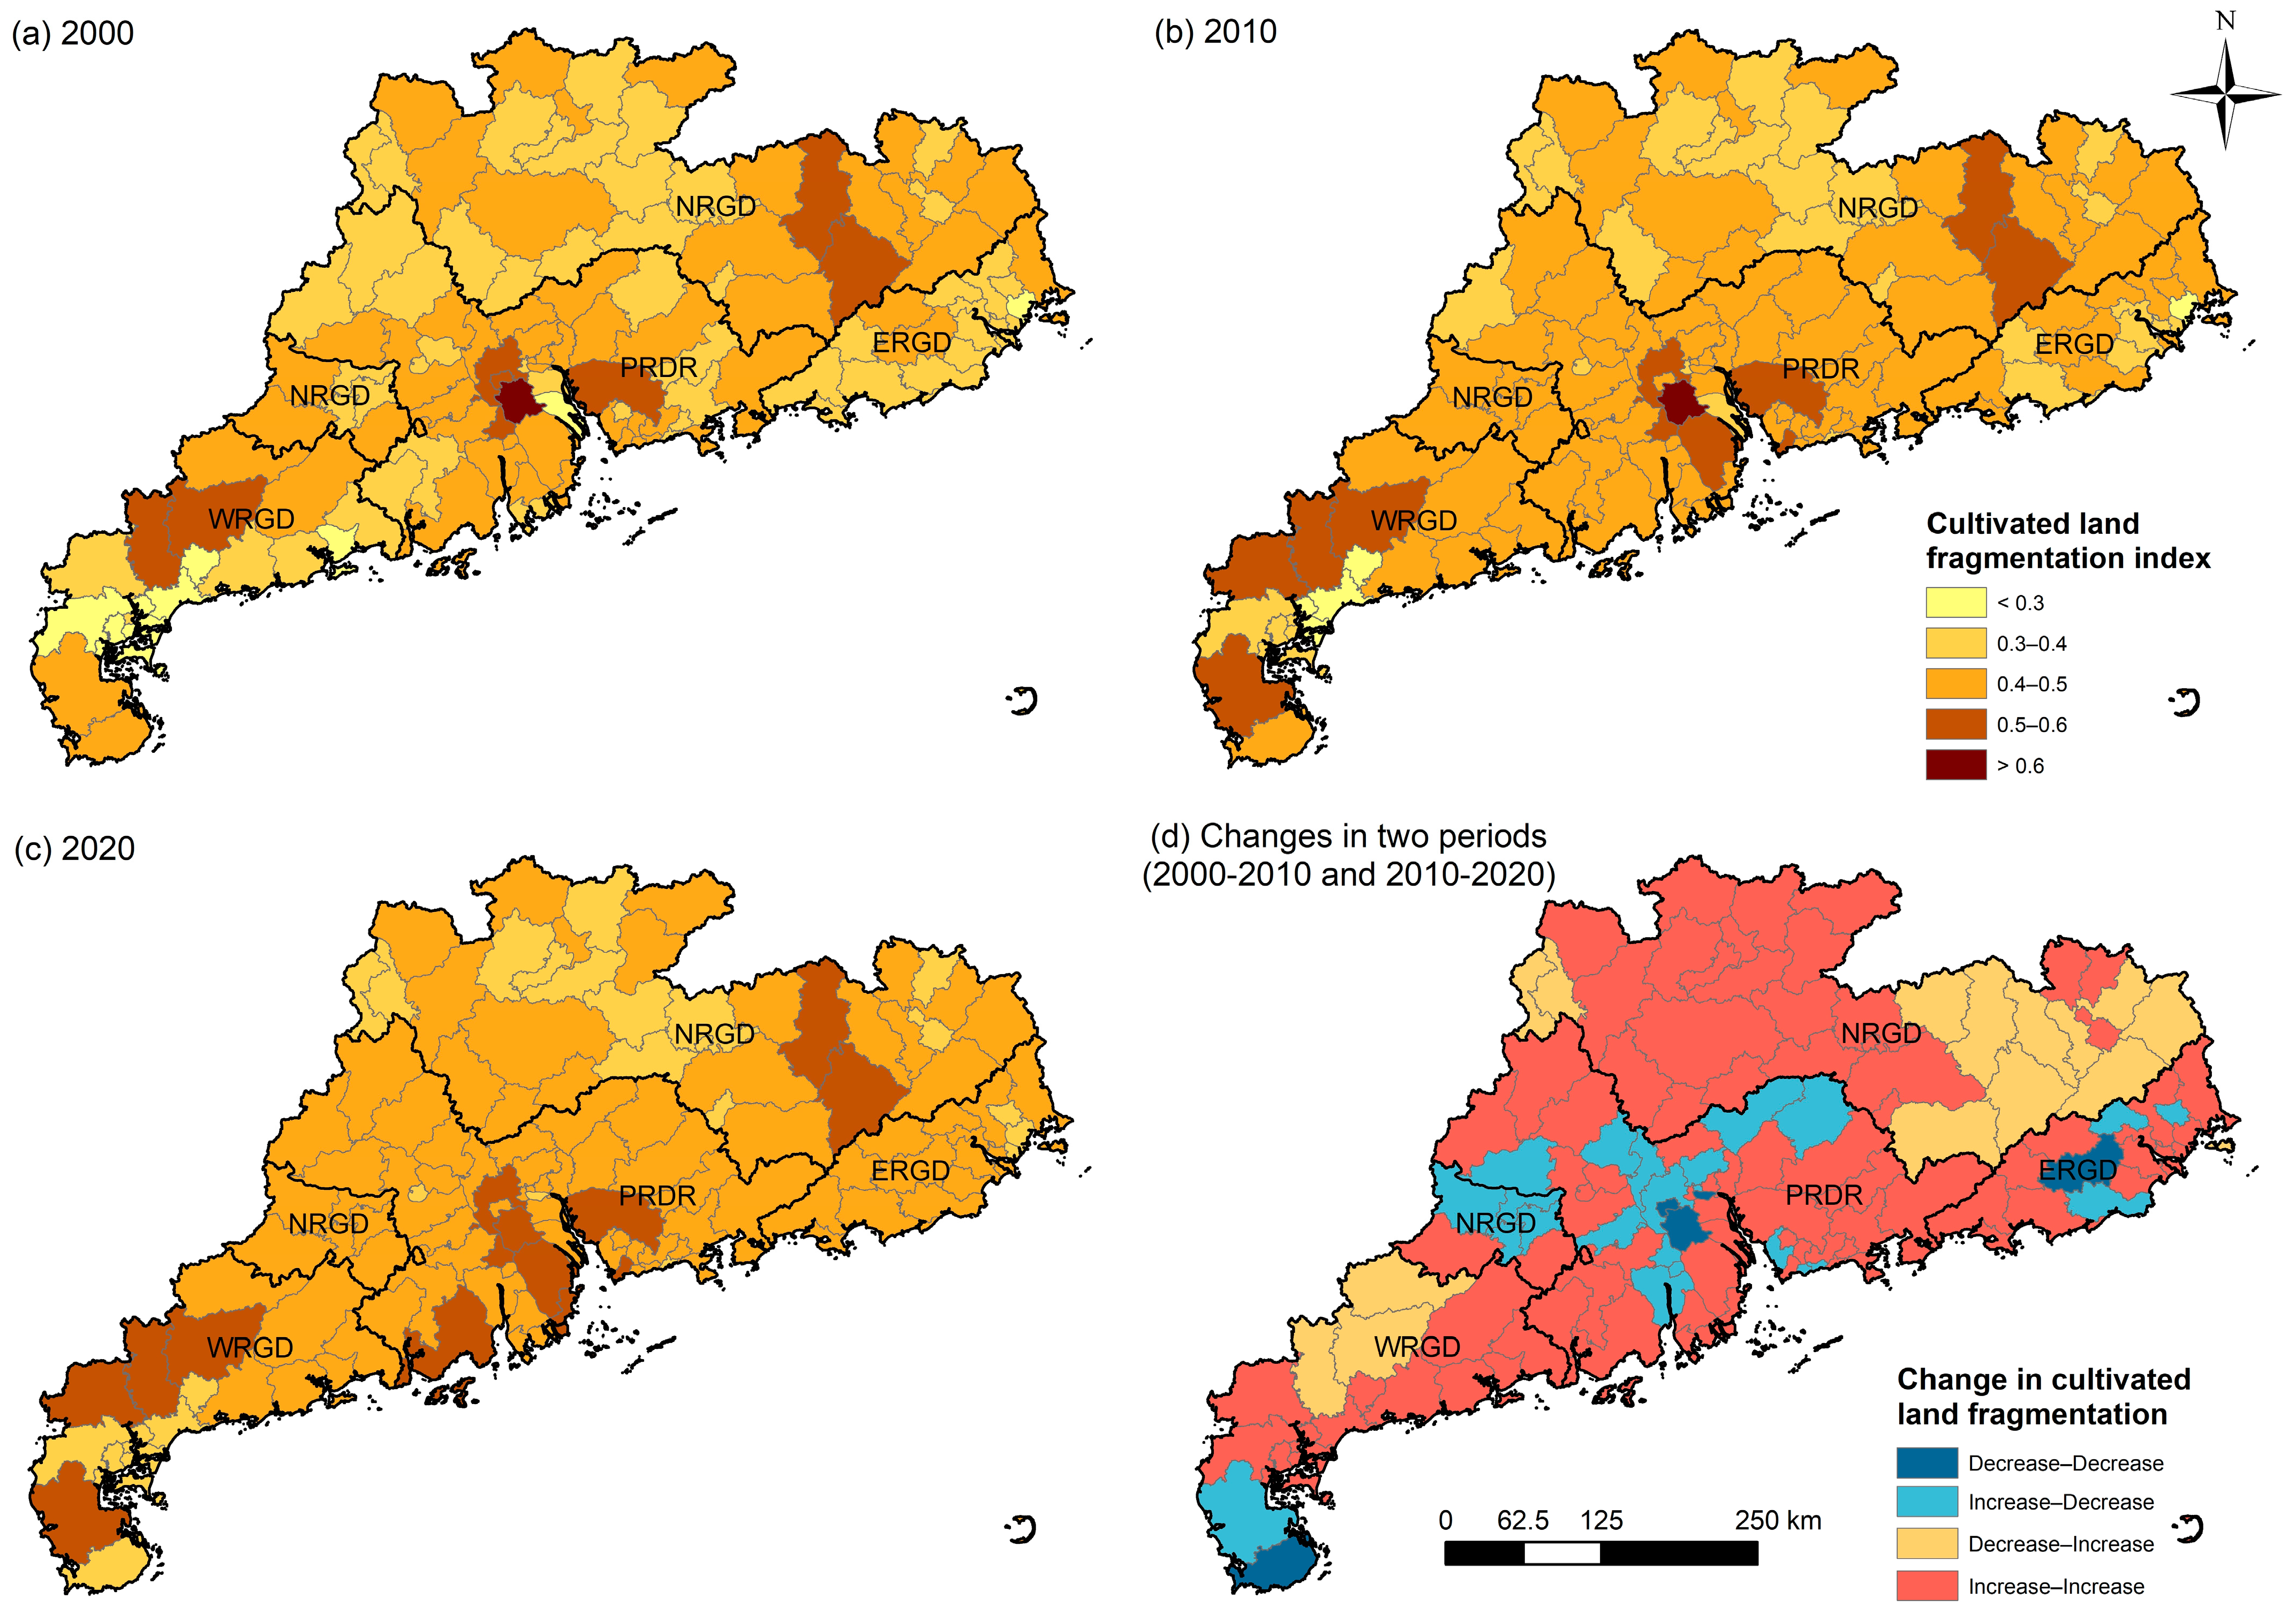
3.3. Spatial Pattern and Characteristics of Cultivated Land Fragmentation in Guangdong Province

The spatial distribution of the CLFI at the county level in Guangdong Province from 2000 to 2020 is illustrated in Figure 5. Initially, areas with high CLFI values in 2000 were concentrated in the PRDR, Maoming in WRGD, and Meizhou in NRGD (Figure 5a). By 2010 and 2020, the high-value areas in the CLFI were geographically continuous, primarily distributed in the central, western, and northern regions of Guangdong Province (Figure 5b,c). However, aside from the high-value areas in the CLFI, the majority of counties in Guangdong Province showed increased CLFI values in 2010 and 2020 when compared to those in 2000. Analyzing the trend changes over the past 20 years, the regions where the CLFI values decreased were mainly concentrated in Huizhou, Foshan, and Jiangmen in the PRDR, Zhanjiang in the WRGD, and Jieyang in the ERGD. Counties where the CLFI values increased were mainly distributed in the NRGD and the coastal areas of Guangdong Province, indicating an increase in the CLFI levels in these regions over the past 20 years (Figure 5d).
The spatial distribution of hot spots and cold spots in the CLFI in Guangdong Province from 2000 to 2020 is illustrated in Figure 6. Firstly, from 2000 to 2020, there were notable changes in the distribution of hot spots and cold spots in Guangdong Province. In 2000 (Figure 6a), hot spots were mainly concentrated on the west bank of the Pearl River and in Meizhou, while cold spots were concentrated in Zhanjiang. By 2010 (Figure 6b), the distribution of hot spots began to expand, with the previously insignificant east bank of the Pearl River transforming into a hot spot, possibly due to the accelerated urbanization process. With the expansion of cities, a significant amount of cultivated land was occupied or fragmented, which led to an exacerbation of the fragmentation. Additionally, Qingyuan and Shaoguan in the NRGD became new cold spot areas. By 2020 (Figure 6c), the trend of hot spot expansion became more pronounced, with the addition of Zhanjiang in the WRGD as a new cold spot area.

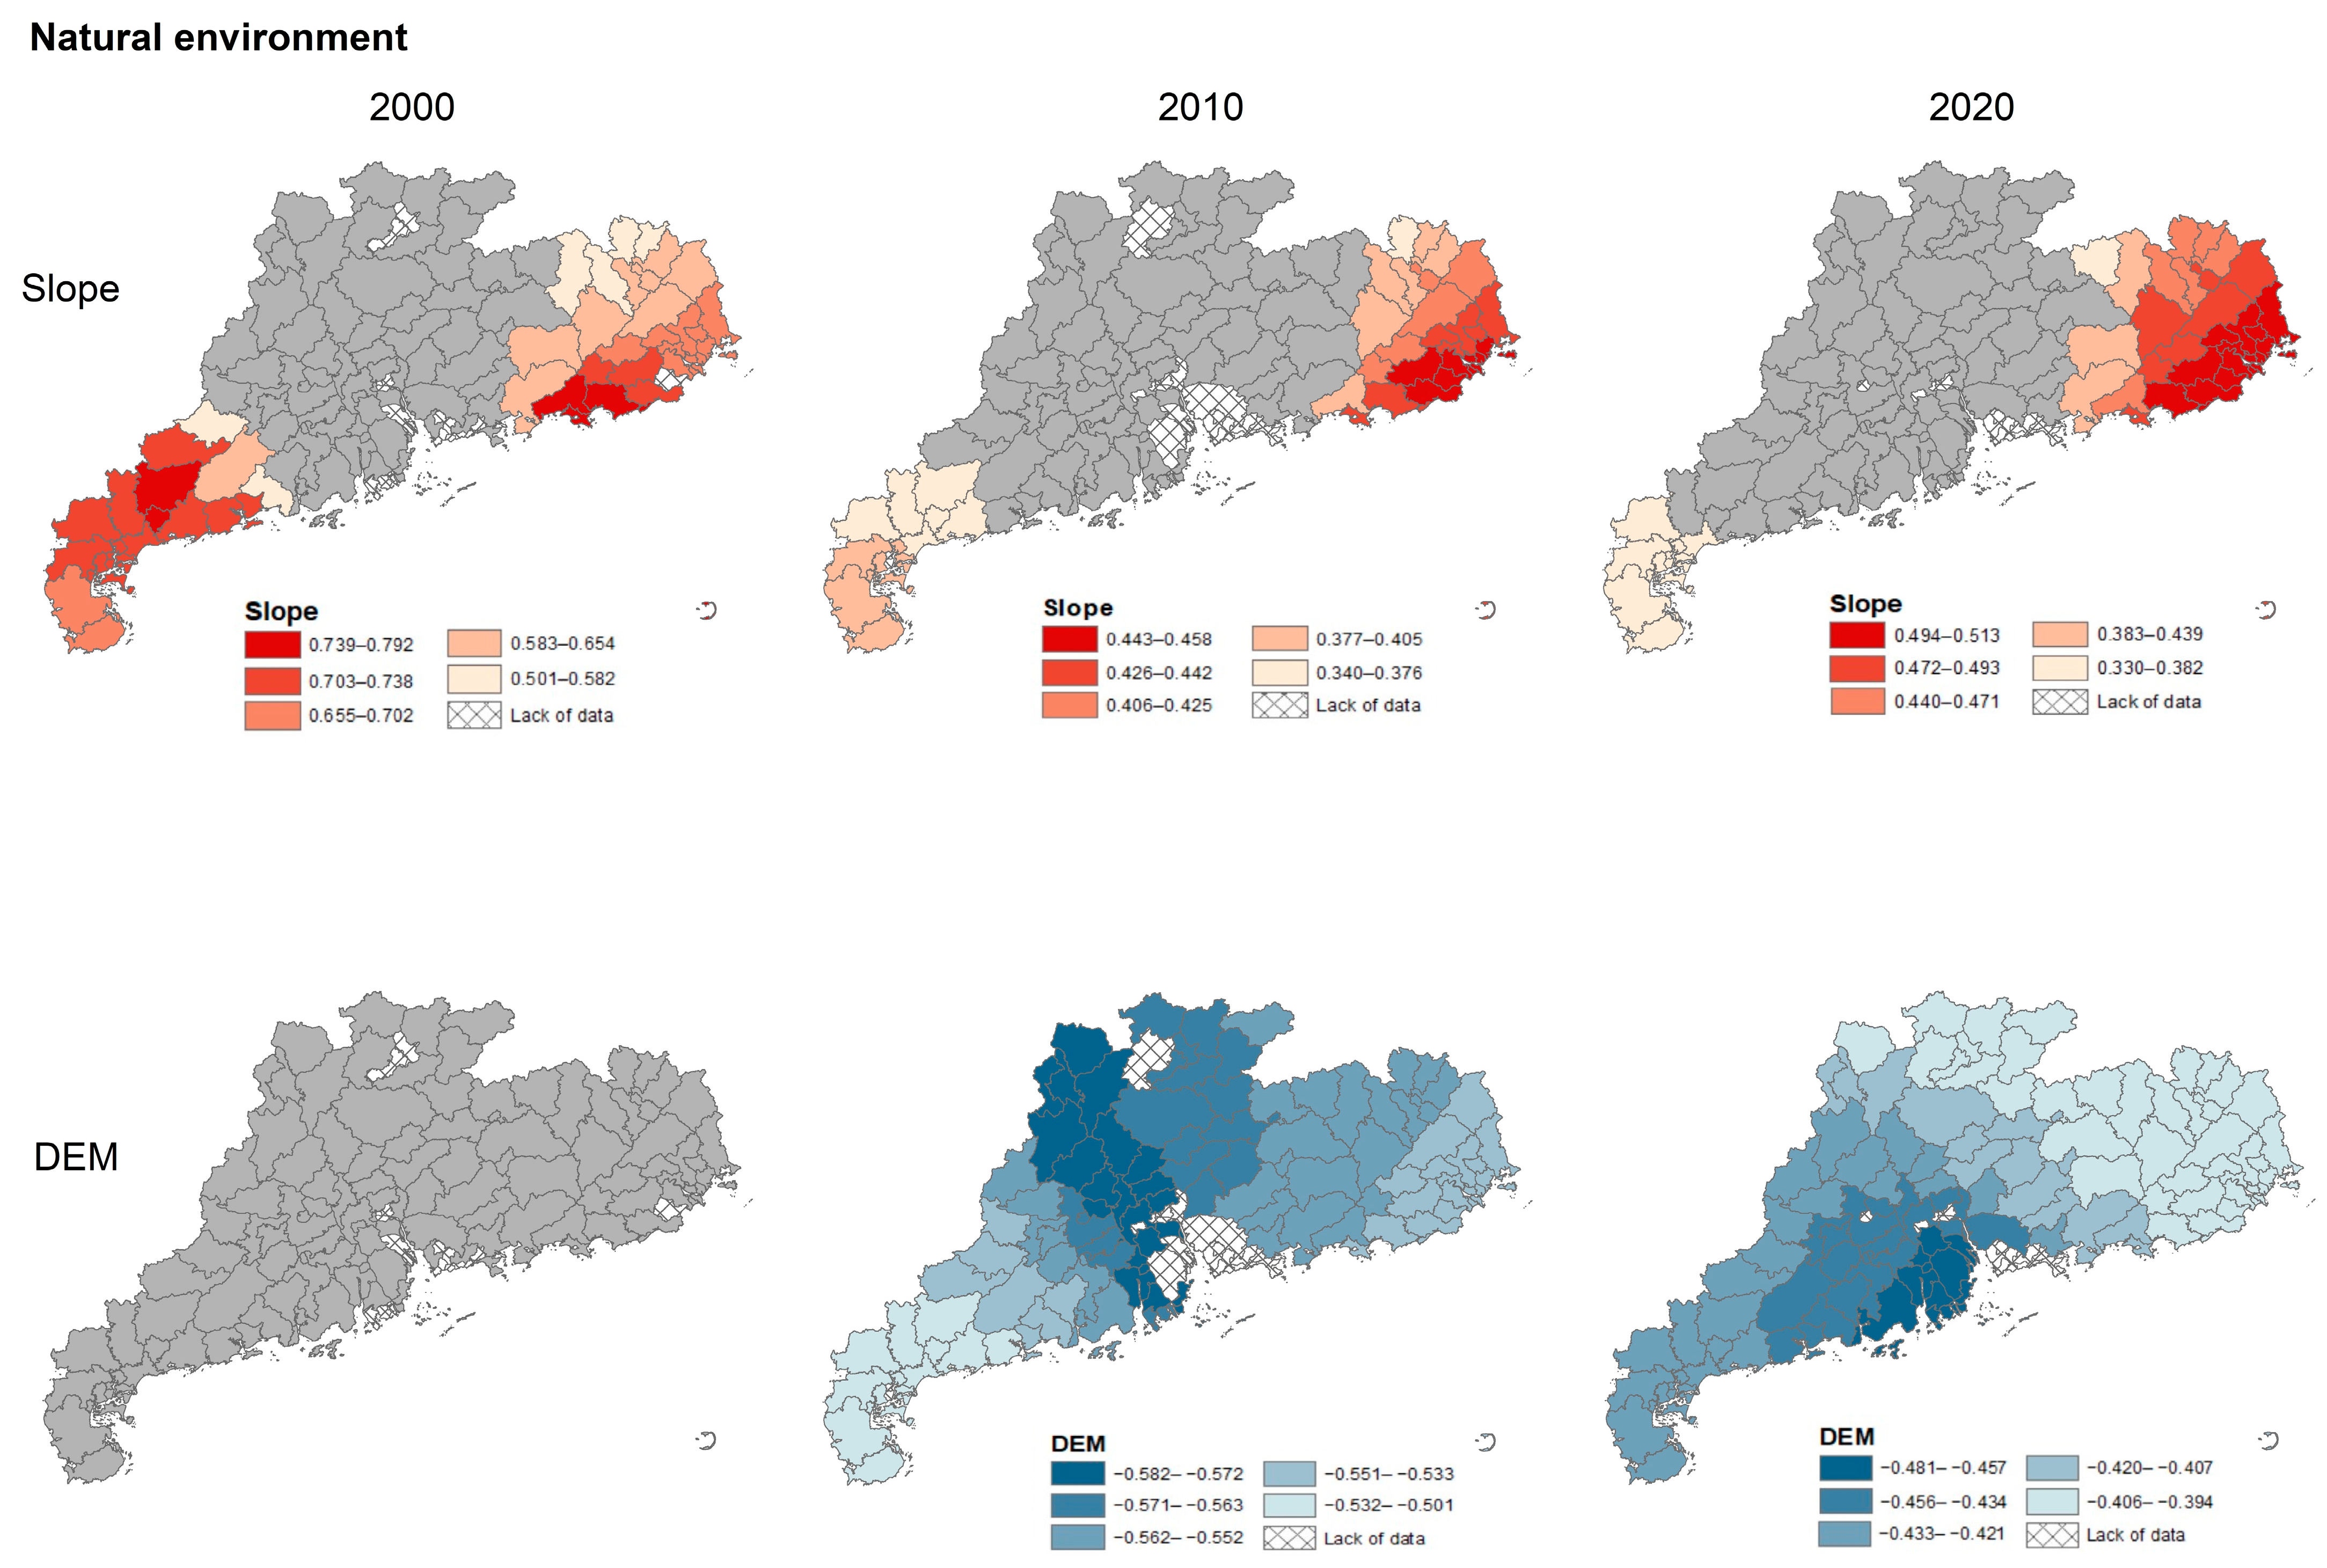
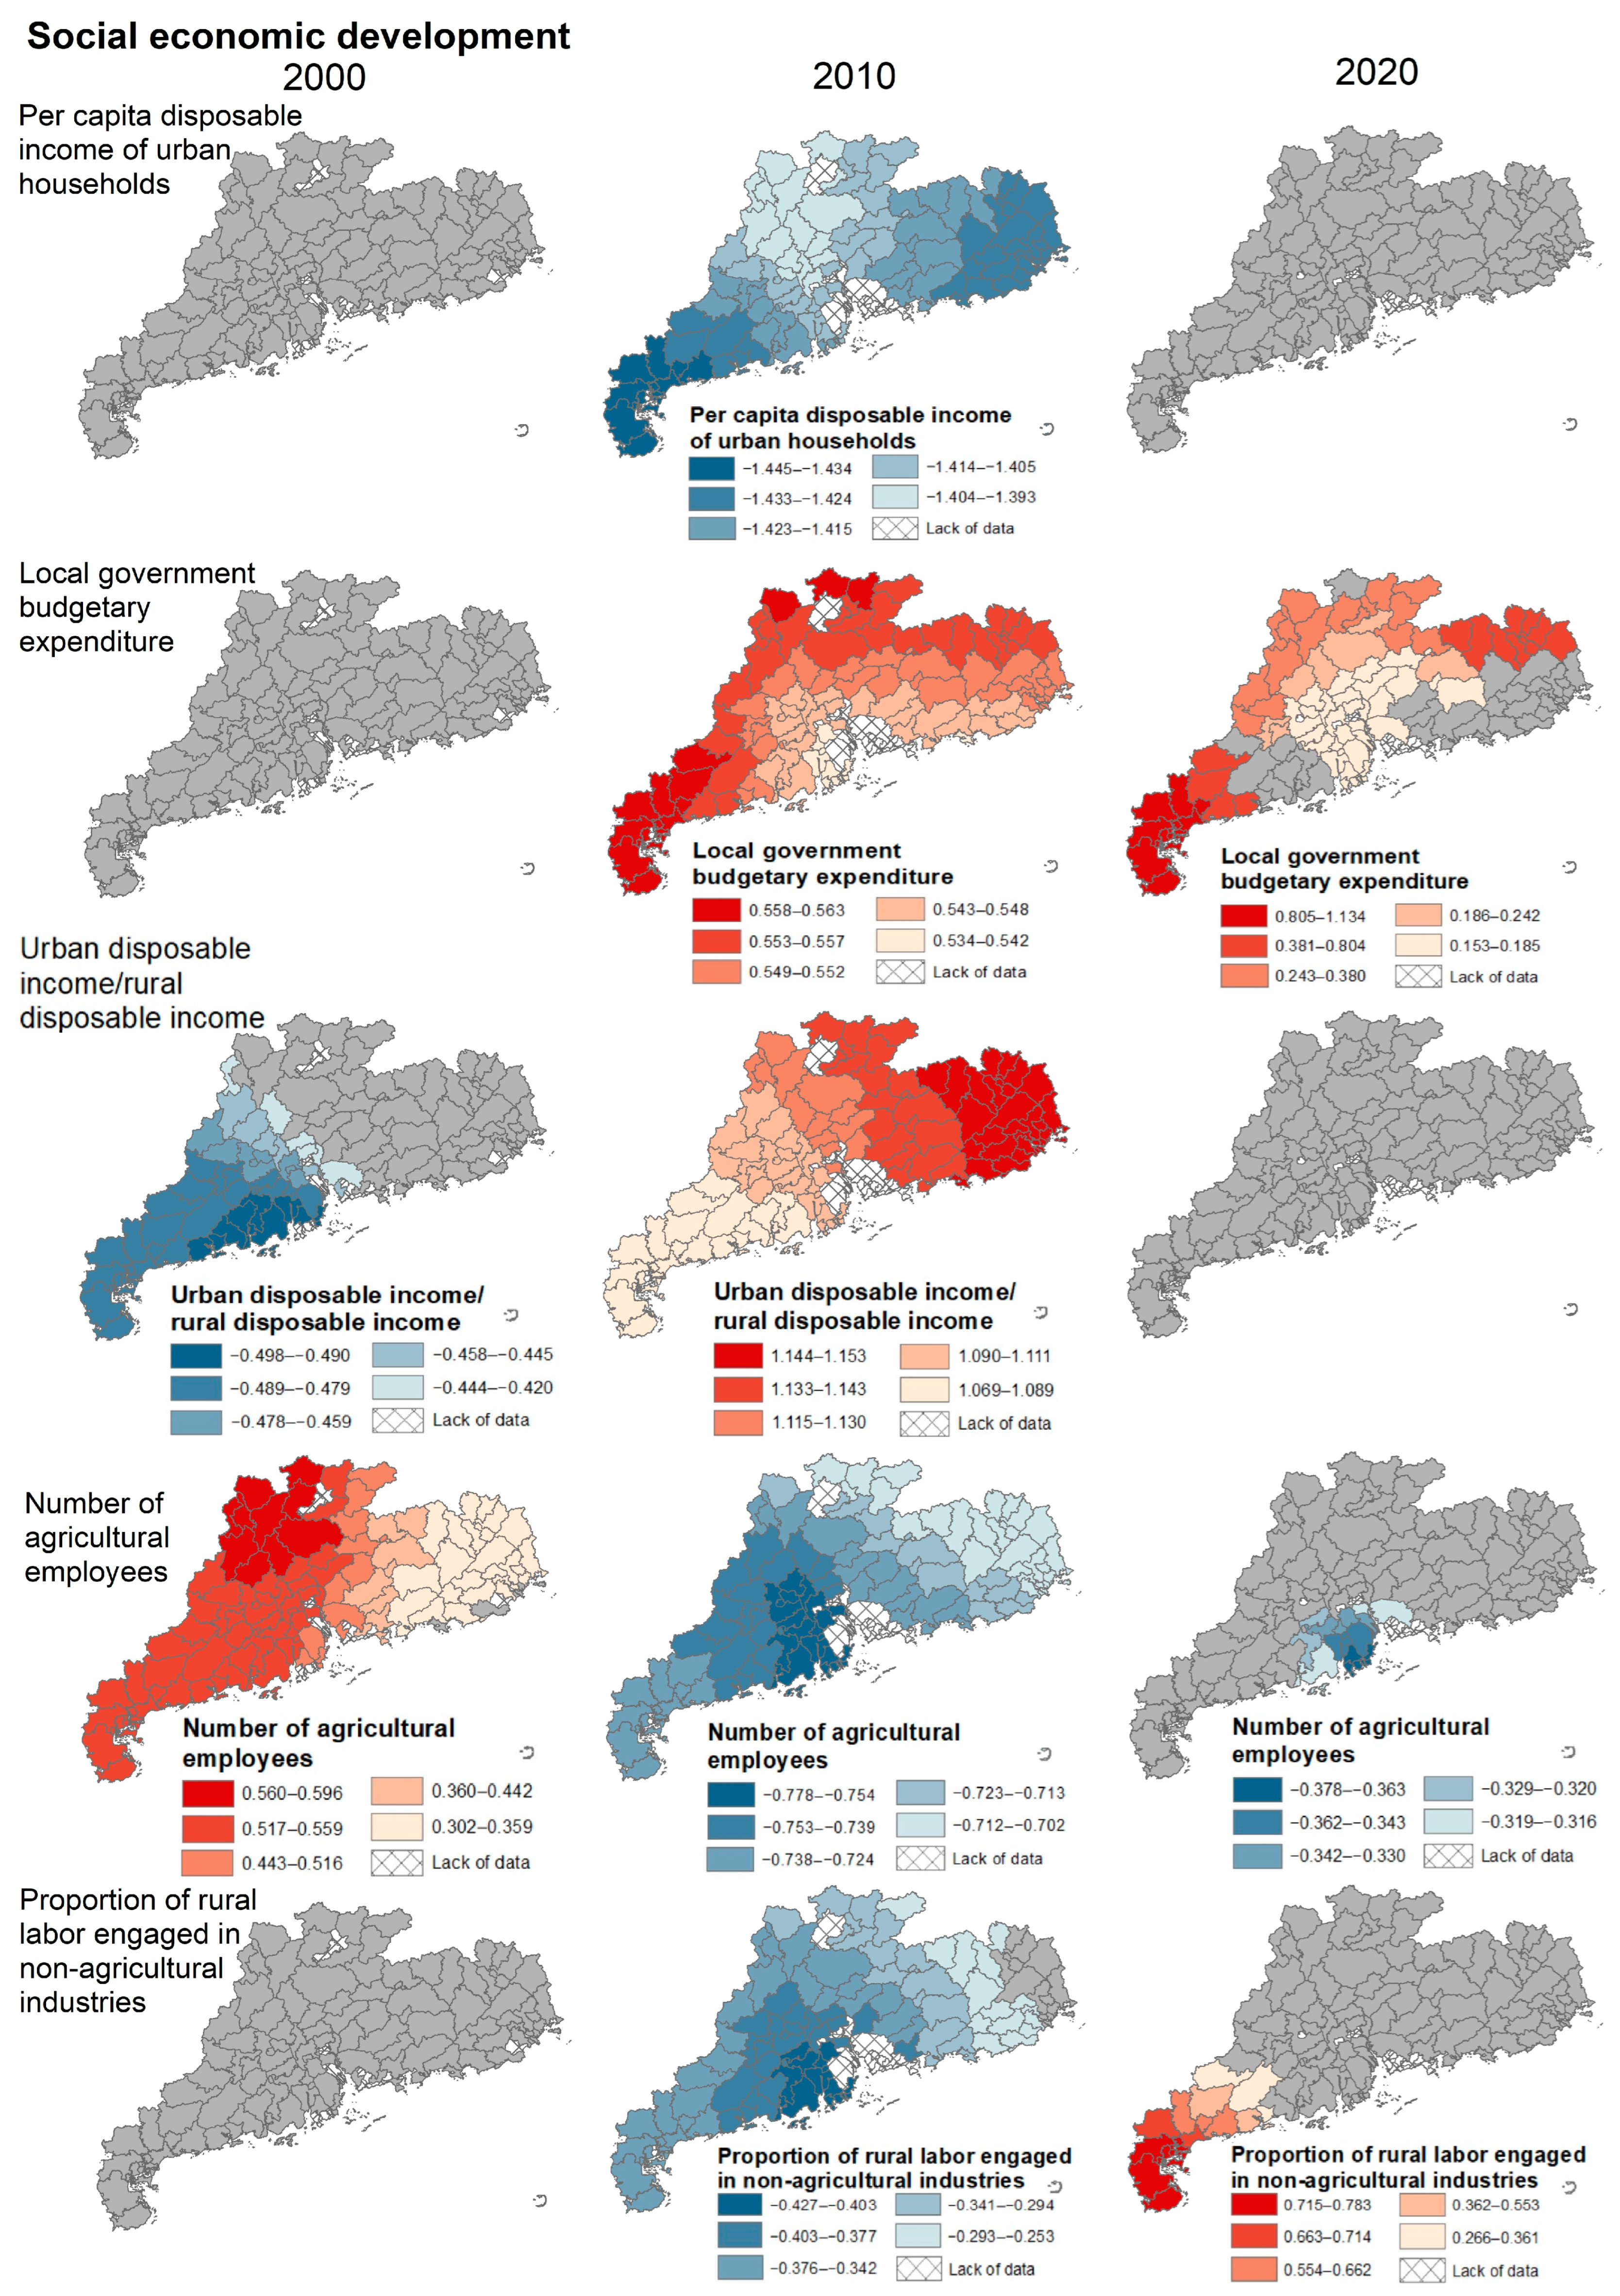
3.4. Regression Results for the Driving Factors of Cultivated Land Fragmentation

Comparing the fitting information of the models, the R2 values of the MGWR models in 2000, 2010, and 2020 were all higher than those of the GWR model. Additionally, the AICc values of the MGWR model in 2000, 2010, and 2020 were lower than those of the GWR model, illustrating that the fitting effect of the MGWR model is superior to the GWR model (Table 4). This shows that the MGWR model is suitable for studying the driving factors of CLF in Guangdong Province.
In addition, the MGWR model can allocate different bandwidths to variables, indicating significant spatial scale differences in the driving factors of the model results. The DEM, water network density, average temperature, annual precipitation, average grain output, per capita gross domestic product, per capita disposable income of urban households, road network density, and the total power of agricultural machinery, can all be considered as global variables, signifying that they impact CLF at a larger, even a global scale, in a similar manner. However, the remaining eight variables exhibited significant spatial differences, further illustrating the necessity of applying the MGWR model. Based on the significant variables influencing CLF in Guangdong Province according to the 2020 MGWR results (Table 5), the bandwidths for local government budgetary expenditure and the proportion of rural labor engaged in non-agricultural industries were the smallest, at 44 and 46, accounting for 40.37% and 42.20% of the total sample, respectively. This indicates that these variables demonstrate strong spatial heterogeneity in terms of their influence on CLF and that they have a considerable impact on CLF. The bandwidths for slope, output of grain, and number of agricultural employees, were also relatively small, at 75, 80, and 81, constituting 68.91%, 73.39%, and 74.31% of the total sample, respectively. This suggests that these factors also exhibited relatively large spatial heterogeneity in terms of their impact on CLF. Among the variables with relatively small bandwidths, three belong to the social economic development factor, while the rest belong to the natural environment factor and agricultural benefits factor. This illustrates significant heterogeneity in the characteristics of different counties (districts) in Guangdong Province.

3.5. Driving Factors of Cultivated Land Fragmentation

The MGWR model provides a concise visual representation of the driving factors of CLF. Figure 7, Figure 8 and Figure 9 illustrate the changes in the variable significance and coefficients from 2000 to 2020. Counties (districts) exhibiting a significant dependency between the CLFI and the variables are highlighted (p-value < 0.1), while counties (districts) lacking a significant relationship are depicted in grey. The results identify patterns and characteristics of the driving factors of CLF, including the natural environment factor (Figure 7): (1) In 2000, 2010, and 2020, the slope variables of the PRDR and NEGD did not drive changes in CLF. However, they exhibited significant positive driving effects in Zhanjiang, Maoming, Meizhou, and the ERGD, with high-value regions shifting from Maoming and Shanwei in 2000 to Jieyang in 2010, and the ERGD becoming the new high-value area in 2020. The flat terrain of the Chaoshan Plain and the Western Guangdong Plain facilitates the concentrated and continuous distribution of farmland. In flat areas, the increase in local slope is a major factor contributing to the increase in CLF the east and west of Guangdong Province. (2) In 2010 and 2020, the DEM coefficients for all counties were negative. Nevertheless, the overall impact of the PRDR and NRGD was relatively high in 2010. In 2020, the negative driving effect of elevation on CLF generally showed a downward trend towards the east, west, and north, with high-value regions of negative driving effects distributed in the PRDR. The PRDR features low and flat terrain, yet with a high degree of urbanization and extensive cultivated land, resulting in significant cultivated land fragmentation.
The results for the agricultural benefits factor (Figure 8) showed that: (1) The variable coefficients of the gross output value of agriculture for the WRGD, Jiangmen, and Yunfu in 2000 and 2020 are positive. This indicates that the higher the total agricultural output value in the region, the more severe the fragmentation of cultivated land, especially towards the southwest. This is due to the superior hydrothermal and topographic conditions of the WRGD, which are suitable for cultivating high-value cash crops, thereby affecting the cultivated land for food crops. (2) The impact of grain production output on CLF was negative in 2000 and positive in 2010 and 2020. Unlike the rough patterns expressed by the global model, the results indicate significant differences in the control of grain output on CLF from 2000 to 2020. In 2000, grain production only had a negative effect on the PRDR, WRGD, Yunfu, and Qingyuan. By 2020, it became a significant driver of CLF in Guangdong Province, showing significant spatial variations (bandwidth of 44), thus becoming a core driving factor of CLF in the northeastern part of Guangdong Province. (3) In 2020, the average grain output per mu had a significantly negative driving effect on CLF. Its high values are located in Qingyuan, Zhaoqing, Foshan, and Zhongshan. The larger the average grain output per mu, the smaller the CLF, indicating more concentrated agricultural land. (4) The impact of the per capita disposable income of rural households on CLF for the PRDR, NRGD, and WRGD was negative in 2000 and positive in 2010. Unlike the rough patterns expressed by the global model, the results indicate significant spatial variations (bandwidth of 62) for the per capita disposable income of rural households in 2010, with high-value areas distributed in the central and northern parts of Guangdong Province.
The results for the social economic development factor (Figure 9) showed that: (1) The variable effect of the per capita disposable income of urban households in 2010 is negative. In 2010, the urban areas of Guangdong Province were in a phase of rapid development, with the growth in the service and industrial sectors attracting a significant labor force to secondary and tertiary industries. This led to farmers leasing out abandoned farmland, consequently reducing the CLF. (2) Furthermore, the results for the local government budgetary expenditure show that the coefficients for 2010 and 2020 are both negative. In 2010, the local government budgetary expenditure became a global variable for Guangdong Province (bandwidth of 102), with low coefficients in the central region and high coefficients in the northern and western regions. In 2020, the local government budgetary expenditure had a positive impact on CLF, exhibiting strong spatial heterogeneity (bandwidth of 44), significantly affecting the fragmentation of cultivated land. (3) The ratio of disposable income per urban household to disposable income per rural household reflects the regional economic development level and the urban–rural income gap. In 2000, the ratio had negative coefficients in the WRGD and the cities on the west bank of the Pearl River, showing significant spatial variations (bandwidth of 93), with the highest coefficients in Yangjiang and Jiangmen. This region is characterized by its flat terrain, frequent land transfer, and land contracting, which consequently widens the urban–rural income gap. This situation promotes labor migration to cities, facilitates land contracting, and encourages the concentration of cultivated land. In contrast, the coefficient for 2010 is positive, becoming a global variable for Guangdong Province (bandwidth of 102), with coefficients gradually decreasing from east to west. (4) The number of agricultural employees in 2000 had a positive impact on CLF. The impact in the northern and western parts of Guangdong Province was generally higher than in the ERGD. Conversely, in 2010 and 2020, the number of agricultural employees produced different results, with negative coefficients and high coefficient areas located in the PRDR. (5) The proportion of rural labor engaged in non-agricultural industries in 2010 and 2020 showed significant spatial variations, with bandwidths of 90 and 46, respectively. In 2010, the variable had a negative impact on CLF, while in 2020, it had a positive impact. Unlike the patterns expressed by the global model, the results indicate significant differences in the control of CLF from 2010 to 2020. In 2010, the coefficient was negative in Guangdong Province, except for Chaozhou and the eastern parts of Meizhou, with the PRDR being most affected by the proportion of the rural labor force engaged in non-agricultural industries. In 2020, the proportion of the rural labor force engaged in non-agricultural industries only had a positive effect on Zhanjiang and Maoming.

4. Discussion

4.1. The Spatio-Temporal Characteristics of CLF in Guangdong Province

The CLF in the cold spots of Guangdong Province is becoming increasingly severe, while in the PRDR, a hot spot, a portion of the fragmentation, is beginning to alleviate. The increasing fragmentation of cultivated land in the cold spots of Guangdong Province may be attributed to various factors, particularly the rapid urbanization process, urban expansion, and various instances of non-agricultural construction, especially linear infrastructure, which significantly contributes to CLF [13,46]. Furthermore, this study establishes a close association between the degree of CLF in Guangdong Province and agricultural productivity. As agricultural productivity and agricultural benefits improve in the cold spot areas, the strong willingness of farmers to cultivate reduces the amount of contracted cultivated land. Moreover, the profitability of non-food crops surpasses that of food crops, leading to an increase in non-food crop cultivation, which in turn elevates the CLFI.
Research indicates that CLF in the hot spot areas within the PRDR is showing signs of improvement. The urbanization rate of the PRDR has consistently remained high, rising from 71.6% in 2000 to 82.7% in 2010, and reaching 87.5% by 2020. Positioned at a crossroads in socio-economic development, the urbanization rate in the PRDR is expected to stabilize, with a deceleration in the pace of urban expansion. The PRDR has facilitated the optimization of agricultural land use patterns and promoted urban–rural integration to mitigate CLFI [47]. This may be related to comprehensive land consolidation and ecological conservation measures implemented in these regions [48,49,50]. Land consolidation, achieved through techniques such as land leveling, gully filling, and the reclamation of abandoned residential land, not only protects cultivated land, conserves land use intensification, but also optimizes spatial patterns, thereby reducing the degree of CLF [50,51]. Particularly in hot spot areas, the Shunde District and Nanhai District of Foshan City, and the Xinhui District of Jiangmen City, have resolved issues of CLF and ecological environmental degradation, and optimized the pattern of cultivated land through comprehensive planning and design.

4.2. The Characteristics of the Driving Factors of CLF in Guangdong Province

The results consistently indicate that both slope and grain output have been the key driving factors of CLF. Additionally, agricultural benefits played an important role in 2000 and 2020, while the coefficient of social economic development in 2010 was more pronounced. The output of grain has played a role in driving CLF. With increasing grain output, farmers tend to over cultivate in pursuit of higher economic returns. Furthermore, to meet the demand for high output, farmers increase the use of fertilizers and pesticides [52]. Improper fertilization also disrupts the ecological balance of the soil, further accelerating the process of land fragmentation. In 2000, grain yield had a negative effect on CLF, while in 2010 and 2020, it had a positive effect. In 2000, despite the increase in grain output, the large, cultivated area did not excessively damage the structure of the cultivated land, instead it helped reduce land fragmentation. Moreover, the relatively low level of economic and social development and urbanization did not exert significant pressure on the demand for grain, providing the possibility for farmers to adopt more conservative and stable agricultural production methods, further restraining the trend of land fragmentation [53]. However, over time, by 2010 and 2020, the relationship between grain yield and land fragmentation gradually shifted to a positive effect. With population growth and economic development, the pressure for grain demand gradually increased, while the cultivated land area sharply decreased [54,55]. In pursuit of higher economic returns, farmers often adopt more aggressive and short-sighted agricultural production methods, over cultivating and over using fertilizers and pesticides, leading to soil structural damage and the exacerbation of land fragmentation [52,56].
In addition to grain output, the influence of the per capita disposable income of rural households, the ratio of rural to urban household disposable income, and the number of agricultural employees, on CLF has undergone changes, shifting from positive to negative, or vice versa. Initially, the increase in the disposable income for rural residents was expected to mitigate the pressure of CLF, as an improved income enables farmers to invest more capital in land improvement and protection and adopt more advanced farming techniques [23]. However, as income levels rise, the pursuit of economic benefits by farmers may lead to the over exploitation of land. Additionally, the widening ratio of disposable income between urban and rural residents has profoundly affected farmers’ production decisions and land use. Initially, farmers had a high dependence on the land [57], but with the urban–rural gap widening, farmers might be more inclined to pursue economic returns [58]. Simultaneously, urbanization exacerbated the level of land abandonment and CLF [42]. Finally, the changes in the number of agricultural employees also reflected the trend of CLF. In 2000, numerous farmers were directly engaged in agricultural production, but with the advancement of agricultural modernization and urbanization, a large number of rural laborers moved to cities [59], increasing the abandonment and fragmentation of cultivated land.

4.3. Implications for Rural Sustainable Development

The results of the MGWR show that different variables exhibit unique spatial variances in terms of their effects on spatial fragmentation. The correlation coefficients of the primary driving factors display specific spatial distribution characteristics, primarily centered around the PRDR, diffusing towards the east, west, and north, with varying degrees of increases or decreases. The PRDR emerges as the region with either the highest or lowest coefficients. CLF is closely associated with the natural environment [23], and the enhancement of farmland quality requires the consideration of topographical factors. Comprehensive land consolidation should be implemented for the PRDR, making rational determinations regarding the agricultural scale, promoting the consolidation and spatial displacement of scattered plots, enhancing farmland quality and contiguity, addressing farmland fragmentation issues, and establishing a high-quality, high-output, efficient, and eco-safe agricultural ecosystem [51,60]. The ERGD has superior agricultural resources, but a dense population. It is essential for this region to leverage its local resource advantages to cultivate distinctive and efficient agriculture. This involves implementing composite land consolidation for forests and agriculture to enhance soil and water conservation functions, adequate governance of rural river networks to control agricultural non-point source pollution, and enhancing farmland quality. The WRGD and NRGD show more pronounced responses to changes in grain output. In the process of farmland development and protection, special attention should be paid to ecological conservation and water conservation. The NRGD’s agricultural spaces are mainly distributed in mountain basins and river valley plains. Strict limitations are needed for the development of low hills and gentle slopes, controlling soil erosion, promoting ecological land consolidation, and gradually mitigating CLF. Therefore, sustainable rural development should balance the agricultural economic benefits with the ecological environmental impact, based on the local agricultural production conditions in the region.
The phenomenon of abandoned fragmented farmland has resulted from the migration of rural populations to urban areas, and the trend of population aging, coupled with a lack of modern agricultural facilities to support large-scale agricultural production [61]. Therefore, optimizing the allocation of cultivated land resources becomes particularly crucial. In response to the sustained decline in food production capacity due to land erosion, since 1998, the Chinese government has implemented a series of policies aimed at protecting cultivated land and promoting land consolidation [62]. The core objectives of these policies are to increase the cultivated land area, reduce land fragmentation, reduce land pollution, and enhance agricultural productivity [63,64]. As a major challenge to agricultural production, CLF has hindered the development of modern, mechanized and large-scale agriculture [32]. Therefore, it should be an important consideration when optimizing the allocation of cultivated land resources [65]. As an effective method to address the issue of CLF, land consolidation has been prioritized by the Chinese government. It has promoted comprehensive land consolidation and multidimensional planning of territorial space, since 2013. However, the current focus of land consolidation management overly emphasizes the negative impact of fragmentation on productivity and food quantity. This focus overlooks the economic income gap between farmers and urban residents, which to some extent affects farmers’ willingness to cultivate the land. Additionally, there is an interest game among the main participants of cultivated land. Farmers and the government tend to divide cultivated land for economic benefits, but policy-makers may not fully consider the interests of individual farmers [18,66]. In areas with high urbanization and relatively developed economies, comprehensive land consolidation should pay more attention to improving the quality of cultivated land to enhance the limited land quality [23]. Furthermore, the issue of farmers’ income needs to be deeply considered. This involves not only increasing agricultural income, but also focusing on other sources of income, such as food processing and tourism industries, to effectively narrow the urban–rural income gap [67]. In conclusion, the sustainable development of rural areas requires comprehensive consideration of multiple aspects, including the optimization of cultivated land resources, farmers’ interests, industrial structural adjustments, and the multifunctional development of farmland, to alleviate the regional development imbalance and urban–rural income gap in Guangdong Province and achieve common prosperity.

4.4. Limitations and Future Challenges

This study has several limitations. Firstly, we treated individual pixels as complete land use units and assessed CLF for each county-level unit. However, the constraints of image resolution (30 m) resulted in an inability to consider fluctuations in land cover within individual pixels, potentially leading to errors in the assessment results. Moreover, the lack of long-term micro-level social data led to the use of county-level socioeconomic data in this study, which prevented the inclusion of ownership fragmentation indicators in the driver analysis. Future research should integrate macro- and micro-level data to conduct a more comprehensive analysis of the factors driving CLF.

5. Conclusions

The fragmentation of cultivated land is one of the main obstacles to the sustainable development of rural areas. Systematically exploring the temporal and spatial characteristics and driving factors of CLF holds significant importance for improving regional agricultural production capacity, optimizing the allocation of cultivated land resources, and ensuring national food security. This paper investigated the spatial–temporal changes and the driving factors of CLF, using Guangdong Province in China as a case study. Guangdong Province serves as a typical case for studying CLF and its driving factors, as it is an area that has experienced rapid urbanization. The regional development imbalance in Guangdong Province, along with conflicts among the population, urbanization, and cultivated land resources, has made Guangdong Province one of the most fragmented agricultural regions in China. This study utilizes landscape pattern indices to quantitatively measure the degree of CLF. Based on multi-source data from 2000, 2010, and 2020, we employed the MGWR model to explore the driving factors of CLF.
The results show an increasing level of fragmentation in the landscape pattern of cultivated land over the past two decades. CLF in the cold spots in Guangdong Province became more severe, while in some areas of the PRDR, the hot spots showed partial mitigation of fragmentation. We found that the spatial differences in CLF are the result of natural environmental factors influenced by social, economic, and agricultural development. The slope and output of grain were key driving factors of CLF. Additionally, agricultural benefits played a significant role in 2000 and 2020, whereas the coefficient for social economic development in 2010 was more pronounced. Furthermore, this study discussed the impact of CLF on food security from the perspectives of farmers’ income and rural sustainability. Therefore, strategies to address CLF should comprehensively consider the optimization of cultivated land resources, farmers’ interests, industrial restructuring, and the multifunctional development of cultivated land to alleviate the regional development imbalance and urban–rural income gap in Guangdong Province, in order to achieve common prosperity.

Author Contributions

Methodology, software, formal analysis, visualization, writing—original draft preparation, M.S.; data curation, visualization, K.S.; investigation, B.D. and N.C.; conceptualization, writing—review and editing, supervision, funding acquisition, Y.C. All authors have read and agreed to the published version of the manuscript.

Funding

This research was funded by the National Natural Science Foundation of China (grant number: 42371295).

Data Availability Statement

The employed remote sensing data are openly available from corresponding website and the processed data are available upon request.

Conflicts of Interest

The authors declare no conflicts of interest.

References

  1. Rosenzweig, C.; Parry, M.L. Potential impact of climate change on world food supply. Nature 1994, 367, 133–138. [Google Scholar] [CrossRef]
  2. Tilman, D.; Balzer, C.; Hill, J.; Befort, B.L. From the cover: Global food demand and the sustainable intensification of agriculture. Proc. Natl. Acad. Sci. USA 2011, 108, 20260. [Google Scholar] [CrossRef] [PubMed]
  3. Chen, X.P.; Cui, Z.L.; Fan, M.S.; Vitousek, P.; Zhao, M.; Ma, W.Q.; Wang, Z.L.; Zhang, W.J.; Yan, X.Y.; Yang, J.C.; et al. Producing more grain with lower environmental costs. Nature 2014, 514, 486–489. [Google Scholar] [CrossRef] [PubMed]
  4. Chen, Y.M.; Yao, M.R.; Zhao, Q.Q.; Chen, Z.J.; Jiang, P.H.; Li, M.C.; Chen, D. Delineation of a basic farmland protection zone based on spatial connectivity and comprehensive quality evaluation: A case study of Changsha City, China. Land Use Policy 2021, 101, 105145. [Google Scholar] [CrossRef]
  5. Costanza, R.; d’Arge, R.; DeGroot, R.; Farber, S.; Grasso, M.; Hannon, B.; Limburg, K.; Naeem, S.; Oneill, R.V.; Paruelo, J.; et al. The value of the world’s ecosystem services and natural capital. Nature 1997, 387, 253–260. [Google Scholar] [CrossRef]
  6. Dogliotti, S.; García, M.C.; Peluffo, S.; Dieste, J.P.; Pedemonte, A.J.; Bacigalupe, G.F.; Scarlato, M.; Alliaume, F.; Alvarez, J.; Chiappe, M.; et al. Co-Innovation of Family Farm Systems: A Systems Approach to Sustainable Agriculture. Agric. Syst. 2014, 126, 76–86. [Google Scholar] [CrossRef]
  7. Piñeiro, V.; Arias, J.; Dürr, J.; Elverdin, P.; Ibáñez, A.M.; Kinengyere, A.; Opazo, C.M.; Owoo, N.; Page, J.R.; Prager, S.D.; et al. A Scoping Review on Incentives for Adoption of Sustainable Agricultural Practices and Their Outcomes. Nat. Sustain. 2020, 3, 809–820. [Google Scholar] [CrossRef]
  8. Smit, B.; Cai, Y.L. Climate change and agriculture in China. Glob. Environ. Chang. 1996, 6, 205–214. [Google Scholar] [CrossRef]
  9. Zhou, Y.; Li, X.H.; Liu, Y.S. Cultivated land protection and rational use in China. Land Use Policy 2021, 106, 105454. [Google Scholar] [CrossRef]
  10. Wang, L.Y.; Anna, H.; Zhang, L.Y.; Xiao, Y.; Wang, Y.Q.; Xiao, Y.; Liu, J.G.; Ouyang, Z.Y. Spatial and Temporal Changes of Arable Land Driven by Urbanization and Ecological Restoration in China. Chin. Geogr. Sci. 2019, 29, 809–819. [Google Scholar] [CrossRef]
  11. Liu, Y.S.; Qiao, L.Y. Innovating system and policy of arable land conservation under the new-type urbanization in China. Econ. Geogr. 2014, 34, 1–6. [Google Scholar]
  12. Kong, X.B. Analysis of current issues and countermeasures in cultivated land protection. China Land 2020, 419, 4–7. [Google Scholar]
  13. Zhou, Y.R.; Chen, T.Q.; Feng, Z.; Wu, K.N. Identifying the contradiction between the cultivated land fragmentation and the construction land expansion from the perspective of urban-rural differences. Ecol. Inform. 2022, 71, 101826. [Google Scholar] [CrossRef]
  14. Looga, J.; Jürgenson, E.; Sikk, K.; Matveev, E.; Maasikamäe, S. Land Fragmentation and Other Determinants of Agricultural Farm Productivity: The Case of Estonia. Land Use Policy 2018, 79, 285–292. [Google Scholar] [CrossRef]
  15. Tu, Y.; Chen, B.; Yu, L.; Xin, Q.C.; Gong, P.; Xu, B. How does urban expansion interact with cropland loss? A comparison of 14 Chinese cities from 1980 to 2015. Landsc. Ecol. 2021, 36, 243–263. [Google Scholar] [CrossRef]
  16. Qiu, L.F.; Zhu, J.X.; Pan, Y.; Wu, S.H.; Dang, Y.X.; Xu, B.G.; Yang, H. The positive impacts of landscape fragmentation on the diversification of agricultural production in Zhejiang Province, China. J. Clean. Prod. 2020, 251, 119722. [Google Scholar] [CrossRef]
  17. Ntihinyurwa, P.D.; De Vries, W.T. Farmland Fragmentation Concourse: Analysis of Scenarios and Research Gaps. Land Use Policy 2021, 100, 104936. [Google Scholar] [CrossRef]
  18. Cao, Y.; Zou, J.; Fang, X.Q.; Wang, J.Y.; Cao, Y.; Li, G.Y. Effect of Land Tenure Fragmentation on the Decision-Making and Scale of Agricultural Land Transfer in China. Land Use Policy 2020, 99, 104996. [Google Scholar] [CrossRef]
  19. Abrantes, P.; Fontes, I.; Gomes, E.; Rocha, J. Compliance of Land Cover Changes with Municipal Land Use Planning: Evidence from the Lisbon Metropolitan Region (1990–2007). Land Use Policy 2016, 51, 120–134. [Google Scholar] [CrossRef]
  20. Farley, K.A.; Ojeda-Revah, L.; Atkinson, E.E.; Eaton-González, B.R. Changes in land use, land tenure, and landscape fragmentation in the Tijuana River Watershed following reform of the ejido sector. Land Use Policy 2012, 29, 187–197. [Google Scholar] [CrossRef]
  21. Deng, J.S.; Qiu, L.F.; Wang, K.; Yang, H.; Shi, Y.Y. An integrated analysis of urbanization-triggered cropland loss trajectory and implications for sustainable land management. Cities 2011, 28, 127–137. [Google Scholar] [CrossRef]
  22. Han, P.; Xiang, J.W.; Zhao, Q.L. Spatial differentiation and scenario simulation of cultivated land in mountainous areas of Western Hubei, China: A PLUS model. Environ. Sci. Pollut. Res. 2023, 30, 52804–52817. [Google Scholar] [CrossRef] [PubMed]
  23. Xu, M.Y.; Niu, L.; Wang, X.B.; Zhang, Z.F. Evolution of Farmland Landscape Fragmentation and Its Driving Factors in the Beijing-Tianjin-Hebei Region. J. Clean. Prod. 2023, 418, 138031. [Google Scholar] [CrossRef]
  24. Qi, X.X.; Dang, H.P. Addressing the Dual Challenges of Food Security and Environmental Sustainability during Rural Livelihood Transitions in China. Land Use Policy 2018, 77, 199–208. [Google Scholar] [CrossRef]
  25. Gomes, E.; Banos, A.; Abrantes, P.; Rocha, J.; Kristensen, S.B.P.; Busck, A. Agricultural land fragmentation analysis in a peri-urban context: From the past into the future. Ecol. Indic. 2019, 97, 380–388. [Google Scholar] [CrossRef]
  26. Yu, P.H.; Fennell, S.; Chen, Y.Y.; Liu, H.; Xu, L.; Pan, J.W.; Bai, S.Y.; Gu, S.X. Positive Impacts of Farmland Fragmentation on Agricultural Production Efficiency in Qilu Lake Watershed: Implications for Appropriate Scale Management. Land Use Policy 2022, 117, 106108. [Google Scholar] [CrossRef]
  27. Tran, T.Q.; Vu, H.V. Land Fragmentation and Household Income: First Evidence from Rural Vietnam. Land Use Policy 2019, 89, 104247. [Google Scholar] [CrossRef]
  28. Ciaian, P.; Guri, F.; Rajcaniova, M.; Drabik, D.; Paloma, S.G.Y. Land Fragmentation and Production Diversification: A Case Study from Rural Albania. Land Use Policy 2018, 76, 589–599. [Google Scholar] [CrossRef]
  29. Xu, M.Y.; Zhang, Z.F. Spatial Differentiation Characteristics and Driving Mechanism of Rural-Industrial Land Transition: A Case Study of Beijing-Tianjin-Hebei Region, China. Land Use Policy 2021, 102, 105239. [Google Scholar] [CrossRef]
  30. Hartvigsen, M.B. Land Reform and Land Consolidation in Central and Eastern Europe after 1989: Experiences and Perspectives. Ph.D. Thesis, Aalborg Universitetsforlag, Aalborg, Denmark, 2015. [Google Scholar] [CrossRef]
  31. Qian, F.K.; Pang, R.R.; Yu, Y.; Xu, H.; Han, C.L. Spatial correlation characteristics and mechanism of cultivated land landscape pattern and cultivated land quality in different geomorphic areas of Liaoning Province. Chin. J. Eco-Agric. 2023, 31, 113–124. [Google Scholar]
  32. Ye, J.Z. Land Transfer and the Pursuit of Agricultural Modernization in China. J. Agrar. Chang. 2015, 15, 314–337. [Google Scholar] [CrossRef]
  33. Yang, J.; Huang, X. The 30 m annual land cover dataset and its dynamics in China from 1990 to 2019. Earth Syst. Sci. Data 2021, 13, 3907–3925. [Google Scholar] [CrossRef]
  34. Center for International Earth Science Information Network (CIESIN)/Columbia University, and Information Technology Outreach Services (ITOS)/University of Georgia. Global Roads Open Access Data Set, Version 1 (gROADSv1); NASA Socioeconomic Data and Applications Center (SEDAC): Palisades, NY, USA, 2013.
  35. Tan, S.H.; Qu, F.T.; Nike, H. Analysis of the causes of land fragmentation and its influencing factors. China Rural Surv. 2003, 24–30+74. [Google Scholar]
  36. Hou, A.F. A study of the impact of cultivated land fragmentation on agricultural mechanization. J. Chin. Agric. Mech. 2009, 68–72. [Google Scholar] [CrossRef]
  37. Tian, C.H.; Chen, H.H.; Jia, S.H. The impact of agricultural land markets on cropland fragmentation—Theory and experience from Jiangsu, Zhejiang and Shandong. China Econ. Q. 2005, 769–784. [Google Scholar]
  38. Qing, J.Y.; Xue, L.Y. Analysis of landscape fragmentation of arable land in the Wangcun River basin. J. Shanxi Norm. Univ. (Nat. Sci. Ed.) 2017, 31, 119–122. [Google Scholar] [CrossRef]
  39. Diakoulaki, D.; Mavrotas, G.; Papayannakis, L. Determining objective weights in multiple criteria problems: The critic method. Comput. Oper. Res. 1995, 22, 763–770. [Google Scholar] [CrossRef]
  40. Getis, A.; Ord, J.K. The Analysis of Spatial Association by Use of Distance Statistics. Geogr. Anal. 1992, 24, 189–206. [Google Scholar] [CrossRef]
  41. Han, Z.; Song, W. Abandoned Cropland: Patterns and Determinants within the Guangxi Karst Mountainous Area, China. Appl. Geogr. 2020, 122, 102245. [Google Scholar] [CrossRef]
  42. Guo, A.; Yue, W.; Yang, J.; Xue, B.; Xiao, W.; Li, M.; He, T.; Zhang, M.; Jin, X.; Zhou, Q. Cropland Abandonment in China: Patterns, Drivers, and Implications for Food Security. J. Clean. Prod. 2023, 418, 138154. [Google Scholar] [CrossRef]
  43. Deng, X.; Huang, J.; Rozelle, S.; Zhang, J.; Li, Z. Impact of Urbanization on Cultivated Land Changes in China. Land Use Policy 2015, 45, 1–7. [Google Scholar] [CrossRef]
  44. Fotheringham, A.S.; Brunsdon, C.; Charlton, M. Geographically Weighted Regression: The Analysis of Spatially Varying Relationships; John Wiley and Sons, Ltd.: West Sussex, UK, 2003. [Google Scholar]
  45. Fotheringham, A.S.; Yang, W.B.; Kang, W. Multiscale Geographically Weighted Regression (MGWR). Ann. Am. Assoc. Geogr. 2017, 107, 1247–1265. [Google Scholar] [CrossRef]
  46. Girardet, X.; Foltête, J.C.; Clauzel, C. Designing a Graph-Based Approach to Landscape Ecological Assessment of Linear Infrastructures. Environ. Impact Assess. Rev. 2013, 42, 10–17. [Google Scholar] [CrossRef]
  47. Liu, L.; Liu, Z.J.; Gong, J.Z.; Wang, L.; Hu, Y.M. Quantifying the amount, heterogeneity, and pattern of farmland: Implications for China’s requisition-compensation balance of farmland policy. Land Use Policy 2019, 81, 256–266. [Google Scholar] [CrossRef]
  48. Chen, X.Y.; Zhan, Q.M.; Fan, Y.L. Classification and Evaluation Methods for Optimization of Land Use Efficiency at Village Level. Land 2023, 12, 710. [Google Scholar] [CrossRef]
  49. Han, B.; Jin, X.B.; Sun, R.; Xiang, X.M.; Liu, J.; Cao, S.; Zhou, Y.K. Optimized allocation of cultivated land in land consolidation project area based on multi-objective linear programming. J. Nat. Resour. 2019, 34, 718–731. [Google Scholar] [CrossRef]
  50. Wu, S.M.; Ye, Y.M.; Zhang, C.Z.; Wen, G.H. Impacts of different modes of rural land consolidation on cultivated land fragmentation and its regional differences: Empirical evidence from Jianghan Plain and Wuling Mountain area in Hubei Province. China Land Sci. 2021, 35, 98–106. [Google Scholar]
  51. Su, M.Y.; Fang, X.Q.; Sun, K.Y.; Bao, J.H.; Cao, Y. Construction and optimization of an ecological network in the comprehensive land consolidation project of a small rural town in southeast China. Sustainability 2023, 15, 5984. [Google Scholar] [CrossRef]
  52. Song, W.; Ye, C. Impact of the Cultivated-Land-Management Scale on Fertilizer Reduction—Empirical Evidence from the Countryside of China. Land 2022, 11, 1184. [Google Scholar] [CrossRef]
  53. Wang, D.; Yang, H.; Hu, Y.; Zhu, A.X.; Mao, X. Analyzing Spatio-Temporal Characteristics of Cultivated Land Fragmentation and Their Influencing Factors in a Rapidly Developing Region: A Case Study in Guangdong Province, China. Land 2022, 11, 1750. [Google Scholar] [CrossRef]
  54. Zhang, Z.F.; Yang, H.; Gu, X.K. Effects of land consolidation in plains and hills on plots use. Trans. Chin. Soc. Agric. Eng. 2013, 29, 1–8. [Google Scholar]
  55. Yun, W.Q.; Zhu, D.L.; Tang, H.Z. Reshaping and innovation of China land consolidation strategy. Trans. Chin. Soc. Agric. Eng. 2016, 32, 1–8. [Google Scholar]
  56. Li, H.; Yin, M.H.; Ma, Y.L.; Kang, Y.X.; Jia, Q.; Qi, G.P.; Wang, J.H. Effects of planting scale and fragmentation on the behavior of smallholders’ farmland quality protection: Taking the application of pesticide and fertilizer in vegetable cultivation as an example. China Land Sci. 2022, 36, 74–84. [Google Scholar]
  57. Zhang, M.Y.; Chen, Q.X.; Zhang, K.W. Influence of the variation in rural population on farmland preservation in the rapid urbanization area of China. J. Geogr. Sci. 2021, 31, 1365–1380. [Google Scholar] [CrossRef]
  58. Sun, X.; Bi, R.T.; Ding, Y.; Ning, F. Effects of cultivated land fragmentation on farmers’ livelihood strategies in impoverished mountainous areas: A case study of 87 villages in Qingzhang River Basin of Zouquan County. China Land Sci. 2018, 32, 40–47. [Google Scholar]
  59. Qiu, T.W.; Choy, S.T.B.; Li, Y.F.; Luo, B.L.; Li, J. Farmers’ Exit from Land Operation in Rural China: Does the Price of Agricultural Mechanization Services Matter? China World Econ. 2021, 29, 123–150. [Google Scholar] [CrossRef]
  60. Su, M.Y.; Wu, J.L. Impact of comprehensive land consolidation rehabilitation on ecosystem services: A case study of the Shazai Island, Jiangmen, Guangdong Province. Trop. Geogr. 2021, 41, 159–166. [Google Scholar]
  61. Ren, C.C.; Zhou, X.Y.; Wang, C.; Guo, Y.L.; Diao, Y.; Shen, S.S.; Reis, S.; Li, W.Y.; Xu, J.M.; Gu, B.J. Ageing threatens sustainability of smallholder farming in China. Nature 2023, 616, 96–103. [Google Scholar] [CrossRef] [PubMed]
  62. Yang, H. China’s soil plan needs strong support. Nature 2016, 536, 375. [Google Scholar] [CrossRef] [PubMed]
  63. Song, W.; Pijanowski, B.C. The effects of China’s cultivated land balance program on potential land productivity at a national scale. Appl. Geogr. 2014, 46, 158–170. [Google Scholar] [CrossRef]
  64. Du, X.D.; Zhang, X.K.; Jin, X.B. Assessing the effectiveness of land consolidation for improving agricultural productivity in China. Land Use Policy 2018, 70, 360–367. [Google Scholar] [CrossRef]
  65. Liu, J.; Jin, X.B.; Xu, W.Y.; Sun, R.; Han, B.; Yang, X.H.; Gu, Z.M.; Xu, C.L.; Sui, X.Y.; Zhou, Y.K. Influential Factors and Classification of Cultivated Land Fragmentation, and Implications for Future Land Consolidation: A Case Study of Jiangsu Province in Eastern China. Land Use Policy 2019, 88, 104185. [Google Scholar] [CrossRef]
  66. Barati, A.A.; Azadi, H.; Scheffran, J. Agricultural Land Fragmentation in Iran: Application of Game Theory. Land Use Policy 2021, 100, 105049. [Google Scholar] [CrossRef]
  67. Wang, Z.L.; Lv, Q.H.; Wu, Y.; Wang, Y.Y. The Impact of Cultivated Land Fragmentation on Part-time Behavior of Farmers in China. China Land Sci. 2024, 38, 73–83. [Google Scholar]
Figure 1. Location and topography of Guangdong Province, China.
Remotesensing 16 02633 g001
Figure 2. Urbanization rate of China and Guangdong Province.
Remotesensing 16 02633 g002
Figure 3. Land cover changes in Guangdong Province between 2000 and 2020.
Remotesensing 16 02633 g003
Figure 4. Cultivated land fragmentation in Guangdong Province from 2000 to 2020.
Remotesensing 16 02633 g004
Figure 5. Spatial distribution of CLFI in Guangdong Province in 2000 (a), 2010 (b), and 2020 (c), and CLF trends in 2000–2010 and 2010–2020 (d).
Remotesensing 16 02633 g005
Figure 6. Spatial distribution of CLF hot spots and cold spots in 2000 (a), 2010 (b), and 2020 (c).
Remotesensing 16 02633 g006
Figure 7. Spatial distribution of the coefficients of the natural environment for the MGWR model from 2000 to 2020.
Remotesensing 16 02633 g007
Figure 8. Spatial distribution of the coefficients of the agricultural benefits for the MGWR model from 2000 to 2020.
Remotesensing 16 02633 g008
Figure 9. Spatial distribution of the coefficients of social economic development for the MGWR model from 2000 to 2020.
Remotesensing 16 02633 g009
Table 1. Data description.
Data TypesSourcesResolutionFormatWebsite
Administrative district dataThe department of natural resources management/Shapefile/
Land coverChina land cover dataset (CLCD),
accessed on 21 October 2023.
30 mRasterhttp://irsip.whu.edu.cn/resources/CLCD.php
DEMASTER GDEM,
accessed on 17 November 2021.
30 mRasterhttp://www.gscloud.cn
MeteorologyResource and environment science and data center
accessed on 5 June 2024
1 kmRasterhttps://www.resdc.cn
Water network and road networkOpen Street Map.
accessed on 1 March 2023.
/Shapefilehttps://openmaptiles.org
Socio-economic dataStatistical Yearbooks for Guangdong Province and Rural Statistics Yearbooks for Guangdong Province
accessed on 4 June 2024
County levelSpreadsheethttps://stats.gd.gov.cn/gdtjnj/
Table 2. Indicators for evaluating cultivated land fragmentation in Guangdong Province.
IndicatorAbbreviationDescriptionWeight
Percentage of the landscapePLANDPLAND equals the percentage of the landscape comprised of the corresponding patch type.0.1352
Patch densityPDPD equals the number of patches of the corresponding patch type divided by the total landscape area.0.1067
Edge densityEDED equals the sum of the length of all the edge segments involving the corresponding patch type, divided by the total landscape area.0.1378
Landscape shape indexLSILSI equals the total length of the edge divided by the minimum possible length of the class edge for a maximally aggregated class.0.1351
Aggregation indexAIAI equals the number of like adjacencies involving the corresponding class, divided by the maximum possible number of like adjacencies involving the corresponding class.0.0867
Area-weighted mean patch areaAREA_AMAREA_AM equals the average size of the patches within a landscape, where the average is calculated based on the area of each patch.0.0997
Area-weighted mean fractal dimensionFRAC_AMFRAC_AM refers to an index that quantifies the complexity or irregularity of a landscape or pattern, where the average fractal dimension is calculated based on the area of each fractal element.0.1451
Mean Euclidean nearest-neighbor distanceENN_AMENN_AM equals the average distance between each point and its nearest neighbor within a given spatial area.0.0638
Landscape division indexDIVISIONDIVISION equals 1 minus the sum of the patch area divided by the total landscape area, the quantity squared, and the sum of all the patches of the corresponding patch type.0.0898
Table 3. Driving factors of cultivated land fragmentation.
FactorIndexUnit
Natural
environment
DEMm
Slope°
Water network densitykm/km2
Average temperature°C
Annual precipitationmm
Agricultural benefitsGross output value of agriculture104 RMB
Output of graint
Average grain output per mukg/mu
Per capita disposable income of rural householdsRMB
Social
economic
development
Per capita gross domestic productRMB
Per capita disposable income of urban householdsRMB
Local government budgetary expenditure104 RMB
Ratio of disposable income per urban household to disposable income per rural household/
Road network densitykm/km2
Number of agricultural employees/
Proportion of rural labor engaged in non-agricultural industries%
Table 4. Regression results for the GWR model and MGWR model.
Year200020102020
ModelsGWRMGWRGWRMGWRGWRMGWR
AIC283.108245.601233.102225.248247.627218.273
AICc293.647273.099244.259235.053257.227243.187
R20.4350.6890.6030.6580.5840.752
Adj.R20.3290.5650.5340.5430.5120.659
Table 5. Regression results from the MGWR model.
Variable200020102020
Coef.Band-WidthCoef.Band-WidthCoef.Band-Width
MeanSTDMeanSTDMeanSTD
DEM−0.1930.004107−0.5550.018102−0.4210.022103
Slope0.3760.282480.2580.135750.3040.12875
Water network density−0.0430.028107−0.0810.018102−0.0580.030103
Average temperature−0.0710.009107−0.1180.024102−0.1370.026107
Annual precipitation0.0660.021107−0.1960.008102−0.0430.026103
Gross output value of agriculture0.2770.186680.0450.091980.1940.088105
Output of grain−0.6010.407440.8620.0221020.5620.10180
Average grain output−0.0610.002107−0.0380.041102−0.1660.009107
Per capita disposable income of rural households−0.7210.0121071.6340.165620.4620.04189
Per capita gross domestic product−0.0590.008107−0.2230.006102−0.1050.007107
Per capita disposable income of urban households0.4590.007107−1.4180.012102−0.3310.016107
Local government budgetary expenditure0.1850.0031070.5510.0061020.3570.27844
Ratio of disposable income per urban household to disposable income per rural household−0.3760.113931.1190.0271020.2240.003107
Road network density−0.0320.020107−0.0890.0251010.0460.09297
Number of agricultural employees0.4720.10193−0.7300.020102−0.2240.07481
Proportion of rural labor engaged in non-agricultural industries−0.0100.026103−0.3360.057900.1120.25046
Total power of agricultural machinery0.0140.0051070.0570.065102///
Disclaimer/Publisher’s Note: The statements, opinions and data contained in all publications are solely those of the individual author(s) and contributor(s) and not of MDPI and/or the editor(s). MDPI and/or the editor(s) disclaim responsibility for any injury to people or property resulting from any ideas, methods, instructions or products referred to in the content.

