Article

Monitoring Cover Crop Biomass in Southern Brazil Using Combined PlanetScope and Sentinel-1 SAR Data

by
Fábio Marcelo Breunig
1,2,
Ricardo Dalagnol
3,4,*,
Lênio Soares Galvão
5,
Polyanna da Conceição Bispo
6,
Qing Liu
6,
Elias Fernando Berra
1,
William Gaida
2,
Veraldo Liesenberg
7 and
Tony Vinicius Moreira Sampaio
1
1
Departamento de Geografia, Setor de Ciências da Terra, Universidade Federal do Paraná (DGEOG/SCT/UFPR), Politécnico, Curitiba 81530-900, PR, Brazil
2
Campus de Frederico Westphalen, Universidade Federal de Santa Maria (UFSM-FW), Frederico Westphalen 98400-000, RS, Brazil
3
Center for Tropical Research, Institute of the Environment and Sustainability, University of California, Los Angeles, CA 90095, USA
4
NASA-Jet Propulsion Laboratory, California Institute of Technology, Pasadena, CA 91109, USA
5
Earth Observation and Geoinformatics Division (DIOTG), National Institute for Space Research (INPE), São José dos Campos 12245-970, SP, Brazil
6
Department of Geography, School of Environment, Education and Development, University of Manchester, Manchester M13 9PL, UK
7
College of Agronomy and Veterinary—CAV, Santa Catarina State University (UDESC), Lages 88520-000, SC, Brazil
*
Author to whom correspondence should be addressed.
Remote Sens. 2024, 16(15), 2686; https://doi.org/10.3390/rs16152686 (registering DOI)
Submission received: 19 June 2024 / Revised: 16 July 2024 / Accepted: 22 July 2024 / Published: 23 July 2024
(This article belongs to the Special Issue Advancements in Remote Sensing for Sustainable Agriculture)

Abstract

:
Precision agriculture integrates multiple sensors and data types to support farmers with informed decision-making tools throughout crop cycles. This study evaluated Aboveground Biomass (AGB) estimates of Rye using attributes derived from PlanetScope (PS) optical, Sentinel-1 Synthetic Aperture Radar (SAR), and hybrid (optical plus SAR) datasets. Optical attributes encompassed surface reflectance from PS’s blue, green, red, and near-infrared (NIR) bands, alongside the Normalized Difference Vegetation Index (NDVI) and Enhanced Vegetation Index (EVI). Sentinel-1 SAR attributes included the C-band Synthetic Aperture Radar Ground Range Detected, VV and HH polarizations, and both Ratio and Polarization (Pol) indices. Ground reference AGB data for Rye (Secale cereal L.) were collected from 50 samples and four dates at a farm located in southern Brazil, aligning with image acquisition dates. Multiple linear regression models were trained and validated. AGB was estimated based on individual (optical PS or Sentinel-1 SAR) and combined datasets (optical plus SAR). This process was repeated 100 times, and variable importance was extracted. Results revealed improved Rye AGB estimates with integrated optical and SAR data. Optical vegetation indices displayed higher correlation coefficients (r) for AGB estimation (r = +0.67 for both EVI and NDVI) compared to SAR attributes like VV, Ratio, and polarization (r ranging from −0.52 to −0.58). However, the hybrid regression model enhanced AGB estimation (R2 = 0.62, p < 0.01), reducing RMSE to 579 kg·ha−1. Using only optical or SAR data yielded R2 values of 0.51 and 0.42, respectively (p < 0.01). In the hybrid model, the most important predictors were VV, NIR, blue, and EVI. Spatial distribution analysis of predicted Rye AGB unveiled agricultural zones associated with varying biomass throughout the cover crop development. Our findings underscored the complementarity of optical with SAR data to enhance AGB estimates of cover crops, offering valuable insights for agricultural zoning to support soil and cash crop management.

1. Introduction

Cover crops are important components of precision agriculture [1]. They are extensively employed for soil erosion prevention and enhancement of its physical and chemical properties [2,3,4,5,6]. Furthermore, the biomass-related functions of cover crops can mitigate weed proliferation [7,8] and reduce pathogen survival [9]. Serving as a conservation practice, cover crops facilitate sustainable farming while functioning as providers to ecosystem services [10,11] and nutrients provision [12].
From a remote sensing perspective, various strategies employing passive optical data to estimate cover crop biomass have emerged as effective proxies for delineating agricultural management zones across different observational scales [13,14,15]. For example, daily data generated by hundreds of CubeSats operating synchronously in orbit, particularly from satellite constellations like PlanetScope (PS), have significantly enhanced the probability of acquiring cloud-free images at high spatial resolution (~3 m) across the visible, red-edge, and near-infrared (NIR) spectral bands [16]. Nonetheless, despite the capacity for daily image capture, satellite constellations encounter challenges in providing a sufficiently frequent supply of cloud-free observations in specific regions of Brazil (e.g., the southern region) or during particular periods of the year (e.g., the rainy season). The causes are the variable atmospheric conditions prevalent in tropical and subtropical environments in Brazil.
To address the limitations associated with atmospheric effects on optical data acquisition, satellite constellations comprising synthetic aperture radar (SAR) data serve as a promising alternative for estimating cover crop biomass, particularly when integrated with optical data. One notable example is the Sentinel-1 SAR constellation, consisting of two polar-orbiting satellites, which offers near-weekly global data at a median spatial resolution of 15 m. As an early component of the Copernicus program, the Sentinel-1 payload has a SAR system operating in the C-band (5.6 cm wavelength), ensuring comprehensive and continuous global coverage [17].
While the SAR Sentinel-1 constellation may capture cover crop responses related to dielectric properties, surface roughness, and biophysical attributes, the PS constellation can retrieve compositional information associated with leaf/canopy pigments and vegetation structure retrieved from vegetation indices such as the Normalized Difference Vegetation Index (NDVI) and Enhanced Vegetation Index (EVI) [18,19,20,21,22]. Therefore, SAR data are well-suited for evaluating canopy structural information of cover crops and addressing saturation issues encountered with optical data [23]. In agricultural studies, time series of PS images enable timely monitoring of crops for various purposes [14,24,25,26]. Given cloud coverage concerns in Brazil, which impact most applications needing the detection of rapid changes on the land surface, Sentinel-1 SAR data offer a partial solution to atmospheric limitations on image acquisition [23,27,28,29].
In the literature, most remote sensing studies, combining optical and SAR data, have focused on estimating the Aboveground Biomass (AGB) of crops and forests [30,31,32,33,34,35,36]. For instance, studies by Hosseini et al. [37,38] successfully monitored maize biomass in Canada using RapidEye and RADARSAT-2 data. Additionally, research efforts have been directed towards monitoring and estimating the biomass of cash crops such as paddy rice [39], wheat [40], and grassland mowing [41,42,43]. Another study has mapped crop-livestock systems using combined optical and SAR data and tested machine and deep learning algorithms [44]. Despite their significant agricultural importance, cover crops have remained inadequately monitored and modeled using combined optical and SAR data [45]. Considering the leaf and canopy characteristics of Rye (Secale cereal L.), we hypothesize that incorporating SAR data into the analysis can provide additional insights into the canopy structure and surface roughness of this cover crop. In conjunction with changes in foliage pigments captured by optical data, the inclusion of microwave information can enhance the accuracy of Rye AGB estimates.
In this study, addressing the challenge of managing cover crops in agriculture and the need for improving monitoring systems, we hypothesized that integrating SAR and optical data could significantly improve the accuracy of cover crop AGB estimates. Therefore, the objective of our investigation was to explore potential gains in AGB estimates for Rye in southern Brazil through the integration of PS attributes (including reflectance values from four visible and near-infrared spectral bands, NDVI, and EVI) with Sentinel-1 SAR metrics (encompassing dual-polarization C-band data, co-polarization bands VV and HH, and the backscatter coefficient). These variables, derived from four synchronized dates of PS and Sentinel-1 SAR acquisitions, served as input data for multiple linear regression utilizing individual and combined satellite datasets. The relationships between AGB measurements, meteorological data, and spectral variables were also explored through the generation of Pearson’s correlation matrix, scatterplots, and histograms.

2. Materials and Methods

2.1. Study Area

The study was conducted at Vila Morena farm with an area of 32 hectares, situated in the municipality of Boa Vista das Missões in southern Brazil, with central coordinates of 27°44′10.30″S and 53°21′5.00″W (Figure 1). The local topography is undulating with an elevation amplitude of 44 m. The predominant soil type in the region is Oxisols (Typic Hapludox), characterized by a clay content exceeding 60% [14,46]. This farm experiences a subtropical climate (Cfa in the Köppen–Geiger classification), with an average annual temperature of 18 °C and an annual precipitation of 1919 mm [47]. Precipitation is evenly distributed throughout the year. Local temperatures generally range from 4 °C in the local winter to 30 °C in the summer. The site was chosen because of (i) the granted access to a robust dataset of reference ground AGB, which is crucial to validate our methodology; (ii) the accessibility in field campaigns; and (iii) the availability of PS and SAR data.

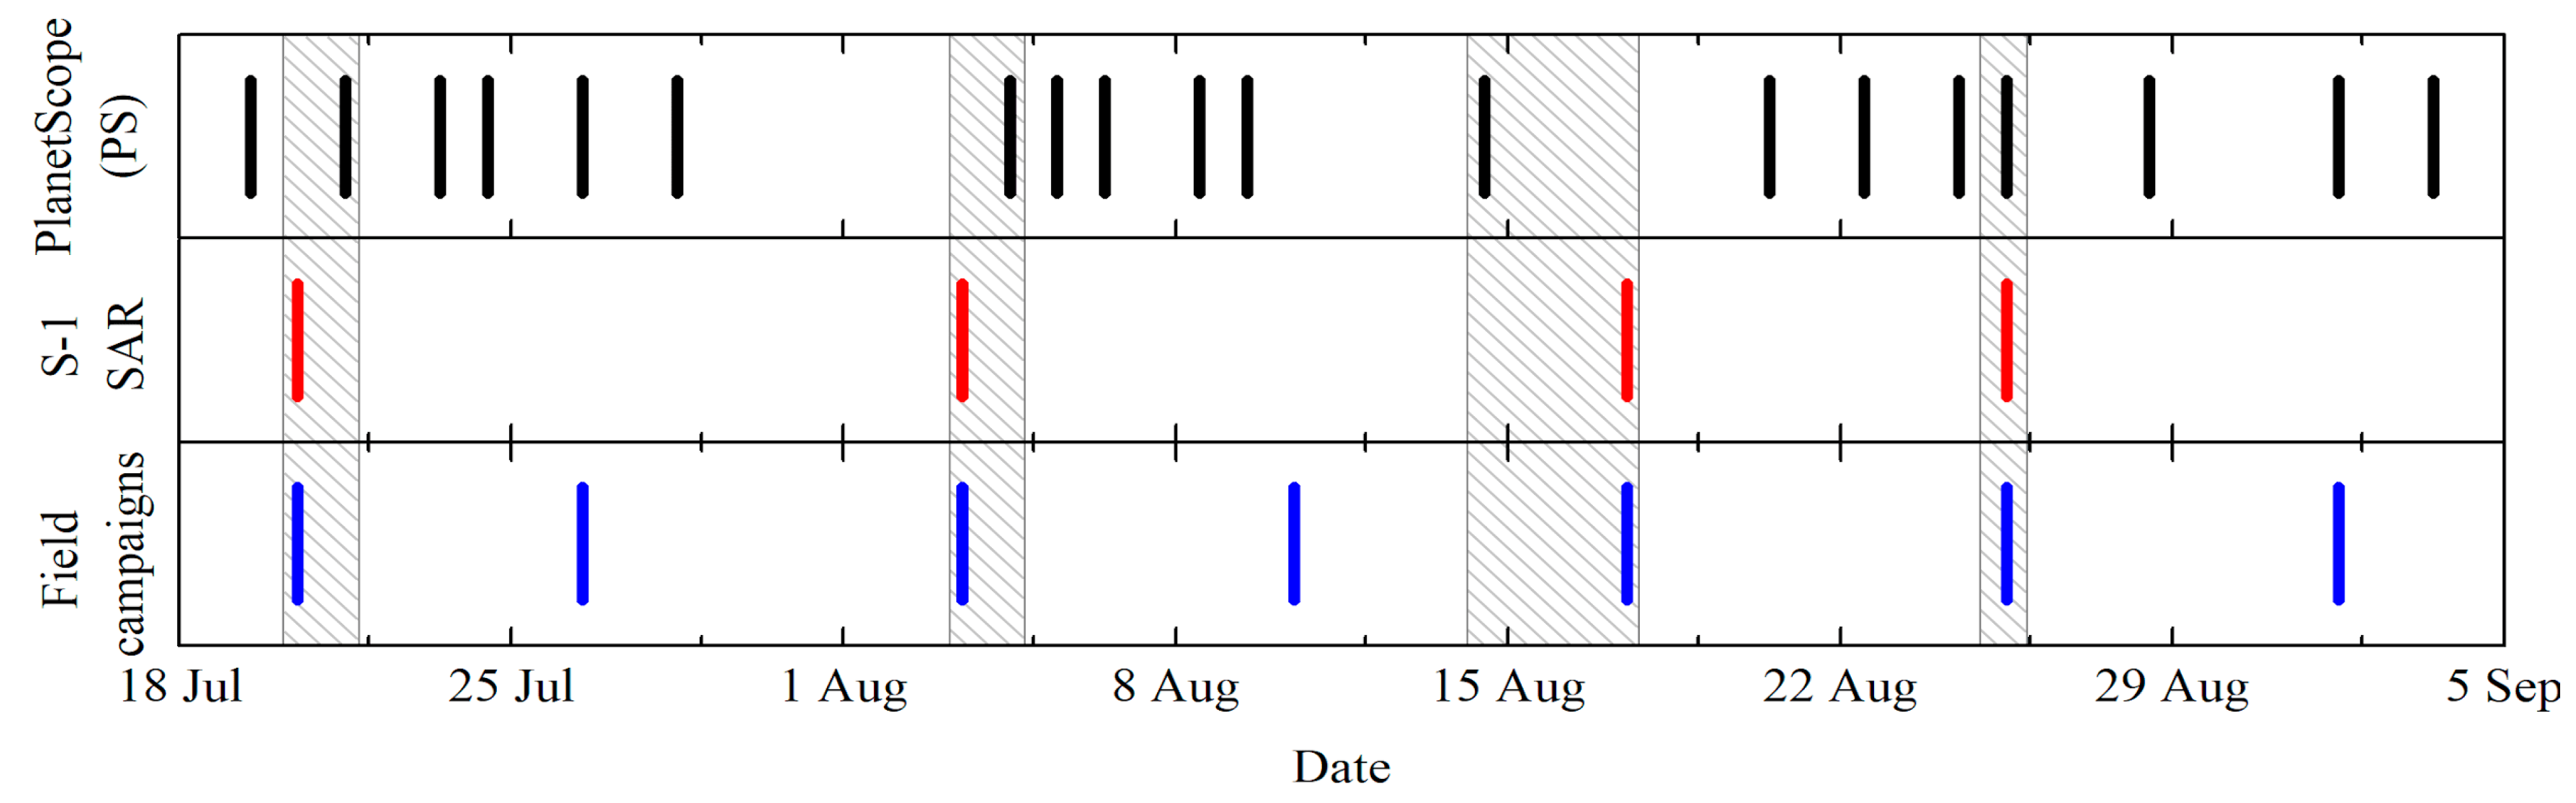
2.2. Field AGB Measurement, Satellite Data Acquisition, and Related Attributes

Over the past nine years, Rye (Secale cereale L.) has been consistently planted at the farm as part of the cash crop cycles. Rye is a winter crop known for its high adaptability and resilience. In Brazil, it is primarily cultivated in the southern states, where its production is linked to animal feed and as a forage cover. Typically, a seeding density of 300 to 350 seeds per square meter is used for cover crops [48].
In 2017, this cover crop, known for its predominantly erectophile architecture, was sown on May 17th. To measure AGB in the field (detailed by [14,15]), encompassing initial (lower measurable biomass) to advanced phenological stages (flowering) of Rye development, we designed a field experiment utilizing regular grids. Regularly spaced sample grids, measuring 0.5 m by 0.5 m, were positioned at half-hectare intervals, totaling 50 sampling points (Figure 1). Across the four dates of the field campaigns that coincided with orbital remote sensing data, a total number of 200 samples were then considered in the analysis. The Rye samples were harvested, collected, and subsequently transported to the laboratory for analysis on each collection date. Dry biomass determination was conducted by oven-drying the samples at 60 °C to eliminate moisture content. The experiment comprised four field campaigns conducted from 21 July to 2 September 2017, as indicated at the bottom of Figure 2 and Table 1.
The satellite data were acquired on dates closely matching the field campaigns (±3 days’ deviation), as indicated by the hatched area in Figure 2. The influence of time lags between satellite overpasses and field measurements was taken into account in the interpretation and discussion of the results. A time series comprising 19 cloud-free images captured by the PS satellite constellation was assessed, as indicated at the top of Figure 2, from which four were chosen to align with Sentinel-1 SAR data and the field measurements. The selection criteria involved a thorough visual evaluation, with only high-quality surface reflectance images being retained. The Planet Surface Reflectance product used in this work employs the 6S radiative transfer model for atmospheric correction, supplemented by ancillary data from the Moderate Resolution Imaging Spectroradiometer (MODIS), to correct for atmospheric scattering and absorption effects on the satellite signal. Estimates for water vapor, ozone, and aerosol are provided in the MOD09CMA, MOD09CMG, and MOD08D3 products, respectively.
From the sown date onwards, PS images from a Sun-synchronous orbit were obtained in 2017 (20 July to 2 September). These images were acquired with a view zenith angle below 5° (nadir viewing) in four spectral bands: blue (455–515 nm), green (500–590 nm), red (590–670 nm), and near-infrared (NIR) (780–860 nm). The nominal spatial resolution was 3.7 m. To align with the spatial resolution of the Sentinel-1 SAR data, the PS data were resampled to 10 m using the nearest neighbor resampling method. Additionally, a buffer of at least three pixels away from the crop border was implemented to take into account the spectral mixture. Two commonly used vegetation indices were computed from the PS data: NDVI [16] and EVI [17]. NDVI correlates more closely with pigment concentration, whereas EVI is more sensitive to vegetation structure, minimizing atmospheric and soil influences [46,47].
The SAR Sentinel-1 data were acquired via the Google Earth Engine platform (GEE), using the Sentinel-1 SAR GRD product, Interferometric Wide (IW) swath mode and descending orbit. Data from the C-band at a spatial resolution of 10 m for the four matching dates of PS were selected for analysis (middle of Figure 2). The Sentinel-1 SAR mission provides dual-polarization C-band data collected at 5.405 GHz (C band). Single co-polarization bands, namely VV and HH, were utilized, and the backscatter coefficient was converted to dB using the formula 10 × log10σ°. Prior to analysis, the data underwent preprocessing steps including border noise removal, elimination of thermal noise, radiometric calibration, Lee speckle filtering (5 × 5), and terrain correction. Additionally, band ratios and polarization indices were also computed. The GEE’s JavaScript code is available at the end of this manuscript for consultation.
Ancillary data included reanalysis of meteorological data to provide temperature and rainfall data during the experiment. Daily rainfall data were extracted from the daily accumulated precipitation (combined microwave–IR) estimate—Early Run (GPM_3IMERGDE v06) product [49,50]. The temperature was obtained from a 2 m air temperature—daily min (M2SDNXSLV v5.12.4) product [51]. Furthermore, Unmanned Aerial Vehicle (UAV) multispectral images were acquired during the growing season to complement the analysis.

2.3. Data Analysis

Initially, we assessed the relationships between AGB measurements, from each of the four fieldwork dates and meteorological data. We tracked the Rye AGB development over the growing cycle by comparing the changes in measured cover crop biomass with local variations in precipitation and temperature. To delve into the interrelations among variables, we generated Pearson’s correlation matrix, scatterplots, and histograms. Subsequently, we utilized multiple linear regression models to predict cover crop AGB, leveraging three distinct sets of satellite data: PS optical, SAR, and a combination of both (PS plus SAR) [40]. All variables were incorporated into a model using 50 samples per date, yielding a total of 200 samples. The sets of PlanetScope and Sentinel-1 SAR data without corresponding ground biomass were used for training and prediction purposes of the model. To match the ground samples with satellite data, we utilized the central coordinates obtained for each field point using a GNSS system with a positional accuracy of 3 m. Using these coordinates, we retrieved the PS and SAR data.
We computed out-of-sample error estimates to derive an unbiased and accurate prediction of error estimates. This involved randomly dividing the dataset into a training set (80%) for model fitting and a validation set (20%) for calculating absolute and relative Root Mean Square Error (RMSE). This process was iterated 100 times to obtain averages and confidence intervals for RMSE, facilitating dataset performance comparisons. To strengthen the validation of the model, we also employed k-fold cross-validation, dividing the 100 samples into five folds, resulting in 500 simulations.
Additionally, to capture the variables’ importance in the model, we implemented a stepwise Akaike Information Criterion (AIC) procedure. This autonomous selection method identified the optimal variables across 100 simulations. In sequence, it allowed us to obtain the frequency of variable selection in the final model. Finally, the best multiple linear regression models were inverted to show the spatial distribution at the farm of the predicted AGB of Rye on each one of the four dates of matched image acquisition by the PS and Sentinel-1 satellite constellations.
To highlight areas of the farm with low AGB increase over time (potential low productivity of cash crop), predicted values below the median biomass per date were computed. This analysis was also supported by using true color composites captured by the UAV in the early and late stages of Rye development.

3. Results

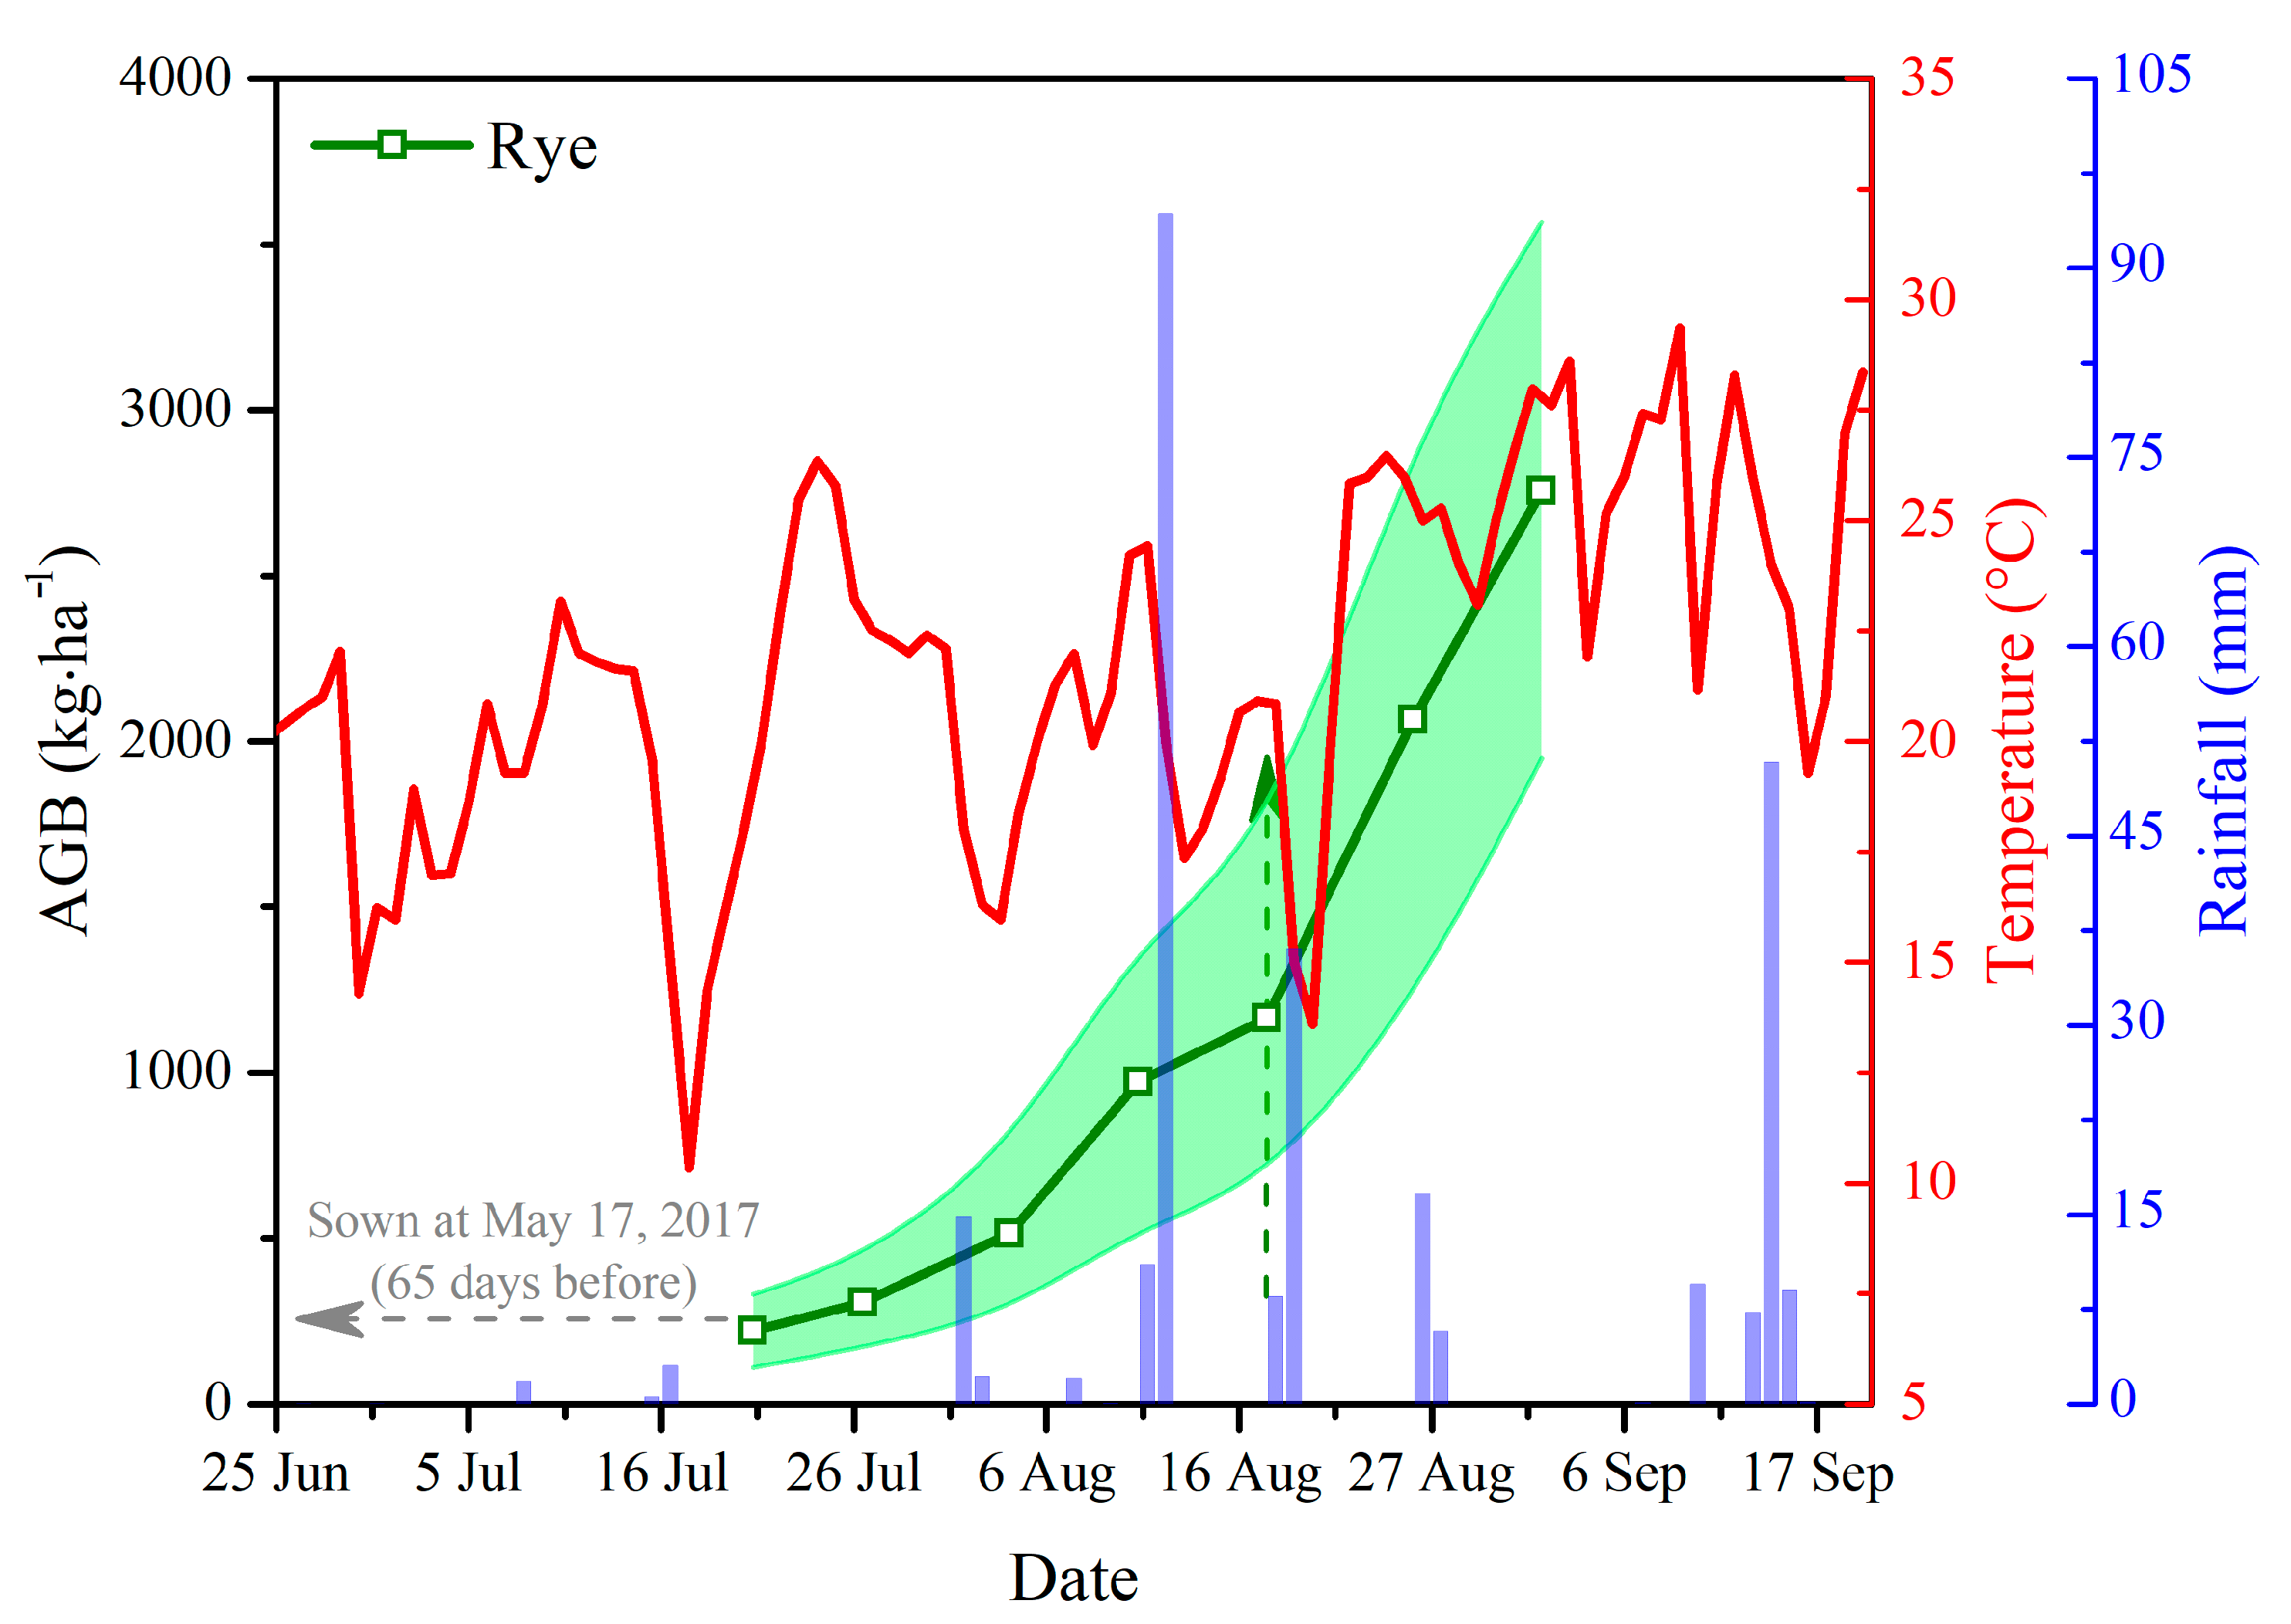
3.1. Relationships between Cover Crop Development and Reanalysis Data from Precipitation and Temperature

From 65 days after sowing and onward, field measurements depicted a consistent rise in Rye’s AGB, starting from 25 kg·ha−1 during the early stages of cover crop development (21 July) and peaking at 2700 kg·ha−1 during the flowering phenological stage (beginning of September, as illustrated in Figure 3). The prolonged period post-sowing (65 days) experienced minimal germination due to scant precipitation between June and July, partially shown by the blue columns in Figure 3. A notable rainfall event (90 mm) in mid-August marked the onset of a phase characterized by substantial AGB increments, as indicated by the green curve in Figure 3. Within a 20-day span starting August 16, green dashed arrow, Rye’s AGB surged markedly from 1000 to 2700 kg·ha−1, attributed to the combined effects of precipitation and temperature, which rose to approximately 25 °C transitioning from local winter to spring, as depicted by the red curve in Figure 3.

3.2. Relationships between Measured Rye AGB and Attributes from PlanetScope (PS) and Sentinel-1 SAR

As previously discussed, the AGB of Rye exhibited a notable increase from the initial measurement on 21 July (25 kg·ha−1) to the final measurement on 3 September (2700 kg·ha−1). Upon analyzing the variability in mean AGB values across the four corresponding dates of PS (Figure 4) and Sentinel-1 SAR (Figure 5) image availability, distinct patterns emerged in their respective attributes with the progression of cover crop development. Notably, all attributes displayed considerable variability, as evidenced by the standard deviation bars, reflecting the diverse responses observed across the 50 samples analyzed on each date.
Following the observed increase in mean AGB over time (Figure 4a), the mean reflectance in the visible bands (blue, green, and red as illustrated in Figure 4b–d) captured by the PS satellite constellation generally declined as the cover crop developed. In contrast, the NIR reflectance exhibited an upward trend toward the latter part of August (Figure 4e). Consequently, vegetation indices utilizing these spectral bands in their calculation (e.g., NDVI and EVI) demonstrated a progressive increase over time, aligning with the observed AGB gains in Rye (Figure 4f and Figure 4g, respectively). Tracking the progressive increase in mean AGB over time (Figure 5a), the Sentinel-1 SAR attributes VV (Figure 5b) and VH (Figure 5c) exhibited an initial rise from the first date of measurement (21 July) to the second date (24 August) of paired satellite acquisitions, followed by a decline as biomass increased toward 26 August. Conversely, the SAR Ratio (Figure 5d) and Pol (Figure 5e) demonstrated a consistent decrease as cover crop development progressed from July to August.
Among the suite of PS attributes (Figure 4) and Sentinel-1 SAR attributes (Figure 5), NDVI and EVI demonstrated inverse correlations with Ratio and Pol, with Pearson’s correlation coefficients (r) ranging from −0.57 to −0.59 at a significance level of 0.001 (Figure 6). Furthermore, with the exception of VH, all optical and SAR attributes exhibited some level of correlation with Rye AGB.
The strongest correlations with AGB were observed for EVI and NDVI (r = +0.67), revealing non-linear relationships with this biophysical parameter, as evident from their respective scatterplots (Figure 6). Consequently, EVI and NDVI exhibited non-linear increases with increasing AGB or cover crop development. In Figure 6, attributes are displayed on the X and Y axes to depict correlations among them. AGB is represented in kg/ha, while SAR data are presented as backscattering coefficients. Optical data pertain to surface reflectance. Vegetation indices and SAR ratios are dimensionless. Scatterplots illustrating relationships between variable pairs are also included. Among the Sentinel-1 SAR metrics, the highest correlations with Rye AGB were found for Ratio (r = −0.56) and Pol (r = −0.58), both of which also displayed non-linear relationships with this field-measured parameter (Figure 6).

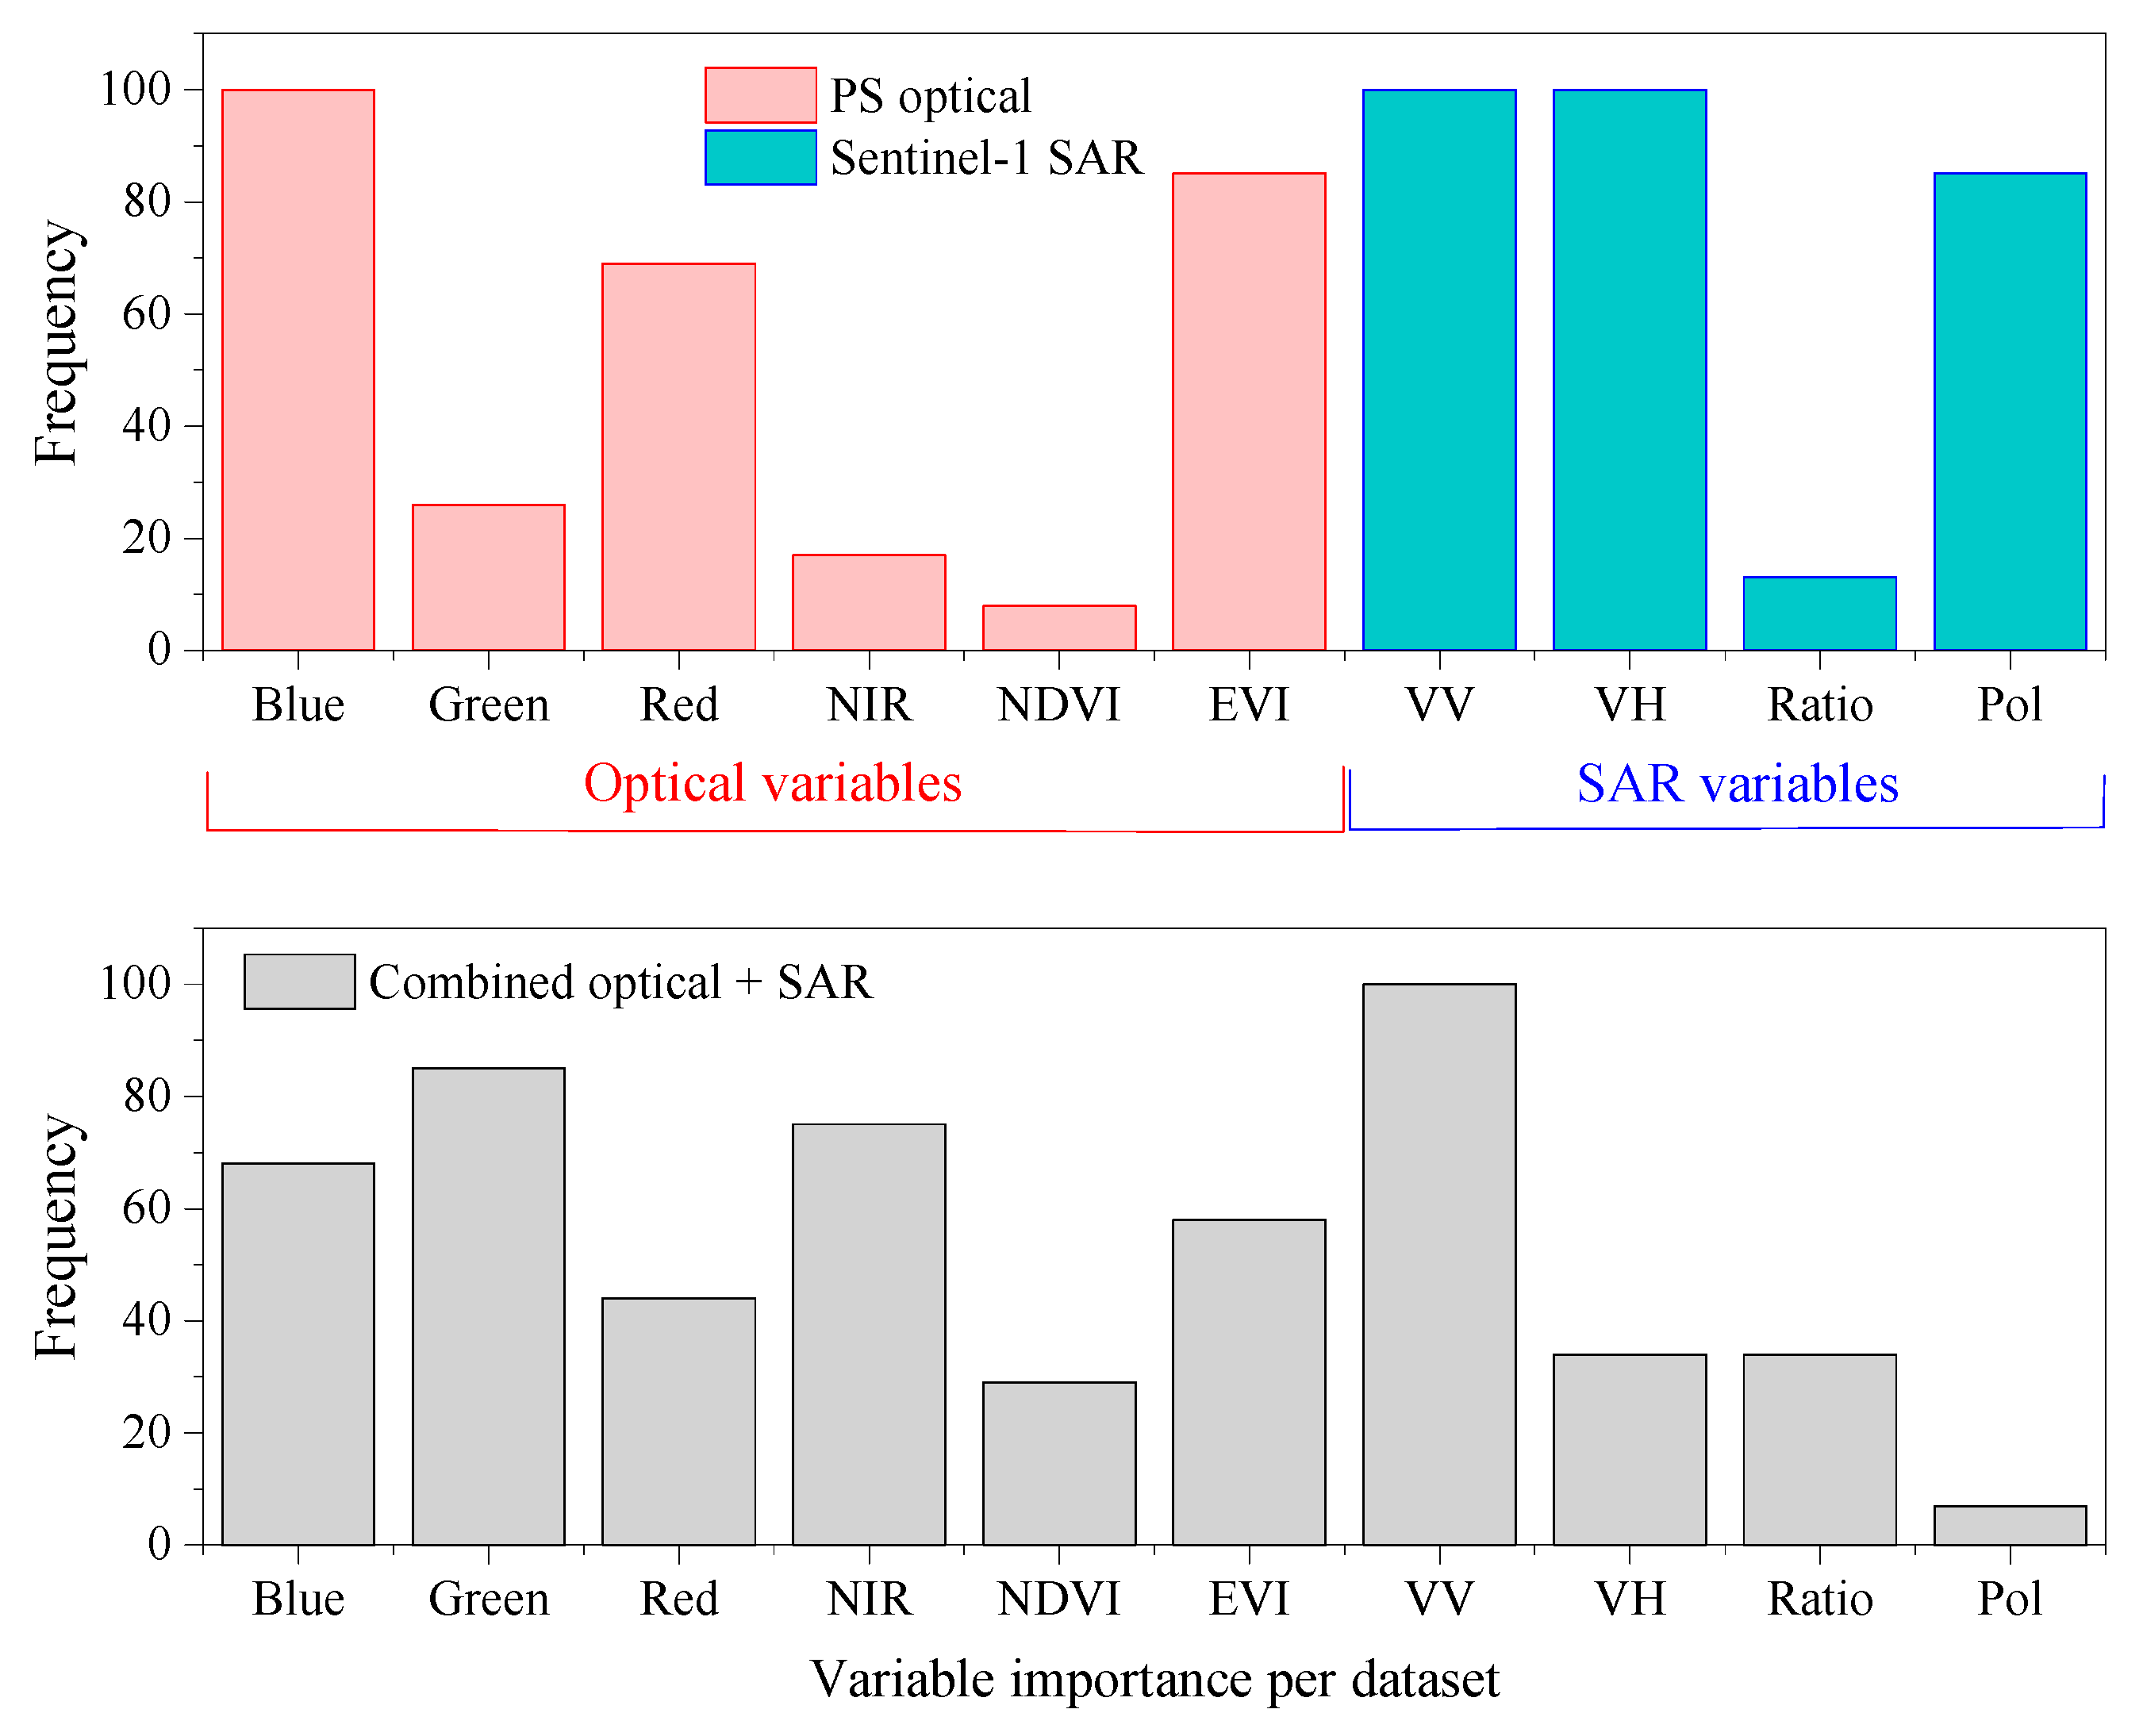
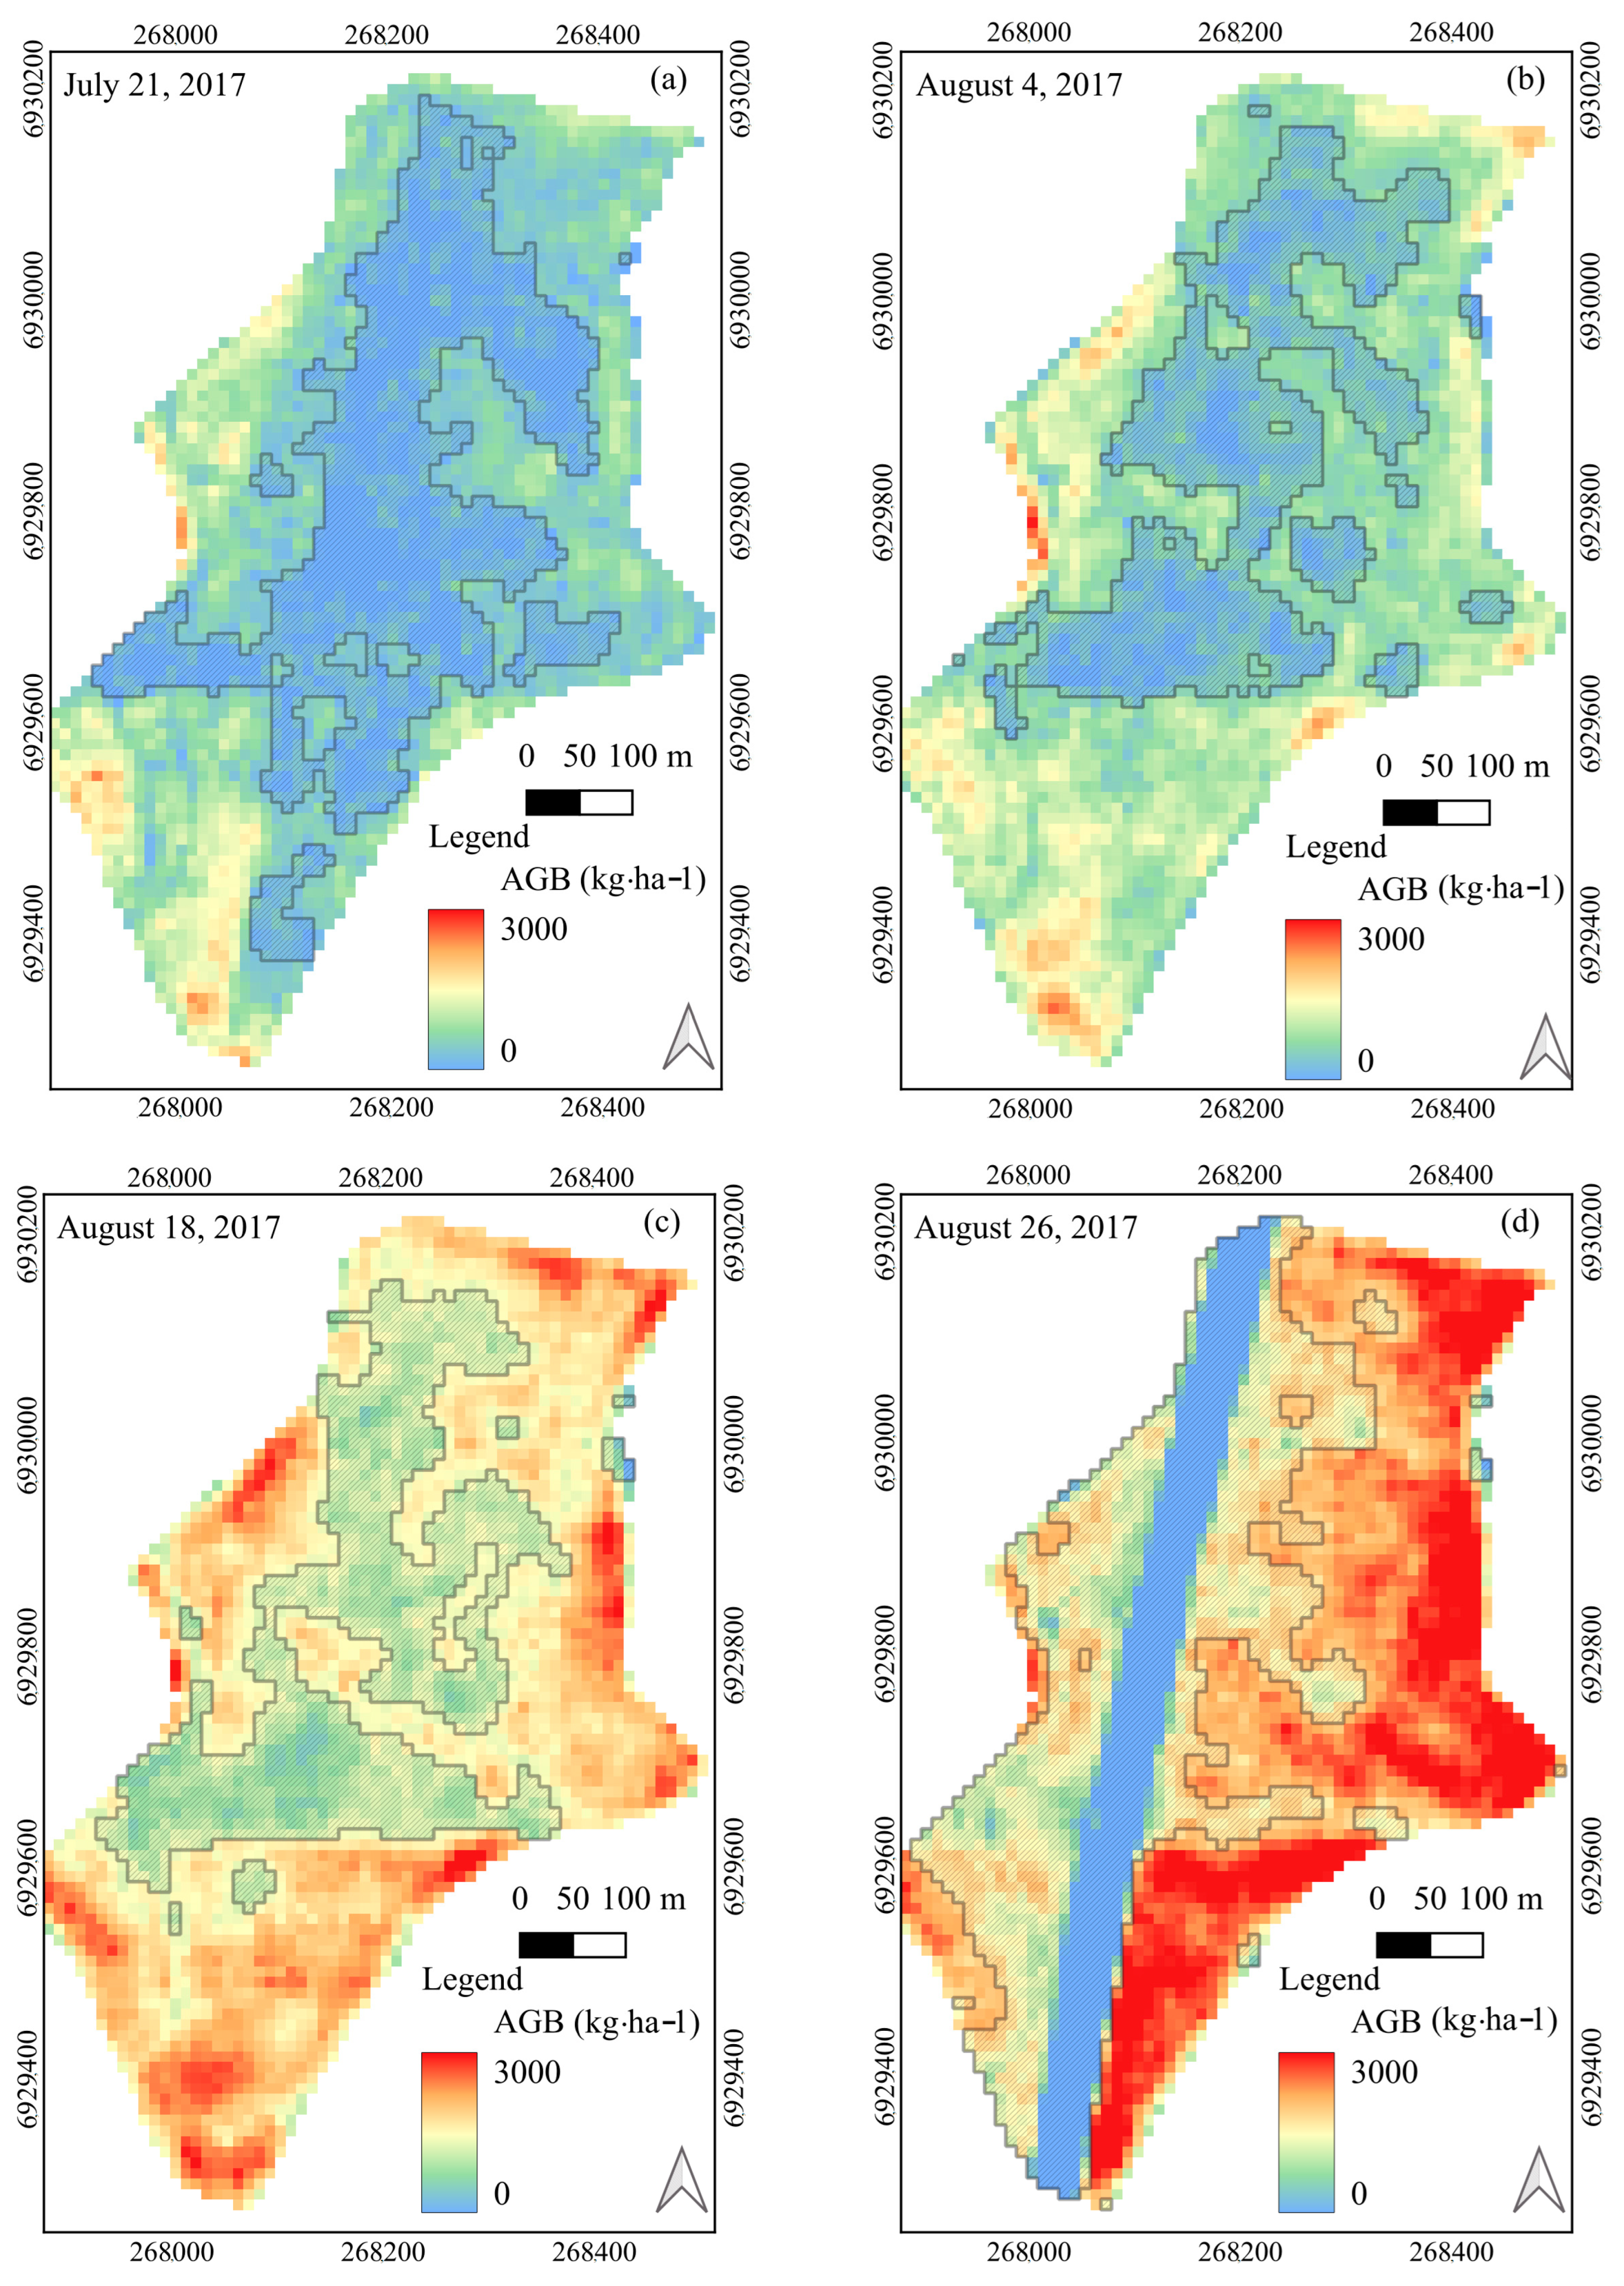
3.3. AGB Modeling Using Optical and SAR Attributes

The prediction of AGB Rye, using multiple linear regression and integrating both optical and SAR variables, revealed a notable enhancement in the coefficient of determination (R2 = 0.62), which was statistically significant (p < 0.01). This improvement contrasts with the individual models based solely on optical (R2 = 0.51) or SAR (R2 = 0.42) variables, as outlined in Table 2. Moreover, the combined use of these metrics demonstrated a significant reduction (p < 0.01) in the out-of-sample prediction error (%RMSE), diminishing from 64.2% to 57.9% (Figure 7). Complementarily, k-fold cross-validation reached the same results (Supplementary Table S1 and Figure S1).
Incorporating both PS optical and Sentinel-1 SAR data in the model, the most influential variables comprised VV, the reflectance of the green, NIR, and blue bands of PS, and the EVI (Figure 8). These variables featured prominently in the majority (>50%) of the simulated models examined. Conversely, in the optical dataset, blue, EVI, and red (reddish tones in Figure 8) emerged as the primary variables of importance. For the SAR dataset, VV, VH, and Pol assumed precedence as the most crucial variables (cyan in Figure 8). Even using k-fold cross-validation, the results did not change (Supplementary Table S2).
The scatterplot depicting predicted versus observed values reveals a trend where uncertainty escalates with higher predicted biomass values, as illustrated in Figure 9. Notably, no predicted values exceeded 3000 kg·ha−1, despite a few instances where observed biomass reached up to 4000 kg·ha−1. These atypical values can be attributed to a drought experienced during the early stages of the growing season.
The predicted AGB from multiple linear regression, using the combined optical-SAR model, confirmed the anticipated rise in biomass from the initial (21 July) to the final date (26 August) of coincident satellite data acquisition, as depicted in Figure 10a–d. Notably, the central and western portions of the studied area displayed comparatively lower AGB values compared to the eastern parts, a trend already evident from the first date (Figure 10a). Comparison of these results with the elevation data of Figure 1 and Supplementary Figure S2 reveals the topography dependence of this pattern. Low-elevation portions of the farm generally have greater amounts of Rye AGB than high-elevation areas. The consistency of these spatial differences in Rye AGB at the farm was confirmed through visual inspection of multi-temporal false color composites of UAV data. Such UAV composite images highlighted the visible disparities in areas with higher and lower cover crop development, as illustrated in Figure 11a and Figure 11b, respectively. Finally, the blue linear stripe in the study area in Figure 10d coincides with a chemical treatment applied locally to dissect plants.
Focusing on the last two dates, the difference in AGB estimates was calculated (AGB of 26 August minus AGB of 18 August) (Figure 12). In eight days, the eastern portion of the study area incorporated over one ton of AGB per hectare. Meanwhile, the dissected vertical patch area presented an AGB reduction as expected. Also, some patches in the western portion presented a reduction in AGB possibly due to the early development of Rye in such areas and because of the presence of weeds with different growth stages.

4. Discussion

The synergistic utilization of PS optical and Sentinel-1 SAR datasets represents a significant advancement in biomass estimation for cover crops such as Rye in southern Brazil. Our results were generally consistent with previous findings in the literature. For instance, by integrating optical and SAR (InSAR coherence) data to assess cereal grass biomass, Jennewein et al. [23] observed an 11% improvement in model performance for cereal Rye, yielding an R2 of 0.34. The same authors highlighted the season and species dependencies of model accuracy. Focusing on a specific season and cover crop species, we achieved an R2 of 0.625 (with an RMSE of 579.1 kg) through a combined optical-SAR model derived from multiple linear regression. Roth and Streit [52] utilized UAS optical data to estimate cover crop canopy height, subsequently predicting diverse cover crop biomass, resulting in an R2 of 0.58, consistent with the results of Wang et al. [53].
Our model shifted the saturation limit from 2000 kg·ha−1 reported by Jennewein et al. [23] to nearly 3000 kg·ha−1 for similar erectophile species, despite encountering underestimates at higher biomass levels (Figure 8). It is plausible that biomass estimates become saturated for values exceeding 3000 kg·ha−1. Additionally, several integration strategies targeting cash crop AGB estimates have achieved comparable accuracy levels, albeit with varying primary focuses across studies [37,38,40,44].
In composing the hybrid optical-SAR model, the SAR variable predominantly selected as a key predictor was VV backscattering, underscoring the significant contribution of SAR data to Rye AGB estimation. Interestingly, in the literature, this same predictor was emphasized in estimating rapeseed biomass by Mercier et al. [40]. These findings could be linked to the vertical structure of Rye, which enhances backscattering as the growing cycle progresses, as the vegetation density increases [54]. The prevalence of VV backscattering during the grow cycle could reduce the optical saturation concerns. Interestingly, Wang et al. [55] evaluated winter wheat phenology using additional polarimetric parameters based on the covariance matrix and a dual-pol-version H-α decomposition that are unfortunately not feasible from GRD Sentinel-1 products.
Among the optical PS attributes, blue and NIR were the primary spectral bands selected by the model as key predictors. Blue is typically associated with the photosynthetic activity of the plants (secondary photosynthesis system), while NIR is sensitive to variations in Rye canopy structure throughout the growing cycle and the subsequent increase in LAI. From the two vegetation indices considered here, EVI was more frequently captured than NDVI as a predictor variable in the simulated regression models. However, both indices were positively correlated with AGB (r = +0.67), as expected. These results suggest that the lower dependence on NIR saturation due to the greater transmittance of the canopy in this range of the electromagnetic spectrum is an important parameter to be considered.
In their integration of Sentinel-1 and 2 data, Jennewein et al. [23] identified red-edge-related vegetation indices and SAR interferometric coherence as the most important predictors. Similarly, other authors have recognized NDVI as a significant predictor of grass biomass [40,56], which is consistent with our spectral scenario analysis. However, our analysis was constrained by the absence of a red-edge band in the first generation of PlanetScope data. Fortunately, this limitation has been recently addressed with the launch of the third generation of Planet’s CubeSats (SuperDove), equipped with eight bands [16]. The SuperDove bands enable determination not only of conventional NDVI and EVI but also of other vegetation indices associated with red-edge, new foliage, and light use efficiency [57].
Our evaluation of the spatial distribution of Rye AGB throughout the growing cycles revealed zones with varying biomass levels, inversely correlated with topographic elevation, as deduced from the comparison between Figure 1 and Figure 9. Greater amounts of Rye AGB were observed at low-elevation areas of the farm compared to high-elevation terrains. Therefore, the AGB map delineation facilitated the identification of regions with differing productivity levels, aligning with earlier studies on management zone delineation [14,15]. Time-series analysis of biomass can prove instrumental in timely crop management. Our findings indicated that just 65 days after planting, the biomass map already highlighted areas with lower biomass content in the central and western regions, ultimately yielding less than those in the eastern areas. Conducting such analyses immediately after plantation can guide farmers in land management decisions, such as the judicious use of fertilizers and fostering more cost-efficient and sustainable land management practices. Our proposed methodology can deliver this support by taking advantage of the combined use of SAR and PS optical data to provide observations approximately every two weeks.
Thus, as canopy development progresses, multiple scattering intensifies, underscoring the significance of cover crop gaps in biomass modeling. The hatched areas in Figure 10 delineate distinct management zones within the experimental area. Leveraging AGB to define management zones enables more informed decisions prior to cash crop planting. Notably, regions with lower development are predominantly situated at higher elevations (Figure 1) and well-drained sections of the field. Additionally, these areas exhibit higher soil compaction and pH values [14].
In our study, it is important to address some constraints and opportunities associated with the experimental design. Firstly, only four dates were available for building the regression model, limiting the temporal scope of cover crop development. The time gap of up to three days between satellite overpasses and field AGB measurements may not capture rapid vegetation changes during Rye development. This could potentially lower the predictive accuracy of the AGB model, particularly over terrains more favorable to cover crop growth. Additionally, the study solely focused on evaluating an erectophile canopy (Rye). Although the approach can be extended to other cover crops, the selected predictors will probably differ in AGB estimates of cover crops with planophile architecture. Moreover, although our experiment utilized preprocessed GRD Sentinel-1 products, it is important to note that other SAR parameters can be derived from Single Look Complex (SLC) Sentinel-1 data, thereby refining the retrieval of biophysical information from the microwave range. Furthermore, linking SAR and optical responses to the roughness concentration index [58] derived from UAV-dense cloud data could offer valuable insights [59]. It is also advisable to conduct future research on the potential of using multi-frequency SAR data to retrieve AGB. In addition to employing multiple linear regression, alternative models could have also been explored for estimating Rye AGB. Nevertheless, prior research utilizing methods like Support Vector Machine (SVM), Cubist, and Random Forest (RF) has demonstrated comparable performance to multiple regression in this regard [14,15]. In our study, the cross-validation RMSE errors closely paralleled those reported for mixed-field mustard biomass estimation using various vegetation indices derived from Sentinel-2 optical images [12]. Integrating Sentinel-1 SAR, Sentinel-2 optical data, and temperature data within an ensemble-based framework notably enhanced the accuracy of the random forest (RF) model for crop time series [60].
Additionally, it is crucial to highlight the importance of studies exploring the integration with other optical data sources such as Sentinel-2, Landsat-8/9, and hyperspectral missions such as EnMAP (Environmental Mapping and Analysis Program) and PRISMA (PRecursore IperSpettrale della Missione Applicativa). Lastly, future studies should investigate the resampling of PS data from 3.7 m to 10 m spatial resolution to align with Sentinel-1 SAR data. A straightforward resampling procedure was applied here to the PS data for this purpose. This process minimizes spatial variability among adjacent pixels but may impact the accuracy of AGB estimates with field data.

5. Conclusions

The accuracy of cover crop AGB estimates experienced a notable improvement with the integration of PS optical and Sentinel-1 SAR data. Focusing on Rye, the hybrid model produced reductions of 11.8% and 5.5% in RMSE compared to using only SAR or optical models individually, respectively, resulting in an overall RMSE of 579.1 kg·ha−1 (R2 = 0.62; p < 0.01).
Upon independent variable importance evaluation, key predictors emerged, including spectral vegetation indices such as NDVI and EVI, alongside SAR parameters like VV backscattering, SAR Ratio, and polarimetry. In multiple simulations of the hybrid model, VV backscattering, NIR, and blue reflectance were the most frequently selected predictors.
The spatial distribution of estimated Rye AGB facilitated the identification of portions of the terrain exhibiting both lower and higher biomass levels, which have behaved as agricultural management zones for cash crop yield. This may aid in efficient fertilizer use, enhancing sustainable land management, and supporting pre-planting decisions.

Supplementary Materials

The following supporting information can be downloaded at: https://www.mdpi.com/article/10.3390/rs16152686/s1, Figure S1: Relative root mean square error (RMSE in %) to estimate Aboveground Biomass (AGB) of Rye using Sentinel-1 SAR attributes, PS optical metrics, and the combination of both sets of variables using K-fold cross-validation procedure, with 5 folds of 100 samples (500 simulations); Figure S2: Transect comparing elevation and the Rye AGB estimates in the four dates. The inlet figure shows the transect line over DEM in the spatial domain; Table S1: Performance of the multiple linear regression models in predicting Aboveground Biomass (AGB) of Rye, along with the corresponding root mean square error (RMSE) for individual datasets and their combined attributes. The reported values represent the average outcome of 500 simulations with RMSE calculated from k-fold cross-validation after splitting the 100 samples into five folds (500 simulations); Table S2: Variable importance per dataset was assessed based on the frequency of selection in the best model using a stepwise procedure across k-fold cross-validation, conducted with 5 folds over 100 samples. This approach involved a total of 500 simulations.

Author Contributions

Conceptualization, F.M.B., R.D. and L.S.G.; Data curation, F.M.B., Q.L. and W.G.; Formal analysis, F.M.B., R.D., L.S.G., P.d.C.B., E.F.B. and V.L.; Funding acquisition, F.M.B.; Investigation, F.M.B. and R.D.; Methodology, F.M.B., R.D., L.S.G., P.d.C.B. and V.L.; Project administration, F.M.B.; Software, R.D.; Supervision, L.S.G.; Validation, F.M.B. and R.D.; Visualization, F.M.B., Q.L., W.G., V.L. and T.V.M.S.; Writing—original draft, F.M.B. and R.D.; Writing—review and editing, F.M.B., L.S.G., P.d.C.B. and E.F.B., William Gaida, V.L. and T.V.M.S. All authors have read and agreed to the published version of the manuscript.

Funding

This research was funded by the Brazilian National Council for Scientific and Technological Development (CNPq) grant numbers 113769/2018-0, 309030/2017-0, 317538/2021-7, 305452/2023-1; Foundation for Research Support of the State of Rio Grande do Sul (FAPERGS), protocol number 23.830.388.22048.19092016; Fundação Araucária, grant PI 13/2022, protocol number UFP2022251000030; and Brazilian Federal Agency for Support and Evaluation of Graduate Education (CAPES). The APC was funded by MDPI.

Data Availability Statement

The Google Earth Engine script to process Sentinel-1 data is available at [https://code.earthengine.google.com/219fc3c05b8ae8132ae2d758ccba3d1e?noload=true] (accessed on 12 July 2024). Due to private company restrictions, the field and satellite data presented in this study are available on reasonable request from the corresponding author.

Acknowledgments

To all who helped in field data collection and to Fazenda Vila Morena for the agronomical information. To Planet Labs PBC and ESA for the imagery availability.

Conflicts of Interest

The authors declare no conflicts of interest.

References

  1. Cherubin, M.R.; Damian, J.M.; Tavares, T.R.; Trevisan, R.G.; Colaço, A.F.; Eitelwein, M.T.; Martello, M.; Inamasu, R.Y.; Pias, O.H.D.C.; Molin, J.P. Precision Agriculture in Brazil: The Trajectory of 25 Years of Scientific Research. Agriculture 2022, 12, 1882. [Google Scholar] [CrossRef]
  2. Koefender, J.; Schoffel, A.; Manfio, C.E.; Golle, D.P. Biomass and nutrient cycling by winter cover crops. Rev. Ceres 2016, 63, 816–821. [Google Scholar] [CrossRef]
  3. Tiecher, T.; Gubiani, E.; Santanna, M.A.; Veloso, M.G.; Calegari, A.; Canalli, L.B.D.S.; Finckh, M.R.; Caner, L.; dos Santos Rheinheimer, D. Effect of 26-years of soil tillage systems and winter cover crops on C and N stocks in a Southern Brazilian Oxisol. Rev. Bras. Ciência Solo 2020, 44, e0200029. [Google Scholar] [CrossRef]
  4. Thapa, V.R.; Ghimire, R.; Acosta-Martínez, V.; Marsalis, M.A.; Schipanski, M.E. Cover crop biomass and species composition affect soil microbial community structure and enzyme activities in semiarid cropping systems. Appl. Soil Ecol. 2021, 157, 103735. [Google Scholar] [CrossRef]
  5. Possamai, E.J.; Conceição, P.C.; Amadori, C.; Bartz, M.L.C.; Ralisch, R.; Vicensi, M.; Marx, E.F. Adoption of the no-tillage system in Paraná State: A (re)view. Rev. Bras. Ciência Solo 2022, 46, e0210104. [Google Scholar] [CrossRef]
  6. Gao, F.; Jennewein, J.; Hively, W.D.; Soroka, A.; Thieme, A.; Bradley, D.; Keppler, J.; Mirsky, S.; Akumaga, U. Near real-time detection of winter cover crop termination using harmonized Landsat and Sentinel-2 (HLS) to support ecosystem assessment. Sci. Remote Sens. 2023, 7, 100073. [Google Scholar] [CrossRef]
  7. Finney, D.M.; White, C.M.; Kaye, J.P. Biomass Production and Carbon/Nitrogen Ratio Influence Ecosystem Services from Cover Crop Mixtures. Agron. J. 2016, 108, 39–52. [Google Scholar] [CrossRef]
  8. Rosario-Lebron, A.; Leslie, A.W.; Yurchak, V.L.; Chen, G.; Hooks, C.R.R. Can winter cover crop termination practices impact weed suppression, soil moisture, and yield in no-till soybean [Glycine max (L.) Merr.]? Crop Prot. 2019, 116, 132–141. [Google Scholar] [CrossRef]
  9. MacLaren, C.; Swanepoel, P.; Bennett, J.; Wright, J.; Dehnen-Schmutz, K. Cover Crop Biomass Production Is More Important than Diversity for Weed Suppression. Crop Sci. 2019, 59, 733–748. [Google Scholar] [CrossRef]
  10. Blanco-Canqui, H.; Shaver, T.M.; Lindquist, J.L.; Shapiro, C.A.; Elmore, R.W.; Francis, C.A.; Hergert, G.W. Cover crops and ecosystem services: Insights from studies in temperate soils. Agron. J. 2015, 107, 2449–2474. [Google Scholar] [CrossRef]
  11. Wallander, S.; Smith, D.; Bowman, M.; Claassen, R. Cover Crop Trends, Programs, and Practices in the United States; EIB 222, U.S. Department of Agriculture, Economic Research Service, February 2021. Available online: https://www.ers.usda.gov/webdocs/publications/100551/eib-222.pdf?v=6917.2 (accessed on 12 July 2024).
  12. Goffart, D.; Curnel, Y.; Planchon, V.; Goffart, J.P.; Defourny, P. Field-scale assessment of Belgian winter cover crops biomass based on Sentinel-2 data. Eur. J. Agron. 2021, 126, 126278. [Google Scholar] [CrossRef]
  13. Melo Damian, J.; De Castro Pias, O.H.; Santi, A.L.; Di Virgilio, N.; Berghetti, J.; Barbanti, L.; Martelli, R. Delineating management zones for precision agriculture applications: A case study on wheat in sub-tropical Brazil. Ital. J. Agron. 2016, 11, 171–179. [Google Scholar] [CrossRef]
  14. Breunig, F.M.; Galvão, L.S.; Dalagnol, R.; Dauve, C.E.; Parraga, A.; Santi, A.L.; Della Flora, D.P.; Chen, S. Delineation of management zones in agricultural fields using cover–crop biomass estimates from PlanetScope data. Int. J. Appl. Earth Obs. Geoinf. 2020, 85, 102004. [Google Scholar] [CrossRef]
  15. Breunig, F.M.; Galvão, L.S.; Dalagnol, R.; Santi, A.L.; Della Flora, D.P.; Chen, S. Assessing the effect of spatial resolution on the delineation of management zones for smallholder farming in southern Brazil. Remote Sens. Appl. Soc. Environ. 2021, 19, 100325. [Google Scholar] [CrossRef]
  16. Planet Labs PBC. PlanetScope Product Specifications; Planet Labs PBC: San Francisco, CA, USA, 2023. [Google Scholar]
  17. ESA. Copernicus Programme—Sentinel-1. In SentiWiki—General Information—Document Library; ESA: Paris, France, 2023. [Google Scholar]
  18. Rouse, J.W.; Hass, R.H.; Schell, J.A.; Deering, D.W. Monitoring vegetation systems in the great plains with ERTS. In Proceedings of the Third Earth Resources Technology Satellite (ERTS) Symposium, Washington, DC, USA, 10–14 December 1973; NASA: Washington, DC, USA, 1973; Volume 1, pp. 309–317. [Google Scholar]
  19. Huete, A.; Didan, K.; Miura, T.; Rodriguez, E.P.; Gao, X.; Ferreira, L.G. Overview of the radiometric and biophysical performance of the MODIS vegetation indices. Remote Sens. Environ. 2002, 83, 195–213. [Google Scholar] [CrossRef]
  20. Atzberger, C. Advances in remote sensing of agriculture: Context description, existing operational monitoring systems and major information needs. Remote Sens. 2013, 5, 949–981. [Google Scholar] [CrossRef]
  21. Gitelson, A. Towards a generic approach to remote non-invasive estimation of foliar carotenoid-to-chlorophyll ratio. J. Plant Physiol. 2020, 252, 153227. [Google Scholar] [CrossRef] [PubMed]
  22. Gaida, W.; Breunig, F.M.; Balbinot, R.; Galvao, L.S.; de Moura, Y.M. Directional effects on the spectral response of Pinus elliottii stands cultivated in subtropical latitudes. RAEGA O Espaço Geográfico em Análise 2023, 56, 140–161. [Google Scholar] [CrossRef]
  23. Jennewein, J.S.; Lamb, B.T.; Hively, W.D.; Thieme, A.; Thapa, R.; Goldsmith, A.; Mirsky, S.B. Integration of Satellite-Based Optical and Synthetic Aperture Radar Imagery to Estimate Winter Cover Crop Performance in Cereal Grasses. Remote Sens. 2022, 14, 2077. [Google Scholar] [CrossRef]
  24. Houborg, R.; McCabe, M.; Houborg, R.; McCabe, M.F. Daily Retrieval of NDVI and LAI at 3 m Resolution via the Fusion of CubeSat, Landsat, and MODIS Data. Remote Sens. 2018, 10, 890. [Google Scholar] [CrossRef]
  25. Houborg, R.; McCabe, M.F. High-Resolution NDVI from planet’s constellation of earth observing nano-satellites: A new data source for precision agriculture. Remote Sens. 2016, 8, 768. [Google Scholar] [CrossRef]
  26. Shi, Y.; Huang, W.; Ye, H.; Ruan, C.; Xing, N.; Geng, Y.; Dong, Y.; Peng, D. Partial least square discriminant analysis based on normalized two-stage vegetation indices for mapping damage from rice diseases using planetscope datasets. Sensors 2018, 18, 1901. [Google Scholar] [CrossRef] [PubMed]
  27. Asner, G.P. Cloud cover in Landsat observations of the Brazilian Amazon. Int. J. Remote Sens. 2001, 22, 3855–3862. [Google Scholar] [CrossRef]
  28. Sano, E.E.; Ferreira, L.G.; Asner, G.P.; Steinke, E.T. Spatial and temporal probabilities of obtaining cloud-free Landsat images over the Brazilian tropical savanna. Int. J. Remote Sens. 2007, 28, 2739–2752. [Google Scholar] [CrossRef]
  29. Corbane, C.; Politis, P.; Kempeneers, P.; Simonetti, D.; Soille, P.; Burger, A.; Pesaresi, M.; Sabo, F.; Syrris, V.; Kemper, T. A global cloud free pixel- based image composite from Sentinel-2 data. Data Br. 2020, 31, 105737. [Google Scholar] [CrossRef] [PubMed]
  30. Zhang, W.; Zhao, L.; Li, Y.; Shi, J.; Yan, M.; Ji, Y. Forest Above-Ground Biomass Inversion Using Optical and SAR Images Based on a Multi-Step Feature Optimized Inversion Model. Remote Sens. 2022, 14, 1608. [Google Scholar] [CrossRef]
  31. Shao, Z.; Zhang, L. Estimating forest aboveground biomass by combining optical and SAR data: A case study in genhe, inner Mongolia, China. Sensors 2016, 16, 834. [Google Scholar] [CrossRef] [PubMed]
  32. Tavasoli, N.; Arefi, H. Comparison of Capability of SAR and Optical Data in Mapping Forest above Ground Biomass Based on Machine Learning. Environ. Sci. Proc. 2021, 5, 13. [Google Scholar]
  33. Debastiani, A.B.; Sanquetta, C.R.; Corte, A.P.D.; Rex, F.E.; Pinto, N.S. Evaluating SAR-optical sensor fusion for aboveground biomass estimation in a Brazilian tropical forest. Ann. For. Res. 2019, 62, 109–122. [Google Scholar] [CrossRef]
  34. Heinrich, V.H.A.; Vancutsem, C.; Dalagnol, R.; Rosan, T.M.; Fawcett, D.; Silva-Junior, C.H.L.; Cassol, H.L.G.; Achard, F.; Jucker, T.; Silva, C.A.; et al. The carbon sink of secondary and degraded humid tropical forests. Nature 2023, 615, 436–442. [Google Scholar] [CrossRef] [PubMed]
  35. Araza, A.; de Bruin, S.; Herold, M.; Quegan, S.; Labriere, N.; Rodriguez-Veiga, P.; Avitabile, V.; Santoro, M.; Mitchard, E.T.A.; Ryan, C.M.; et al. A comprehensive framework for assessing the accuracy and uncertainty of global above-ground biomass maps. Remote Sens. Environ. 2022, 272, 112917. [Google Scholar] [CrossRef]
  36. Rodríguez-Veiga, P.; Barbosa-Herrera, A.P.; Barreto-Silva, J.S.; Bispo, P.C.; Cabrera, E.; Capachero, C.; Galindo, G.; Gou, Y.; Moreno, L.M.; Louis, V.; et al. Mapping the spatial distribution of Colombia’s forest aboveground biomass using SAR and optical data. Int. Arch. Photogramm. Remote Sens. Spat. Inf. Sci. ISPRS Arch. 2019, 42, 57–60. [Google Scholar] [CrossRef]
  37. Hosseini, M.; McNairn, H.; Mitchell, S.; Dingle Robertson, L.; Davidson, A.; Homayouni, S. Synthetic aperture radar and optical satellite data for estimating the biomass of corn. Int. J. Appl. Earth Obs. Geoinf. 2019, 83, 101933. [Google Scholar] [CrossRef]
  38. Hosseini, M.; McNairn, H.; Mitchell, S.; Davidson, A.; Robertson, L.D. Combination of optical and SAR sensors for monitoring biomass over corn fields. In Proceedings of the International Geoscience and Remote Sensing Symposium (IGARSS), Valencia, Spain, 22–27 July 2018; IEEE: New York, NY, USA, 2018; Volume 2018-July, pp. 5952–5955. [Google Scholar]
  39. Alebele, Y.; Zhang, X.; Wang, W.; Yang, G.; Yao, X.; Zheng, H.; Zhu, Y.; Cao, W.; Cheng, T. Estimation of Canopy Biomass Components in Paddy Rice from Combined Optical and SAR Data Using Multi-Target Gaussian Regressor Stacking. Remote Sens. 2020, 12, 2564. [Google Scholar] [CrossRef]
  40. Mercier, A.; Betbeder, J.; Baudry, J.; Denize, J.; Leroux, V.; Roger, J.-L.; Spicher, F.; Hubert-Moy, L. Evaluation of Sentinel-1 and -2 time series to derive crop phenology and biomass of wheat and rapeseed: Northen France and Brittany case studies. In Remote Sensing for Agriculture, Ecosystems, and Hydrology XXI; Neale, C.M., Maltese, A., Eds.; SPIE: Bellingham, WA, USA, 2019; p. 2. [Google Scholar]
  41. Holtgrave, A.-K.; Lobert, F.; Erasmi, S.; Röder, N.; Kleinschmit, B. Grassland mowing event detection using combined optical, SAR, and weather time series. Remote Sens. Environ. 2023, 295, 113680. [Google Scholar] [CrossRef]
  42. Dos Reis, A.A.; Werner, J.P.S.; Silva, B.C.; Figueiredo, G.K.D.A.; Antunes, J.F.G.; Esquerdo, J.C.D.M.; Coutinho, A.C.; Lamparelli, R.A.C.; Rocha, J.V.; Magalhães, P.S.G. Monitoring pasture aboveground biomass and canopy height in an integrated crop-livestock system using textural information from planetscope imagery. Remote Sens. 2020, 12, 2534. [Google Scholar] [CrossRef]
  43. Bretas, I.L.; Valente, D.S.M.; Silva, F.F.; Chizzotti, M.L.; Paulino, M.F.; D’Áurea, A.P.; Paciullo, D.S.C.; Pedreira, B.C.; Chizzotti, F.H.M. Prediction of aboveground biomass and dry-matter content in brachiaria pastures by combining meteorological data and satellite imagery. Grass Forage Sci. 2021, 76, 340–352. [Google Scholar] [CrossRef]
  44. Toro, A.P.S.G.D.D.; Bueno, I.T.; Werner, J.P.S.; Antunes, J.F.G.; Lamparelli, R.A.C.; Coutinho, A.C.; Esquerdo, J.C.D.M.; Magalhães, P.S.G.; Figueiredo, G.K.D.A. SAR and Optical Data Applied to Early-Season Mapping of Integrated Crop–Livestock Systems Using Deep and Machine Learning Algorithms. Remote Sens. 2023, 15, 1130. [Google Scholar] [CrossRef]
  45. Quintarelli, V.; Radicetti, E.; Allevato, E.; Stazi, S.R.; Haider, G.; Abideen, Z.; Bibi, S.; Jamal, A.; Mancinelli, R. Cover Crops for Sustainable Cropping Systems: A Review. Agriculture 2022, 12, 2076. [Google Scholar] [CrossRef]
  46. Damian, J.M.; Santi, A.L.; Fornari, M.; Da Ros, C.O.; Eschner, V.L. Monitoring variability in cash-crop yield caused by previous cultivation of a cover crop under a no-tillage system. Comput. Electron. Agric. 2017, 142, 607–621. [Google Scholar] [CrossRef]
  47. Alvares, C.A.; Stape, J.L.; Sentelhas, P.C.; De Moraes Gonçalves, J.L.; Sparovek, G. Köppen’s climate classification map for Brazil. Meteorol. Z. 2013, 22, 711–728. [Google Scholar] [CrossRef] [PubMed]
  48. do Nascimento, A., Jr.; Sattler, A.; Lorini, I.; Denardin, S.W.J.E.; Fernandes, J.M.C.; Salvadori, J.R.; Vargas, L.; da Silva Pereira, P.R.V.; Spera, S.T. Centeio (in Portuguese): Rye; Passo Fundo, Brasil: EMBRAPA-Empresa Brasileira de Pesquisa Agropecuária (unidade Trigo), 2021. Available online: https://www.embrapa.br/en/agencia-de-informacao-tecnologica/cultivos/centeio/equipe-editorial (accessed on 12 July 2024).
  49. Huffman, G.J.; Stocker, E.F.; Bolvin, D.T.; Nelkin, E.J.; Tan, J. GPM IMERG Final Precipitation L3 Half Hourly 0.1 degree x 0.1 degree V06 (GPM_3IMERGHH). In Goddard Earth Sciences Data and Information Services Center (GES DISC); NASA/GSFC/SED/ESD/GCDC/GESDIC: Greenbelt, MD, USA, 2019. Available online: https://catalog.data.gov/dataset/gpm-imerg-final-precipitation-l3-half-hourly-0-1-degree-x-0-1-degree-v06-gpm-3imerghh-at-g (accessed on 12 July 2024).
  50. Huffman, G.J.; Stocker, E.F.; Bolvin, D.T.; Nelkin, E.J.; Tan, J. Global Precipitation Measurement GPM IMERG Late Precipitation L3 Half Hourly 0.1 degree x 0.1 degree V06 (GPM_3IMERGHHL). Atmospheric Composition, Water & Energy Cycles and Climate Variability; NASA/GSFC/SED/ESD/GCDC/GESDIC: Greenbelt, MD, USA, 2021. Available online: https://catalog.data.gov/dataset/gpm-imerg-late-precipitation-l3-half-hourly-0-1-degree-x-0-1-degree-v06-gpm-3imerghhl-at-g (accessed on 12 July 2024).
  51. Gelaro, R.; McCarty, W.; Suárez, M.J.; Todling, R.; Molod, A.; Takacs, L.; Randles, C.A.; Darmenov, A.; Bosilovich, M.G.; Reichle, R.; et al. The modern-era retrospective analysis for research and applications, version 2 (MERRA-2). J. Clim. 2017, 30, 5419–5454. [Google Scholar] [CrossRef] [PubMed]
  52. Roth, L.; Streit, B. Predicting cover crop biomass by lightweight UAS-based RGB and NIR photography: An applied photogrammetric approach. Precis. Agric. 2018, 19, 93–114. [Google Scholar] [CrossRef]
  53. Wang, J.; Xiao, X.; Bajgain, R.; Starks, P.; Steiner, J.; Doughty, R.B.; Chang, Q. Estimating leaf area index and aboveground biomass of grazing pastures using Sentinel-1, Sentinel-2 and Landsat images. ISPRS J. Photogramm. Remote Sens. 2019, 154, 189–201. [Google Scholar] [CrossRef]
  54. Veloso, A.; Mermoz, S.; Bouvet, A.; Le Toan, T.; Planells, M.; Dejoux, J.-F.; Ceschia, E. Understanding the temporal behavior of crops using Sentinel-1 and Sentinel-2-like data for agricultural applications. Remote Sens. Environ. 2017, 199, 415–426. [Google Scholar] [CrossRef]
  55. Wang, M.; Wang, L.; Guo, Y.; Cui, Y.; Liu, J.; Chen, L.; Wang, T.; Li, H. A Comprehensive Evaluation of Dual-Polarimetric Sentinel-1 SAR Data for Monitoring Key Phenological Stages of Winter Wheat. Remote Sens. 2024, 16, 1659. [Google Scholar] [CrossRef]
  56. Reddersen, B.; Fricke, T.; Wachendorf, M. A multi-sensor approach for predicting biomass of extensively managed grassland. Comput. Electron. Agric. 2014, 109, 247–260. [Google Scholar] [CrossRef]
  57. Galvão, L.S.; Arlanche Petri, C.; Dalagnol, R. Coupled effects of solar illumination and phenology on vegetation index determination: An analysis over the Amazonian forests using the SuperDove satellite constellation. GIScience Remote Sens. 2024, 61, 2290354. [Google Scholar] [CrossRef]
  58. Sampaio, T.V.M.; Augustin, C.H.R.R. Índice de concentração da rugosidade: Uma nova proposta metodológica para o mapeamento e quantificação da dissecação do relevo como subsídio a cartografia geomorfológica. Rev. Bras. Geomorfol. 2014, 15, 47–60. [Google Scholar] [CrossRef]
  59. Kümmerer, R.; Noack, P.O.; Bauer, B. Using High-Resolution UAV Imaging to Measure Canopy Height of Diverse Cover Crops and Predict Biomass. Remote Sens. 2023, 15, 1520. [Google Scholar] [CrossRef]
  60. Chen, D.; Hu, H.; Liao, C.; Ye, J.; Bao, W.; Mo, J.; Wu, Y.; Dong, T.; Fan, H.; Pei, J. Crop NDVI time series construction by fusing Sentinel-1, Sentinel-2, and environmental data with an ensemble-based framework. Comput. Electron. Agric. 2023, 215, 108388. [Google Scholar] [CrossRef]
Figure 1. Location of the study area, cultivated with Rye, in southern Brazil (Vila Morena farm). A total of 50 samples were systematically distributed across every half-hectare. Throughout the experiment, seven field campaigns were conducted in 2017. Tri-dimensional perspectives of UAV RGB dense-cloud are shown for the early and late growing season. The UAV-derived DEM is also depicted.
Remotesensing 16 02686 g001
Figure 2. The timeline illustrates the field data campaigns conducted for Rye Aboveground Biomass (AGB) measurements, positioned at the bottom of the figure (blue). PlanetScope (black) and Sentinel-1 SAR (red) data acquired during the 2017 cover crop winter cycle are depicted at the top and middle of the figure, respectively. The hatched area indicates the matching periods of satellite data acquisition adopted for analysis.
Remotesensing 16 02686 g002
Figure 3. Relationships between field measurements of Aboveground Biomass (AGB) of Rye, gathered from seven campaigns in 2017 (represented by symbols in the green curve ± standard deviation), and reanalysis data of daily rainfall (depicted by blue columns) and mean temperature (illustrated by the red line). At the Vila Morena farm, there was a notable surge in cover crop AGB following significant rainfall in mid-August, coupled with the general rise in temperature transitioning from local winter to spring. The sowing date is also indicated for reference.
Remotesensing 16 02686 g003
Figure 4. Per-sample point values variations in (a) field-measured Aboveground Biomass (AGB) of Rye and in the reflectance of the (b) blue, (c) green, (d) red, and (e) near-infrared (NIR) bands of PlanetScope. Results for the Normalized Difference Vegetation Index (NDVI) and Enhanced Vegetation Index (EVI) are shown in (f,g), respectively. All results are shown across the four dates coinciding with the availability of both PS and Sentinel-1 SAR images.
Remotesensing 16 02686 g004
Figure 5. Per-sample point values variations in (a) field-measured Aboveground Biomass (AGB) of Rye and in the Sentinel-1 SAR attributes (b) VV, (c) VH, (d) ratio, and (e) polarization. All results are shown across the four dates coinciding with the availability of both PS and Sentinel-1 SAR images.
Remotesensing 16 02686 g005
Figure 6. Pearson’s correlation matrix for the relationships between field-measured Aboveground Biomass (AGB; kg·ha−1) of Rye on the four dates (n = 200 samples), PlanetScope optical attributes, and Sentinel-1 SAR metrics. Data distribution is shown by histograms. Statistical significance levels are indicated by asterisks: * (0.05), ** (0.01), and *** (0.001).
Remotesensing 16 02686 g006
Figure 7. Relative root mean square error (RMSE in %) to estimate Aboveground Biomass (AGB) of Rye using Sentinel-1 SAR attributes, PS optical metrics, and the combination of both sets of variables.
Remotesensing 16 02686 g007
Figure 8. Variable importance per dataset, with values indicating the frequency (%) at which each variable was selected in the best model using a stepwise procedure across 100 simulations.
Remotesensing 16 02686 g008
Figure 9. Predicted versus observed Aboveground Biomass (AGB) of Rye for the multiple linear regression model combining PlanetScope (PS) optical attributes with Sentinel-1 SAR metrics. The results were derived using the validation dataset.
Remotesensing 16 02686 g009
Figure 10. Aboveground Biomass (AGB) map of Rye, derived from the combined optical-SAR multiple regression model, for the four coincident satellite data acquisition dates: (a) 21 July 2017; (b) 4 August 2017; (c) 18 August 2017 and; (d) 26 August 2017. Differences in the spatial occurrence of the predicted AGB are discussed in the text. Hatched areas correspond to areas with AGB that have less than the median value for the corresponding date. In (d), the stripe in blue corresponds to a portion of the farm submitted to chemical treatment.
Remotesensing 16 02686 g010
Figure 11. UAV true-color composites for (a) the early stage of Rye development on 10 August 2017 and (b) the late stage of maximum biomass development on 31 August 2017. RGB channels correspond to UAV bands centered at 660 nm, 550 nm, and 450 nm, respectively (X3 camera). The magenta rectangle refers to the location in Figure 1.
Remotesensing 16 02686 g011
Figure 12. Difference map of Aboveground Biomass (AGB) estimates of 18 August 2017 (Figure 10c) and 26 August 2017 (Figure 10d). Reddish tones indicate AGB increase and blue tones indicate AGB decrease. White areas indicate low AGB variation (±100 kg·ha−1). The background is a Google satellite true color composite image.
Remotesensing 16 02686 g012
Table 1. List of the dates of fieldwork campaigns and satellite data acquisition by PlanetScope and Sentinel-1 SAR.
Date FieldworkPlanetScope Sentinel-1 SAR
Campaign 121 July 201722 July 201721 July 2017
Campaign 24 August 20175 August 20174 August 2017
Campaign 318 August 201714 August 201718 August 2017
Campaign 426 August 201726 August 201726 August 2017
Table 2. Performance of the multiple linear regression models in predicting Above Ground Biomass (AGB) of Rye, along with the corresponding root mean square error (RMSE) for individual datasets and their combined attributes. The reported values represent the average outcome of 100 simulations, with RMSE calculated out-of-sample.
DatasetR2RMSE (kg·ha−1)RMSE (%)
Combined Optical + SAR0.63579.157.9
Combined Optical + SAR_Step0.62582.058.2
Sentinel-1 SAR0.42696.969.7
Sentinel-1 SAR_Step0.42695.169.5
Optical PS0.51642.464.2
Optical PS_Step0.50637.163.6
Disclaimer/Publisher’s Note: The statements, opinions and data contained in all publications are solely those of the individual author(s) and contributor(s) and not of MDPI and/or the editor(s). MDPI and/or the editor(s) disclaim responsibility for any injury to people or property resulting from any ideas, methods, instructions or products referred to in the content.

