


Agent-Based Spatial Dynamic Modeling of Diatraea saccharalis and the Natural Parasites Cotesia flavipes and Trichogramma galloi in Sugarcane Crops

 ,
,  , , ,
, , ,
Abstract
:
1. Introduction
2. Materials and Methods
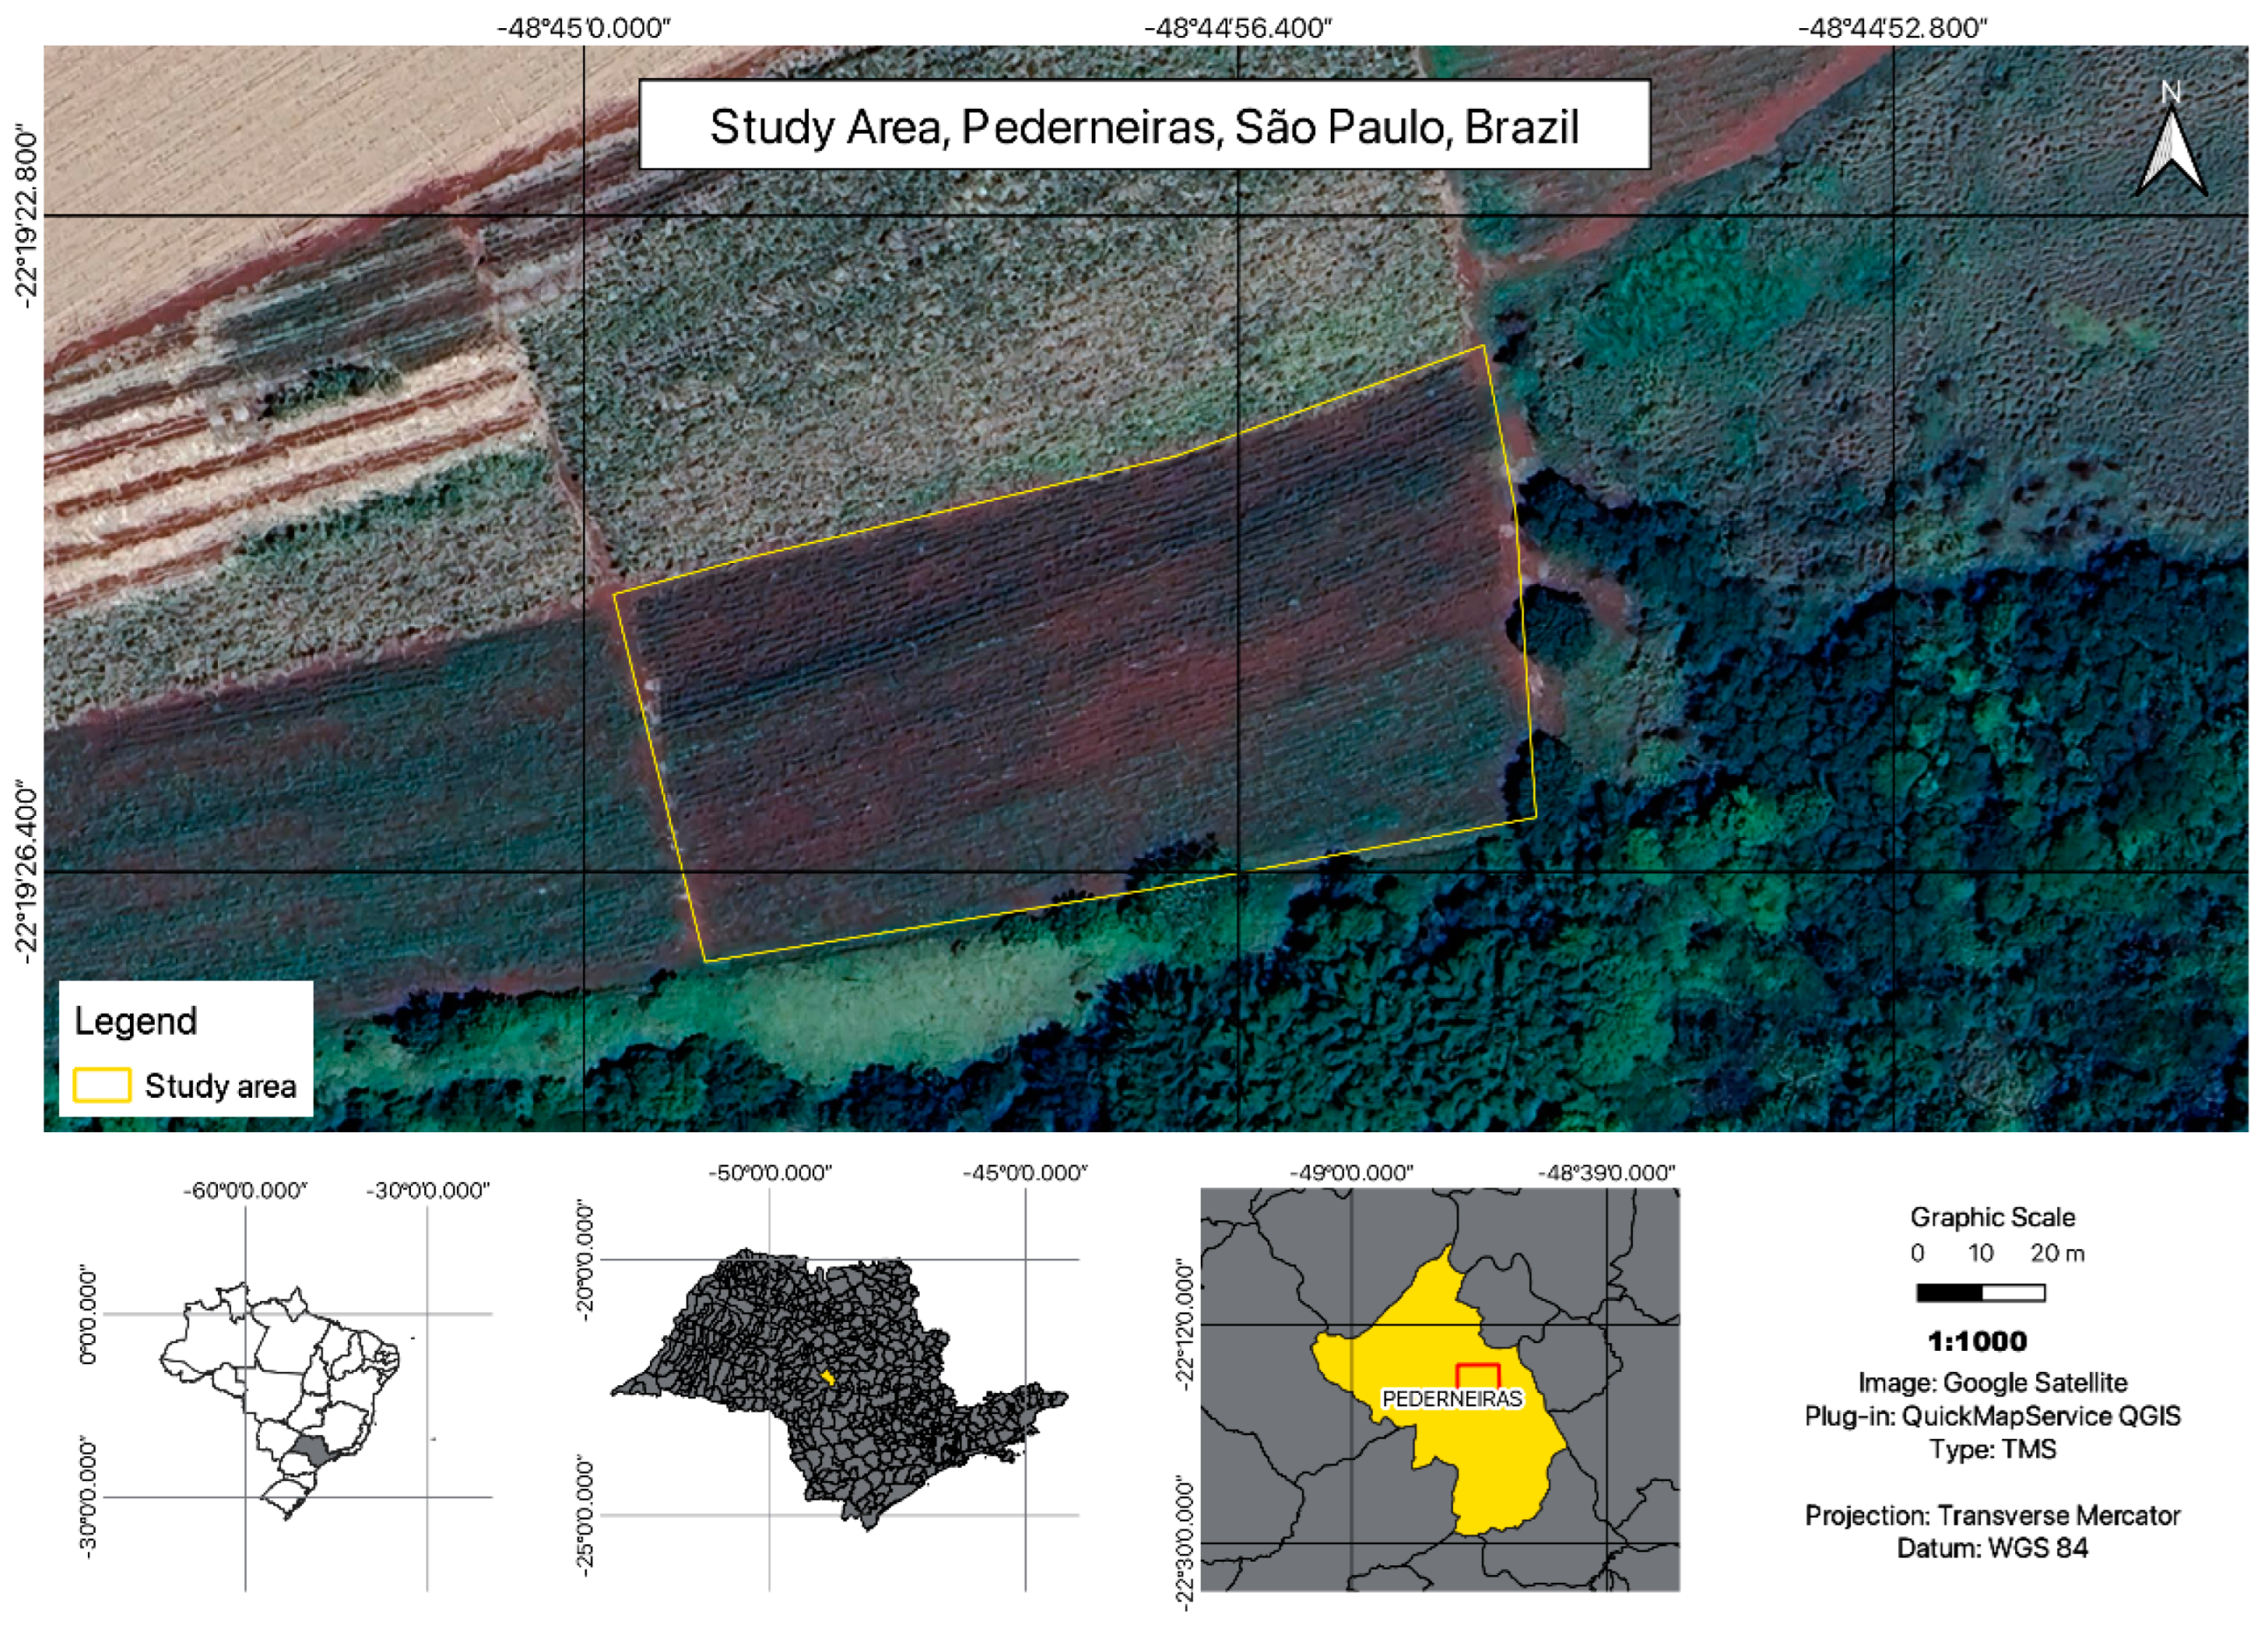
2.1. Study Area
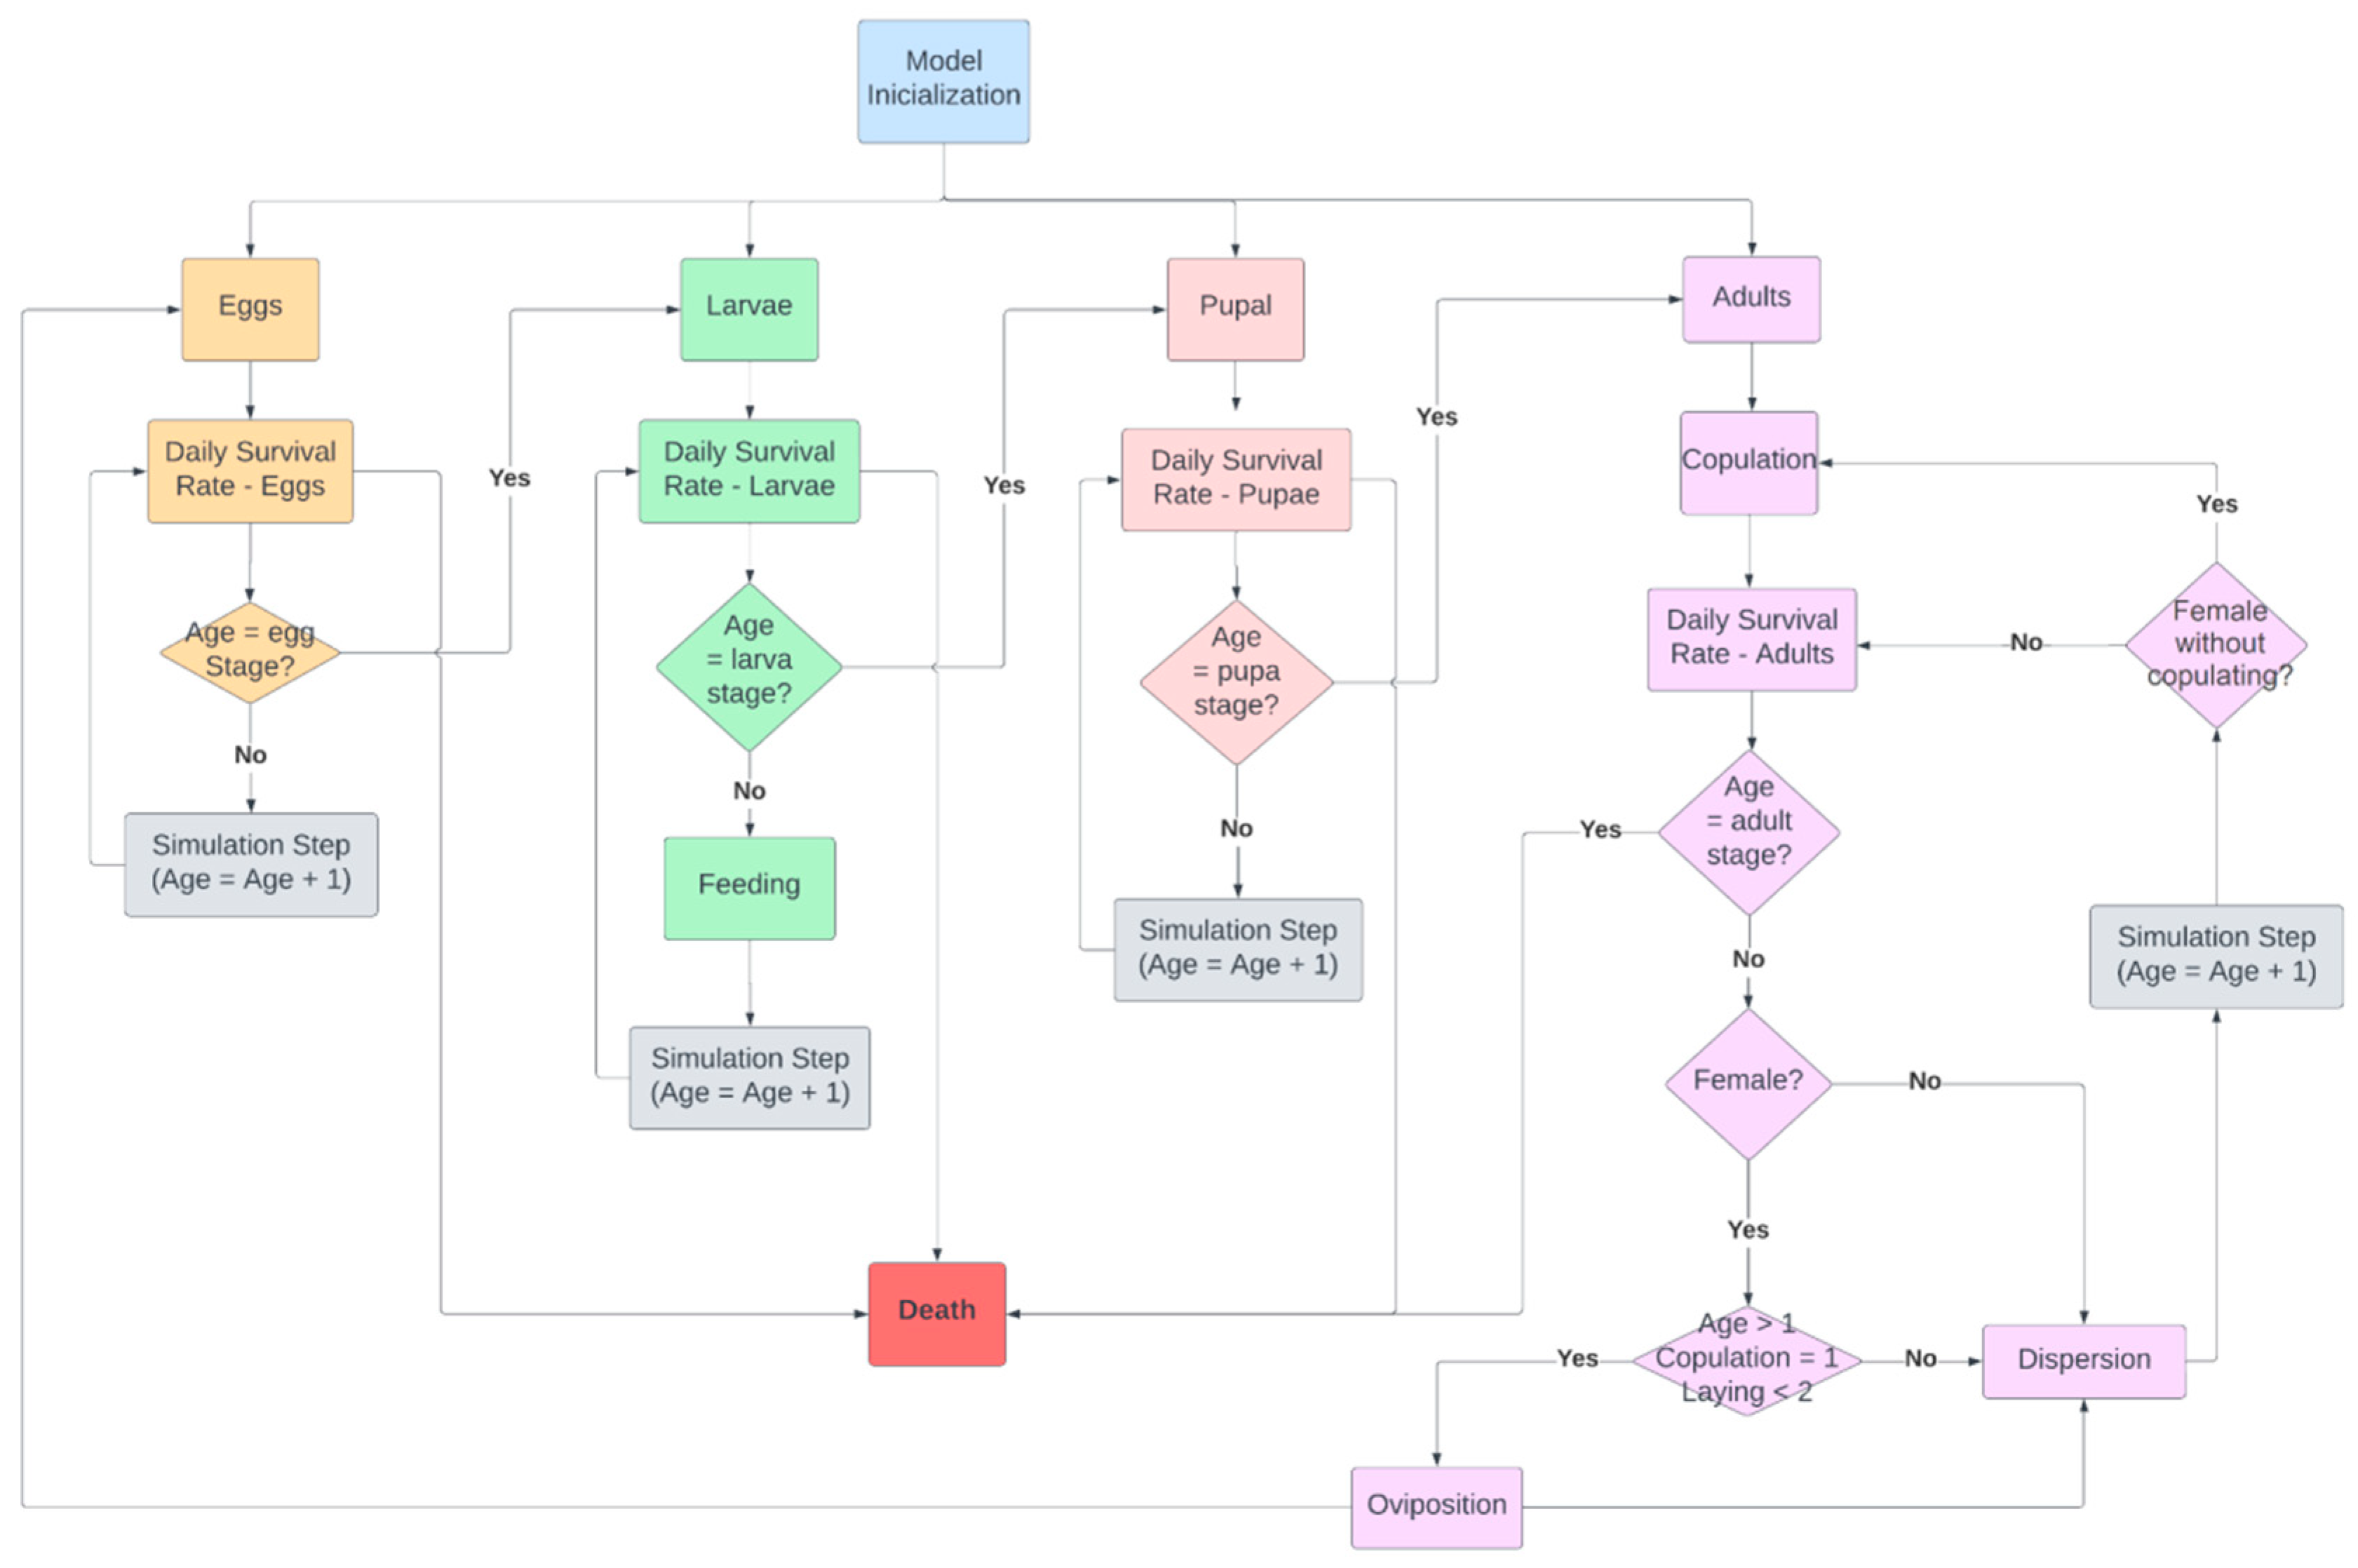
2.2. The Agent-Based Model of D. saccharalis and Simulation Scenarios
2.2.1. Scenario of D. saccharalis Dispersal without Biological Control
2.2.2. Scenario of D. saccharalis Dispersal with Biological Control Using the Parasites C. flavipes and T. galloi
3. Results
3.1. Simulation of D. saccharalis Dispersal without Biological Control
3.2. Simulation of D. saccharalis Population and Dispersal with Biological Control
4. Discussion
4.1. Simulation of D. saccharalis Dispersal without Biological Control
4.2. Simulation of D. saccharalis Population and Dispersal with Biological Control
5. Conclusions
Author Contributions
Funding
Data Availability Statement
Conflicts of Interest
References
- CONAB−Brazilian Supply Company. Sugar Cane Harvest Bulletin. First Survey. 2021; v. 8, n. 3, p. 56. Available online: https://www.conab.gov.br/info-agro/safras/cana/boletim-da-safra-de-cana-de-acucar (accessed on 15 April 2022).
- Fonseca, E.M.S.; Araújo, R.C. Fitossanidade: Princípios Básicos e Métodos de Controles e Doenças, 1st ed.; Saraiva: São Paulo, Brazil, 2015; Volume 1, p. 136. [Google Scholar]
- Gallo, D.; Nakano, O.; Silveira Neto, S.; Carvalho, R.L.; De Batista, G.C. Manual de Entomologia Agrícola; Agronômica Ceres: São Paulo, Brazil, 1988; p. 649. [Google Scholar]
- Rodero, D.P. Modelagem matemática da interação populacional entre Diatraea saccharalis (Fabricius, 1794) e o parasitoide Cotesia flavipes (Cameron, 1891). Master’s Thesis, Universidade de São Carlos, Araras, Brazil, 2016; p. 98. [Google Scholar]
- Cruz, I. Lepdoptera como Pragas de Milho. 2010. Available online: https://ainfo.cnptia.embrapa.br/digital/bitstream/item/31231/1/doc-111.pdf (accessed on 12 December 2022).
- Sandoval, S.S.; Senô, K.C.A. Comportamento controle da Diatraea saccharalis na cana-de-açúcar. Nucleus 2010, 7, 1–16. Available online: https://dialnet.unirioja.es/servlet/articulo?codigo=4037676 (accessed on 1 August 2022). [CrossRef]
- Portela, G.L.F.; Padua, L.E.M.; Branco, R.T.P.C.; Barbosa, O.A.; Silva, P.R.R. Flutuação populacional de Diatraea saccharalis (Fabricius, 1794) (Lepidoptera—Crambidae) em cana-de-açúcar no município de União-PI. Rev. Bras. Ciênc. Agrárias 2021, 5, 303–307. Available online: http://www.agraria.pro.br/ojs32/index.php/RBCA/article/view/v5i3a510 (accessed on 15 August 2022). [CrossRef]
- Macedo, N.; Macedo, D. As pragas de mais incidência nos canaviais e seus controles. Rev. Visão Agrícola 2004, 1, 38–46. Available online: https://www.esalq.usp.br/visaoagricola/sites/default/files/cana-producao-vegetal04.pdf (accessed on 15 August 2023).
- Bayer Agro. Broca-da-Cana: Como Identificar e Como Realizar o Manejo|Impulso Negócios EP. 58. 2023. Available online: https://www.youtube.com/watch?v=fVJergBn_3E (accessed on 5 November 2022).
- Paranhos, S.B. Cana-de-Açúcar Cultivo e Utilização; Fundação Cargil: Campinas, SP, Brazil, 1987; p. 856. [Google Scholar]
- Kogan, M. Integrated pest management: Historical, perspectives and contemporary development. Annu. Rev. Entomol. 1998, 43, 243–270. Available online: https://www.annualreviews.org/doi/abs/10.1146/annurev.ento.43.1.243?casa_token=GIwhbd6_k9YAAAAA%3Aq7N95GlmTtCLM6Qje9KJG5C8u4QJNHRlCfks7e_ylhWqKcAdsDJn_ACxqe03V-Cyzn_3n_B6qyxdu9K6 (accessed on 17 November 2022). [CrossRef] [PubMed]
- Barros, G.S.C.; Miranda, S.H.G.; Osaki, M.; Alves, L.R.A.; Adami, A.O.; Nishikawa, M.E.; Perez, F.C.; Lima, F.F.; Ribeiro, R.G. Mensuração econômica da incidência de pragas e doenças no brasil: Uma aplicação para as culturas de soja, milho e algodão. CEPEA 2019, 1, 4–12. Available online: https://www.cepea.esalq.usp.br/upload/kceditor/files/Cepea_EstudoPragaseDoencas_Parte%201.pdf (accessed on 3 October 2022).
- Burrough, P. Dynamic Modelling and Geocomputation. In Geocomputation: A Primer, 1st ed.; Longley, P., Batty, M., Mcdonnel, R., Eds.; John Wiley & Sons: London, UK, 1998; Volume 1, p. 280. [Google Scholar]
- Jones, J.W.; Luyten, J.C. Simulation of Biological Processes. In Agricultural Systems Modeling and Simulation, 1st ed.; Robert, M.P., Curry, R.B., Eds.; CRC Press: New York, NY, USA, 1998; Volume 1, pp. 19–62. [Google Scholar]
- Bonabeau, E. Agent-based modeling: Methods and techniques for simulating human systems. Proc. Natl. Acad. Sci. USA 2002, 99, 7280–7287. [Google Scholar] [CrossRef] [PubMed]
- Donatelli, A.; Magarey, R.D.; Bregaglio, S.; Willocquet, L.; Whish, P.M.; Savary, S. Modelling the impacts of pests and diseases on agricultural systems. Agric. Syst. 2017, 155, 213–224. [Google Scholar] [CrossRef] [PubMed]
- Rasche, L.; Taylor, R.A.J. EPIC-GILSYM: Modelling crop-pest insect interactions and management with a novel coupled crop-insect model. J. Appl. Ecol. 2019, 56, 2045–2056. [Google Scholar] [CrossRef]
- Malaquias, J.B.; Godoy, W.A.C.; Garcia, A.D.; Ramalho, F.S.; Omoto, C. Larval dispersal of Spodoptera frugiperda Strains on Bt cotton: A model for understanding resistance resolution and consequences for its management. Sci. Rep. 2017, 7, 16109. [Google Scholar] [CrossRef] [PubMed]
- Zhang, S.; Wang, D.; Li, L.; Yuan, Y. Design and implementation of Aculops lycopersici population dynamic model prototype based on cellular automata. In IFIP-International Federation for Information Processing, 1st ed.; IFIP: Boston, MA, USA, 2009; Volume 2, pp. 1319–1328. [Google Scholar] [CrossRef]
- Lima, E.A.B.F.; Ferreira, C.P.; Godoy, W.A.C. Ecological modeling and pest population management: A possible and necessary connection in a changing world. Neotrop. Entomol. 2009, 38, 699–707. [Google Scholar] [CrossRef] [PubMed]
- Potgieter, L.; Vuuren, J.H.V.; Conlong, D.E. Simulation modelling as a decision support in developing a sterile insect-inherited sterility release strategy for Eldana saccharina (Lepidoptera: Pyralidae). Fla. Èntomol. 2021, 99, 12–22. [Google Scholar] [CrossRef]
- Molnár, S.; López, I.; Gámez, M.; Garay, J. A two-agent model applied to the biological control of the sugarcane borer (Diatraea saccharalis) by the egg parasitoid Trichogramma galloi and the larvae parasitoid Cotesia flavipes. Biosystems 2016, 141, 45–54. [Google Scholar] [CrossRef] [PubMed]
- Municipal Government of Pederneiras. General Aspect of Pederneiras Municipality. Available online: https://www.pederneiras.sp.gov.br/portal/servicos/67/a-nossa-cidade/aspectos-gerais#:~:text=Localiza%C3%A7%C3%A3o%3A%20O%20munic%C3%ADpio%20de%20Pederneiras,Agudos%20e%20Bauru%20a%20oeste (accessed on 18 September 2023).
- Wilensky, U. 1999. Netlogo. Available online: http://ccl.northwestern.edu/netlogo (accessed on 15 September 2022).
- IBGE−Brazilian Institute for Geography and Statistics. Municipal Agricultural Production. Available online: https://sidra.ibge.gov.br/tabela/1612 (accessed on 15 June 2023).
- Botelho, P.S.M. Tabela de Vida ecológica e Simulação da Fase Larval da Diatrea saccharalis (Fabr., 1794) (Lep: Pyralidae). Ph.D. Dissertation, São Paulo University, São Paulo, Brazil, 1985; p. 110. Available online: https://www.teses.usp.br/teses/disponiveis/11/11146/tde-20191220-132512/publico/BotelhoPauloSergioMachado.pdf (accessed on 30 September 2022).
- Sakuno, C.I.R. Efeitos da Movimentação de Diatraea saccharalis (Fabricius) (Lepidoptera: Crambidae) em Sistemas Compostos por Cana-de-Açúcar Geneticamente Modificada e Refúgio. Master’s Thesis, São Paulo University, Piracicaba, Brazil, 2021; p. 84. Available online: https://www.teses.usp.br/teses/disponiveis/11/11146/tde-04082021-134220/pt-br.php (accessed on 18 October 2022).
- Caixeta, D.F. Dispersão de Machos de Diatraea saccharalis (Fabricius) (Leipdoptera: Crambidae) em Cana-de-Açúcar. Master’s Thesis, São Paulo State University, Jaboticabal, Brazil, 2010. Available online: https://repositorio.unesp.br/server/api/core/bitstreams/779ed8b8-b20f-4fbb-b09a-5afc5ea800ae/content (accessed on 11 August 2022).
- SEMIL−Sao Paulo State Secretary for Environment, Infrastructure and Logistics. Wind Atlas of São Paulo State. Available online: https://www.infraestruturameioambiente.sp.gov.br/energias-eletrica-e-renovaveis/atlas-eolico-do-estado-de-sao-paulo/ (accessed on 3 July 2022).
- Botelho, P.S.M.; Parra, J.R.P.; Chagas Neto, J.F.; Oliveira, C.P.B. Association of the egg parasitoid Trichogramma galloi Zucchi (Hymenoptera: Trichogrammatidae) with the larval parasitoid Cotesia flavipes (Cam.) (Hymenopera: Braconidae) to control the sugarcane Borer Diatraea saccharalis (Fabr.) (Lepidoptera: Crambidae). An. Soc. Entomol. 1999, 28, 491–496. Available online: https://www.scielo.br/j/aseb/a/rX6DYzxwxp8th9JDfgYCmZf/ (accessed on 30 August 2022). [CrossRef]
- Mendonça, A.F. Distribuição de Diatraea spp. (Lep.: Pyralidae) e de seus principais parasitoides larvais no Continente Americano. In Pragas da Cana-de-Açúcar, 1st ed.; Insetos & Cia: Itabira, Brazil, 1996; Volume 1, pp. 83–121. Available online: https://ainfo.cnptia.embrapa.br/digital/bitstream/item/79313/1/documento-287.pdf (accessed on 10 September 2022).
- Moutia, L.A.; Courtois, C.M. Parasites of mothborers of sugar-cane in Mauritius. Bull. Entomol. Res. 1952, 43, 325–359. Available online: https://www.cambridge.org/core/journals/bulletin-of-entomological-research/article/abs/parasites-of-the-mothborers-of-sugarcane-in-mauritius/2EC220F628230BB6418EEF6F224552DA (accessed on 9 October 2022). [CrossRef]
- Lopes, J.R.S. Estudos Bioetológicos de Trichogramma galloi Zucchi, 1988 (Hym., Trichogrammatidae) para o Controle de Diatraea saccharalis (Fabr., 1794) (Lep., Pyralidae). Master’s Thesis, São Paulo University, Piracicaba, Brazil, 1988; p. 141. Available online: https://teses.usp.br/teses/disponiveis/11/11146/tde-20191218-104515/pt-br.php (accessed on 23 November 2022).
- Drake, V.A.; Farrow, R.A. The influence of atmospheric structure and motions on insect migration. Ann. Rev. Entomol. 1988, 33, 183–210. Available online: https://www.annualreviews.org/doi/abs/10.1146/annurev.en.33.010188.001151 (accessed on 13 December 2022). [CrossRef]
- Pereira-Barros, J.L.; Broglio-Micheletti, S.M.F.; Santos, A.J.N.D.; Carvalho, L.W.T.D.; Carvalho, L.H.T.D.; Oliveira, C.J.T.D. Biological aspects of Trichogramma galloi Zucchi, 1988 (Hymenoptera: Trichogrammatidae) reared on eggs of Diatraea saccharalis (Fabricius, 1794) (Lepidoptera: Crambidae). Ciênc. Agrotec. 2005, 29, 714–718. Available online: https://www.scielo.br/j/cagro/a/Rtz5rHpN99YKwzhPnyHSYpb/ (accessed on 22 August 2022). [CrossRef]
- Nava, D.E.; Afonso, A.P.S.; Melo, M.; Pinto, A.S.; Anjos e Silva, S.D.; Controle Biológico da Broca da Cana-de-Açúcar. Embrapa Clima Temperado, Pelotas, Rio Grande do Sul, Brasil. 2009. Available online: https://ainfo.cnptia.embrapa.br/digital/bitstream/item/44196/1/broca-cana.pdf (accessed on 19 September 2022).
- Micheletti, S.M.F.B. Distribuição espacial e temporal de ovos de Diatraea saccharalis (Fabr., 1794) (Lep.: Pyralldae) e seu parasitismo por Trichogramma sp. (Hym., Trichogrammatidae). Master’s Thesis, São Paulo University, Piracicaba, Brazil, 1987; p. 95. Available online: https://teses.usp.br/teses/disponiveis/11/11146/tde-20181127-161021/pt-br.php (accessed on 23 September 2022).
- Souza, R.G.B.D. Otimização do Controle de Diatraea saccharalis (Fabricius, 1794) (Lepidoptera: Crambidae) por Meio do Parasitoide Cotesia flavipes (Cameron, 1891) (Hymenoptera: Braconidae) Visando a Redução de Custos. Ph.D. Dissertation, Federal University of São Carlos, São Carlos, Brazil, 2018; p. 118. Available online: https://repositorio.ufscar.br/handle/ufscar/10033 (accessed on 3 October 2022).


| Summer | Autumn | Winter | Spring | Parameter | Source |
|---|---|---|---|---|---|
| 1–75 | 76–184 | 185–306 | 307–365 | Simulation Step (day) | [26] |
| 7 | 8 | 12 | 8 | Egg Stage (days) | [26] |
| 53 | 50 | 91 | 84 | Larval Stage (days) | [26] |
| 11 | 11 | 11 | 12 | Pupal Stage (days) | [26] |
| 4 | 4 | 8 | 5 | Adult Stage (days) | [26] |
| 2 | 2 | 2 | 2 | Pre-oviposition Period (days) | [26] |
| 195 | 195 | 121 | 121 | Number of eggs by oviposition (2 ovipositions) | [27] |
| 0.524 | 0.545 | 0.400 | 0.625 | Sexual ratio (female/female + male) | [26] |
| 0.984 | 0.9725 | 0.9663 | 0.9751 | Daily survival rate—eggs | [26] |
| 0.9582 | 0.9185 | 0.973 | 0.9733 | Daily survival rate—larvae | [26] |
| 0.9861 | 0.9392 | 0.9742 | 0.9616 | Daily survival rate—pupae | [26] |
| 0.8524 | 0.8307 | 0.8918 | 0.9106 | Daily survival rate—adults | [26] |
| Flight Distance (m) | Captured Male | (%) | Flew with the Wind | (%) | Flew against the Wind | (%) | Flew Indifferently to the Wind | (%) |
|---|---|---|---|---|---|---|---|---|
| 49.7 | 56 | 47.86 | 34 | 55.74 | 7 | 36.84 | 15 | 40.54 |
| 100.2 | 11 | 9.40 | 6 | 9.84 | 0 | 0 | 5 | 13.51 |
| 150.5 | 12 | 10.26 | 2 | 3.28 | 6 | 31.58 | 4 | 10.81 |
| 200.6 | 8 | 6.84 | 8 | 13.11 | 0 | 0 | 0 | 0 |
| 250.8 | 2 | 1.71 | 2 | 3.28 | 0 | 0 | 0 | 0 |
| 301.2 | 11 | 9.40 | 3 | 4.92 | 1 | 5.26 | 7 | 18.52 |
| 350.8 | 4 | 3.42 | 1 | 1.64 | 2 | 10.53 | 1 | 2.70 |
| 401.1 | 1 | 0.85 | 0 | 0 | 0 | 0 | 1 | 2.70 |
| 449.1 | 1 | 0.85 | 0 | 0 | 1 | 5.26 | 0 | 0 |
| 498.5 | 1 | 0.85 | 1 | 1.64 | 0 | 0 | 0 | 0 |
| 599.6 | 5 | 4.27 | 1 | 1.64 | 0 | 0 | 4 | 10.81 |
| 648.3 | 1 | 0.85 | 1 | 1.64 | 0 | 0 | 0 | 0 |
| 747.4 | 1 | 0.85 | 0 | 0 | 1 | 5.26 | 0 | 0 |
| 799.0 | 3 | 2.56 | 2 | 3.28 | 1 | 5.26 | 0 | 0 |
| Total | 117 | 100 | 61 | 100 | 19 | 100 | 37 | 100 |
| Days | Parameters | Source |
|---|---|---|
| 9 | Egg, larval, pre-pupal, and pupal period stages | [35] |
| 0.973 * | Daily survival rate | [35] |
| 5 ** | Adult stage | [35] |
| 1 a 2 | Number of eggs in oviposition | [36] |
| 1:7.1 | Sex ratio (males:females) | [37] |
| Days | Parameters | Source |
|---|---|---|
| 4 | Egg stage | [38] |
| 10 * | Larva stage | [38] |
| 5 ** | Pupa stage | [37] |
| 2 | Adult stage | [38] |
| 0.8752 | Daily survival rate | [38] |
| 28 ± 19 | Number of eggs in oviposition | [38] |
| 1:2.13 | Sex ratio (males:females) | [38] |
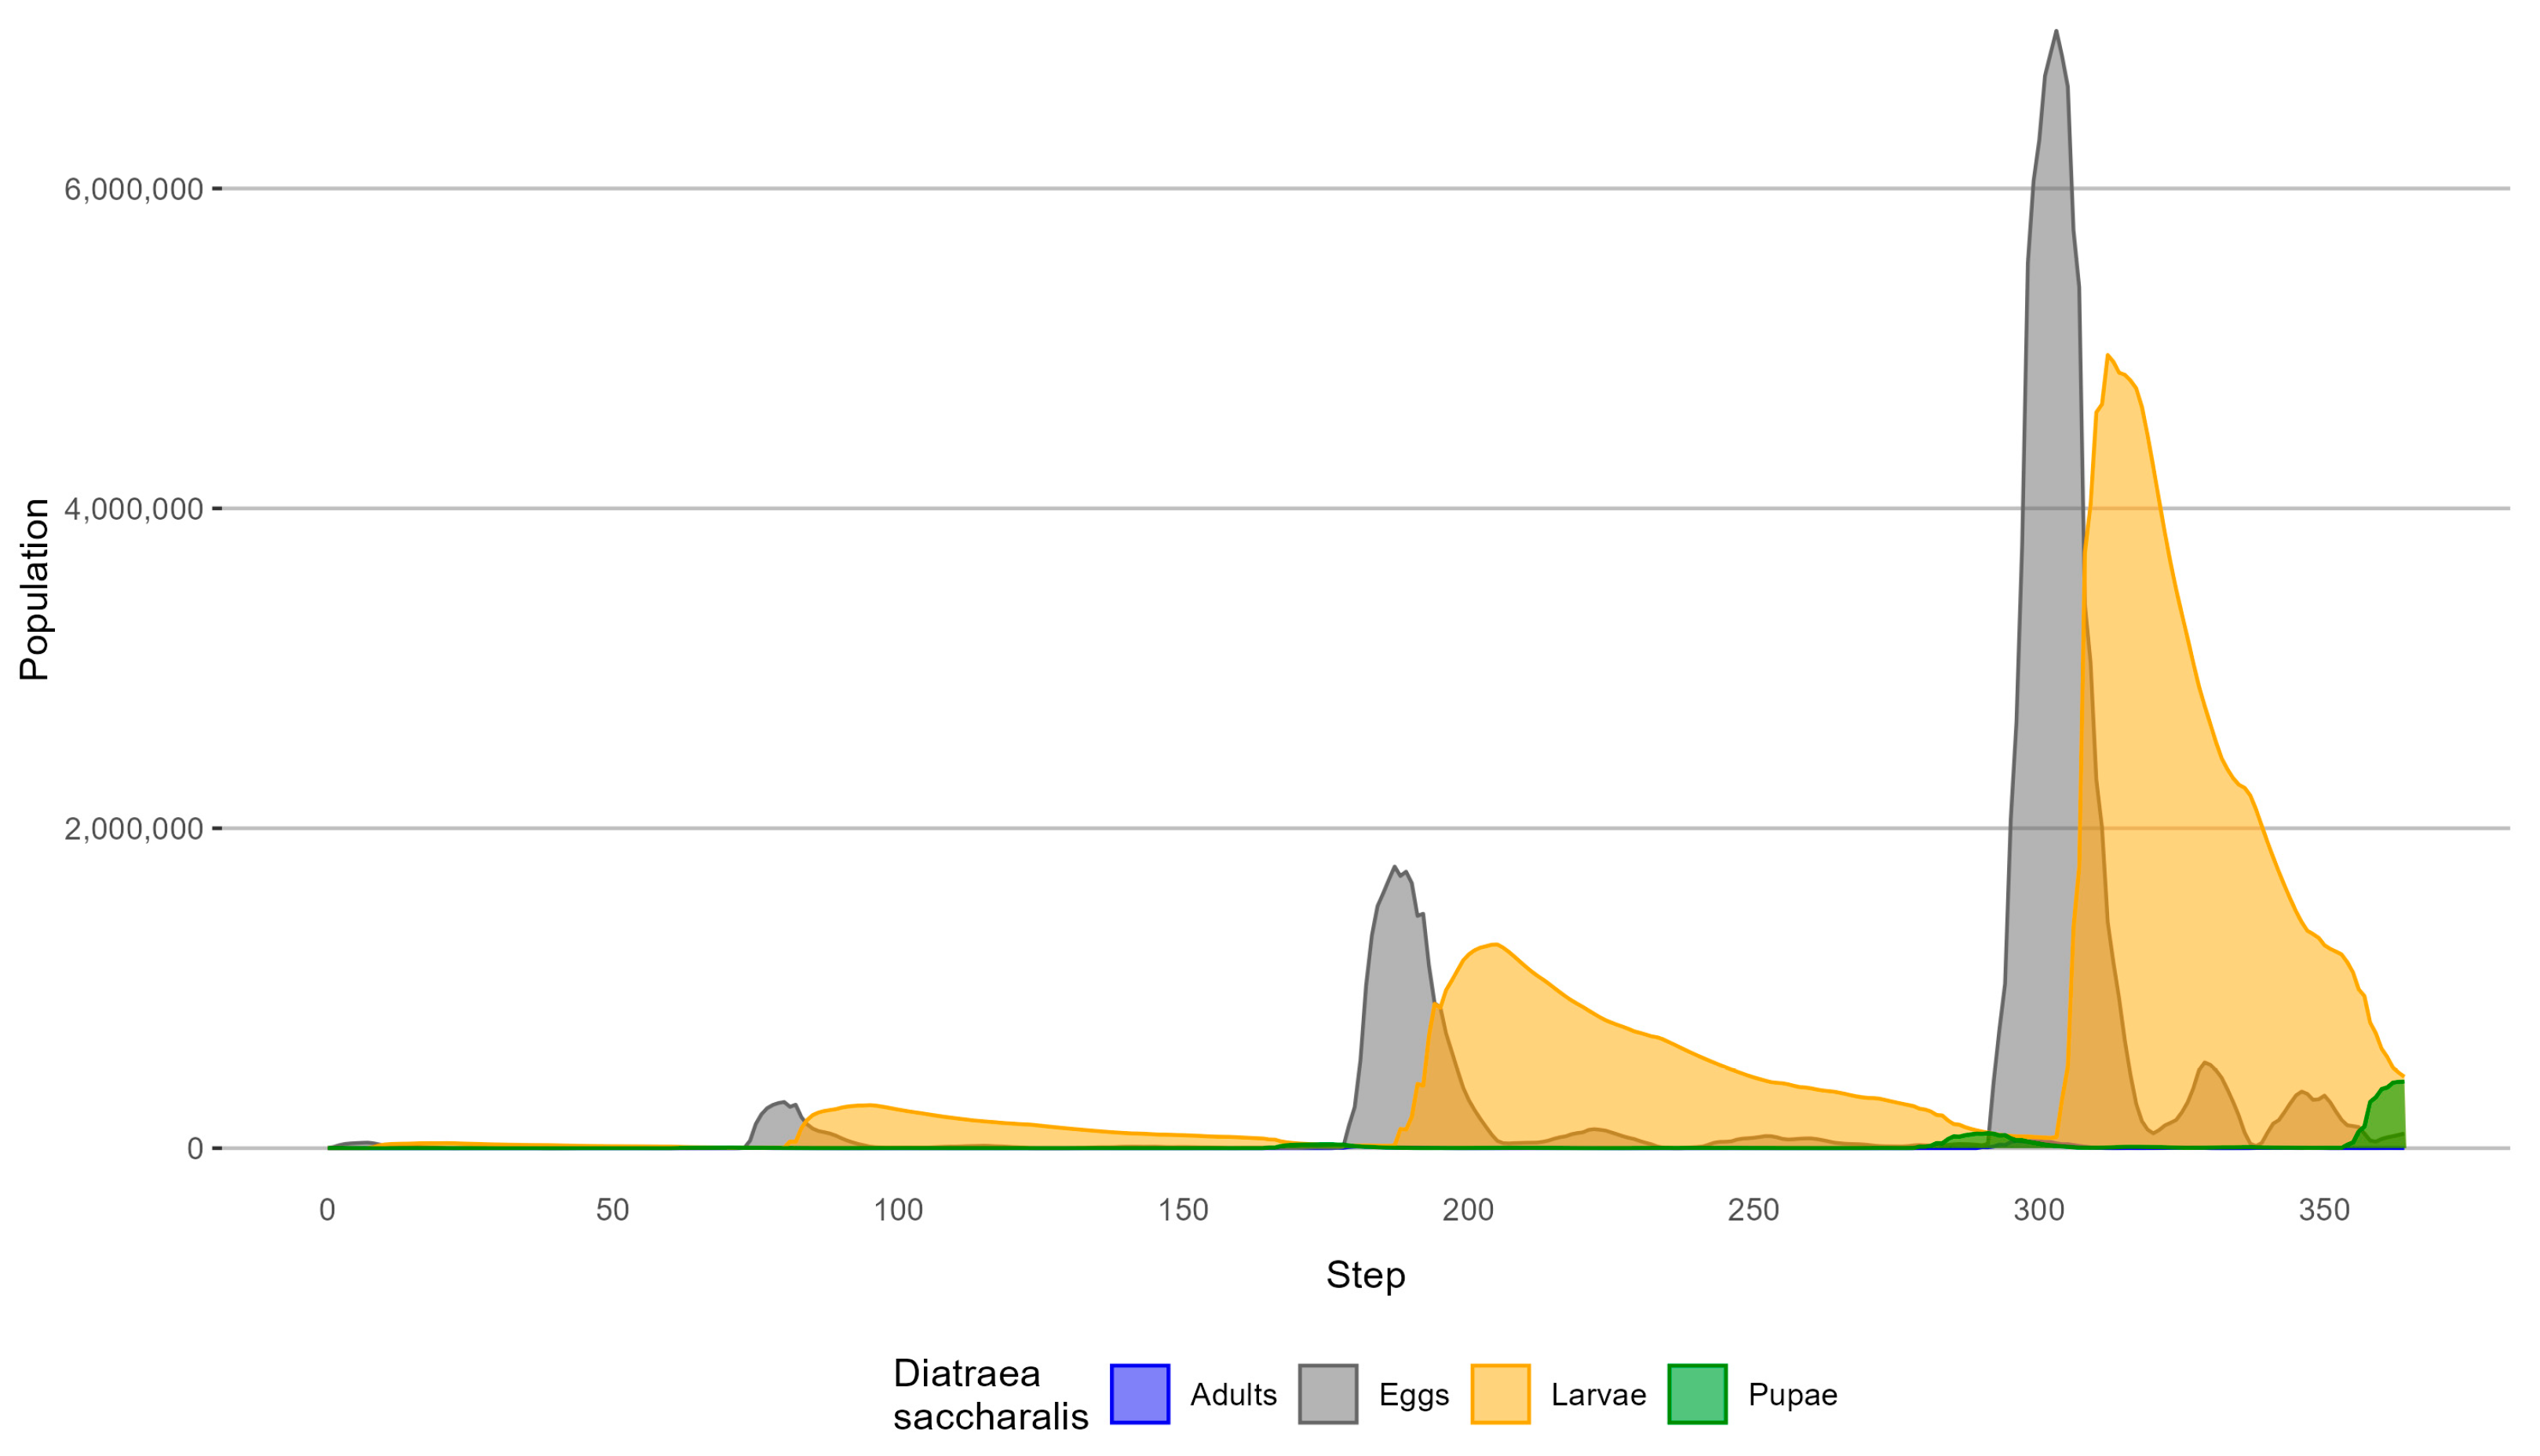
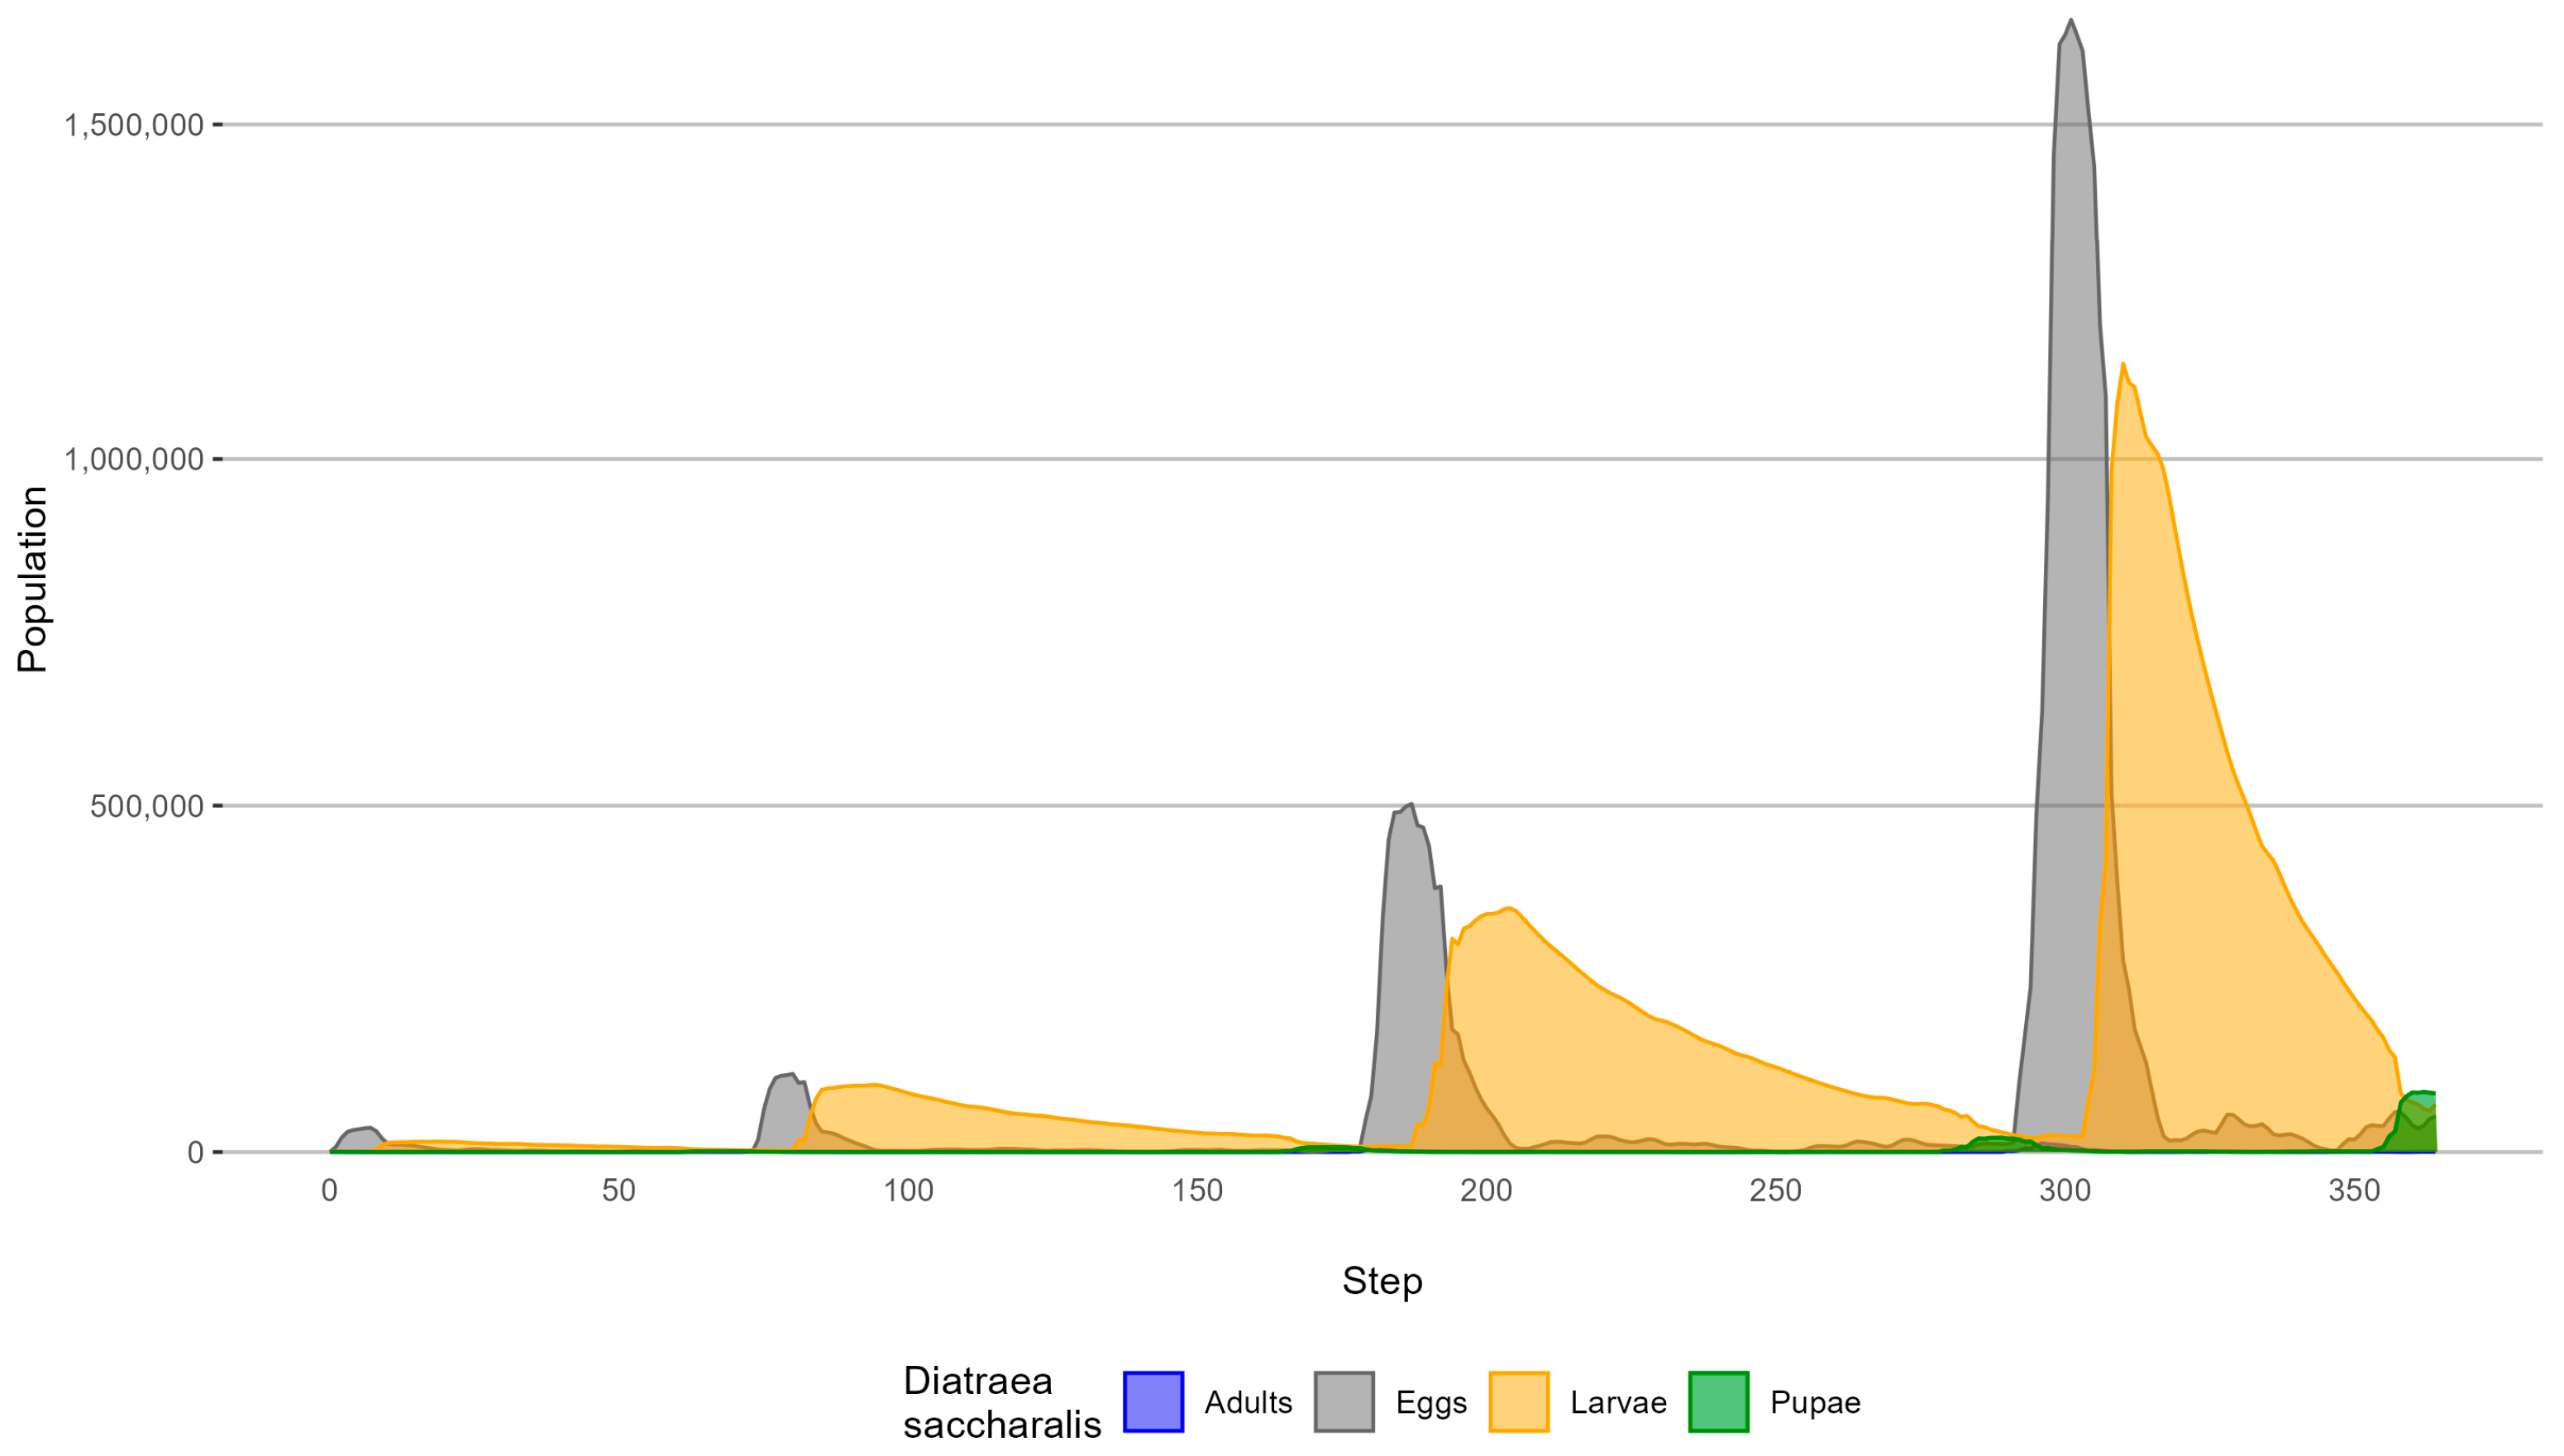
| Biological Form | Peak (Step) | Population without Biological Control | Population with Biological Control | Percentage of Reduction |
|---|---|---|---|---|
| 80 | 288,765 | 112,884 | 60.9% | |
| Egg | 187 | 1,760,546 | 502,484 | 71.5% |
| 303 | 6,985,802 | 1,607,223 | 76.9% | |
| 95 | 268,793 | 96,341 | 64.2% | |
| Larval | 205 | 1,273,561 | (Step 204) 351,933 | 72.4% |
| 312 | 4,959,428 | 1,103,572 | 77.8% | |
| 176 | 24,719 | 6,804 | 72.5% | |
| Pupal | 291 | 93,864 | 19,617 | 79.1% |
| 364 | 416,683 | 84,707 | 79.7% | |
| 75 | 1832 | 771 | 57.9% | |
| Adult | 181 | 11,742 | 3955 | 66.3% |
| 296 | 47,299 | 12,859 | 72.8% |
Disclaimer/Publisher’s Note: The statements, opinions and data contained in all publications are solely those of the individual author(s) and contributor(s) and not of MDPI and/or the editor(s). MDPI and/or the editor(s) disclaim responsibility for any injury to people or property resulting from any ideas, methods, instructions or products referred to in the content. |
© 2024 by the authors. Licensee MDPI, Basel, Switzerland. This article is an open access article distributed under the terms and conditions of the Creative Commons Attribution (CC BY) license (https://creativecommons.org/licenses/by/4.0/).
Share and Cite
Alves, R.B.d.O.; Tomasiello, D.B.; Almeida, C.M.d.; Rosalen, D.L.; Pereira, L.H.; Silva, H.P.d.; Rodrigues, C.L. Agent-Based Spatial Dynamic Modeling of Diatraea saccharalis and the Natural Parasites Cotesia flavipes and Trichogramma galloi in Sugarcane Crops. Remote Sens. 2024, 16, 2693. https://doi.org/10.3390/rs16152693
Alves RBdO, Tomasiello DB, Almeida CMd, Rosalen DL, Pereira LH, Silva HPd, Rodrigues CL. Agent-Based Spatial Dynamic Modeling of Diatraea saccharalis and the Natural Parasites Cotesia flavipes and Trichogramma galloi in Sugarcane Crops. Remote Sensing. 2024; 16(15):2693. https://doi.org/10.3390/rs16152693
Chicago/Turabian StyleAlves, Rayanna Barroso de Oliveira, Diego Bogado Tomasiello, Cláudia Maria de Almeida, David Luciano Rosalen, Luiz Henrique Pereira, Hernande Pereira da Silva, and Cesar Leandro Rodrigues. 2024. "Agent-Based Spatial Dynamic Modeling of Diatraea saccharalis and the Natural Parasites Cotesia flavipes and Trichogramma galloi in Sugarcane Crops" Remote Sensing 16, no. 15: 2693. https://doi.org/10.3390/rs16152693
APA StyleAlves, R. B. d. O., Tomasiello, D. B., Almeida, C. M. d., Rosalen, D. L., Pereira, L. H., Silva, H. P. d., & Rodrigues, C. L. (2024). Agent-Based Spatial Dynamic Modeling of Diatraea saccharalis and the Natural Parasites Cotesia flavipes and Trichogramma galloi in Sugarcane Crops. Remote Sensing, 16(15), 2693. https://doi.org/10.3390/rs16152693