Article

Impacts of Climatic Fluctuations and Vegetation Greening on Regional Hydrological Processes: A Case Study in the Xiaoxinganling Mountains–Sanjiang Plain Region, Northeastern China

1
State Key Laboratory of Environment Criteria and Risk Assessment, National Engineering Laboratory for Lake Pollution Control and Ecological Restoration, State Environmental Protection Key Laboratory for Lake Pollution Control, Chinese Research Academy of Environmental Sciences, Beijing 100012, China
2
Department of Environment & Society, Utah State University, Logan, UT 84322, USA
3
Natural Resources Aero-Geophysical and Remote Sensing Center of China Geological Survey, Beijing 100083, China
4
School of Geographic and Environmental Sciences, Tianjin Normal University, Tianjin 300387, China
5
Key Laboratory of Digital Earth Science, Aerospace Information Research Institute, Chinese Academy of Sciences, Beijing 100094, China
6
International Research Center of Big Data for Sustainable Development Goals, Beijing 100094, China
7
Institute of Remote Sensing Satellite, China Academy of Space Technology, Beijing 100094, China
8
State Key Laboratory of Hydraulics and Mountain River Engineering, Sichuan University, Chengdu 610065, China
*
Author to whom correspondence should be addressed.
Remote Sens. 2024, 16(15), 2709; https://doi.org/10.3390/rs16152709
Submission received: 31 May 2024 / Revised: 10 July 2024 / Accepted: 20 July 2024 / Published: 24 July 2024

Abstract

:
The Xiaoxinganling Mountains–Sanjiang Plain region represents a crucial ecological security barrier for the Northeast China Plain and serves as a vital region for national grain production. Over the past two decades, the region has undergone numerous ecological restoration projects. Nevertheless, the combined impact of enhanced vegetation greening and global climate change on the regional hydrological cycle remains inadequately understood. This study employed the distributed hydrological model ESSI-3, reanalysis datasets, and multi-source satellite remote sensing data to quantitatively evaluate the influences of climate change and vegetation dynamics on regional hydrological processes. The study period spans from 2000 to 2020, during which there were significant increases in regional precipitation and leaf area index (p < 0.05). The hydrological simulation results exhibited strong agreement with observed river discharge, evapotranspiration, and terrestrial water storage anomalies, thereby affirming the ESSI-3 model’s reliability in hydrological change assessment. By employing both a constant scenario that solely considered climate change and a dynamic scenario that integrated vegetation dynamics, the findings reveal that: (1) Regionally, climate change driven by increased precipitation significantly augmented runoff fluxes (0.4 mm/year) and water storage components (2.57 mm/year), while evapotranspiration trends downward, attributed primarily to reductions in solar radiation and wind speed; (2) Vegetation greening reversed the decreasing trend in evapotranspiration to an increasing trend, thus exerting a negative impact on runoff and water storage. However, long-term simulations demonstrated that regional runoff fluxes (0.38 mm/year) and water storage components (2.21 mm/year) continue to increase, mainly due to precipitation increments surpassing those of evapotranspiration; (3) Spatially, vegetation greening altered the surface soil moisture content trend in the eastern forested areas from an increase to a decrease. These findings suggested that sub-regional ecological restoration initiatives, such as afforestation, significantly influence the hydrological cycle, especially in areas with higher vegetation greening. Nevertheless, persistent increases in precipitation could effectively mitigate the moisture deficits induced by vegetation greening. The study’s outcomes provide a basis for alleviating concerns regarding potential water consumption risks associated with future ecological restoration and extensive vegetation greening projects, thereby offering scientific guidance for sustainable water resource management.

1. Introduction

Global climate change, particularly global warming, along with pronounced spatiotemporal variations in factors such as precipitation and solar radiation, are driving significant changes in the terrestrial water cycle [1]. Furthermore, land use changes critically influence the regulation of water cycle systems across various temporal and spatial scales by altering climate–vegetation–water interactions. Land use management and changes drive alterations in surface vegetation [2]. Acting as a link between the hydrosphere, biosphere, and atmosphere, vegetation plays a crucial role in regulating the terrestrial water cycle [3]. Climate change affects the distribution of vegetation, and the transpiration of vegetation further regulates climatic conditions, especially by changing precipitation patterns [4]. The complex relationship between water-mediated climate and vegetation changes further exacerbates the uncertainty in hydrological process transformations [5].
Recent research demonstrates that from 2001 to 2017, one-third of the global vegetated areas exhibited increased greening, with China being one of the few countries to experience significant vegetation greening during this period [6]. Satellite observations have verified that changes in land use management and natural climate variability over the past two decades have together driven the substantial greening of vegetation in China [7]. Although vegetation greening can enhance terrestrial carbon sequestration, the substantial changes in climate and vegetation, which are intricately linked through various hydrological processes, have concurrently heightened the challenges in water resource management [8]. Consequently, investigating the impacts of climate and vegetation greening on hydrological processes, along with identifying their driving factors, becomes fundamental. This knowledge aids in managing our planet’s ecosystem more effectively, supporting environmental sustainability, and ensuring agricultural production safety—issues at the forefront of environmental studies [9].
In light of the intricate environment characterized by vegetation greening through ecological restoration and climate change, elucidating the primary factors that drive alterations in regional hydrological cycles is of paramount importance. Prior studies have primarily concentrated on the responses of specific hydrological processes, such as runoff or evapotranspiration to environmental variations [10]. However, these studies often overlook the interrelationships among these processes. Hydrological components encompass precipitation, interception, infiltration, evapotranspiration, soil moisture, runoff, groundwater flow, and groundwater storage. The integration of water sources from traditional surface, subsurface, and ecological systems, along with the quantification of each component, remains a formidable challenge [11,12]. Furthermore, the spatiotemporal distribution of hydrological components is susceptible to changes in climate and underlying surface conditions [13]. The current comprehension of the interactions among hydrological systems, vegetation dynamics, and climatic factors is still constrained and requires further investigation. Hydrological models offer an alternative to studying the impact of climate and underlying surface changes on various hydrological components.
Hydrological models, in combination with climate, vegetation, and land use/land cover (LULC) data, provide quantitative insights into various hydrological processes [14]. The choice of a model depends on data availability, problem scale, region characteristics, desired spatiotemporal resolution, uncertainty in simulations, allowable error, and model robustness [15]. Among various land surface models, the ESSI model, a physically based distributed hydrological model, stands out for its ability to consider spatial variability in catchment characteristics and meteorological forcings, making it suitable for the study region [16,17,18,19,20]. Additionally, reliable input model parameters are crucial for a robust estimation of the regional hydrology system. The utilization of remote-sensing-derived data in both model inputs and validation processes, encompassing climate variables, land surface characteristics (e.g., meteorological inputs, soil properties, land use/cover classifications, and leaf area index), as well as water budget components (e.g., evapotranspiration and terrestrial water storage), has demonstrated its efficacy in enriching our comprehension of water resource availability and evolving patterns [18,21]. This approach contributes significantly to meeting the imperatives of sustainable development in regional study.
In China, adopting a holistic approach to the conservation of mountains, rivers, forests, farmlands, lakes, and grasslands holds significant importance for ecological protection and restoration practices [22]. The Xiaoxinganling Mountains–Sanjiang Plain (XM-SP) region in Heilongjiang Province, Northeast China, is a pivotal area for pilot projects for the ecological protection and restoration of these diverse ecosystems. In the past 20 years, this region has seen the implementation of a series of national ecological restoration initiatives, including the Natural Forest Protection Program, the Grain for Green Program, and the Three-North Shelterbelt Development Program. These initiatives have significantly contributed to the national trend of increased vegetation cover [23]. However, the greening associated with ecological restoration is sometimes perceived as “trading water for biocarbon sequestration,” which can potentially disrupt regional water budgets and lead to water resource challenges due to increased evaporative demand [24]. Recent research also indicates that in Northeast China, vegetation greening is more significantly influenced by temperature and precipitation than the direct implementation of ecological restoration projects [7]. Furthermore, in China, farmland and forest areas contribute approximately 32% and 42%, respectively, to surface vegetation greening [6]. Specifically, the ecosystems of the XM-SP are notable, serving as a critical ecological barrier for Northern China and a major national grain production base. The contributions of crop growth in the Sanjiang Plain and afforestation in the Xiaoxinganling Mountains are particularly significant in enhancing regional vegetation cover. The documented discrepancies between agricultural crop production and afforestation with water resource availability have emerged as primary constraints on regional sustainable development [25]. Nonetheless, the effects of regional vegetation greening on water resources, mediated through alterations in the hydrological cycle, remain insufficiently understood. In addition, the local government recently plans to invest billions of RMB in an ‘Ecological Conservation and Restoration Pilot Project for Mountains, Waters, Forests, Farmlands, Lakes, and Grasslands’. Consequently, it is imperative to advance our understanding of the current hydrological systems and evaluate the impacts of climatic variations and surface changes linked to vegetation dynamics for effective water resource planning, management, and sustainable development.
Trend analysis of hydrological variables provides valuable information on data behavior, reflecting changes in the hydrological cycle [26]. Such analysis is necessary to detect long-term changes and statistics of variables like runoff fluxes, evaporation fluxes, and terrestrial water storage components. This study aimed to assess the impacts of vegetation-related LULC dynamics and climate change on regional-scale hydrological cycles. The study focused on the period from 2000 to 2020, during which ecological restoration projects and natural climate variability around the year 2000 significantly increased regional vegetation dynamics [27]. To achieve this objective, the multisource remote sensing data and reanalysis datasets were utilized to analyze the spatiotemporal changes in climate and LAI. The LAI data, which reflected long-term vegetation dynamics, along with gridded climate data, was incorporated into the ESSI-3 model to quantify the influence of various factors. LAI is a crucial parameter for simulating terrestrial ecological processes and the cycles of water and energy fluxes, serving as a key variable related to water conditions in the driving model. Through process-based model simulations and the establishment of various simulation scenarios, the contributions and impacts of LAI on hydrological variables are distinguished from those of other climate variables (such as temperature and precipitation). This study offers valuable insights into the efficient management and sustainable utilization of water resources in a changing environment.

2. Materials and Methods

2.1. Study Area

The XM-SP (127°37′–135°05′E, 44°51′–49°26′N), situated in Northeast China (as shown in Figure 1), serves as a critical ecological security barrier, water conservation area, biodiversity region, and food production base for the country [22]. Covering approximately 99,600 km2, it constitutes 21.6% of Heilongjiang Province. The Heilongjiang, Songhua, and Wusuli Rivers collectively form the river framework of the region’s water system. The Xiaoxinganling Mountains and the Wanda Mountains, two important ecological barriers, are located in the eastern and southern regions of the area, while the central and western areas contain the Sanjiang Plain, which is characterized by fertile black soil and dense wetlands [28].
The Xiaoxinganling Mountains typically range in elevation from 300 to 800 m above sea level, exhibiting higher relief in the southeast and lower relief in the northwest. Geomorphologically, the region displays a stratified pattern, characterized predominantly by hills and ridges [29]. The area has been shaped by numerous volcanic eruptions, resulting in the formation of volcanic cones and lava plateau landscapes. The prevailing soil type is dark brown soil, with forests predominating as the typical land cover [22]. The Sanjiang Plain represents China’s least densely populated plain [28]. Sloping from southwest to northeast, its topography transitions from piedmont plateaus to alluvial plains. Alluvial plains constitute over 60% of the region, with elevations averaging approximately 50–60 m above sea level. Primary soil types include black soil, meadow soil, and solonchak, positioning it as one of the world’s four most significant original black soil zones [18].
This region experiences a temperate humid and sub-humid monsoon climate, characterized by an average annual temperature ranging from 1.4 to 3.6 °C and average annual precipitation between 537.8 and 810.9 mm [29]. The rainy season spans from June to September, contributing to around 80% of the annual rainfall. The region receives 2400 to 2500 h of sunshine annually, with an average temperature of −21 to −18 °C in January and 21–22 °C in July [30]. These conditions are conducive to agricultural development during the rainy and hot seasons. Therefore, the Sanjiang Plain is indeed recognized as one of China’s most significant commercial grain-producing regions [18]. Positioned as a natural barrier in the northeast, the dominant forest types in the Xiaoxinganling Mountains region include temperate coniferous and broad-leaved mixed forests, featuring Korean pine, spruce, fir, and some deciduous broad-leaved forests with Mongolian oak and birch [31].

2.2. Hydrological Model and Driving Datasets

In this study, we employed a revised distributed hydrological model, ESSI-3, with a spatial resolution of 30 arcseconds (~1 km at the equator) to assess water storage and hydrological processes within the study region. The original ESSI model described watershed hydrology as 1-D fluxes, wherein precipitation is partitioned into canopy-intercepted and effective precipitation. The latter is further partitioned into direct runoff, infiltrates into deep soils (partly stored to support evapotranspiration), and flows into channels as river baseflow [16]. A key feature of the model is its capability to account for both infiltration and saturation-excess water-yielding mechanisms based on spatial and temporal variations in rainfall intensity and underlying surface conditions [17].
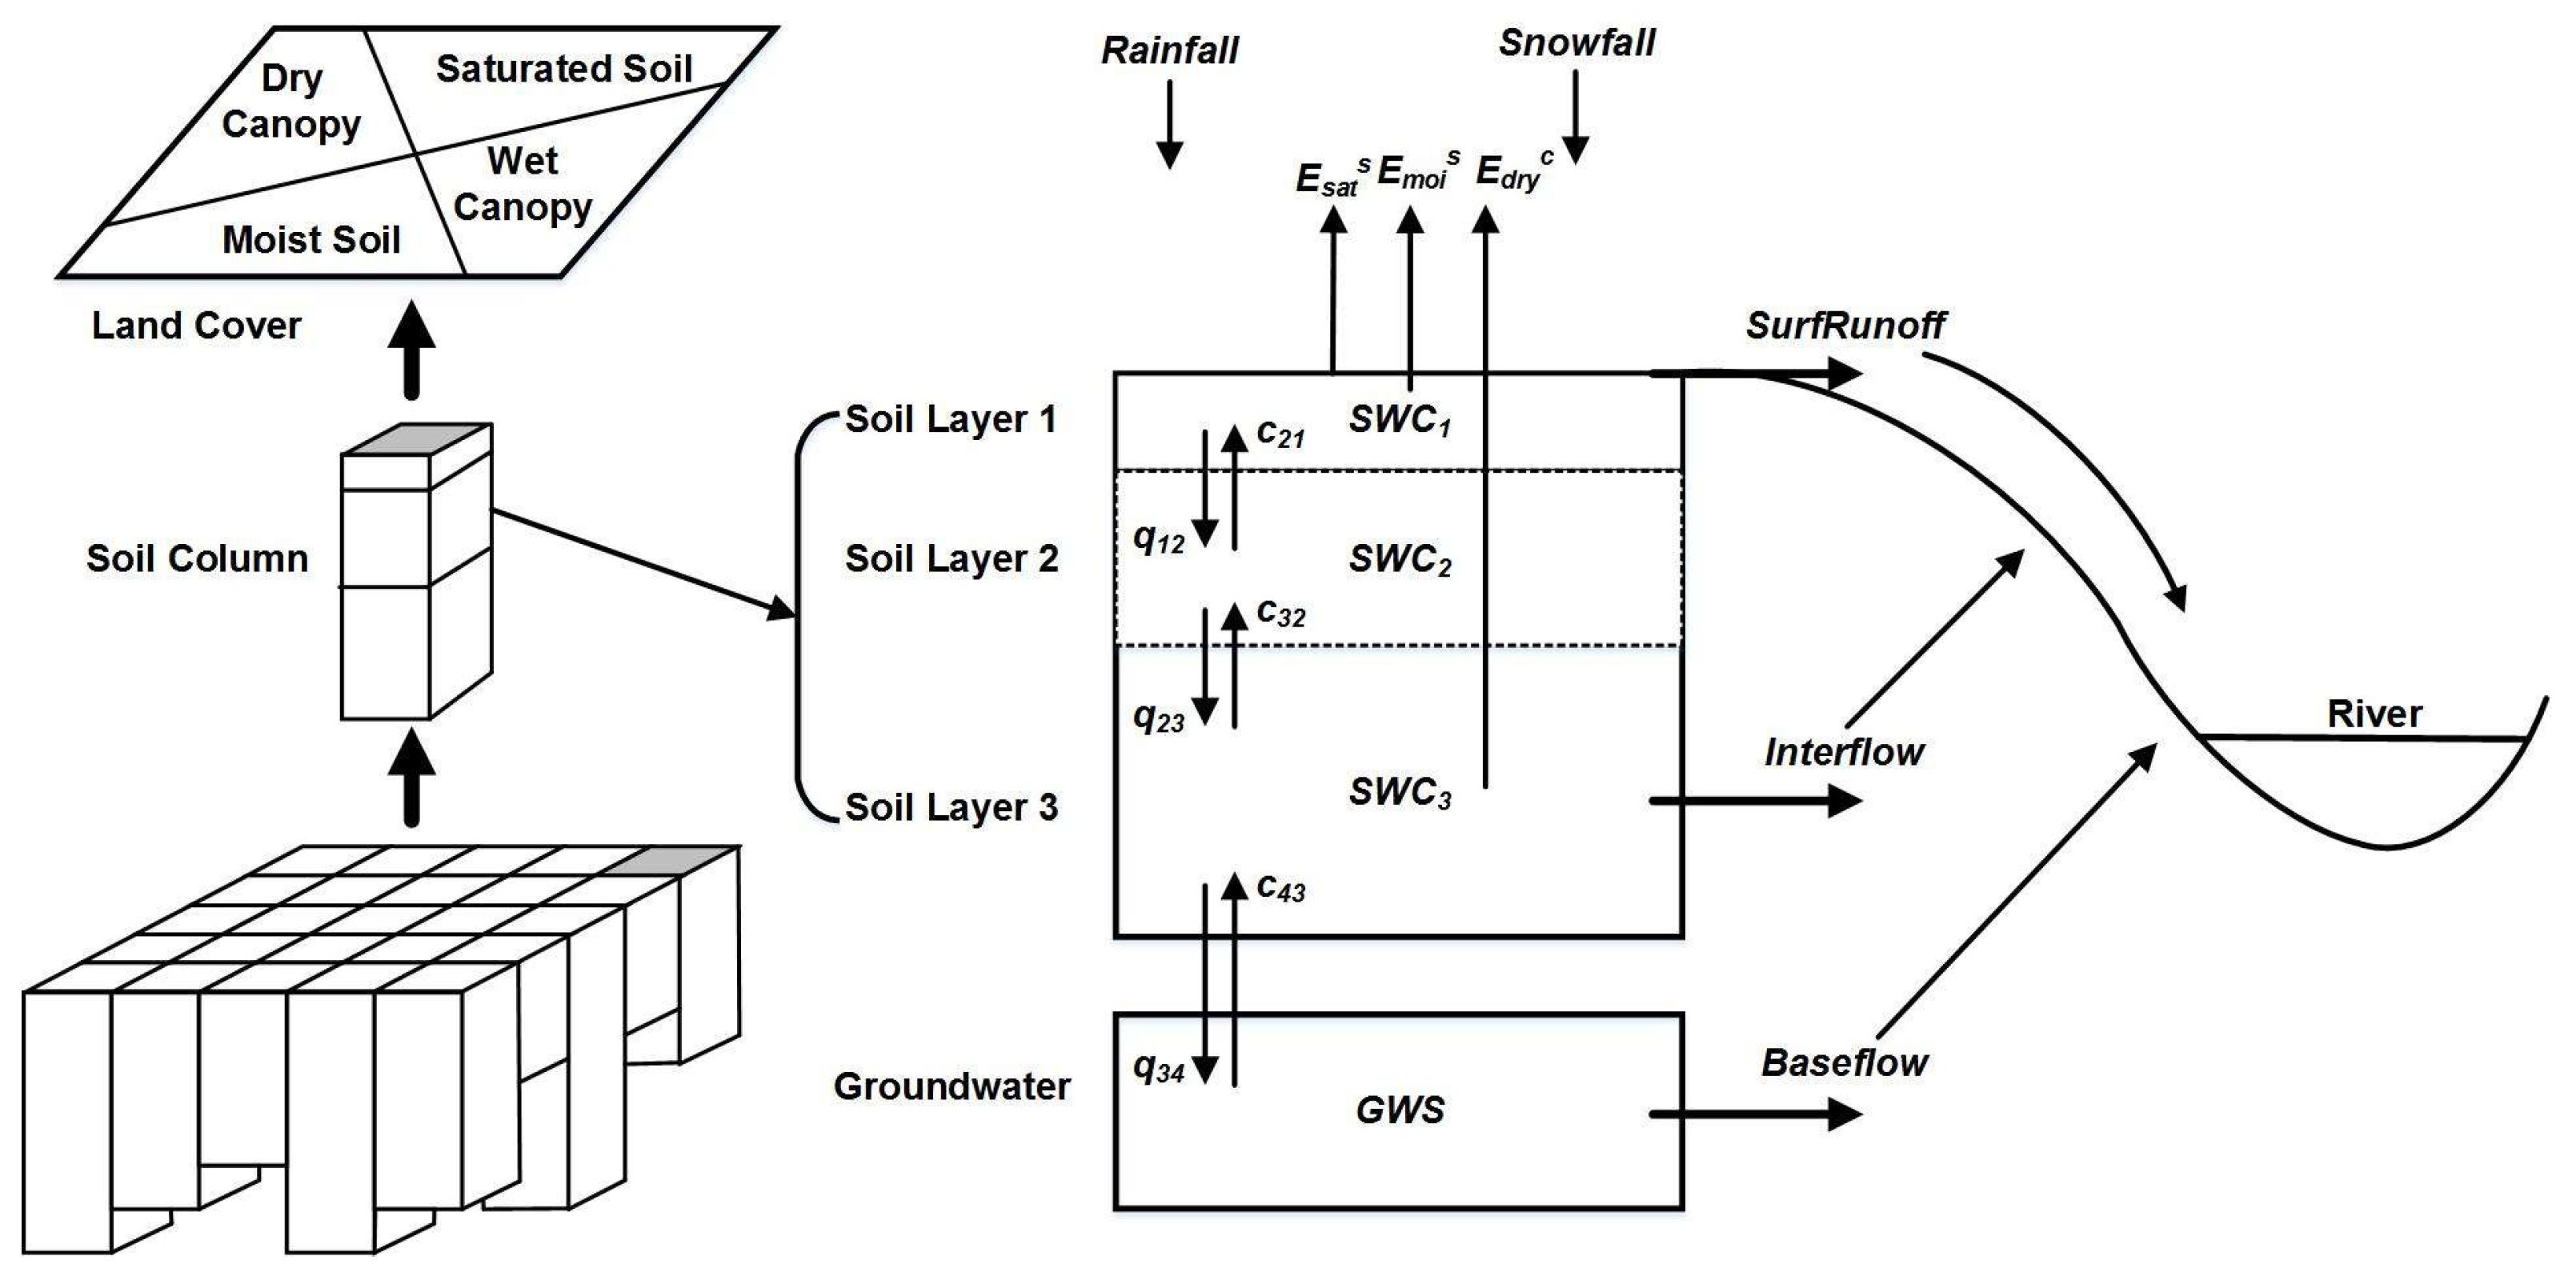
Recent enhancements were made to the ESSI model, as detailed in several works [16,17,18,19,20]. Notably, a three-layer soil water balance module and a remote sensing-based two-leaf Jarvis-type canopy conductance model (RST-Gc) were incorporated to simulate discharge and water exchange in soil water storage over the vertical soil column. Additionally, a first-order linear reservoir approach was employed to model groundwater storage and discharge. These modifications aimed to improve simulations of spatial heterogeneity in hydrological processes, reducing uncertainties and enabling reliable quantification of the influences of underlying surfaces and climate changes on the hydrological regime of the study region. The structural diagram of the ESSI-3 hydrological model is shown in Figure 2.
For model setup, Table 1 provides a summary of necessary datasets, including data type, spatial and temporal resolution, and duration. Model simulations were conducted at a 1 km × 1 km resolution from 2000 to 2020, with the first year for model state initialization and the subsequent years for calibration and validation. To account for varying spatial resolutions in input gridded datasets, appropriate interpolation methods, such as bilinear interpolation, were employed to upscale or downscale various datasets to a consistent spatial resolution.

2.3. Simulation Scenario Design and Model Evaluation

Two simulation scenarios were established for the period 2000–2020 to quantitatively assess the impact of climate and vegetation changes on hydrological components. The first scenario, termed the dynamic scenario, utilized dynamic LULC (2000–2020, yearly) and LAI data (2000–2020, daily). The second scenario, termed the constant scenario, employed fixed LULC (2000, yearly) and fixed LAI (2000, daily) data. Two scenarios were implemented over the 2000–2020 period using consistent meteorological forcings, distinguished primarily by variations in vegetation-related inputs such as LAI and LULC data. The constant simulation scenario assumed static vegetation conditions in XM-SP throughout 2000–2020, thereby isolating hydrological responses to climate variability alone. In contrast, the dynamic simulation scenario introduced spatiotemporal vegetation dynamics, integrating dynamically evolving vegetation data to simulate hydrological processes from 2000 to 2020. Disparities in hydrological responses between these two scenarios were analyzed in terms of their attribution to changes in vegetation dynamics.
The model setup using dynamic map data was employed for calibration and validation processes. Once model performance was deemed satisfactory, the same calibrated parameter set was utilized to evaluate model performance on LULC changes using the constant simulation scenario.
For model calibration, daily observed streamflow data at Jiamusi Station (130°21′ E, 46°49′ N) from 2008 to 2016 were employed, while monthly observed streamflow data from 2001 to 2007 were used for model validation. At the grid scale, due to the lack of actual observed values of evapotranspiration, the ETMOD16 product sequence was used as a reference value to evaluate the ESSI-3 model’s performance. The MOD16A2 product, based on MODIS terrestrial ET budgeting, provides estimates of actual evapotranspiration on the land surface, facilitating the evaluation of simulated evapotranspiration by the model. Additionally, GRACE-based Terrestrial Water Storage (TWS) data were utilized to evaluate the ESSI-3 model’s performance in simulating terrestrial water storage components.
The evaluation employed four common indicators, namely the correlation coefficient (R), Nash–Sutcliffe efficiency (NSE), bias, and determination coefficient (R²), as described in previous studies [19]. The ESSI-3 model was further employed to investigate the influence of climate and vegetation changes on hydrological components, categorizing them into three groups: runoff fluxes (including saturation excess surface runoff, interflow, baseflow, and groundwater recharge (GWR)); water storage components (including snow water equivalent (SWE), three soil reservoir water storages (SWC1, SWC2, and SWC3) and groundwater storage (GWS)); and evapotranspiration fluxes, including actual evapotranspiration (AET), potential evaporation (PET), and canopy transpiration (ETC).

2.4. Terrestrial Water Storage

TWS encompasses all forms of water held above and below the Earth’s land surfaces, including soil moisture, snow, groundwater, and water within biomass [40]. Generally, the change in TWS (ΔTWS), according to Xu et al. [18], can be calculated as:
Δ T W S = Δ S M S + Δ G W S + Δ C W S + Δ S W E
Here, SMS represents soil moisture storage, SWE is snow water equivalent, CWS is total canopy water storage, and GWS is groundwater storage. In this study, ΔTWS and its individual components simulated by the ESSI-3 model are calculated as (referring to Xu et al. [18]):
Δ T W S E S S I 3 = Δ S W C 1 + Δ S W C 2 + Δ S W C 3 + Δ G W S + Δ C W S + Δ S W E
Here, SWC1, SWC2, and SWC3 represent the first, second, and third soil moisture storage layers, respectively. The study characterizes ΔTWS using Gravity Recovery and Climate Experiment (GRACE) data. GRACE, leveraging precise Earth gravitational field measurements, has provided monthly variations in TWS since April 2002 [41]. The JPL RL06M.MSCNv02 GRACE mascon solutions were employed, offering 0.5° × 0.5° sampling resolution for global water storage anomalies [39]. Within the study region, these mascon solutions were extracted for ΔTWS investigation.
Scaling factors were applied to adjust the corresponding mascon grids for enhanced comparison between GRACE-TWS and ESSI-3 model data. Additionally, statistical analysis of ΔSWC1, ΔSWC2, ΔSWC3, ΔSWE, and ΔGWS simulated by the ESSI-3 model was conducted. These components were summed to obtain the monthly simulated ΔTWS time series. GRACE-TWS was computed relative to a time-mean baseline (Jan 2004 to Dec 2009) for all months. To facilitate comparisons with GRACE-TWS, the baseline values of each model-TWS individual component over 2004–2009 were computed and subtracted from all time steps.

2.5. Contribution Index and Statistical Analysis

To investigate the inter-annual variations (IAVs) in different vegetation types, the MCD12Q1 spanning from 2000 to 2020 was acquired and processed. Initially, unchanged vegetation cover pixels from 2001 to 2020 were isolated, and those pixels with a predominant land cover fraction were selected for further analysis. Five major land use/cover classes were identified, with water bodies and urban areas collectively constituting less than 2% of the study region and consequently excluded. Thus, three predominant vegetation types with substantial coverage were identified in the study region: forest/woodland, grass/shrubs, and croplands. The hydrological variable patterns of these different vegetation types and their influencing factors were explored based on this preliminary map.
To quantify the contribution of individual regions (i.e., climate zones) and hydrological components to the regional IAV, a contribution index (f j) was calculated using the methodology outlined in Ahlström et al. [42]. The contribution index (f j) is expressed as:
f j = IAVj/Total IVA
where IAVj represents the IAV of a specific region or hydrological component. Total IAV is the sum of IAV across all regions or hydrological components.
This index was employed to score individual geographic locations based on their consistency. Furthermore, spatiotemporal trends during the study period (2000–2020) were analyzed using Mann–Kendall statistical tests [43,44].

3. Results

3.1. Evaluation of the ESSI-3 Model Performance

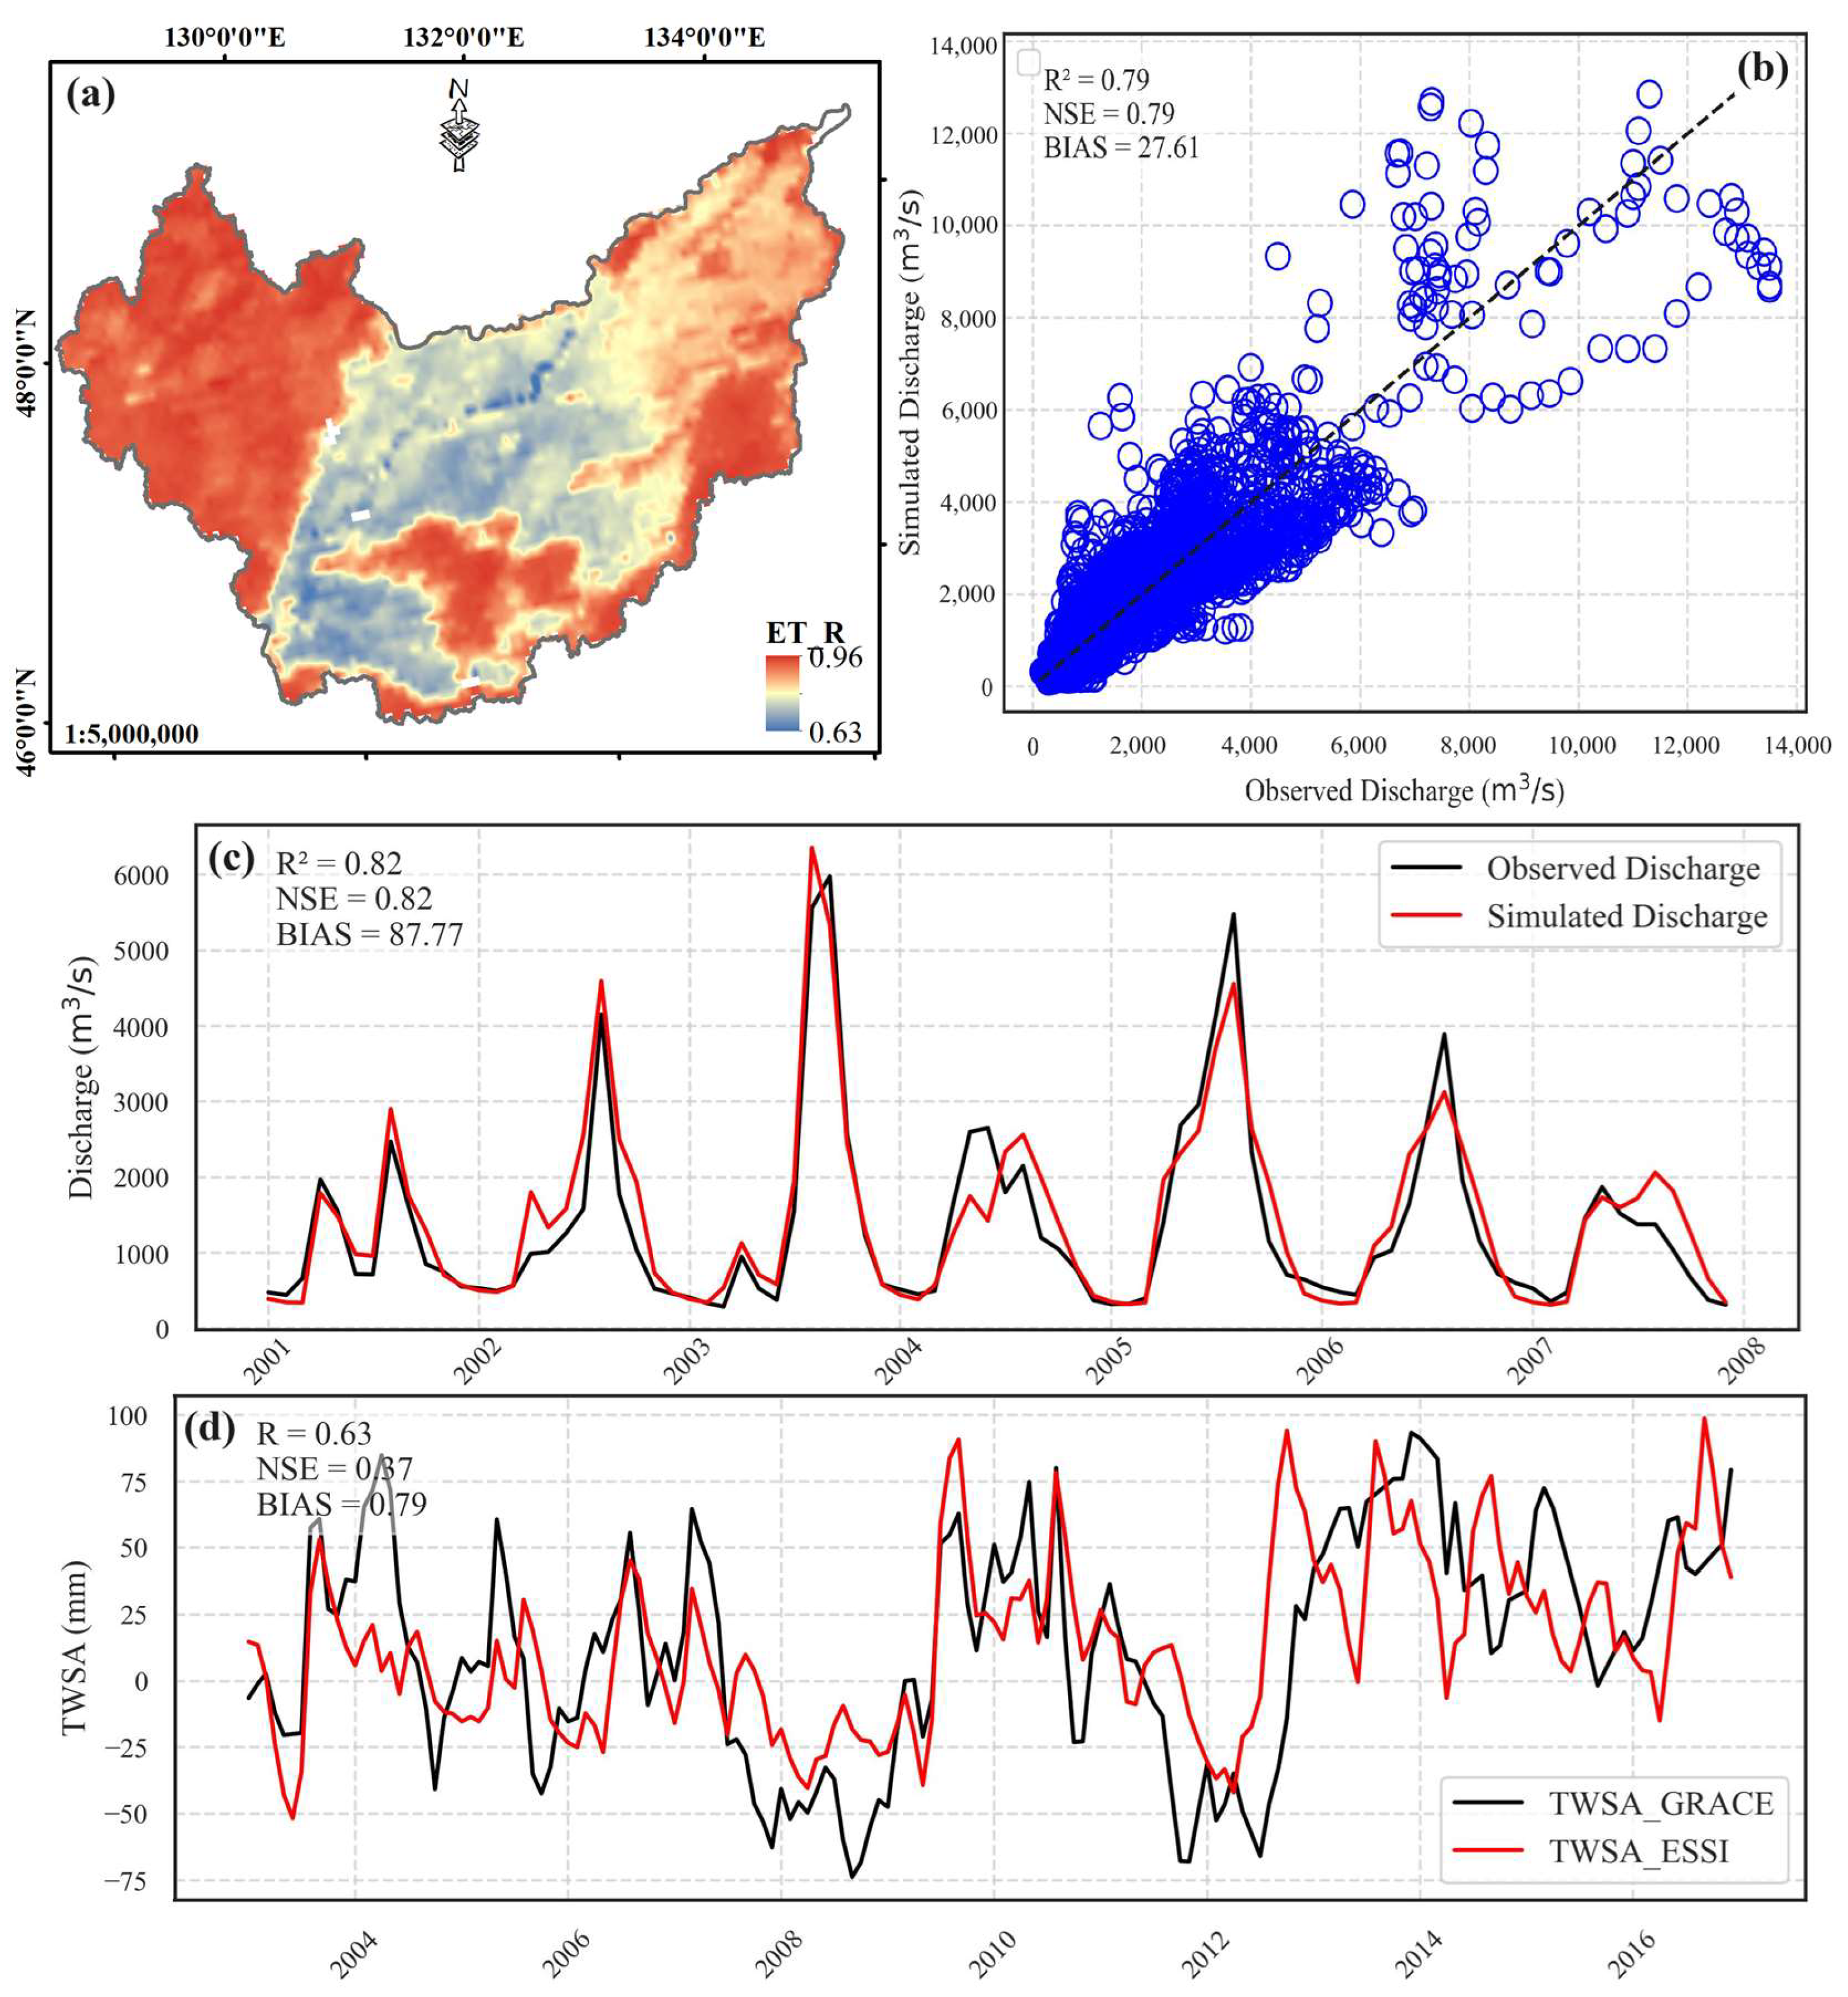
Figure 3 illustrates the evaluation of model performance through multivariate and multiscale approaches. Hydrological responses, particularly streamflow, offer high accuracy. Daily observed stream flows at the Jiamusi runoff gauging station (2008–2016) were compared with the daily flows simulated using the ESSI-3 model through the routing model with the river network. Throughout the calibration period, the daily streamflow exhibited commendable simulation outcomes (Figure 3b), characterized by an NSE of 0.79, R² of 0.79, and a bias of 27.61 m³/s. Routing parameters determined during calibration were then used for validation. The monthly streamflow during the validation periods (2001–2007) consistently maintained NSE and R² values above 0.82, thus achieving satisfactory simulation results (Figure 3c).
Furthermore, additional validations were conducted for the simulated actual evapotranspiration and terrestrial water storage. Figure 3a illustrates the spatial distribution of the correlation coefficient between ESSI-3 (ETESSI3) and MODIS ETMOD16 from 2000 to 2020. Notably, over 80% of the study region exhibited a correlation coefficient exceeding 0.8. Regions with lower correlation, predominantly characterized by croplands, revealed challenges in distinguishing C3 and C4 crops by MOD16, leading to diminished correlation. Conversely, the ESSI-3 model, designed with distinct parameterization methods for C3 and C4 crops, exhibited refined and more realistic evapotranspiration simulations.
Understanding dynamic changes in terrestrial water storage is pivotal in studying regional water cycle variations. Many global land surface models, such as the four main models of the Global Land Surface Data Assimilation System (GLDAS)—the VIC, CLM, MOSAIC, and NOAH models—lack parameterization on detailed groundwater exchange with surface hydrologic processes, limiting their applicability to a certain extent in detailed groundwater reserve estimations [45]. In this study, the ESSI-3 model, employing a simple linear reservoir scheme to describe the dynamics of groundwater reserves, addressed this limitation. Figure 3d displays monthly ∆TWSGRACE and ∆TWSESSI-3 from 2003 to 2016, revealing a coherent trend with a significant correlation coefficient of 0.63 (p < 0.01). This alignment suggests that the ESSI-3 model provides reliable estimates of terrestrial water storage components, offering a valuable tool for assessing responses to climate and land use/land cover changes, although the changes in terrestrial water storage caused by anthropogenic factors and changes in surface water storage such as lakes, rivers, and reservoirs are not taken into account in the ESSI-3 model.
In summary, despite some biases and uncertainties in specific seasons, the ESSI-3 model effectively reproduced runoff hydrographs, indicating its capability to estimate long-term ET and TWS, aligning with observed precipitation and runoff. The improved physically based distributed hydrological model lays a robust foundation for estimating hydrological components and exploring their variations and potential influencing factors.

3.2. The Dynamics of Climate, Vegetation, and Terrestrial Water Storage Observed through Remote Sensing and Reanalysis Data

3.2.1. Climate Changes

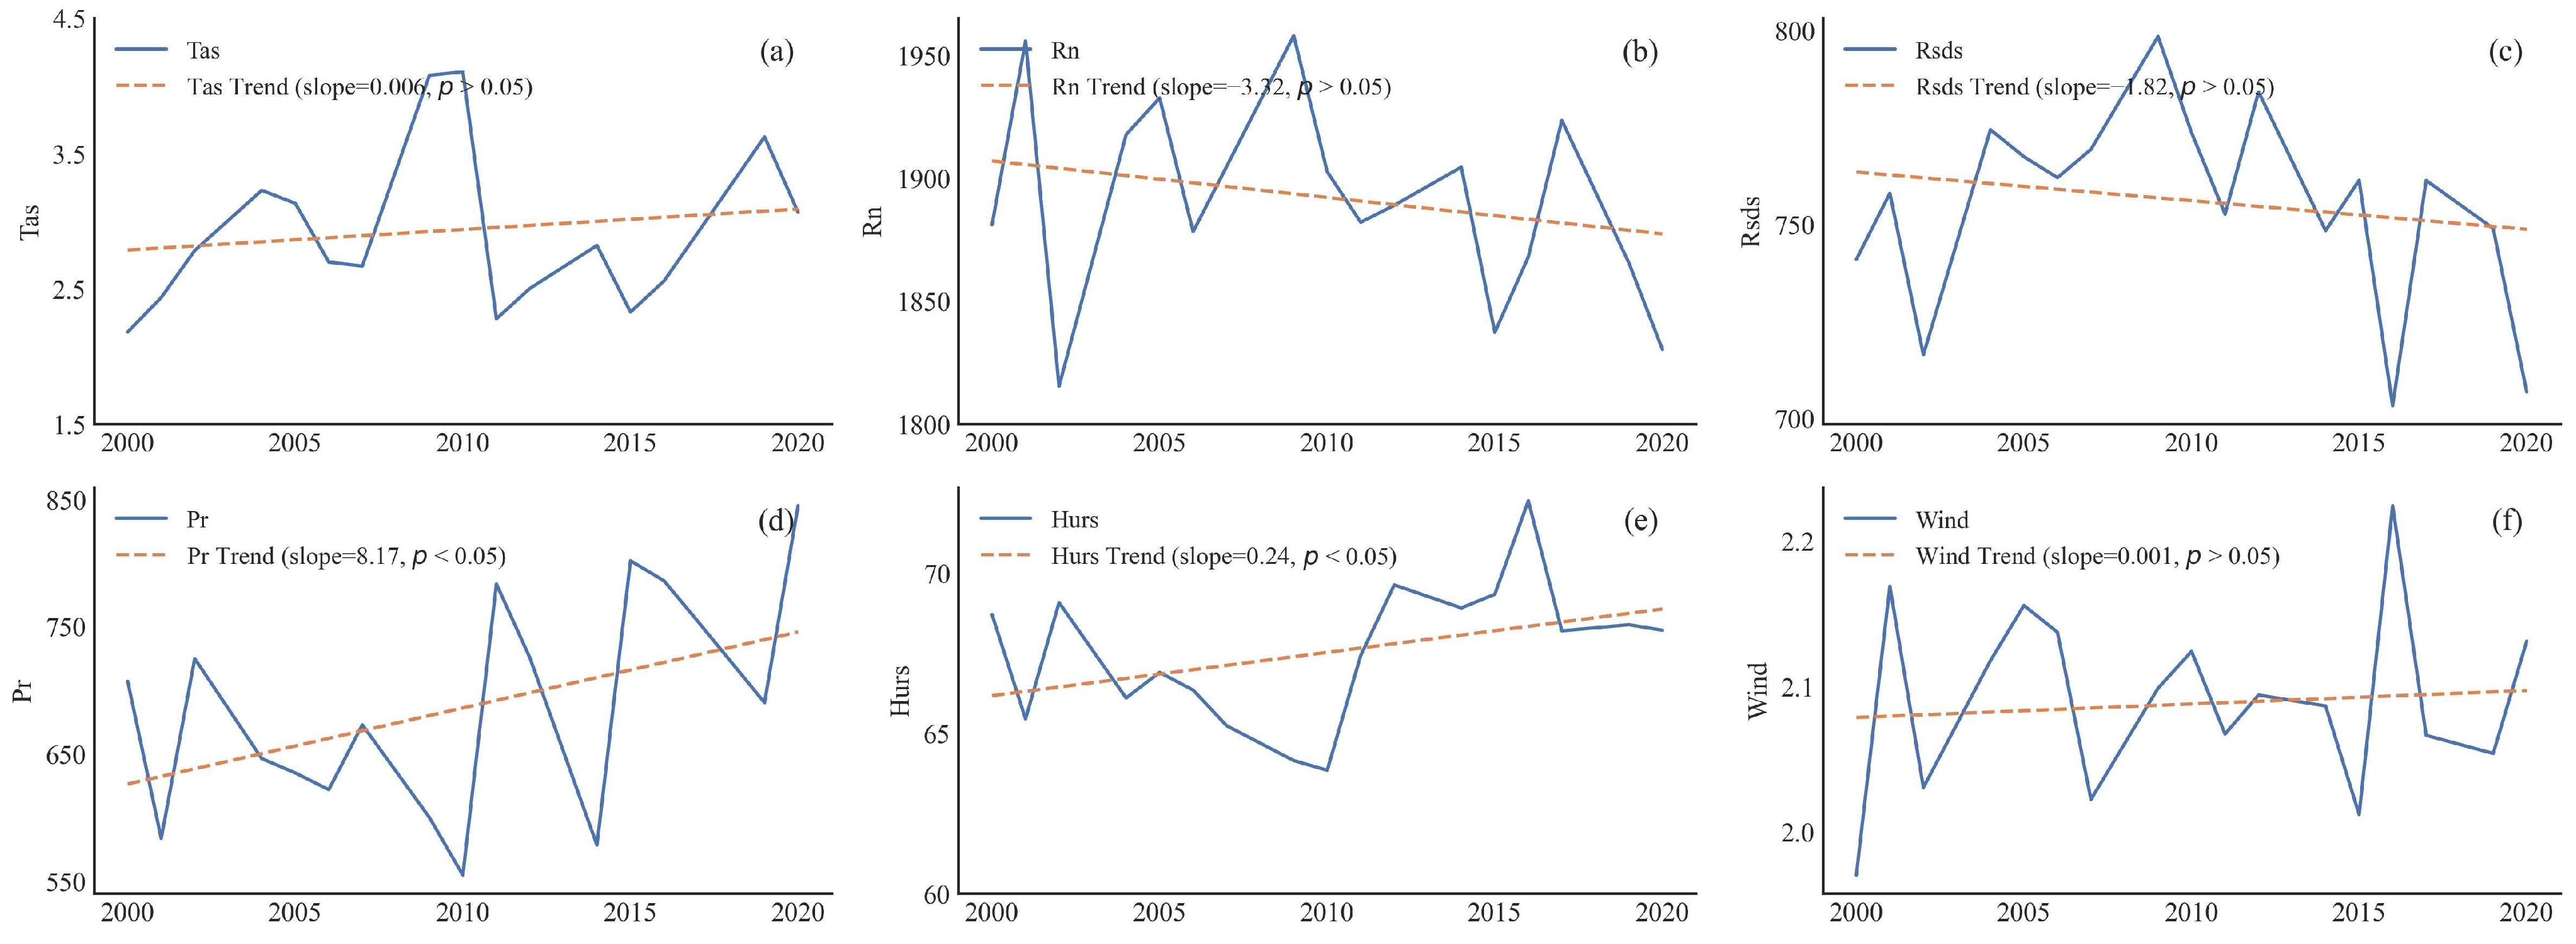
Figure 4 illustrates the annual variations in climate variables, including mean temperature (Tas), net radiation (Rn), downward shortwave radiation (Rsds), precipitation (Pr), relative humidity (RH), and wind speed (WS), over the study region for the past 20 years. To discern trends and abrupt changes in climate variables at an annual scale, the Mann–Kendall test was applied to analyze these indices from 2000 to 2020 at a confidence level of 95%. Throughout the study period, the annual mean Tas in the region fluctuated from a minimum of 2.18 °C in 2000 to a maximum of 4.10 ℃ in 2008, showing a statistically non-significant increase of about 0.006 °C/yr (p > 0.05). Regarding indicators representing changes in surface energy input at land surfaces, i.e., Rn and net Rsds, a general declining trend (p > 0.05) was observed, with multi-year average rates of change being −3.32 W/(m²·yr) and −1.82 W/(m²·yr), respectively. Changes in area-averaged annual mean Pr and RH during the same period demonstrated a statistically significant increasing trend (p < 0.05), with rates of increase measured at 8.17 mm/yr and 0.24%/yr, respectively. A relatively stable inter-annual fluctuation for WS was observed (0.001 ms−1 /yr, p > 0.05).
Figure 5 illustrates the spatial variation of six climatic factors in XM-SP. Firstly, it was noteworthy that the spatial patterns of Pr, Rsds, and RH demonstrated a consistent trend across the entire region (Figure 5c,d). In contrast, other climatic variables exhibited mixed trends of increase and decrease with pronounced spatial disparities. Pr and RH generally increased throughout the region, whereas Rsds showed an overall decline. Hotspots of increased Pr were predominantly found in the western Xiaoxinganling Mountains, coinciding with notable increases in RH and decreases in Tas, Rn, Rsds, and WS in these areas. This suggested a potential positive correlation among these climatic variables in the eastern part of the region. Conversely, climatic changes observed in the central and western plains were more intricate, likely influenced by a combination of natural factors and anthropogenic activities.

3.2.2. LULC Changes

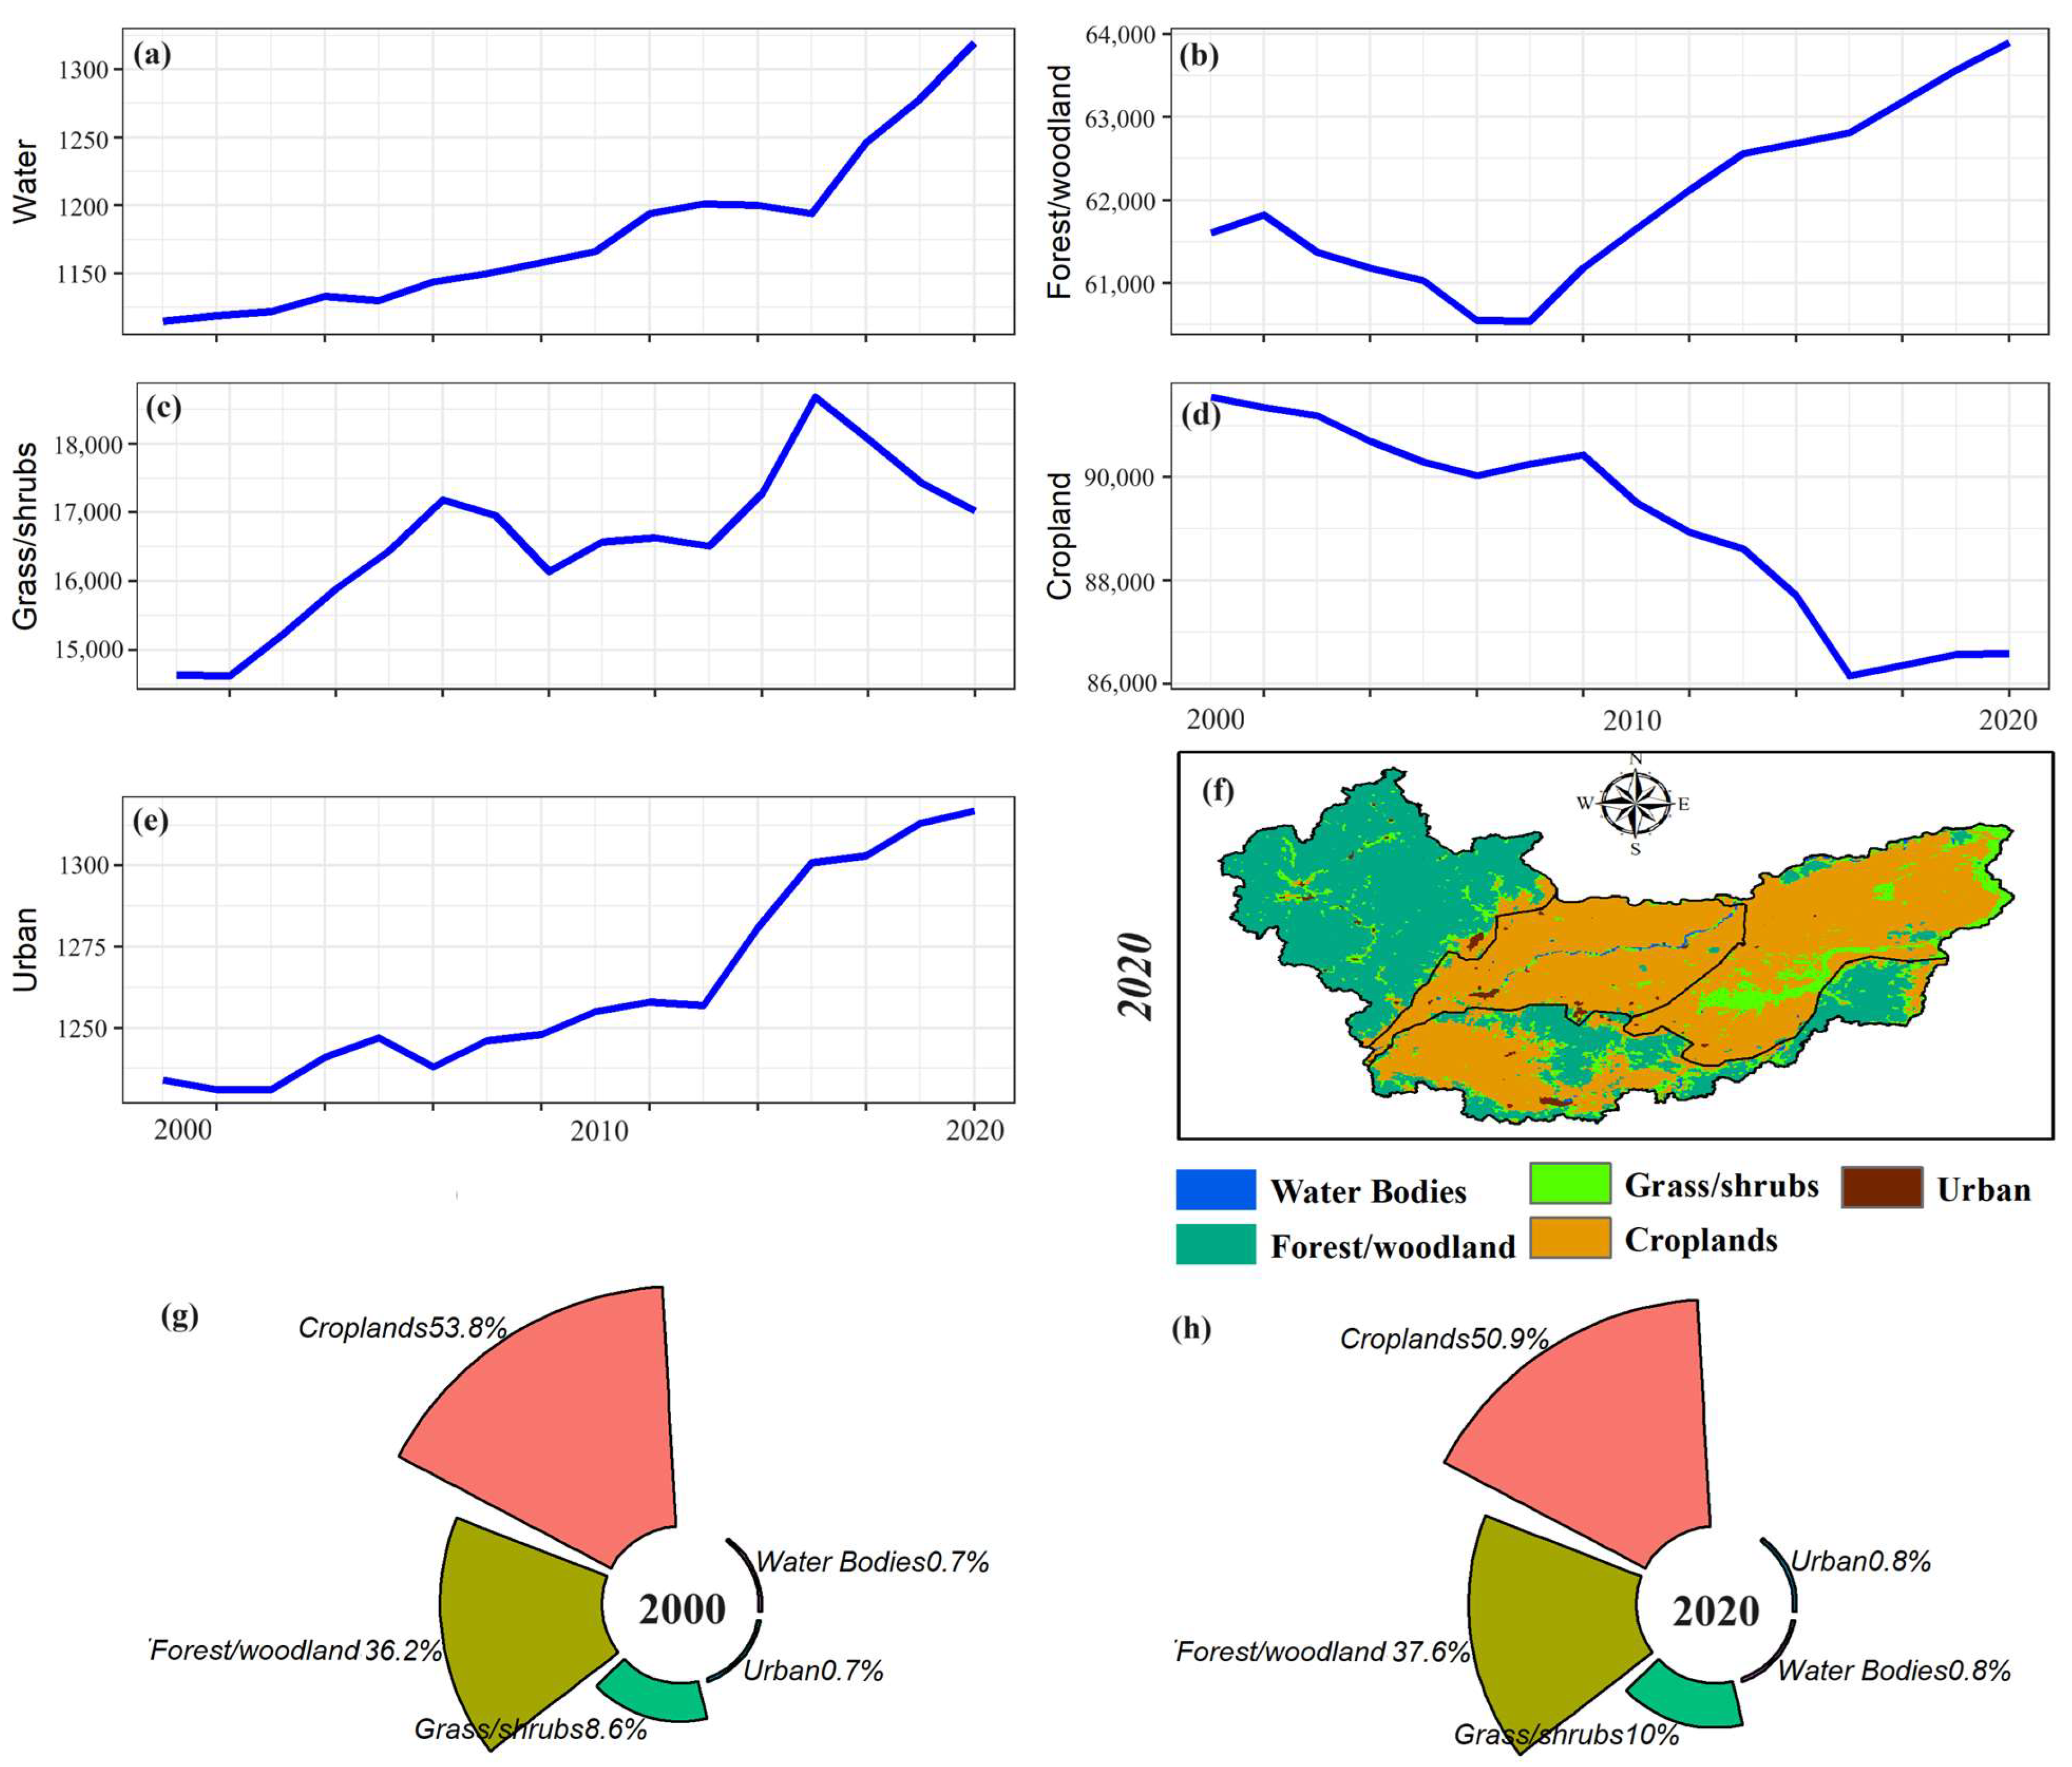
Using the MCD12Q1 LULC dataset based on remote sensing observations, the changes in the five main land use/cover types from 2000 to 2020 were investigated (as illustrated in Figure 6), including forest/woodland, grass/shrubs, cropland, urban land, and water. In 2000, cropland, forest/woodland, and grass/shrubs dominated the study region, covering approximately 53.8%, 36.2%, and 8.6% of the total area, respectively. By 2020, cropland had decreased to cover 50.9% of the area, while forest/woodland and grass/shrubs expanded to cover 37.6% and 10.0%, respectively. The decrease in agricultural land was mainly due to conversion to forest/woodland and grass/shrubs.
While the loss of cropland and expansion of forest/woodland and grass/shrubs may influence hydrological components, significant changes were not observed at the regional-average scale. However, changes in land use/cover may have significant impacts at smaller scales, such as sub-watershed levels. In addition, it is important to emphasize that the hydrological model utilizes LULC data based on MCD12Q1, which is annually updated. From this perspective, the changes are more substantial, exhibiting a variety of trends including sharp declines, monotonic increases, and gradual shifts. Nevertheless, focusing solely on the magnitude of LULC changes may not yield conclusive insights into their impact on hydrological processes. Therefore, to further explore the significant changes in this region, a spatiotemporal analysis of the regional LAI and TWSA was conducted.

3.2.3. Changes in LAI and TWSA

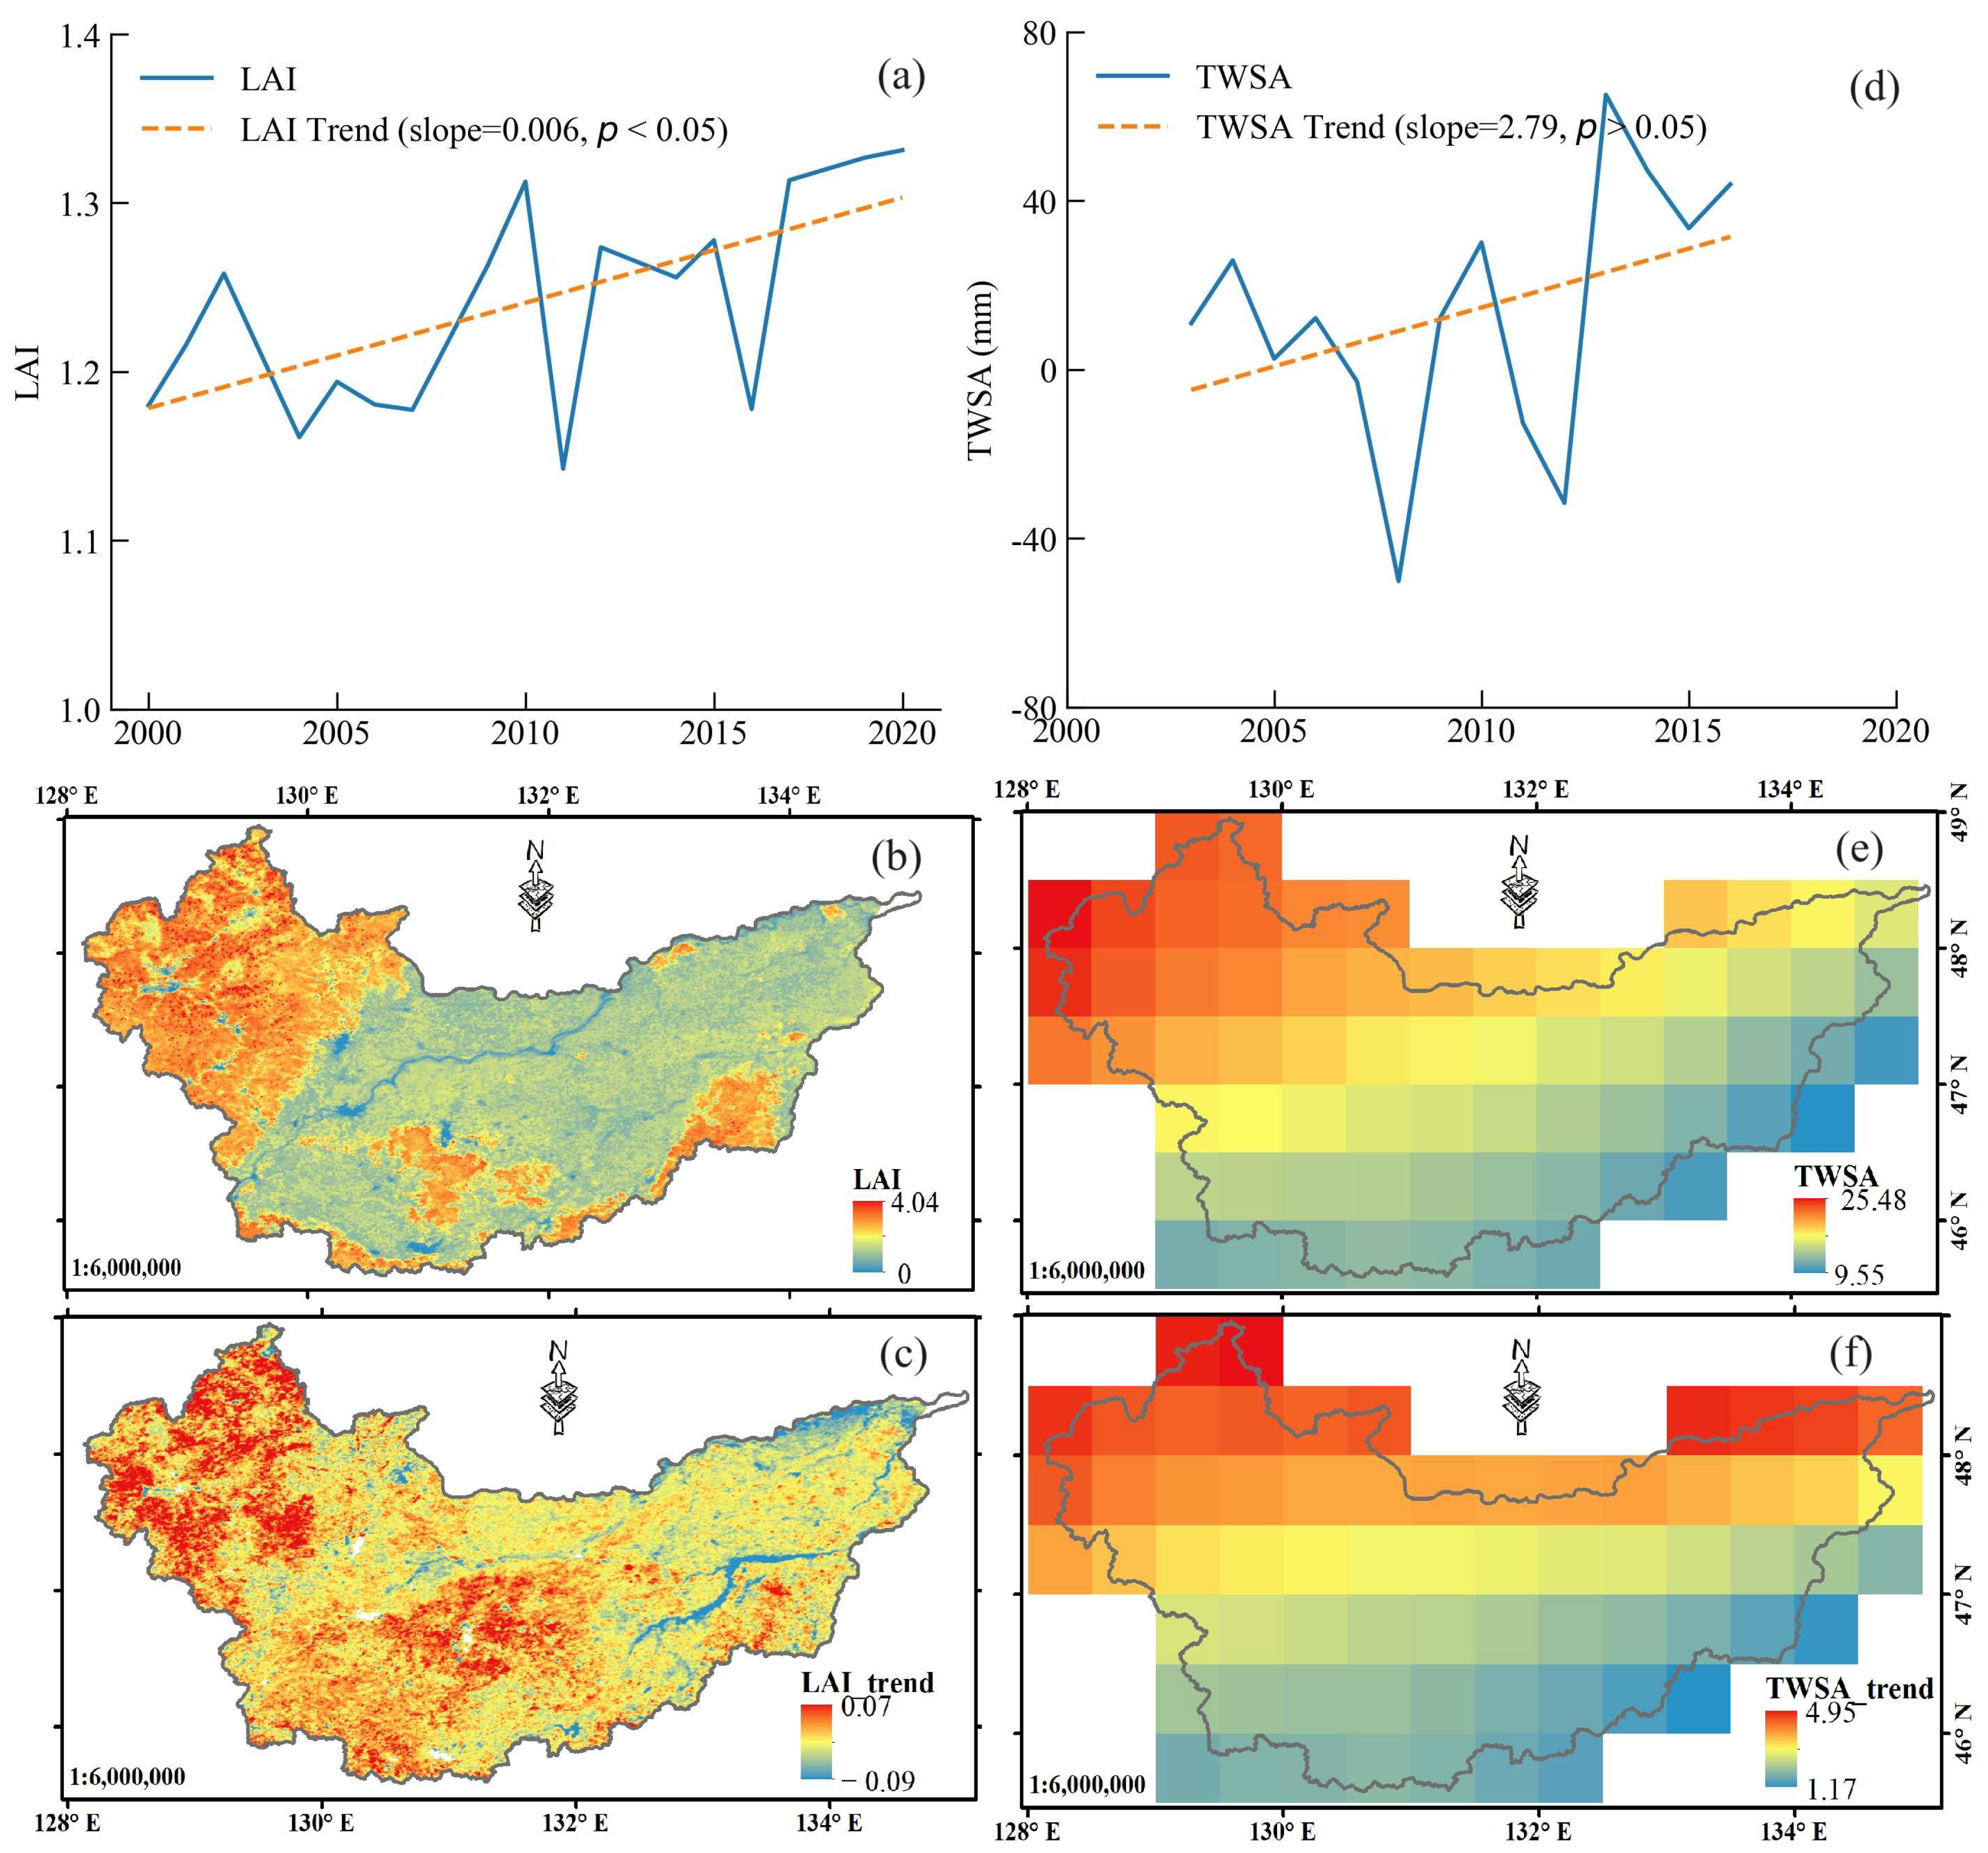
Using the GLASS LAI and GRACE Mascon datasets based on remote sensing observations, we investigated the spatiotemporal dynamics of regional vegetation greening spanning 2000 to 2020, alongside TWSA from 2003 to 2016 (see Figure 7). The results revealed a statistically significant upward trend in LAI throughout the study period (p < 0.05). Specifically, regions experiencing significant (p < 0.05, slope > 0) and slight increases (p > 0.05, slope > 0) in LAI constituted 28.2% and 48.3% of the study area, respectively. Conversely, areas exhibiting a decreasing trend in LAI accounted for less than 24%, with only 3.4% demonstrating a statistically significant decrease. Significant increases in LAI were predominantly observed in the eastern mountainous areas and central Sanjiang Plain, while decreases were concentrated along the main stem of the Songhua River, Naoli River, and Heilongjiang River. From 2003 to 2016, there was a statistically significant increasing trend in regional TWSA over the temporal scale. Spatially, the trends indicated consistent increases across the entire region, ranging from 1.17 mm/yr to 4.95 mm/yr. Moreover, the spatial distribution of multi-year means and trends demonstrated a gradual increase from southeast to northwest, aligning with patterns observed in precipitation, temperature, and vegetation dynamics.

3.3. Dynamics and Responses of Hydrological Components at Regional Scale

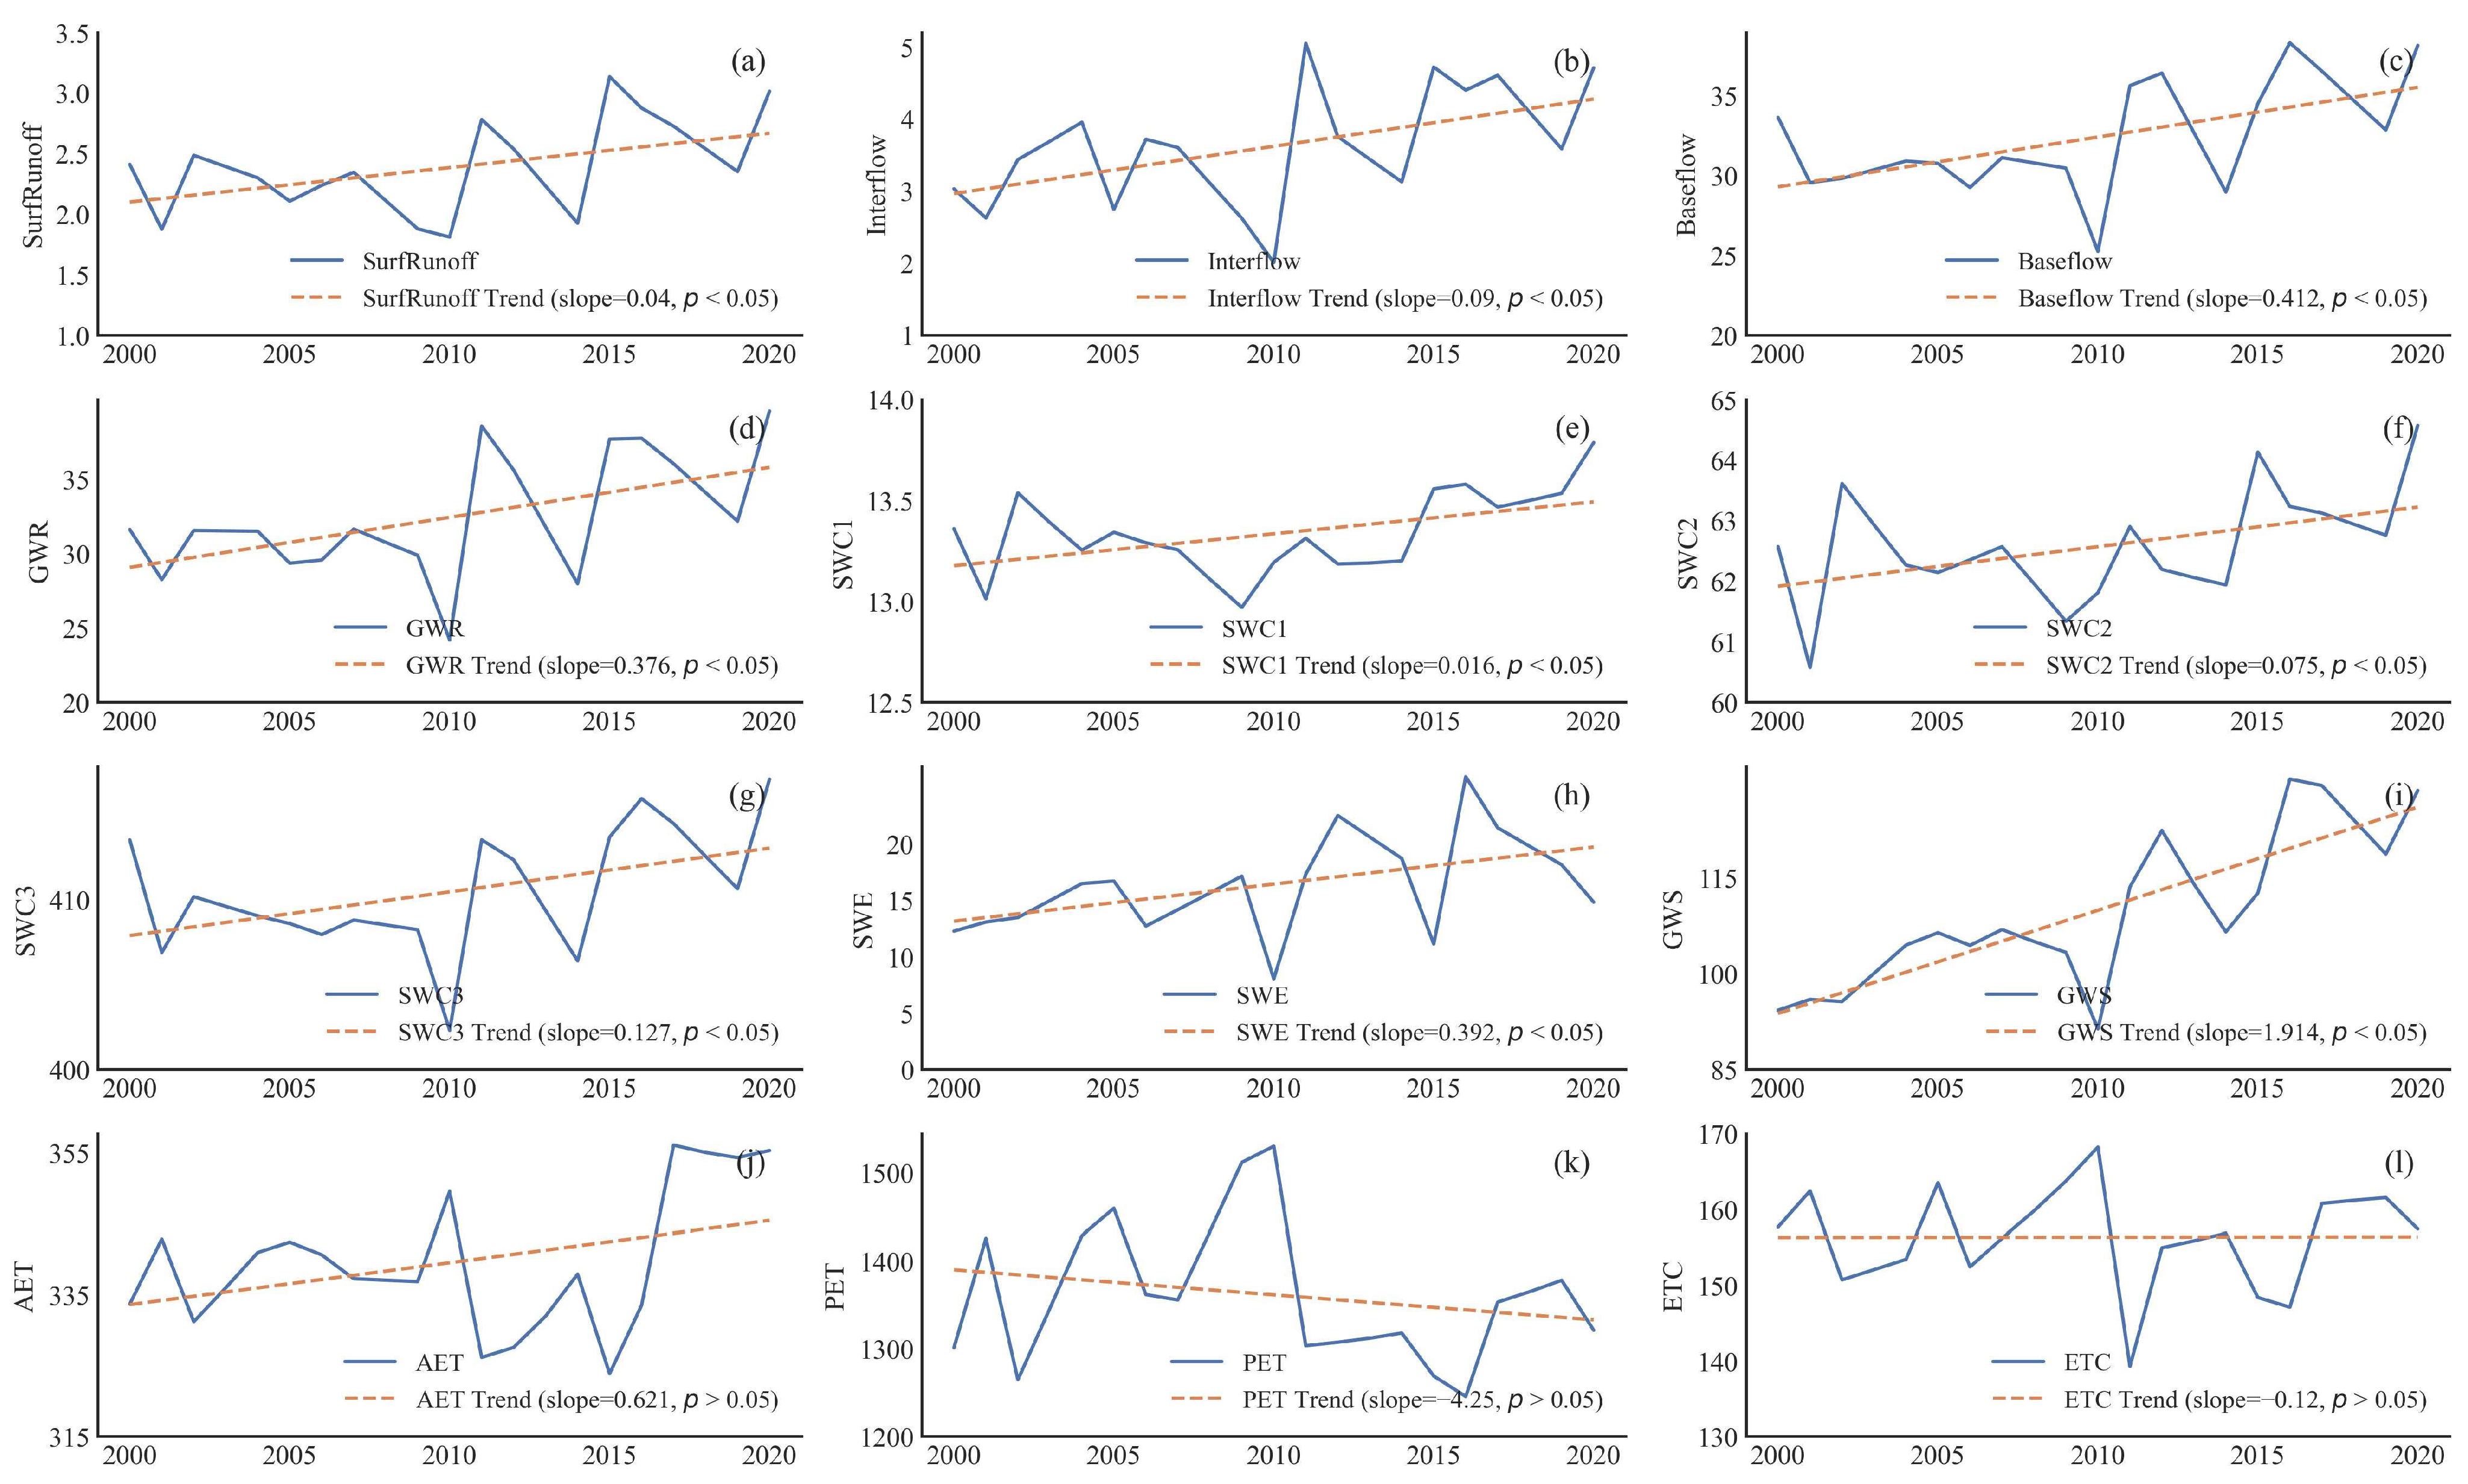
Figure 8 illustrates the interannual variations of twelve hydrological components in the study region under the dynamic scenario, encompassing four runoff fluxes, five water storage components, and three evapotranspiration fluxes. As depicted in Figure 8a–d, the results revealed a statistically significant upward trend (p < 0.05) in all four runoff fluxes throughout the study period. Specifically, surface runoff, interflow, baseflow, and GWR exhibited annual increases of 0.04 mm/year, 0.09 mm/year, 0.41 mm/year, and 0.38 mm/year, respectively, over the past 20 years. Similarly, a statistically significant upward trend (p < 0.05) was observed in all five water storage components throughout the study period. The slopes ranged from 0.02 mm/year to 1.91 mm/year for the five water storage components (Figure 8e–i). For three evapotranspiration fluxes, PET and ETC exhibited a decreasing trend with slopes of −4.25 mm/year and −0.12 mm/year, respectively, over the past 20 years. Conversely, AET increased with a slope of 0.62 mm/year (Figure 8j–l). However, the trends in the absolute change of three evapotranspiration fluxes were statistically non-significant (p > 0.05).
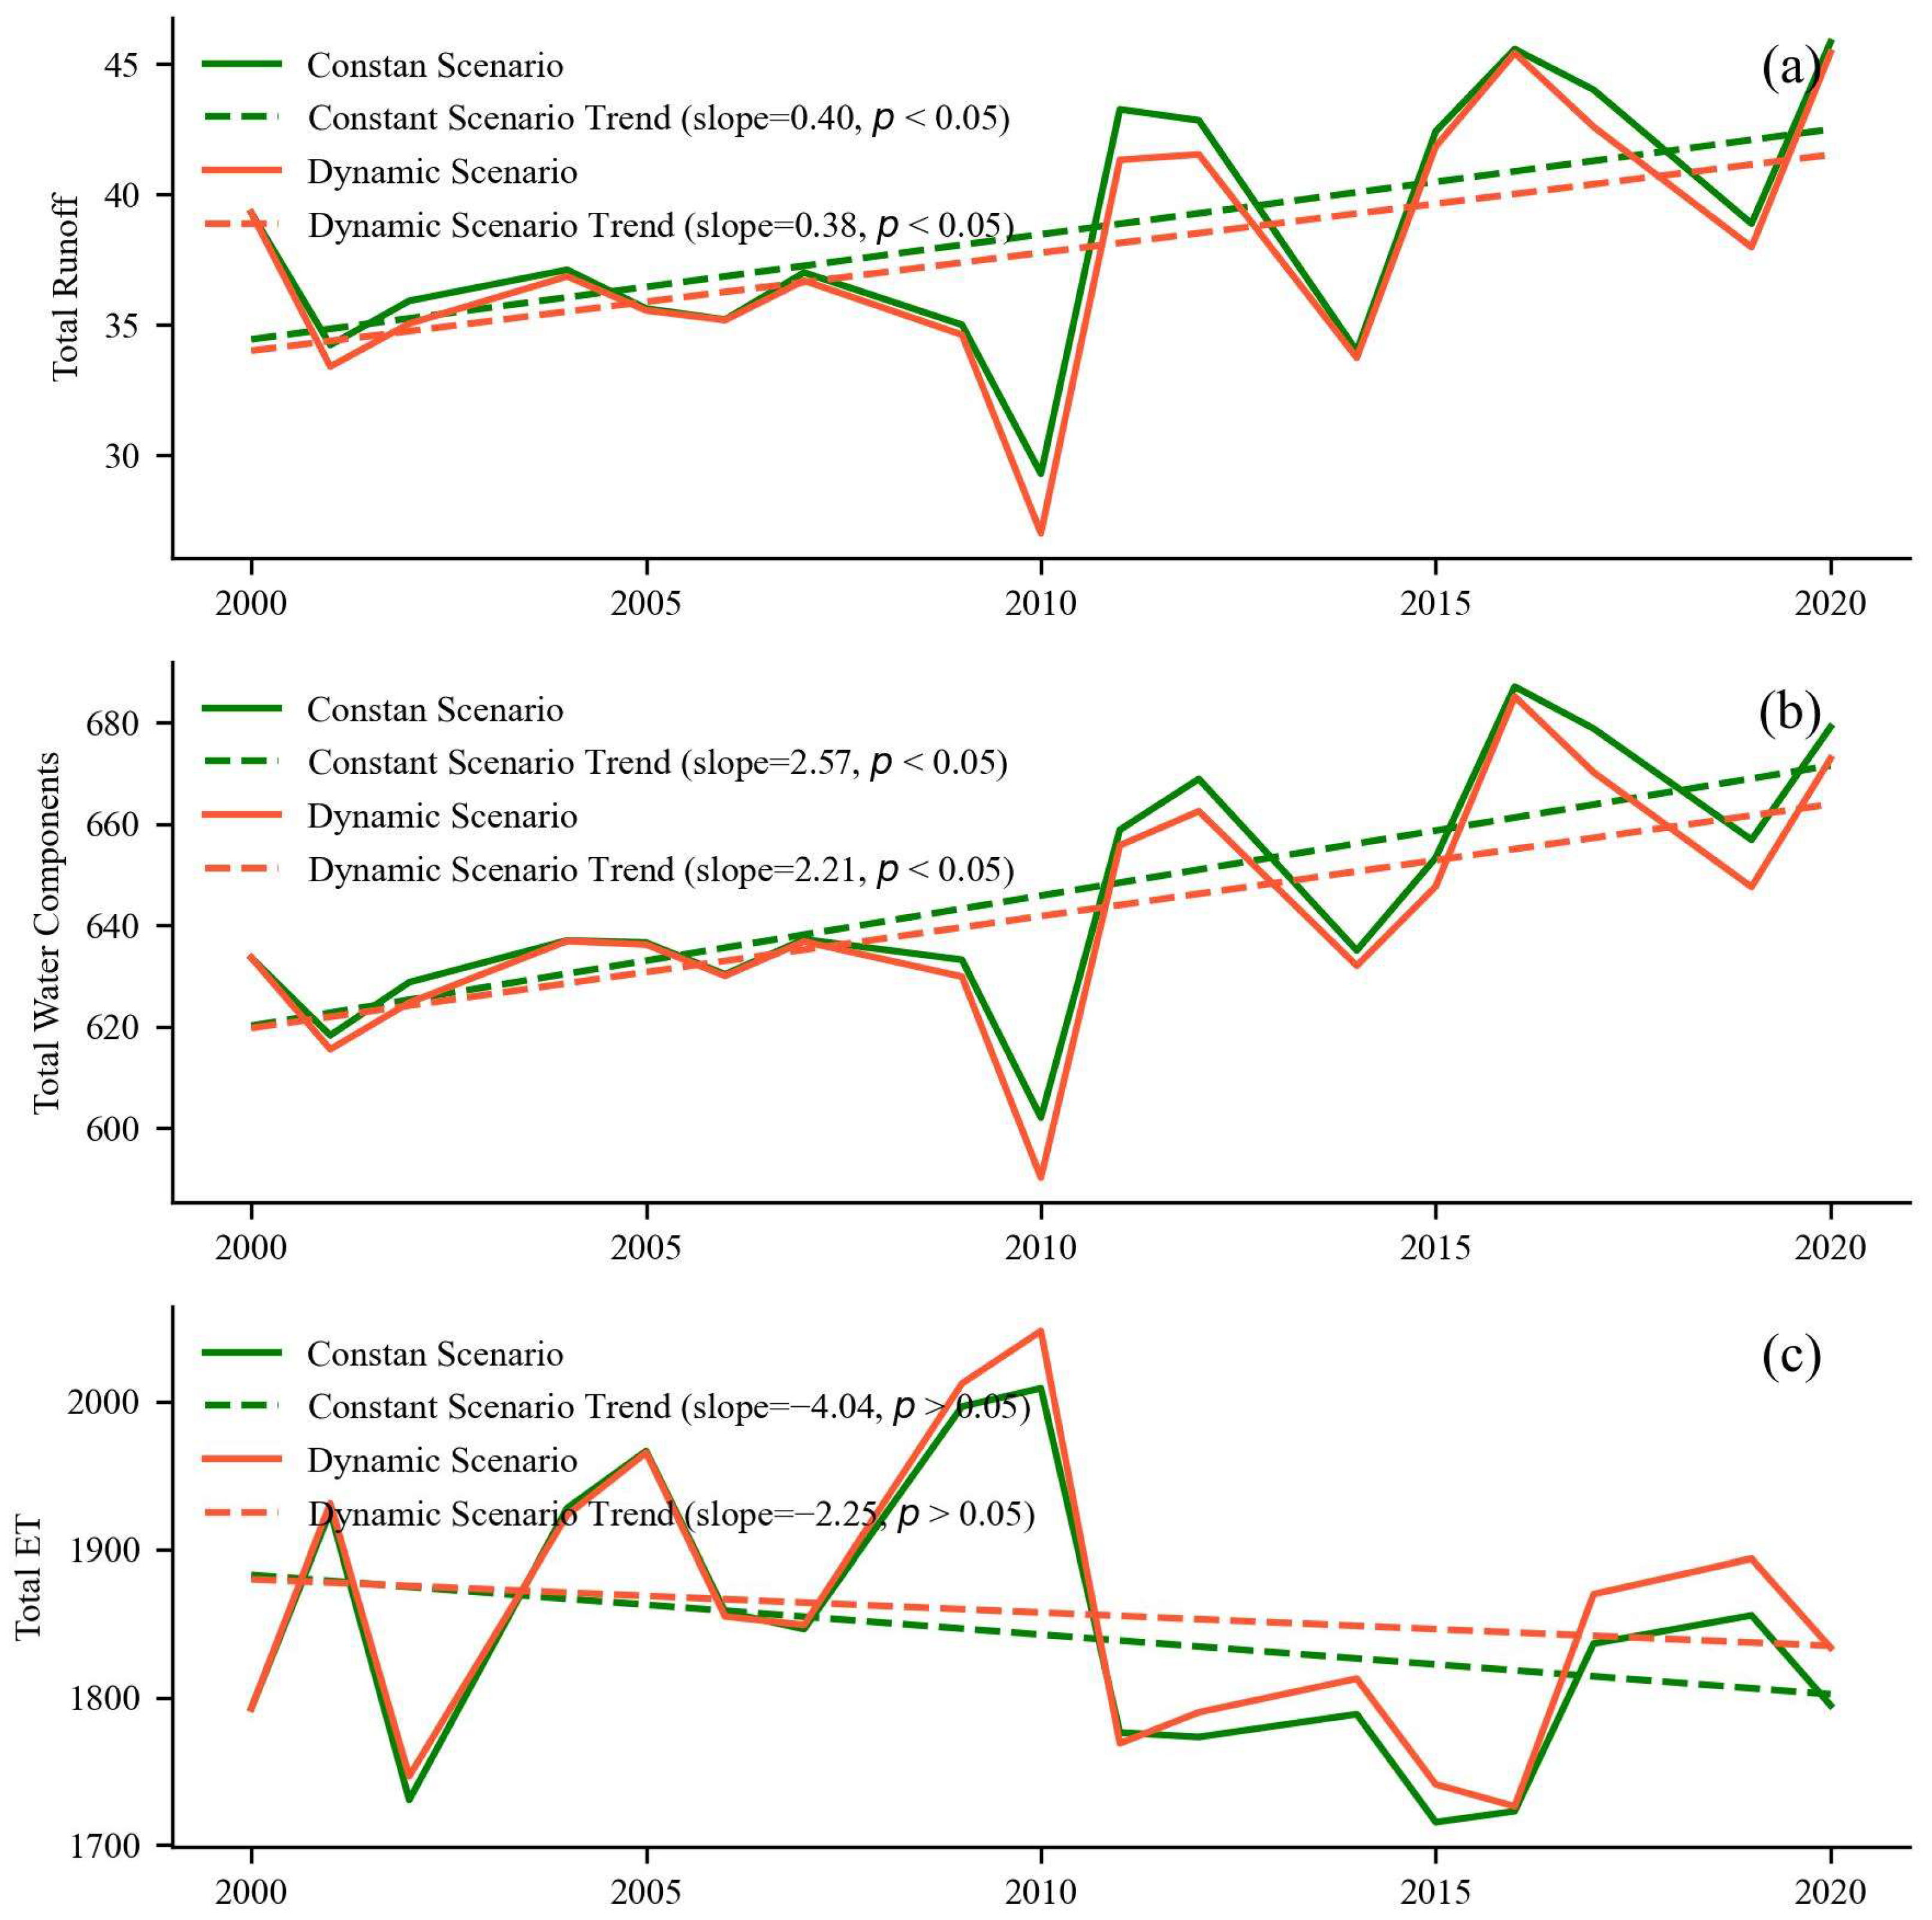
To reveal the impact of vegetation greening on regional hydrological processes, the changes in total runoff (the sum of four runoff fluxes), total water storage (the sum of five water storage components), and total evapotranspiration (the sum of three evapotranspiration fluxes) under two simulated scenarios were analyzed, as illustrated in Figure 9. The results indicated that vegetation greening resulted in a reduction in the annual trend slopes for total runoff and total water storage from 0.40 mm/year and 2.57 mm/year to 0.38 mm/year and 2.21 mm/year, respectively, over the period from 2000 to 2020. Concurrently, the annual decline trend slope for total evapotranspiration decelerated from −4.04 mm/year to −2.25 mm/year. Hence, from a regional perspective, the annual variation trends in both fluxes and storages were predominantly influenced by climate changes. Although vegetation changes alone could not reverse the annual trends of hydrological variables, the dynamics of vegetation greening promoted an increase in total evapotranspiration (Figure 9c) while attenuating the increase in total runoff (Figure 9a), thereby ultimately suppressing the rise in total water storage (Figure 9b).
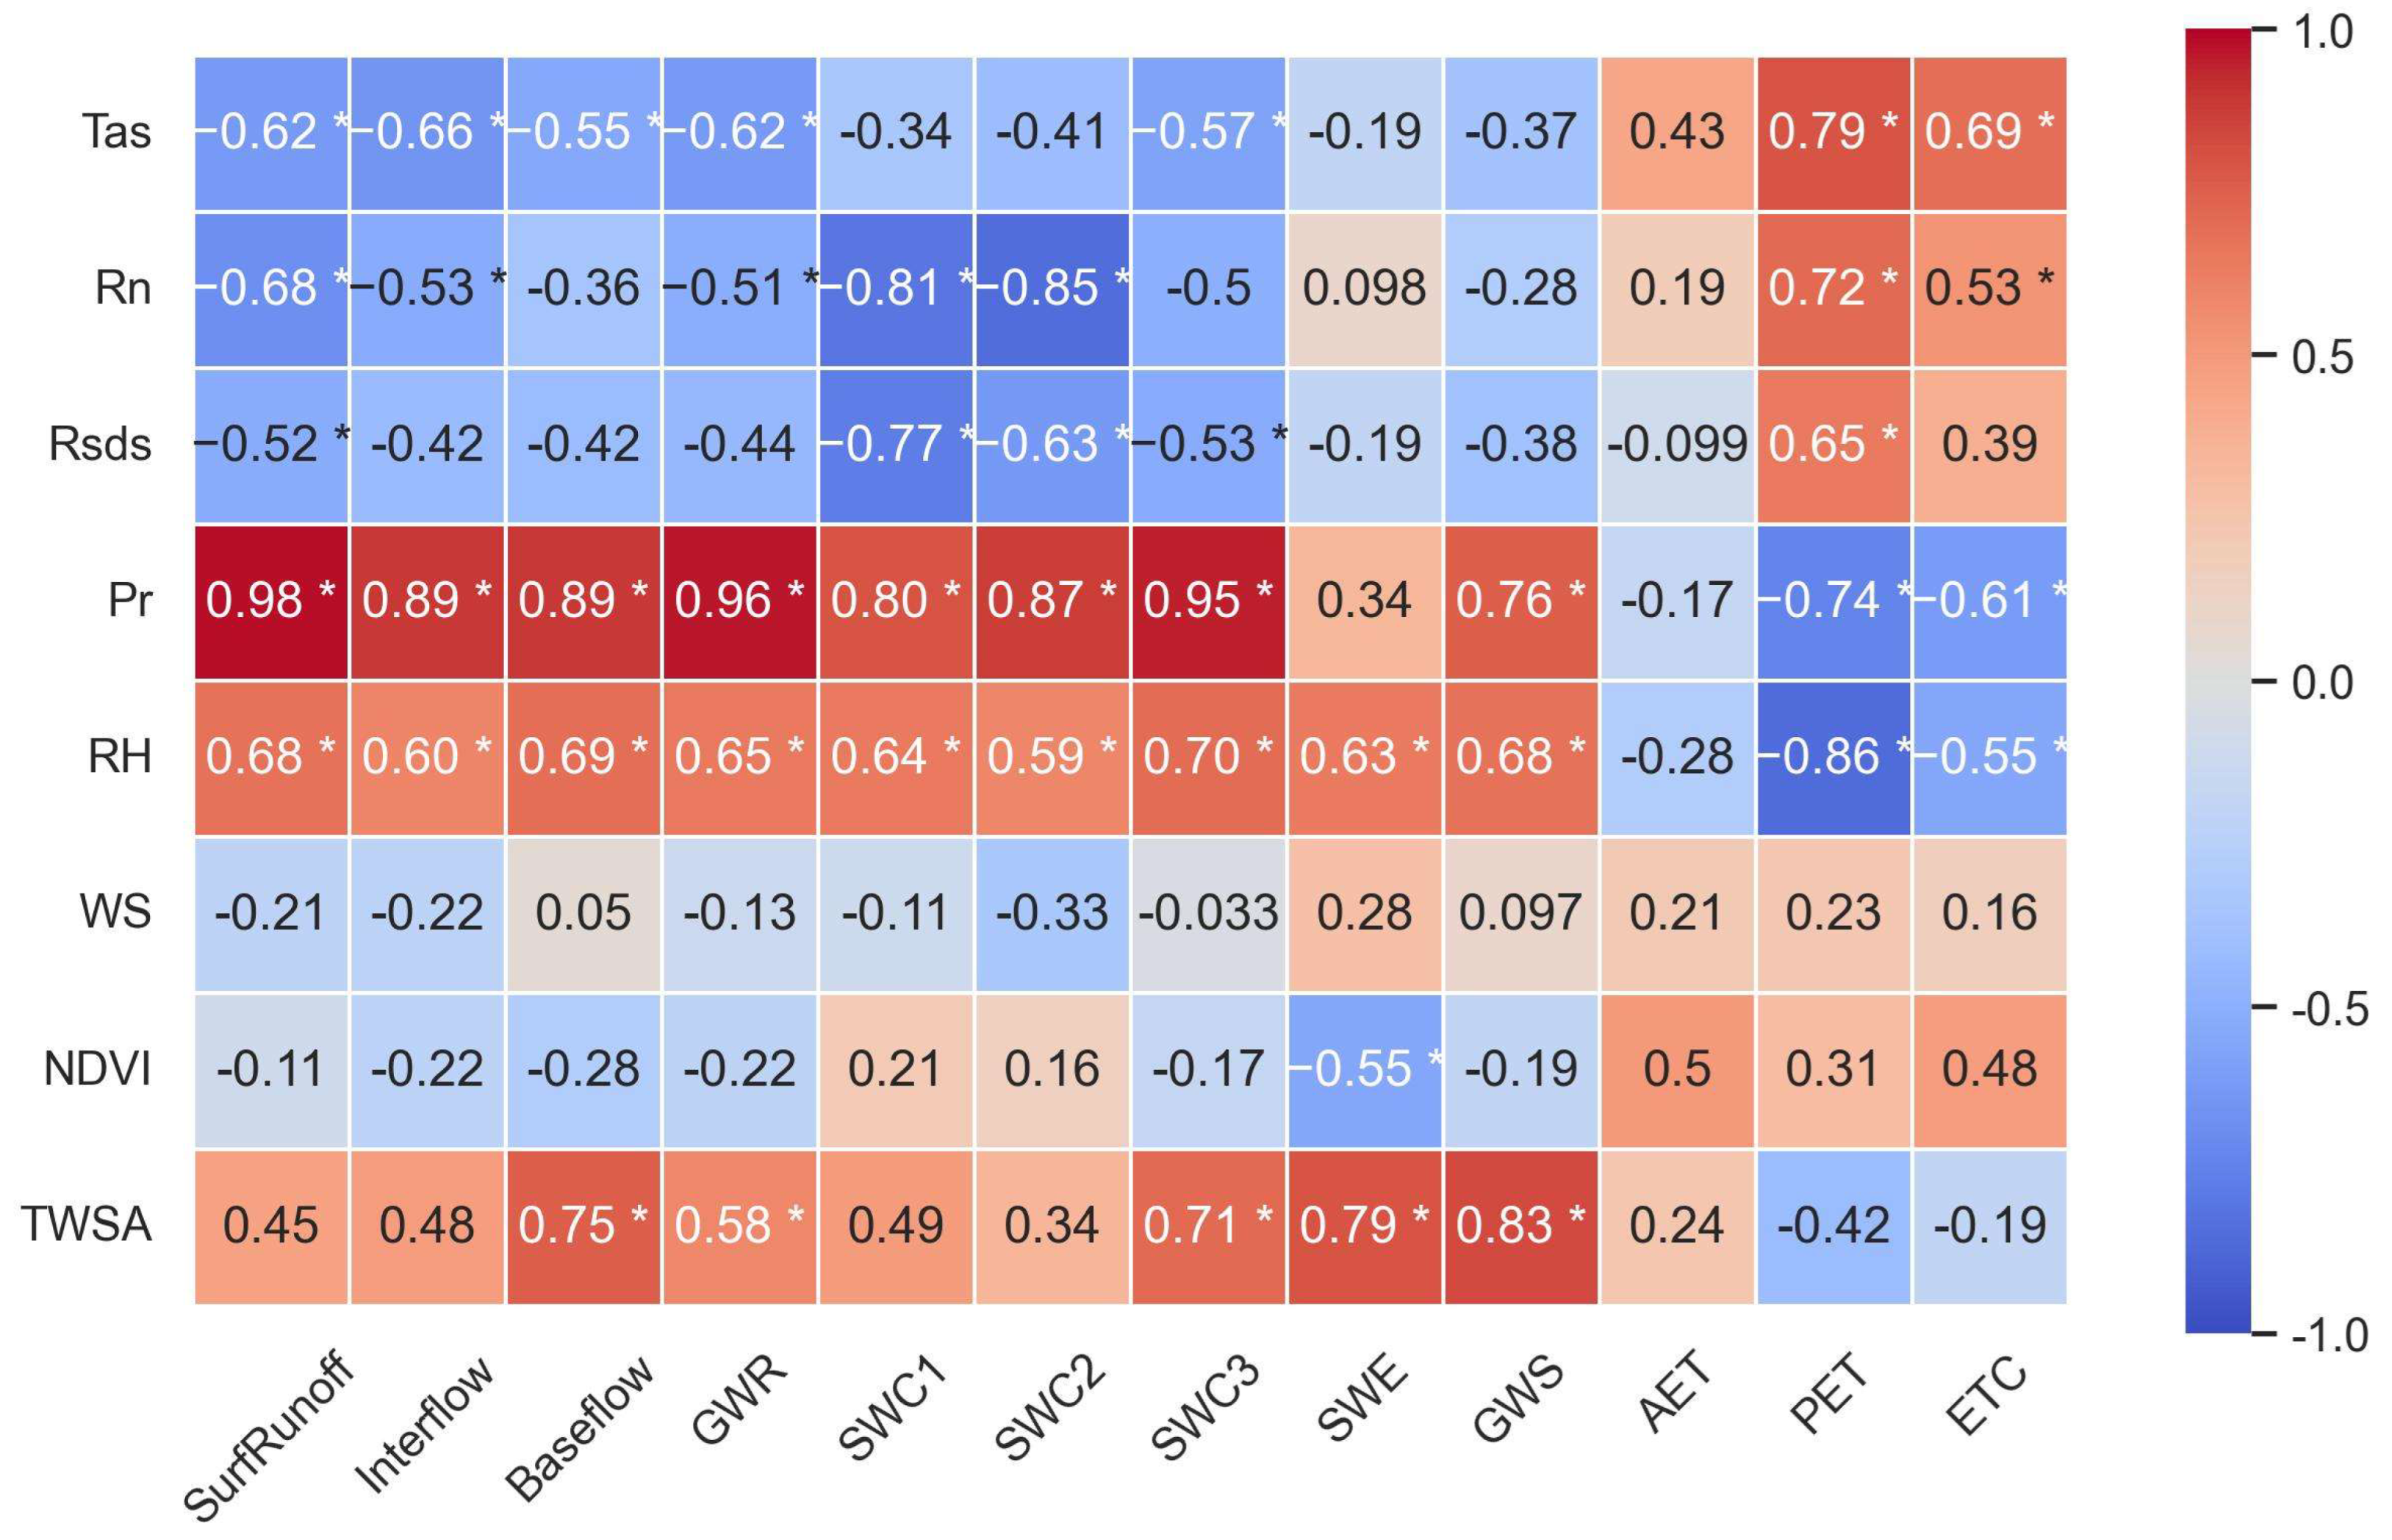
Figure 10 provides a detailed analysis of the correlations between each hydrological variable under the dynamic scenario and various climate and vegetation factors. The results revealed that, with the exception of SWE and AET, all other hydrological variables generally exhibited strong correlations with various climate factors, excluding WS. Out of 50 correlation coefficients examined, 41 were found to be statistically significant (p < 0.05). Runoff fluxes and water storage components showed significant positive correlations with Pr and relative humidity RH, as well as significant negative correlations with Tas, Rn, and incoming Rsds. Conversely, evapotranspiration fluxes demonstrated inverse correlations with these climate variables. The correlations between SWE and AET with climate factors were generally low. This can be attributed to SWE being notably influenced by topography, snow accumulation dates, and seasonal melting patterns, whereas AET is influenced by a combination of climate conditions, soil moisture content, and vegetation dynamics. Among all climate factors, Pr showed the strongest correlations with hydrological variables, with most correlation coefficients exceeding 0.8. This underscored Pr as the primary climate factor influencing the hydrological cycle in the region. While vegetation factors exhibited weaker correlations with most hydrological variables, the results indicated that dynamic changes in vegetation contributed to increased evapotranspiration and reduced runoff. Furthermore, correlation analysis between GRACE-derived TWSA and hydrological variables indicated that variations in deep soil water predominantly drove changes in regional TWS.

3.4. The Spatial Impacts of Climate Variations and Vegetation Dynamics on Hydrological Processes

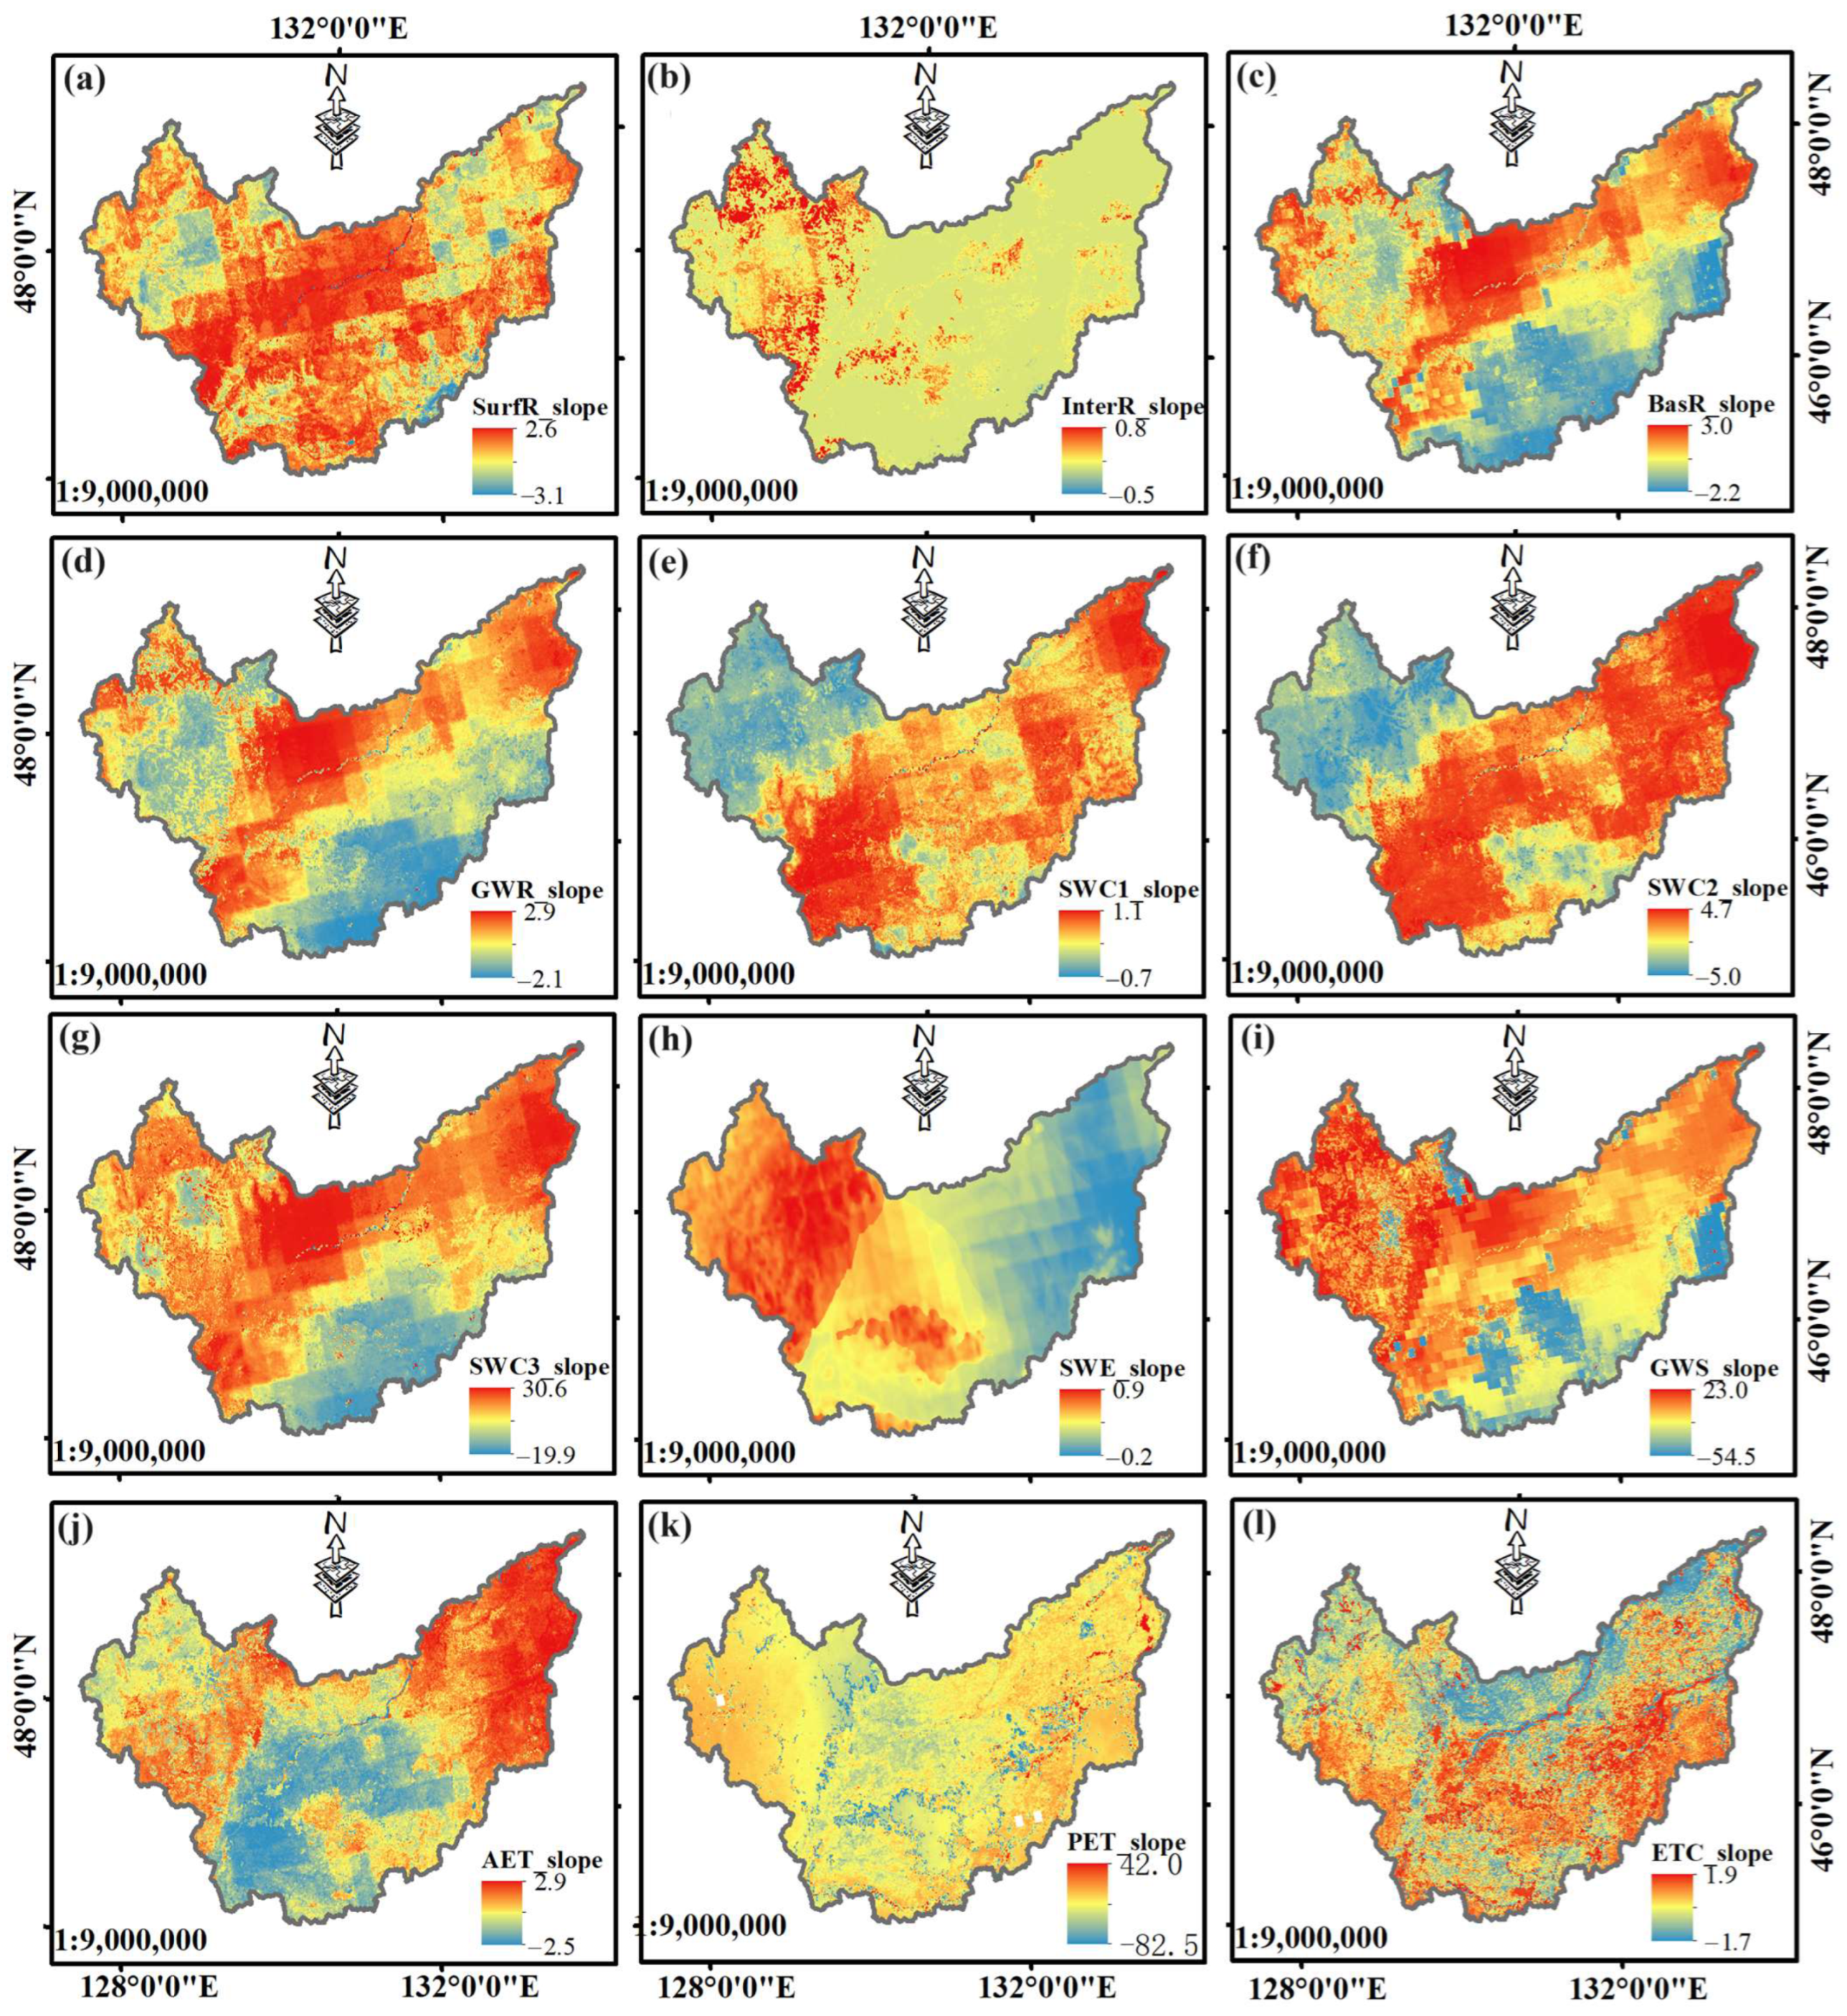
Figure 11 depicts the spatial distribution of variation trends in 12 hydrological components within the study region under the dynamic scenario during 2000–2020. The results indicated that despite the overall regional-scale consistency and statistical significance in the increasing trends of most hydrological components, significant spatial variability is observed in the grid-scale trends of each hydrological variable. With the exception of interflow and PET, diverse hydrological indicators exhibited mixed trends, indicating changes in regional hydrology likely attributed to climatic fluctuations and vegetation dynamics. Interflow demonstrated general stability with minor fluctuations, although some regions in the eastern mountainous areas exhibited an increase. PET exhibited considerable spatial variability with predominantly negative trends. Variations in SWE highlighted pronounced regional disparities, characterized by an increasing trend in the eastern mountainous areas and a decreasing trend in the central and western plains regions. The spatial dynamics of shallow surface fluxes (e.g., surface runoff, AET, and ETC) and storages (e.g., SWC1 and SWC2) exhibited complexity, particularly in the vegetated eastern mountain regions. SWC1 and SWC2 displayed a clear declining trend, while surface runoff, AET, and ETC showed mixed spatial variability. Conversely, deeper subsurface fluxes (e.g., baseflow and GWR) and storages (e.g., SWC3 and GWS) exhibited more uniform spatial trends.
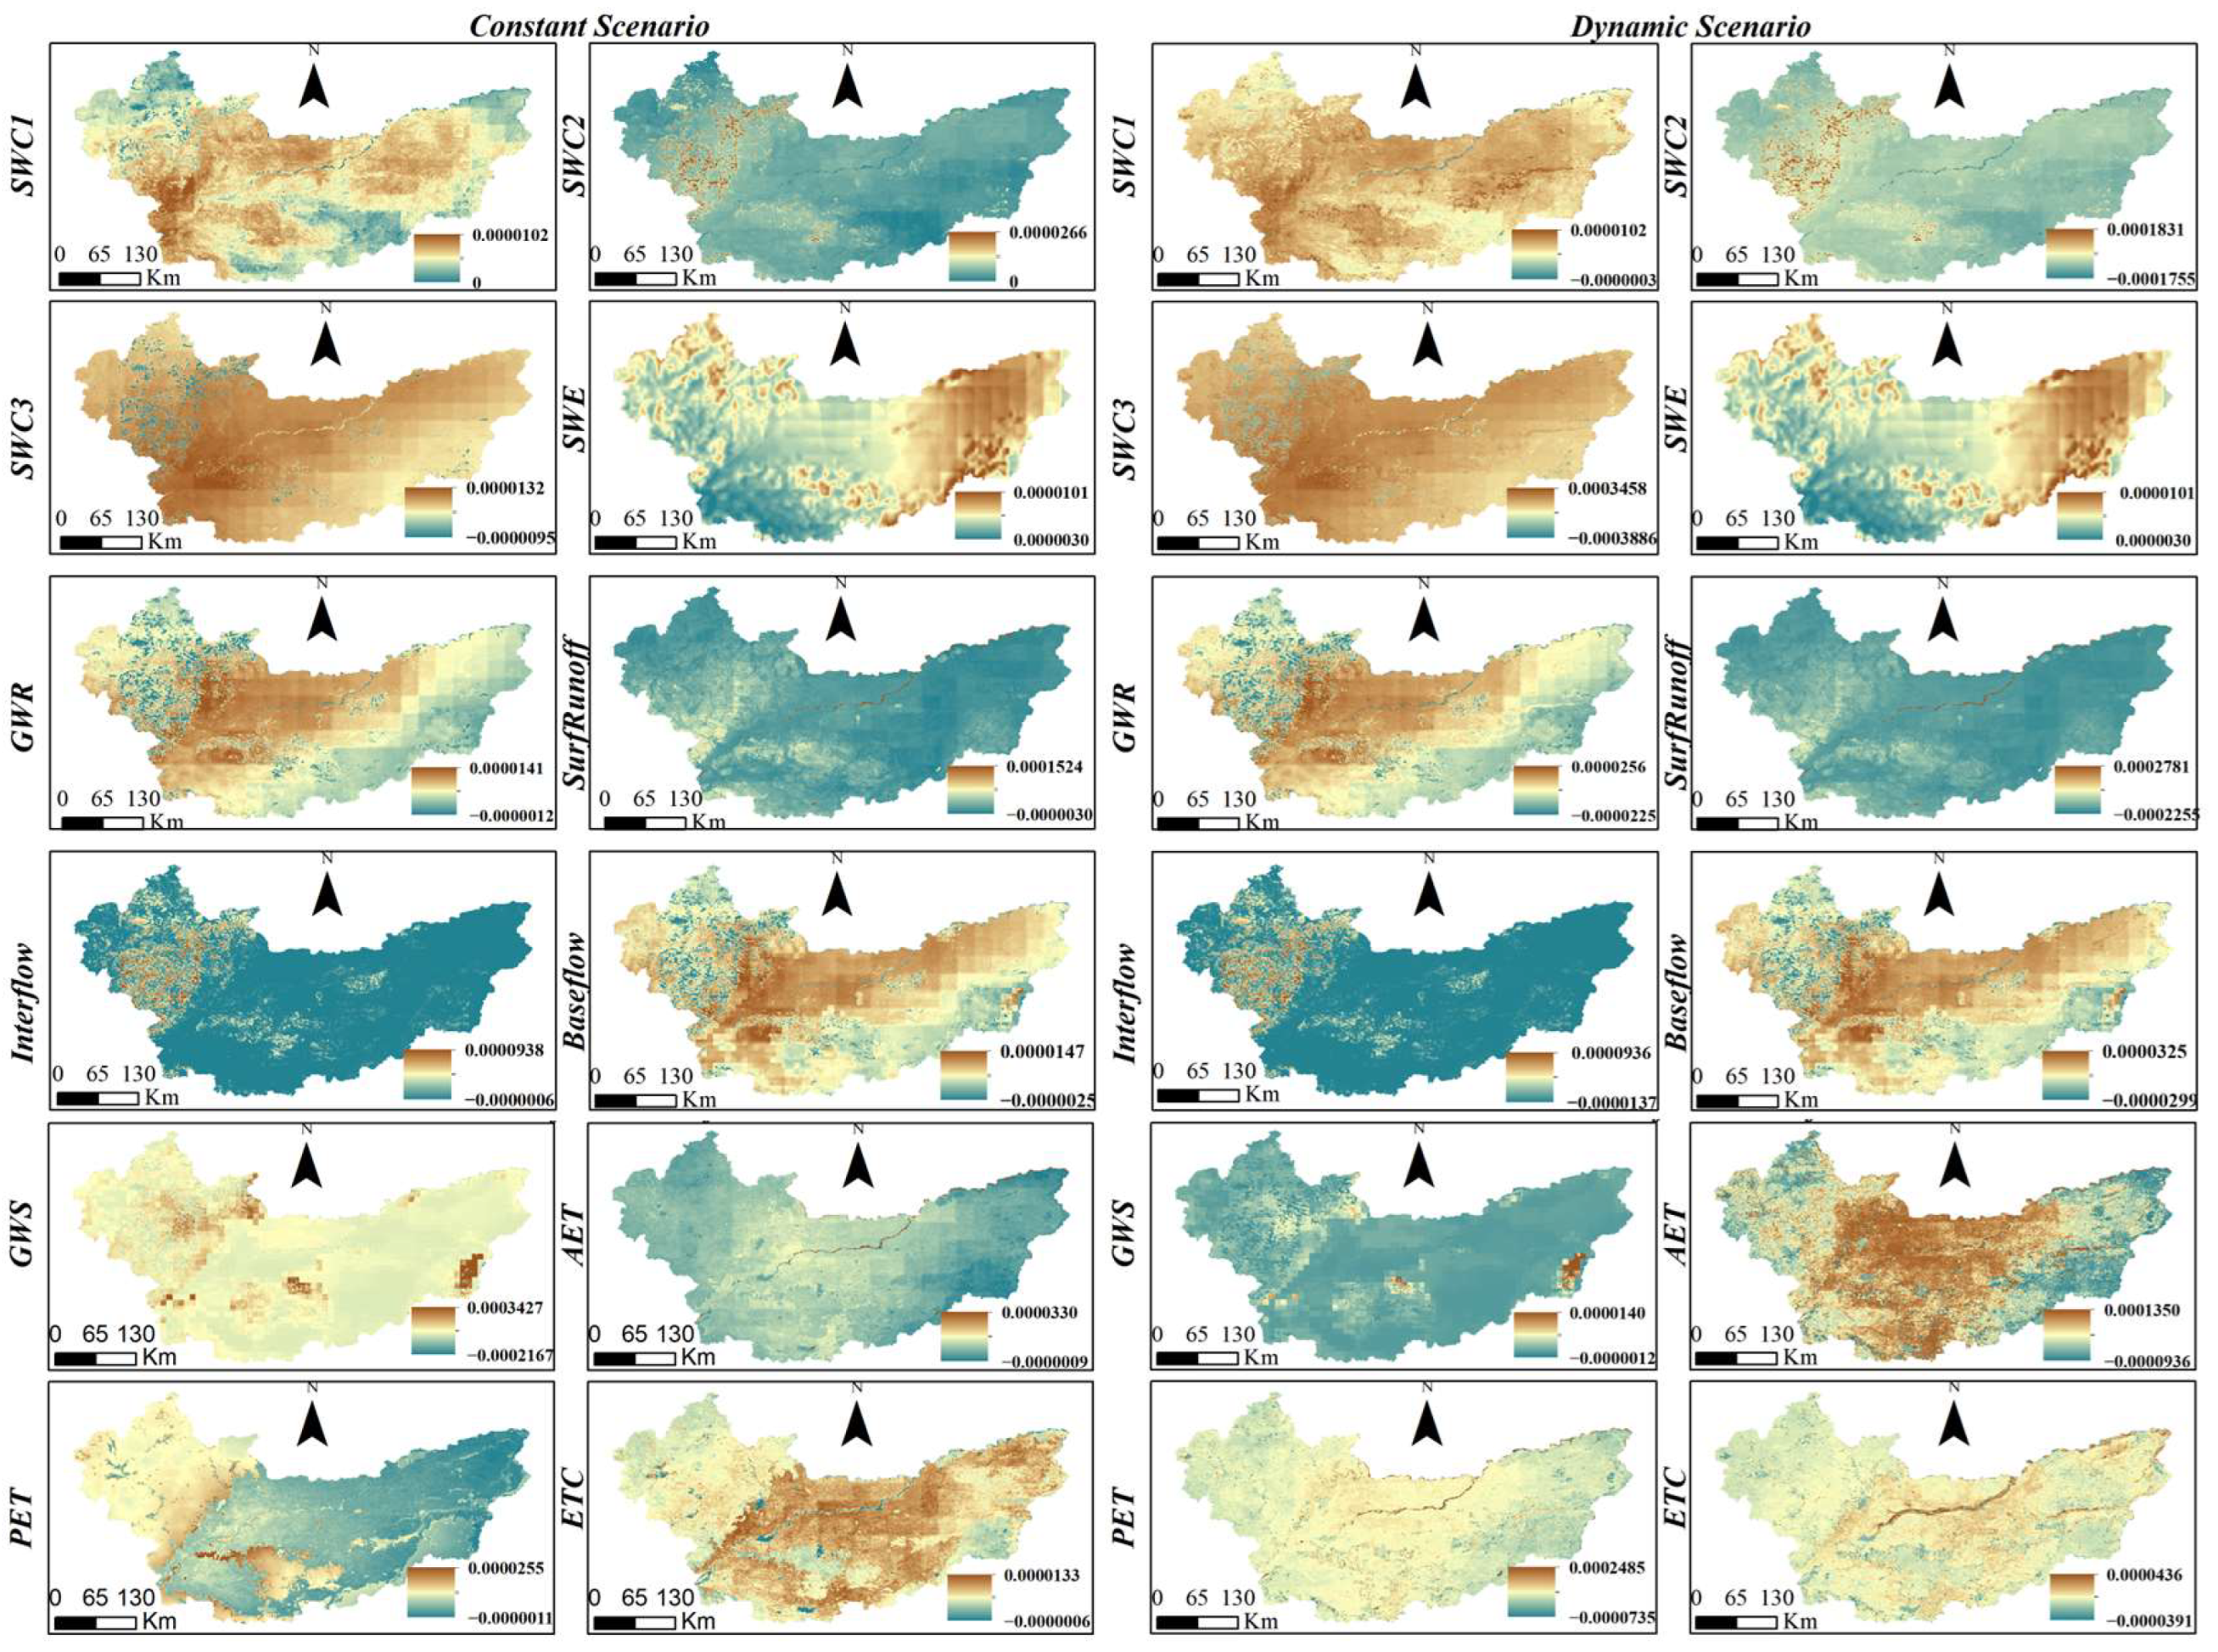
Figure 12 depicts the spatial patterns of significance trends computed at a 95% significance level over the XM-SP under the dynamic and constant scenarios for 12 hydrological variables. Significant spatial heterogeneity in the changes of these variables was observed. For runoff fluxes, surface runoff and interflow exhibited complex spatial heterogeneity, while baseflow and GWR showed similar spatial patterns in significance and trend slope. This led to synergistic spatial heterogeneity in SWC3 and GWS, which were influenced by baseflow and GWR. Moreover, evaporation fluxes, such as AET, were found to be the dominant factor influencing the spatial heterogeneity of superficial water storage components (SWE, SWC1, and SWC2), while deep water storage components were associated with the spatial heterogeneity of deep runoff fluxes under climate change. Additionally, vegetation changes intensified the complexity of spatial heterogeneity in hydrological variables. Following the consideration of vegetation greening effects, the eastern mountainous regions emerged as spatial focal points where increased LAI influences both surface fluxes and water storage components. Across the entire eastern mountainous area, the trend in surface soil water content (SWC1, and SWC2), previously increasing under constant scenarios, had shifted to a declining trend. Concurrently, AET had transitioned from a markedly decreasing trend to an increasing trend under dynamic conditions. In the plains, elevated LAI had similarly caused a shift in surface soil water content trends from significant increases observed under constant scenarios to trends of non-significant increases. Additionally, AET and ETC had moved from decreasing trends to increasing trends under dynamic scenarios. Spatially, the impact of vegetation greening on deeper fluxes and water storage components was notably concentrated in the southern regions. Whether examining fluxes such as baseflow, GWR, or water storage components like SWC3 and GWS, there was a consistent shift from increasing trends to decreasing trends under dynamic conditions.
Figure 13 illustrates the statistical outcomes of 12 hydrological variables under two simulation scenarios. For the water storage components over the past 20 years, areas with an increasing tendency accounted for 99.36%, 99.16%, and 95.04% of the area in SWC1, SWC2, and SWC3, respectively, under the constant scenario. Among these, 31.43%, 23.53%, and 53.42% exhibited a significant increasing trend. Under the dynamic scenario, 62.45%, 70.08%, and 81.83% exhibited an insignificantly increasing trend, and pixels with an insignificantly decreasing trend comprised about 36.88%, 27.11%, and 17.41% for SWC1, SWC2, and SWC3, respectively. This phenomenon suggests that climate change over 20 years led to an increase in three-layer soil water content, while LULC changes contributed to a reduction.
For SWE under the constant scenario, 95.3% of the region exhibited an insignificantly increasing trend, primarily influenced by climate change. Under the dynamic scenario, areas with an insignificantly increasing trend constituted 76.67%, and 23.16% exhibited an insignificantly decreasing trend, indicating that LULC changes caused SWE to shift from an insignificantly upward to an insignificantly downward trend. Regarding SWS, areas with an increasing tendency comprised 94.93% of the region, with 38.14% showing a significant increase under the constant scenario. Conversely, under the dynamic scenario, approximately 99% displayed a decreasing trend, of which 22.29% demonstrated a significant increase. This implies that climate change led to an SWS increase, while LULC changes caused a shift from a significantly upward to an insignificantly upward trend.
In the constant scenario over the past 20 years, 80.12% of the study region displayed an insignificantly increasing trend in surface runoff. Pixels with a significantly increasing trend covered about 11.42% of the area, while those with an insignificantly decreasing trend comprised 8.45%. Notably, climate change predominantly contributed to an increase in surface runoff. Conversely, under the dynamic scenario, areas with an insignificantly increasing trend constituted 88.93%, and only 2.43% exhibited a significantly increasing trend, indicating that LULC changes altered surface runoff from a significantly upward to an insignificantly upward trend. The trends of interflow under the two scenarios were similar, highlighting climate factors as dominant influencers, with little impact from LULC changes. Concerning baseflow, areas with an increasing trend comprised 94.94% of the region, with 38.5% showing a significant increase under the constant scenario. Conversely, under the dynamic scenario, approximately 98% displayed a decreasing trend, of which 22.23% demonstrated a significant increase. This suggests that climate change led to a baseflow increase, while LULC changes caused a shift from a significantly upward to an insignificantly upward trend.
For evaporation components over the past 20 years, 96.38% and 92.32% of the region exhibited a decreasing trend in AET and ETc under the constant scenario, with 60.94% and 77.57% showing an insignificantly decreasing trend. Conversely, under the dynamic scenario, areas with an increasing trend accounted for 86.06% and 52.76% for AET and ETc, suggesting that LULC changes led to an increase in AET and ETc. The trend of ET0 under the constant and dynamic scenarios was displayed similarly, indicating that LULC changes had little impact on ET0.

3.5. Contributions of Different Land Use/Cover to the IAV of Hydrological Components

To assess the influence of various land use/cover classes on hydrological variables within the study region, we examined the contributions of these classes to the IAV of each hydrological component. This approach aimed to elucidate the relationship between land use/cover classes and the IAV of hydrological variables across different geographic locations and time periods.
The spatial distributions of relative contributions to the IAV at the pixel scale under dynamic and constant scenarios are presented in Figure 14. Given the considerable spatial variability in climate and land use/cover changes across the study area, the relative contributions of grids to the IAV exhibited significant spatial heterogeneity. While differences between the two scenarios were not overly pronounced, a general trend in IAV was evident. For fluxes, surface runoff and interflow showed less spatial heterogeneity, whereas GWR, baseflow, AET, ET0, and ETC exhibited relatively higher spatial heterogeneity. This resulted in SWC2 and SWC3 showing less spatial heterogeneity, while SWC1, GWS, and SWE displayed relatively higher spatial heterogeneity.
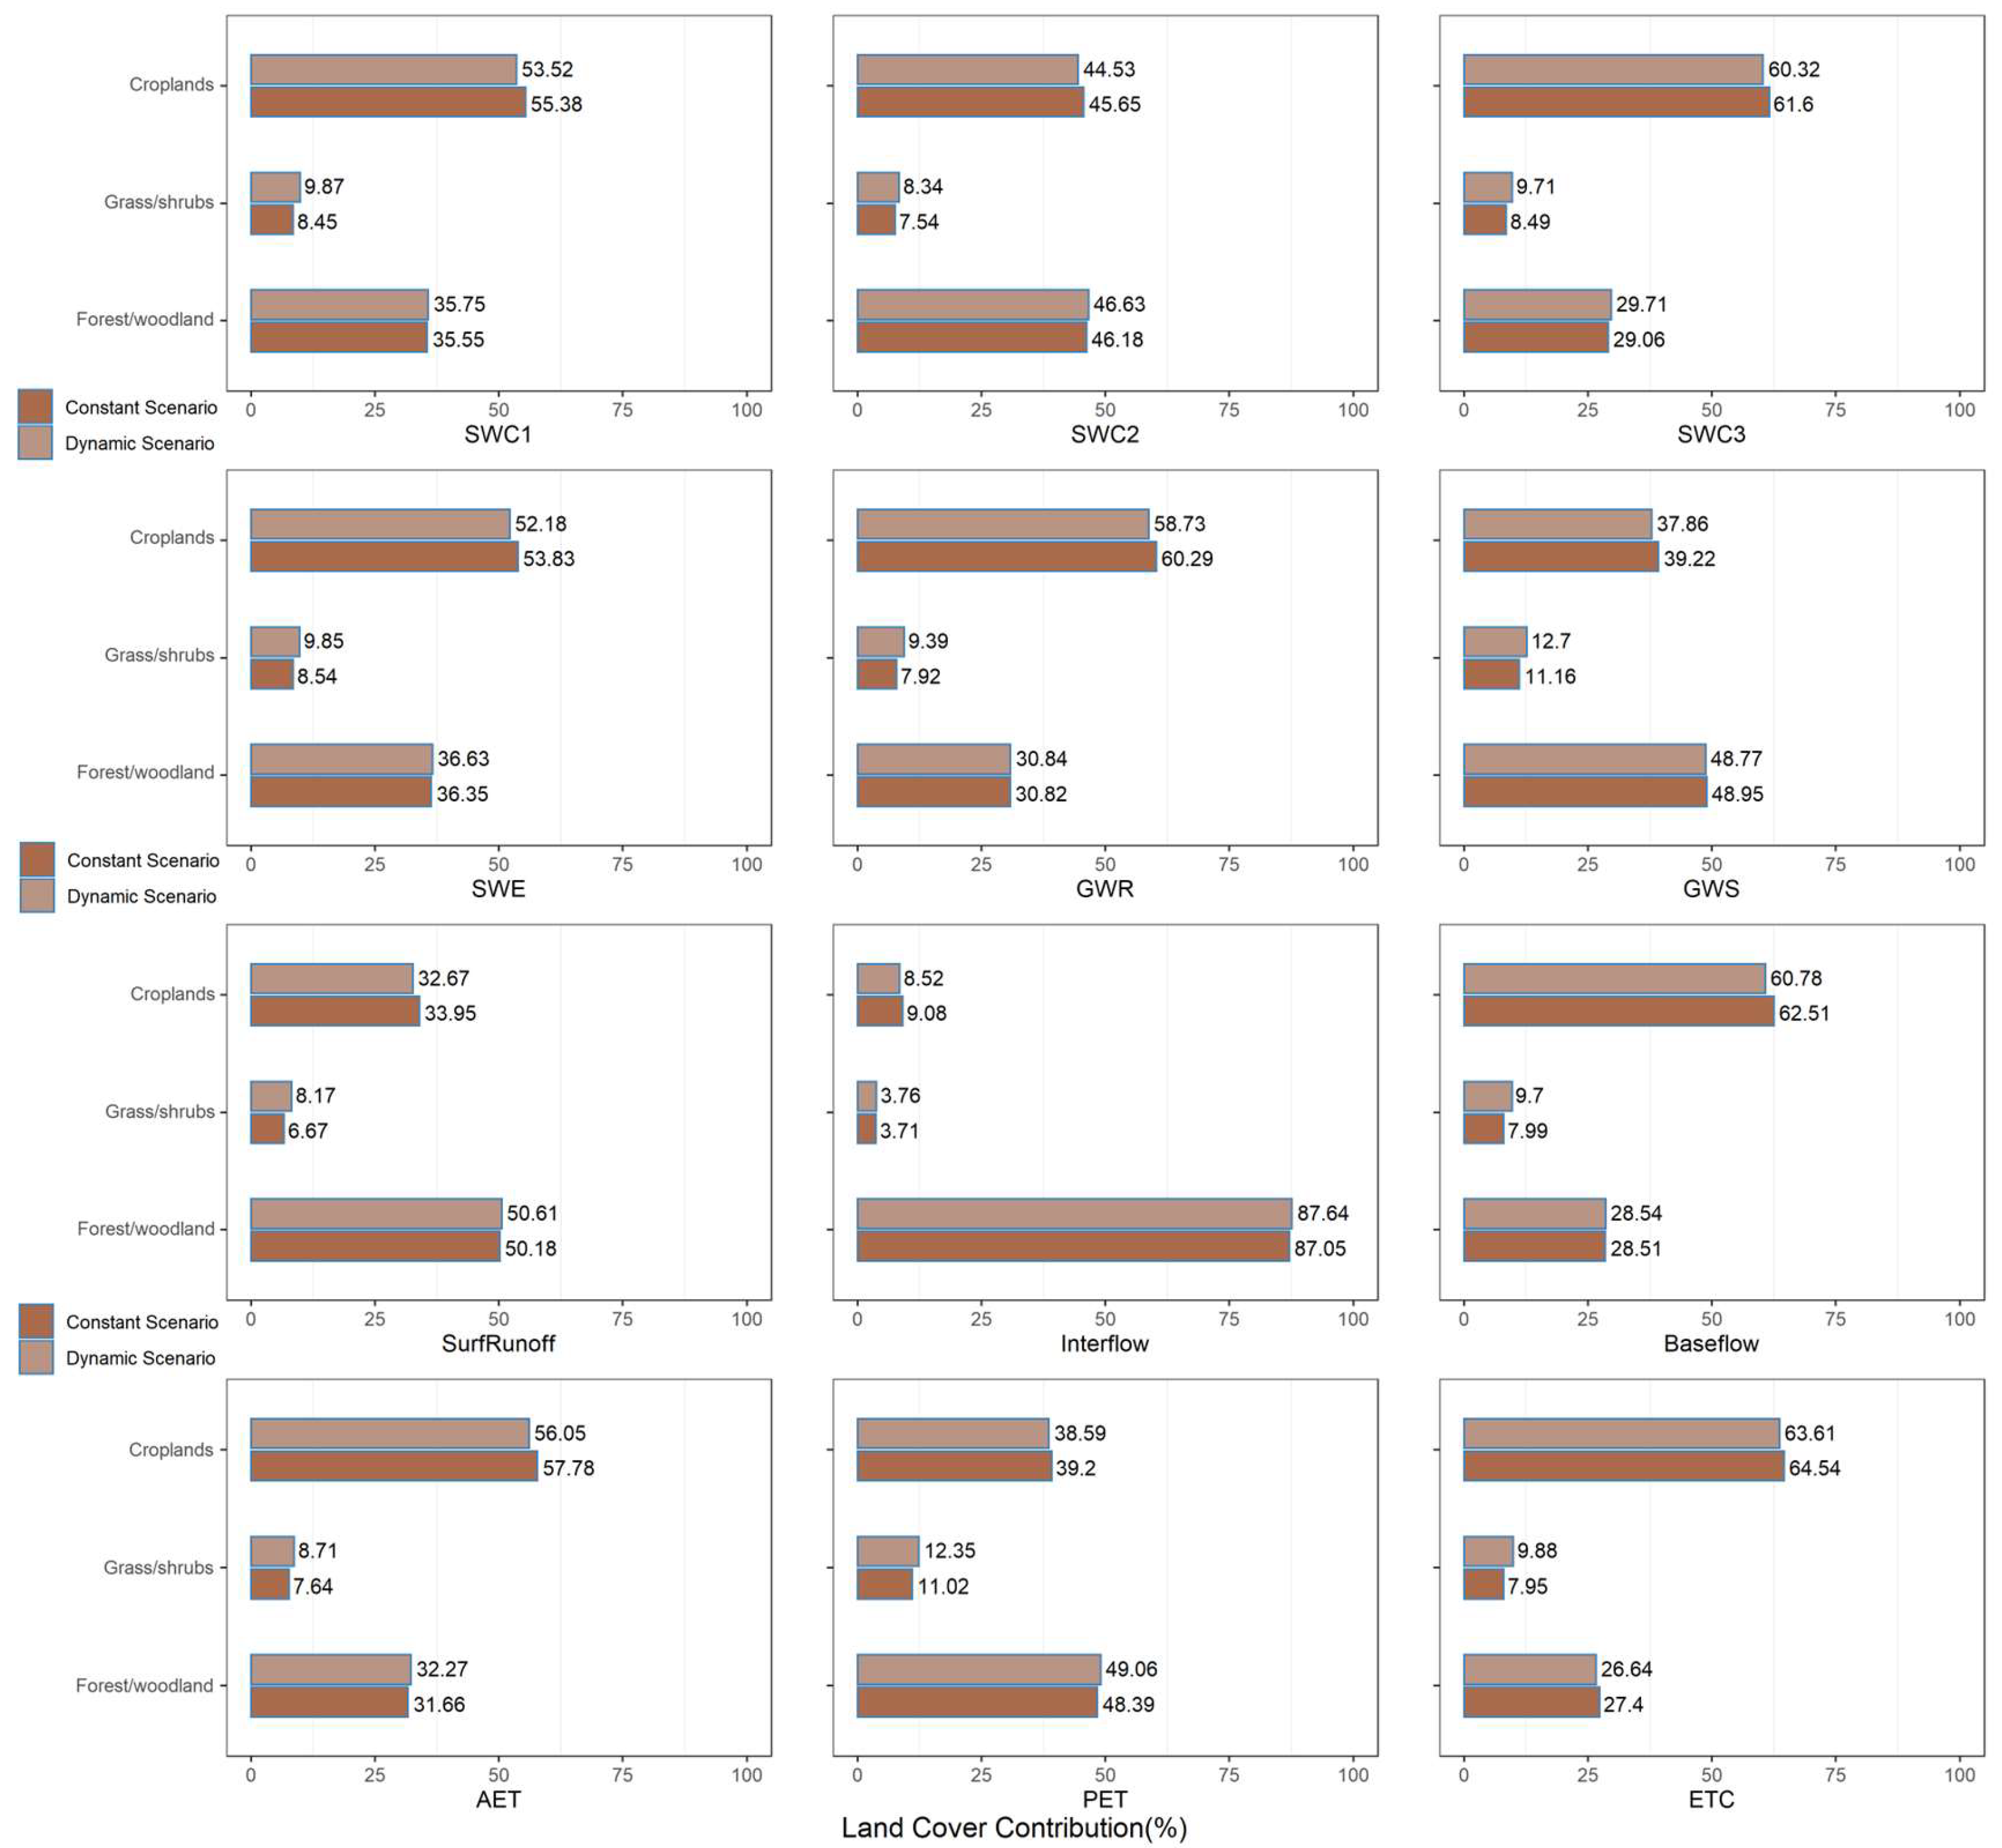
The statistical results of explanatory contributions in each hydrological variable under both simulation scenarios are depicted in Figure 15. Cropland and forest/woodland consistently emerged as the dominant land use/cover factors influencing the IAV of each hydrological component. This pattern aligned with the overall characteristics of the study region. Specifically, for runoff flux components, forest/woodland played a leading role in the IAV of surface runoff (50%) and interflow (87%), while cropland was dominant in baseflow (61%) and GWR (59%). Among water storage components, forest/woodland was significant for SWC2 (46%) and GWS (48%), while cropland prevailed in SWC1 (54%), SWC3 (61%), and GWR (53%). Regarding evapotranspiration flux components, cropland exerted primary influence on AET (57%) and ETC (64%), while forest/woodland was dominant in ET0 (49%).
We further investigated the impact of spatial distribution changes in each land use/cover class on the IAV of hydrological variables based on the differences between the two simulation scenarios. For evapotranspiration fluxes, cropland dominated the IAV of AET and ETc in the entire study region, contributing 56.05% and 63.61% to AET and ETc, respectively, under the constant scenario, and 57.78% and 64.54%, respectively, under the dynamic scenario. Meanwhile, forest/woodland dominated the IAV of ET0 in the entire study region, contributing 49.06% under the dynamic scenario and 48.39% under the constant scenario. A slight decrease in cropland area (2.92%) resulted in a proportional decrease in the IAV, affecting AET (1.73%), ET0 (0.61%), and ETC (0.94%). Notably, the impact of cropland change was relatively more substantial on AET than on ETC. A slight increase in forest/woodland area (1.35%) and grass/shrubs area (1.40%) caused a relative increase in the IAV, affecting AET (0.61% and 1.08%), ET0 (0.67% and 1.33%), and ETC (−0.76% and 1.93%). The relative contribution of grass/shrubs to ET0 was greater than to AET and ETC; however, the impact of grass/shrubs change was relatively more substantial on ETC than on ET0 and AET.
For runoff fluxes, cropland dominated the IAV of baseflow and GWR in the entire study region, contributing 60.78% and 58.73% to baseflow and GWR, respectively, under the dynamic scenario, and 62.51% and 60.29%, respectively, under the constant scenario. Forest/woodland dominated the IAV of surface runoff and interflow in the entire study region, contributing 50.61% and 87.64% to surface runoff and interflow, respectively, under the dynamic scenario, and 50.18% and 87.05%, respectively, under the constant scenario. A slight decrease in cropland area (2.92%) caused a relative decrease in the IAV, affecting surface runoff (1.27%), interflow (0.56%), baseflow (1.73%), and GWR (1.55%). The relative contribution of cropland to baseflow and GWR was greater than to surface runoff and interflow, indicating a more substantial impact of cropland change on baseflow and GWR. A slight increase in forest/woodland area (1.35%) and grass/shrubs area (1.40%) caused a relative increase in the IAV, affecting surface runoff (0.43% and 1.51%), interflow (0.59% and 0.05%), baseflow (0.03% and 1.71%), and GWR (0.02% and 1.46%). The relative contribution of forest/woodland to baseflow and GWR was greater than to surface runoff and interflow, indicating a more substantial impact of forest/woodland change on baseflow and GWR. The relative contribution of grass/shrubs to baseflow was greater than to others, indicating a more substantial impact of grass/shrubs change on baseflow than on others.
For water storage components, cropland dominated the IAV of SWC1, SWC3, and SWE in the entire study region, contributing 53.52%, 60.32%, and 52.18% to SWC1, SWC3, and SWE, respectively, under the dynamic scenario, and 55.38%, 61.60%, and 53.83%, respectively, under the constant scenario. Meanwhile, forest/woodland dominated the IAV of SWC2 and GWS in the entire study region, contributing 46.63% and 48.77% to SWC2 and GWS, respectively, under the dynamic scenario, and 46.18% and 48.95%, respectively, under the constant scenario. A slight decrease in cropland area (2.92%) caused a relative decrease in the IAV, affecting SWC1 (1.86%), SWC2 (1.12%), SWC3 (1.28%), SWE (1.66%), and GWS (1.37%). Although the relative contribution of cropland to SWC3 was greater than to others, the impact of cropland change was relatively more substantial on SWC1 than on others. A slight increase in forest/woodland area (1.35%) and grass/shrubs area (1.40%) caused a relative increase in the IAV, affecting SWC1 (0.20% and 1.43%), SWC2 (0.46% and 0.81%), SWC3 (0.65% and 1.23%), SWE (0.28% and 1.31%), and GWS (−0.18% and 1.55%). Although the relative contribution of forest/woodland and grass/shrubs to GWS was greater than to others, the impact of forest/woodland change was relatively more substantial on SWC3 than on others.
In summary, cropland and forest/woodland played pivotal roles in the annual hydrological activity, both in terms of explanatory ability and area percentage in the study region. These findings underscore the critical impact of these land use/cover classes on hydrological processes. Notably, despite the greater proportion of forest/woodland (36.2%) compared to grass/shrubs (8.6%) in the study region, grass/shrubs exhibited a more sensitive response to temporal and spatial pattern changes, influencing inter-annual variations in hydrological variables. Therefore, the role of grass/shrubs in affecting hydrological variability deserves heightened attention in future studies and ecological restoration projects.

4. Discussion

4.1. Increased Background Precipitation as the Dominant Driver of Regional Hydrological Process Dynamics

Research on the evolution of regional climate conditions indicated that between 2000 and 2020, the region experienced a significant upward trend in precipitation and relative humidity, both temporally and spatially, while temperature and solar radiation showed a slight decline in most areas. Previous studies on climate change in this region and the broader Amur River Basin have demonstrated that around the year 2000, the regional climate transitioned from warm–dry to warm–wet conditions [46]. Despite slight variations in the magnitude of changes in climate factors, the findings of this study are consistent with previous research on the overall trends in climate change.
The significant changes in precipitation in this region can be attributed to multiple factors, including alterations in atmospheric circulation patterns and ocean–atmosphere interactions, such as the El Niño phenomenon. Li et al. [47] found that over recent decades, precipitation in Northeast China has notably increased, particularly during the summer. This increase is closely linked to adjustments of the position and intensity in atmospheric circulation patterns, such as the North Pacific Oscillation (NPO), the Western Pacific Subtropical High (WPSH), and the East Asian summer monsoon [48]. For example, the positive phase of the NPO has enhanced the transport of water vapor from the Pacific to Northeast China. Additionally, Zhu et al. [49] reported that the El Niño–Southern Oscillation (ENSO), especially strong El Niño events, leads to anomalous rises in sea surface temperature in the tropical Pacific, thereby modifying global atmospheric circulation patterns. The El Niño phenomenon intensifies circulation in the mid-to-high latitudes of the Northern Hemisphere, facilitating increased water vapor transport to Northeast China [49].
Under the climate change scenario characterized by a significant increase in precipitation, hydrological simulation results considering only climate change (Constant Scenario) demonstrated that simulated runoff fluxes and water storage components showed a consistent increasing trend both temporally and spatially. The correlation analysis between climate variables and hydrological variables further confirms that precipitation has been the dominant factor driving the dynamic changes in regional hydrological processes. Furthermore, previous studies based on ten CMIP6 models under three SSP scenarios for climate change in the Sanjiang Plain from 2025 to 2100 [20], along with other researchers’ predictions on precipitation changes in Northeast China’s ecosystem [24], indicate that regional precipitation will significantly increase under all future scenarios, suggesting a wetter climate over the next 80 years. Consequently, we propose that concerns about potential water shortages due to continuous increases in crop growth in XM-SP’s grain-producing regions may be alleviated.
Climate warming undeniably speeds up the evaporation of soil moisture and the transpiration of vegetation. However, many researchers have identified a period from 1998 to 2012 where the global warming rate was lower than that from 1951 to 2012, a phenomenon referred to as the “hiatus”, “pause”, or “slowdown” in global warming, which has garnered significant global attention [50]. Zhou et al. [51] also discovered a significant cooling trend in spring temperatures in Northeast China when comparing global and mainland China’s temperature changes, concluding that this hiatus phenomenon is more pronounced in Northeast China. The Arctic Oscillation (AO) is considered a key factor influencing temperature and solar radiation changes in this region, while the Pacific Decadal Oscillation (PDO) is another closely related climate factor that may have contributed to this hiatus period. In addition, the overall decline in solar radiation and wind speed has led to a reduction in measured water surface evaporation at the majority of meteorological and hydrological stations in China, which also suppresses vegetation transpiration [52,53,54]. Similar conclusions were drawn from the simulation results of this project. During the study period (2000–2020), temperature changes exhibited fluctuations without a clear upward trend, while both solar radiation and wind speed showed a weakening trend across the entire region (as shown in Figure 4 and Figure 5), leading to a corresponding decrease in actual evapotranspiration and vegetation transpiration levels under constant simulation scenario. This could be good news for agricultural cultivation activities in the Sanjiang Plain.

4.2. Increased Background Precipitation Has Obscured the Hydrological Deficit Resulting from Vegetation Greening in XM-SP Region

To balance the relationship between the ecological environment and economic development, the Chinese government has implemented and will continue to propose ambitious national ecological conservation and restoration projects [55,56]. For example, policies such as ‘returning farmland to forests’, which have been implemented in the past, as well as the strategy of ‘integrating the protection and restoration of mountains, rivers, forests, farmlands, lakes, grasslands, and sands’ proposed in recent years [57,58]. Clearly defining the key tasks and objectives of large-scale ecological restoration plans, especially in regions characterized by complex environments, variable climates, limited water resources, and intensive human activities, can significantly enhance the effectiveness of ecological construction efforts [59,60]. Against the backdrop of global climate warming, several large-scale ecological restoration plans implemented since 1998 have driven vegetation greening across the entire XM-SJ region (as shown in Figure 7). Most of the regions displaying a significant upward trend were located over the Xiaoxinganling Mountains and Wandashan Mountains, characterized by the expansion of grass/shrubs and forests/woodland, often at the cost of cropland. Meanwhile, the vegetation greening in the agricultural regions of the Sanjiang Plain is predominantly influenced by factors such as climate change, human land-use management practices, CO2 fertilization, and nitrogen deposition [6].
Numerous scholars have investigated the impact of vegetation greening on water responses at both regional and global scales. Certain studies indicate that vegetation greening, by enhancing evapotranspiration and decreasing surface water yield, leads to a gradual increase in soil water content [61], as observed in the Hanjiang River Basin of China [10]. Conversely, some research suggests that vegetation greening increases ET, thereby reducing soil moisture and runoff [62], as observed in the Three-North region and the Loess Plateau of China [8,63].
By formulating dynamic scenarios that incorporated vegetation change information and constant scenarios that considered only climate change, this study contrasted the hydrological simulation differences between the two scenarios. The results revealed an overall increasing trend in the water storage components and runoff fluxes over XM-SP. This trend can be mainly attributed to regional climate change, particularly the rise in precipitation levels. Despite the observed increasing trends in hydrological factors over XM-SP due to regional climate change, our analysis also revealed a significant factor counteracting this trend. Widespread vegetation greening over the years has led to an inevitable increase in water demand, resulting in substantial water use stress. This finding was further supported by our hydrological simulation results under a dynamic scenario, where the use of dynamic LAI indicated that areas experiencing significant vegetation greening phenomena exhibited a slowdown or even reversal of the increasing trends in water storage components and runoff fluxes. This reversal often transitioned into a non-significant decreasing trend.
Specifically, in the Xiaoxinganling Mountains region, characterized by forested landscapes, surface runoff and surface soil water content (SWC1 and SWC2) shifted from increasing to decreasing trends. Conversely, in the Sanjiang Plain, dominated by farmland, the interannual variations in runoff and water storage components transition from significant to non-significant increasing trends. These simulation results suggest that while afforestation and vegetation greening negatively impact runoff and soil moisture, the relative scale of this impact depends on the extent of vegetation increase and the scale of the study area [64]. For humid and semi-humid regions like the XM-SP, the results from both simulation scenarios underscore the dominant role of background climate change in determining the overall direction of regional water cycle changes. This is primarily because the increase in regional precipitation exceeds the increase in ET driven by vegetation greening. However, on a local scale, the water cycle’s response to vegetation greening may be more significant than the background climate. For instance, in the Xiaoxinganling Mountains, vegetation change, rather than increased precipitation, is the main contributor to soil moisture changes in the forest ecosystem. In the Sanjiang Plain, dominated by farmland, although vegetation greening due to crop growth significantly increases ET and slows the trend towards more humid soil, continued increases in precipitation can effectively compensate for the water deficit caused by increased ET, thereby alleviating the conflict between agriculture and water resources.

4.3. Implications for Subsequent Implementation of Ecological Restoration Projects

The primary intention of ecological projects such as afforestation and vegetation restoration is to mitigate soil erosion and protect water resources [65]. However, it should be noted this study reveals that while regional water yield and water storage components generally increase, they may decline on a local scale. For example, soil moisture is decreasing in the forest-dominated Xiaoxinganling Mountains region. This suggests that ongoing vegetation greening will promote water consumption in forest soils through the evaporation process. With future climate change intensification and extreme events like droughts, this will pose a risk of water scarcity in these areas. Field experiments also show that soil moisture in forests is significantly lower than that in grasslands and shrubs, and the decline in soil moisture is more pronounced in afforested areas [66]. This indicates that compared to grass and shrub planting, afforestation typically leads to higher water consumption and has a greater negative impact on surface water supply due to higher canopy coverage and more developed root systems [67]. This raises a warning for future vegetation restoration projects in the XM-SP regions. Future efforts should aim to maintain or reduce the trend of soil moisture shifting to evapotranspiration and adopt measures to improve the effective use of water resources to meet the increasing water demand.
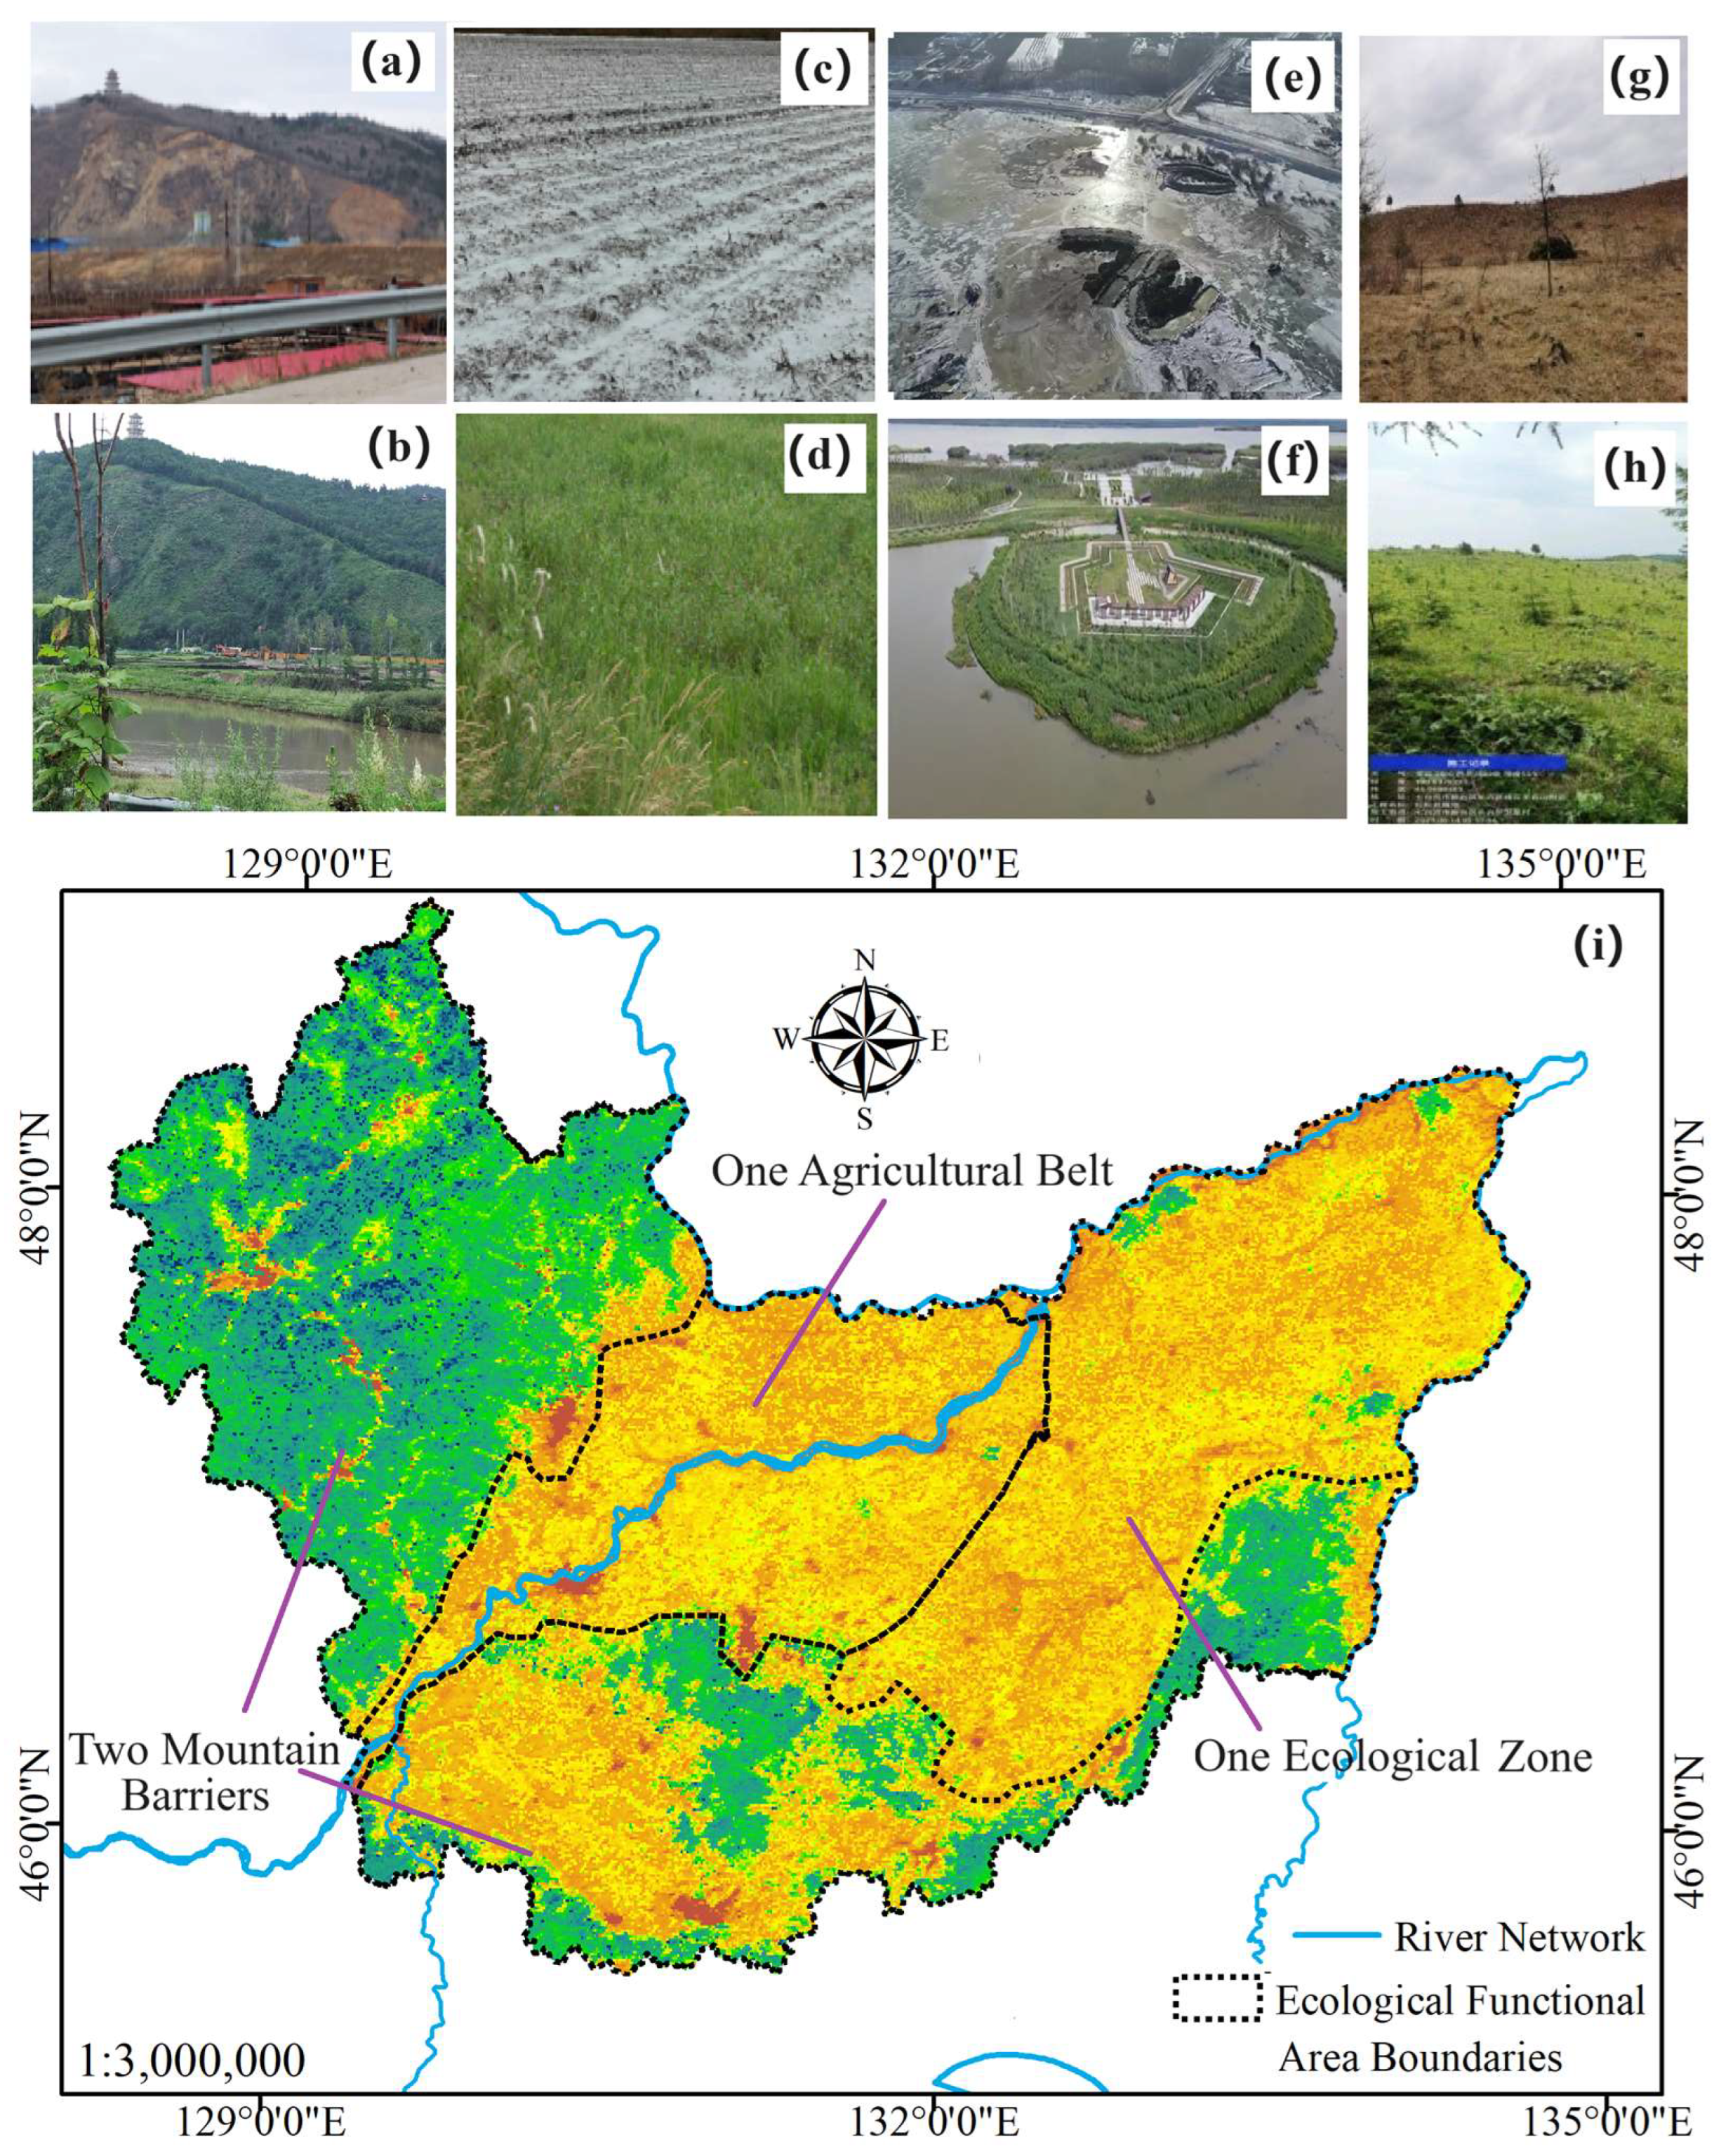
In terms of vegetation-hydrological responses to different land cover types, this study found that, under the current background of climate changes, hydrological variables are more sensitive to grass/shrubs. This suggests that in undertaking ecological restoration efforts in this region, placing greater emphasis on restoring grasslands may yield more effective outcomes in soil and water conservation and regional management. Therefore, it is worth considering increasing the proportion of grassland restoration and reducing the interference of human activities in the Xiaoxinganling Mountains and Wanda Mountains regions, thereby implementing vegetation greening projects. For the Sanjiang Plain, with agricultural development as its goal, the extensive afforestation efforts may limit the space available for agricultural expansion. Hence, vegetation expansion driven by ecological restoration projects over this region should focus on natural restoration methods, such as prohibiting land clearing for cropland and reducing deforestation, rather than implementing intensive LULC changes. Those suggestions have already been adopted by the local government, and measures to enhance the protection and restoration of grasslands have been implemented in several pilot ecological restoration projects within the region (as shown in Figure 16a–h).
Following the approach of integrating optimized ecological spatial control with precise restoration zoning, and considering the significant natural geographical boundaries such as lakes, mountains, and rivers within the region, this study proposes constructing an ecological security pattern centered around the “Two Mountains” (Xiaoxinganling Mountains and Wanda Mountains), “Three Belts” (Heilongjiang River, Songhua River, and Ussuri River), and “Multiple Points” (national-level nature reserves and national forest parks). This framework aims to establish an overall layout termed the “Two Barriers, One Belt, One Zone” (as shown in Figure 16i).

5. Conclusions

This research initially delineated the notable characteristics of climate and vegetation changes within the region, based on reanalysis data and remote sensing observations, which revealed significant increases in regional precipitation and LAI. By employing both a constant scenario that solely considers climate change and a dynamic scenario that integrates vegetation dynamics, the ESSI-3 model was utilized to analyze the impacts of climate change and vegetation dynamics on the XM-SP hydrological cycle from 2000 to 2020.
The findings indicated that the dynamic variations in regional hydrological processes were predominantly driven by increased background precipitation, which masked the hydrological deficits induced by regional vegetation greening. On a regional scale, although vegetation greening significantly enhanced evapotranspiration, adversely affecting runoff fluxes and water storage components, these effects were overshadowed by changes in precipitation. As the increase in precipitation exceeded the increase in evapotranspiration, hydrological factors exhibited a continuous upward trend. Moreover, the study highlighted that on a local scale, vegetation greening might exert a more significant influence on hydrological responses than background climate change. For instance, in highly vegetated sub-regions such as the forested eastern area, hydrological factors were more responsive to vegetation greening.
These findings suggest that, to ensure sustainable water resource management in the XM-SP region, particular attention should be directed towards the impacts of climate change on hydrological processes. Additionally, the study emphasizes that future ecological restoration projects should prioritize the planting of herbaceous plants and shrubs over large-scale afforestation to maintain or reduce the conversion of soil moisture to evapotranspiration, thus mitigating potential water consumption risks.
One limitation of this study is the exclusion of the impact of climate change on vegetation greening and the feedback effect of vegetation greening on regional climate change. It also does not distinguish between the contributions of ecological restoration projects, land use management changes, and natural climate variability to vegetation greening. Future research should aim to further quantify the contributions of ecological restoration projects and climate change to vegetation greening by enhancing empirical and modeling methodologies and developing higher-resolution ecological restoration project datasets, thereby more precisely isolating their impacts on regional hydrological processes.

Author Contributions

Conceptualization, Z.Z. and W.Z.; Data curation, C.X., H.C. and Z.Z.; Formal analysis, C.X., S.X. and W.Z.; Methodology, C.X., Z.Z. and W.Z.; Software, C.X. and W.Z.; Writing—original draft, C.X., W.Z. and S.W.; Writing—review and editing, Z.Z., Z.F., H.L., D.Z. and X.J. All authors have read and agreed to the published version of the manuscript.

Funding

This study was jointly financed by the National Key R&D Program of China [Grant No. 2023YFC3209102 and Grant No. 2023YFC3206202] and the National Natural Science Foundation of China (42101034).

Data Availability Statement

The raw data supporting the conclusions of this article will be made available by the authors on request.

Acknowledgments

Open discussions in weekly seminars with the graduate students in Wanchang Zhang’s Lab are acknowledged. The authors are grateful to the European Centre for Medium-Range Weather Forecasts (ECMWF), the Goddard Earth Sciences Data and Information Services Center (GES DISC), and other agencies for providing datasets. The authors appreciate the editor-in-chief, assistant editor and three anonymous reviewers for their valuable comments and suggestions that helped improve the manuscript.

Conflicts of Interest

The authors declare no conflicts of interest.

References

  1. Degano, M.F.; Rivas, R.E.; Carmona, F.; Niclòs, R.; Sánchez, J.M. Evaluation of the MOD16A2 evapotranspiration product in an agricultural area of Argentina, the Pampas region. Egypt. J. Remote Sens. Space Sci. 2021, 24, 319–328. [Google Scholar] [CrossRef]
  2. Huang, H.; Xue, Y.; Chilukoti, N.; Liu, Y.; Chen, G.; Diallo, I. Assessing global and regional effects of reconstructed land-use and land-cover change on climate since 1950 using a coupled land–atmosphere–ocean model. J. Clim. 2020, 33, 8997–9013. [Google Scholar] [CrossRef]
  3. Lan, X.; Li, Y.; Shao, R.; Chen, X.; Lin, K.; Cheng, L.; Gao, H.; Liu, Z. Vegetation controls on surface energy partitioning and water budget over China. J. Hydrol. 2021, 600, 125646. [Google Scholar] [CrossRef]
  4. Sun, G.Q.; Li, L.; Li, J.; Liu, C.; Wu, Y.P.; Gao, S.; Wang, Z.; Feng, G.L. Impacts of climate change on vegetation pattern: Mathematical modeling and data analysis. Phys. Life Rev. 2022, 43, 239–270. [Google Scholar] [CrossRef] [PubMed]
  5. Chen, Z.; Wang, W.; Fu, J. Vegetation response to precipitation anomalies under different climatic and biogeographical conditions in China. Sci. Rep. 2020, 10, 830. [Google Scholar] [CrossRef] [PubMed]
  6. Chen, C.; Park, T.; Wang, X.; Piao, S.; Xu, B.; Chaturvedi, R.K.; Fuchs, R.; Brovkin, V.; Ciais, P.; Fensholt, R. China and India lead in greening of the world through land-use management. Nat. Sustain. 2019, 2, 122–129. [Google Scholar] [CrossRef]
  7. Song, W.; Feng, Y.; Wang, Z. Ecological restoration programs dominate vegetation greening in China. Sci. Total Environ. 2022, 848, 157729. [Google Scholar] [CrossRef] [PubMed]
  8. Meng, S.; Xie, X.; Zhu, B.; Wang, Y. The relative contribution of vegetation greening to the hydrological cycle in the Three-North region of China: A modelling analysis. J. Hydrol. 2020, 591, 125689. [Google Scholar] [CrossRef]
  9. Mehrotra, R.; Sharma, A.; Kumar, D.N.; Reshmidevi, T.V. Assessing future rainfall projections using multiple GCMs and a multi-site stochastic downscaling model. J. Hydrol. 2013, 488, 84–100. [Google Scholar] [CrossRef]
  10. Li, X.; Zou, L.; Xia, J.; Zhang, L.; Wang, F.; Li, M. Response of blue-green water to climate and vegetation changes in the water source region of China’s South-North water Diversion Project. J. Hydrol. 2024, 634, 131061. [Google Scholar] [CrossRef]
  11. Sheffield, J.; Ferguson, C.R.; Troy, T.J.; Wood, E.F.; McCabe, M.F. Closing the terrestrial water budget from satellite remote sensing. Geophys. Res. Lett. 2009, 36, 7. [Google Scholar] [CrossRef]
  12. Meenu, R.; Rehana, S.; Mujumdar, P.P. Assessment of hydrologic impacts of climate change in Tunga—Bhadra river basin, India with HEC-HMS and SDSM. Hydrol. Process. 2013, 27, 1572–1589. [Google Scholar] [CrossRef]
  13. Sivakumar, B. Global climate change and its impacts on water resources planning and management: Assessment and challenges. Stoch. Environ. Res. Risk Assess. 2011, 25, 583–600. [Google Scholar] [CrossRef]
  14. Ma, N.; Szilagyi, J. The CR of evaporation: A calibration-free diagnostic and benchmarking tool for large-scale terrestrial evapotranspiration modeling. Water Resour. Res. 2019, 55, 7246–7274. [Google Scholar] [CrossRef]
  15. Ma, N.; Zhang, Y. Increasing Tibetan Plateau terrestrial evapotranspiration primarily driven by precipitation. Agric. For. Meteorol. 2022, 317, 108887. [Google Scholar] [CrossRef]
  16. Chen, H.; Zhang, W. Variations of simulated water use efficiency over 2000–2016 and its driving forces in Northeast China. In Remote Sensing for Agriculture, Ecosystems, and Hydrology XXI; SPIE: Bellingham, WA, USA, 2019; Volume 11149, pp. 344–356. [Google Scholar]
  17. Wang, S.; Xu, C.; Zhang, W.; Chen, H.; Zhang, B. Human-Induced water loss from closed inland Lakes: Hydrological simulations in China’s Daihai lake. J. Hydrol. 2022, 607, 127552. [Google Scholar] [CrossRef]
  18. Xu, C.; Zhang, W.; Wang, S.; Chen, H.; Azzam, A.; Zhang, B.; Xu, Y.; Nie, N. Spatiotemporal green water dynamics and their responses to variations of climatic and underlying surface factors: A case study in the Sanjiang Plain, China. J. Hydrol. Reg. Stud. 2023, 45, 101303. [Google Scholar] [CrossRef]
  19. Gao, H.; Zhang, Z.; Chen, H.; Zhang, W.; Xu, C.; Yi, Y.; Liu, J.; Xiao, Z. Impacts of seasonally frozen soil hydrothermal dynamics on the watershed hydrological processes inferred from a spatially distributed numerical modelling approach. J. Hydrol. 2023, 624, 129947. [Google Scholar] [CrossRef]
  20. Liu, C.; Xu, C.; Zhang, Z.; Xiong, S.; Zhang, W.; Zhang, B.; Chen, H.; Xu, Y.; Wang, S. Modeling hydrological consequences of 21st-Century climate and land use/land cover changes in a mid-high latitude watershed. Geosci. Front. 2024, 15, 101819. [Google Scholar] [CrossRef]
  21. Chen, H.; Wang, T.; Zhang, Y.; Bai, Y.; Chen, X. Dynamically weighted ensemble of geoscientific models via automated machine-learning-based classification. Geosci. Model Dev. 2023, 16, 5685–5701. [Google Scholar] [CrossRef]
  22. Zhang, B.; Wang, S.; Zheng, S.; Jiang, X.; Ni, Y. Problem identification and scheme study of ecological protection and restoration of mountain- river- forest- farmland- lake- grassland in Xiaoxinganling- Sanjiang Plain. J. Environ. Eng. Technol. 2019, 9, 491–498. [Google Scholar]
  23. Zhu, J.J.; Zheng, X.; Wang, G.G.; Wu, B.; Liu, S.; Yan, C.; Li, Y.; Sun, Y.; Yan, Q.; Zeng, Y. Assessment of the world largest afforestation program: Success, failure, and future directions. BioRxiv 2017, 105619. [Google Scholar]
  24. Yu, L.; Li, X.; Bu, K.; Yan, F.; Zhang, S.; Liu, T. Increased background precipitation masks the moisture deficit caused by crop greening in Northeast China. J. Hydrol. 2023, 623, 129857. [Google Scholar] [CrossRef]
  25. Liu, Y.; Guo, W.; Huang, H.; Ge, J.; Qiu, B. Estimating global aerodynamic parameters in 1982–2017 using remote-sensing data and a turbulent transfer model. Remote Sens. Environ. 2021, 260, 112428. [Google Scholar] [CrossRef]
  26. Chen, H.; Wang, T.; Montzka, C.; Gao, H.; Guo, N.; Chen, X.; Vereecken, H. Toward an improved ensemble of multi-source daily precipitation via joint machine learning classification and regression. Atmos. Res. 2024, 304, 107385. [Google Scholar] [CrossRef]
  27. Yu, L.; Liu, Y.; Yang, J.; Liu, T.; Bu, K.; Li, G.; Jiao, Y.; Zhang, S. Asymmetric daytime and nighttime surface temperature feedback induced by crop greening across Northeast China. Agric. For. Meteorol. 2022, 325, 109136. [Google Scholar] [CrossRef]
  28. Sun, Q.; Xu, C.; Gao, X.; Lu, C.; Cao, B.; Guo, H.; Yan, L.; Wu, C.; He, X. Response of groundwater to different water resource allocation patterns in the Sanjiang Plain, Northeast China. J. Hydrol. Reg. Stud. 2022, 42, 101156. [Google Scholar] [CrossRef]
  29. Fu, J.; Liu, J.; Wang, X.; Zhang, M.; Chen, W.; Chen, B. Ecological risk assessment of wetland vegetation under projected climate scenarios in the Sanjiang Plain, China. J. Environ. Manag. 2020, 273, 111108. [Google Scholar] [CrossRef] [PubMed]
  30. Jin, X.; Du, J.; Liu, H.; Wang, Z.; Song, K. Remote estimation of soil organic matter content in the Sanjiang Plain, Northest China: The optimal band algorithm versus the GRA-ANN model. Agric. For. Meteorol. 2016, 218, 250–260. [Google Scholar] [CrossRef]
  31. Wang, X.; Chen, S.; Wang, J. An adaptive snow identification algorithm in the forests of Northeast China. IEEE J. Sel. Top. Appl. Earth Obs. Remote Sens. 2020, 13, 5211–5222. [Google Scholar] [CrossRef]
  32. Hersbach, H.; Bell, B.; Berrisford, P.; Hirahara, S.; Horányi, A.; Muñoz-Sabater, J.; Nicolas, J.; Peubey, C.; Radu, R.; Schepers, D. The ERA5 global reanalysis. Q. J. R. Meteorol. Soc. 2020, 146, 1999–2049. [Google Scholar] [CrossRef]
  33. Hengl, T.; Mendes de Jesus, J.; Heuvelink, G.B.M.; Ruiperez Gonzalez, M.; Kilibarda, M.; Blagotić, A.; Shangguan, W.; Wright, M.N.; Geng, X.; Bauer-Marschallinger, B. SoilGrids250m: Global gridded soil information based on machine learning. PLoS ONE 2017, 12, e0169748. [Google Scholar] [CrossRef] [PubMed]
  34. Liu, Y.; Liu, R.; Chen, J.M. Retrospective retrieval of long-term consistent global leaf area index (1981–2011) from combined AVHRR and MODIS data. J. Geophys. Res. Biogeosci. 2012, 117, G4. [Google Scholar] [CrossRef]
  35. Kobayashi, T.; Tsend-Ayush, J.; Tateishi, R. A new global tree-cover percentage map using MODIS data. Int. J. Remote Sens. 2016, 37, 969–992. [Google Scholar] [CrossRef]
  36. Sulla-Menashe, D.; Gray, J.M.; Abercrombie, S.P.; Friedl, M.A. Hierarchical mapping of annual global land cover 2001 to present: The MODIS Collection 6 Land Cover product. Remote Sens. Environ. 2019, 222, 183–194. [Google Scholar] [CrossRef]
  37. Lehner, B.; Verdin, K.; Jarvis, A. HydroSHEDS Technical Documentation; World Wildlife Fund US: Washington, DC, USA, 2006; p. 5. [Google Scholar]
  38. Mu, Q.; Zhao, M.; Running, S.W. Improvements to a MODIS global terrestrial evapotranspiration algorithm. Remote Sens. Environ. 2011, 115, 1781–1800. [Google Scholar] [CrossRef]
  39. Watkins, M.M.; Wiese, D.N.; Yuan, D.N.; Boening, C.; Landerer, F.W. Improved methods for observing Earth’s time variable mass distribution with GRACE using spherical cap mascons. J. Geophys. Res. Solid Earth 2015, 120, 2648–2671. [Google Scholar] [CrossRef]
  40. Li, B.; Rodell, M.; Kumar, S.; Beaudoing, H.K.; Getirana, A.; Zaitchik, B.F.; de Goncalves, L.G.; Cossetin, C.; Bhanja, S.; Mukherjee, A. Global GRACE data assimilation for groundwater and drought monitoring: Advances and challenges. Water Resour. Res. 2019, 55, 7564–7586. [Google Scholar] [CrossRef]
  41. Liang, W.; Bai, D.; Wang, F.; Fu, B.; Yan, J.; Wang, S.; Yang, Y.; Long, D.; Feng, M. Quantifying the impacts of climate change and ecological restoration on streamflow changes based on a Budyko hydrological model in China’s Loess Plateau. Water Resour. Res. 2015, 51, 6500–6519. [Google Scholar] [CrossRef]
  42. Ahlström, A.; Raupach, M.R.; Schurgers, G.; Smith, B.; Arneth, A.; Jung, M.; Reichstein, M.; Canadell, J.G.; Friedlingstein, P.; Jain, A.K. The dominant role of semi-arid ecosystems in the trend and variability of the land CO2 sink. Science 2015, 348, 895–899. [Google Scholar] [CrossRef]
  43. Mann, H.B. Nonparametric tests against trend. Econom. J. Econom. Soc. 1945, 13, 245–259. [Google Scholar] [CrossRef]
  44. Kendall, M.G. Rank Correlation Methods; Griffin Publishing Group: Irvine, CA, USA, 1948. [Google Scholar]
  45. Scanlon, B.R.; Zhang, Z.; Save, H.; Wiese, D.N.; Landerer, F.W.; Long, D.; Longuevergne, L.; Chen, J. Global evaluation of new GRACE mascon products for hydrologic applications. Water Resour. Res. 2016, 52, 9412–9429. [Google Scholar] [CrossRef]
  46. Zhou, S.; Zhang, W.; Wang, S.; Zhang, B.; Xu, Q. Spatial–temporal vegetation dynamics and their relationships with climatic, anthropogenic, and hydrological factors in the Amur River basin. Remote Sens. 2021, 13, 684. [Google Scholar] [CrossRef]
  47. Li, H.; He, S.; Yuan, X.; Liu, Y.; Yan, Y. The contrast responses of August precipitation over Northeast China to strong and moderate developing El Nino. Atmos. Res. 2024, 304, 107378. [Google Scholar] [CrossRef]
  48. Sun, H.J.; Chen, H.S.; Du, X.G. Interdecadal changes of the relationship between early summer precipitation over Northeast China and spring land surface thermal anomalies in West Asia. J. Meteorol. Res. 2024, 38, 1–13. [Google Scholar]
  49. Zhu, Z.; Lu, R.; Fu, S.; Chen, H. Alternation of the atmospheric teleconnections associated with the Northeast China spring rainfall during a recent 60-year period. Adv. Atmos. Sci. 2023, 40, 168–176. [Google Scholar] [CrossRef]
  50. Medhaug, I.; Stolpe, M.B.; Fischer, E.M.; Knutti, R. Reconciling controversies about the ‘global warming hiatus’. Nature 2017, 545, 41–47. [Google Scholar] [CrossRef]
  51. Zhou, Z.; Shi, H.; Fu, Q.; Li, T.; Gan, T.Y.; Liu, S.; Liu, K. Is the cold region in Northeast China still getting warmer under climate change impact? Atmos. Res. 2020, 237, 104864. [Google Scholar] [CrossRef]
  52. Wang, J.; Wang, Q.; Zhao, Y.; Li, H.; Zhai, J.; Shang, Y. Temporal and spatial characteristics of pan evaporation trends and their attribution to meteorological drivers in the Three-River Source Region, China. J. Geophys. Res. Atmos. 2015, 120, 6391–6408. [Google Scholar] [CrossRef]
  53. Zhang, H.; Wang, L. Analysis of the variation in potential evapotranspiration and surface wet conditions in the Hancang River Basin, China. Sci. Rep. 2021, 11, 8607. [Google Scholar] [CrossRef]
  54. Jin, Y.; Wang, D.; Feng, Y.; Wu, J.; Cui, W.; He, X.; Chen, A.; Zeng, Z. Decreasing relative humidity dominates a reversal of decreasing pan evaporation in mainland China after 1989. J. Hydrol. 2022, 608, 127641. [Google Scholar] [CrossRef]
  55. Liao, W.; Jiang, W. Evaluation of the spatiotemporal variations in the eco-environmental quality in China based on the remote sensing ecological index. Remote Sens. 2020, 12, 2462. [Google Scholar] [CrossRef]
  56. Jiang, F.; Xie, X.; Wang, Y.; Liang, S.; Zhu, B.; Meng, S.; Zhang, X.; Chen, Y.; Liu, Y. Vegetation greening intensified transpiration but constrained soil evaporation on the Loess Plateau. J. Hydrol. 2022, 614, 128514. [Google Scholar] [CrossRef]
  57. Qin, Y.; Sun, Y.; Zhang, W.; Qin, Y.; Chen, J.; Wang, Z.; Zhou, Z. Species monitoring using unmanned aerial vehicle to reveal the ecological role of Plateau Pika in maintaining vegetation diversity on the northeastern Qinghai-Tibetan Plateau. Remote Sens. 2020, 12, 2480. [Google Scholar] [CrossRef]
  58. Cao, Y.; Xie, Z.; Woodgate, W.; Ma, X.; Cleverly, J.; Pang, Y.; Qin, F.; Huete, A. Ecohydrological decoupling of water storage and vegetation attributed to China’s large-scale ecological restoration programs. J. Hydrol. 2022, 615, 128651. [Google Scholar] [CrossRef]
  59. Jiang, W.; Yuan, L.; Wang, W.; Cao, R.; Zhang, Y.; Shen, W. Spatio-temporal analysis of vegetation variation in the Yellow River Basin. Ecol. Indic. 2015, 51, 117–126. [Google Scholar] [CrossRef]
  60. Ma, Y.J.; Shi, F.Z.; Hu, X.; Li, X.Y. Threshold vegetation greenness under water balance in different desert areas over the Silk Road Economic Belt. Remote Sens. 2020, 12, 2452. [Google Scholar] [CrossRef]
  61. Sun, S.; Liu, Y.; Chen, H.; Ju, W.; Xu, C.-Y.; Liu, Y.; Zhou, B.; Zhou, Y.; Zhou, Y.; Yu, M. Causes for the increases in both evapotranspiration and water yield over vegetated mainland China during the last two decades. Agric. For. Meteorol. 2022, 324, 109118. [Google Scholar] [CrossRef]
  62. Yin, L.; Feng, X.; Fu, B.; Wang, S.; Wang, X.; Chen, Y.; Tao, F.; Hu, J. A coupled human-natural system analysis of water yield in the Yellow River basin, China. Sci. Total Environ. 2021, 762, 143141. [Google Scholar] [CrossRef] [PubMed]
  63. Zhang, B.; Tian, L.; Yang, Y.; He, X. Revegetation does not decrease water yield in the Loess Plateau of China. Geophys. Res. Lett. 2022, 49, e2022GL098025. [Google Scholar] [CrossRef]
  64. Kong, R.; Zhang, Z.; Zhang, Y.; Wang, Y.; Peng, Z.; Chen, X.; Xu, C.Y. Detection and Attribution of Changes in Terrestrial Water Storage across China: Climate Change versus Vegetation Greening. Remote Sens. 2023, 15, 3104. [Google Scholar] [CrossRef]
  65. Li, X.; Zou, L.; Xia, J.; Dou, M.; Li, H.; Song, Z. Untangling the effects of climate change and land use/cover change on spatiotemporal variation of evapotranspiration over China. J. Hydrol. 2022, 612, 128189. [Google Scholar] [CrossRef]
  66. Gao, X.; Wu, P.; Zhao, X.; Wang, J.; Shi, Y. Effects of land use on soil moisture variations in a semi-arid catchment: Implications for land and agricultural water management. Land Degrad. Dev. 2014, 25, 163–172. [Google Scholar] [CrossRef]
  67. Ye, L.; Cheng, L.; Liu, P.; Liu, D.; Zhang, L.; Qin, S.; Xia, J. Management of vegetative land for more water yield under future climate conditions in the over-utilized water resources regions: A case study in the Xiong’an New area. J. Hydrol. 2021, 600, 126563. [Google Scholar] [CrossRef]
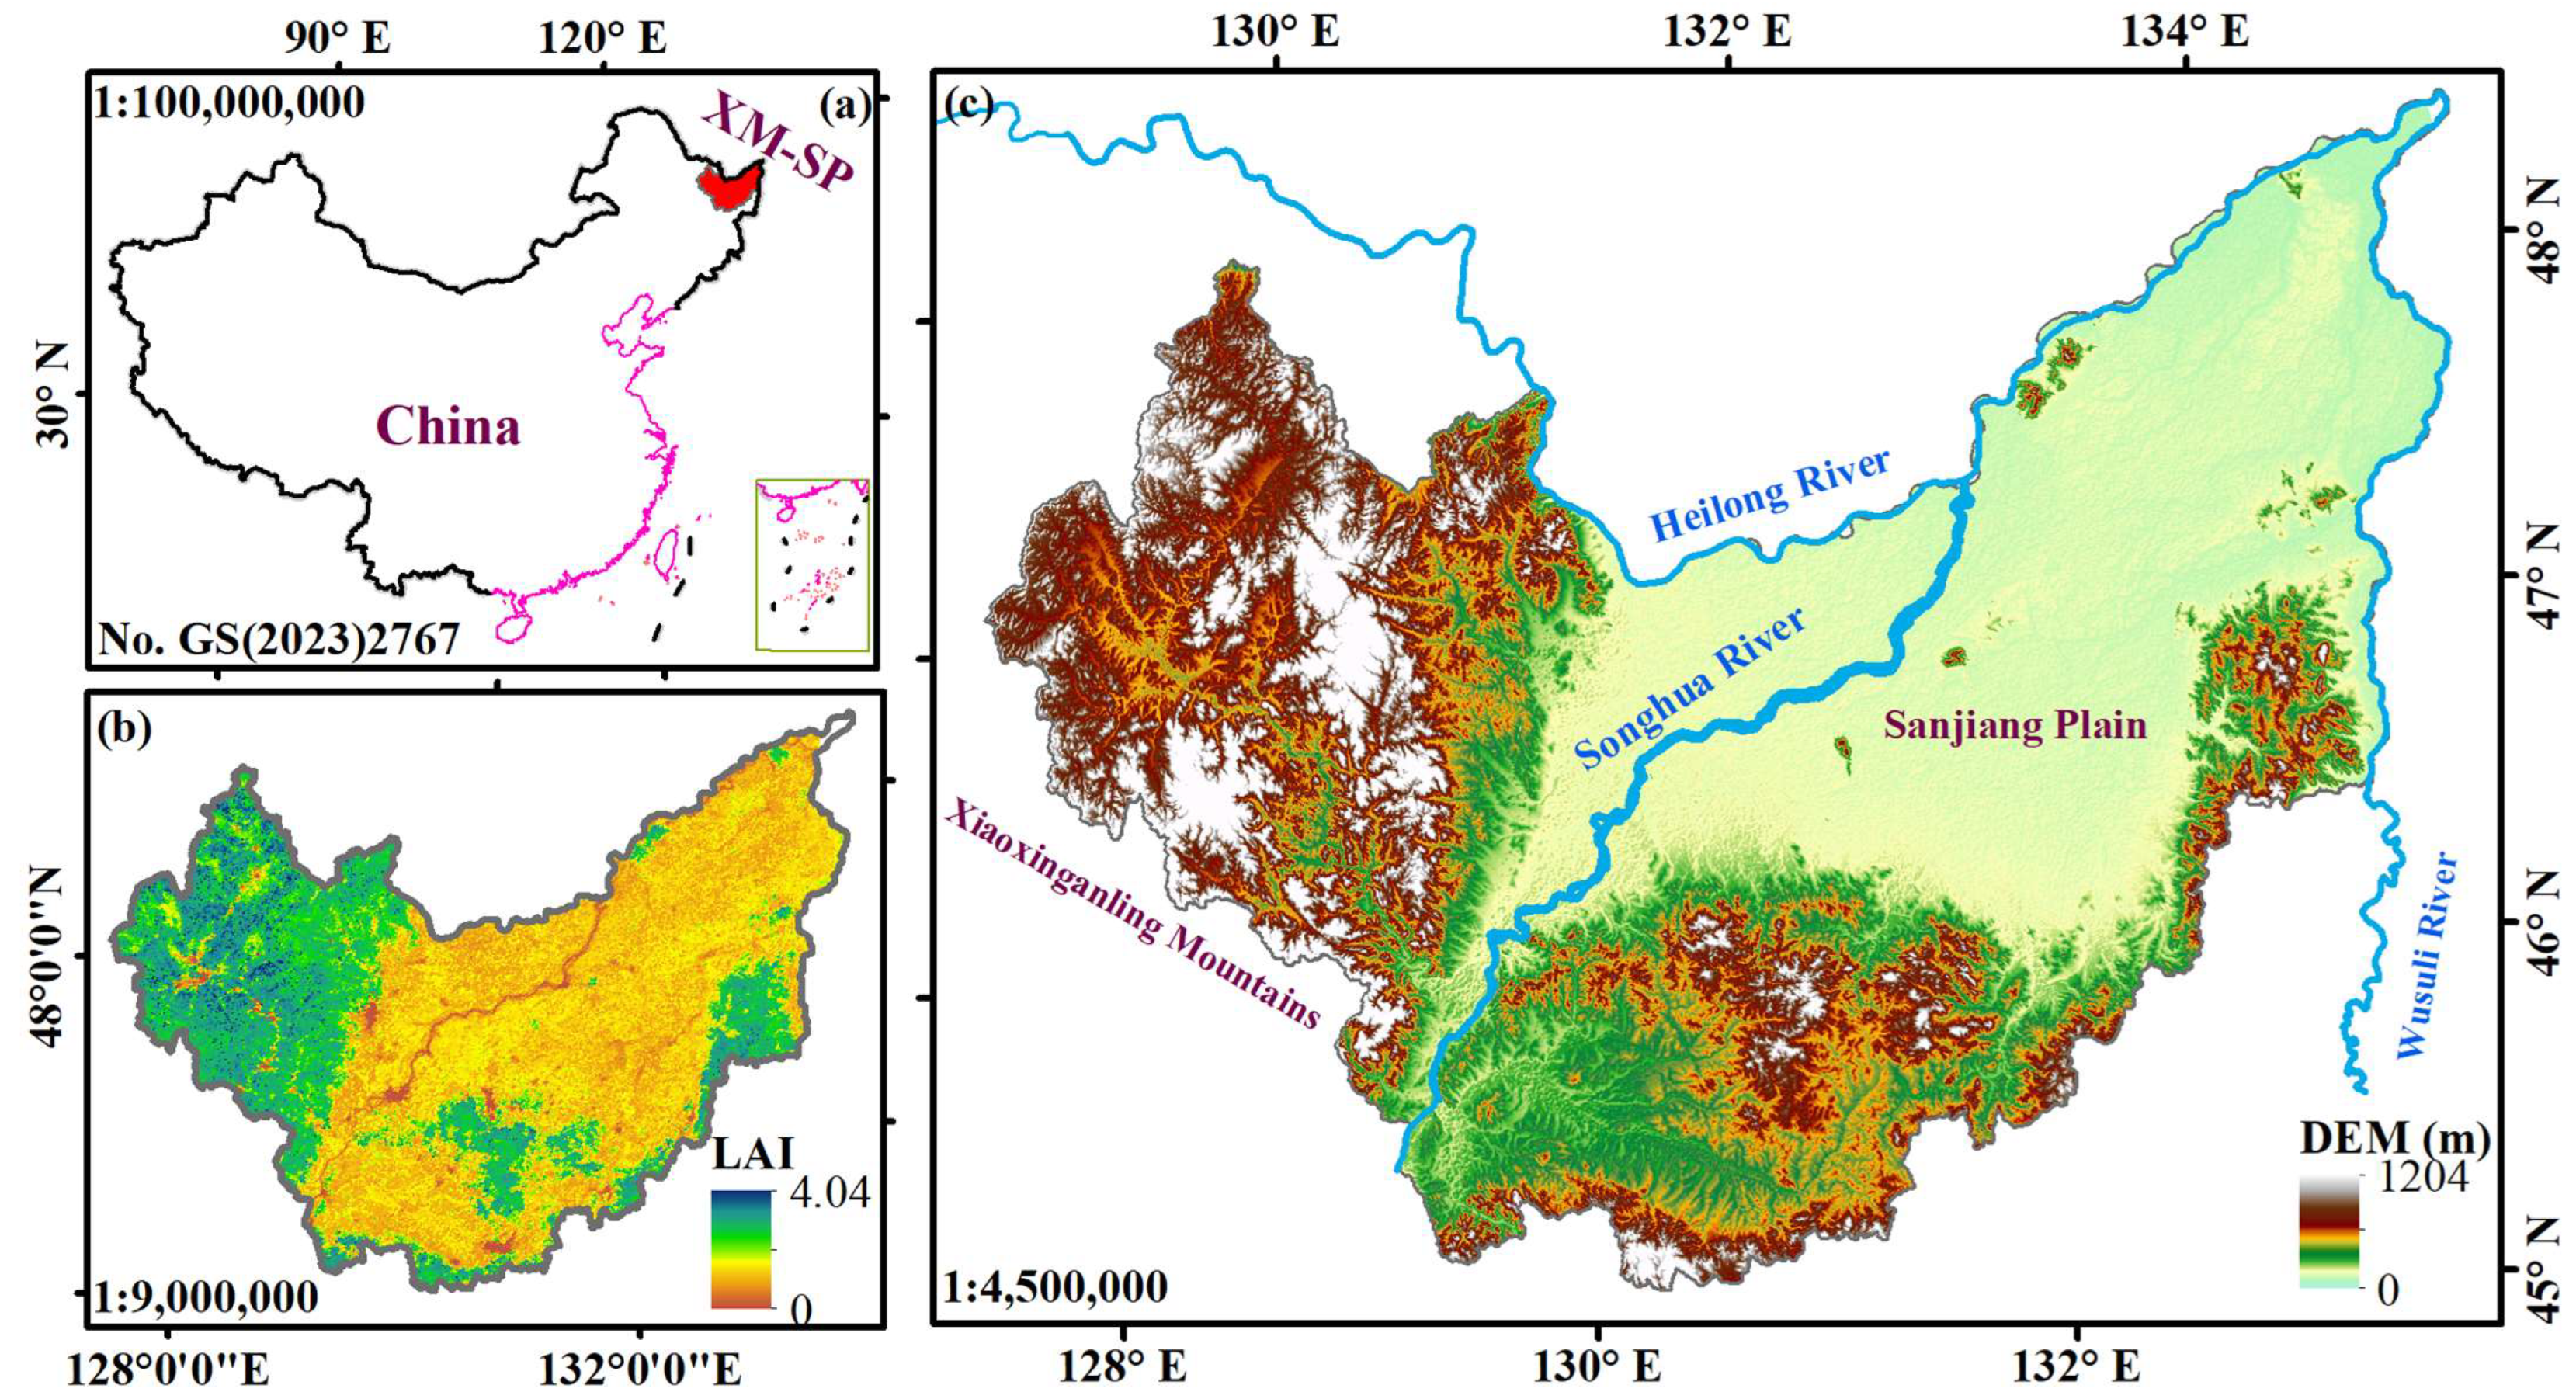
Figure 1. The localization (a) and hypsometry (c) of the study area and spatial distribution of average LAI (b) from 2000 to 2020 within the study region.
Remotesensing 16 02709 g001
Figure 2. The structure diagram of the ESSI-3 hydrological model.
Remotesensing 16 02709 g002
Figure 3. The evaluation of ESSI-3 model performance for evapotranspiration (a), streamflow (b,c), and terrestrial water storage (d).
Remotesensing 16 02709 g003
Figure 4. Annual variations of (a) Tas (units: °C), (b) Rn (units: W/m²), (c) Rsds (units: W/m²), (d) Pr (units: mm), (e) RH (units: %), and (f) WS (units: m/s) in the XM-SP during 2000–2020. The blue solid line represents actual inter-annual variation, and the orange dashed line represents the fitted inter-annual trend variation.
Remotesensing 16 02709 g004
Figure 5. Spatial distribution of (a) Tas (units: °C/yr), (b) Rn (units: W·m²/yr), (c) Rsds (units: W·m>−²/yr), (d) Pr (units: mm/yr), (e) RH (units: %/yr), and (f) WS (units: m·s−1/yr) variation trend in XM-SP from 2000 to 2020.
Remotesensing 16 02709 g005
Figure 6. Temporal dynamics (ae), spatial distribution (f), and proportions (g,h) of major land use/land cover area during 2000–2020 over the XM-SP.
Remotesensing 16 02709 g006
Figure 7. Temporal and spatial trends of LAI ((ac), 2000–2020) and TWSA (d,e), units: mm, (f), units: mm/yr, 2003–2016) in XM-SP.
Remotesensing 16 02709 g007
Figure 8. The interannual variations of runoff fluxes (ad), water storage components (ei), and evapotranspiration fluxes (jl) during 2000–2020 over the XM-SP region (units: mm).
Remotesensing 16 02709 g008
Figure 9. Interannual variation of (a) total runoff fluxes, (b) total water storage components, and (c) total evapotranspiration fluxes simulated under dynamic and constant scenarios during 2000–2020 over the XM-SP region (units: mm).
Remotesensing 16 02709 g009
Figure 10. Correlation coefficients of hydrological components under dynamic scenario with climatic and vegetation factors. Note: * indicates statistical significance at the p < 0.05 level.
Remotesensing 16 02709 g010
Figure 11. The spatial distribution of variation trends in runoff fluxes (ad), water storage components (ei), and evapotranspiration fluxes (jl) during 2000–2020 over the XM-SP region (units: mm/year).
Remotesensing 16 02709 g011
Figure 12. Spatial patterns of variation of 12 hydrological variables over the XM-SP under the dynamic and constant scenarios over the 20 years studied.
Remotesensing 16 02709 g012
Figure 13. Statistical Results of 12 Hydrological Variables in the XM-SP over the 20 years studied.
Remotesensing 16 02709 g013
Figure 14. The contributions of the IAV on hydrological variations at pixel scale under the dynamic and constant scenario in the XM-SP during 2000–2020.
Remotesensing 16 02709 g014
Figure 15. The relative contributions of different land use/cover to the IAV of hydrological components at pixel scale in the XM-SP during 2000–2020.
Remotesensing 16 02709 g015
Figure 16. Comparison between the conditions before and after pilot ecological restoration projects following the recommendations of this study (ah), and the proposed zoning map (i) for the ecological conservation and restoration functional areas in XM-SP. (ah) represents the on-site comparison before and after ecological measures.
Remotesensing 16 02709 g016
Table 1. Summary of the datasets utilized in this study.
TypeVariableData SourceSpatial and Temporal Resolution, Time SpanReference
Meteorological
forcing
PrecipitationERA-5 (https://cds.climate.copernicus.eu, accessed on 1 December 2023)0.25° × 0.25°, daily, 2000–2020[32]
Temperature
Wind speed
Relative humidity
Surface air pressure
Surface net solar radiation
Surface solar radiation downwards
Soil propertyBulk densitySoilGrids
(https://www.soilgrids.org/, accessed on 10 December 2023)
1 km × 1 km, fixed[33]
Clay content mass fraction
Silt content mass fraction
Sand content mass fraction
Vegetation
parameter
Leaf area index (LAI)GLOBMAP-based (https://zenodo.org/, accessed on 15 December 2023)8 km, 8-day, 2000–2020[34]
Tree cover fractionMODIS (https://appeears.earthdatacloud.nasa.gov/, accessed on 15 December 2023)500 m × 500 m, fixed, 2008[35]
Land use/cover (LULC)MCD12Q1 (https://appeears.earthdatacloud.nasa.gov/, accessed on 15 December 2023)500 m × 500 m, yearly, 2000–2020[36]
OthersDEMHydroSHED (https://www.hydrosheds.org/, accessed on 15 December 2023)30 arc-second, fixed[37]
Streamflow at Jiamusi StationWater YearbookDaily, 2008–2016, monthly, 2001–2007
EvapotranspirationMOD16A2 (https://appeears.earthdatacloud.nasa.gov/, accessed on 1 March 2024)500 m × 500 m, yearly, 2000–2020[38]
Terrestrial water storageJPL-Mascon GRACE (https://podaac.jpl.nasa.gov/, accessed on 1 March 2024)0.25° × 0.25°,
monthly,
2003–2016
[39]
Disclaimer/Publisher’s Note: The statements, opinions and data contained in all publications are solely those of the individual author(s) and contributor(s) and not of MDPI and/or the editor(s). MDPI and/or the editor(s) disclaim responsibility for any injury to people or property resulting from any ideas, methods, instructions or products referred to in the content.