Abstract
Le’an Town, located in the southwest of Qingchuan County, Guangyuan City, Sichuan Province, boasts a unique geographical position. The town’s terrain is complex, and its geological environment is fragile. Multiple phases of tectonic movements have resulted in numerous cracks and faults, making the area prone to landslides, debris flows, and other disasters. Additionally, heavy rainfall and fluctuating groundwater levels further exacerbate the instability of the mountains. Human activities, such as overdevelopment and deforestation, have significantly increased the risk of geological disasters. Currently, the methods for landslide prediction in Le’an Town are limited; traditional techniques cannot provide precise forecasts, and the study area is largely covered by tall vegetation. Therefore, this paper proposes a method that combines SBAS-InSAR technology with dynamic changes in land use and hydrological conditions. SBAS-InSAR technology is used to obtain surface deformation information, while land-use changes and hydrological condition data are incorporated to analyze the dynamic characteristics and potential influencing factors of landslide areas. The innovation of this method lies in its high-precision surface deformation monitoring capability and the integration of multi-source data, which can more comprehensively reveal the geological environmental characteristics of the study area, thereby achieving accurate predictions of landslide development. The study results indicate that the annual subsidence rate in most deformation areas of Le’an Town ranges from −10 to 0 mm, indicating slow subsidence. In some areas, the subsidence rate exceeds −50 mm per year, showing significant slope aspect differences, reflecting the combined effects of geological structures, climatic conditions, and human activities. It is evident that land-use changes and hydrological conditions have a significant impact on the occurrence and development of landslides. Therefore, by utilizing SBAS-InSAR technology and cross-verifying it with other techniques, the consistency of identified landslide deformation areas can be enhanced, thereby improving results. This method provides a scientific basis for the monitoring and early warning of landslide disasters and has important practical application value.
1. Introduction
A landslide refers to a natural phenomenon in which masses of soil or rock on a slope, influenced by factors such as river erosion, groundwater activity, rainfall saturation, earthquakes, and human excavation, will slide downhill along a defined weak surface or zone under the force of gravity. The components of a landslide include the landslide body (the entire sliding portion of the slope), the landslide scarp (the exposed boundary resembling a wall after detachment from the stable hillside), the sliding surface (the boundary along which the landslide mass slides over the stable rock or soil), the sliding zone (a fractured zone of crushed material along parallel sliding surfaces), the landslide bed (the stable rock or soil mass upon which the landslide moves), the landslide toe (the protruding front edge of the landslide resembling a tongue), landslide benches (steps formed on the surface of the landslide as a result of differential sliding velocities), the landslide perimeter (the boundary line on a plan between the landslide mass and the surrounding stable rock or soil), the landslide trough (a depression formed between the sliding mass and the scarp), the landslide bulge (a small mound formed at the front edge of the landslide due to resistance forces), and landslide cracks, among others. Due to the various types of movement and sources, landslides are common geological hazards in nature and often pose significant risks [1,2,3,4,5,6].
Landslides frequently result in the destruction of farmland, houses, and infrastructure, causing harm to humans and livestock, damaging forests, roads, agricultural machinery, and water-conservancy and hydropower facilities, and so on. In severe cases, landslides can lead to devastating disasters in rural areas, severely impacting residents’ lives and property safety. When occurring in urban areas, they can bury houses, which will cause casualties among humans and livestock, destroy farmland, factories, schools, government offices, and other facilities, leading to loss of life and property, as well as affecting the functionality of infrastructure such as electricity, water, and transportation. In extreme cases, they may even threaten the safety of entire towns. Landslides in mining areas can destroy mining facilities, cause casualties among workers, damage factory buildings, and result in the suspension of mining operations, leading to significant economic losses for mining enterprises [7,8,9,10,11,12].
Sichuan Province is a geographically complex region, located in southwest China (Figure 1), characterized by diverse terrain encompassing high mountains, hills, and basins. The varied topography with significant elevation changes provides favorable conditions for the landslide occurrence. From a tectonic perspective, Sichuan Province lies in the transitional zone between the Qinghai-Tibet Plateau and the basin geological structures, resulting in active geological processes and complex geological structures. The poor stability of rocks in the region makes it prone to landslides. Sichuan Province experiences diverse climates, with the eastern region being relatively humid and the western region drier, influenced by monsoons. Heavy rainfall, concentrated mainly in the summer accompanied by frequent torrential rains, is one of the main factors triggering landslides. With the acceleration of urbanization and expansion of human interventions, land development, mining, and other human interventions further exacerbate the risk of geological disasters [13,14,15,16]. Le’an Town in Guangyuan City, Sichuan Province, exhibits complex terrain and landforms due to multiple tectonic movements over time. Furthermore, being an important area for mineral exploration and having a well-developed river system, it is selected as the study area in this paper. By leveraging the characteristics of dynamic changes in land use and hydrological conditions, the SBAS-InSAR technique is employed to investigate the development characteristics of landslides in this region, aiming to provide more accurate predictions of landslide occurrences.
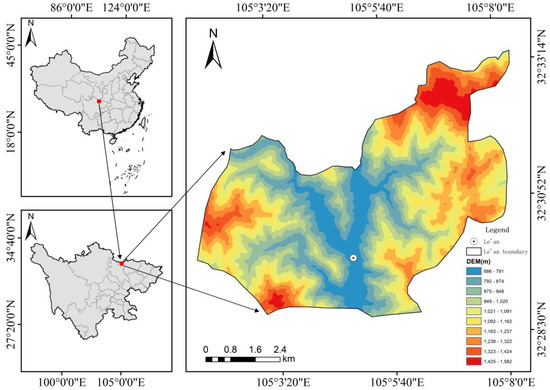
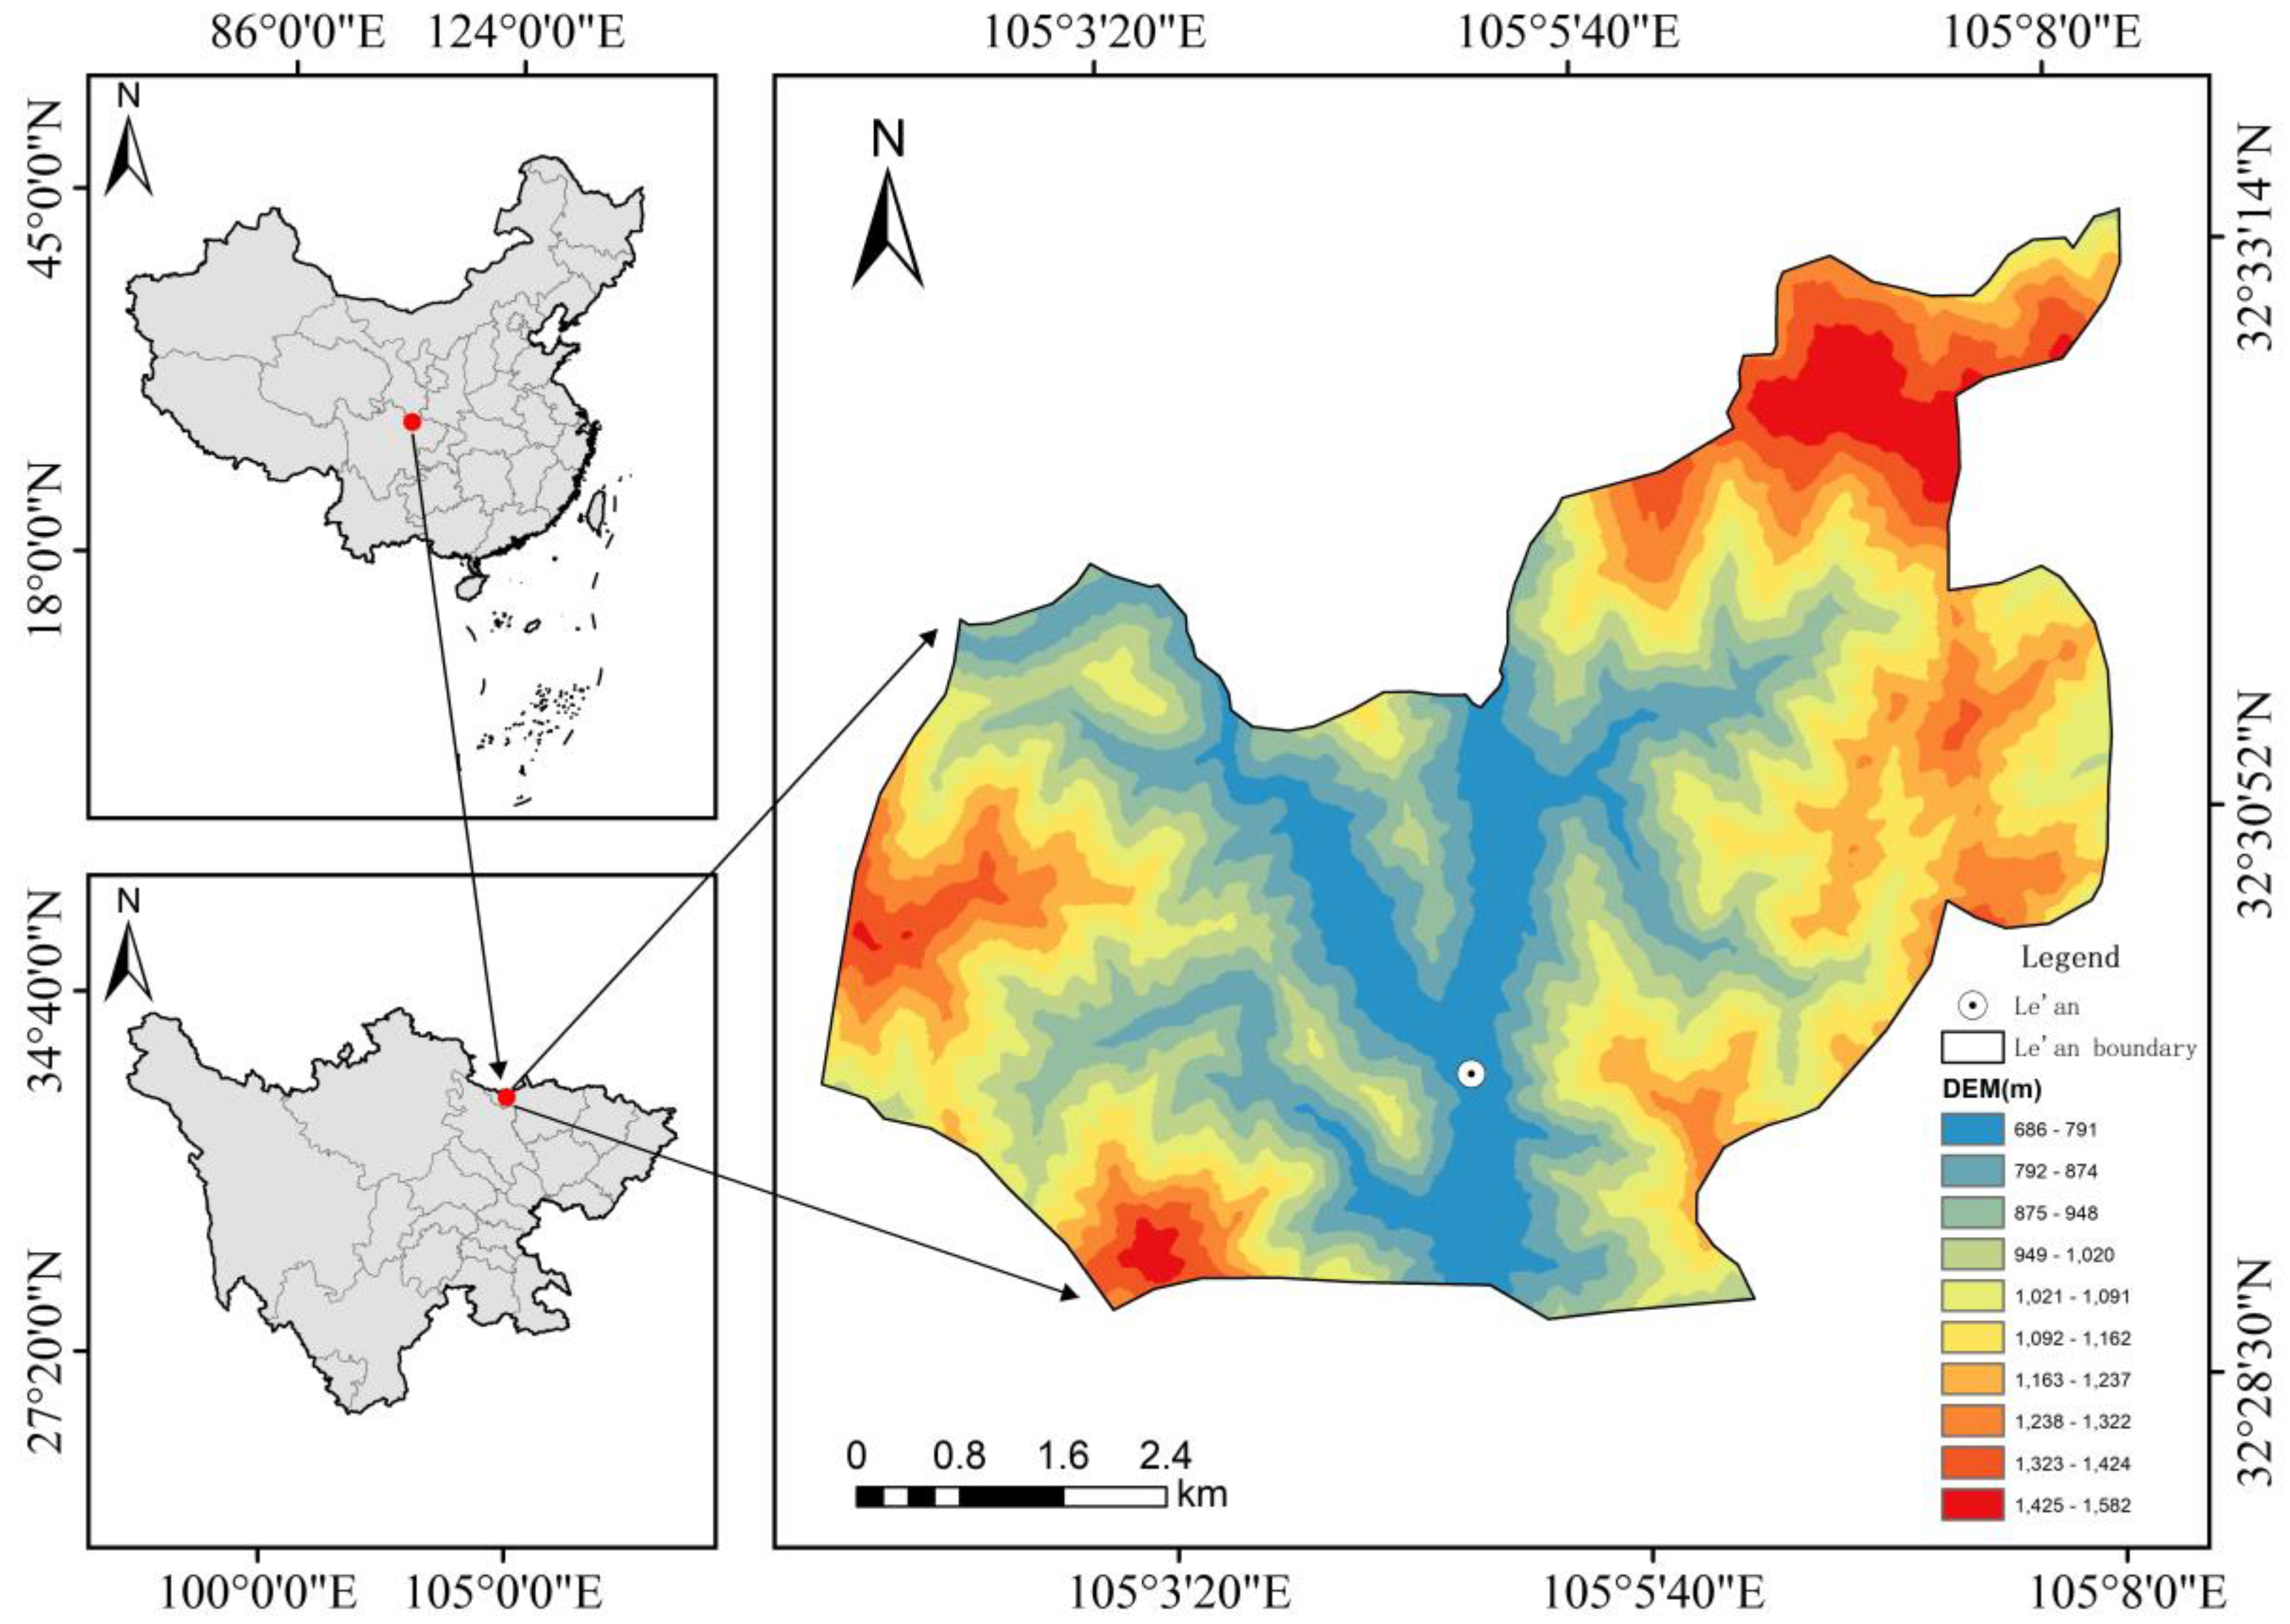
Figure 1.
Digital elevation model of the study area.
Despite significant advancements in landslide monitoring and prediction technologies, there are still some drawbacks and challenges with respect to prediction accuracy [17,18,19,20]. Firstly, landslide disasters are influenced by multiple factors such as geology, topography, climate, and vegetation, making landslide prediction highly complex. Secondly, current landslide monitoring technologies often have limitations in spatial and temporal resolution, making it difficult to accurately monitor and predict landslides that are occurring on a small scale or within a short time frame. Furthermore, landslide monitoring and prediction require extensive data support, including geological and topographical data, meteorological data, remote sensing data, etc. Lastly, existing landslide-prediction models often struggle to accurately capture information such as the timing, location, and magnitude of landslide occurrences, leading to uncertainties in predictions. Additionally, the accuracy of the models is influenced by geological conditions, data quality, and other factors. In recent years, with the rapid development of remote sensing technology, Interferometric Synthetic-Aperture Radar (InSAR) technology, particularly Small Baseline Subset (SBAS) technology, has shown great potential in landslide monitoring, due to its high precision, wide coverage, and all-weather monitoring capabilities. This paper proposes a new method for landslide monitoring and prediction based on SBAS-InSAR technology, combined with the dynamic changes in land use and hydrological conditions.
Small Baseline Subset–Interferometric Synthetic-Aperture Radar (SBAS-InSAR) is a surface-deformation monitoring technique based on Synthetic-Aperture Radar (SAR) data [21,22,23,24,25,26]. This technology utilizes multiple master images and performs time-series analysis based on the short temporal and spatial baseline criteria. SBAS-InSAR technology is primarily used for monitoring geological phenomena such as landslide deformation, uplift, and seismic activity, and it holds significant application value in monitoring urban areas, mining sites, hydrological conditions and geology.
Dynamic changes in land use refer to changes in land-use patterns, coverage, and intensity resulting from both intrinsic changes in land characteristics and modifications in human activities by individuals or groups. With rapid economic development and increasing urban populations, urban land expands rapidly, leading to a decrease in agricultural land and the degradation of land ecosystems [27,28,29,30]. Concurrently, industrialization and the development of transportation networks directly impact dynamic changes in land use, with the expansion of industrial land and the construction of transportation networks facilitating urban development but also resulting in the occupation of large amounts of land [31,32,33]. Additionally, agricultural development is another important factor influencing dynamic changes in land use. Mechanization and widespread use of fertilizers and pesticides have led to the expansion of agricultural land and increased food production. However, excessive agricultural development has brought about a series of issues such as soil quality decline, water pollution, and loss of biodiversity [34,35,36]. Therefore, dynamic changes in land use represent a concentrated reflection of the interaction between human activities and the natural ecological environment. Furthermore, dynamic changes in land use affect hydrological conditions because changes in land use alter surface coverage and soil properties, thereby influencing the circulation and distribution of water [37,38,39]. Different types of land use have varying effects on rainfall interception, soil water retention, and evaporation. Natural vegetation in forested areas, for example, effectively reduces runoff and promotes rainfall infiltration and circulation, maintaining water conservation capabilities. Conversely, in urbanization processes, land cover transitions from vegetation to artificial hard materials such as concrete and asphalt, which lead to increased rainfall runoff, reduced water infiltration, and weakened water circulation [40,41,42,43,44]. For the study of dynamic changes in land use, this paper employs techniques such as multi-temporal image-overlay methods, image algebra operations, and spectral classification methods for monitoring and evaluation, enabling a more accurate understanding of dynamic changes in land use and providing strong support for landslide disaster prevention and control efforts.
2. Materials and Methods
2.1. Study Area
Le’an Town is located in Guangyuan City, Sichuan Province, China, at approximately 32.4355° North latitude and 105.8434° East longitude (Figure 2). It covers an area of approximately 44.6 square kilometers and features a terrain that slopes from northwest to southeast, with predominantly mid-mountain topography. It also encompasses various landforms including low- to mid-mountain areas, hills, terraces, valleys, and small plains. The highest elevation within the town is 3837 m above sea level, while the lowest elevation is 491 m. Situated at the southern foothills of the Qinling Mountains, Le’an Town falls within a transitional zone of the north–south climate. As a result, it exhibits characteristics of a subtropical humid monsoon climate, with an average annual temperature of around 13.7 °C and an average annual precipitation of approximately 1027 mm. The climate is characterized by a relatively delayed spring, a short summer, a cool autumn, and a long winter. Furthermore, the three-dimensional climate variation is significant, meaning that climatic conditions vary with altitude, with different elevations experiencing distinct climatic conditions.
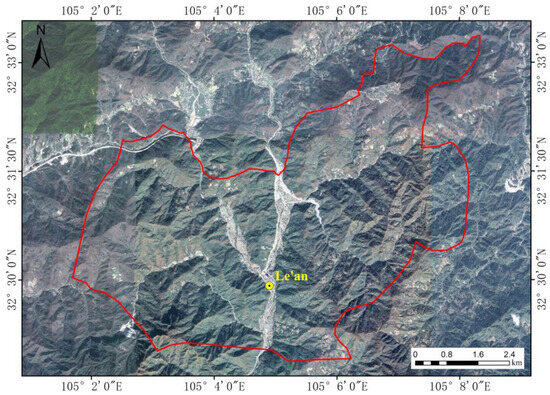
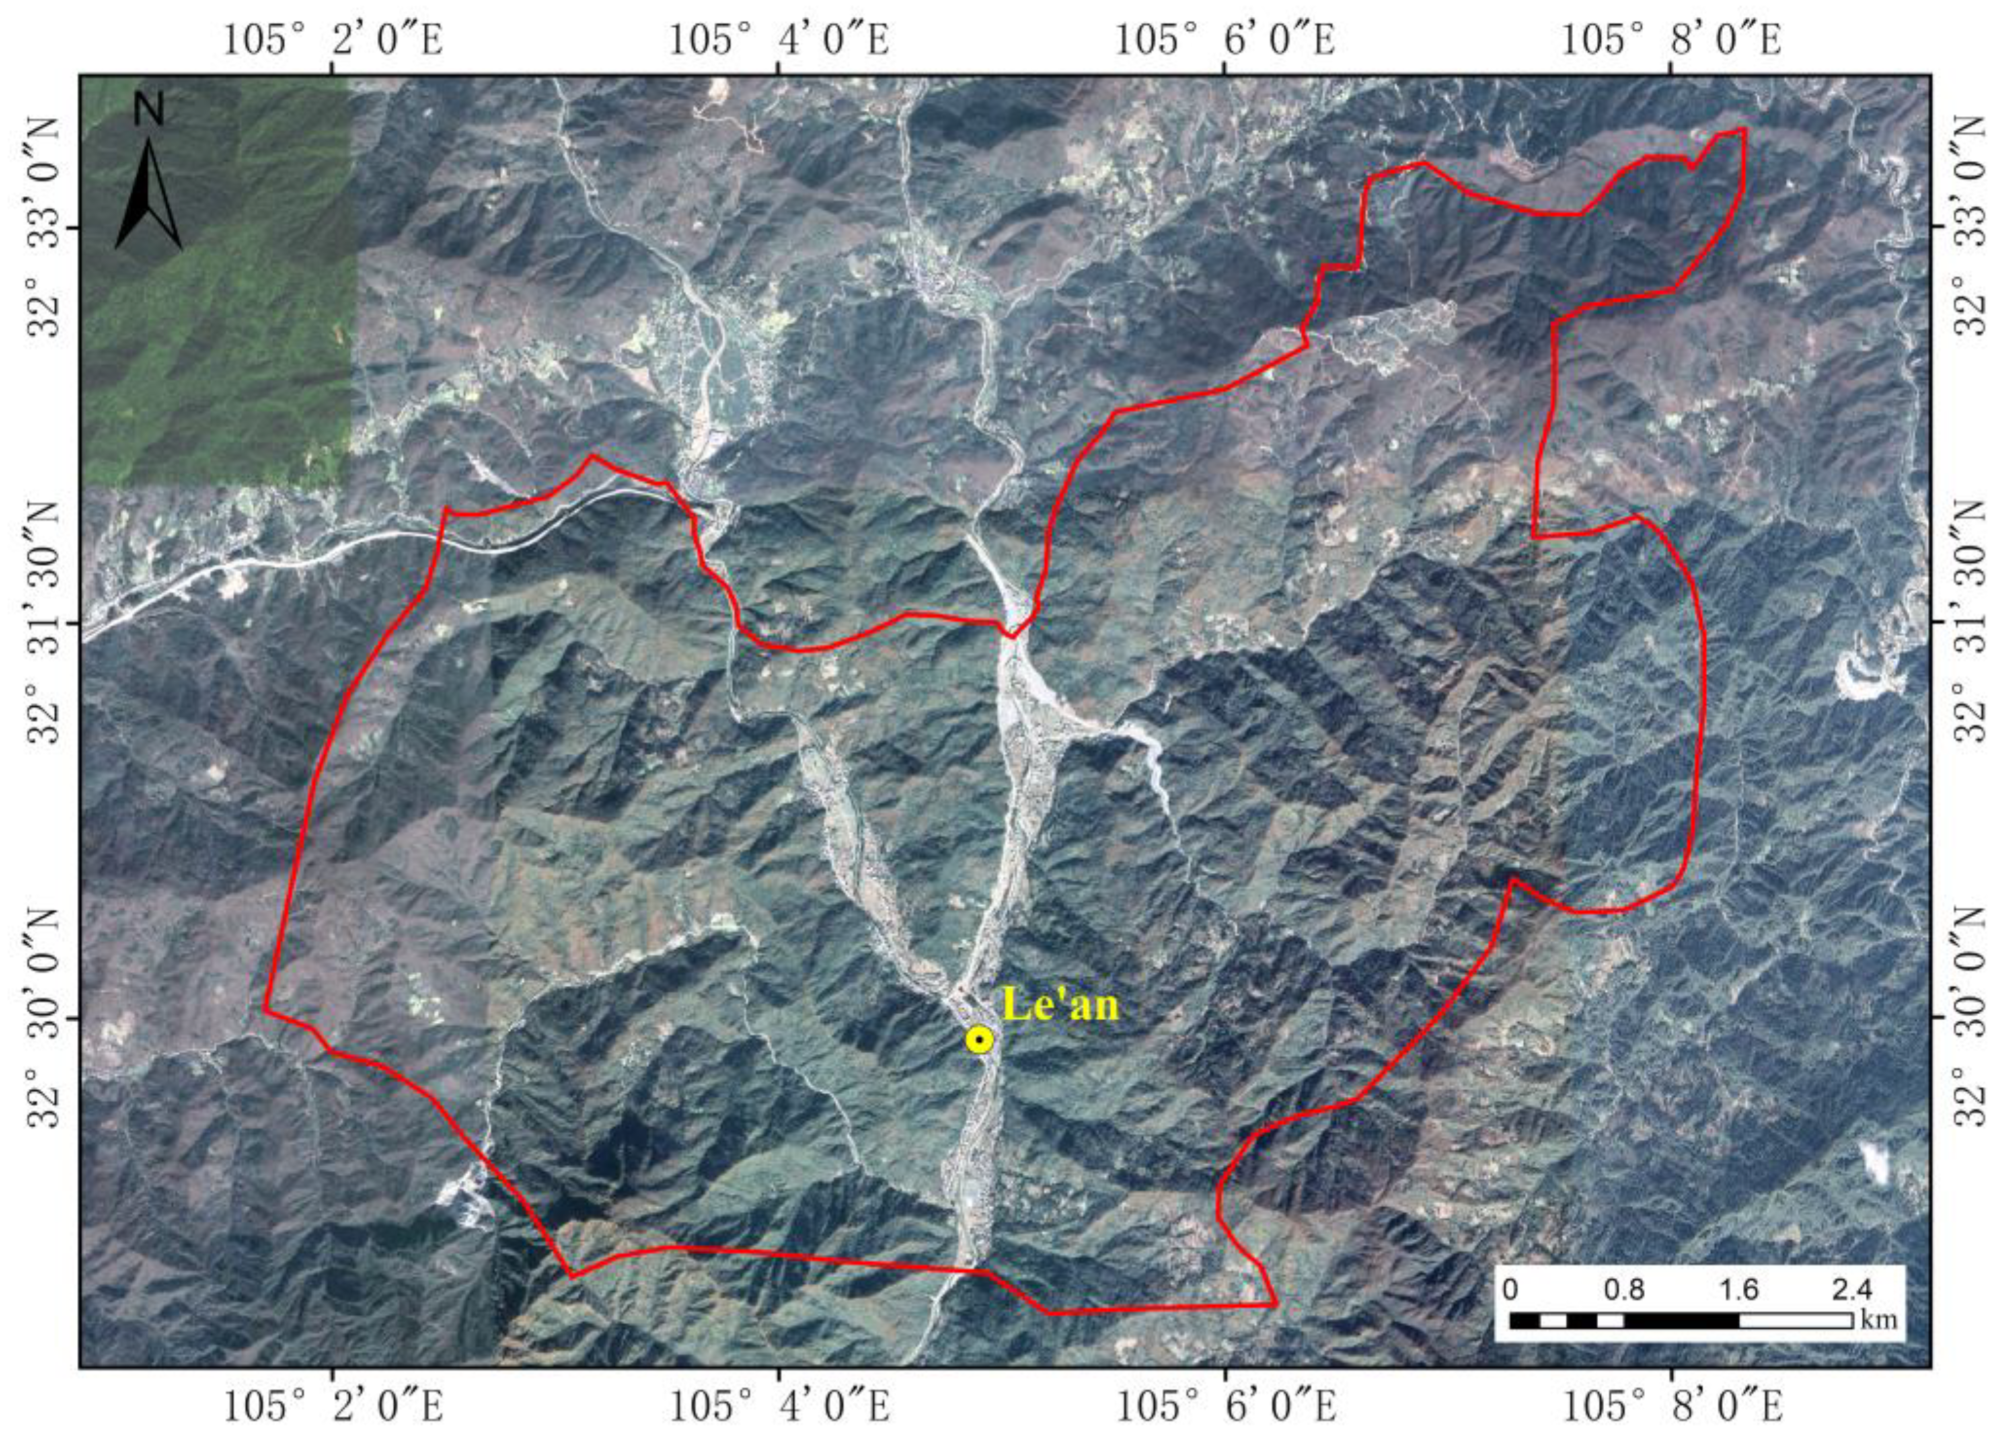
Figure 2.
Satellite map of the study area.
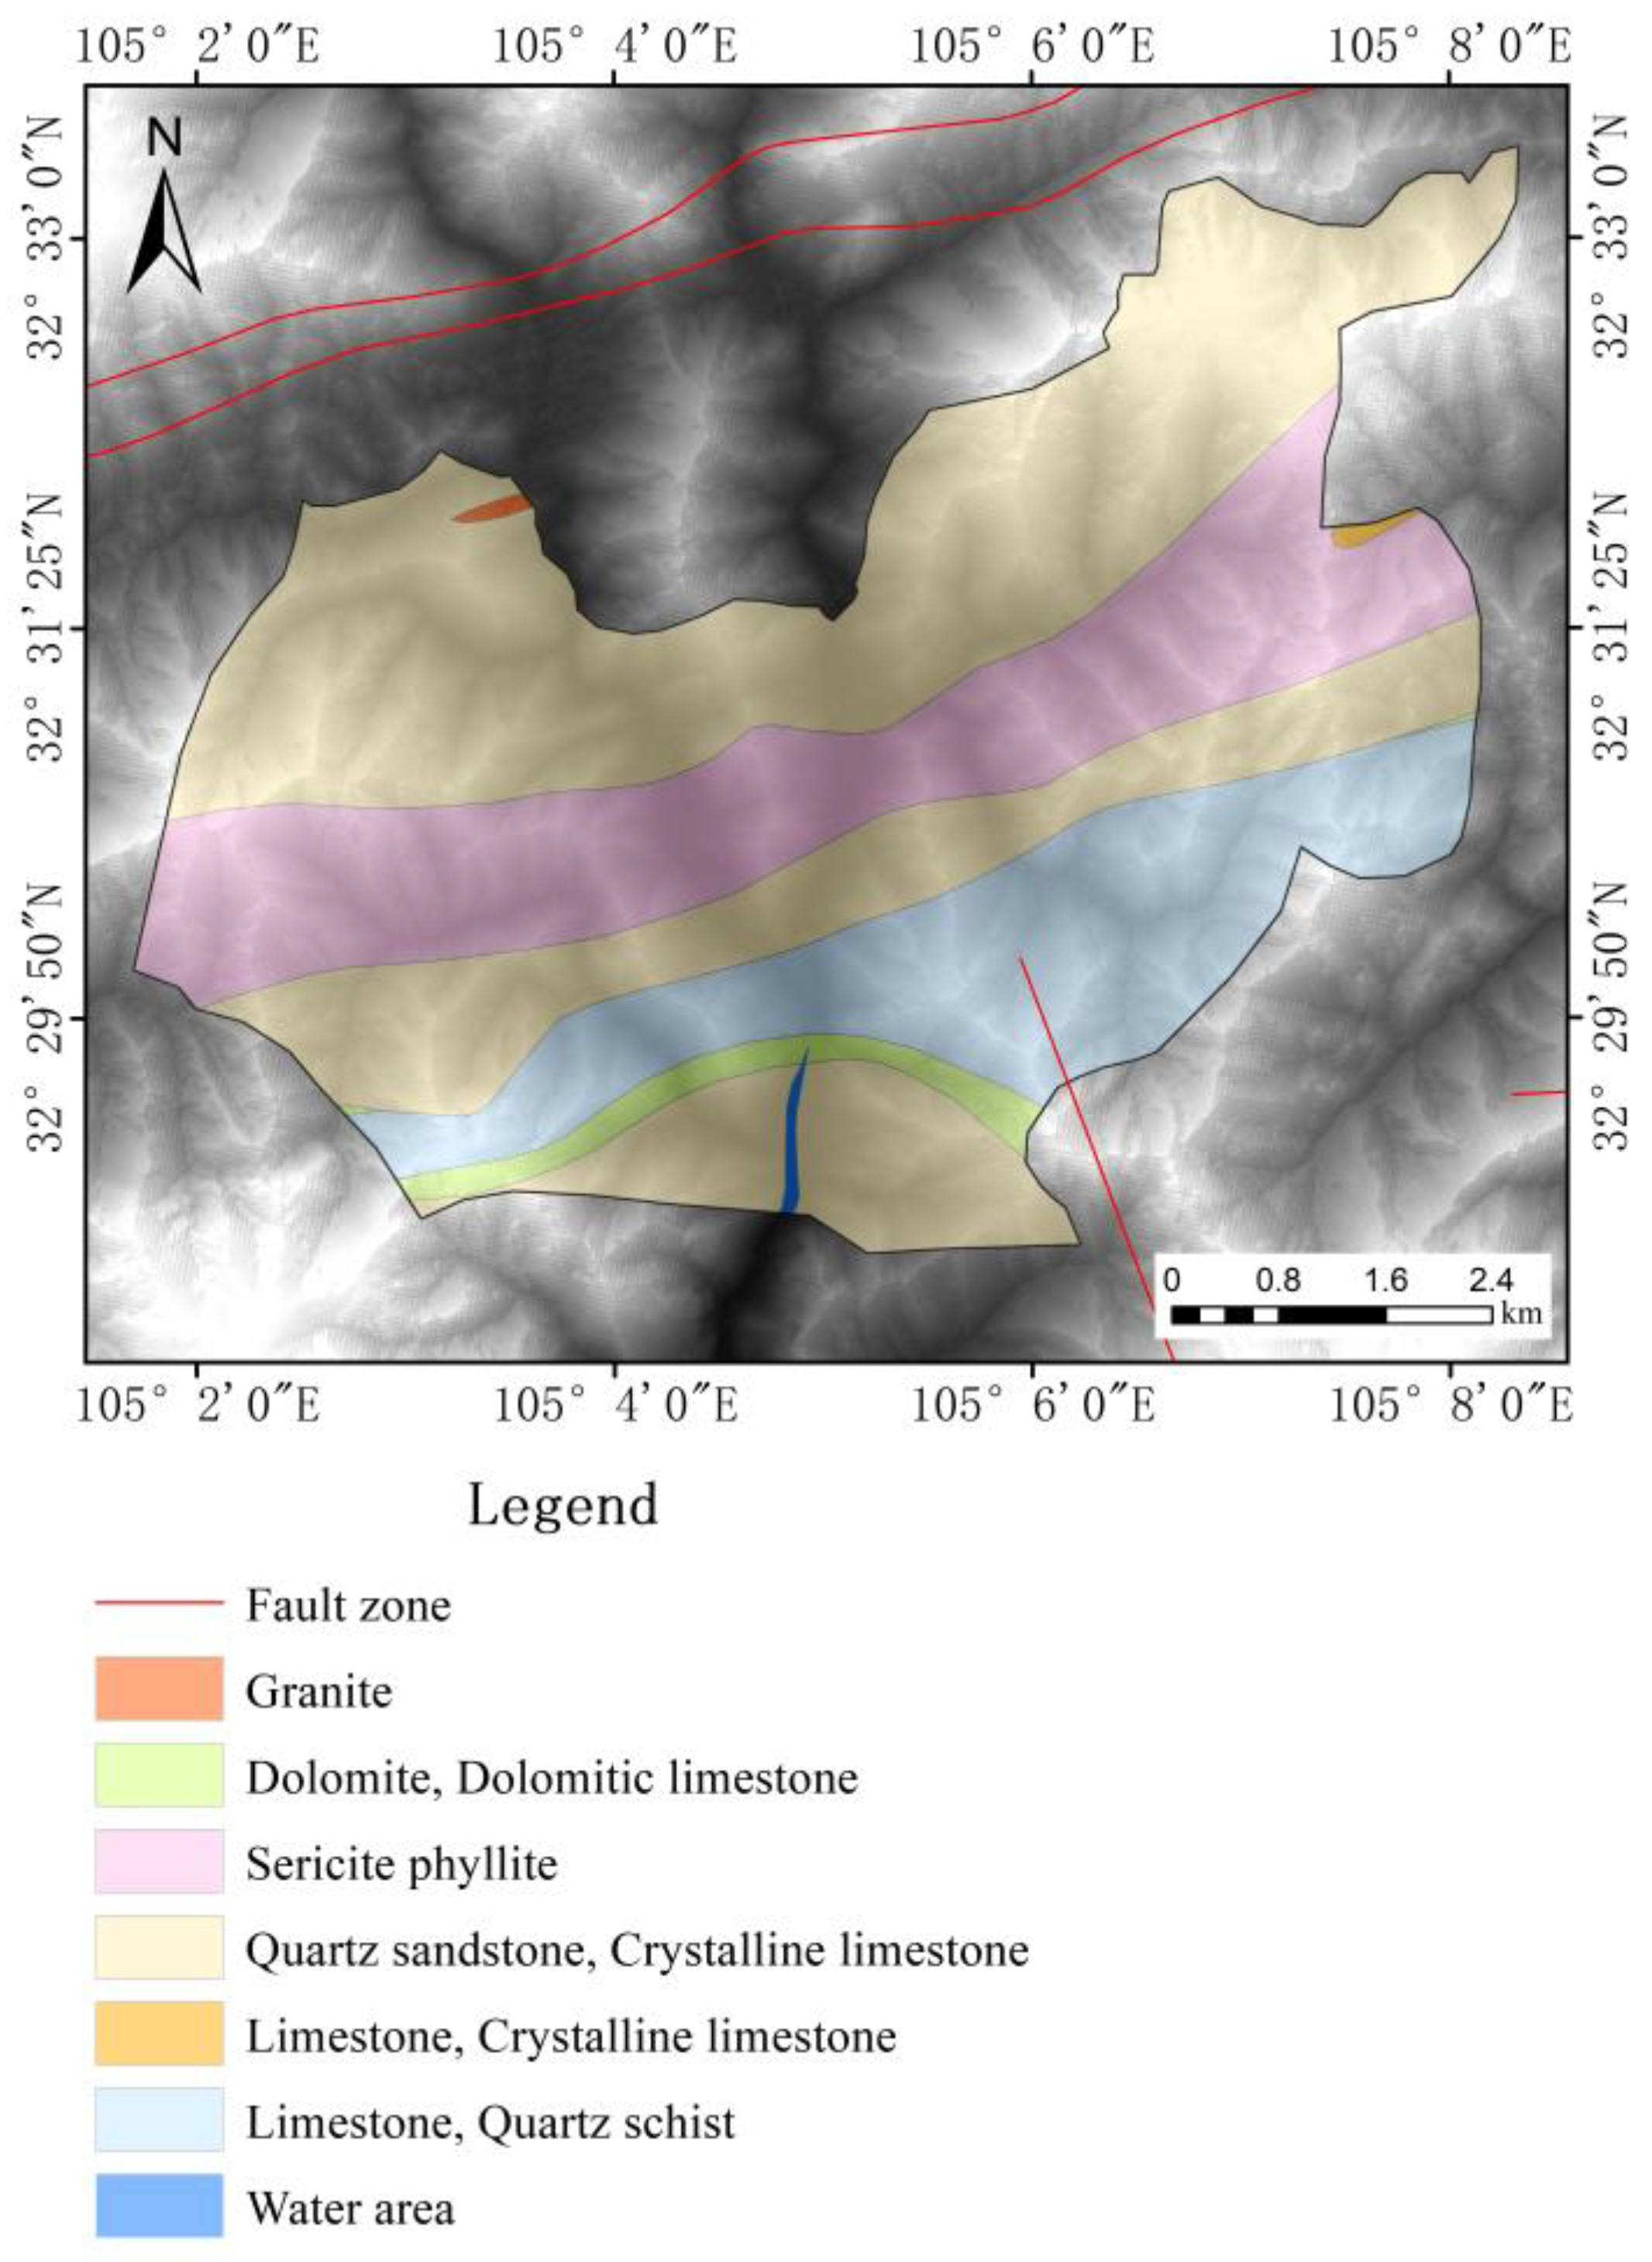
The regional tectonic activity in Le’an Town has resulted in the formation of unique geological landscapes and geological relics. Situated within the transitional zone between the Songpan-Ganzi orogenic belt and the Yangtze Craton, Le’an Town features complex geological structures and diverse landforms. Its geological history has undergone multiple evolutionary stages, including the formation of the Yangtze Platform basement during the Middle and Late Proterozoic, the evolution of passive continental margins from the Cambrian to the Middle Triassic, the transformation from basin to mountain and the subsequent formation of foreland basins during the Late Triassic, the development of foreland basins from the Late Triassic to the end of the Jurassic, and the filling and disappearance of foreland basins from the Late Jurassic to the Tertiary. The geological strata in the Le’an Town area mainly range from the Late Proterozoic to the Early Paleozoic, encompassing formations such as the Cambrian, Ordovician, Silurian, and Carboniferous. Several geological hazard points, such as landslides and collapses, are often developed along fault zones. The presence of these hazard points indicates the active tectonic activity in the region, where the lithology of the strata may exhibit heterogeneity and contain weak interlayers (Figure 3). Concurrently, ongoing regional engineering geological studies have identified predominant lithologies including purple thin-layered mudstone, calcareous mudstone, and shale, with the presence of weak mudstone interlayers, the development of minor-to-moderate folds, intense structural deformation, fault traces, and widespread joint fissures, indicating relatively poor rock strength.

Figure 3.
Geological map of the study area.
Le’an Town boasts abundant geological relics, including various geological profiles and landform types, which record the regional tectonic evolution history. Influenced by multiple periods of tectonic activity, the area exhibits unique geological structural features, spanning three hierarchical structural units: the central thrust belt of the Longmen Mountain, the foreland thrust belt of the Longmen Mountains, and the Sichuan Basin. The geological landscape in this area is primarily characterized by karst landforms, Danxia landforms, typical geological profiles, and water bodies. Due to varying structural conditions, lithological formations, and the erosive effects of running water, the lithological compositions in the area are diverse, and include karst landforms, Danxia landforms, geological structural profile landforms, and metamorphic rock profile landforms. Notably, one of the main components of Danxia landforms is red sandstone, while limestone constitutes the main rock type in karst landforms, which are prone to dissolution, leading to the formation of caves and underground rivers.
Due to multiple periods of tectonic movements experienced by Le’an Town, leading to active fault activity and diverse lithological changes, the area is also an important hub for mineral resource accumulation. According to the overall plan for mineral resources released by the Sichuan Provincial Government and related data, the main mineral resources in this area include approximately 390 million tons of coal, around 5 trillion cubic meters of natural gas, about 31.61 million tons of iron ore, approximately 1 million tons of manganese ore, around 37.526 million tons of natural asphalt, approximately 5 million tons of crystalline graphite, 690 million tons of limestone for cement production, about 145 million cubic meters of limestone for building stone, and approximately 24.717 million tons of quartzite for glass production. With abundant mineral resources and increasing human activities, geological disasters such as landslides may also occur.
The rivers in Le’an Town exhibit significant seasonal variations, greatly influenced by the monsoon climate. During the flood season, water volumes are abundant, whereas they decrease during the dry season. The river system in Le’an Town is primarily composed of the Qingjiang River, Bailong River, and Jialing River (Table 1). The Qingjiang River is a secondary tributary of the Jialing River and a primary tributary of the Bailong River. It originates in the high-altitude regions of northwest Qingchuan County, flows through Le’an Town and other areas, and finally joins the Bailong River at Zhangjiaping in Zhaohua. Additionally, the Qingjiang River basin includes several tributaries with a catchment area of over 100 km2, which also traverse Le’an Town. The ecological environment of the river basins in Le’an Town is well-preserved, with rich vegetation including forests, shrubs, and farmland. The river channels and surrounding areas serve as habitats for various flora and fauna, contributing to a high level of biodiversity.

Table 1.
River system of the study area.
The study area exhibits diverse land-use types, including arable land, orchards, forest land, grassland, wetlands, urban and rural areas, industrial and mining land, and transportation land, as well as water bodies and water conservancy facilities. From 2005 to 2018, Le’an Town witnessed an increasing trend in forest land, water bodies, and construction land, while the areas of arable land, grassland, and unused land decreased. It indicates a significant change in land-use structure during this period, with a particularly notable increase in construction land. The comprehensive index of land-use change ranged from 245.38 to 246.14, showing a clear upward trend which reflects the substantial expansion of construction land area and the improvement in intensive land utilization in Le’an Town. Land-use dynamic changes and driving forces are among the main causes of landslide disasters [45,46,47]. In this study, based on SBAS-InSAR technology, 18 scenes of Sentinel-1A SAR data (Table 2) were utilized. The remote sensing data used in this study were sourced from the European Space Agency (ESA) and obtained through the Copernicus Open Access Hub. Slope surface deformation was analyzed, and its characteristics were examined. Furthermore, by integrating land-use changes and hydrogeological conditions, a more comprehensive analysis of the mechanism of landslide formation and evolution was conducted.
Table 2.
Sentinel-1 satellite image information.
2.2. Data and Preprocessing
Due to changes in surface cover materials (such as vegetation growth, rainfall, etc.), longer time baselines may result in decreased coherence between SAR images, thus affecting the quality of interferograms. Therefore, when utilizing SBAS-InSAR technology, it is advisable to select image pairs with shorter time baselines to generate high-quality interferograms for more accurate detection of surface deformation. In this study, Sentinel-1A data with the Wide swath (IW) mode and Single-Look Complex (SLC) processing, with a polarization type of VV, were used as the data foundation. The remote sensing data-acquisition period spanned from January 2016 to March 2024 (Table 3).
Table 3.
Time series of Sentinel-1A data of the landslide.
Geological disasters (such as landslides, debris flows, earthquakes, etc.) have a direct impact on land use. The occurrence of geological disasters can restrict the ways in which land is utilized, while changes in land use (such as urban expansion, agricultural cultivation, deforestation, etc.) can, in turn, affect the types of land use, thereby altering surface hydrological conditions, soil structure, and vegetation cover [48,49,50].
Based on the long-term series of SAR images obtained using the SBAS-InSAR technique for Le’an Town, this paper integrates optical remote sensing technology to conduct an in-depth study of land-use changes in Le’an Town from four key perspectives: slope, aspect, drainage density, and watershed. This approach aims to reveal the development patterns of landslides in the area.
Slope and aspect are the primary topographic conditions that influence and control landslide development. Based on the high-resolution DEM data (12.5 m), a slope distribution map of the study area is calculated and aspect information is extracted. By overlaying the elevation layer with the slope and aspect maps, the potential impacts of different slopes and aspects on landslide development are analyzed (Figure 4). This shows that landslides tend to occur predominantly on slopes ranging from 38° to 69°, and primarily develop in the east, the north, southeast, and south directions. As the slope gradient increases, the downward force generated by gravity along the slope direction also increases, further exacerbating the stress distribution within the slope body, leading to higher risks of instability. Therefore, it is crucial to strengthen monitoring and assessment of slope bodies, especially in steep slope areas, to prevent landslide disasters.
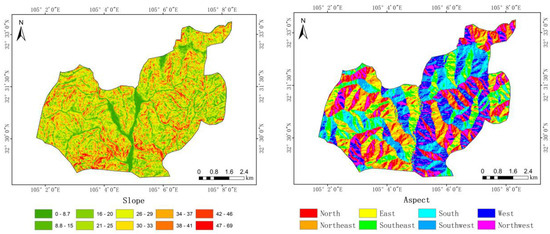
Figure 4.
Influence factors of slope and slope direction.
In addition, river network density and watershed characteristics are two key factors influencing landslide development. Features of the watershed, such as drainage area, watershed shape coefficient, and river gradient, also affect the occurrence of landslides. This paper obtained actual geological survey data through Japan’s ALOS radar satellite and used GIS software v10.8 to conduct a hydrological data analysis of the study area. To ensure smoothness of the acquired data images, the depression filling method was used to obtain flow-direction and flow-accumulation data images (Figure 5).
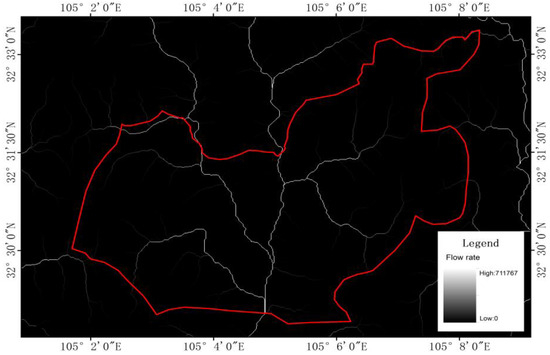
Figure 5.
Flow-accumulation map of the study area.
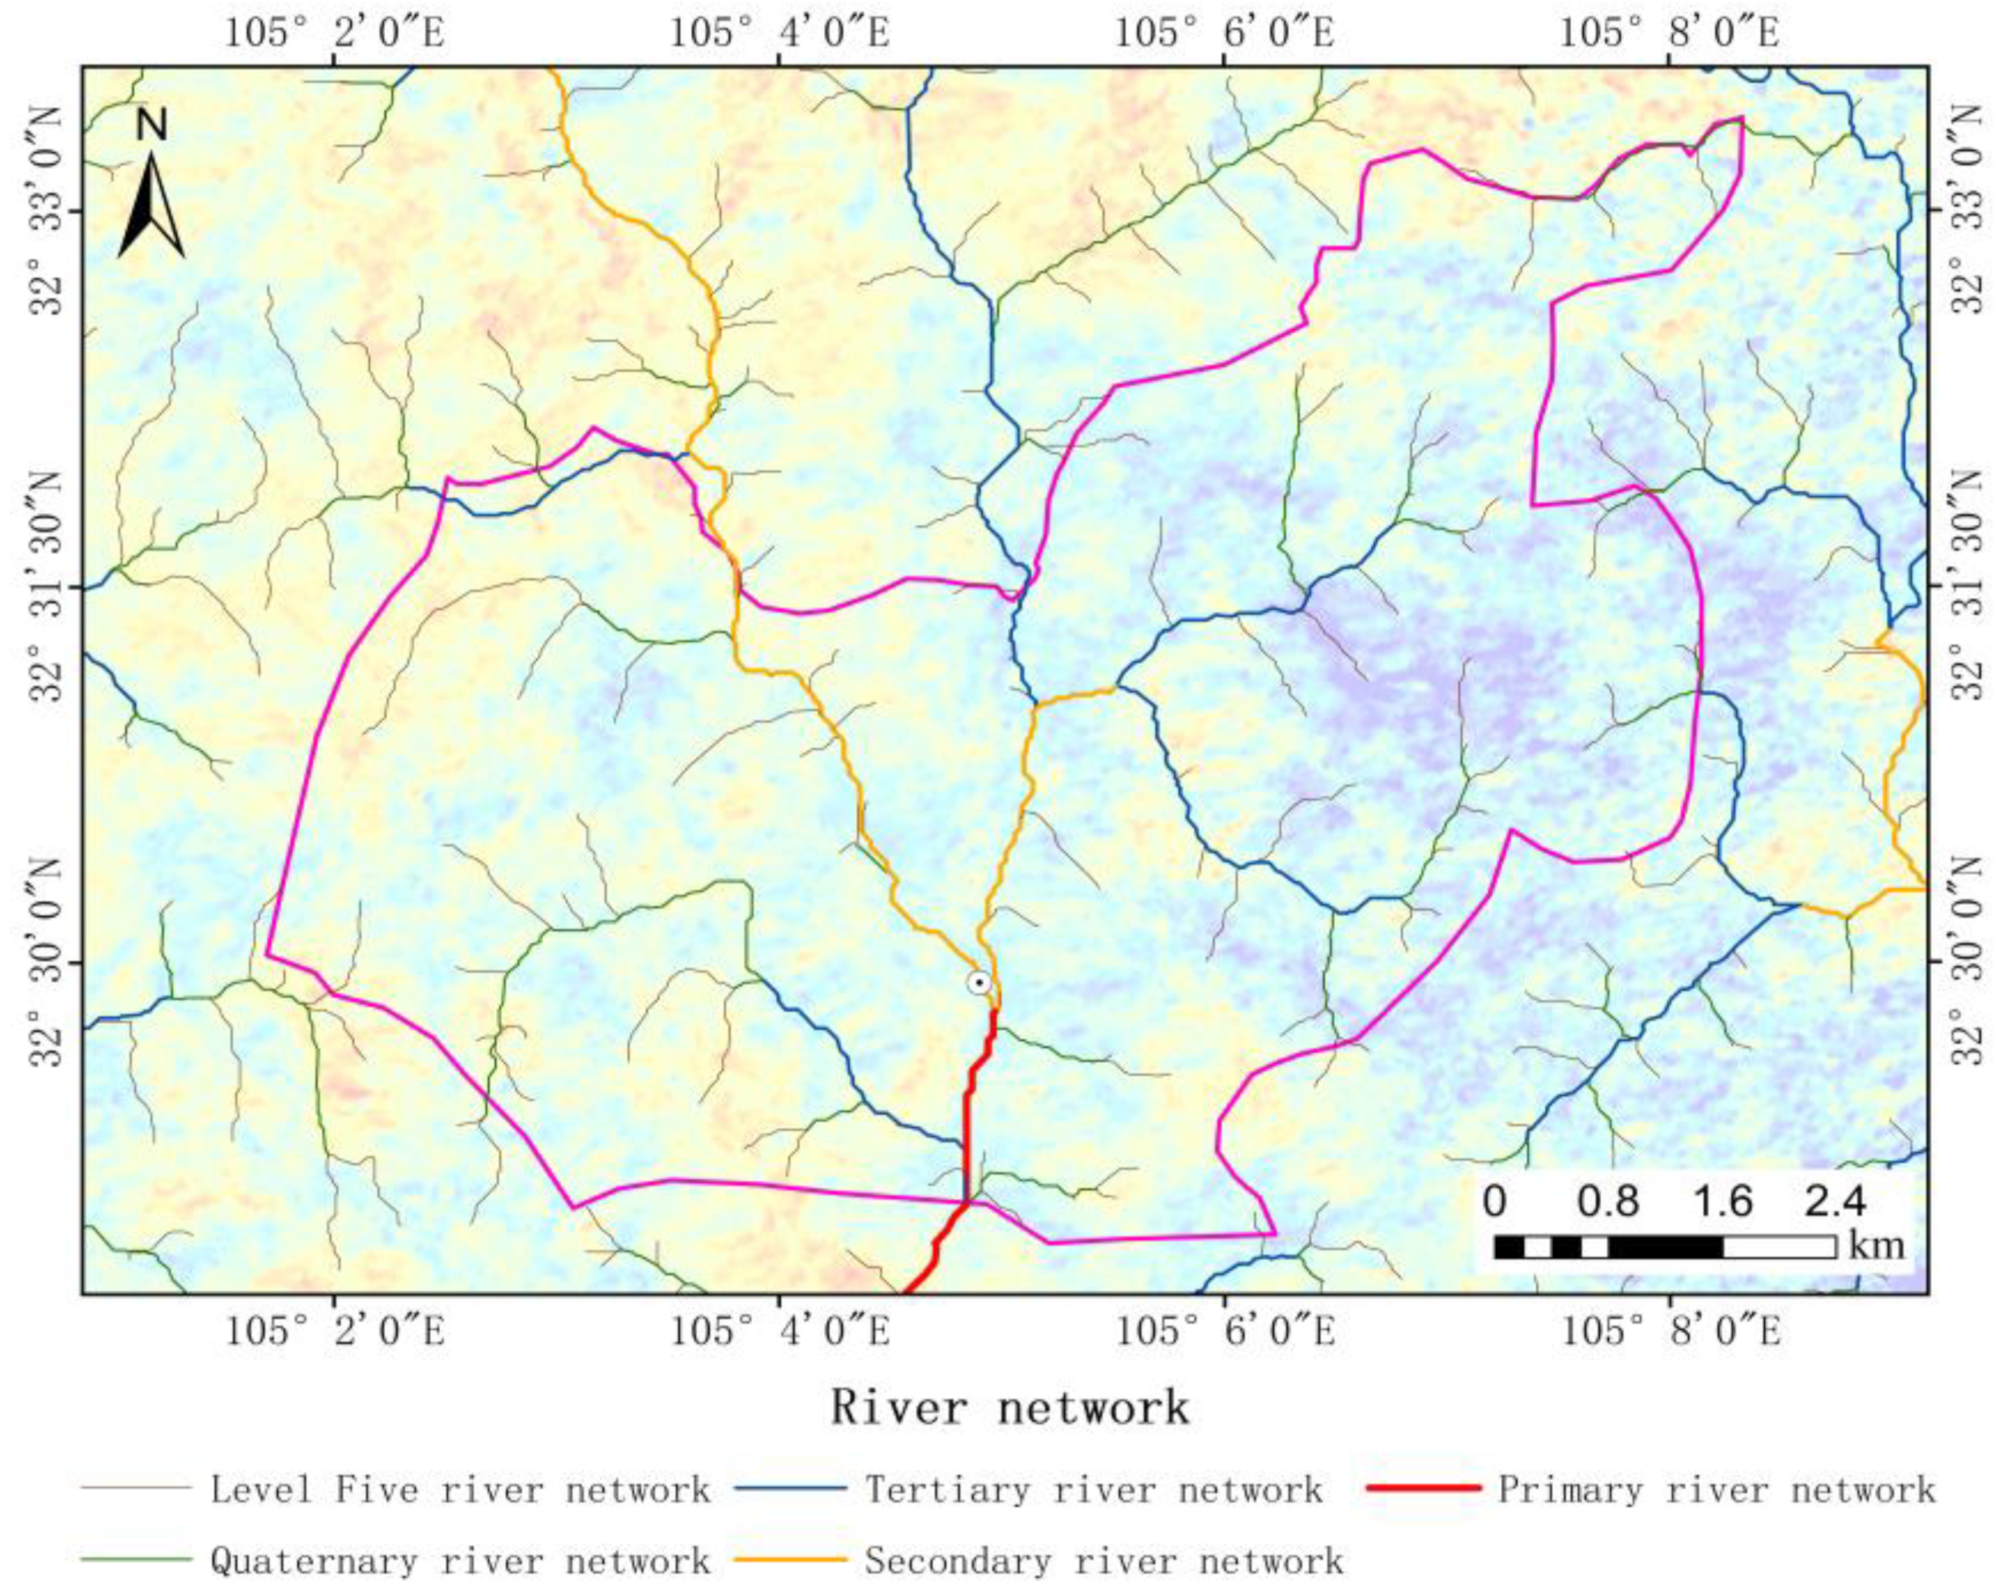
Based on the extraction of the flow-accumulation map of the study area, the river network was extracted through threshold segmentation, and then the river network was connected and classified (Figure 6).
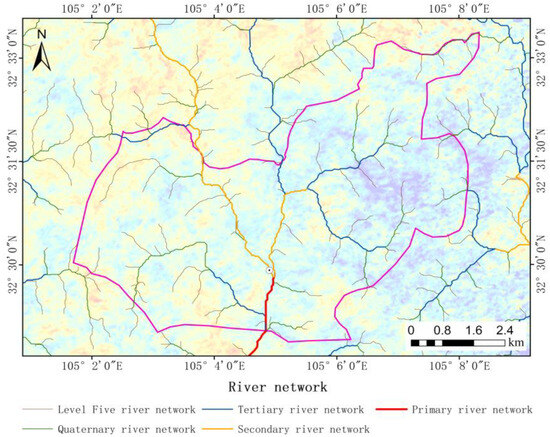
Figure 6.
Density of river network.
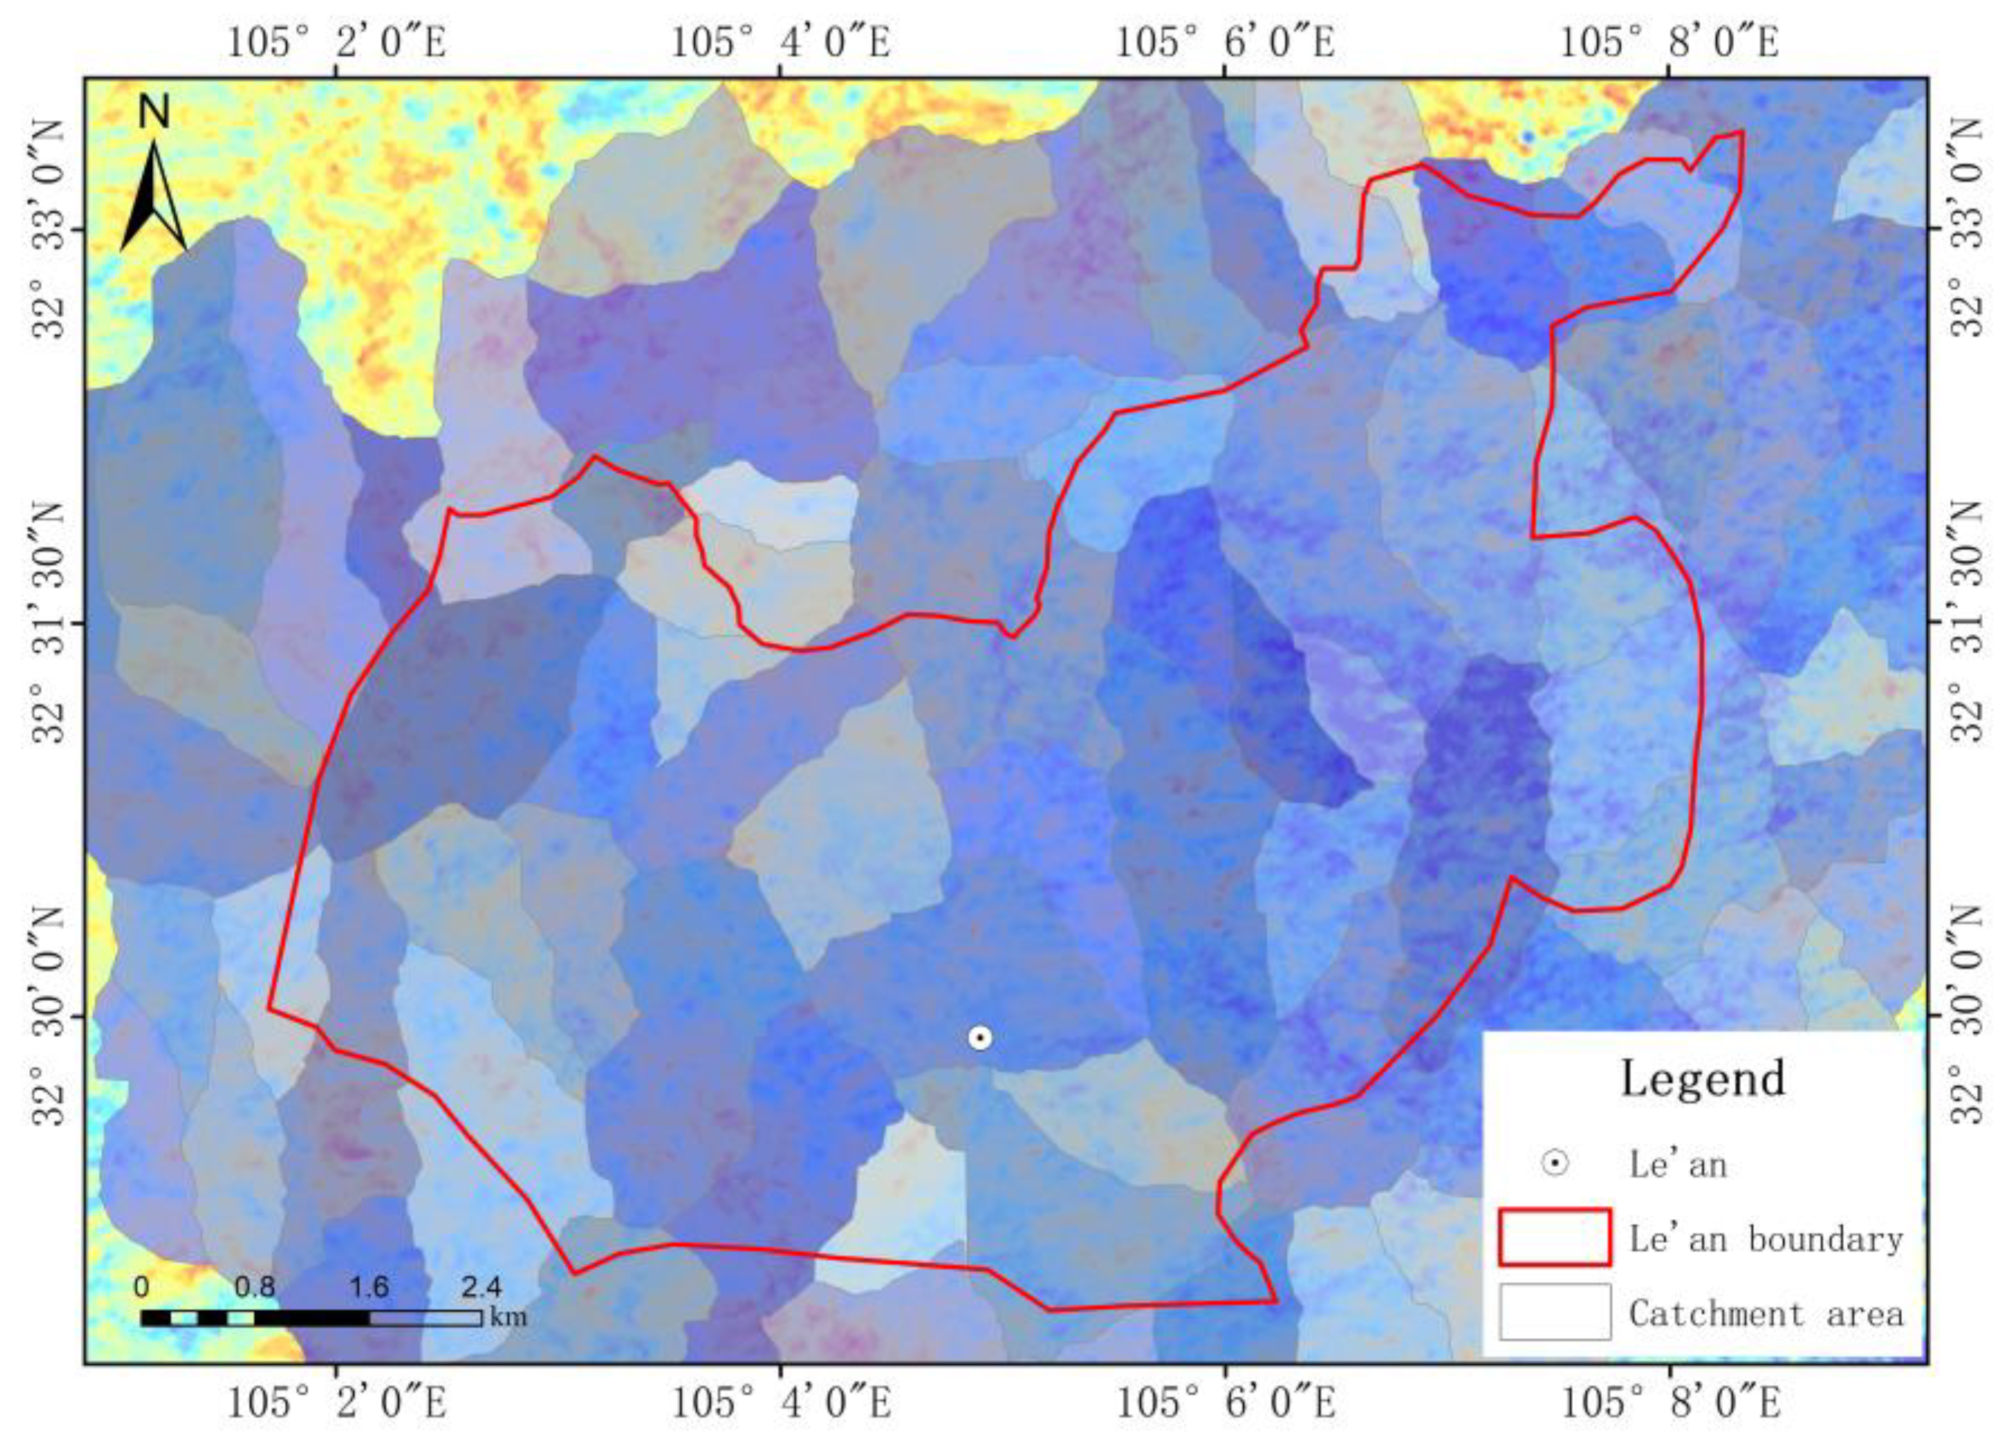
According to the classification of the river network, the watershed of the study area was identified by locating the outlet points (Figure 7).

Figure 7.
Drainage basin characteristics.
2.3. Research Method
Although the SBAS-InSAR (Small Baseline Subset–Interferometric Synthetic-Aperture Radar) technology has significant advantages in landslide monitoring, it still has many drawbacks in nonlinear feature extraction, data processing efficiency, model generalization capability, and accuracy of time-series prediction. For instance, seasonal changes can affect vegetation growth, soil moisture, etc., leading to errors in surface deformation monitoring. Additionally, terrain has a considerable impact on the reflection and propagation of SAR signals, and complex terrain in the study area can introduce significant errors. Due to the unique climatic conditions in the study area, such as heavy rainfall and high atmospheric humidity, SAR signal propagation can also be affected, potentially resulting in noise or errors. Furthermore, in SAR interferometric measurements, phase unwrapping can lead to inaccuracies in deformation monitoring, especially in cases where significant surface deformation occurs. Therefore, to ensure the accuracy of studying landslide development patterns, many scholars have integrated SBAS-InSAR technology with multi-source remote sensing technology, while also improving differential interferometry techniques and applying machine learning. This integration has yielded numerous results, laying a data foundation for subsequent research [51,52,53,54,55,56,57].
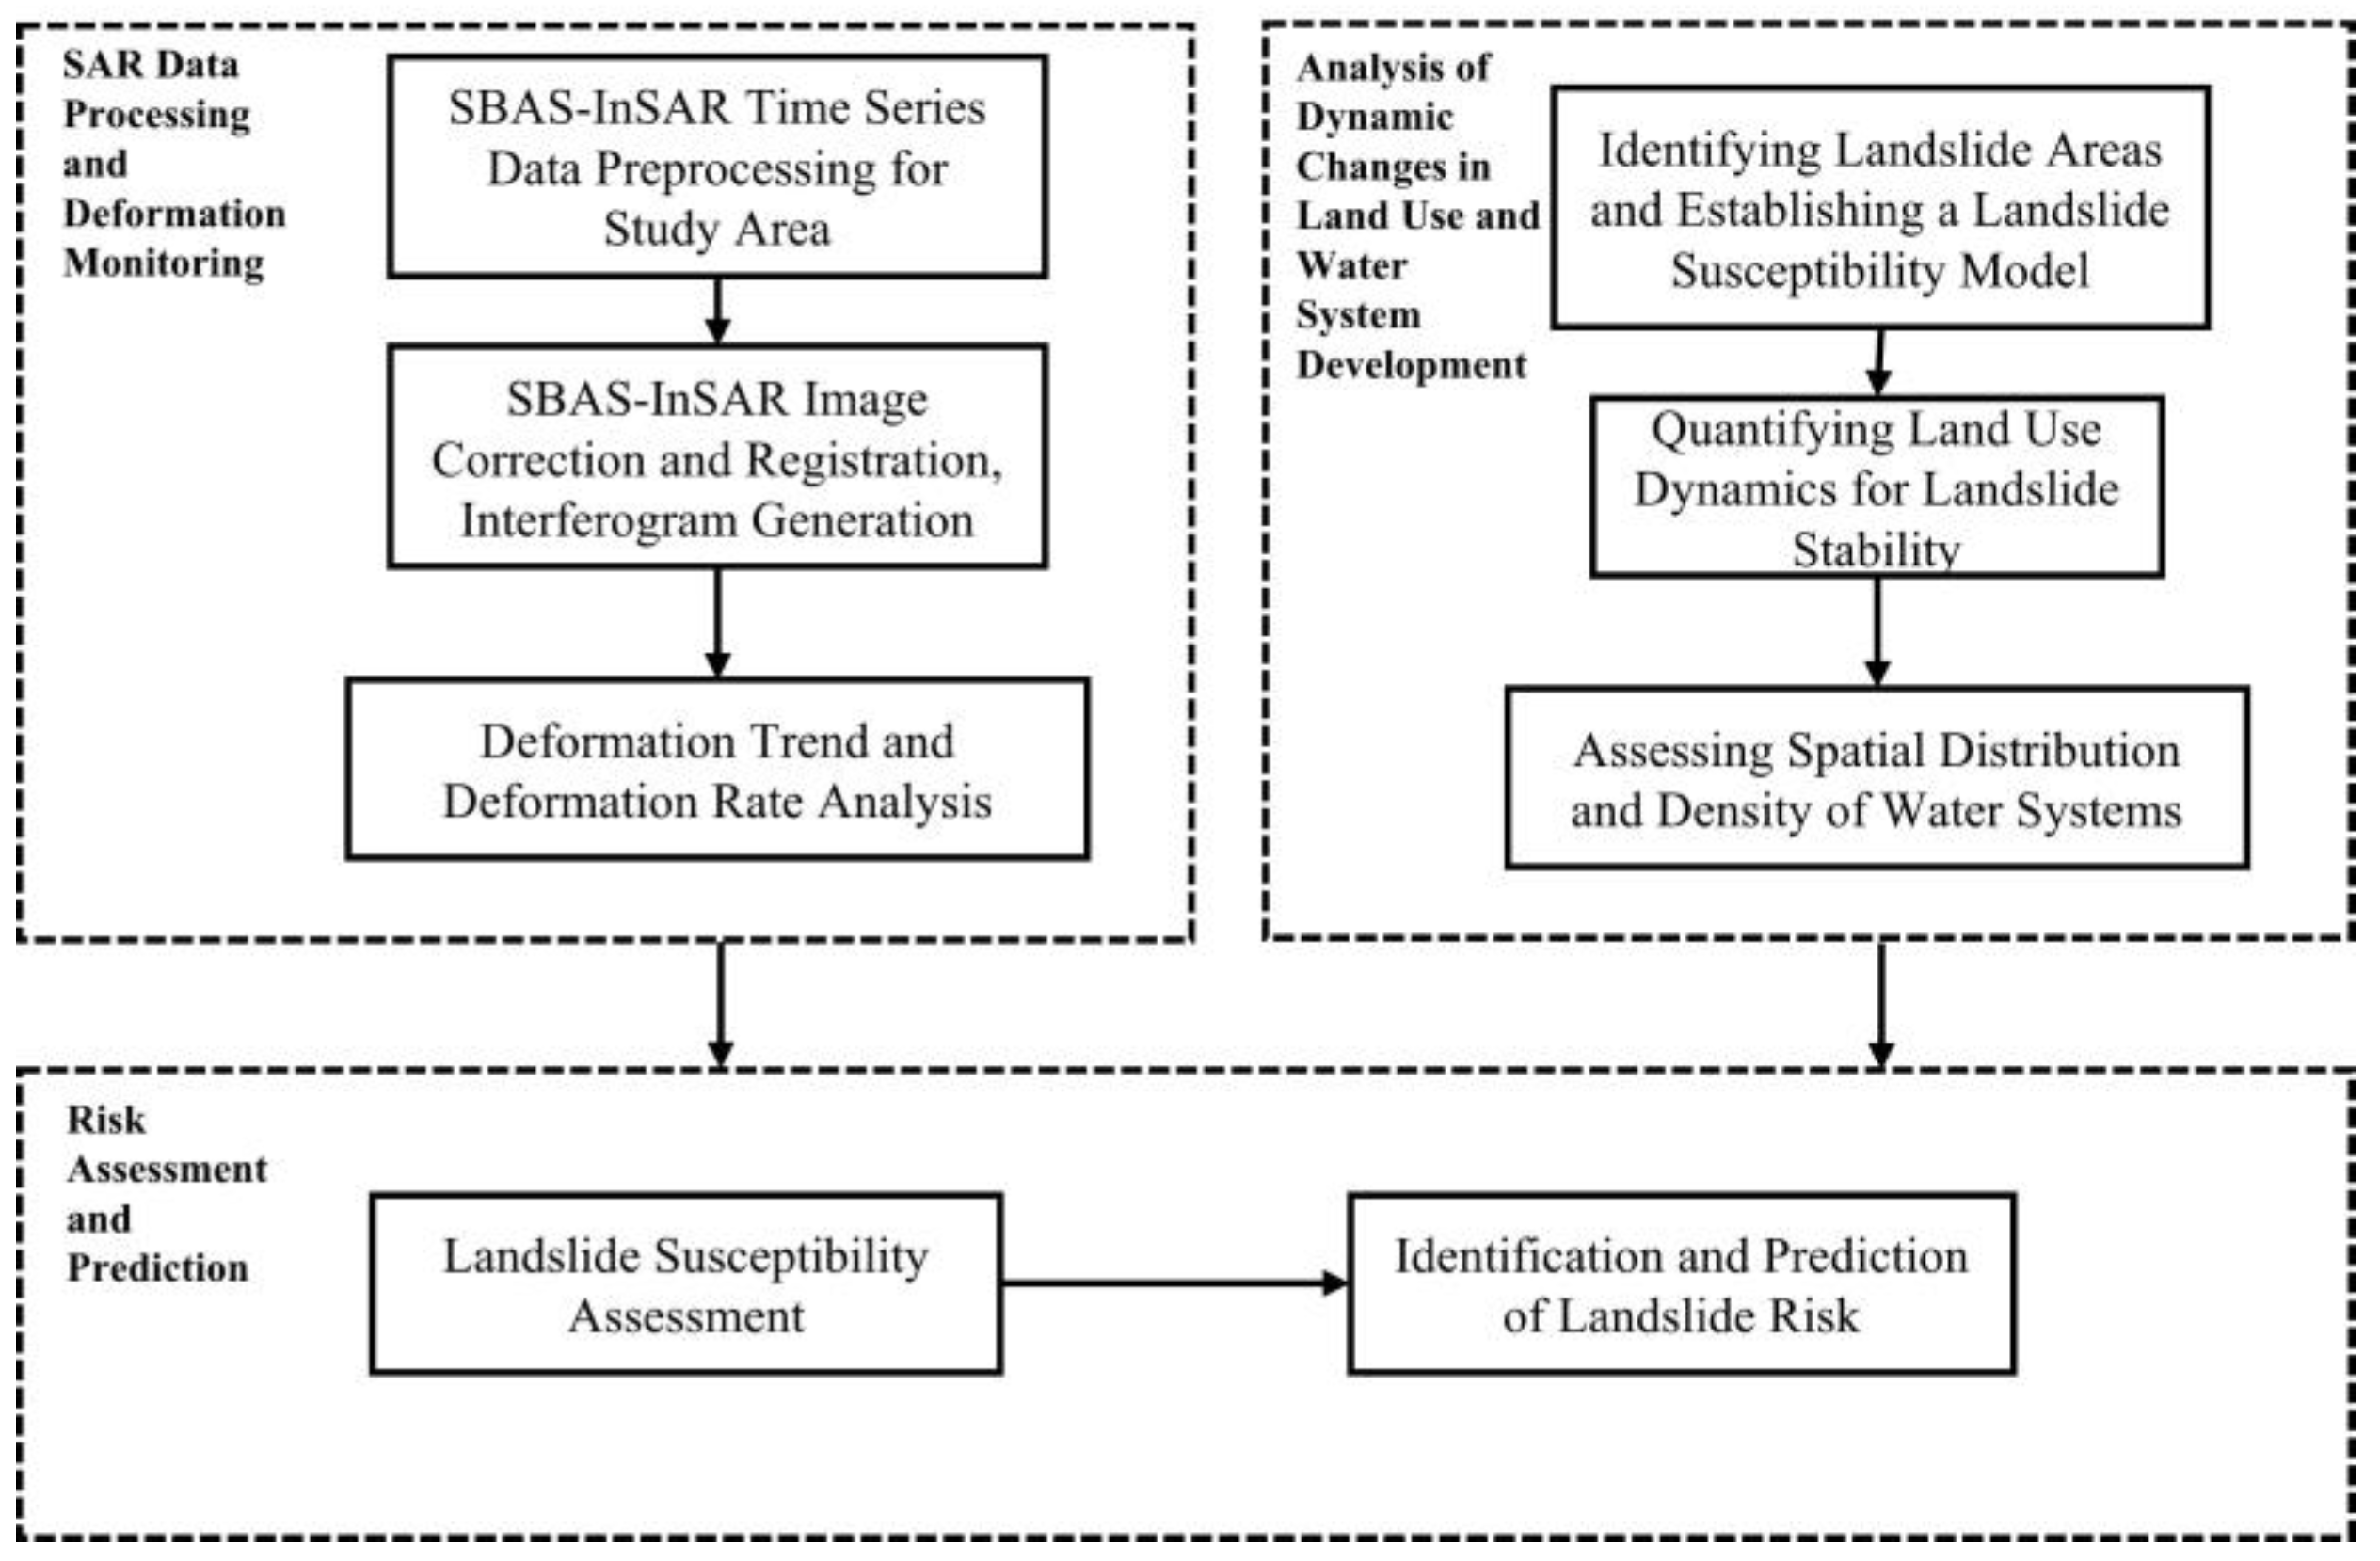
This study integrates SBAS-InSAR technology as the core, combining multi-source remote sensing techniques to integrate acquired land-use change data with hydrological data through a Geographic Information System (GIS) platform (Figure 8). This enables the overlay of deformation areas with dynamic changes in land-use and hydrological data. While SBAS-InSAR technology enhances the precision of surface deformation monitoring, errors can still occur during DEM generation, due to various factors [58,59,60,61]. Error sources include data acquisition errors, interpolation errors, terrain surface features, data source errors, point acquisition equipment errors, human errors, sampling point density and distribution, interpolation methods, and DEM data structure. This study addresses these challenges by selecting SAR image data with high resolution, accuracy, and short time intervals as data sources. Furthermore, during data processing, noise removal, phase unwrapping, and inverse-distance-weighted interpolation algorithms are employed to enhance DEM accuracy, incorporating various terrain features for comprehensive quality control (Equation (1)). The inverse-distance-weighting method assigns weights based on the distance between known points and the point to be interpolated. Points that are closer have larger weights and a greater influence on the interpolation result. This weighting method makes the interpolation results more consistent with the actual terrain, reducing errors caused by sparse or unevenly distributed data. In geological-disaster prediction, local variations in terrain data (such as elevation, slope, aspect, etc.) have a significant impact on the occurrence of geological disasters. Therefore, the DEM (Digital Elevation Model) obtained through inverse-distance-weighting interpolation can more accurately reflect the local characteristics of the terrain, thereby improving the accuracy of geological- disaster prediction.
where represents the interpolated result at the unknown point , Zi is the elevation value at known point i, di is the distance between the unknown point and the known point, and p is the power of the distance (usually a positive value), used in the interpolation formula.

Figure 8.
Technique flow chart.
During the research process, SBAS-InSAR technology is used in conjunction with multi-source remote sensing techniques to accurately extract landslide-prone areas and predict landslide development, involving several detailed steps and methods as follows:
Firstly, collect multi-temporal SAR image data covering the study area (including high-resolution optical images, DEM, etc.) to extract information such as slope, aspect, and hydrological development features. Utilize existing geological maps and other relevant data as references and verification standards. Use the SBAS algorithm to acquire N sets of SAR images and perform image registration to ensure alignment of SAR images at different time points. Process the pre-processed data and freely combine them based on spatiotemporal interferometric baseline-threshold conditions to generate M coherent interferograms with good coherence (Equation (2)).
For the ith differential interferogram generated from SAR images acquired at different times, the interference phase is denoted as Δφi (Equation (3)).
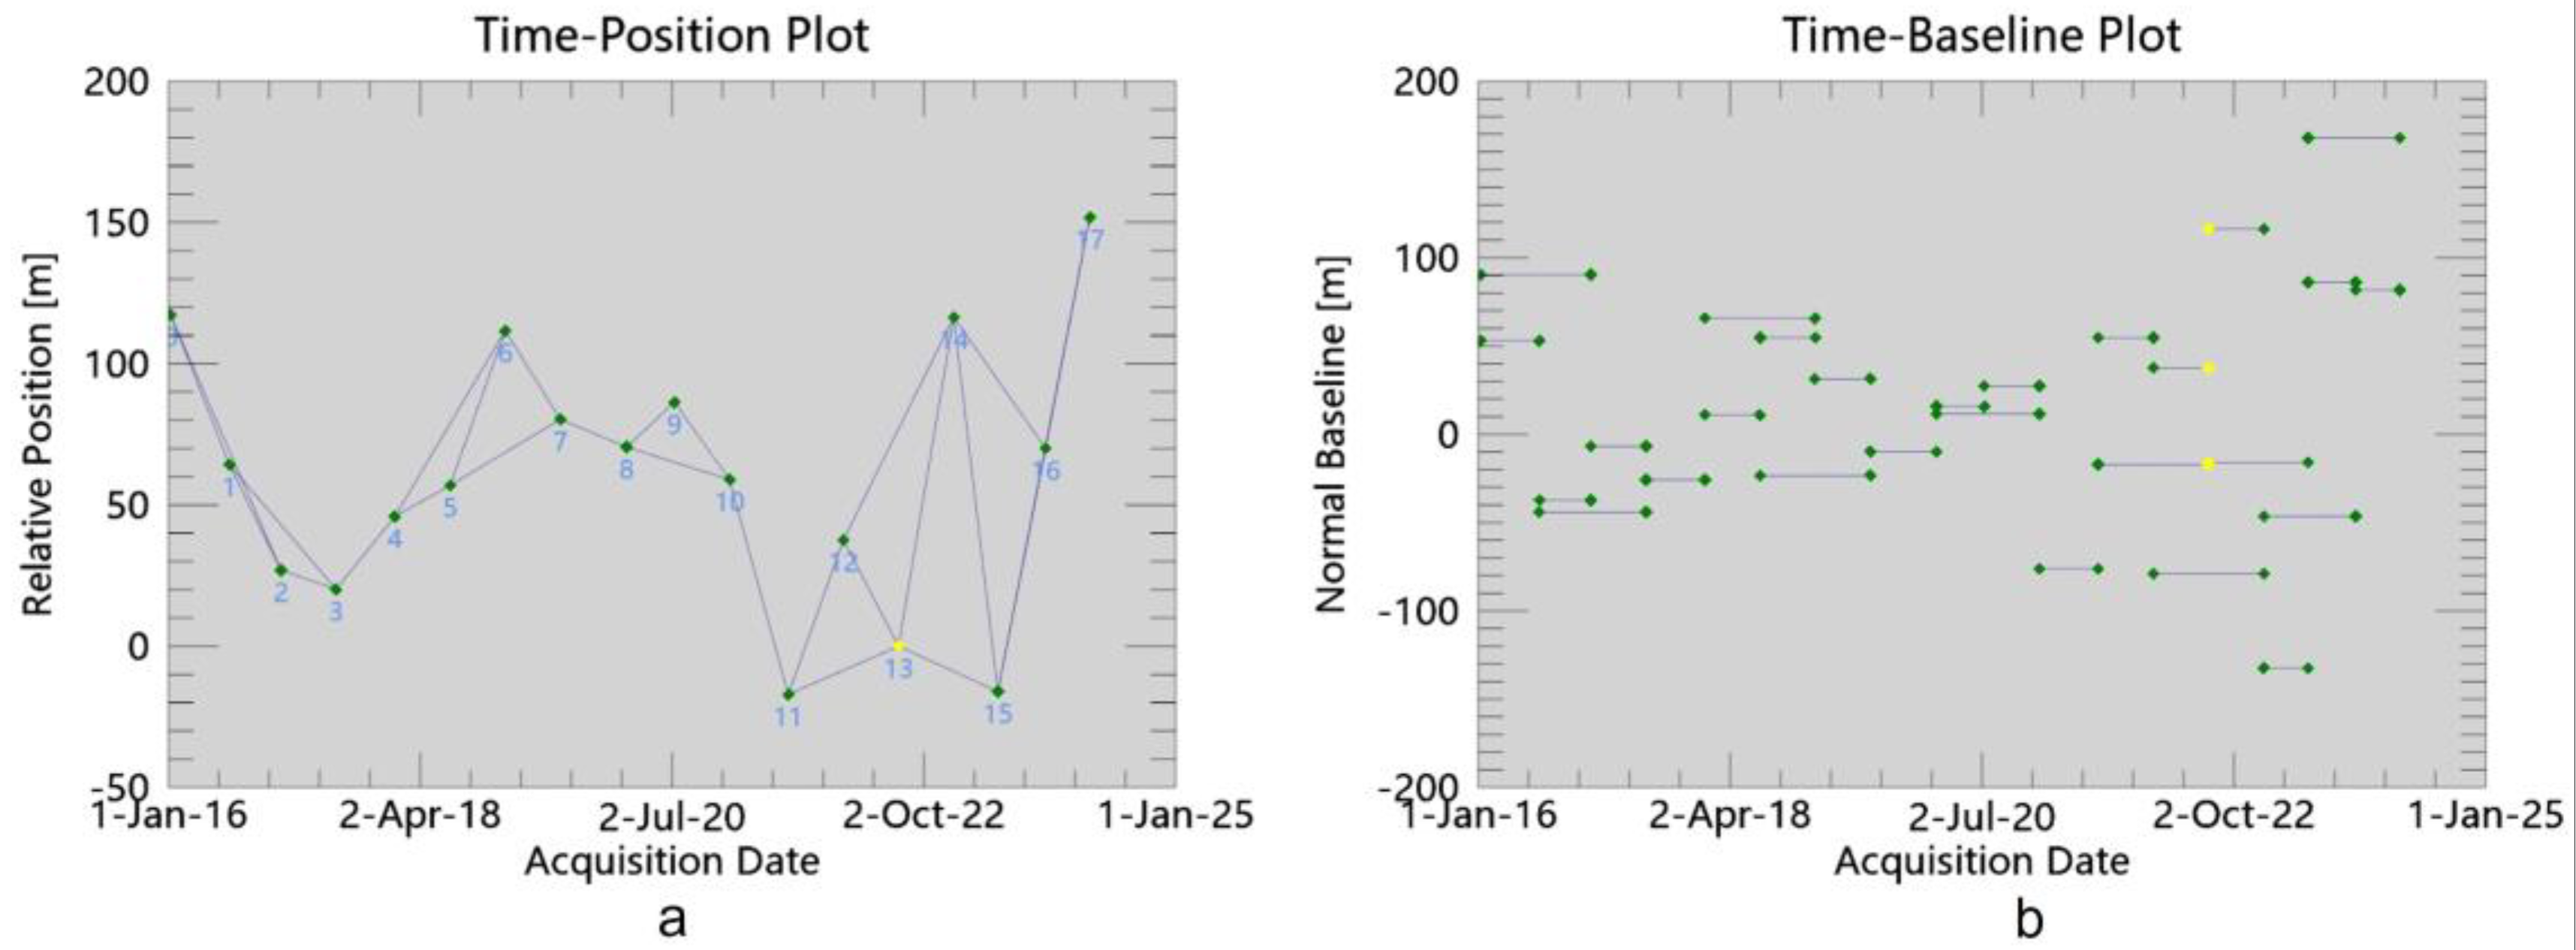
where , represent the deformation phase, topographic phase, satellite orbit error, atmospheric delay phase, and noise, respectively. To ensure the quality of interferograms in data processing, considering both temporal and spatial baselines, 11 July 2022 images were selected as the master images. The main image selected for this study is dated 11 July 2022. Concurrently generated with the coherence map (Figure 9a), a baseline map (Figure 9b) displays the temporal- and spatial-baseline lengths between image pairs. The baseline map serves as a crucial criterion for assessing the suitability of image pairs for interferometric processing, where shorter baselines contribute to obtaining high-quality interferograms.
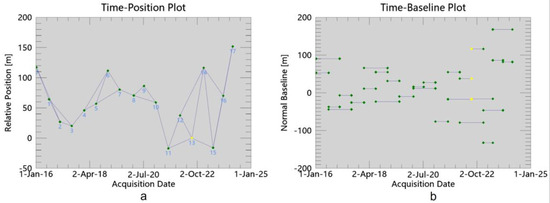
Figure 9.
SBAS-InSAR space-time baseline diagram. (a) Connection graph; (b) Baseline graph.
Next, the minimum-cost flow method (with an unwrapping coherence threshold of 0.3) is applied to process the selected image pairs for interferometry, generating a series of interferograms.
This study performs interferometric processing on the selected images. During the registration process, DEM data are used as geographical references to enhance registration accuracy. The registered image pairs undergo differential interferometry processing to generate interferogram maps (Figure 10).
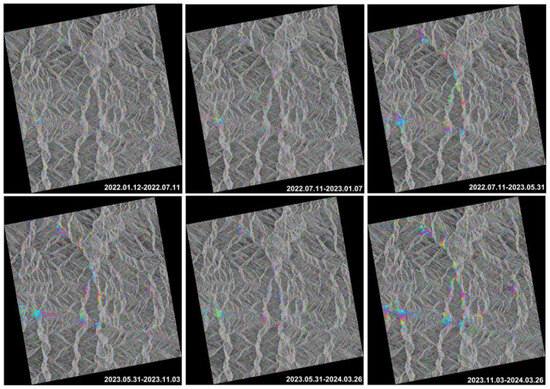
Figure 10.
The pattern of interference fringes after flattening.
During the orbit-refinement and -rephasing process, the polynomial refinement method is used to estimate and remove residual constant-phase and phase ramps remaining after unwrapping, aiming to improve the quality of interferograms. Orbit refinement and rephasing further reduce phase errors, allowing interferograms to accurately reflect surface deformation information. Phase unwrapping (Figure 11) and filtering are conducted to ensure each step of the differential interferometry process undergoes meticulous adjustments and optimizations, resulting in high-quality interferogram maps. Through analysis of these interferogram maps, surface deformation information is extracted and interpreted, validating the deformation results.
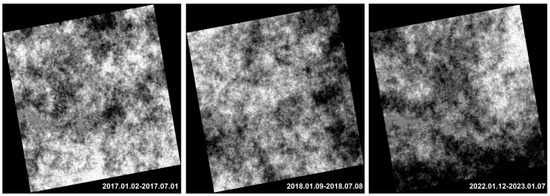
Figure 11.
Phase unwinding diagram.
Furthermore, in the first inversion step, the minimum-cost flow method (with an unwrapping coherence threshold of 0.2) is applied. This method uses differential interferogram and phase-unwrapping maps as input data, combined with high-resolution DEM information, to estimate deformation rates and residual topography. In the second inversion step, the polynomial refinement method is utilized for atmospheric filtering. This step aims to estimate and remove atmospheric phase contributions, resulting in more accurate displacement results over time.
After completing the above steps, dynamic changes in land-use (slope and aspect) and watershed characteristics are integrated as influencing factors into the SBAS deformation analysis model. Based on DEM data and multi-temporal optical images, information such as slope, aspect, and watershed network in the study area is extracted. The dynamic changes in slope and aspect are analyzed, along with the characteristics of watershed morphology, density, and flow direction. Their impact on landslide development is evaluated, to identify potential landslide-prone areas.
Finally, SBAS-InSAR is used to extract surface deformation information and delineate landslide-prone areas. Simultaneously, land-use changes (slope and aspect), extracted from multi-source remote sensing data, and watershed characteristics, are used to identify landslide-prone areas. The spatial overlap between landslide areas identified by both methods is validated to ensure accuracy.
3. Results
Remote sensing imagery provides surface information covering the study area. Through preprocessing and classification techniques, the acquired information is converted into pixel units of different land-use types, identifying changes at different detection points in 2016 and 2024. Based on this, the pixels in the changed areas are reclassified by replacing the original land-use-type values with new land-use-type values for each changed pixel. This ultimately results in a real-time land-use-type change map. In 2016, human activity areas were relatively small, so vegetation coverage was relatively stable (Figure 12).
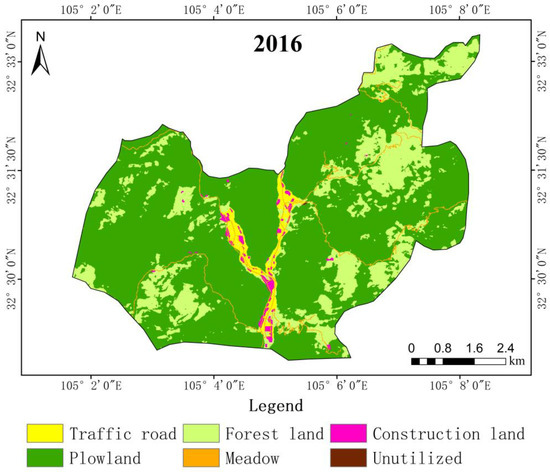
Figure 12.
Land-use pattern in the study area in 2016.
However, from 2016 to 2024, the area of human engineering construction significantly increased. These construction activities have also provided conditions for the development of landslides (Figure 13).
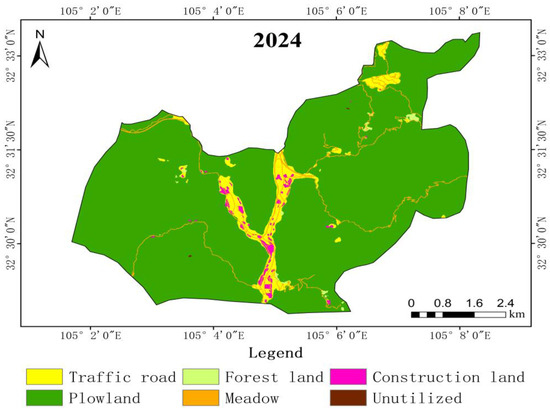
Figure 13.
Land-use pattern in the study area in 2024.
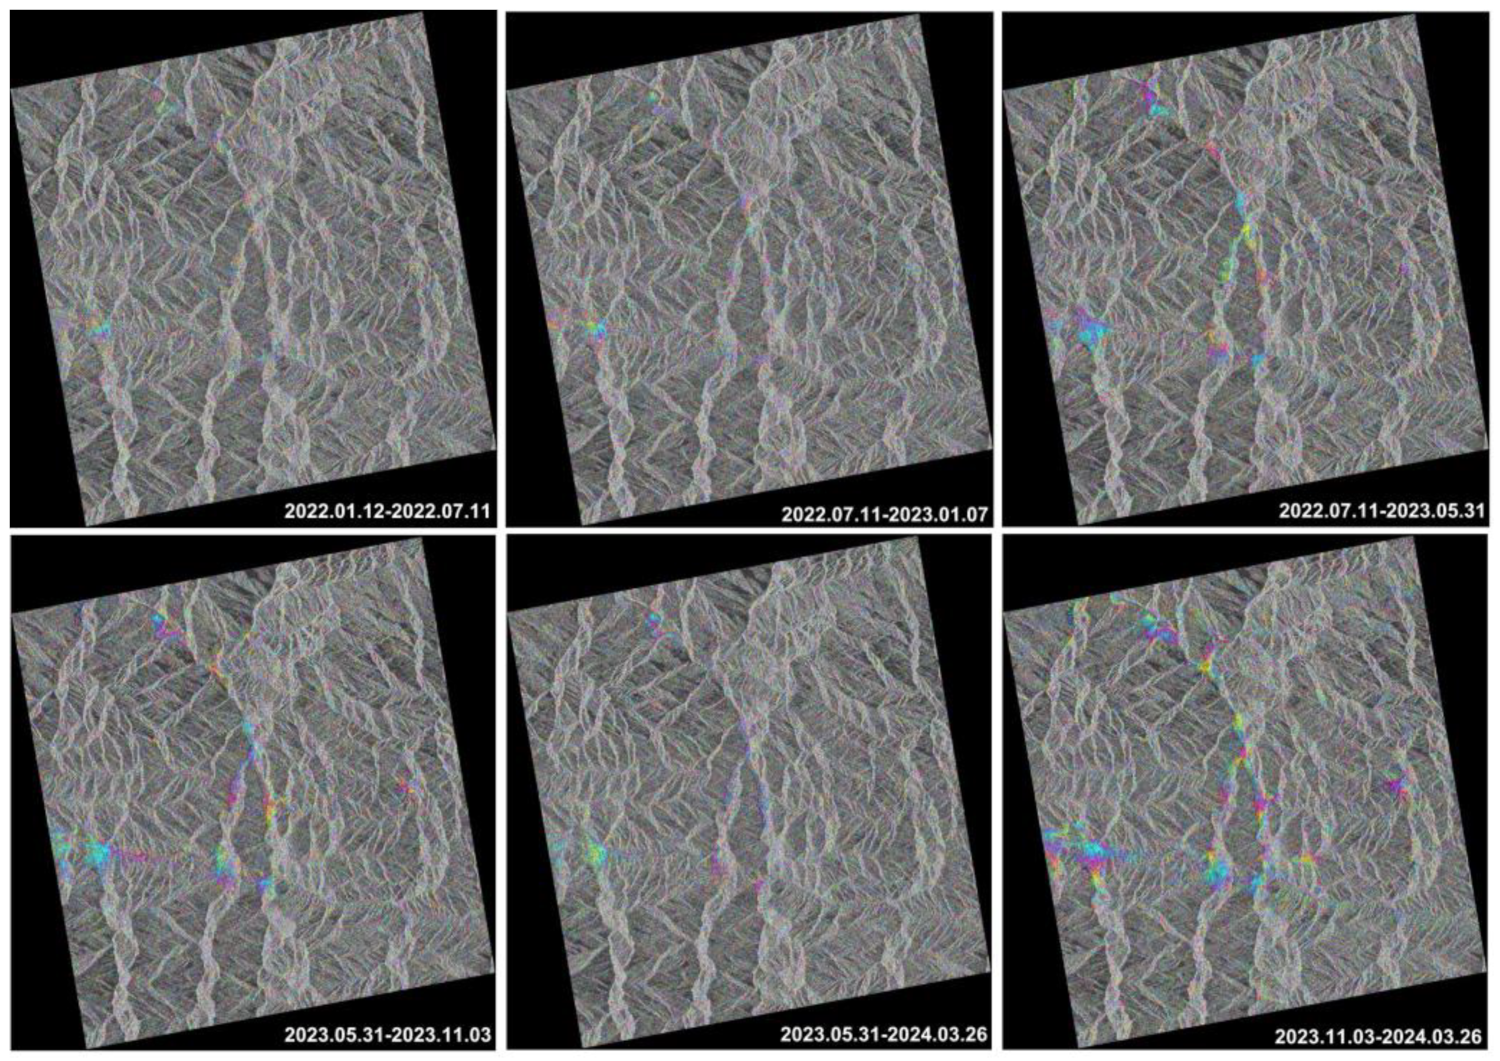
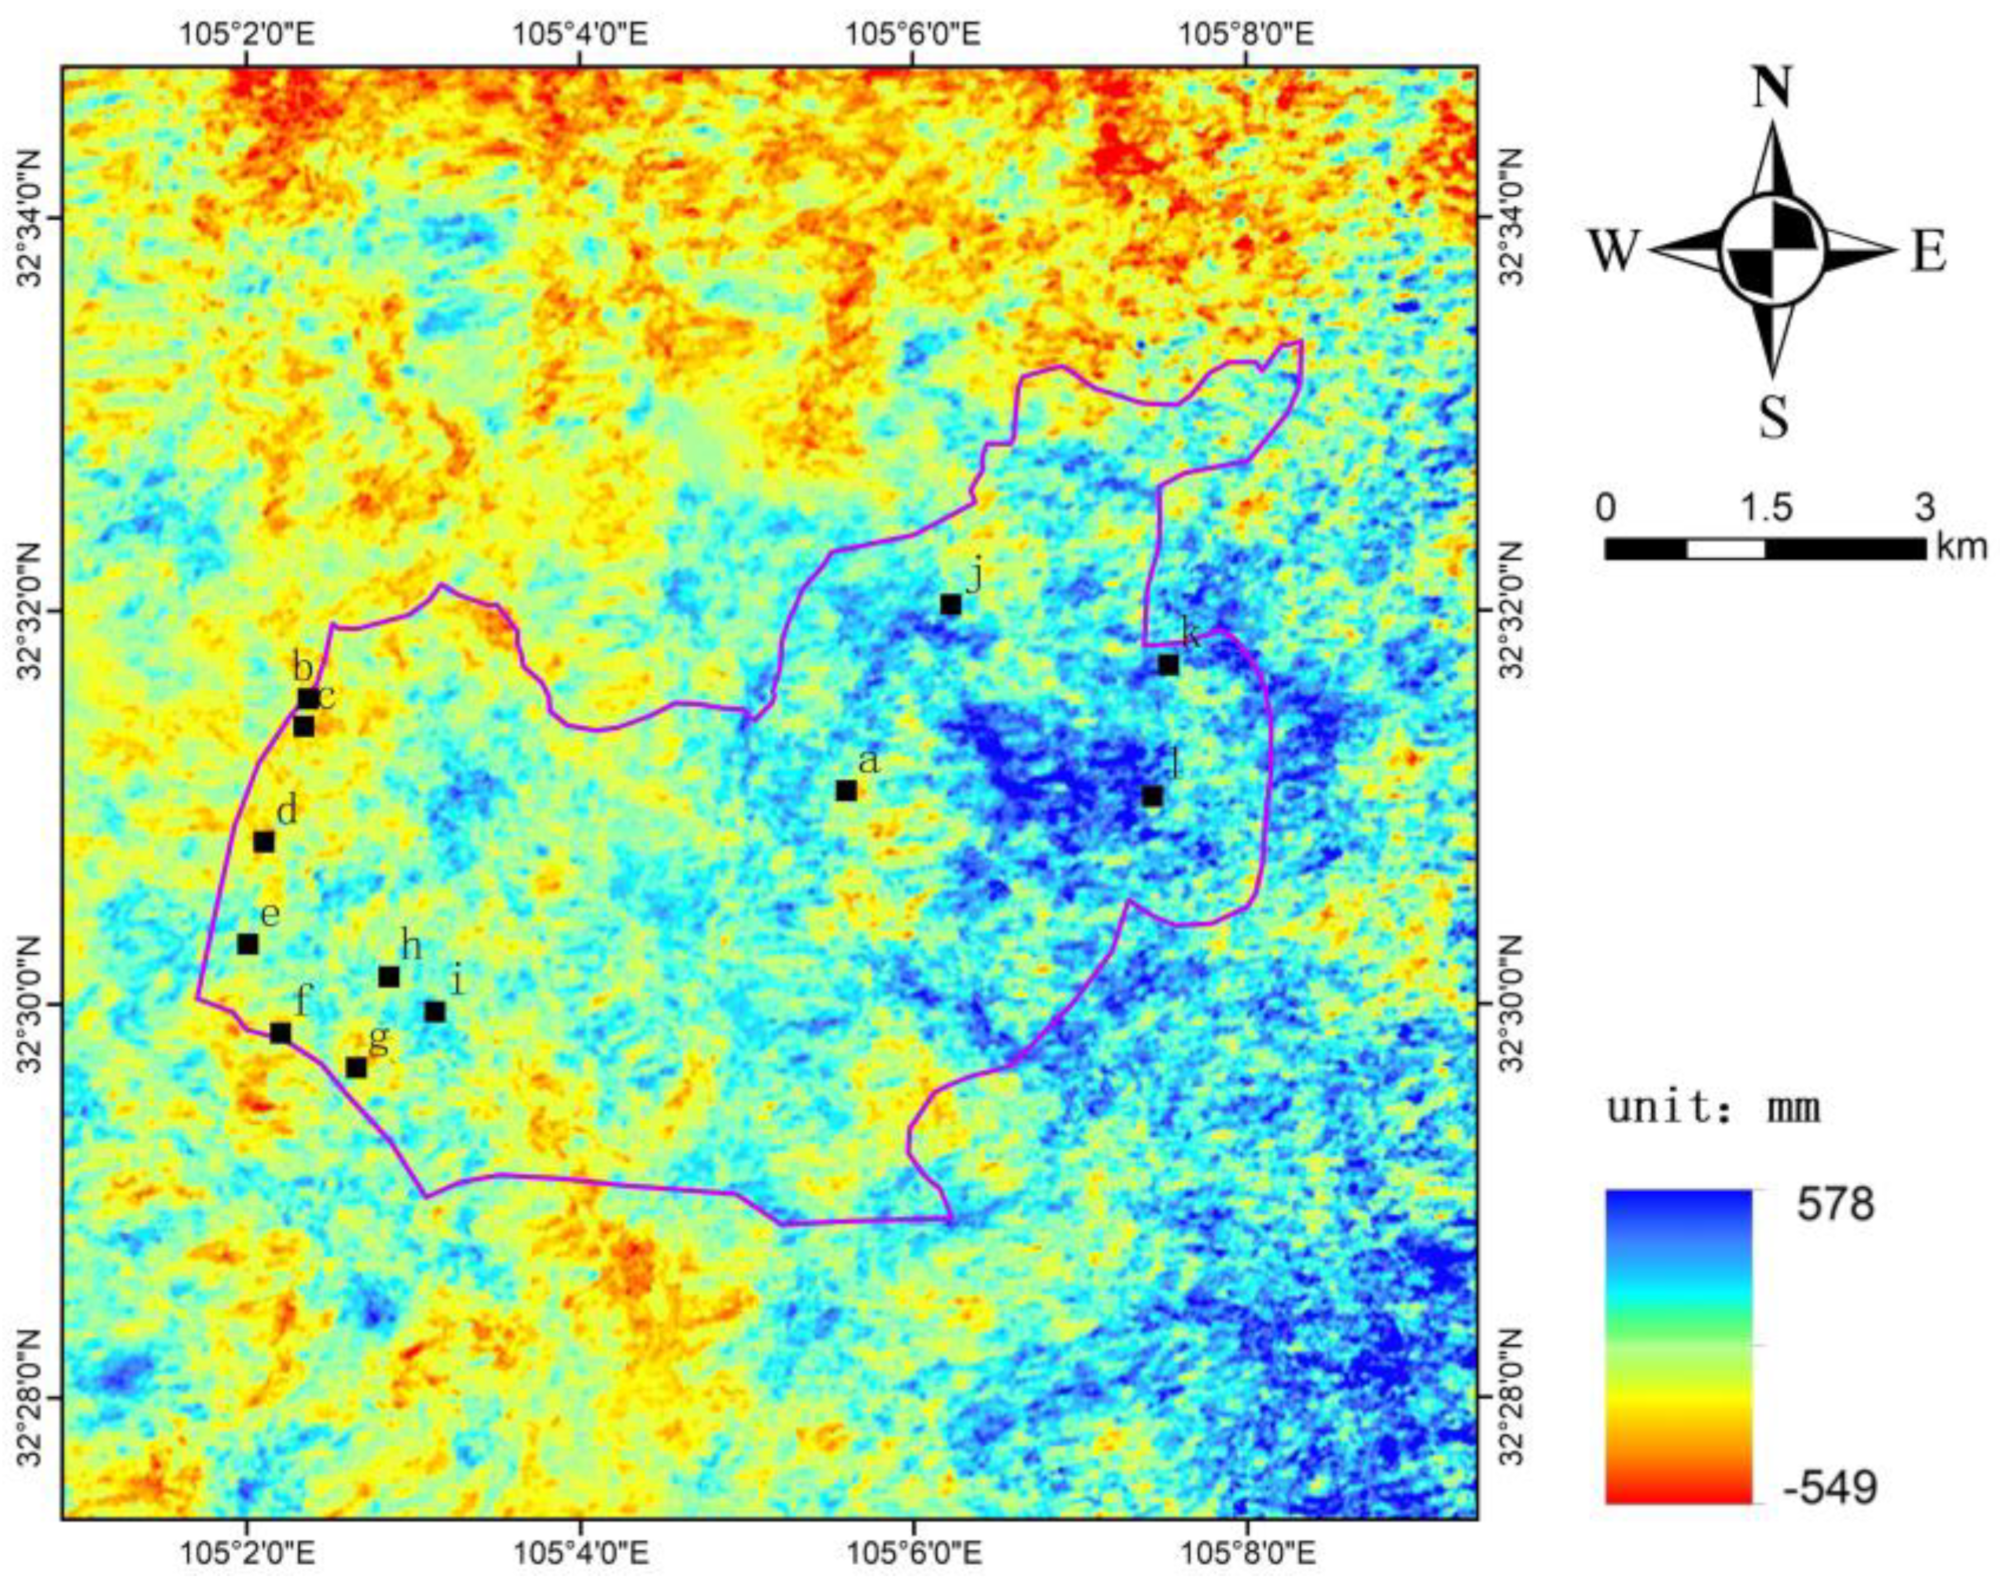
Through processing multi-temporal SAR (Synthetic-Aperture Radar) imagery and utilizing the principles of interferometry, surface deformation information was extracted. By selecting image pairs with small spatial and temporal baselines for interferometric processing, the impact of atmospheric delay and terrain errors was effectively reduced, thereby improving the accuracy of deformation monitoring. After steps including phase unwrapping, filtering, and deformation modeling, 12 landslide deformation areas (a-l) within the study area were successfully identified (Figure 14). Each area exhibits different deformation trends and rates, reflecting the complexity of internal stress states, geological structures, hydrological conditions, and external triggering factors (such as rainfall, earthquakes, etc.) within the landslide body. Some areas show significant surface subsidence, while others exhibit surface uplift. This coexistence of subsidence and uplift further demonstrates the diversity and dynamic nature of landslide activities.
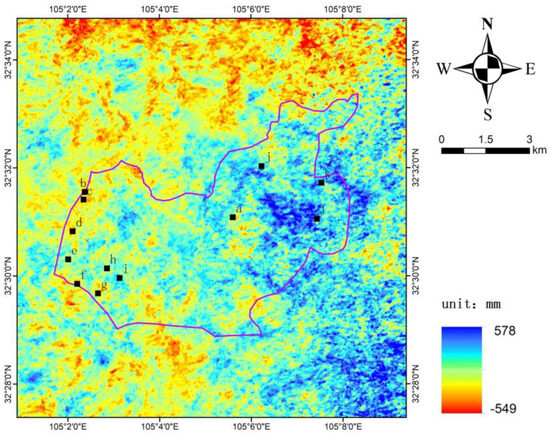
Figure 14.
The temporal deformation of typical points in different parts of the landslide (a–l represent 12 deformation target areas).
The SBAS remote-sensing identification results were compared with the results of land-use dynamics and river-system development characteristics identified through multi-source remote sensing technology. Through this comparison, the aforementioned 12 deformation characteristic areas were identified based on the land-use dynamics and river-system development characteristics obtained from multi-source remote sensing technology (Figure 15). After a period of sliding and deformation, landslide bodies may gradually stabilize due to factors such as energy dissipation and increased resistance. Additionally, the relative stability of geological structures, lithology, and groundwater may also contribute to the stability of the landslide body. This stability is reflected in the surface cracks of the landslide body no longer developing or developing slowly, the vegetation on the landslide body gradually recovering, and trees growing normally without significant tilting or collapse. Therefore, the surface of the deformation-characteristic areas a, b, c, e, f, g, and h tends to slowly uplift, but remains relatively stable. However, deformation-characteristic area d shows significant surface uplift and has a continuous uplifting trend. Deformation-characteristic areas j and k exhibit a slow subsidence trend, but remain relatively stable. In contrast, deformation-characteristic areas i and l show significant surface subsidence with a trend of continuous development.
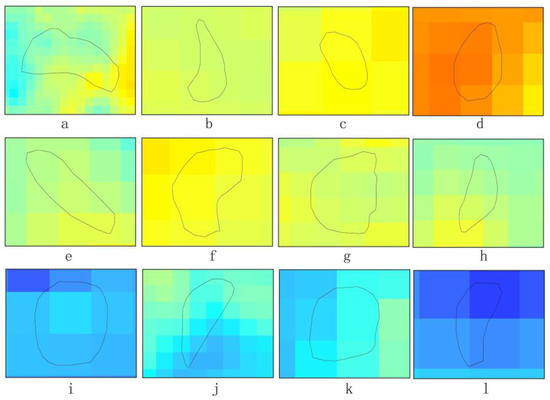
Figure 15.
The analysis of deformation target areas (a–l represent 12 deformation target areas).
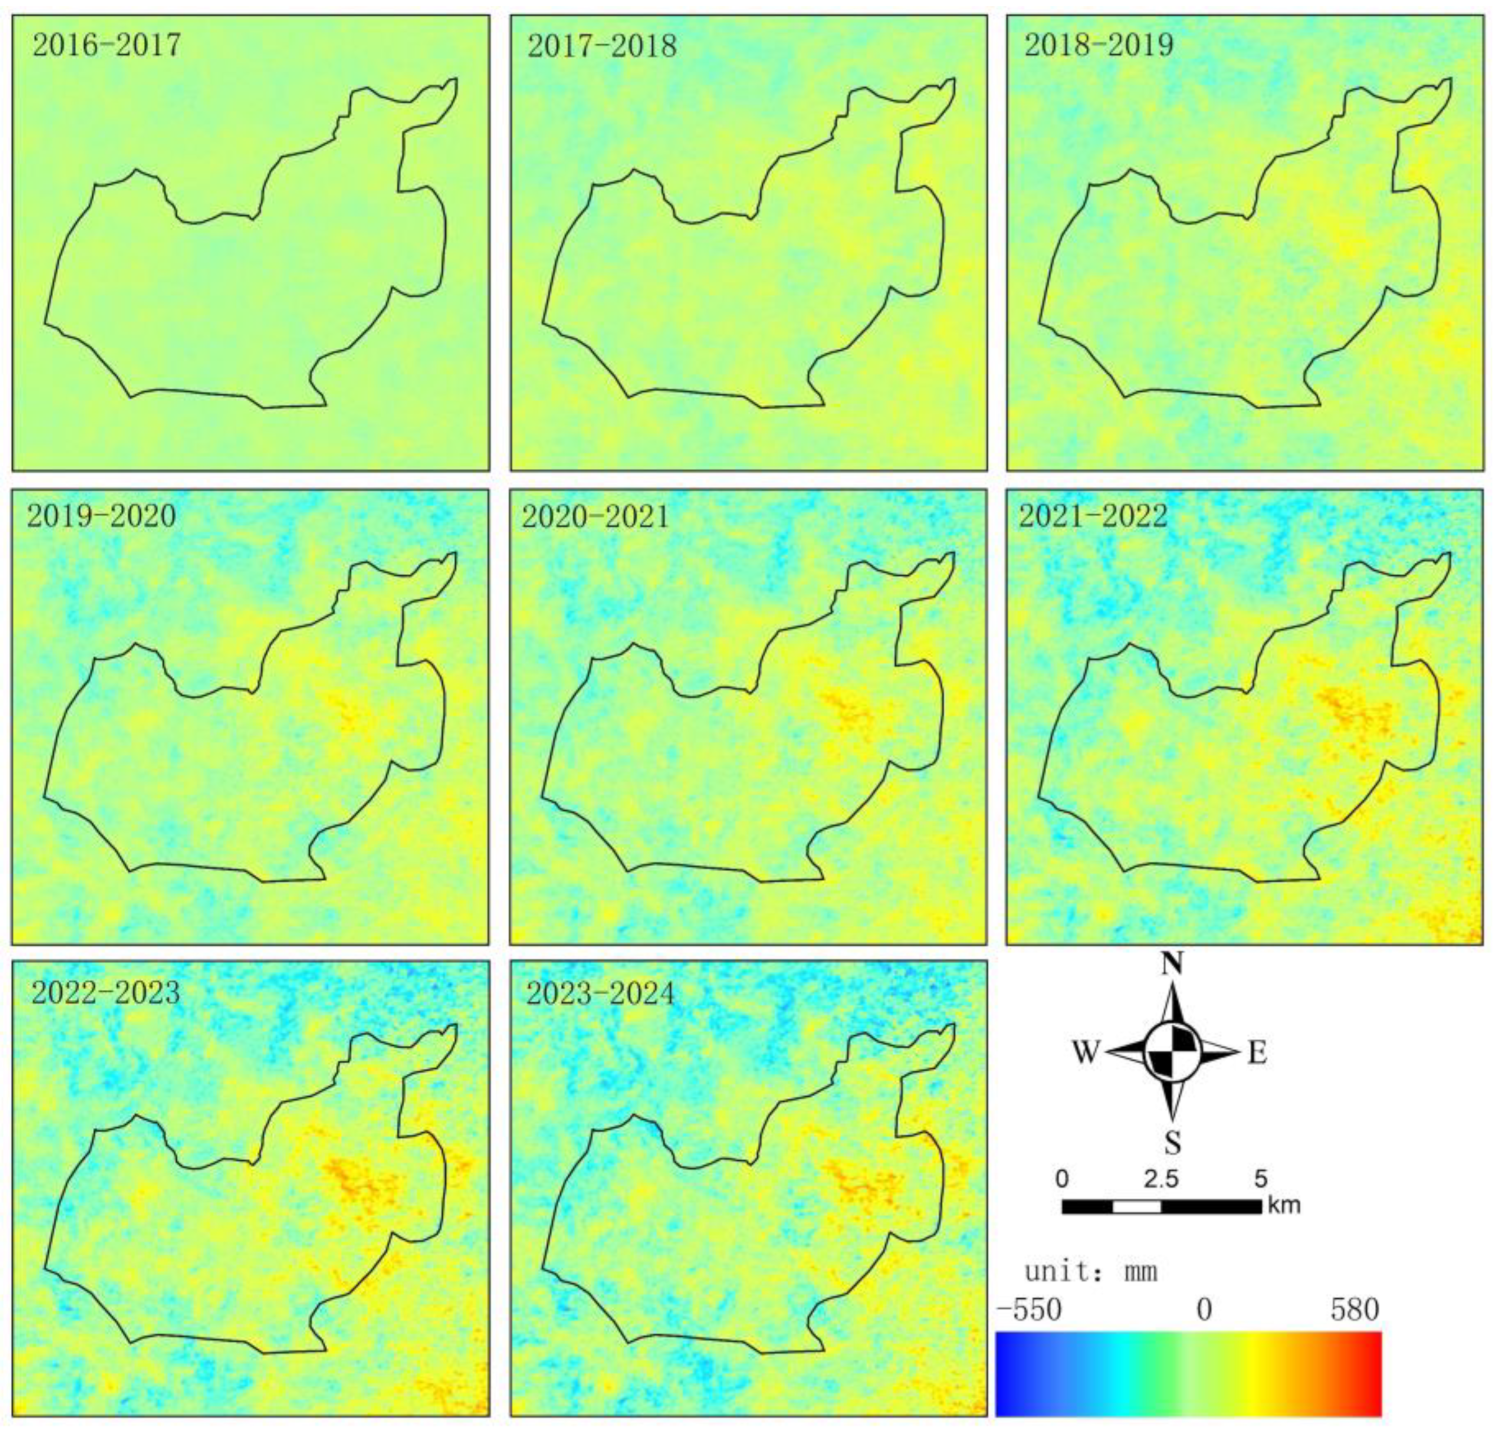
Areas with steeper slopes are usually where slope subsidence rates are most significant. These steep slopes, under the influence of geological activities or natural factors, are more prone to significant subsidence phenomena. Specifically, the central and southwestern regions have landslide subsidence amounts exceeding −100 mm, directly indicating that ground subsidence along specific slopes in these areas is exceptionally rapid (Figure 16).

Figure 16.
Temporal deformation of landslides in the study area.
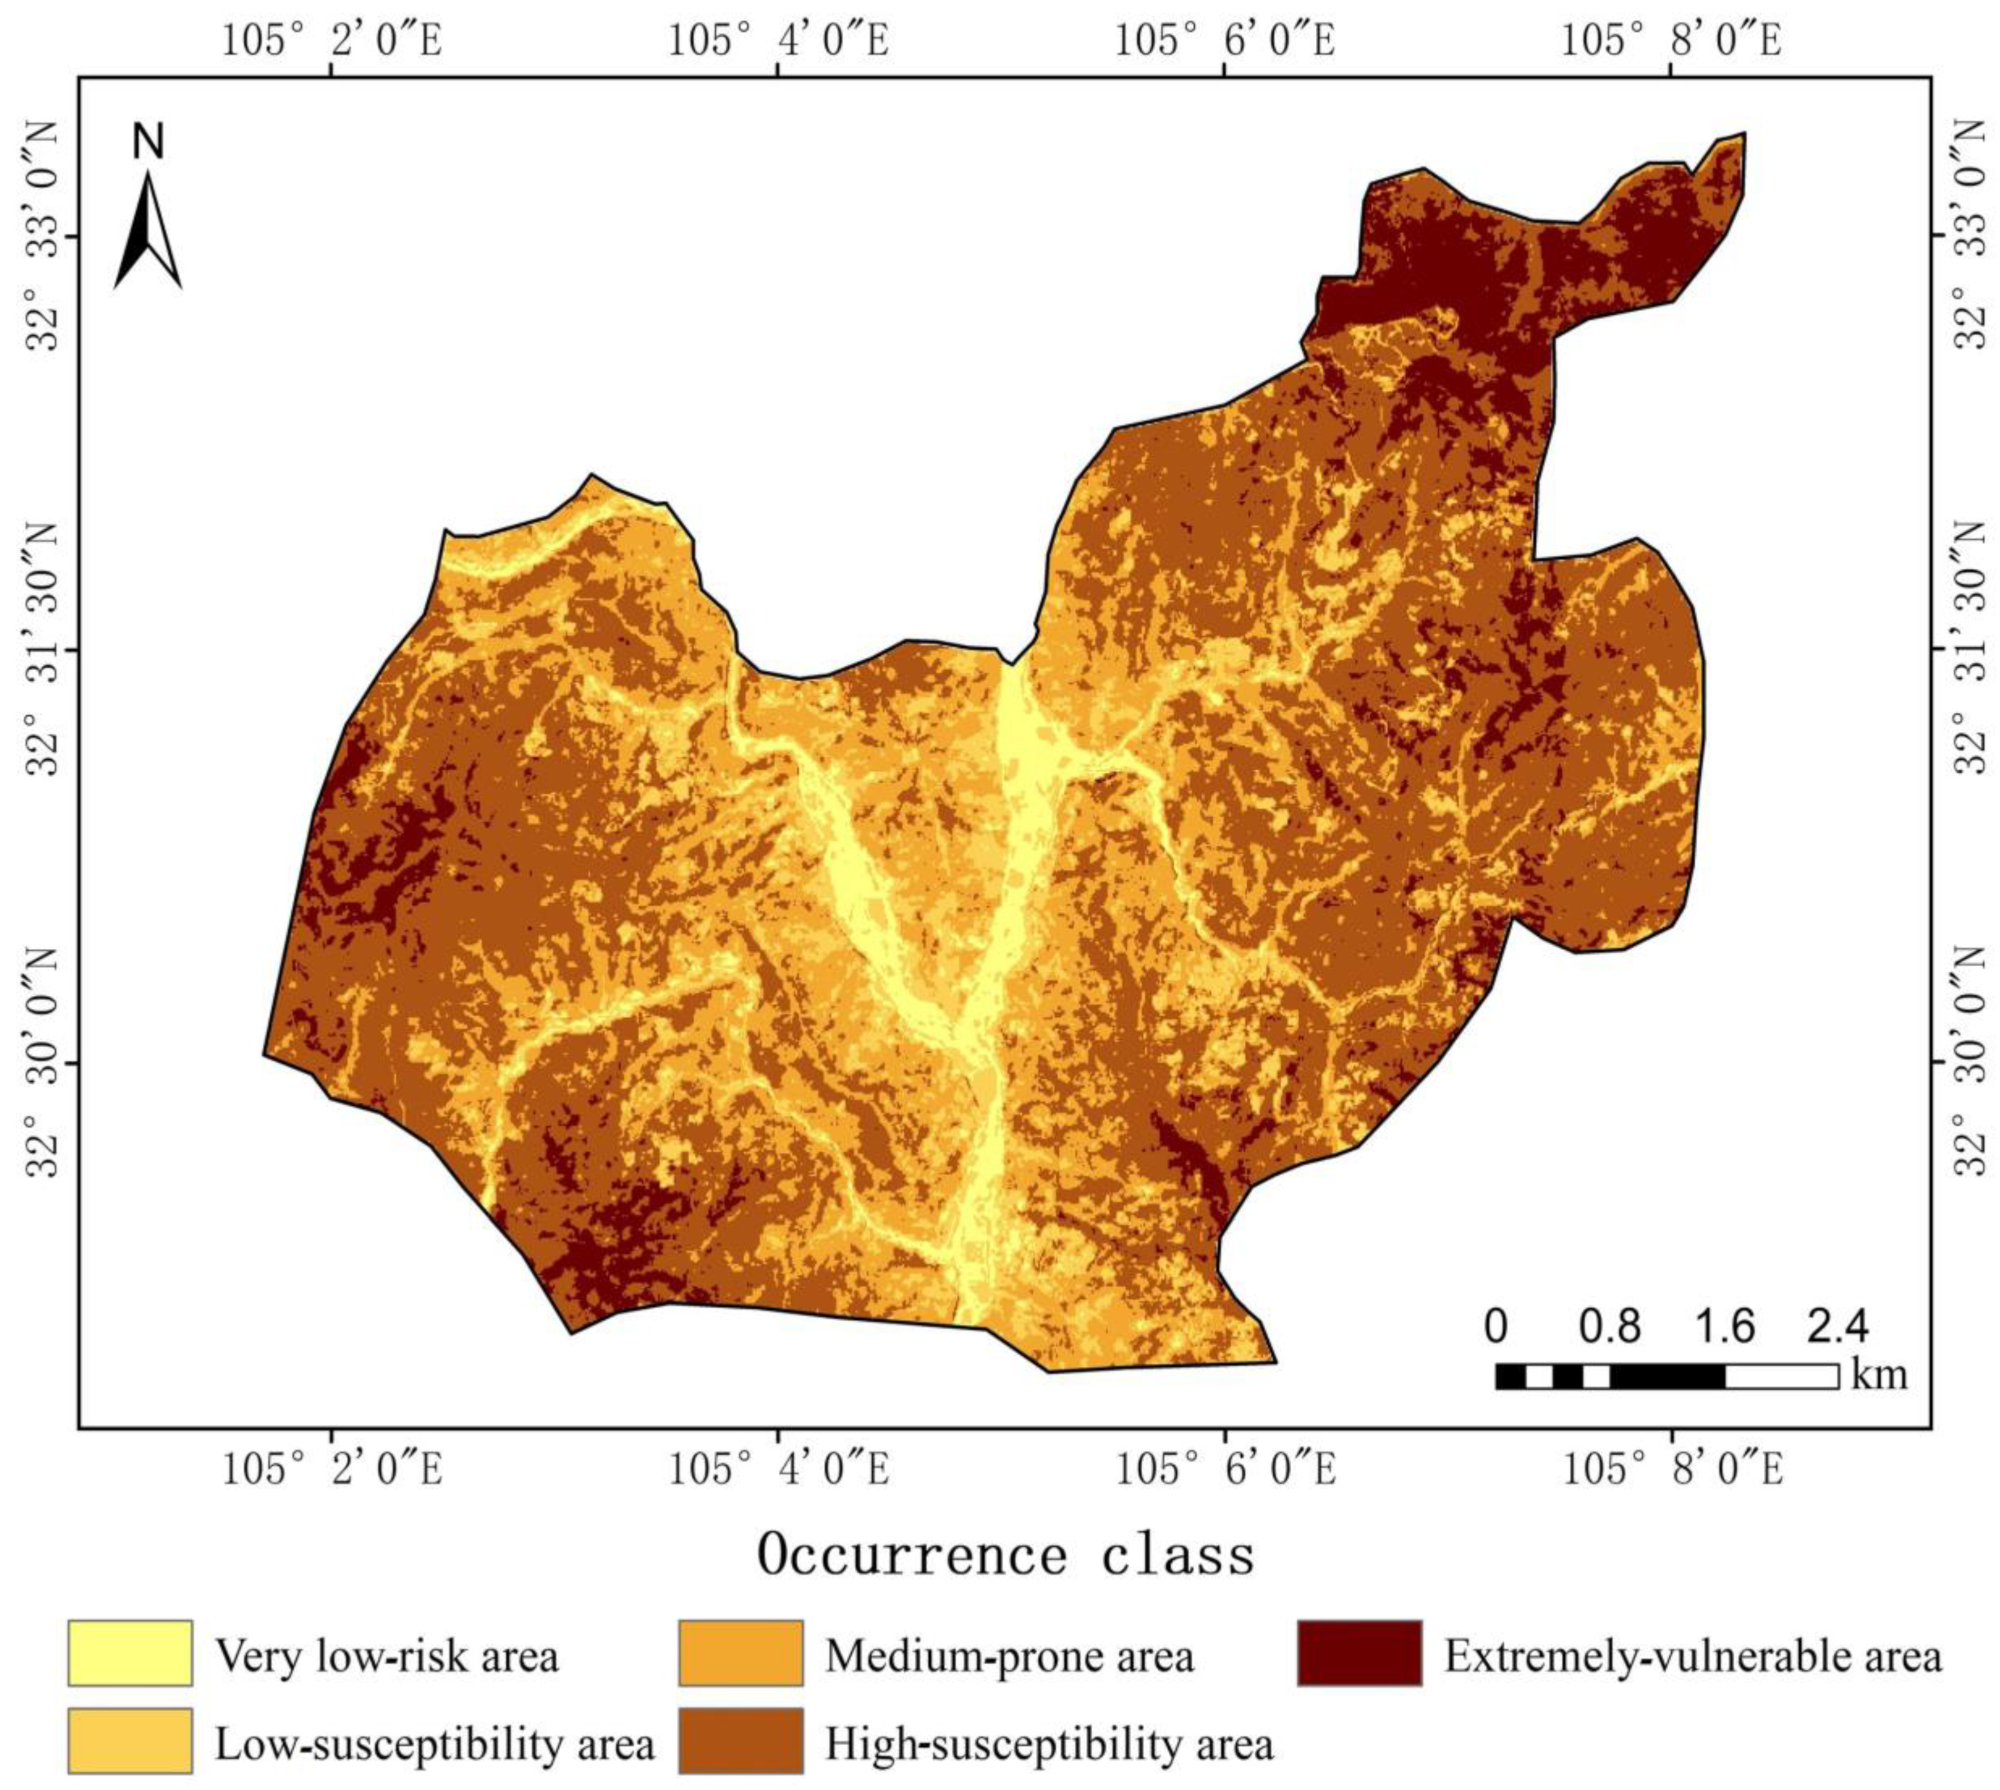
After conducting a thorough analysis of the factors influencing land-use type changes and employing precise SBAS (Small Baseline Subset) monitoring imagery data, considering various factors such as terrain, topography, soil conditions, and human activities, we used the Natural Breaks method to delineate landslide-prone areas. The range of values for each classification criterion was determined based on natural breakpoints (i.e., significant change points) in landslide risk-assessment data. Consequently, we obtained five classification criteria (extremely-vulnerable, high-susceptibility, medium-prone, low- susceptibility, very-low risk) and their corresponding range of values (Figure 17). The research results indicate that the northeast area and eastern area have become concentrated in the high-susceptibility zone. A notable characteristic of these areas is significant changes in land-use types, where intense land-use changes disrupt the original ecological balance and weaken the stability of geological structures. Consequently, these areas face higher landslide risks. In contrast, the middle region emerges as the primary distribution area for the low-susceptibility zone. These areas have relatively homogeneous land types and stable geological structures, resulting in a lower probability of landslide occurrence. This result not only highlights a high degree of correspondence between predictive results and actual landslide distribution, but also validates the scientific rigor and accuracy of the research methodology.
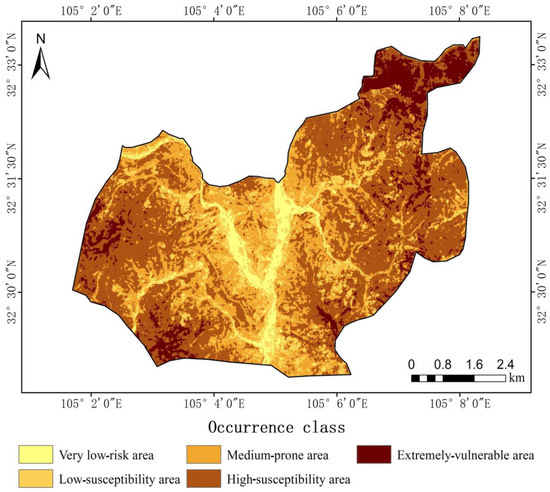
Figure 17.
Landslide-susceptibility area in the study area.
4. Discussion
Firstly, as a relatively small area within Guangyuan City, resource allocation for geological disaster research in Le’an Town is relatively limited. Secondly, despite the high risk of major geological disasters due to its unique terrain and landforms, Le’an Town has not received focused attention, due to its low historical frequency of occurrence and uncertain impact range. Additionally, the town’s remote geographical location, limited accessibility, and high vegetation cover pose challenges for data acquisition and on-site monitoring, thereby constraining the in-depth investigation and study of geological disaster patterns. SBAS-InSAR technology, with its advantages of high precision, wide coverage, and continuous monitoring, plays a crucial role in the extraction and prediction of landslide areas in Le’an Town. By employing differential interferometry on multiple SAR images, it can effectively monitor surface deformations and thereby identify potential landslide areas. This technology not only overcomes the spatial and temporal limitations of traditional ground-based monitoring methods, but also provides reliable deformation data in areas with high vegetation cover. Therefore, this paper utilizes SBAS-InSAR technology to monitor surface deformations and extract image data in Le’an Town.
However, in the geological-disaster research process in Le’an Town, it was found that extensive high vegetation cover poses challenges. This study also found that current research on SBAS-InSAR technology for landslide prediction mostly focuses on mining areas or regions with less-extensive vegetation cover. There is relatively limited research on areas with extensive high vegetation cover [62,63,64,65,66]. Therefore, this paper fills the gap in the application of SBAS technology in this regard. In addition, there is currently a lack of extensive research combining land-use change and water system characteristics with SBAS-InSAR technology for geological-disaster prediction and validation [67,68,69,70,71,72]. Therefore, this paper plays a crucial role in filling this gap by integrating and validating these factors through SBAS-InSAR technology.
In regions with high vegetation cover, the complex structure and multi-layered vegetation can lead to multiple scattering of SAR signals and occlusion effects, complicating the surface reflection signals. These multiple reflections make it difficult to extract surface deformation information, thus affecting monitoring accuracy.
To overcome this challenge, in addition to enhancing data processing steps such as radiometric and atmospheric corrections to minimize environmental impacts on SAR signals, this paper creatively integrates the land-use change characteristics based on optical remote sensing technology. Leveraging its advantages in areas with high vegetation cover, critical information on surface slope and aspect is extracted, given the crucial role of water system-development characteristics in geological disaster research in Le’an Town, where the distribution and development of water systems reflect surface hydrological features directly influencing the formation and evolution of geological disasters. By integrating water system information, a comprehensive understanding of landslide formation mechanisms and their correlation with surface deformations is achieved. Consequently, the study also incorporates the water system-development characteristics specific to Le’an Town. The results validate the deformation monitoring achieved through SBAS-InSAR technology with the analysis of land-use changes and water system-development features obtained via optical remote sensing. The validation demonstrates high consistency in deformation information across 12 typical surface-deformation zones identified by both technologies, confirming the effectiveness and reliability of the approach.
In predicting geological disaster risks in areas extensively covered by tall vegetation, despite the current research methods demonstrating certain innovation and practicality, there are still some limitations: for instance, the effects of tall vegetation on surface runoff and soil stability, the correlation between meteorological data and geological disasters such as landslides, and the impact of seismic wave peaks on geological disasters. Therefore, further improvements are needed in the following areas:
- Obtain finer details of terrain changes, soil moisture, extent of rock exposure, and other key information beneath surface vegetation cover. Utilize deep learning algorithms to automatically identify and classify remote sensing imagery, enhancing the accuracy and efficiency of identifying geological disaster risks.
- Use GIS and three-dimensional geological modeling techniques to construct a three-dimensional geological structure model of the study area. Simulate geological responses under various external factors such as different rainfall intensities and seismic activities. Through simulation analysis, predict potential types, scales, and impact ranges of geological disasters in areas covered by dense vegetation.
- Establish long-term monitoring stations, collect real-time data, strengthen on-site surveys and monitoring efforts. Validate remote sensing interpretations and model predictions through field investigations, continuously adjusting and optimizing predictive models.
5. Conclusions
This study focuses on the Le’an Town of Guangyuan City, utilizing Sentinel-1 data collected between 2016 and 2024. The SBAS-InSAR technology was employed to obtain vertical surface-deformation imagery of the study area. Given the high vegetation coverage in the region, to ensure the accuracy and reliability of the research results, we incorporated land-use changes derived from optical remote sensing technology (including slope and aspect) and integrated watershed development characteristics. The deformation results obtained by SBAS technology were cross-validated, and these results were compared with data obtained through other methods. This comprehensive approach was used to study and predict the landslide development in the area.
In this paper, surface deformation information of the study area was obtained by processing SBAS-InSAR (Small Baseline Subset–Interferometric Synthetic-Aperture Radar) image data. To ensure data quality, the data underwent phase unwrapping, filtering, and removal of unrelated signals. Subsequently, the SBAS algorithm was used to perform differential interferometry on multiple images, obtaining surface deformation information by calculating phase differences. Through meticulous data analysis and processing, critical information such as surface deformation time-series maps and deformation-rate maps for the study area was obtained. This information not only reveals the spatial distribution characteristics of surface deformation, but also its temporal variation patterns. To comprehensively study the development characteristics of landslides in the research area and predict landslide disasters, real-time dynamic changes in land use were combined with the natural break method to divide the research area into landslide-susceptibility zones.
Combining the analysis of land-use change information (slope and aspect), it was found that landslide-prone areas are mainly concentrated in regions with steep slopes and aspects conducive to water accumulation. The surface deformation rate in these areas is significantly higher than in the surrounding areas, further verifying the important influence of topographical conditions on landslide development. Additionally, the analysis of water system-development characteristics revealed the inducing effect of the water network on landslide disasters, especially during periods of heavy rainfall or flood seasons. Water system activity exacerbates the instability of potential landslide masses.
The study revealed the following findings:
- When the elevation is below 1160 m, the susceptibility sensitivity of landslides gradually increases with elevation. Subsequently, as the elevation continues to increase, the susceptibility sensitivity of landslides begins to decrease gradually.
- When the slope is less than 38°, the susceptibility sensitivity of landslides gradually increases with the slope. Once the slope exceeds 50°, the susceptibility sensitivity of landslides begins to decrease with increasing slope.
- With the acceleration of urbanization and changes in agricultural activities, factors such as land-cover types, vegetation conditions, and terrain have all had a significant impact on the susceptibility of landslides. In particular, human activities such as deforestation, slope cultivation, and urban construction have significantly increased the risk of landslides. The northeast and eastern regions have become concentrated areas of high susceptibility. The central region, on the other hand, is mainly distributed in low-susceptibility areas.
Based on in-depth analysis and comprehensive evaluation, this study successfully identified and delineated 12 significant landslide areas in Le’an Town, Guangyuan City. Subsequently, the deformation data obtained using SBAS-InSAR technology were cross-validated with deformation results acquired through other independent methods (land-use changes and watershed development characteristics). The deformation data from these two different sources exhibited a high degree of consistency in identifying landslide areas. This not only greatly enhances the reliability of the study’s results but also provides a valuable approach for conducting geological-disaster research in similar study areas.
Author Contributions
Conceptualization, H.G., A.M.M.-G.; methodology, H.G.; software, H.G.; validation, H.G., A.M.M.-G.; formal analysis, H.G.; investigation, H.G., A.M.M.-G. resources, H.G.; data curation, H.G. writing—original draft preparation, H.G., A.M.M.-G.; writing—review and editing, H.G., A.M.M.-G.; visualization, H.G.; supervision H.G., A.M.M.-G.; project administration A.M.M.-G.; funding acquisition, A.M.M.-G. All authors have read and agreed to the published version of the manuscript.
Funding
This research was supported by MCIN/AEI/10.13039/501100011033 and the GEAPAGE research group (Environmental Geomorphology and Geological Heritage) of the University of Salamanca.
Data Availability Statement
The raw data supporting the conclusions of this article will be made available by the authors on request.
Conflicts of Interest
The authors declare that they have no known competing financial interests or personal relationships that could have appeared to influence the work reported in this paper.
References
- Guo, J.; Yang, Z.; Yang, Z.; Shi, Z.; Huang, G.; Yang, Z.; Yang, D. Landslide hazard susceptibility evaluation based on SBAS-InSAR technology and SSA-BP neural network algorithm: A case study of Baihetan Reservoir Area. J. Mt. Sci. 2024, 21, 594–614. [Google Scholar] [CrossRef]
- Yang, Z.; Du, G.; Zhang, Y.; Xu, C.; Yu, P.; Shao, W.; Mai, X. Seismic landslide hazard assessment using improved seismic motion parameters of the 2017 Ms 7.0 Jiuzhaigou earthquake, Tibetan Plateau. Front. Earth Sci. 2024, 12, 1302553. [Google Scholar] [CrossRef]
- Wistuba, M.; Malik, I.; Tie, Y.; Gorczyca, E.; Zhang, X.; Wang, J.; Lu, T. Indicating landslide hazard from tree rings—Ecosystem service provided by an alder forest in the hengduan Mts, Sichuan, China. Ecosyst. Serv. 2024, 67, 101619. [Google Scholar] [CrossRef]
- Singh, M.; Khajuria, V.; Singh, S.; Singh, K. Landslide susceptibility evaluation in the Beas River Basin of North-Western Himalaya: A geospatial analysis employing the Analytical Hierarchy Process (AHP) method. Quat. Sci. Adv. 2024, 14, 100180. [Google Scholar] [CrossRef]
- Sreejith, M.K.; Jasir, M.C.M.; Sunil, S.P.; Rose, M.S.; Saji, A.P.; Agrawal, R.; Bushair, M.T.; Kumar, K.V.; Desai, N.M. Geodetic Evidence for Cascading Landslide Motion Triggered by Extreme Rain Events at Joshimath, NW Himalaya. Geophys. Res. Lett. 2024, 51, e2023GL106427. [Google Scholar] [CrossRef]
- Liu, J.; Zhang, Y.; Xu, P.; Zeng, Y.; Xiang, C.; Fu, H.; Yu, H.; He, Y. Predictive Displacement Models Considering the Probability of Pulse-Like Ground Motions for Earthquake-Induced Landslides Hazard Assessment. J. Earthq. Eng. 2024, 28, 1793–1817. [Google Scholar] [CrossRef]
- Harp, L.E.; Reid, E.M.; McKenna, P.J.; Michael, J.A. Mapping of hazard from rainfall-triggered landslides in developing countries: Examples from Honduras and Micronesia. Eng. Geol. 2008, 104, 295–311. [Google Scholar] [CrossRef]
- Verma, K.A.; Mushtaq, R. Landslides: An environmental hazard in the Pir-Panjal Himalayan range in Poonch district of J&K state, India. Indian J. Sci. Res. 2013, 4, 143–148. [Google Scholar]
- Pattukandan, G.G.; Rajawat, A.S. Use of hazard and vulnerability maps for landslide planning scenarios: A case study of the Nilgiris, India. Nat. Hazards 2015, 77, 305–316. [Google Scholar]
- Heidarzadeh, M.; Miyazaki, H.; Ishibe, T.; Takagi, H.; Sabeti, R. Field surveys of September 2018 landslide-generated waves in the Apporo dam reservoir, Japan: Combined hazard from the concurrent occurrences of a typhoon and an earthquake. Landslides 2022, 20, 143–156. [Google Scholar] [CrossRef]
- Glade, S.; Schmitz, C.; Barron, B.N.; Dashti, S.; Roudbari, S.; Liel, A.B.; Pezzullo, P.C.; Miller, S.L. Hazards and Incarceration Facilities: Evaluating Facility-Level Exposure to Floods, Wildfires, Extreme Heat, and Landslides in Colorado. Nat. Hazards Rev. 2024, 25, 04023047. [Google Scholar] [CrossRef]
- Wahba, M.; Rawy, E.M.; Arifi, A.N.; Mansour, M.M. A Novel Estimation of the Composite Hazard of Landslides and Flash Floods Utilizing an Artificial Intelligence Approach. Water 2023, 15, 4138. [Google Scholar] [CrossRef]
- Wei, J.; Zhao, Z.; Xu, C.; Wen, Q. Numerical investigation of landslide kinetics for the recent Mabian landslide (Sichuan, China). Landslides 2019, 16, 2287–2298. [Google Scholar] [CrossRef]
- Li, C.; Su, L. Influence of critical acceleration model on assessments of potential earthquake–induced landslide hazards in Shimian County, Sichuan Province, China. Landslides 2021, 18, 1659–1674. [Google Scholar] [CrossRef]
- Song, D.; Wu, R.; Ma, D.; Guo, C.; Wang, Y.; Ni, J.; Li, X. Simulation and Analysis of the Movement Process of Landslide Disasters in the Xigeda Formation, Luding, Sichuan. Geol. Bull. China 2023, 42, 2185–2197. [Google Scholar]
- Valencia Ortiz, J.A.; Martínez-Graña, A.M.; Cabero, T. DInSAR MultiTemporal Analysis for the Characterization of Ground Deformations Related to Tectonic Processes in the Region of Bucaramanga, Colombia. Remote Sens. 2024, 16, 449. [Google Scholar] [CrossRef]
- Liu, R.; Yang, X.; Xu, C.; Wei, L.; Zeng, X. Comparative Study of Convolutional Neural Network and Conventional Machine Learning Methods for Landslide Susceptibility Mapping. Remote Sens. 2022, 14, 321. [Google Scholar] [CrossRef]
- Liu, Q.; Wu, T.; Deng, Y.; Liu, Z. Intelligent identification of landslides in loess areas based on the improved YOLO algorithm: A case study of loess landslides in Baoji City. J. Mt. Sci. 2023, 20, 3343–3359. [Google Scholar] [CrossRef]
- Li, X.; Nishio, M.; Sugawara, K.; Iwanaga, S.; Shimada, T.; Kanasaki, H.; Kanai, H.; Zheng, S.; Chun, P.-J. Enhancing prediction of landslide dam stability through AI models: A comparative study with traditional approaches. Geomorphology 2024, 454, 109120. [Google Scholar] [CrossRef]
- Wang, T.; Luo, R.; Ma, T.; Chen, H.; Zhang, K.; Wang, X.; Chu, Z.; Sun, H. Study and verification on an improved comprehensive prediction model of landslide displacement. Bull. Eng. Geol. Environ. 2024, 83, 90. [Google Scholar] [CrossRef]
- Zhang, L.; Dai, K.; Deng, J.; Ge, D.; Liang, R.; Li, W.; Xu, Q. Identifying Potential Landslides by Stacking-InSAR in Southwestern China and Its Performance Comparison with SBAS-InSAR. Remote Sens. 2021, 13, 3662. [Google Scholar] [CrossRef]
- Chang, M.; Sun, W.; Xu, H.; Tang, L. Identification and deformation analysis of potential landslides after the Jiuzhaigou earthquake by SBAS-InSAR. Environ. Sci. Pollut. Res. Int. 2023, 30, 39093–39106. [Google Scholar] [CrossRef] [PubMed]
- Li, Y.; Feng, X.; Li, Y.; Jiang, W.; Yu, W. Detection and analysis of potential landslides based on SBAS-InSAR technology in alpine canyon region. Environ. Sci. Pollut. Res. Int. 2024, 31, 6492–6510. [Google Scholar] [CrossRef]
- Zhu, Z.; Yuan, X.; Gan, S.; Zhang, J.; Zhang, X. A research on a new mapping method for landslide susceptibility based on SBAS-InSAR technology. Egypt. J. Remote Sens. Space Sci. 2023, 26, 1046–1056. [Google Scholar] [CrossRef]
- Guo, H.; Martínez-Graña, A.M. Susceptibility of Landslide Debris Flow in Yanghe Township Based on Multi-Source Remote Sensing Information Extraction Technology (Sichuan, China). Land 2024, 13, 206. [Google Scholar] [CrossRef]
- Qin, X.; Huang, Y.; Wang, C.; Jiang, K.; Xie, L.; Liu, R.; Shi, X.; Chen, X.; Zhang, B. A temporary soil dump settlement and landslide risk analysis using the improved small baseline subset-InSAR and continuous medium model. Int. J. Appl. Earth Obs. Geoinf. 2024, 128, 103760. [Google Scholar] [CrossRef]
- Hao, L.; van Westen, C.; Rajaneesh, A.; Sajinkumar, K.S.; Martha, T.R.; Jaiswal, P. Evaluating the relation between land use changes and the 2018 landslide disaster in Kerala, India. Catena 2022, 216, 106363. [Google Scholar] [CrossRef]
- Ya, R.; Wu, J.; Tang, R.; Zhou, Q. Increased flood susceptibility in the Tibetan Plateau with climate and land use changes. Ecol. Indic. 2023, 156, 111086. [Google Scholar] [CrossRef]
- Suci, S.; Wiwandari, H.; Atik, S. Spatio-Temporal Analysis on Land Use/Land Cover Change in Banda Aceh: A Preliminary Study of Disaster Resilience. IOP Conf. Ser. Earth Environ. Sci. 2023, 1264, 012011. [Google Scholar]
- Zhang, X.; Zeng, X.; Luo, H.; Zhou, C.; Shu, Z.; Jiang, L.; Wang, Z.; Fei, Z.; Yu, J.; Yang, X.; et al. The relationship between geological disasters with land use change, meteorological and hydrological factors: A case study of Neijiang City in Sichuan Province. Ecol. Indic. 2023, 154, 110840. [Google Scholar]
- Niu, H.; Xiu, Z.; Xiao, D. Impact of land-use change on ecological vulnerability in the Yellow River Basin based on a complex network model. Ecol. Indic. 2024, 166, 112212. [Google Scholar] [CrossRef]
- Li, Z.; Zhu, J.; Tian, Y. Impact of Land-Use–Land Cover Changes on the Service Value of Urban Ecosystems: Evidence from Chengdu, China. J. Urban Plan. Dev. 2024, 150, 05024028. [Google Scholar] [CrossRef]
- Gandharum, L.; Hartono, M.D.; Karsidi, A.; Ahmad, M.; Prihanto, Y.; Mulyono, S.; Sadmono, H.; Sanjaya, H.; Sumargana, L.; Alhasanah, F. Past and future land use change dynamics: Assessing the impact of urban development on agricultural land in the Pantura Jabar region, Indonesia. Environ. Monit. Assess. 2024, 196, 645. [Google Scholar] [CrossRef] [PubMed]
- Pozo, D.A.; Aguilera, C.G.; Gallo, A.B. Consequences of Land Use Changes on Native Forest and Agricultural Areas in Central-Southern Chile during the Last Fifty Years. Land 2024, 13, 610. [Google Scholar] [CrossRef]
- Raza, A.; Shahid, A.M.; Safdar, M.; Zaman, M.; Sabir, R.M.; Muzammal, H.; Ahmed, M.M. Impact of Land Use and Land Cover Change on Agricultural Production in District Bahawalnagar, Pakistan. Environ. Sci. Proc. 2024, 29, 46. [Google Scholar] [CrossRef]
- Meshesha, M.T.; Tsunekawa, A.; Haregeweyn, N.; Tsubo, M.; Fenta, A.A.; Berihun, M.L.; Mulu, A.; Belay, A.S.; Sultan, D.; Ebabu, K.; et al. Alterations in Hydrological Responses under Changing Climate and Land Use/Land Cover across Contrasting Agroecological Environments: A Case Study on the Chemoga Watershed in the Upper Blue Nile Basin, Ethiopia. Water 2024, 16, 1037. [Google Scholar] [CrossRef]
- Anand, V.; Oinam, B.; Wieprecht, S. Synergistic impact of climate and land use land cover change dynamics on the hydrological regime of Loktak Lake catchment under CMIP6 scenarios. J. Hydrol. Reg. Stud. 2024, 53, 101851. [Google Scholar] [CrossRef]
- Godwin, E.; Anthony, G.; Yazidhi, B.; Egeru, A.; Kabenge, I. Spatiotemporal Analysis of the Hydrological Responses to Land-Use Land-Cover Changes in the Manafwa Catchment, Eastern Uganda. Prof. Geogr. 2024, 76, 259–276. [Google Scholar]
- Mandah, P.V.; Tematio, P.; Onana, A.A.; Fiaboe, K.K.M.; Arthur, E.; Giweta, M.H.; Ndango, R.; Silatsa, F.B.T.; Voulemo, D.D.I.; Biloa, J.B.; et al. Variability of soil organic carbon and nutrient content across land uses and agriculturally induced land use changes in the forest-savanna transition zone of Cameroon. Geoderma Reg. 2024, 37, e00808. [Google Scholar] [CrossRef]
- Zhou, J.; Luo, J.; Ma, X. Spatiotemporal Evolution of Land Use and Ecosystem Service Value and Its Driving Factors in the Lhasa River Basin. Arid Zone Res. 2024, 21, 2059–2074. [Google Scholar]
- Wu, C.; Wang, Z. Multi-scenario simulation and evaluation of the impacts of land use change on ecosystem service values in the Chishui River Basin of Guizhou Province, China. Ecol. Indic. 2024, 163, 112078. [Google Scholar] [CrossRef]
- Jing, X.; Tian, G.; He, Y.; Wang, M. Spatial and temporal differentiation and coupling analysis of land use change and ecosystem service value in Jiangsu Province. Ecol. Indic. 2024, 163, 112076. [Google Scholar] [CrossRef]
- Rees, G.; Baidy, H.L.; Belenok, V. Temporal Variations in Land Surface Temperature within an Urban Ecosystem: A Comprehensive Assessment of Land Use and Land Cover Change in Kharkiv, Ukraine. Remote Sens. 2024, 16, 1637. [Google Scholar] [CrossRef]
- Juan, Y.X.; Jian, Z.; Qiang, C.; Zhang, L.; Zou, F. Instantaneous Frequency Extraction Using the EMD-Based Wavelet Ridge to Reveal Geological Features. Front. Earth Sci. 2018, 6, 65. [Google Scholar]
- Huang, C.; Cao, Y.; Zhou, L. Application of optimized GM (1,1) model based on EMD in landslide deformation prediction. Comput. Appl. Math. 2021, 40, 261. [Google Scholar] [CrossRef]
- Meng, Y.; Qin, Y.; Cai, Z.; Tian, B.; Yuan, C.; Zhang, X.; Zuo, Q. Dynamic forecast model for landslide displacement with step-like deformation by applying GRU with EMD and error correction. Bull. Eng. Geol. Environ. 2023, 82, 211, Correction in Bull. Eng. Geol. Environ. 2023, 82, 237. [Google Scholar] [CrossRef]
- Cai, H.; Shi, H.; Liu, S.; Babovic, V. Impacts of regional characteristics on improving the accuracy of groundwater level prediction using machine learning: The case of central eastern continental United States. J. Hydrol. Reg. Stud. 2021, 37, 100930. [Google Scholar] [CrossRef]
- Chen, Y.; Chang, J.; Li, Z.; Ming, L.; Li, C. Influence of land use change on habitat quality: A case study of coal mining subsidence areas. Environ. Monit. Assess. 2024, 196, 535. [Google Scholar] [CrossRef]
- Uddin, M.M.; Mia, B.M.; Gazi, Y.; Kamal, A.M. Quantification of landuse changes driven by the dynamics of the Jamuna River, a giant tropical river of Bangladesh. Egypt. J. Remote Sens. Space Sci. 2024, 27, 392–402. [Google Scholar] [CrossRef]
- Tang, J.; Liu, D.; Shang, C.; Niu, J. Impacts of land use change on surface infiltration capacity and urban flood risk in a representative karst mountain city over the last two decades. J. Clean. Prod. 2024, 454, 142196. [Google Scholar] [CrossRef]
- Sun, X.; Wang, Y.; Wang, H.; Zhang, C.; Wang, Z. Digital soil mapping based on empirical mode decomposition components of environmental covariates. Eur. J. Soil Sci. 2019, 70, 1109–1127. [Google Scholar] [CrossRef]
- Zhang, X.; Chen, H.; Zhu, G.; Zhao, D.; Duan, B. A new groundwater depth prediction model based on EMD-LSTM. Water Supply 2022, 22, 5974–5988. [Google Scholar] [CrossRef]
- Hua, A.G.; Fei, P.L.; Dan, D.W.; Wu, J.-Z.; Xiao, C.; Peng, H.-Y.; Jiang, S.-H. Improving the resolution of poststack seismic data based on UNet+GRU deep learning method. Appl. Geophys. 2023, 20, 176–185. [Google Scholar]
- Nan, T.; Cao, W.; Wang, Z.; Gao, Y.; Zhao, L.; Sun, X.; Na, J. Evaluation of shallow groundwater dynamics after water supplement in North China Plain based on attention-GRU model. J. Hydrol. 2023, 625, 130085. [Google Scholar] [CrossRef]
- Chen, T.; Gao, G.; Liu, H.; Li, Y.; Gui, Z.; Yu, Z.; Zhai, X. Rock brittleness index inversion method with constraints of seismic and well logs via a CNN-GRU fusion network based on the spatiotemporal attention mechanism. Geoenergy Sci. Eng. 2023, 225, 211646. [Google Scholar] [CrossRef]
- Nisar, A.; Xu, Y.; Muhammad, T. Water resource management and flood mitigation: Hybrid decomposition EMD-ANN model study under climate change. Sustain. Water Resour. Manag. 2024, 10, 71. [Google Scholar]
- Wu, Q.; Jia, C.; Chen, S.; Li, H. SBAS-InSAR based deformation detection of urban land, created from mega-scale mountain excavating and valley filling in the loess plateau: The case study of Yan’an city. Remote Sens. 2019, 11, 1673. [Google Scholar] [CrossRef]
- Seong, H.L.; Hong, J.O. Correcting Digital Elevation Models (DEM) from Unmanned Aerial Vehicles (UAV): A New Method Using Polynomial Model Matching Techniques. J. Coast. Res. 2021, 114, 434–438. [Google Scholar]
- El Hage, M.; Villard, L.; Huang, Y.; Ferro-Famil, L.; Koleck, T.; Le Toan, T.; Polidori, L. Multicriteria Accuracy Assessment of Digital Elevation Models (DEMs) Produced by Airborne P-Band Polarimetric SAR Tomography in Tropical Rainforests. Remote Sens. 2022, 14, 4173. [Google Scholar] [CrossRef]
- Thanh-Nhan-Duc, T.; Quang, B.N.; Duong, N.V.; Le, M.-H.; Nguyen, Q.-D.; Lakshmi, V.; Bolten, J.D. Quantification of global Digital Elevation Model (DEM)—A case study of the newly released NASADEM for a river basin in Central Vietnam. J. Hydrol. Reg. Stud. 2023, 45, 101282. [Google Scholar]
- Krdžalić, D.; Ćatić, J.; Vrce, E.; Omićević, D. Evaluating the accuracy of the digital elevation models (DEMs) within the territory of Bosnia and Herzegovina. Remote Sens. Appl. Soc. Environ. 2024, 34, 101187. [Google Scholar] [CrossRef]
- He, Y. Monitoring and Analysis of Surface Settlement in Lingxin Coal Mine Based on SBAS-InSAR Technology. J. Res. Sci. Eng. 2022, 4, 3711–3721. [Google Scholar]
- Valencia Ortiz, J.A.; Martínez-Graña, A.; Mejía Mendez, L. Evaluation of Susceptibility by Mass Movements through Stochastic and Statistical Methods for a Region of Bucaramanga, Colombia. Remote Sens. 2023, 15, 4567. [Google Scholar] [CrossRef]
- Omid, S.M.; Mohammad, K.; Suraparb, K. Landslides monitoring with SBAS-InSAR and GNSS. Phys. Chem. Earth 2023, 132, 103486–103499. [Google Scholar]
- Zhou, S.; Guo, Z.; Huang, G.; Liu, K. Improving the Understanding of Landslide Development in Alpine Forest Regions Using the InSAR Technique: A Case Study in Xiaojin County China. Appl. Sci. 2023, 13, 11851. [Google Scholar] [CrossRef]
- Valencia Ortiz, J.A.; Nieto, C.E.; Martínez-Graña, A.M. Evaluation of Mass Movement Hazard in the Shoreline of the Intertidal Complex of El Grove (Pontevedra, Galicia). Remote Sens. 2024, 16, 2478. [Google Scholar] [CrossRef]
- Merchán, L.; Martínez-Graña, A.; Nieto, C.; Criado, M.; Cabero, T. Geospatial Characterization of Gravitational and Erosion Risks to Establish Conservation Practices in Vineyards in the Arribes del Duero Natural Park (Spain). Agronomy 2023, 13, 2102. [Google Scholar] [CrossRef]
- Cavalieri, F.; Franchin, P.; Giovinazzi, S. Earthquake-altered flooding hazard induced by damage to storm water systems. Sustain. Resilient Infrastruct. 2016, 1, 14–31. [Google Scholar] [CrossRef]
- Valencia Ortiz, J.A.; Martínez-Graña, A. Calculation of precipitation and seismicity thresholds as triggers for mass movements in the region of Bucaramanga, Colombia. Ecol. Indic. 2023, 152, 110355. [Google Scholar] [CrossRef]
- Zhao, S.; Qi, J.; Li, D.; Wang, X. Land use change and its influencing factors along railways in Africa: A case study of the Ethiopian section of the Addis Ababa–Djibouti Railway. J. Geogr. Sci. 2024, 34, 1128–1156. [Google Scholar] [CrossRef]
- Mashiyi, S.; Weesakul, S.; Vojinovic, Z.; Torres, A.S.; Babel, M.S.; Ditthabumrung, S.; Ruangpan, L. Designing and evaluating robust nature-based solutions for hydro-meteorological risk reduction. Int. J. Disaster Risk Reduc. 2024, 93, 103787, Corrigendum in Int. J. Disaster Risk Reduc. 2024, 109, 104579. [Google Scholar] [CrossRef]
- Marengo, J.A.; Cunha, A.P.; Seluchi, M.E.; Camarinha, P.I.; Dolif, G.; Sperling, V.B.; Alcântara, E.H.; Ramos, A.M.; Andrade, M.M.; Stabile, R.A. Heavy rains and hydrogeological disasters on February 18th–19th, 2023, in the city of São Sebastião, São Paulo, Brazil: From meteorological causes to early warnings. Nat. Hazards 2024, 120, 7997–8024. [Google Scholar] [CrossRef]


Disclaimer/Publisher’s Note: The statements, opinions and data contained in all publications are solely those of the individual author(s) and contributor(s) and not of MDPI and/or the editor(s). MDPI and/or the editor(s) disclaim responsibility for any injury to people or property resulting from any ideas, methods, instructions or products referred to in the content. |
© 2024 by the authors. Licensee MDPI, Basel, Switzerland. This article is an open access article distributed under the terms and conditions of the Creative Commons Attribution (CC BY) license (https://creativecommons.org/licenses/by/4.0/).