Abstract
Quantifying the effect of maize tassel on canopy reflectance is essential for creating a tasseling progress monitoring index, aiding precision agriculture monitoring, and understanding vegetation canopy radiative transfer. Traditional field measurements often struggle to detect the subtle reflectance differences caused by tassels due to complex environmental factors and challenges in controlling variables. The three-dimensional (3D) radiative transfer model offers a reliable method to study this relationship by accurately simulating interactions between solar radiation and canopy structure. This study used the LESS (large-scale remote sensing data and image simulation framework) model to analyze the impact of maize tassels on visible and near-infrared reflectance in heterogeneous 3D scenes by modifying the structural and optical properties of canopy components. We also examined the anisotropic characteristics of tassel effects on canopy reflectance and explored the mechanisms behind these effects based on the quantified contributions of the optical properties of canopy components. The results showed that (1) the effect of tassels under different planting densities mainly manifests in the near-infrared band of the canopy spectrum, with a variation magnitude of ±0.04. In contrast, the impact of tassels on different leaf area index (LAI) shows a smaller response difference, with a magnitude of ±0.01. As tassels change from green to gray during growth, their effect on reducing canopy reflectance increases. (2) The effect of maize tassel on canopy reflectance varied with spectral bands and showed an obvious directional effect. In the red band at the same sun position, the difference in tassel effect caused by the observed zenith angle on canopy reflectance reaches 200%, while in the near-infrared band, the difference is as high as 400%. The hotspot effect of the canopy has a significant weakening effect on the shadow effect of the tassel. (3) The non-transmittance optical properties of maize tassels reduce canopy reflectance, while their high reflectance increases it. Thus, the dual effects of tassels create a game in canopy reflectance, with the final outcome mainly depending on the sensitivity of the canopy spectrum to transmittance. This study demonstrates the potential of using 3D radiative transfer models to quantify the effects of crop fine structure on canopy reflectance and provides some insights for optimizing crop structure and implementing precision agriculture management (such as selective breeding of crop optimal plant type).
1. Introduction
Maize is a crucial source of food and feed, and it is one of the most widely distributed food crops in the world [1]. As China’s largest grain crop, maize holds a significant strategic position in ensuring food security and has a substantial economic impact on agricultural producers. The tassel plays a vital role in the growth process of maize, marking the transition from vegetative to reproductive growth stages. The emergence of the tassel indicates the optimal time for field management activities such as fertilizer application [2,3,4]. Studying the influence mechanism of maize tassels on canopy reflectance aids in the rapid monitoring and management of precision agriculture by accurately constructing inversion models of tasseling indices and maize physiological parameters. This, in turn, provides more precise decision support for agricultural production [5,6,7,8].
In plant phenotypic analysis and precision agriculture, continuous monitoring of crop growth is often required [9]. From the perspective of remote sensing technology, satellites, drones, or ground spectrometers capture the dynamic growth of crops by obtaining spectral reflectance across multiple bands. Vegetation remote sensing relies on the understanding of plant leaf and canopy spectra. However, in the inversion models of maize canopy vegetation indices and physical and chemical indices, the influence of tassels on canopy reflectance is often overlooked. Tassels and top leaves are treated as a single unit, which affects the accuracy of inversion models of physiological parameters based on maize canopy characteristics [10]. When the inversion model of vegetation canopy parameters is constructed based on physical methods such as the radiative transfer model, the knowledge of the expected range of canopy structure and associated optical properties of the elements may significantly improve the estimates [11].
The transition of maize from vegetative growth to reproductive growth during the tasseling period significantly alters the canopy structure. The fully developed tassel, located at the top of the maize canopy, has a geometric structure and optical properties distinct from those of the leaves, which is expected to significantly affect radiation transmission within the canopy. However, few studies have recorded the effect of maize tassels on canopy reflectance. Li et al. demonstrated through comparison of unmanned aerial vehicle (UAV)-measured data with simulated data from a three-dimensional (3D) ray tracing render engine that maize tassels generally increase the bidirectional reflectance factor (BRF) in all sun and observation directions in the red and near-infrared bands. [11]. By collecting canopy spectral data during the maize heading stage over two years, Bai et al. used the tassel-cutting experiment for comparative analysis and found that maize tassels reduce the reflectance of visible and near-infrared bands on the directions of the sun main plane, vertical sun main plane, and vertical observation direction [12]. Based on the method of image segmentation, Shao et al. removed maize tassels from canopy images and found that this improved the accuracy of leaf area index (LAI) estimation [10]. However, these studies did not analyze the causes of changes in canopy reflectance due to tassels and showed inconsistencies, possibly due to environmental noise and data acquisition scene differences. Therefore, more detailed research is necessary to quantify the effect of maize tassels on canopy reflectance while avoiding redundant noise interference.
Simulations of remote sensing signals based on three-dimensional (3D) radiative transfer modeling have received increasing attention [13]. This method effectively simulates correlated reflectance concerning the sun’s position and observation direction from realistic canopies and is a more economical solution compared to destructive field experiments [14]. At present, a growing number of 3D radiative transfer models have been developed, such as DART [15], LESS [16], RAPID [17], and HELIOS [18]. For crops such as maize with tassel characteristics, the PROSAIL model does not account for the influence of tassels on canopy radiative transfer characteristics [11]. In contrast, 3D radiative transfer models can easily adjust assumptions about vegetation canopy structure and optical properties [19], allowing for controlled analysis of factors affecting canopy reflectance under ideal conditions. However, for crops with prominent ear structures such as wheat and maize, most simulation studies focus on the pre-reproductive stage [20,21]. Accurate reconstruction of ears, which have fine and complex structures, requires a higher point cloud density [22]. Additionally, the limited knowledge of the optical properties of ears and flowers [20] means few studies include ears in their simulations.
This study aims to use the 3D radiative transfer model to control variables under relatively ideal conditions to analyze the influence of tassels on canopy reflectance and its potential mechanisms. Specifically, based on the 3D radiative transfer model verified by artificial tassel-cutting experiments, we focus on the following aspects: (1) quantifying the changes of tassel effects under different canopy characteristics; (2) the directional effect of the tassel on canopy reflectance was analyzed; (3) analyzing the mechanism of the effect of the tassel on canopy reflectance.
2. Materials and Methods
2.1. Study Area and Experimental Designs
The study area is located in Xiaotangshan National Agricultural Research Demonstration Base, Changping District, Beijing (40°10′60′′N, 116°26′30′′E, Figure 1). The average precipitation in this area is 508 mm, and the average annual temperature is 13 °C. The sowing date for the maize was 31 May 2023, with a planting density of 60,000 plants/hm2. The test site was selected in a uniform area of the field, with one 3.6 × 3.6 m plot of the same variety. Testing was conducted on 29 August 2023. At this time, the maize was in the early stage of grain filling, with fully developed leaves, and plants at their final height. The tassel structure was stable and light yellow, with only the bottom of the canopy showing slight signs of aging. To create a contrast condition for tassel change, artificial tassel cutting was performed on the same plot and during adjacent periods. The artificial tassel-cutting experiment refers to the removal of maize tassels in the experimental plot with scissors.
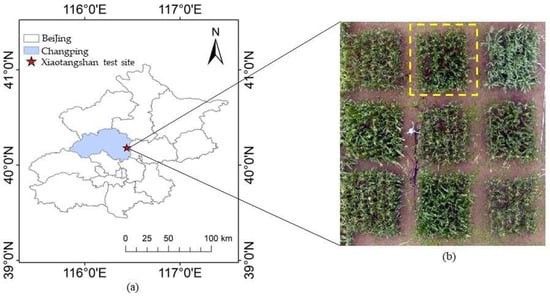
Figure 1.
Overview of the study area. (a) Location of the study area; (b) UAV image of the experimental spot.
2.2. Canopy Reflectance Observation
Canopy reflectance measurements were taken before and after the artificial tassel-cutting test, with data collected at 12:00 noon under sunny and windless conditions. Measurements were conducted using the DJI P4 Multispectral (Shenzhen Dajiang Innovation Technology Co., Ltd., Shenzhen, China) and the ASD FieldSpec 4 Hi-Res (Malvern Panalytical Co., Almelo, The Netherlands), a high-resolution spectral radiometer. Before each UAV flight, spectral reflectance correction board data were collected to calibrate the sensor, ensuring the correction board remained fixed during the test. The UAV was observed at an altitude of 10 m, approximately 8 m above the canopy. The entire experimental plot, in both tassel and non-tassel states, was observed twice. Two groups of images of the canopy with and without tassels were captured respectively, including blue band (center wavelength 450 nm), green band (center wavelength 560 nm), red band (center wavelength 650 nm), red edge band (center wavelength 730 nm), and near-infrared band (center wavelength 840 nm). After radiometric correction, the average reflectance of each band from the two sets of images was taken as the canopy reflectance value.
The ASD FieldSpec 4 Hi-Res covers a spectral range of 350–2500 nm. Before measuring canopy reflectance with the spectrometer, a white reference plate (reflectance 99%) was used to calibrate the radiometer’s dark current and system offset. Spectrometer measurements and UAV observations were conducted alternately. The spectrometer measured reflectance from 350–2500 nm at three points above the maize canopy before and after tassel cutting, with the average value taken as the canopy reflectance. The specific equipment and observation setup are shown in Figure 2.
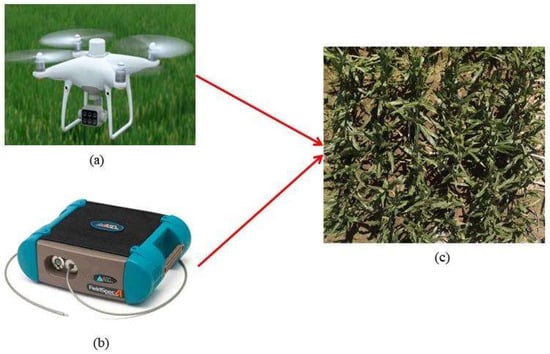
Figure 2.
Observation instrument and artificial tassel cutting test site. (a) DJI P4 Multispectral; (b) ASD FieldSpec 4 Hi-Res; (c) maize trial plot.
2.3. 3D Structure Reconstruction of Maize
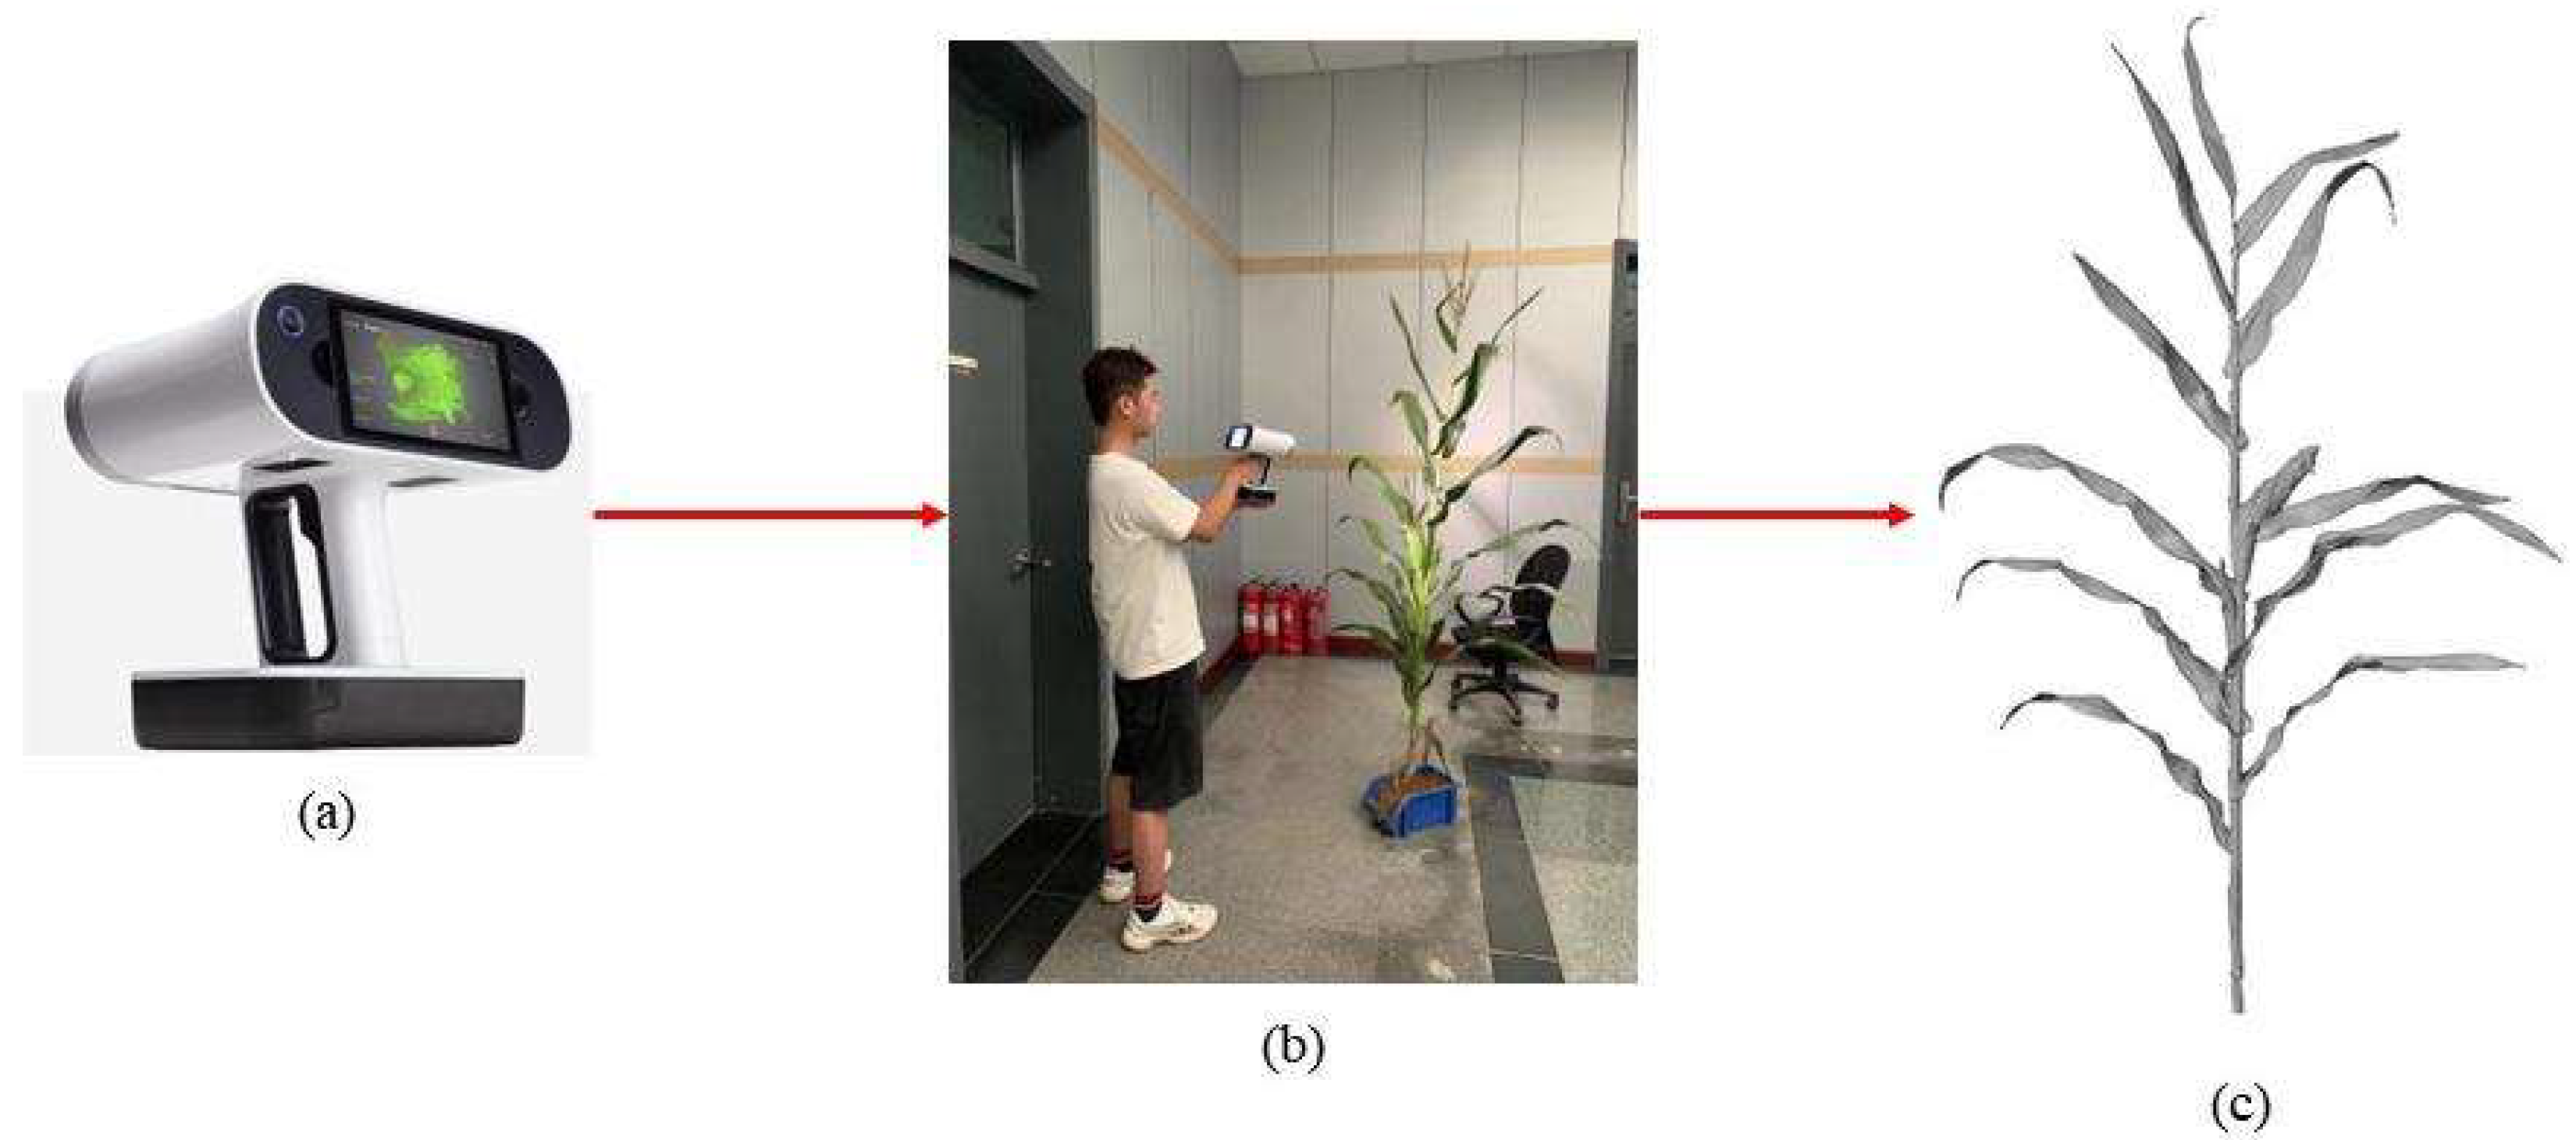
To establish a 3D scene corresponding to the actual maize canopy, the plants were divided into stems, leaves, and tassels to obtain the geometric structure. The 3D structure information of the stems and leaves was obtained using a handheld 3D scanner based on destructive sampling. Destructive sampling was conducted simultaneously with the plot test. Complete maize plants of the same and representative varieties as those in the test plot were selected. Destructive sampling was performed from their roots, and the sampled stems and leaves were then moved indoors. Finally, the Artec Leo handheld wireless 3D scanner (Artec3D Co., Luxemburg) was used for point cloud data collection. The working distance of Artec Leo is 0.35–1.2 m, with a data acquisition speed of 35 million points per second. The 3D point accuracy and resolution of the scanner are 0.1 mm and 0.2 mm, respectively. The specific equipment and data acquisition process are shown in Figure 3.

Figure 3.
Data acquisition process of maize stem and leaf structure. (a) Artec Leo Scanner; (b) indoor scanning; (c) 3D structure of maize.
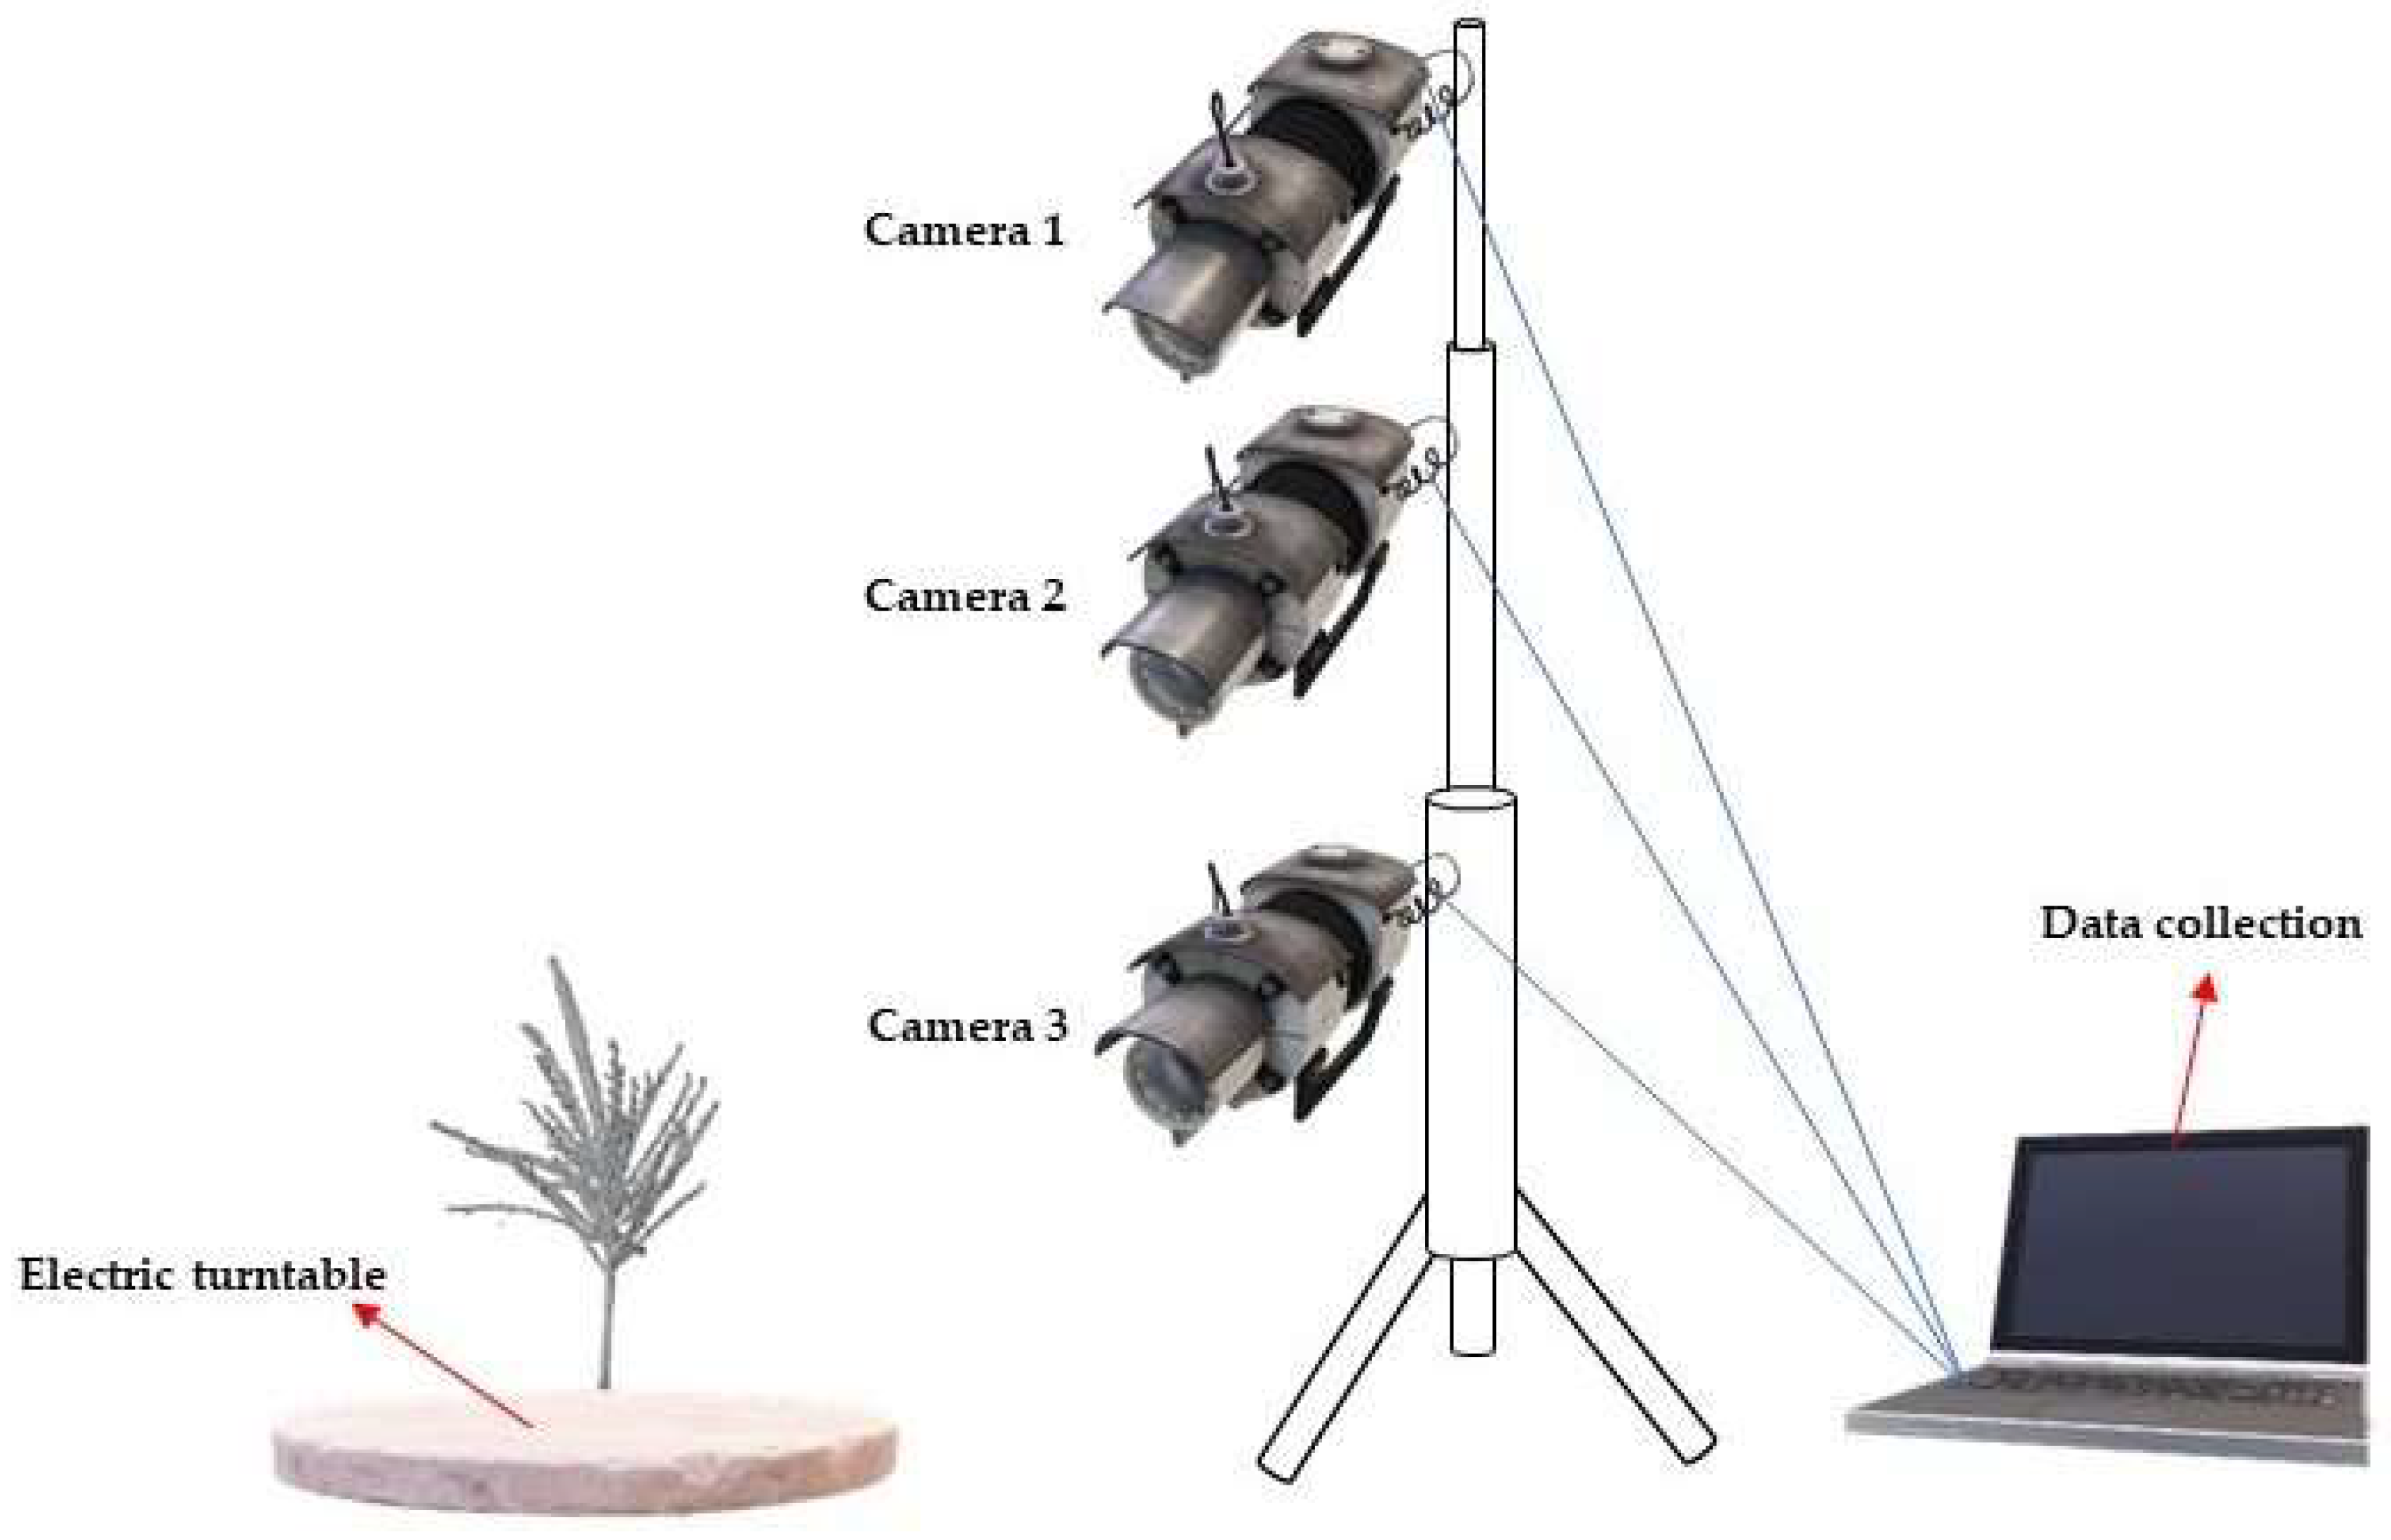
The maize tassel is primarily composed of a main axis and branches, with short-stalked tassel florets, similar in size to wheat grains, densely distributed on the main axis and branches. The 3D structure information of the maize tassel is obtained by the 3D phenotypic measurement system based on TreeQSM [22]. This system includes three digital cameras (Nikon D5600, Nikon Corporation, Chiyoda Prefecture, Tokyo, Japan), each with an effective resolution of 24.16 million pixels, equipped with an 18–140 mm f/3.5–5.6G ED VR lens that supports 16x zoom. These cameras are vertically arranged at different viewing angles. During the experiment, representative maize tassel samples were collected and placed on an electric turntable with a diameter of 64 cm. The turntable was set to rotate at 15° intervals, capturing multi-view images of the upper, middle, and lower layers of each tassel. The specific equipment diagram is shown in Figure 4.

Figure 4.
Schematic diagram of 3D phenotypic measurement system for maize tassel.
The Artec Studio 17 Professional tool (Artec3D Co., Luxemburg) was used to preprocess the collected maize stem and leaf point cloud data. First, obviously isolated point clouds were deleted, and then the Delaunay triangulation algorithm was used to generate the mesh model. Next, the open-source software Blender (V3.6.2, https://www.blender.org) was employed to repair the mesh model and remove redundant patches. Finally, the repaired model was exported to an OBJ format file required by the LESS model.
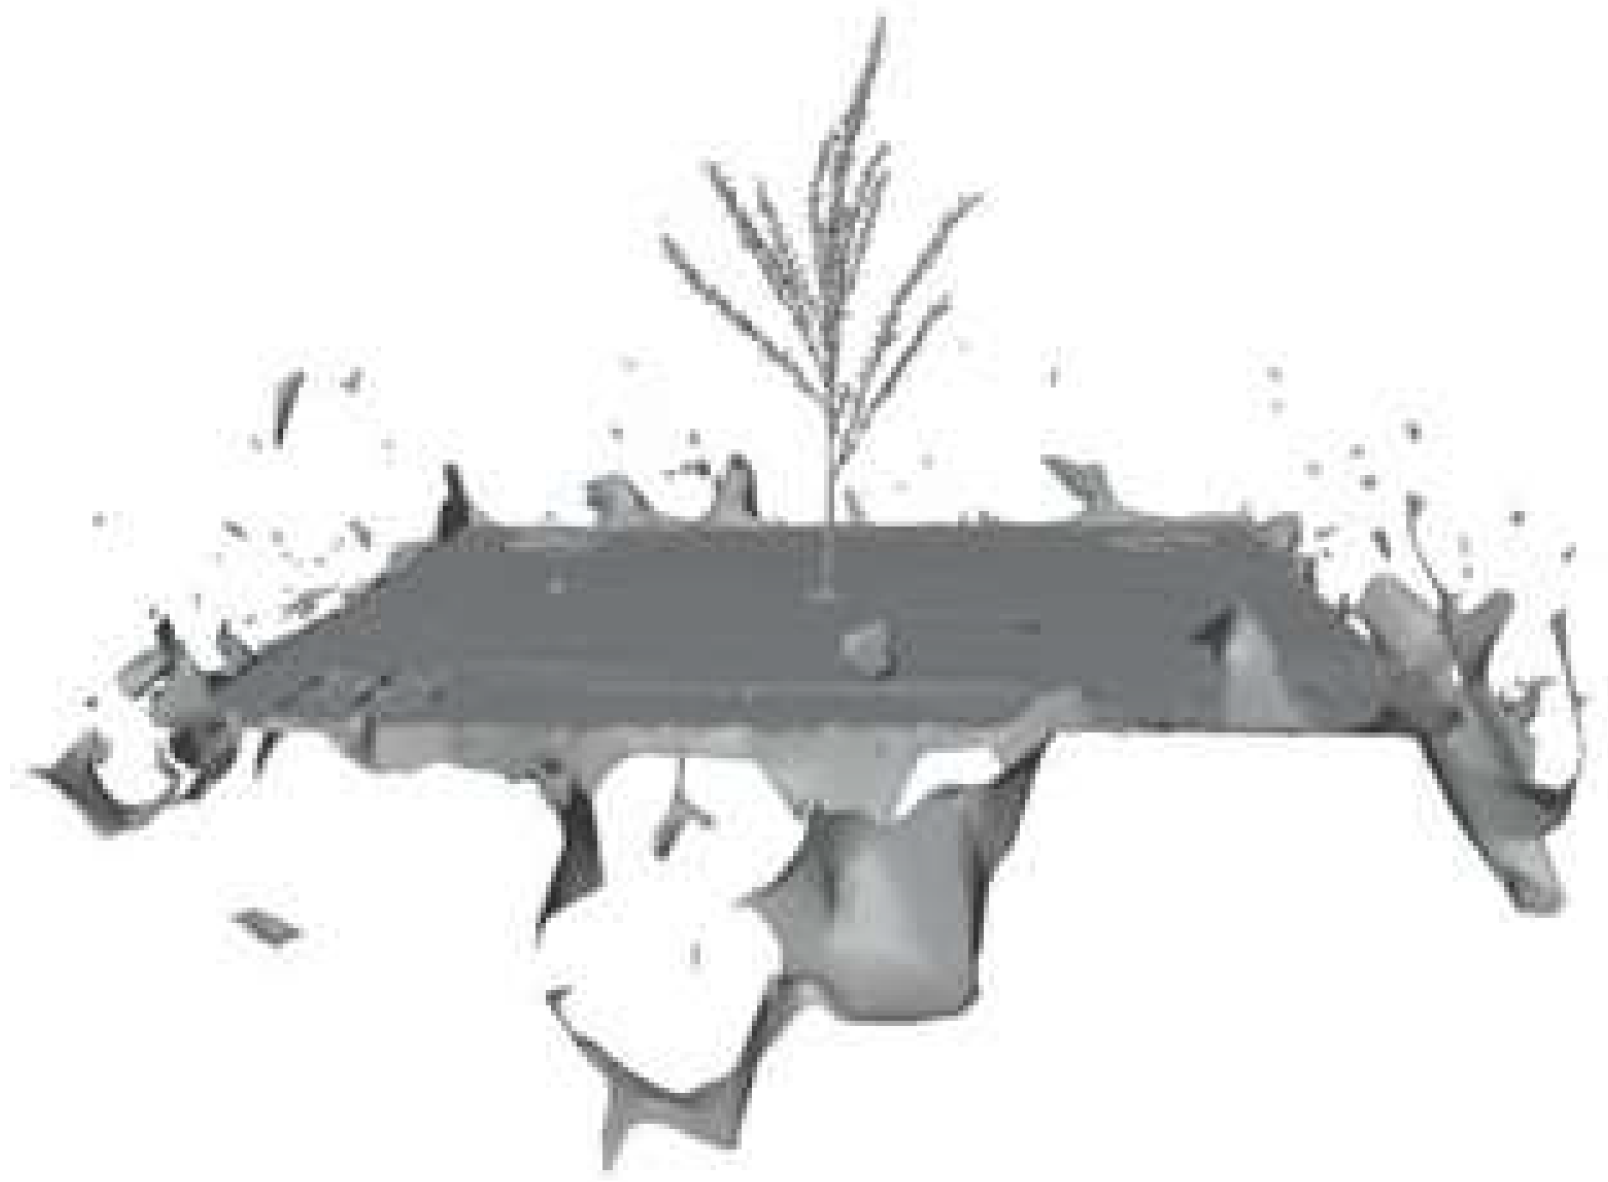
For the collected multi-angle images of maize tassels, the SFM algorithm was used to reconstruct 3D point clouds of the maize tassels. The DJI Terra tool (Shenzhen Dajiang Innovation Technology Co., Ltd., Shenzhen, China) was utilized for 3D point cloud data reconstruction. Since the reconstruction results contained calibration plates and noise (Figure 5), the open-source software Blender was used to remove non-tassel points for subsequent analysis. The specific method is to use the point, face, and edge selection modes provided by the blender software to select and delete.
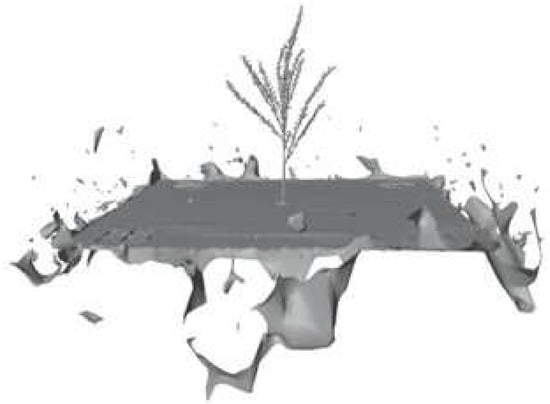
Figure 5.
3D reconstruction of maize tassel.
2.4. Spectral Measurement of Maize Tassel
During the experiment, tassels from the same variety of maize were destructively sampled at different growth stages. The spectral reflectance of the samples, ranging from 350 to 2500 nm, was measured using the ASD FieldSpec 4 Hi-Res. The tassels were placed horizontally on a black background, and the spectrometer’s fiber was fixed vertically downward on a tripod under a clear sky, ensuring that only the tassels were within the 25° field of view. The specific observation setup is shown in Figure 6. Finally, the average reflectance of the maize tassels under sunlight was calculated using ViewSpecPro software (V6.20, Malvern Panalytical Co., Almelo, The Netherlands).
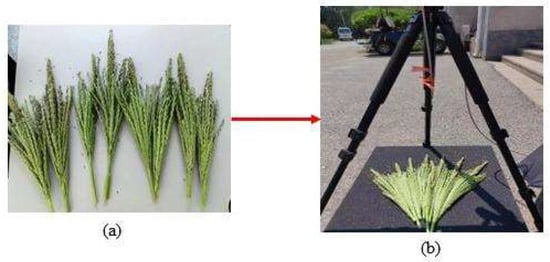
Figure 6.
Maize tassel reflectance measurement process. (a) Maize tassels at different growth stages; (b) measurement scenarios.
2.5. LESS Model Simulated Canopy Reflectance
The LESS model is a 3D real canopy radiative transfer model based on ray tracing. Compared with the traditional 1D radiative transfer model, the LESS model can integrate the actual structure of the canopy and simulate the canopy reflectance of vegetation in the spectral range of 400–2500 nm. The model has been validated with field measurements and reference simulations provided by the RAdiation transfer Model Intercomparison (RAMI) initiative [23], showing accurate and reliable results. Compared with other existing 3D radiative transfer models, the LESS model can easily modify the assumptions about vegetation canopy and optical properties. The simplicity of the graphical user interface and the batch processing function make the model more widely used. The most important thing is that the simulation efficiency of the LESS model is high, and different simulation strategies are adopted for different simulation data. These capabilities enable the quantitative analysis of the impact of the tassel’s geometric structure and optical properties on the canopy spectrum of maize under ideal conditions. The main operations of the LESS model include inputting the 3D structure and spectral parameters of maize plants through its graphical user interface, constructing a typical 3D scene for comparative analysis, setting different sun angles and sensor observation angles (Table 1), and finally simulating and calculating the canopy reflectance of the corresponding 3D scene.

Table 1.
Input parameters of LESS model. The canopy reflectance of maize with different structures, component spectra, and observation conditions was simulated to facilitate further analysis of the effect of tassel on canopy reflectance.
3. Results
3.1. Consistency Analysis of Canopy Simulation and Measured Spectrum
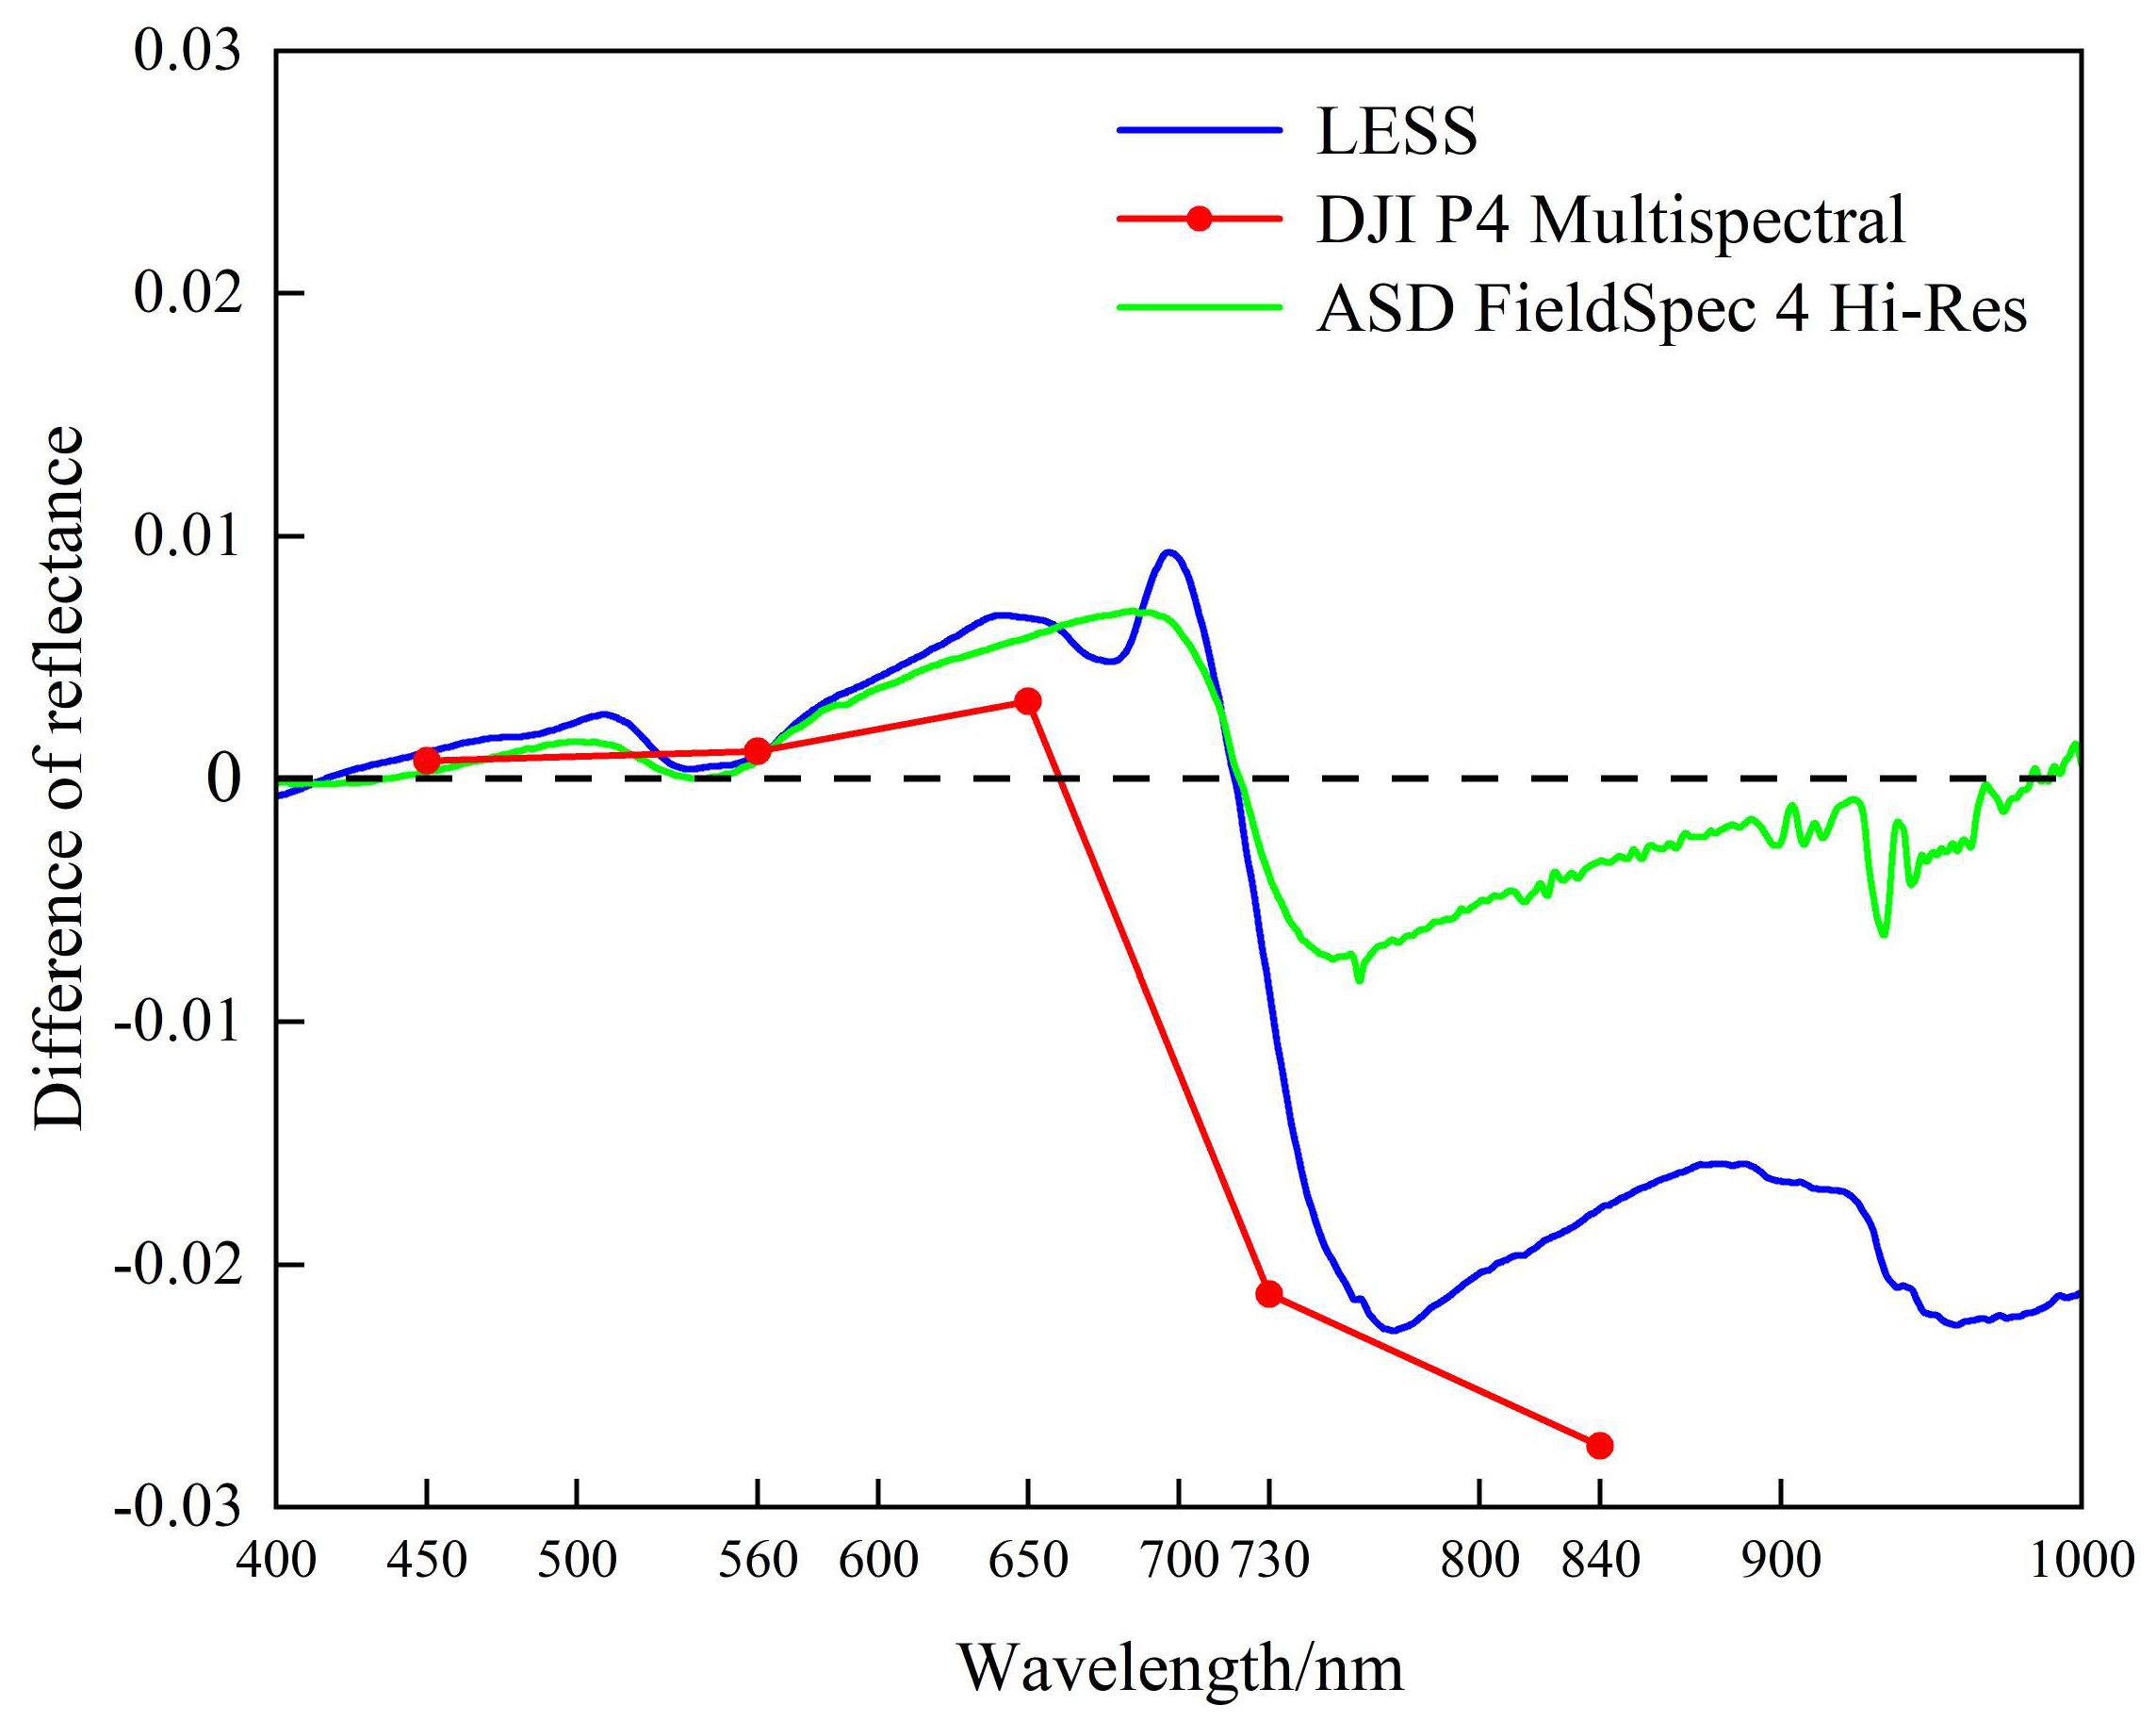
Before quantifying the effect of maize tassel on canopy reflectance, the consistency between the measured values from maize tassel cutting experiments in visible and near-infrared bands (400–1000 nm) and the simulated values from LESS was first verified. We compared the difference in canopy reflectance between the with-tassel and without-tassel conditions, as observed by the ASD FieldSpec 4 Hi-Res and the UAV, with the simulated values, and the results are shown in Figure 7. Figure 7 shows that the variation trend of the measured differences from the ASD FieldSpec 4 Hi-Res is consistent with the simulated values. Notably, the peak increase in reflectance in the visible band in the simulated values and the valley decrease in reflectance in the near-infrared band show a backward shift compared to the measured values. This shift may be due to differences between the reconstructed 3D scene and the actual test scene. For the UAV-measured values, the variation trend of the reflectance difference in a single band aligns with the measured values from the ASD FieldSpec 4 Hi-Res and the simulated values from the LESS model. However, there is a significant difference in the absolute values of the measured reflectance from the UAV and the ASD FieldSpec 4 Hi-Res in the near-infrared band. This discrepancy may be due to differences in spectral resolution between the non-imaging spectrometer and the imaging spectrometer used to acquire the spectral data of the ground objects. Compared with the design of an artificial tassel-cutting experiment to obtain the measured data for analysis, the use of the LESS model to analyze the effect of the tassel on canopy reflectance is non-destructive and controllable. At the same time, the LESS model can be used to analyze the influence of tassels on canopy reflectance in a more detailed and complete way in a relatively ideal environment. Therefore, we explain the effect of maize tassels on canopy reflectance based on the LESS model.
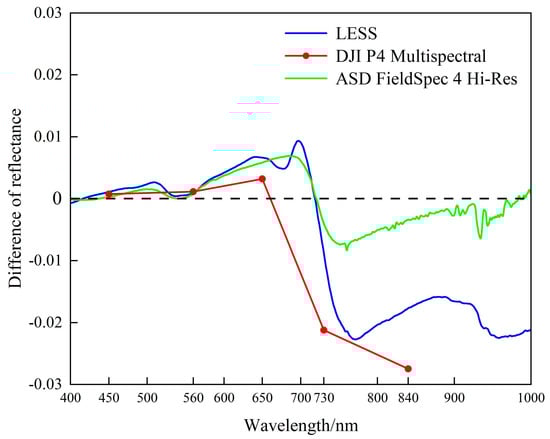
Figure 7.
Comparison of measured and simulated values of canopy reflectance in tassel cutting experiment. In this figure, the vertical axis label Difference of reflectance represents the reflectance difference between the with and without tassel canopy (same as below).
3.2. Differences in the Effects of Different Tassels on Canopy Reflectance
3.2.1. Tassel Structure
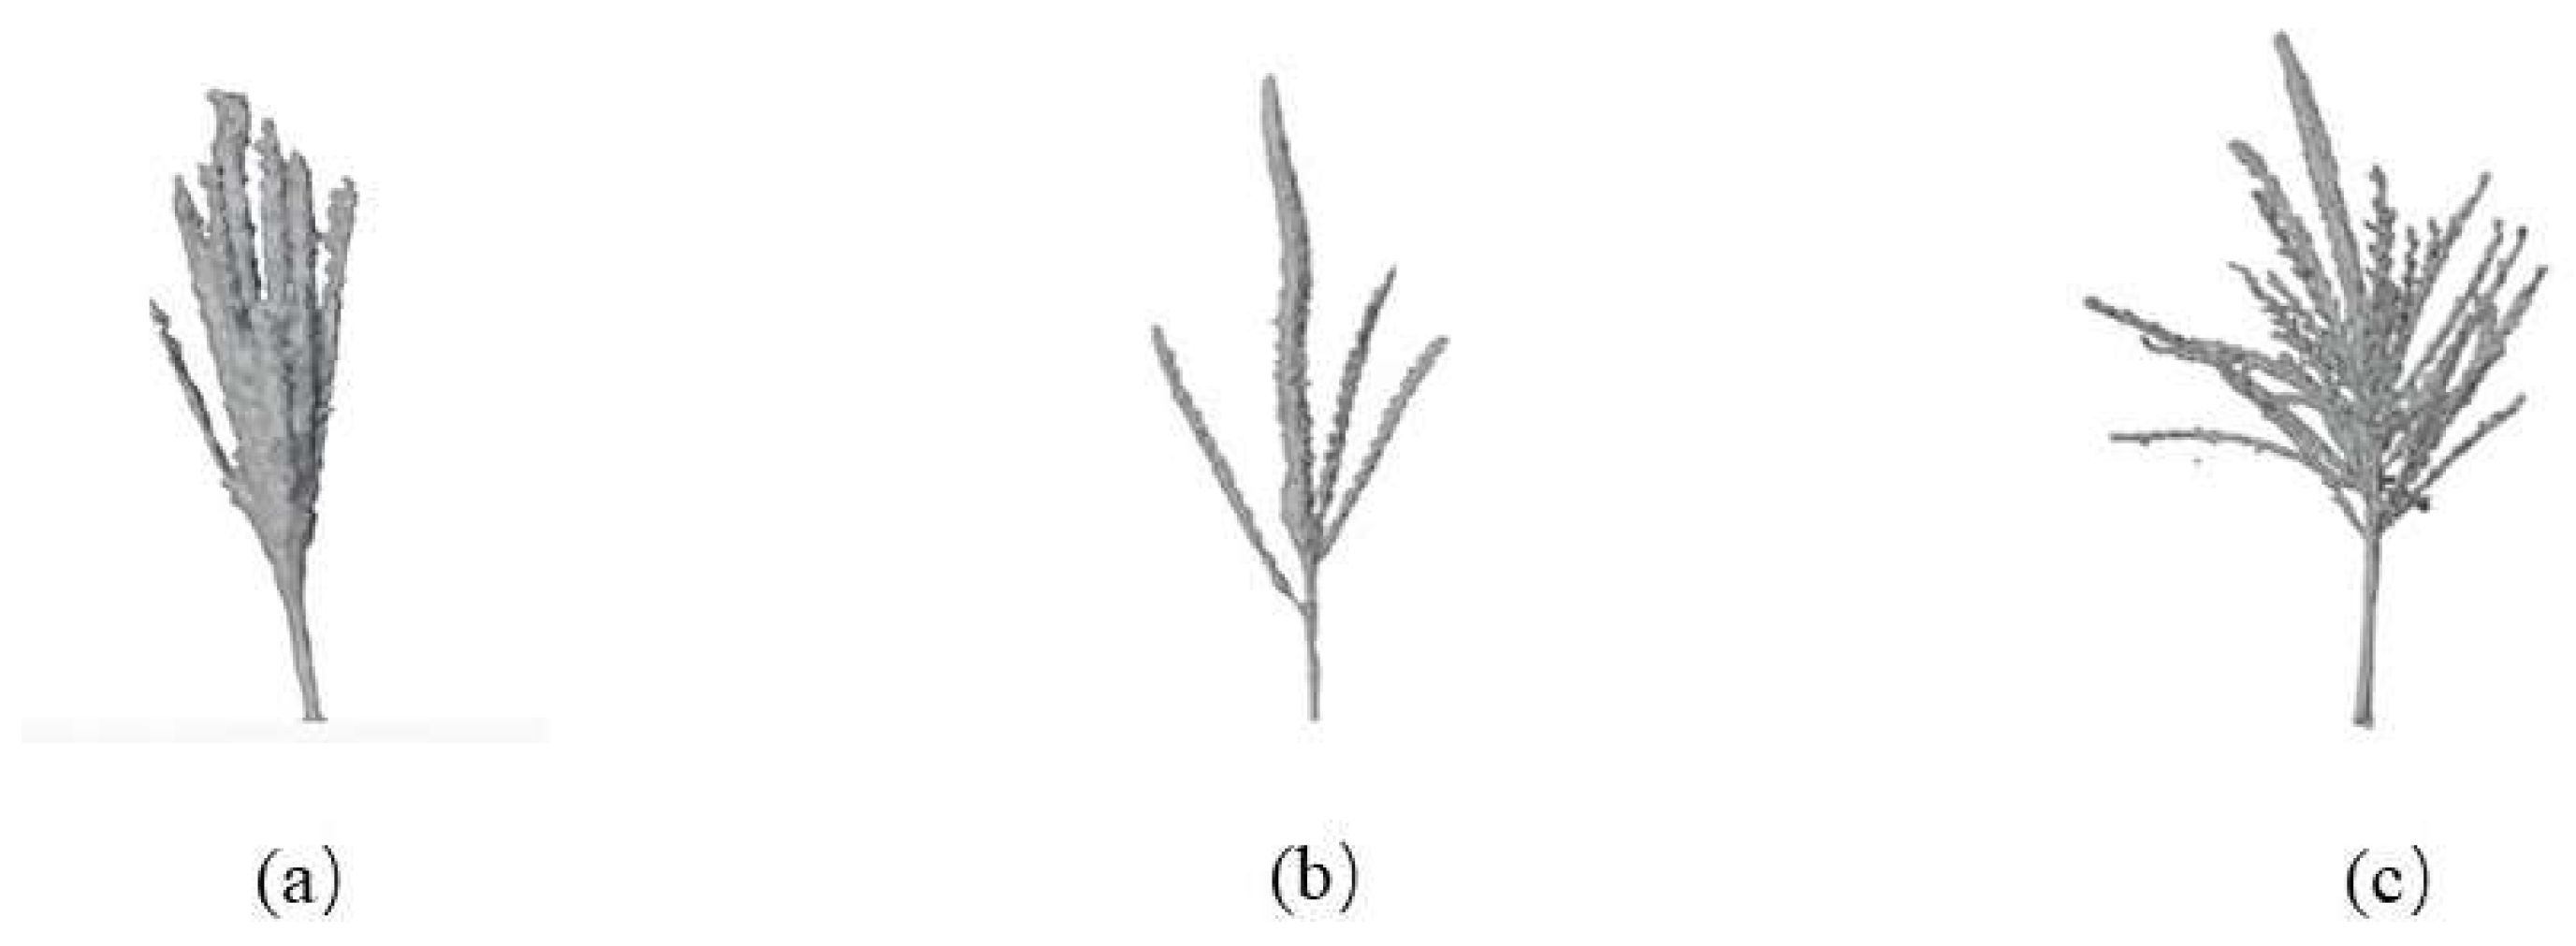
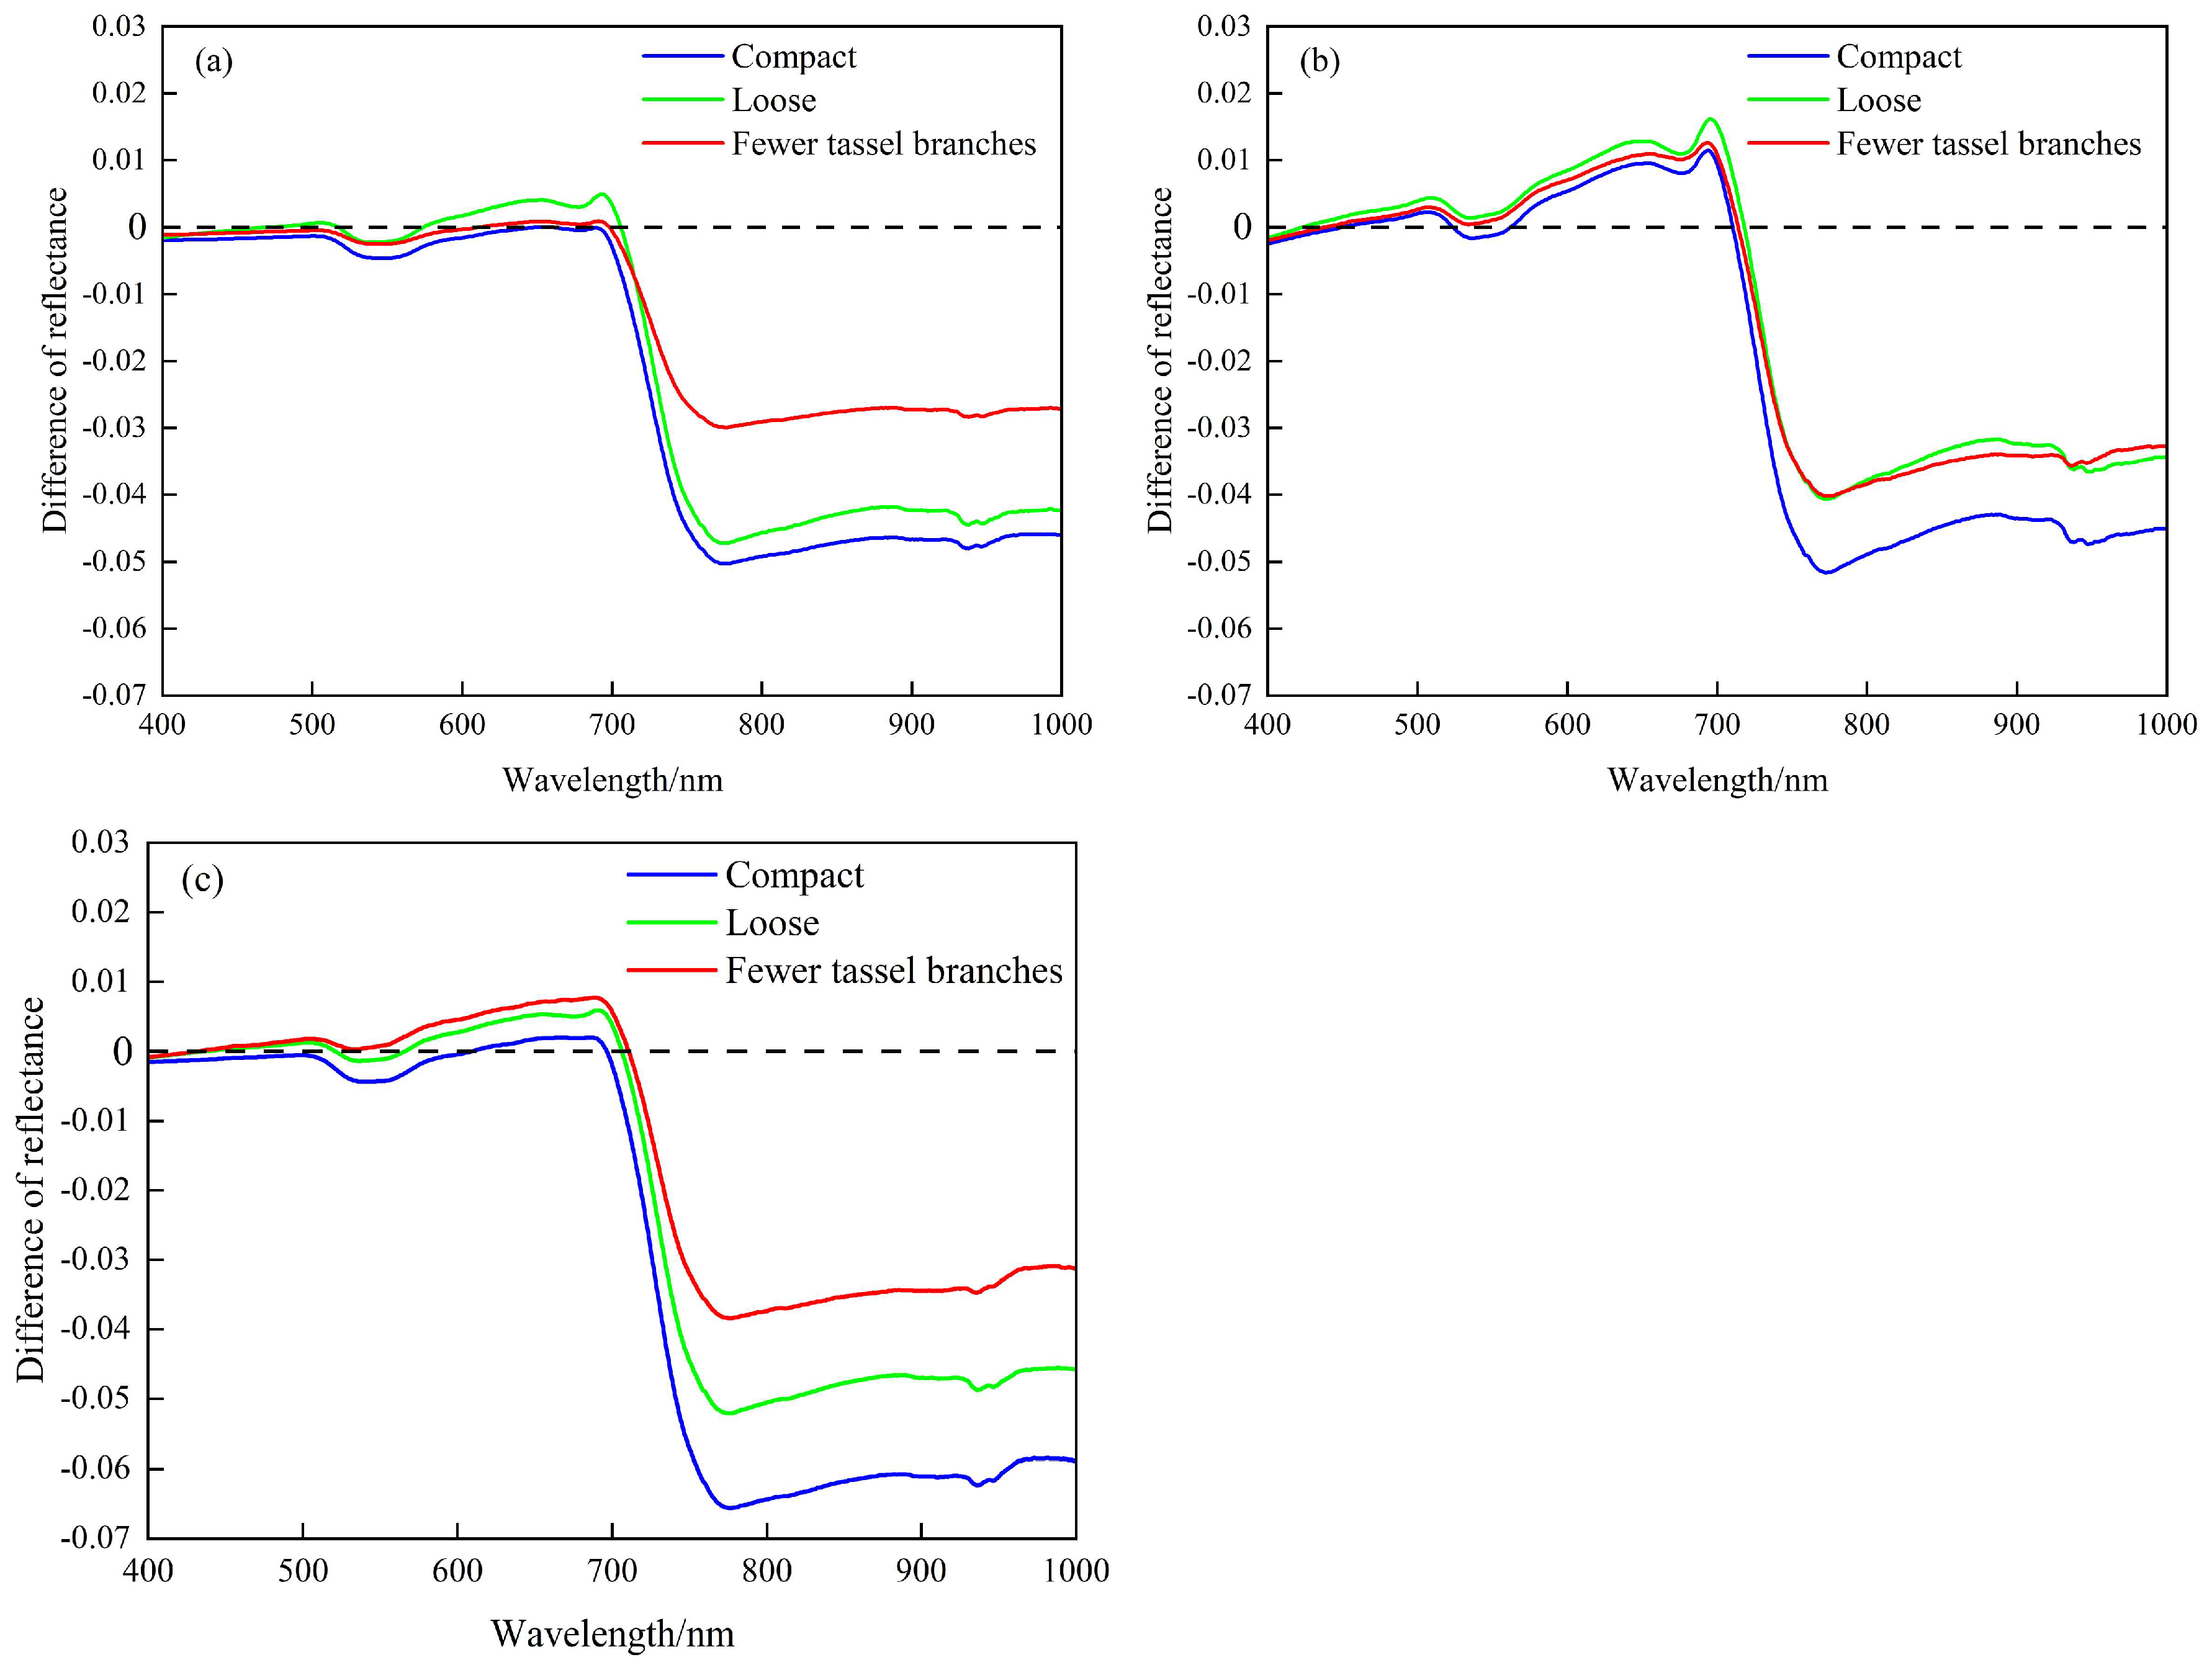
The 3D structure of maize tassels is a critical physical factor that influences light propagation within the canopy. In the LESS model, the structure of maize tassels was altered (Figure 8), and the effects of three representative tassel structures on canopy reflectance were analyzed (Figure 9). In the vertical observation and hotspot directions (The observation direction is the same as the incidence of solar light), compact tassels had a greater reducing effect on near-infrared reflectance compared to loose tassels and those with fewer branches. Conversely, loose tassels enhanced visible reflectance more effectively than the other two types of tassels. In the dark spot direction (The observation direction is opposite to the incidence of solar light), the three tassel structures had the opposite effect: they increased reflectance in the visible band while decreasing it in the near-infrared band.
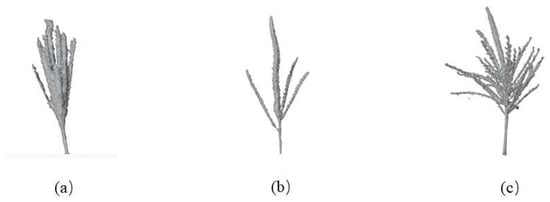
Figure 8.
3D reconstruction results of maize tassel. (a) Compact type; (b) fewer tassel branches type; (c) loose type.
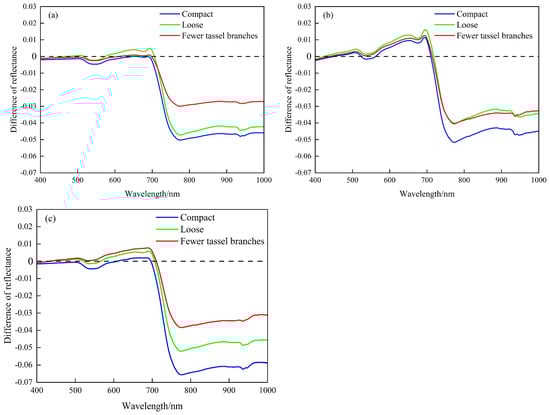
Figure 9.
Canopy reflectance difference caused by different tassel structures. (a) Vertical observation; (b) hotspot direction; (c) dark spot direction.
3.2.2. Tassel Spectrum
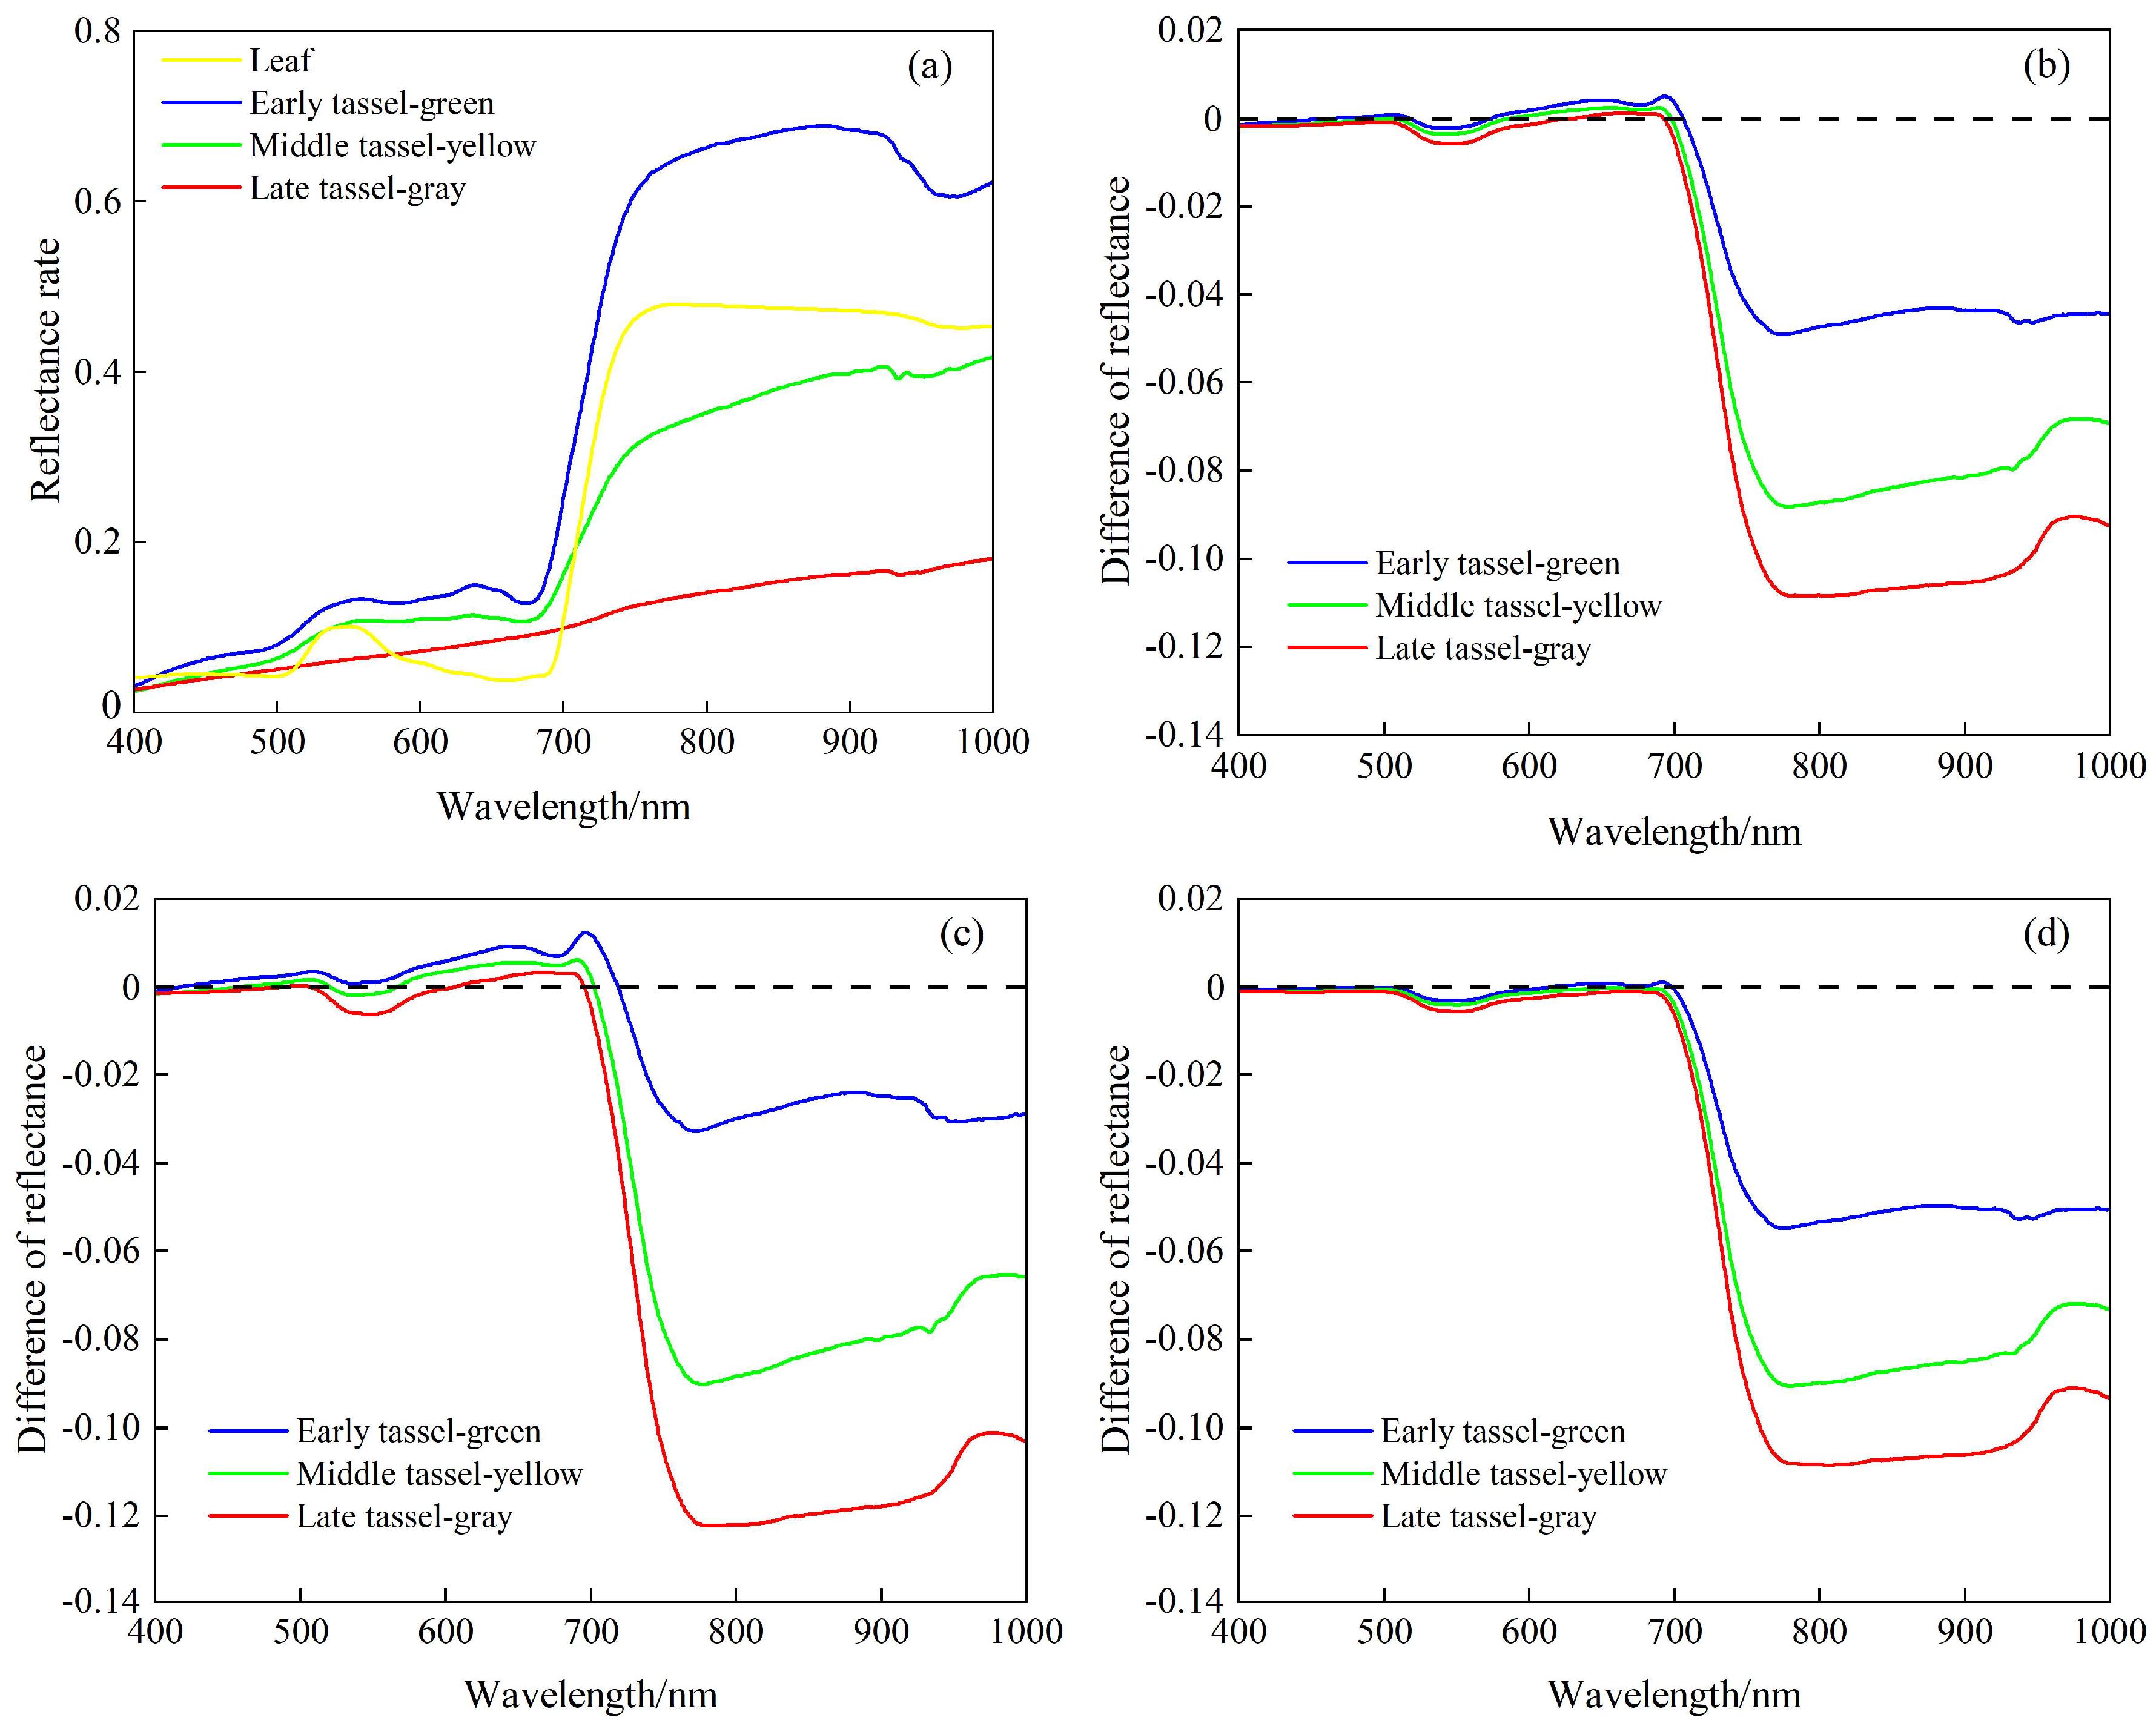
The 3D structure of maize tassels stabilizes after the middle stage of tasseling, but their color gradually changes from green to yellow. Based on the measured spectral data of tassels at different growth stages (Figure 10a), the spectral attributes of maize tassels were adjusted in the LESS model, and the resulting changes in canopy reflectance were obtained, as shown in Figure 10. In all simulated observation directions, the difference in canopy reflectance caused by tassels at different growth stages was similar. As the tassels’ color changed from green to gray, their effect on increasing visible band reflectance weakened, while their effect on decreasing near-infrared reflectance strengthened.
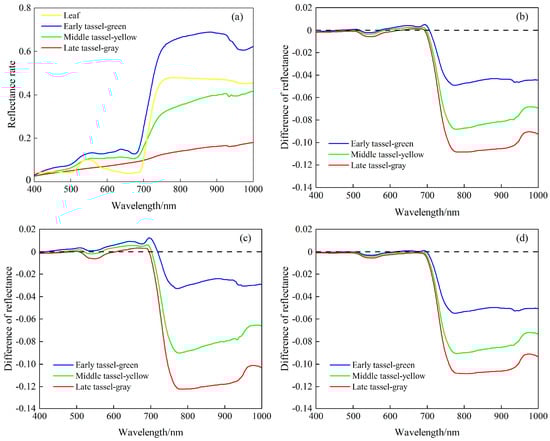
Figure 10.
Canopy reflectance difference caused by tassels at different growth stages. (a) Input spectra of the LESS model; (b) vertical observation; (c) hotspot direction; (d) dark spot direction.
3.3. The Effect of Tassel on Canopy Reflectance in Different 3D Scenes
3.3.1. Different Planting Density
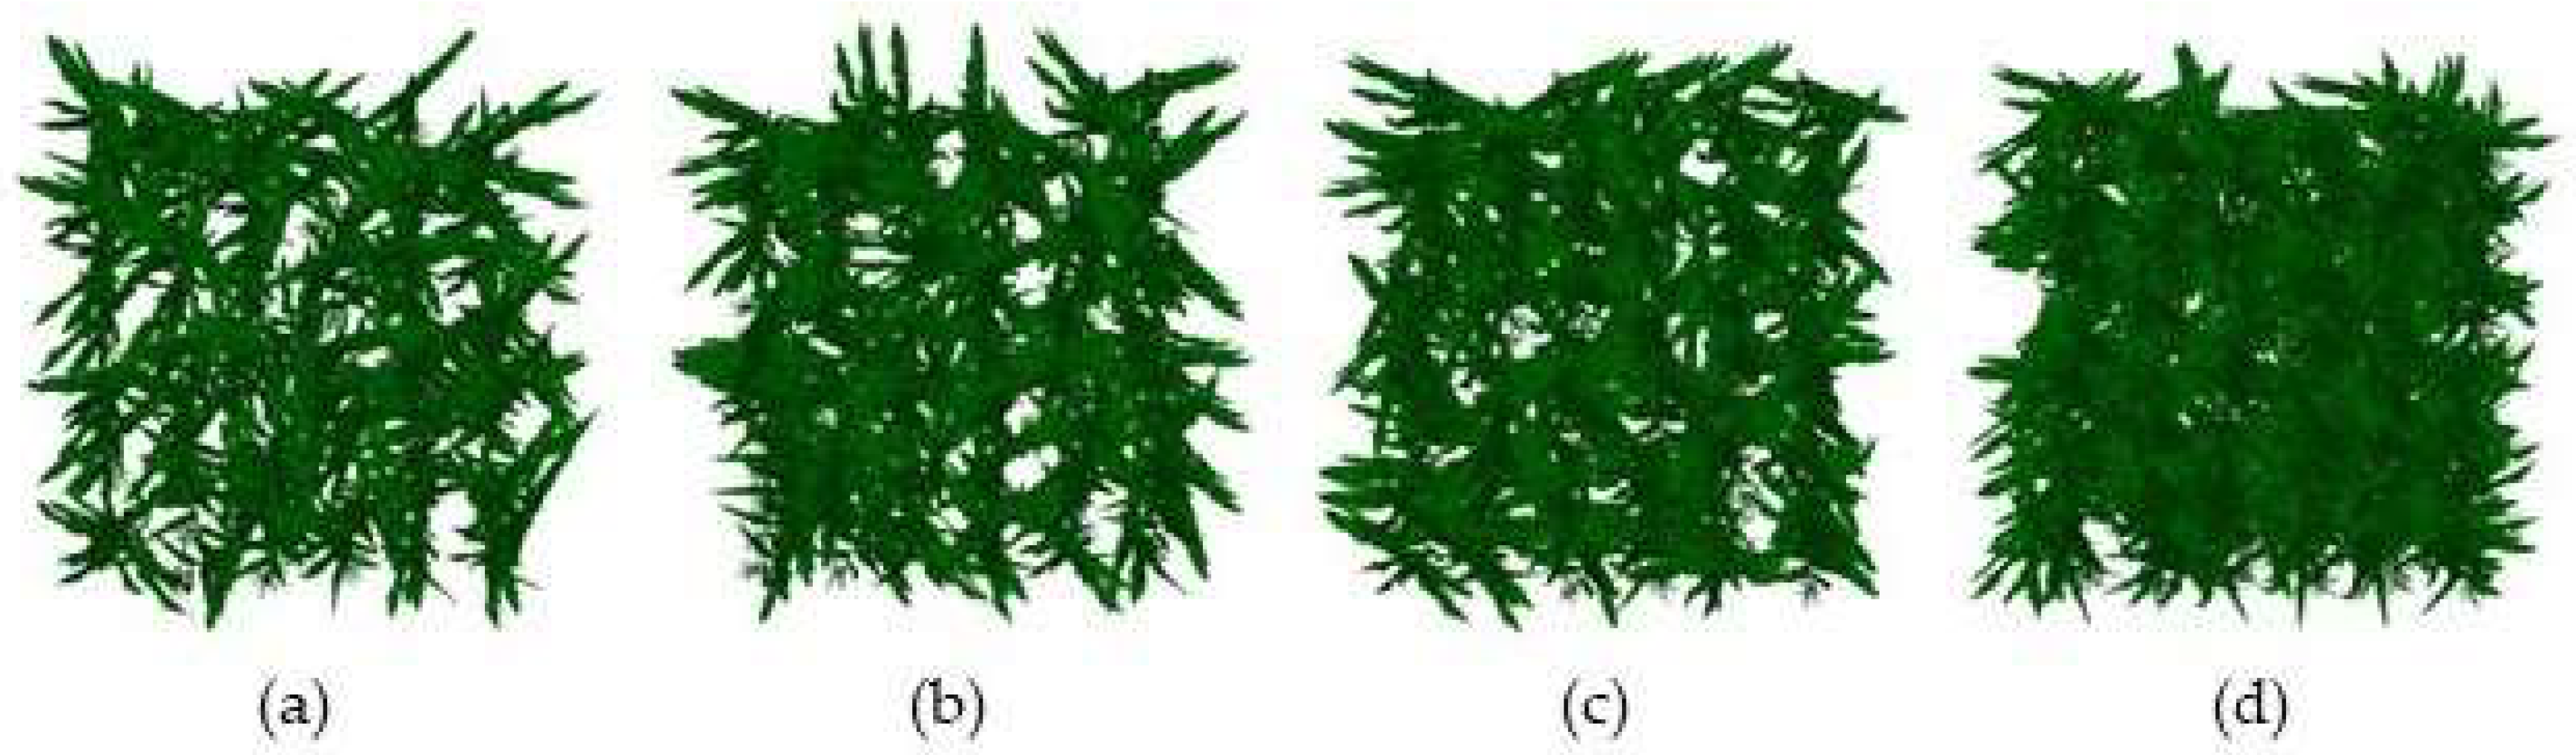
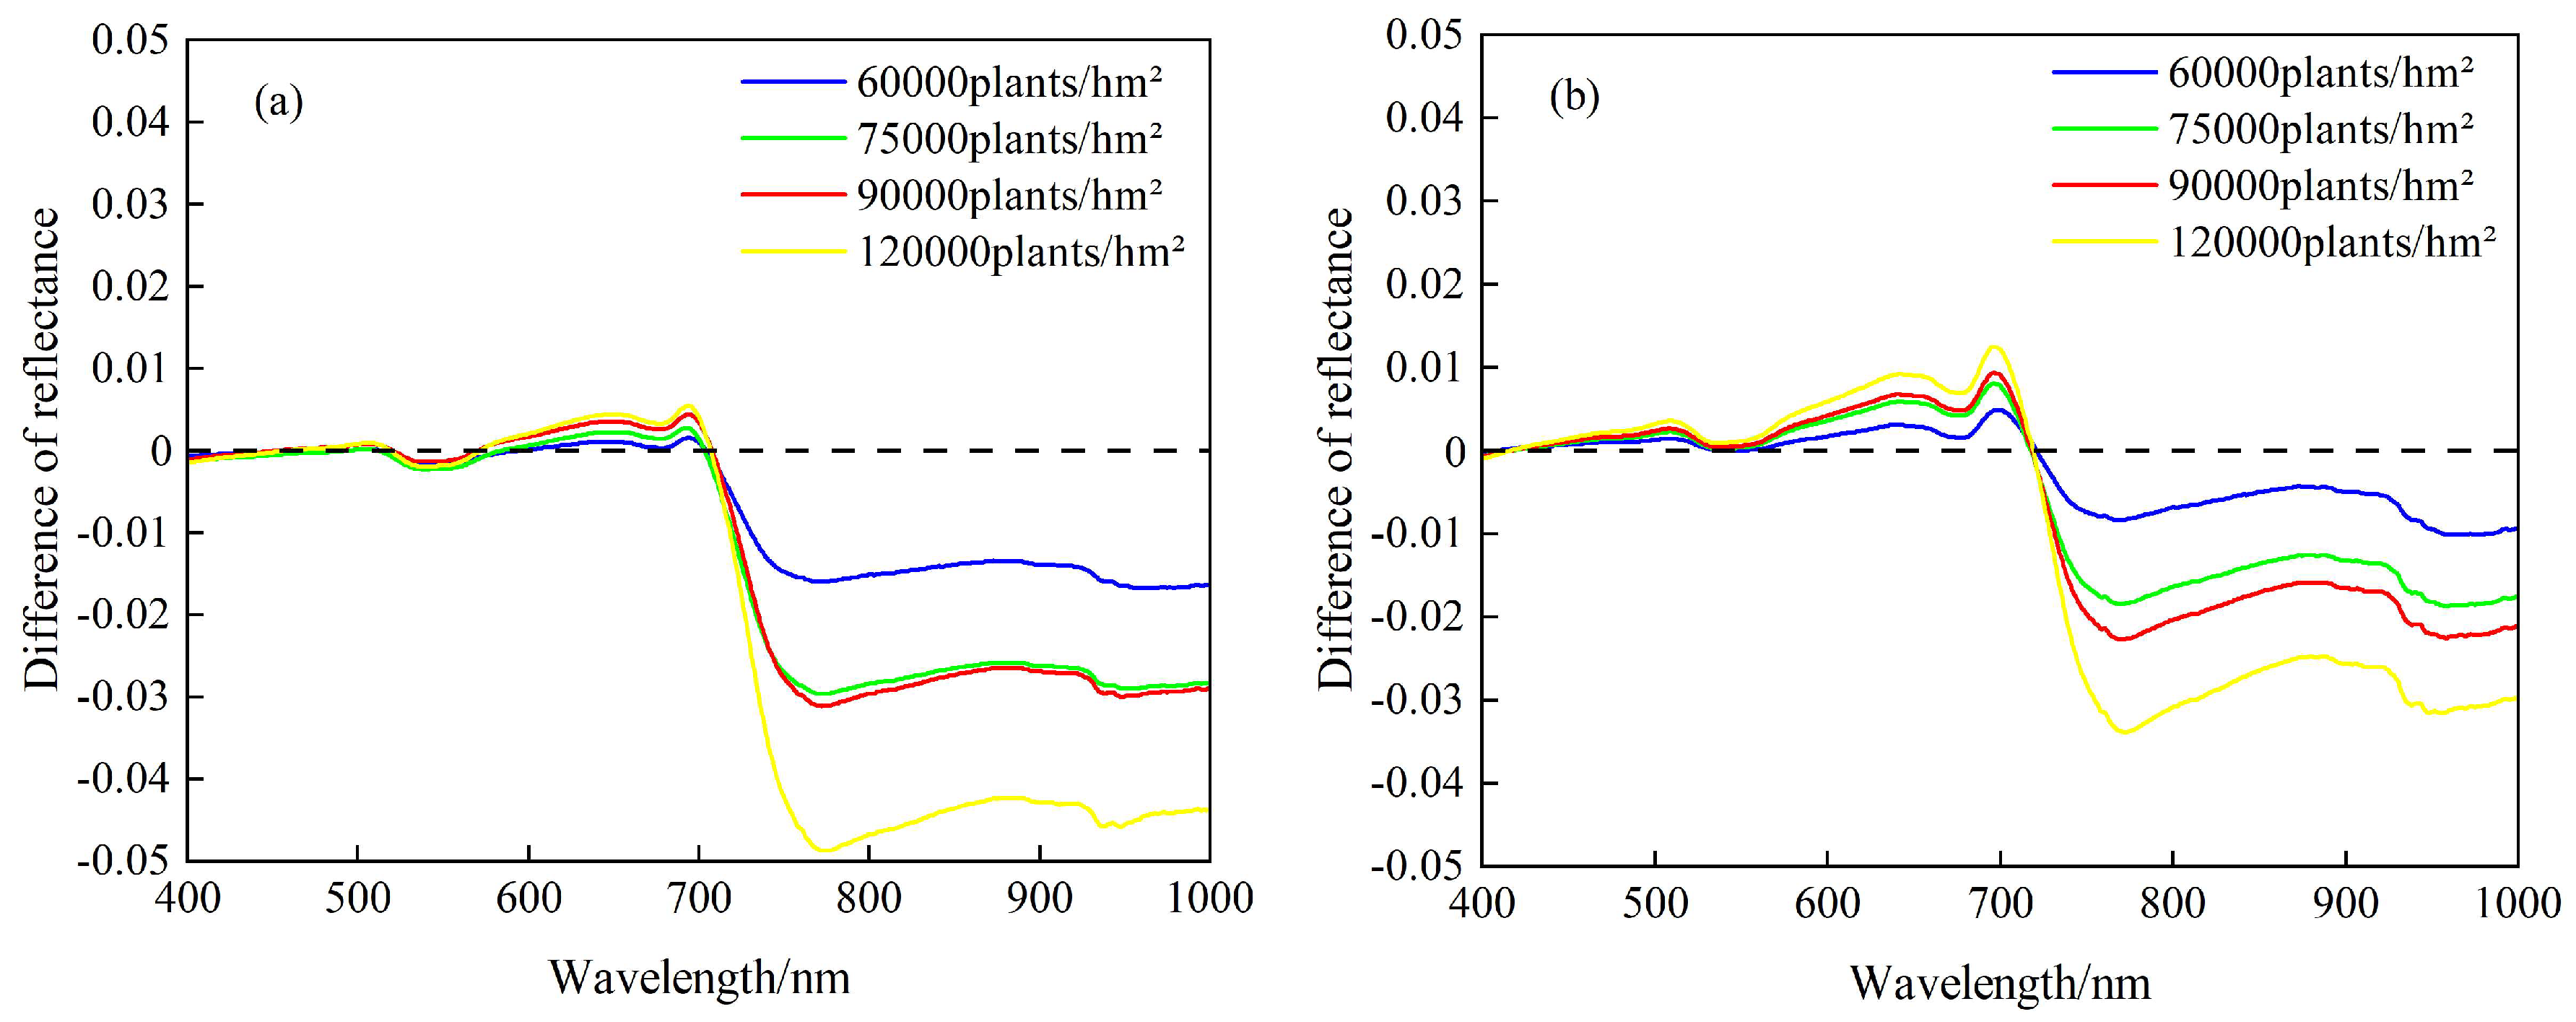
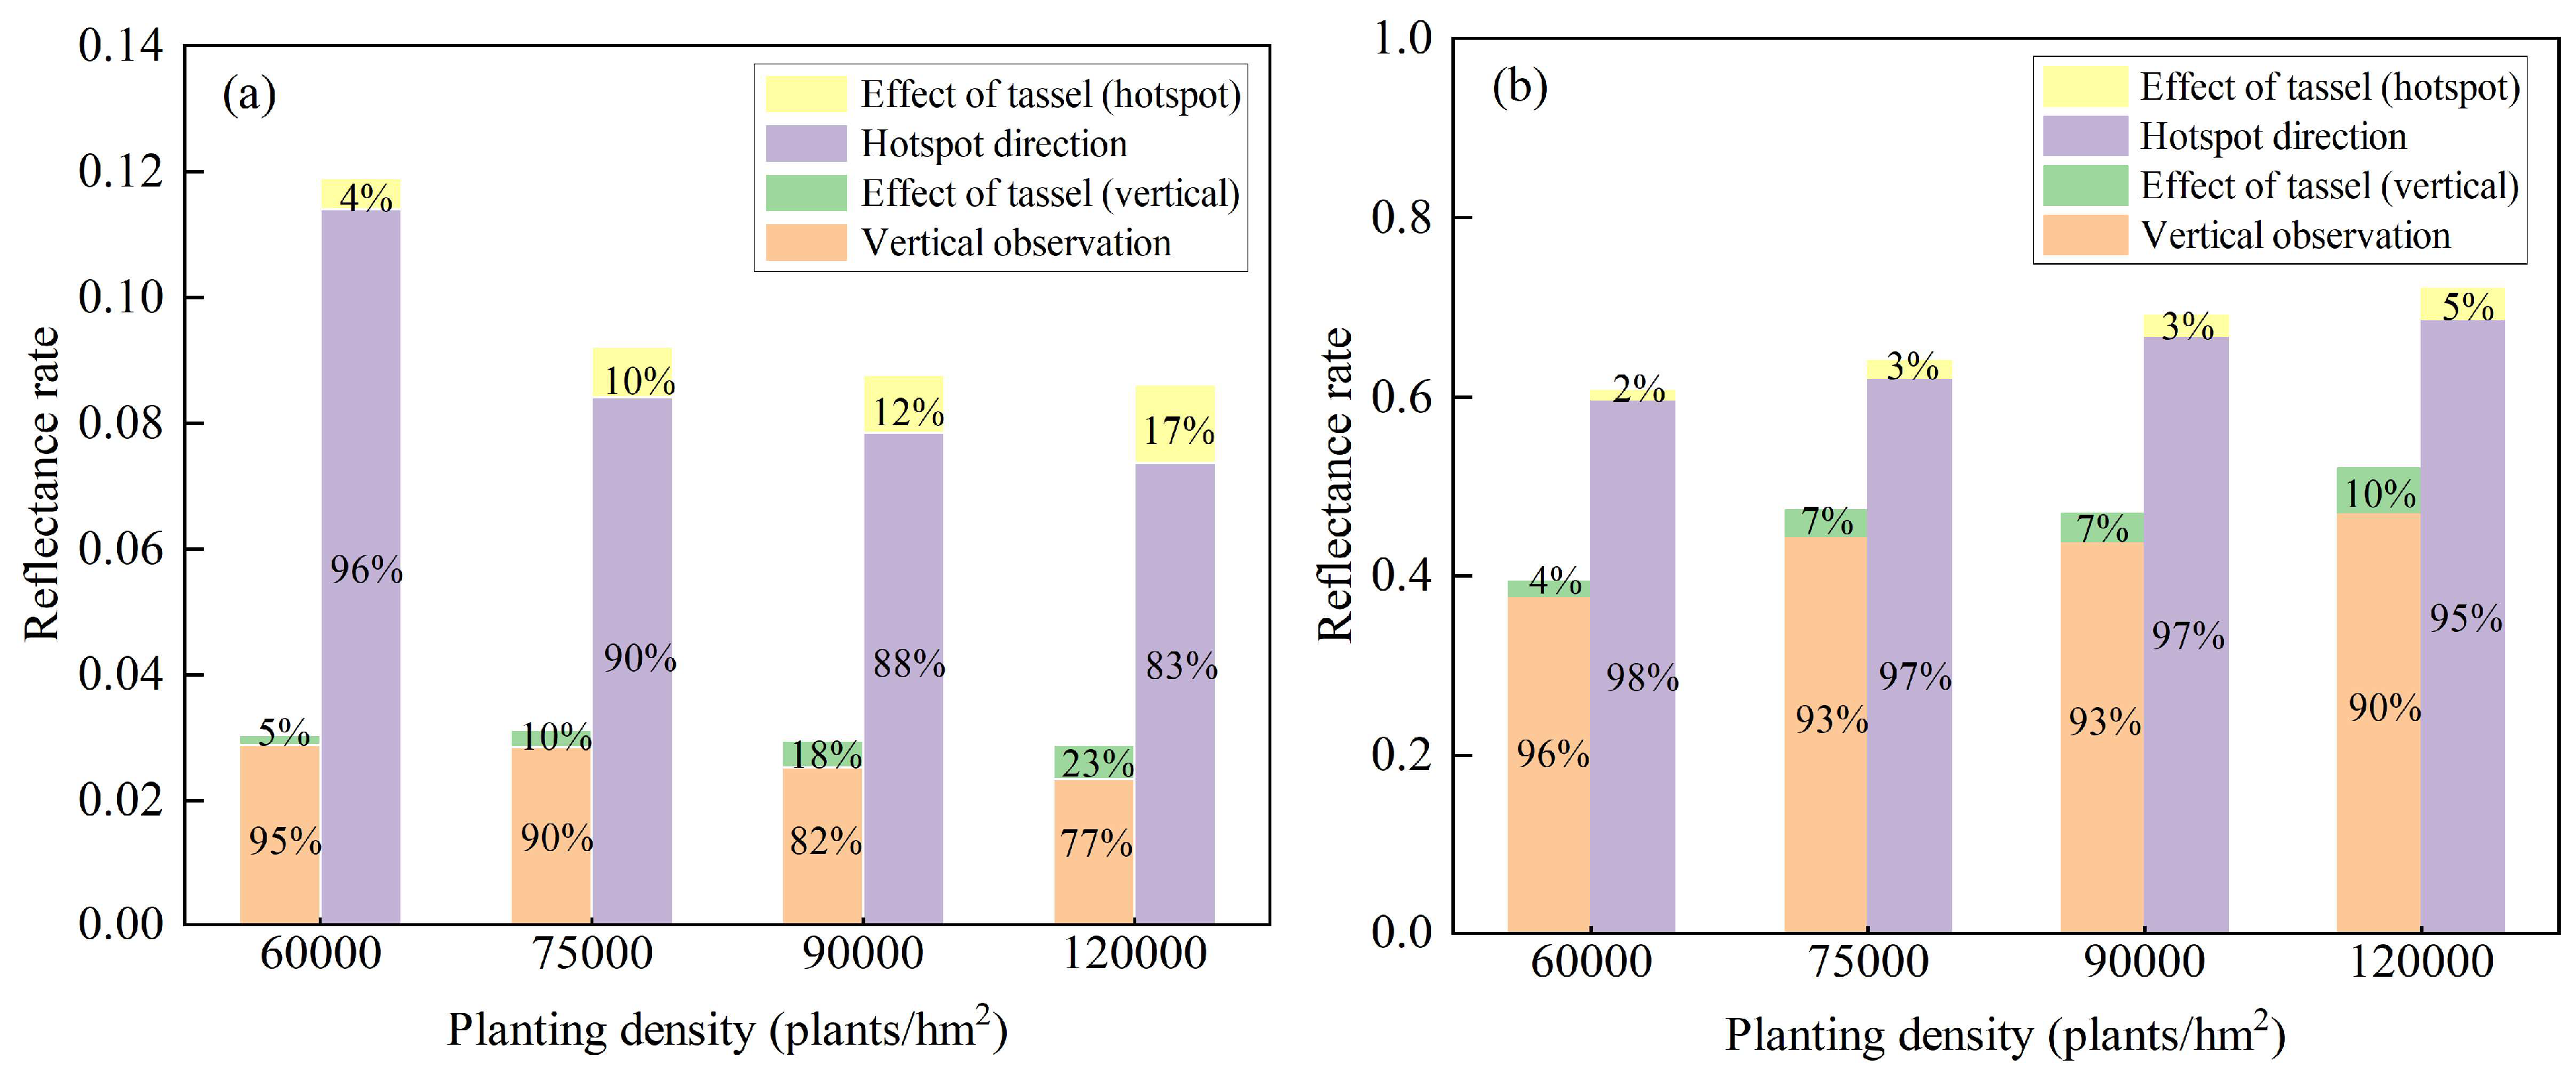
Planting density is a fundamental factor in constructing a 3D maize scene, significantly affecting maize canopy structure. To analyze how different planting densities influence the impact of maize tassels on canopy reflectance, four 3D scenes with varying planting densities were constructed using the LESS model. The top–down view of the 3D scene is shown in Figure 11. The simulation considered the difference in canopy reflectance between tassel and non-tassel conditions in the vertical observation and hotspot directions. The results, shown in Figure 12, indicate that the absolute effect of maize tassels on canopy reflectance is relatively small. The range of variation in the visible region is −0.002–0.012, and the range of variation in the near-infrared region is −0.049–0. For the same planting density, the absolute reflectance difference in the visible band is smaller in the vertical observation direction than in the hotspot direction, whereas in the near-infrared band, the opposite is true. In the 3D scenes with different planting densities, the percentage of maximum effect of tassels on canopy reflectance in the visible band was from 4% to 23%, while the percentage of effect on the near-infrared band from 2% to 10% (Figure 13). Overall, maize tassels increase reflectance in the visible band and decrease it in the near-infrared band, with higher planting density amplifying these effects.
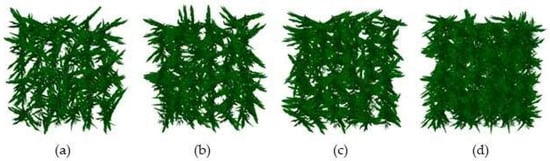
Figure 11.
3D scene top view of different planting densities. (a) 60,000 plants/hm2; (b) 75,000 plants/hm2; (c) 90,000 plants/hm2; (d) 120,000 plants/hm2.
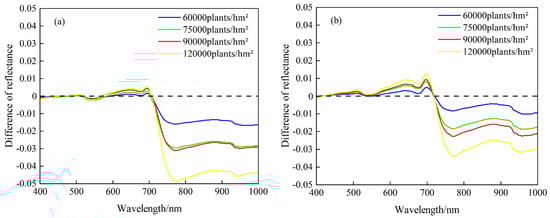
Figure 12.
The reflectance difference between the with and without tassel canopy under different planting densities. (a) Vertical observation; (b) hotspot direction.
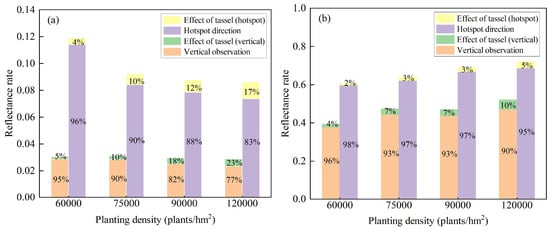
Figure 13.
The difference of maximum tassel effect under different planting densities. (a) Visible band; (b) near-infrared band.
3.3.2. Different Leaf Area Index
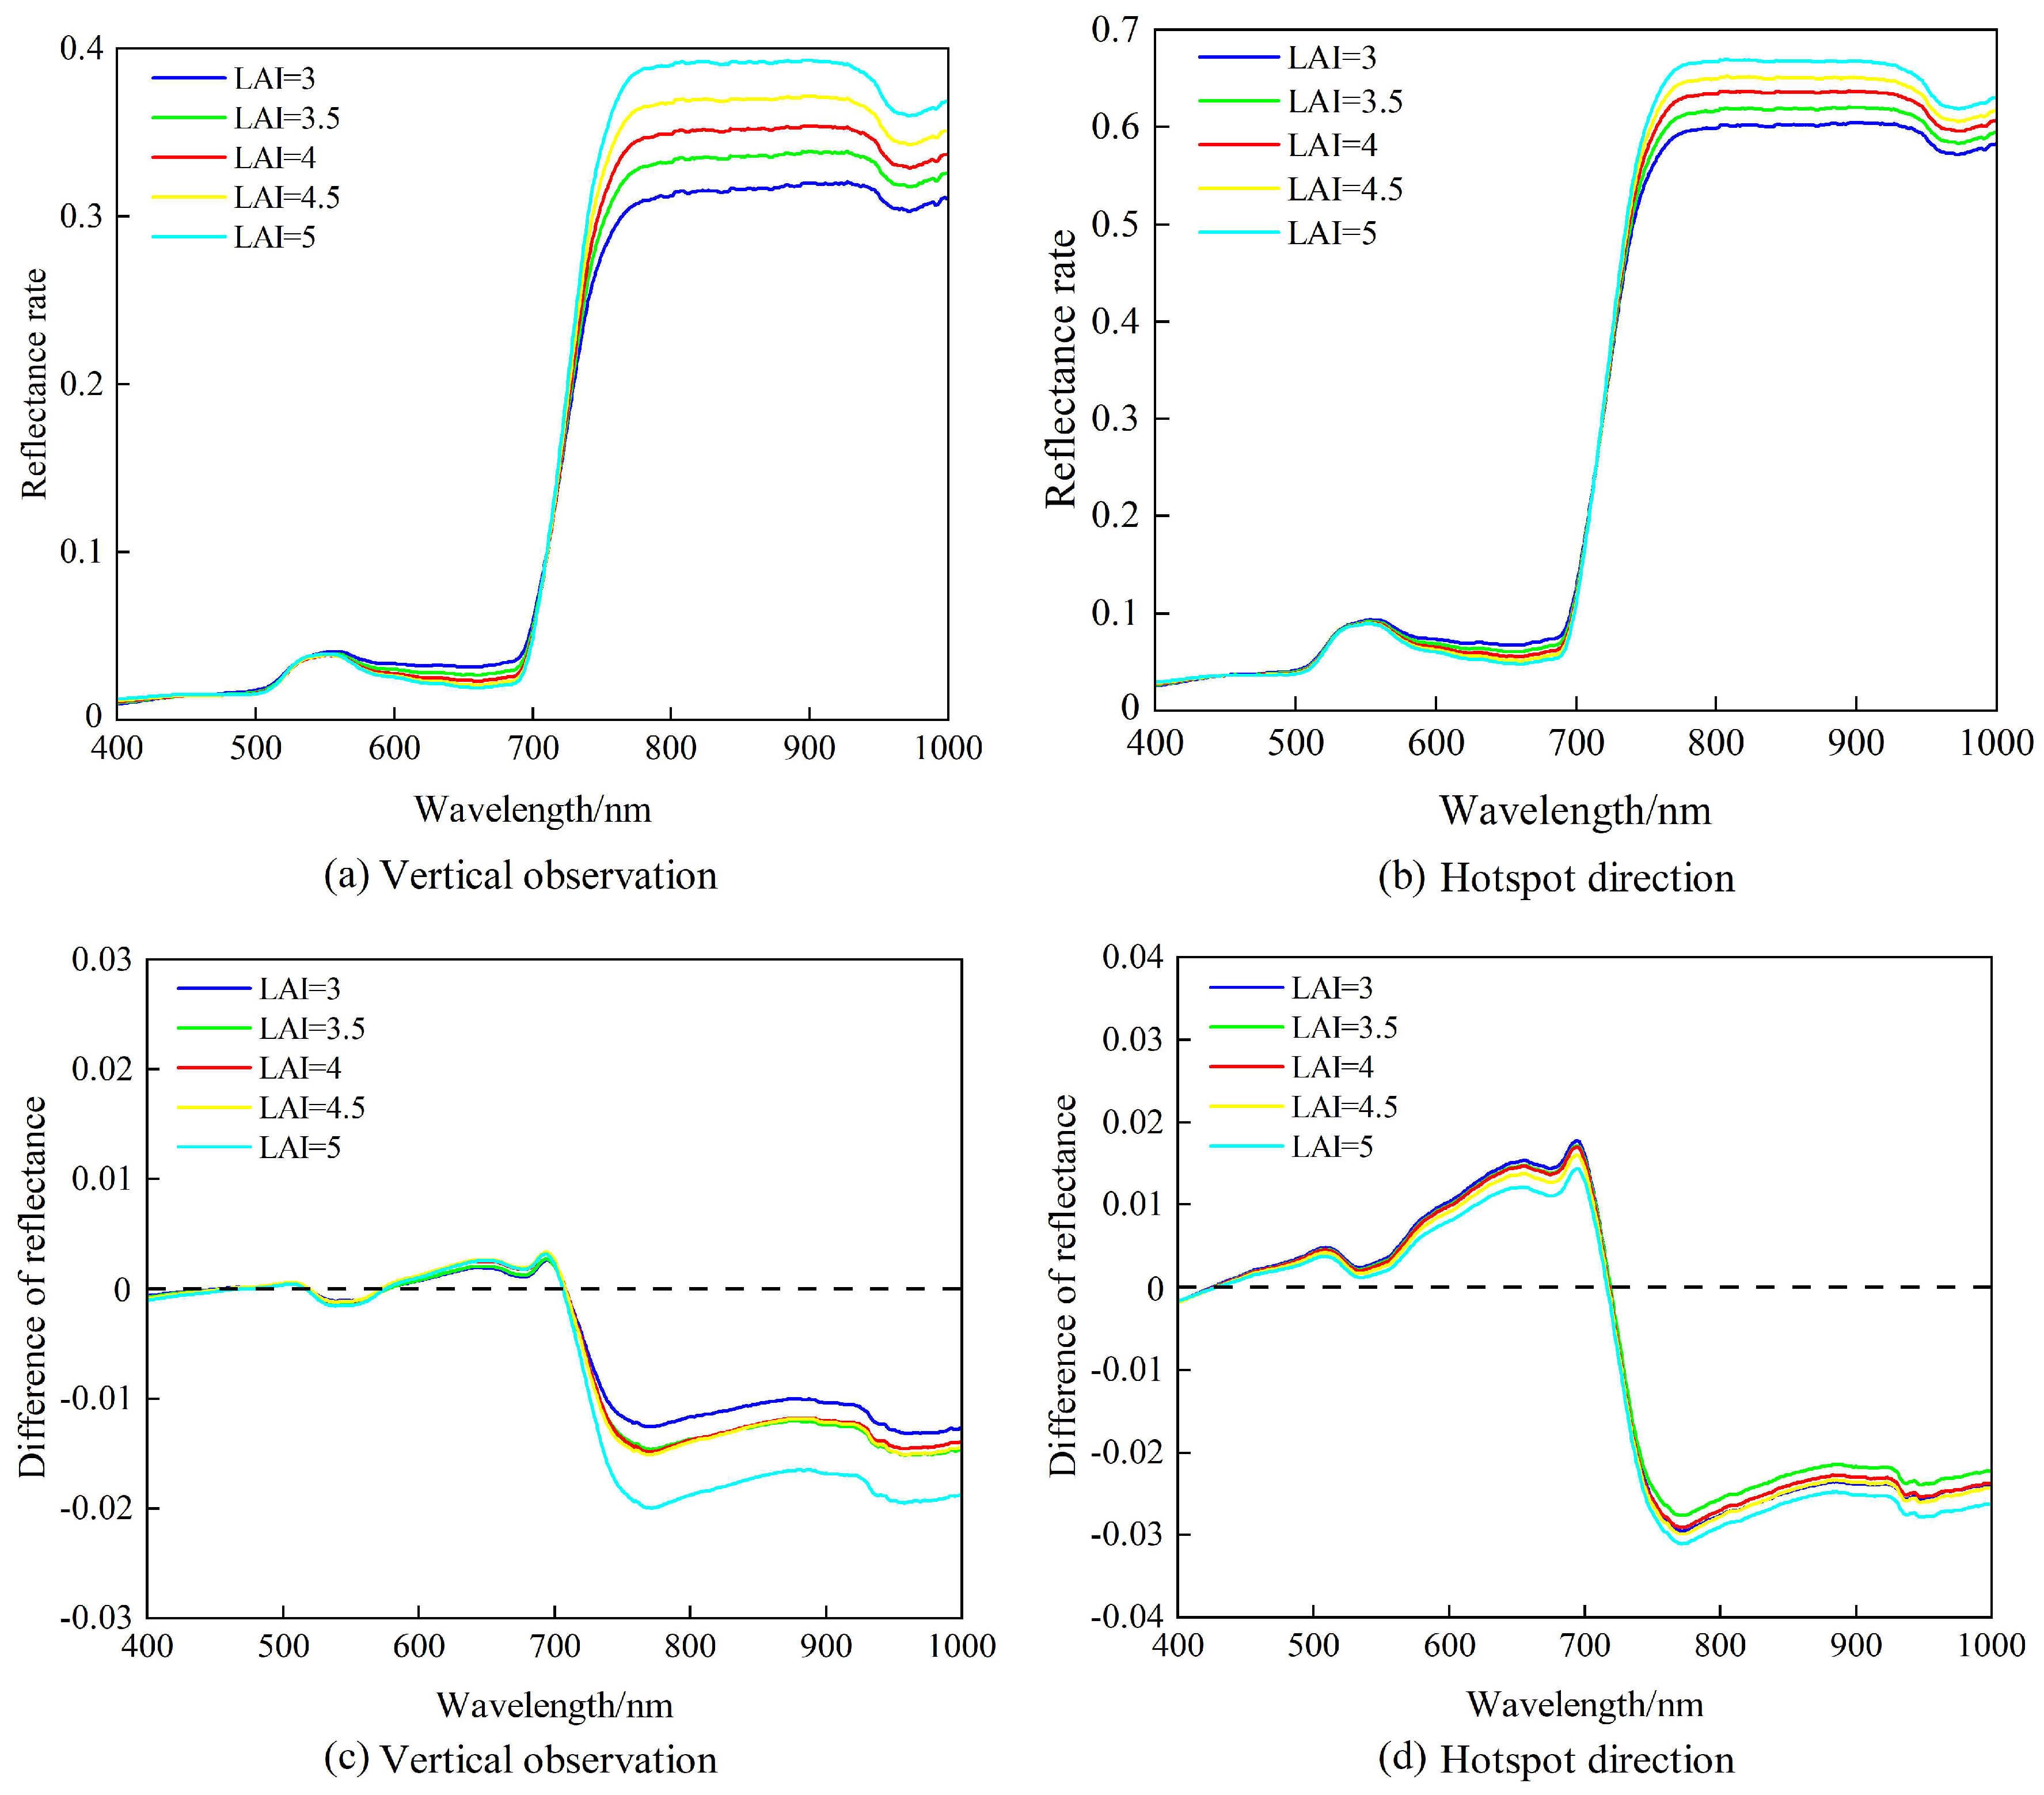
During the tasseling period, the maize canopy gradually closes. Although the geometric structure of maize tassels remains nearly constant by the middle stage of tasseling, the leaf area index (LAI) of each planting plot varies significantly. Using the measured leaf area data and the distribution pattern of maize leaves, a 3D model of a single maize plant was constructed, forming 3D scenes of maize with five LAI gradients. The top–down view is shown in Figure 14, and the simulation results are shown in Figure 15. For non-tassel canopies, changes in LAI had a greater impact on canopy reflectance in the near-infrared band. In the 3D scenes with different LAI, the difference in the effect of the tassel on canopy reflectance was mainly in the near-infrared band, with an absolute reflectance difference of less than 0.01.
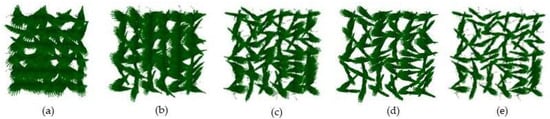
Figure 14.
The difference in tassel effect under different planting densities. (a) LAI = 5; (b) LAI = 4.5; (c) LAI = 4; (d); LAI = 3.5; (e) LAI = 3.
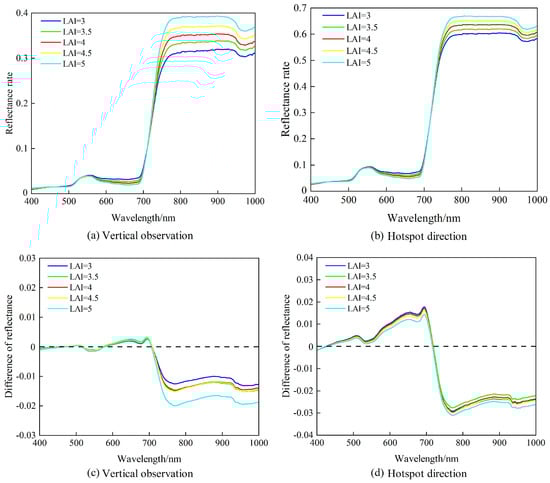
Figure 15.
Difference analysis of canopy reflectance under different LAI. (a,b) are the changes in canopy reflectance without a tassel; (c,d) are the differences in canopy reflectance caused by tassels.
3.4. Directional Effect of Tassel on Canopy Reflectance in Maize
3.4.1. Main Directional Features of the Canopy without Tassels
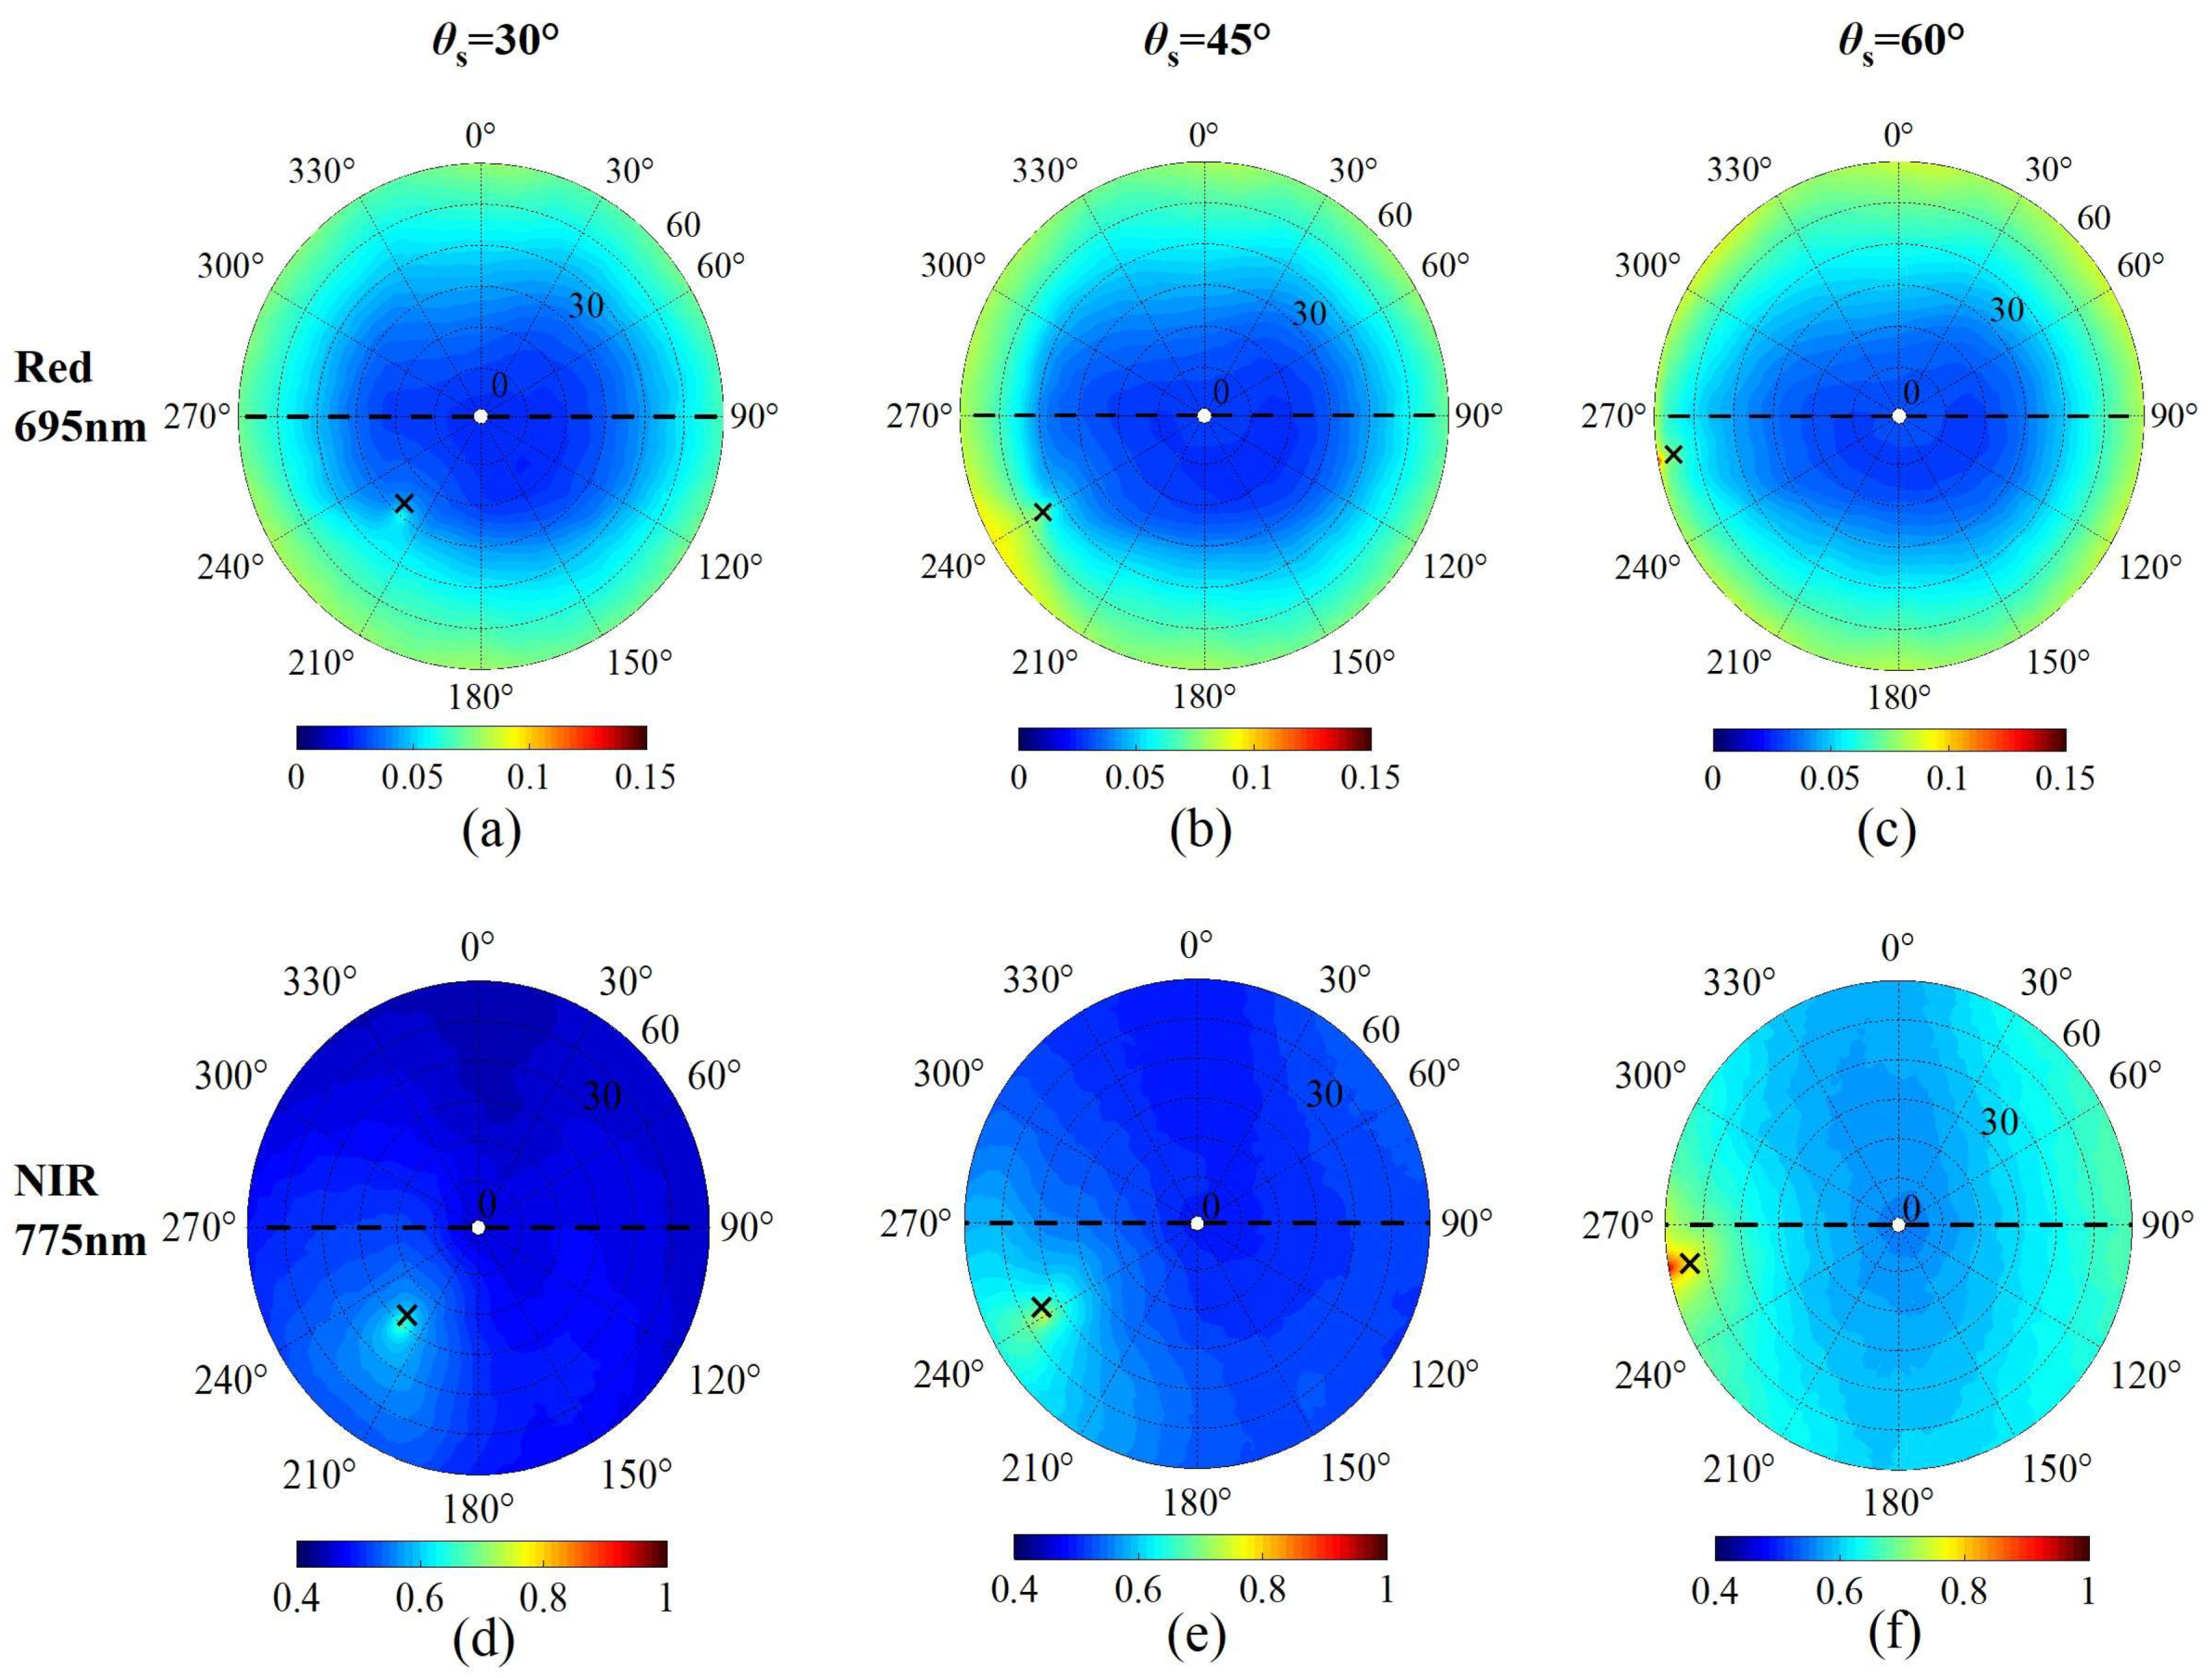
Before quantifying the directional influence of maize tassels on canopy reflectance, the band with the largest reflectance difference in the tassel-cutting simulation was selected as the representative subset of the visible and near-infrared bands. The LESS model was then used to simulate the reflectance at different observation zenith and azimuth angles, creating a polar coordinate map (Figure 16) representing the directional features of the non-tassel canopy, with an angular resolution of 1°. Figure 16 shows that the directional features of the two bands exhibited similar patterns at three sun positions. At the hotspot, where maize leaf shadows are not visible, a reflectance peak corresponding to the sun’s direction is observed. As the sun’s zenith angle increases, the reflectance of both bands rises, but the red band shows a stronger response to the observed zenith angle.

Figure 16.
Polar plot of canopy reflectance for maize without tassel @695 nm and 775 nm, and the three sun positions considered. represents the zenith angle of the sun, (a,d) are 13:50; (b,e) are 15:20; (c,f) are 16:30. The black cross marker represents the sun’s position. The black dashed line is row direction (east-west).
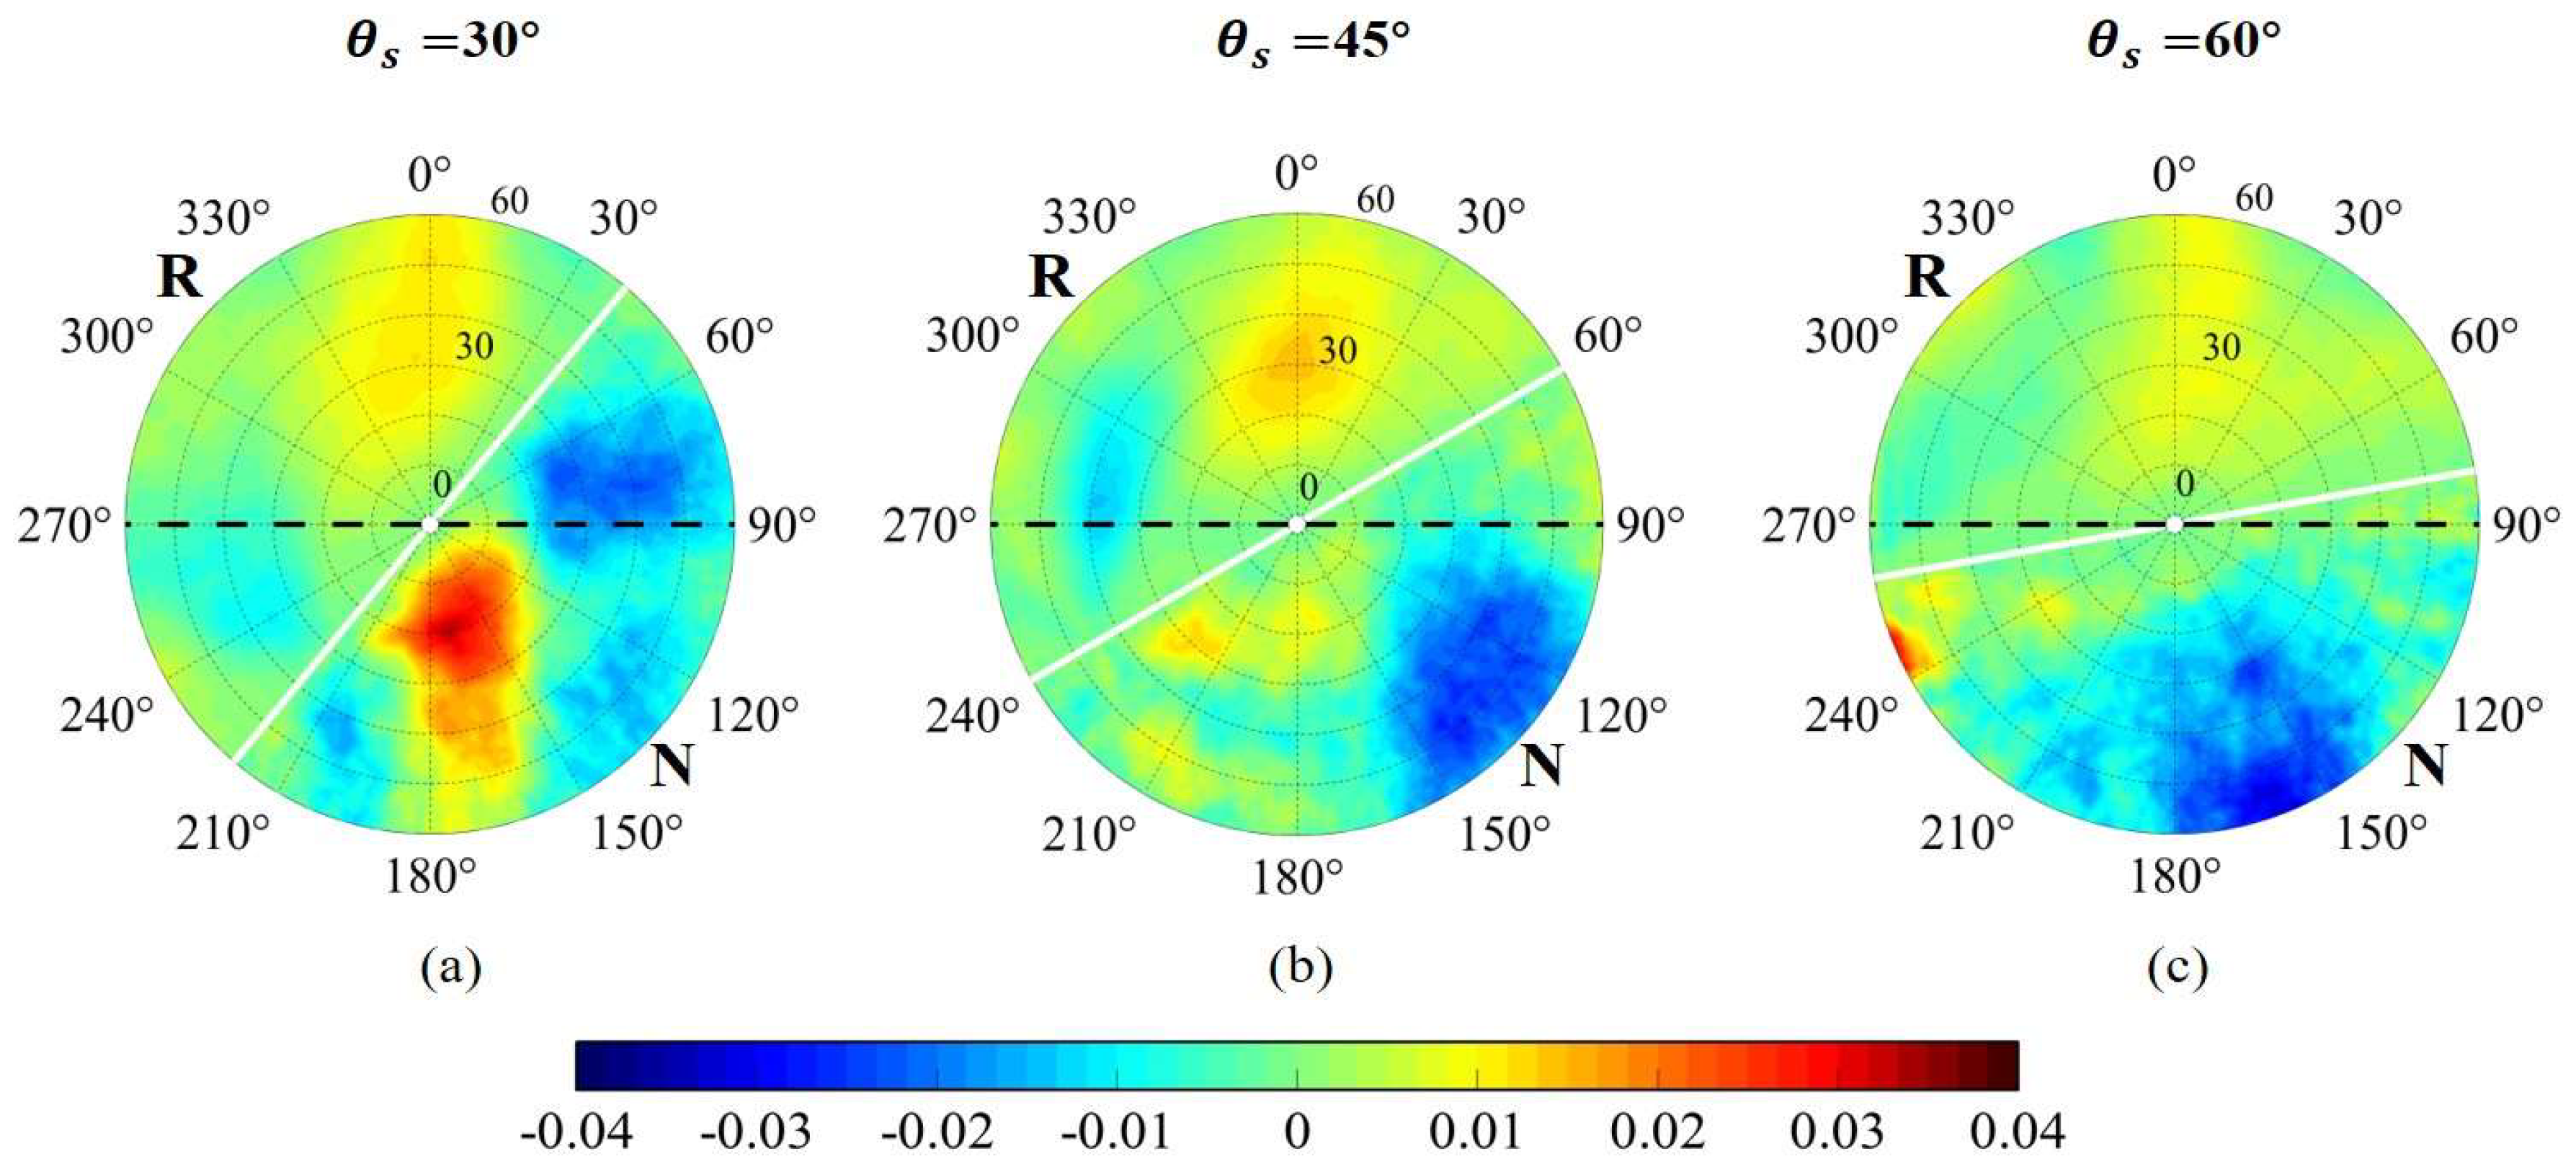
For the red and near-infrared bands, maize reflectance shows overall symmetry on both sides of the principal plane, i.e., the plane containing the sun’s direction (Figure 16). To evaluate the symmetry of the non-tassel canopy relative to the principal plane comprehensively, the reflectance difference in the symmetrical direction of the principal plane was calculated for six simulation results at different sun positions in the two bands, as shown in Figure 17. The reflectance difference of the red band in the symmetrical direction of the principal plane was usually between −0.01 and 0.01, confirming the general symmetry of the red band reflectance relative to the principal plane. However, persistent asymmetry was observed in the near-infrared band at three sun positions, with the reflectance difference in the symmetrical direction of the principal plane ranging from −0.04 to 0.04. This may be due to the near-infrared band’s relatively wide hotspot compared to the red band. On the near-infrared reflectance polar map, the reflectance difference caused by the hotspot effect [24] was centered on the sun’s position, showing an approximate fan-shaped distribution, while in the dark spot direction, the overall reflectance is low (Figure 16). Both bands exhibited a lower reflectance difference in the hotspot direction.
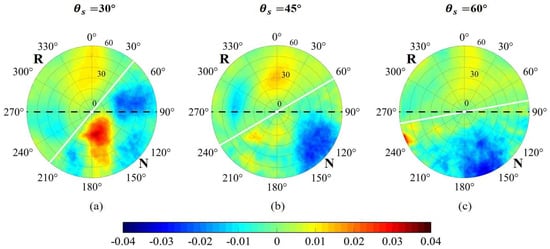
Figure 17.
Polar representation of the reflectance difference distribution of the non-tassel canopy in the symmetrical direction of the principal plane at different sun positions. R represents the hemisphere where the red band is located, and N represents the hemisphere where the near-infrared band is located. represents the zenith angle of the sun, (a) is 13:50; (b) is 15:20; (c) is 16:30. The projection line of the principal plane of the sun is represented by a white solid line. The black dashed line is row direction (east-west).
3.4.2. Directional Distribution of Canopy Reflectance Difference
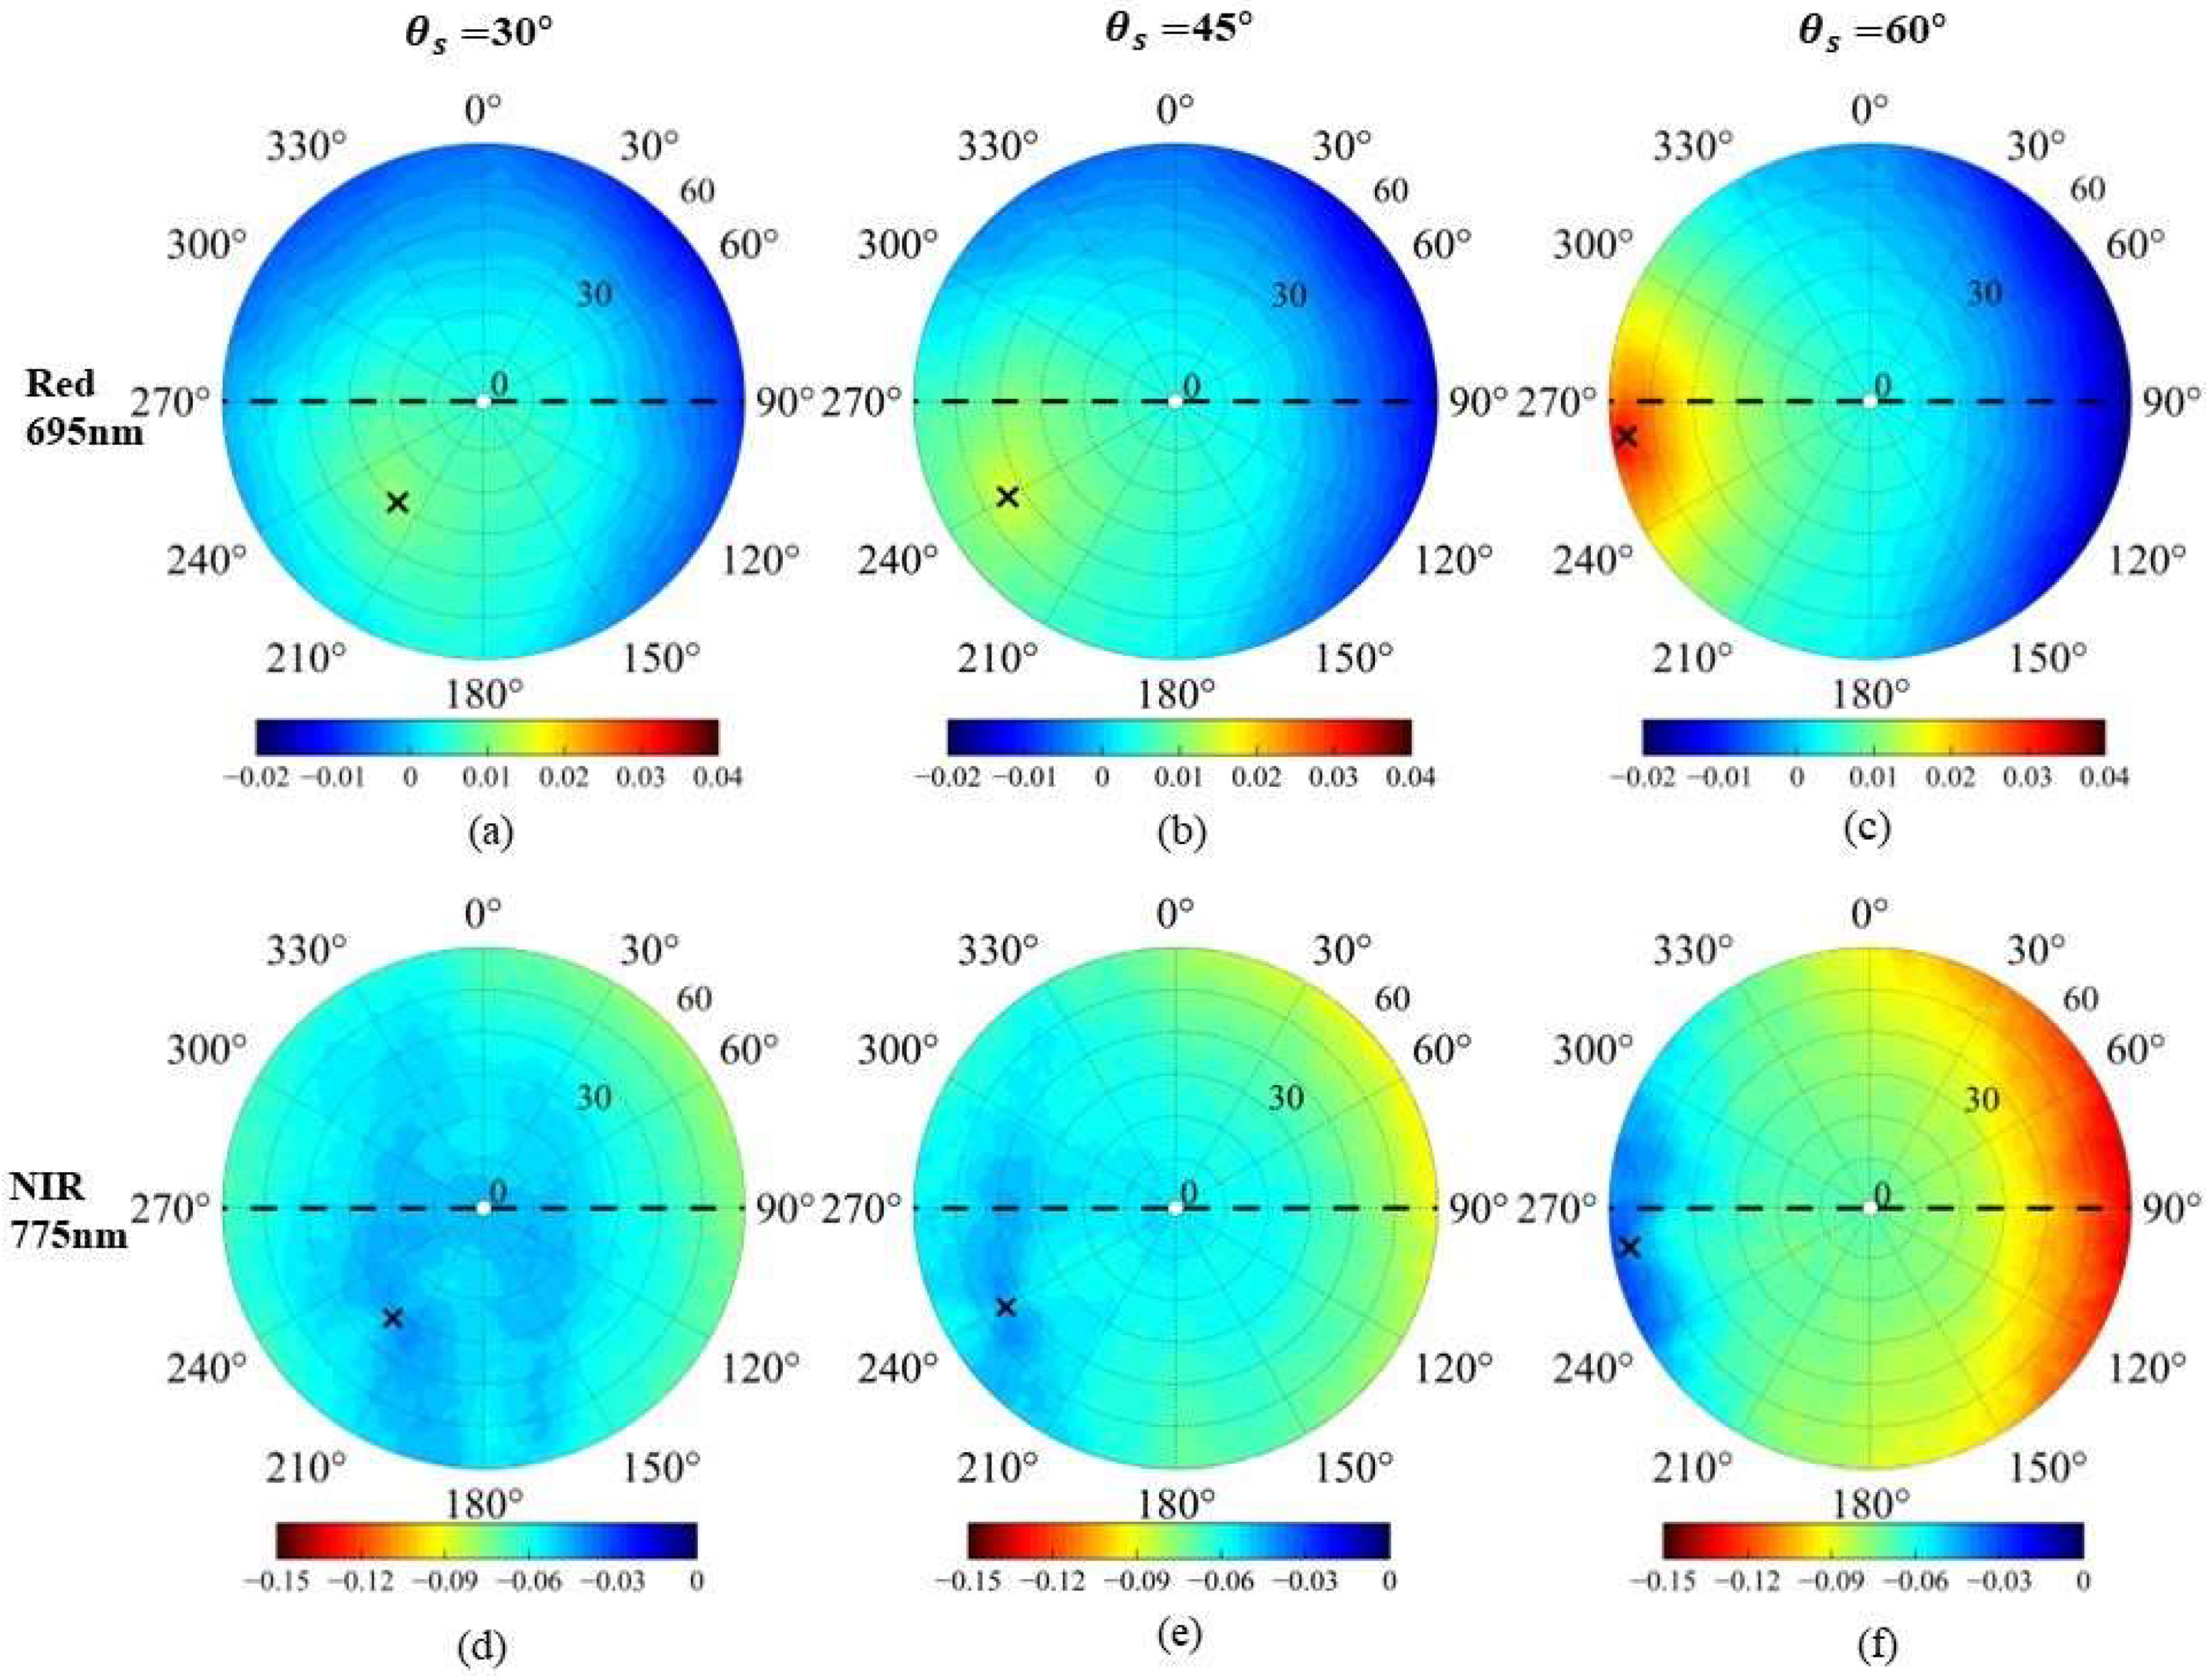
For the two states of the maize canopy (with or without tassels), the reflectance difference between the two bands in the same observation direction at different sun positions was calculated, resulting in a polar coordinate map reflecting the directional influence of tassels (Figure 18). The results showed that the absolute effect of maize tassels on canopy reflectance was relatively small. At three sun positions, the reflectance difference in the red band ranged from −0.02 to 0.04, while in the near-infrared band, it ranged from −0.15 to 0. Due to the observed low reflectance in the red band (Figure 16), the relative change in reflectance could reach 50%, while in the near-infrared band, it was 20%.

Figure 18.
Directional distribution of the reflectance difference between the with and without tassel canopy. represents the zenith angle of the sun, (a,d) are 13:50; (b,e) are 15:20; (c,f) are 16:30. The black cross marker represents the sun’s position. The black dashed line is row direction (east-west).
Figure 18 clearly shows that the effect of tassels on red band reflectance is mainly observed in the hotspot direction, while in the near-infrared band, the effect is seen at larger observation zenith angles near the dark spot. As the sun’s position shifted, the hotspot influence range decreased, and the proportion of the tassels’ reduction effect on the red band across the polar coordinate map increased. In the near-infrared band, the absolute reflectance difference in the hotspot direction was relatively low. However, near the dark spot, as the observation zenith angle increased, the effect of tassels on near-infrared reflectance gradually intensified. The hotspot direction weakened the reduction effect of tassels on canopy reflectance, resulting in the observed outcomes in Figure 18.
4. Discussion
4.1. The Change in Tassel Influence under the Difference of Canopy Characteristics
The effect of maize tassel on canopy reflectance is influenced by various factors, such as the temporal changes in tassel spectral characteristics, tassel orientation, genotype variation, and environmental conditions [11]. In this study, we combined the 3D virtual maize scene with a 3D radiative transfer model to quantitatively analyze the relationship between structural and spectral differences in canopy characteristics and canopy reflectance. The structural differences in canopy characteristics include changes in the structure of both the non-tassel canopy and the tassel. Among these, variations in planting density reflect differences in canopy structure due to the spatial arrangement of maize, while plots with different LAI more accurately reflect the effect of the tassel on canopy reflectance when the tassel structure is fixed in the late tasseling stage. The variation in the effect of the same tassel on canopy reflectance under different planting densities was ±0.04 (Figure 12), whereas, for plots with different LAI, the variation in the tassel’s effect on canopy reflectance was ±0.01 (Figure 15). This is primarily because a fully developed tassel is located at the top of the maize canopy, and changes in planting density directly alter the number of tassels. In contrast, adjusting LAI by changing the leaf area of individual maize plants does not affect the number of tassels in the scene. The maize tassel is the main canopy structure studied here. Compared to differences in canopy structure without tassels, the space occupied by the tassel means its influence on canopy reflectance depends more on the structural differences it causes. Although the fully developed tassel structure changed little, its color shifted from green in the early tasseling stage to dry and gray at maturity, resulting in spectral differences in canopy components. The decrease in tassel reflectance corresponds well with its effect on canopy reflectance (Figure 10). The 3D radiative transfer model is crucial for quantitatively analyzing the relationship between canopy reflectance and canopy characteristics due to its clear physical mechanism [25]. In traditional field measurements, the complex and variable environmental factors make it difficult to effectively capture the slight reflectance differences caused by tassels through destructive tassel-cutting experiments, making it nearly impossible to analyze control variables in different scenarios.
4.2. The Anisotropic Characteristics of Tassel Affecting Canopy Reflectance
Vegetation canopy reflectance depends on the observation configuration [11]. The effect of maize tassel on canopy reflectance varies with spectral bands and shows an obvious directional effect. A series of canopy reflectance values related to sun position and observation direction were simulated using a 3D radiative transfer model. The polar coordinate diagram of the difference distribution of canopy reflectance caused by tassels shows that in the red band at the same sun position, the difference in tassel effect caused by the observed zenith angle on canopy reflectance reaches 200%, while in the near-infrared band, the difference is as high as 400% (Figure 18). The canopy reflectance of maize demonstrates strong anisotropy (Figure 16). Studies of canopy reflectance in rice, wheat, and other crops also show similar results [26,27,28], primarily due to the shadow and hotspot effects of the canopy [29]. The influence of tassels on canopy reflectance can be divided into two categories: structural and optical properties. The 3D radiative transfer model fixes its optical properties to analyze the impact of the shadow effect caused by its structure on canopy reflectance. The hotspot effect of the canopy significantly weakens the shadow effect of the tassel. Outside the hotspot effect’s influence range, increasing the observed zenith angle significantly enhances the shadow effect of the tassel on canopy reflectance (Figure 18). Both the sun zenith angle and the observed zenith angle affect maize canopy reflectance. The sensitivity of the tassel to the sun zenith angle increases with the observed zenith angle because, when the sun is oblique, the interception and multiple scattering of the canopy to the sun increase with the sun zenith angle [30]. By controlling the observation configuration, the shadow effect of the tassel on canopy reflectance can be effectively reduced. In vegetation remote sensing inversion, different observation zenith angles can express the spectral characteristics of different structural layers of vegetation [31]. Depending on the remote sensing application, reasonable selection of sun position and observation direction helps reduce or avoid canopy reflectance differences caused by non-research structures.
4.3. The Influence Mechanism of Maize Tassel on Canopy Reflectance
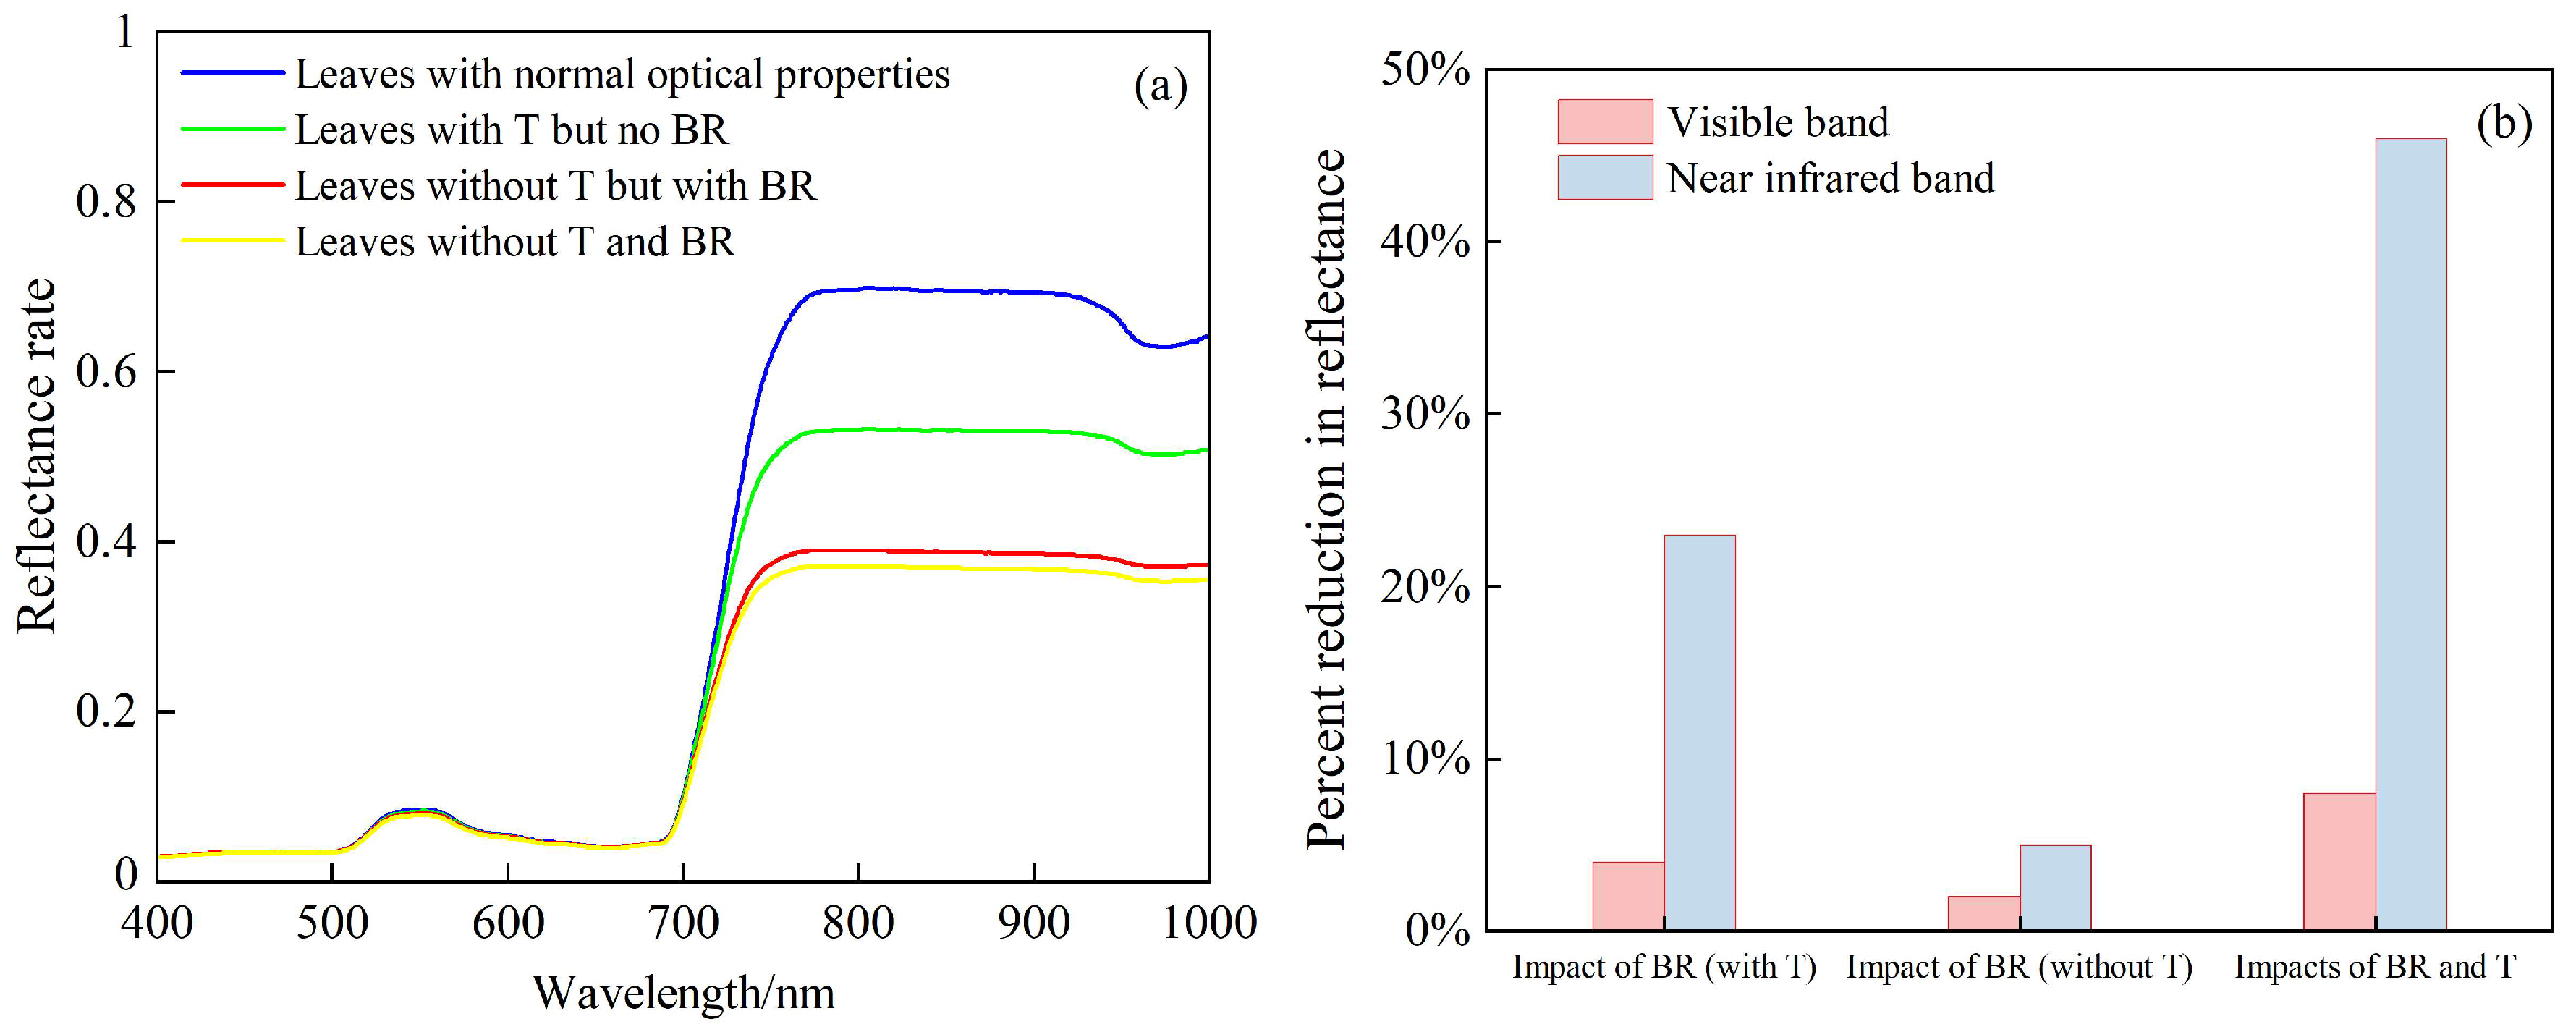
During maize growth, the tassel changes from green to gray, and its reflectance shows specific dynamic changes. In the early tasseling stage, tassel reflectance is higher than that of leaves; in the late tasseling stage, tassel reflectance is lower than that of leaves. In the LESS model, tassels with higher reflectance than leaves were assigned to the non-tassel canopy, increasing maize canopy reflectance in the visible band and decreasing it in the near-infrared band (Figure 10). To deeply analyze this phenomenon, the key factors affecting the reflectance of the non-tassel canopy are first considered. Based on the optical properties of maize tassel without transmittance and back reflectance, the changes in non-tassel canopy reflectance in the visible band (400–760 nm) and near-infrared band (760–1000 nm) were further studied when leaves lost transmittance and back reflectance (Figure 19). The results showed that the effect of leaf back reflectance on canopy reflectance depends on leaf transmittance. When leaves had transmittance, the average percentage reduction in visible and near-infrared band reflectance was 4% and 23%, respectively. When leaves lost transmittance, the average percentage reduction in reflectance was 2% and 5%, respectively. Thus, whether leaves have transmittance is a key factor affecting non-tassel canopy reflectance. Compared to normal leaves, leaves that lost transmittance and back reflectance caused an 8% and 46% reduction in canopy reflectance in the visible and near-infrared bands, respectively.
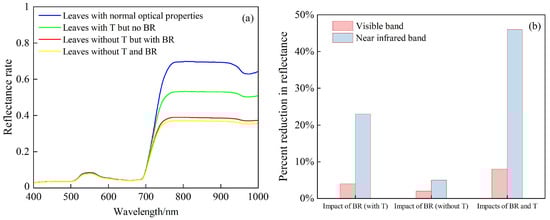
Figure 19.
Comparison of the effects of leaf optical properties on the reflectance of the non-tassel canopy. (a) Comparison of Canopy Reflectance Change; (b) percentage reduction of canopy reflectance. In the figure, T represents the transmittance, and BR represents the back reflectance (Same as below).
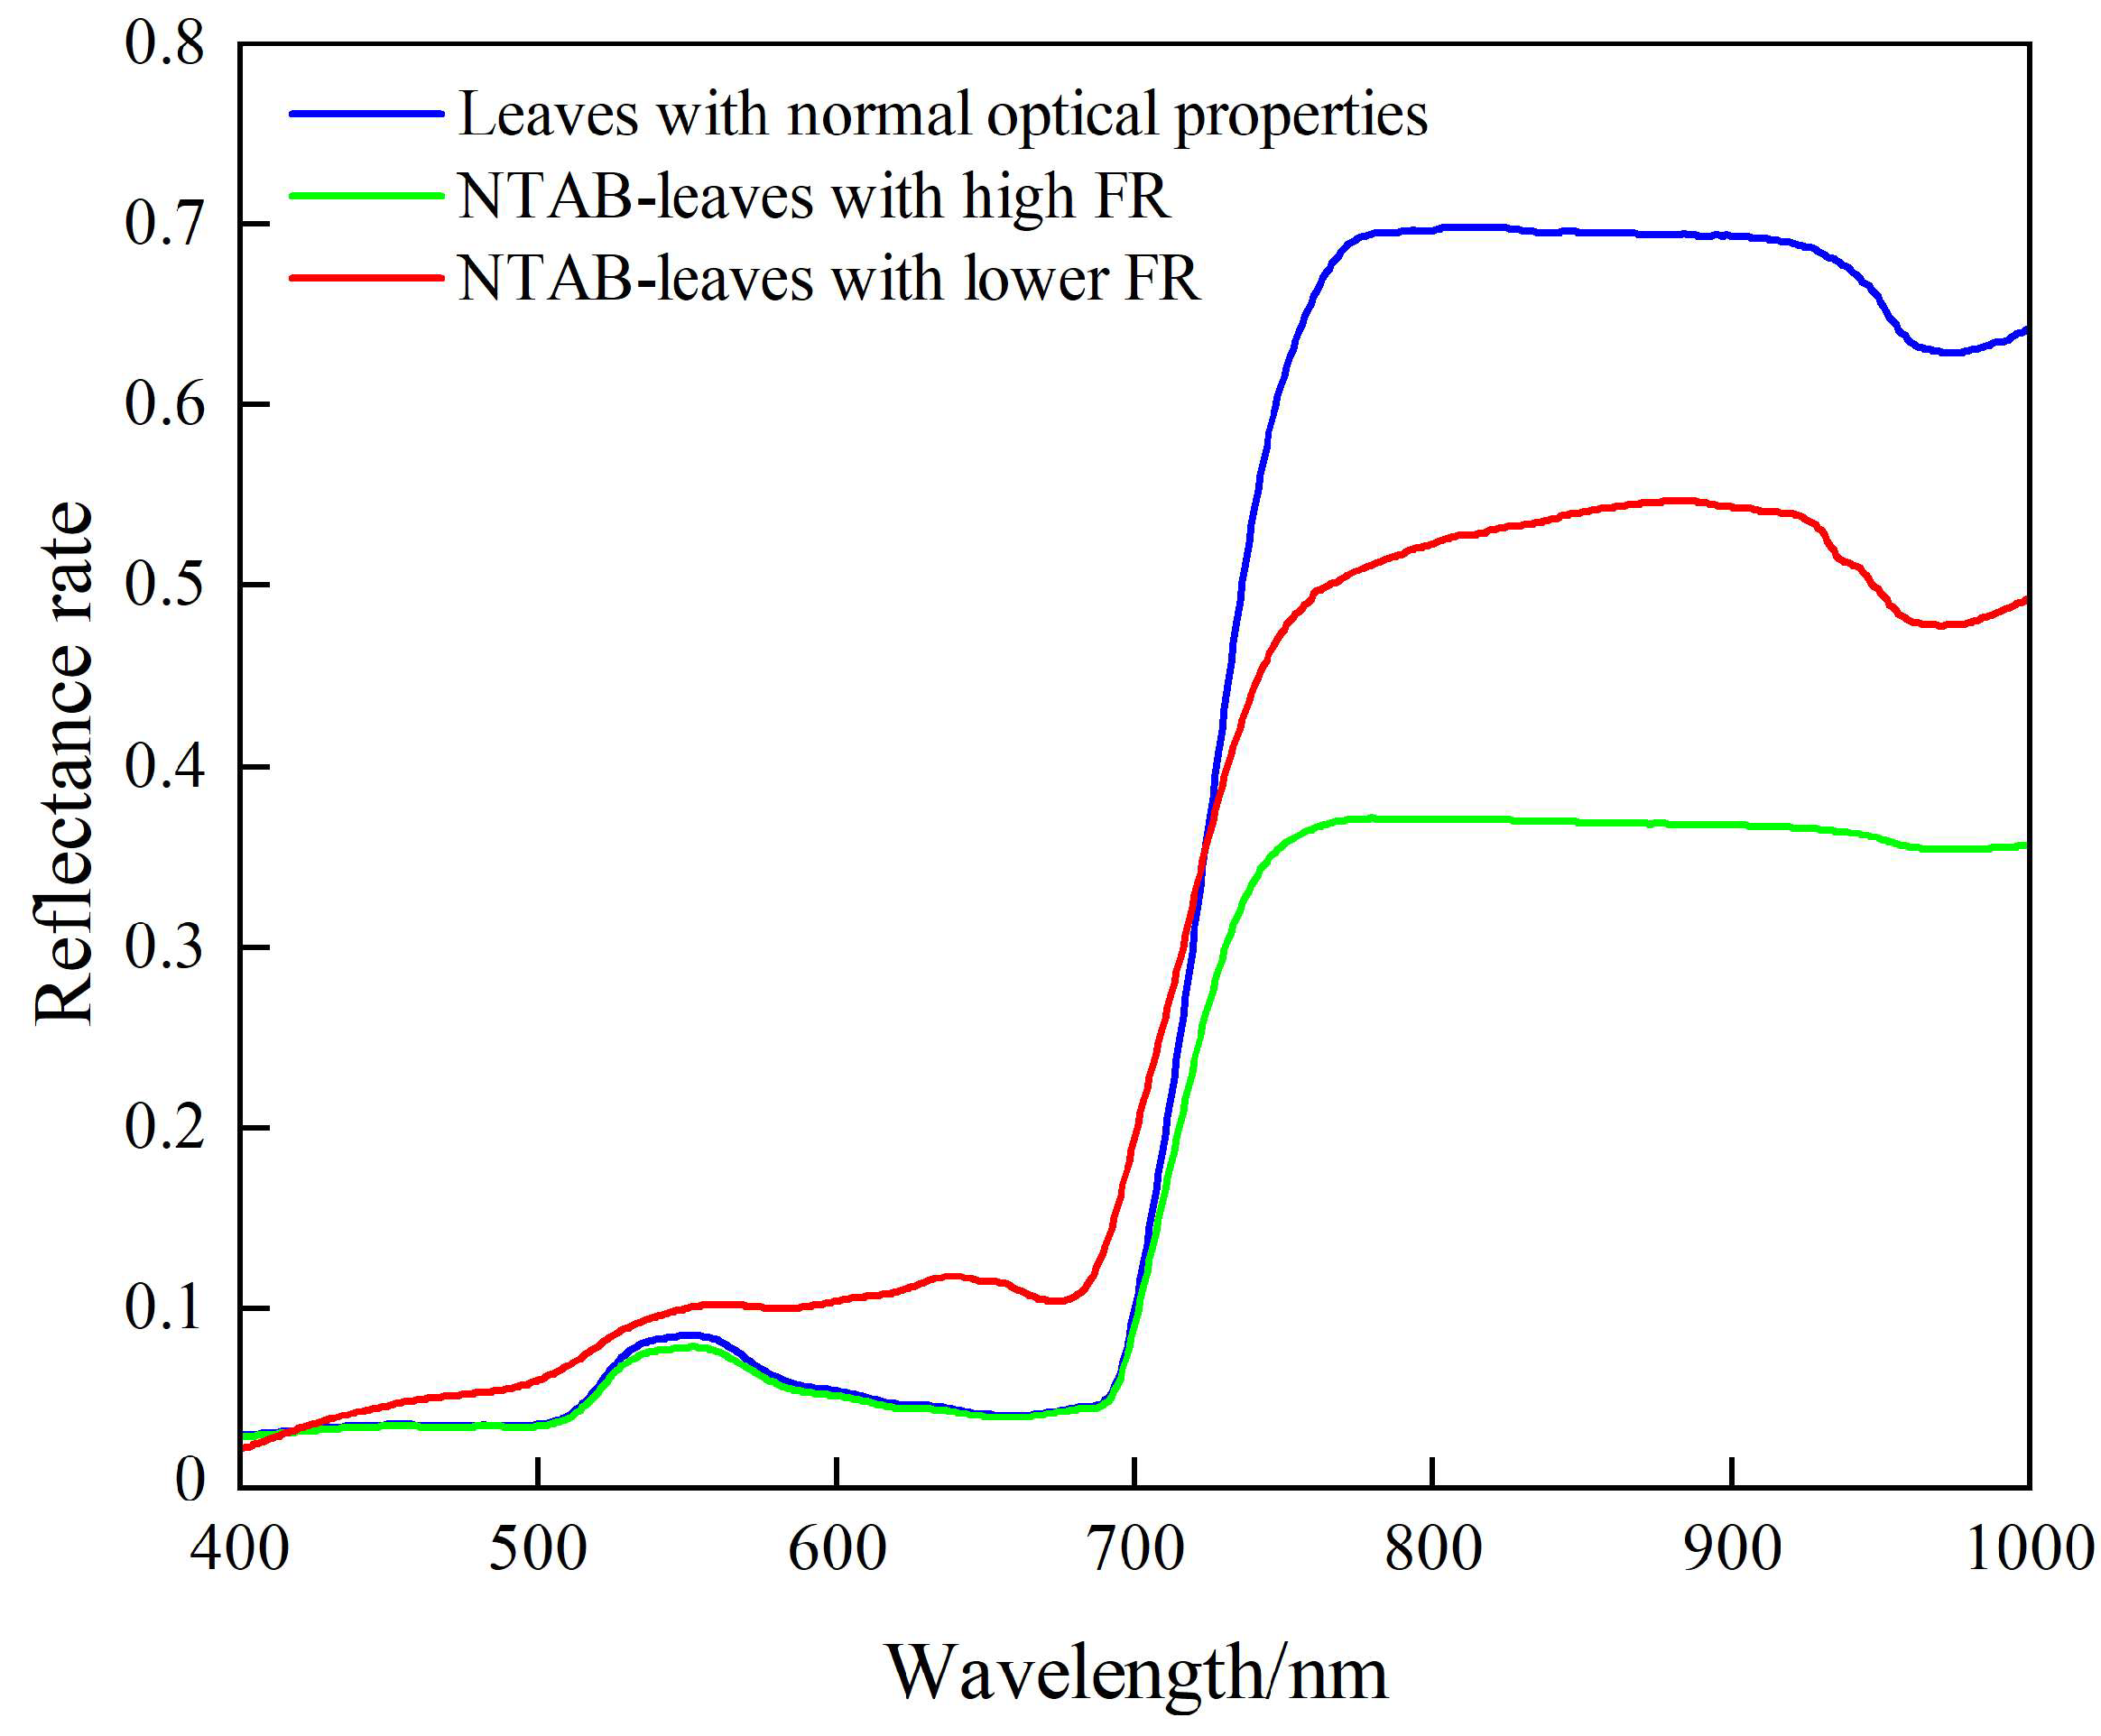
Based on the above results, by assigning leaves the same optical properties as maize tassels (i.e., no transmittance and back reflectance), the treated leaves are called NTAB-leaves. Initially, the reflectance of NTAB-leaves was increased, and their lower reflectance was consistent with normal leaves. Then, two kinds of NTAB-leaves with different reflectance and normal maize leaves were placed in the same maize scene for simulation. The changes in non-tassel canopy reflectance in the three scenes were obtained (Figure 20). Due to the high transmission and multiple scattering characteristics of sun radiation inside the canopy in the near-infrared band [32], the canopy reflectance in the visible band is much less sensitive to leaf transmittance than the near-infrared band (Figure 19b). Thus, NTAB-leaves with higher reflectance increase the canopy reflectance in the visible band more than that of maize canopy composed of normal leaves. However, in the near-infrared band, the improvement effect of NTAB-leaves with higher reflectance on canopy reflectance is weaker than the reduction effect due to lack of transmittance, ultimately leading to lower canopy reflectance than that of maize canopy composed of normal leaves.
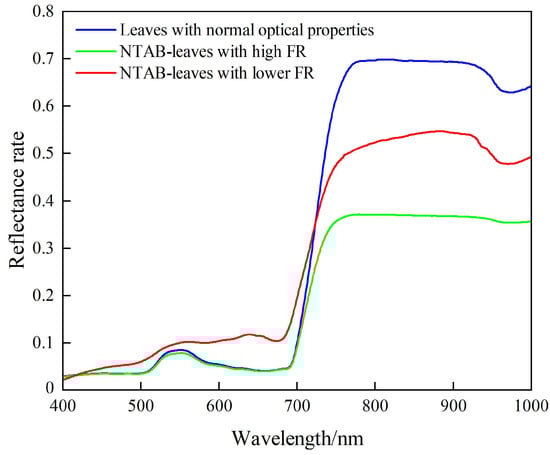
Figure 20.
Comparison of the effects of the reflectance of NTAB-leaves on the reflectance of the non-tassel canopy. In the figure, FR represents the front reflectance.
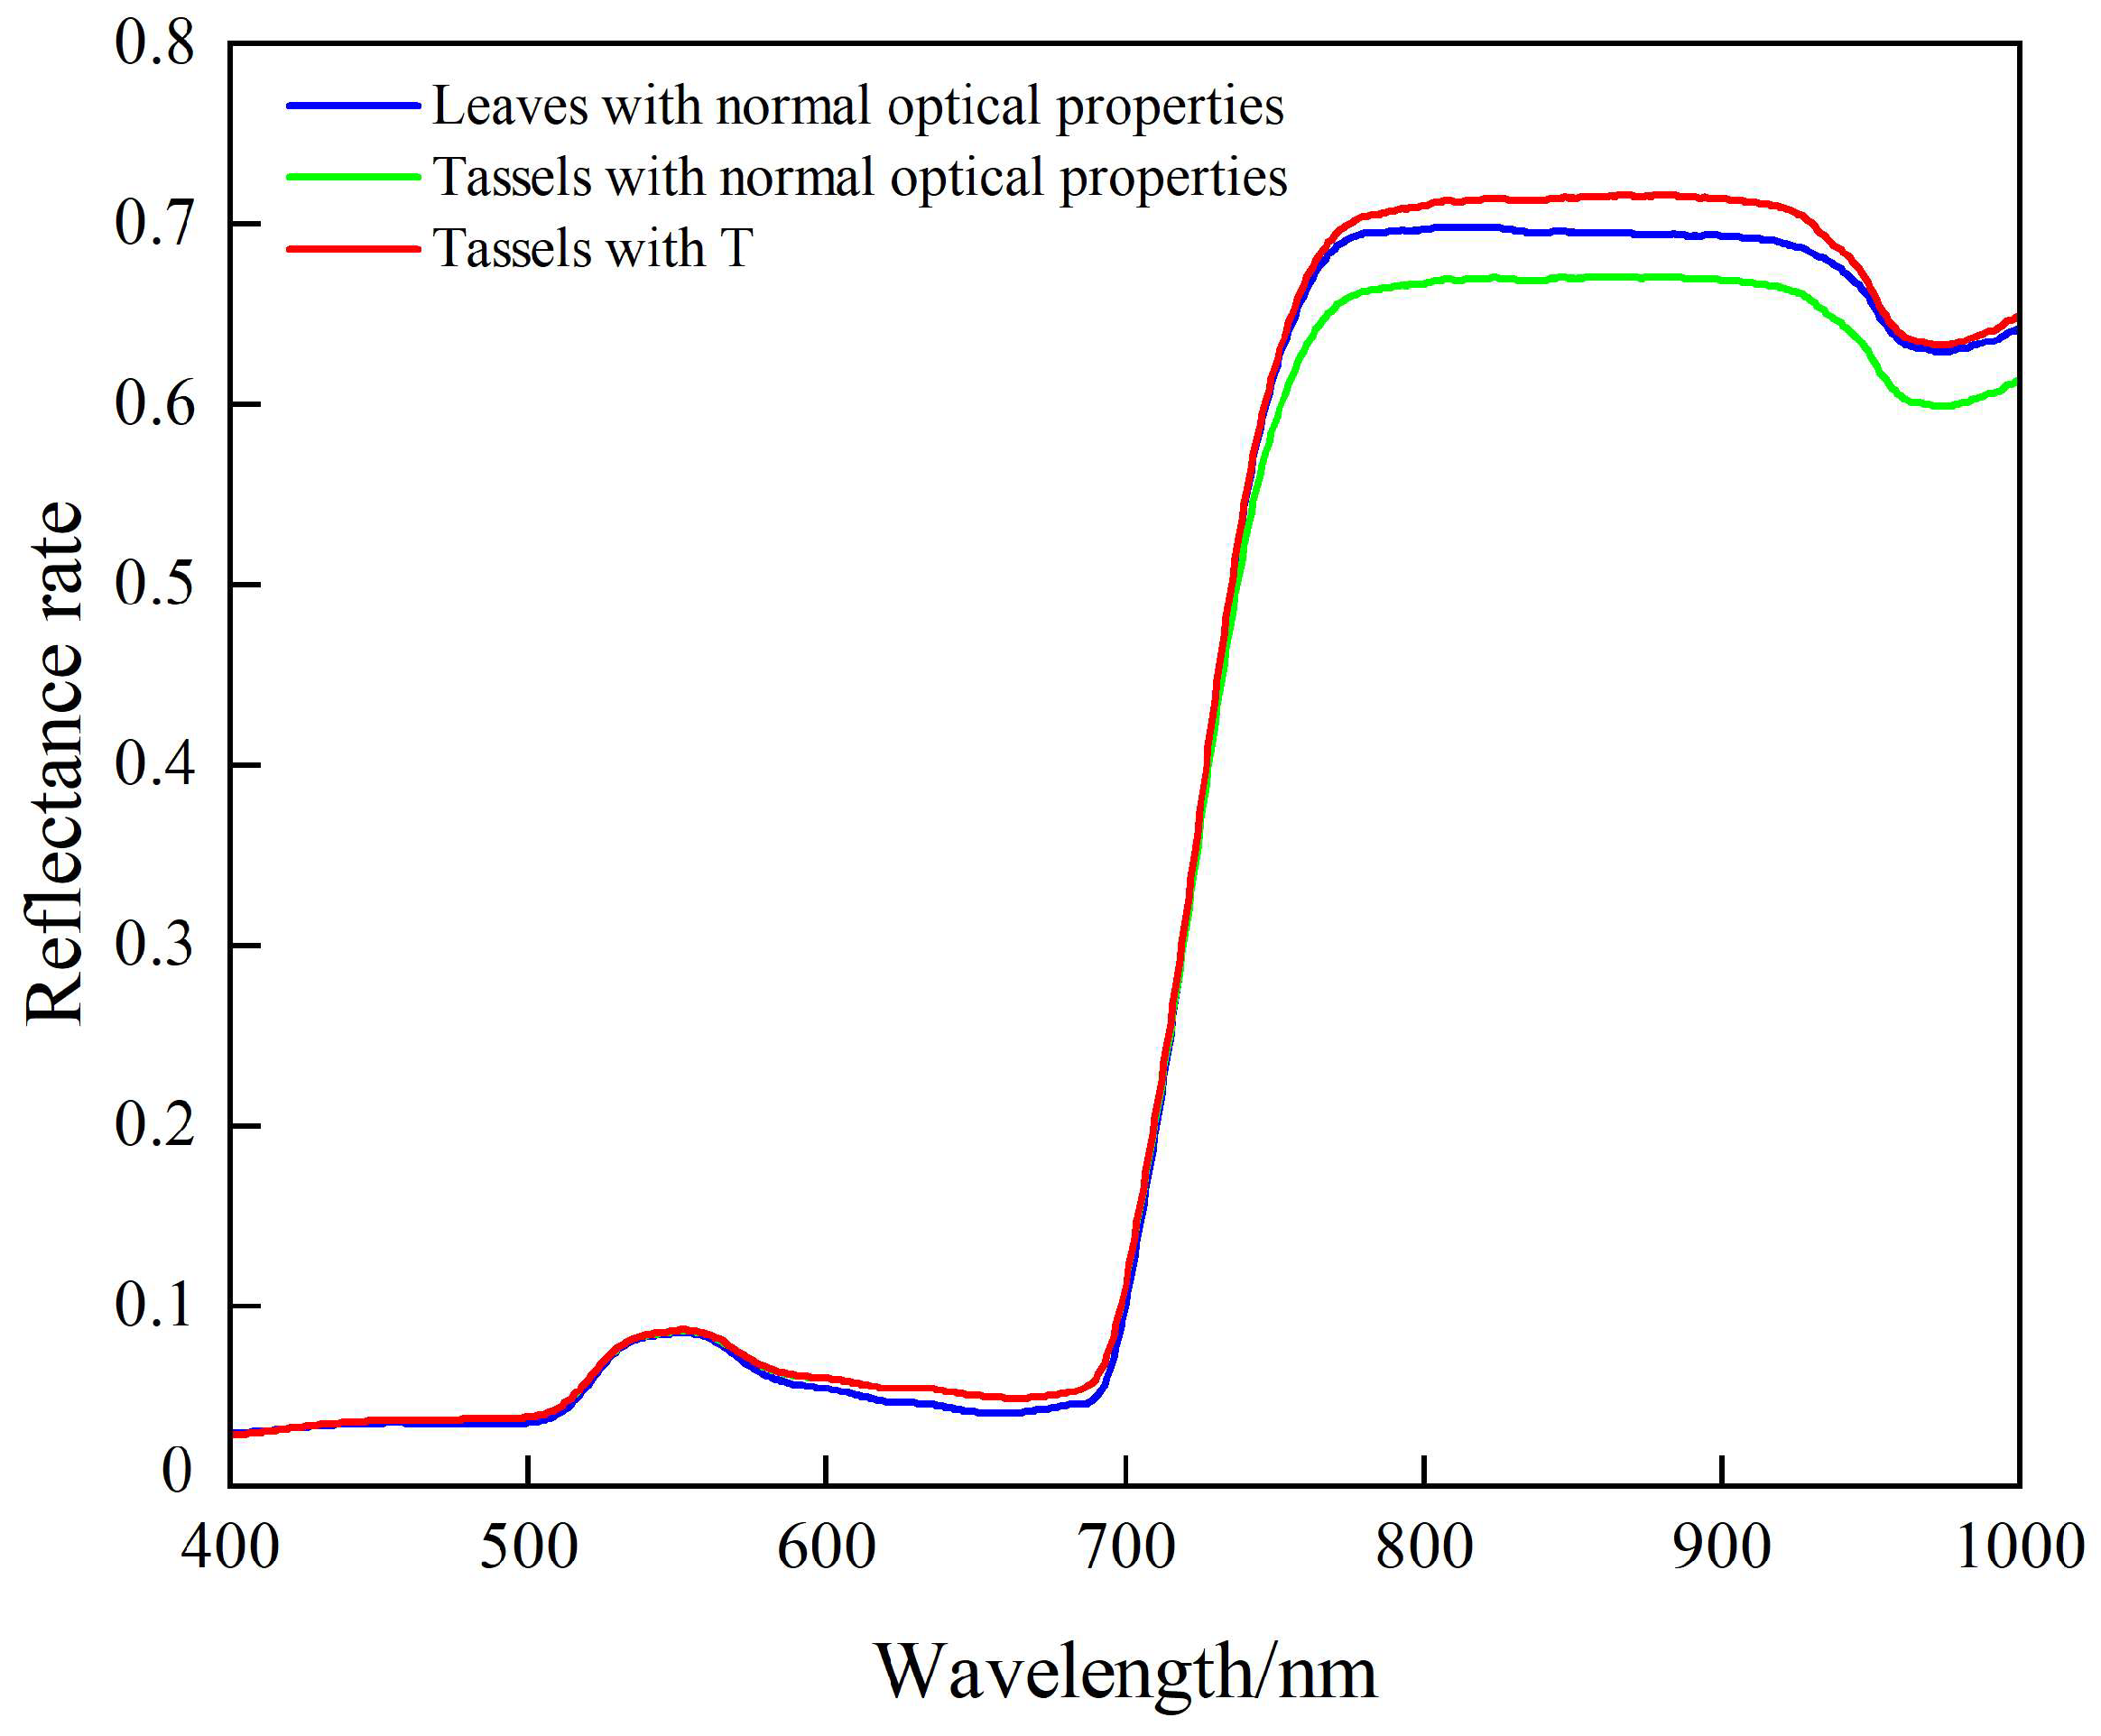
Through the maize leaf simulation experiment, it was found that under the condition of a fixed 3D structure and unchanged observation angle and sun position, the reflectance and transmittance of the maize canopy components largely determined the reflectance of the whole canopy (Figure 19 and Figure 20). For the maize canopy, reflectance in the visible band was mainly affected by the reflectance of the components, while reflectance in the near-infrared band was more influenced by the components’ transmittance (Figure 20). Based on these findings, ignoring the differences in the 3D structure of maize tassels and leaves, the maize tassels can be regarded as a layer of maize leaves with high reflectance but no transmittance placed on the non-tassel canopy. The optical properties of non-transmittance reduce canopy reflectance [20], while higher reflectance itself has the opposite effect. The different spectral response rules of visible and near-infrared bands to canopy components determine the phenomenon shown in Figure 10. Further, maize tassels were given the transmittance of normal leaves, and the resulting canopy spectral curve is shown in Figure 21. The results align with expectations. When tassels had transmittance, maize tassels with higher reflectance increased the non-tassel canopy’s reflectance. Compared to the visible band, the change in near-infrared band reflectance was more significant. This also confirms the conclusion that the lack of tassel transmittance reduces canopy spectrum reflectance.
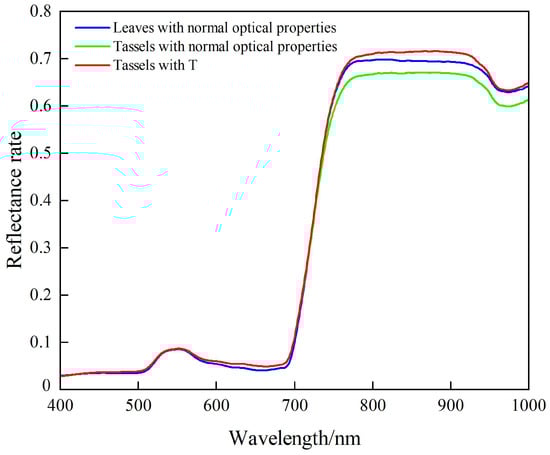
Figure 21.
Comparison of the effects of tassels with transmittance on canopy reflectance.
4.4. Limitations of Quantifying Tassel Effects on Canopy Reflectance
In our study, we combined the 3D radiative transfer model with a clear maize canopy scene to explore the influence of maize tassel on canopy reflectance and analyze the mechanism. However, the measured data used for verification only come from the measurement results of a single date, and the complex and changeable environmental factors may lead to differences in the results of artificial tassel-cutting tests. Although the changes in the spectral characteristics of tassels during the growth and development cycle were considered in our study, the continuous changes in the structure of tassels may also lead to different effects on canopy reflectance with different development stages. For wheat, the inclination of the ear affects the canopy spectrum and its directional expression [33]. The orientation of maize tassels was not considered in our study. Therefore, this study only studied the law and mechanism of the effect of the tassel on canopy reflectance through limited control conditions, but more research is needed, especially when the orientation, genotype, and growth environment of maize tassel change, the effect of the tassel on canopy reflectance changes.
5. Conclusions
The effect of maize tassel on canopy reflectance was quantified by combining a 3D radiative transfer model with virtual maize structure data. This method not only avoids the interference of complex and variable environmental factors but also effectively captures the reflectance differences caused by fine canopy structures, such as tassels. In this study, the difference in tassel influence in different 3D scenes was analyzed by control variables. In the reconstructed 15 virtual maize 3D scenes, results showed that the variation in the effect of the same tassel on canopy reflectance under different planting densities was ±0.04, whereas, for plots with different LAI, the variation in the tassel’s effect on canopy reflectance was ±0.01. Additionally, the anisotropic characteristics of tassel effects on canopy reflectance were analyzed. The results indicated that the absolute effect of maize tassels on canopy reflectance was relatively small. At three sun positions, the reflectance difference in the red band ranged from −0.02 to 0.04, while in the near-infrared band, it ranged from −0.15 to 0. Due to the low reflectance observed in the red band, the relative change in the red band reflectance could reach 50%, while in the near-infrared band, it was 20%. In the red band at the same sun position, the difference in tassel effect caused by the observed zenith angle on canopy reflectance reached 200%, while in the near-infrared band, the difference was as high as 400%. The hotspot effect of the canopy significantly weakened the shadow effect of the tassel. Overall, the results show that the effect of tassels on canopy reflectance mainly depends on the tassel’s structural and spectral differences, spectral wavelength, and observation geometry.
Furthermore, the influence mechanism of maize tassel on canopy reflectance was analyzed by quantifying the contribution of leaf optical properties to the maize canopy spectrum. Results showed that the contribution rate of leaf transmittance to canopy reflectance in visible and near-infrared bands was 6% and 41%, respectively. The maize tassel can be regarded as a layer of maize leaves with high reflectance but no transmittance placed on the non-tassel canopy. The optical property of no transmittance reduces canopy reflectance, while its higher reflectance has the opposite effect. Therefore, the dual role of the tassel forms a game in the canopy reflectance. The final result mainly depends on the transmittance sensitivity of canopy reflectance in the corresponding spectral band.
In conclusion, our research demonstrates the feasibility of using simulation methods to explore the influence of fine canopy structures on canopy reflectance and the mechanisms behind them. This provides the potential for constructing vegetation indices for accurate monitoring of important crop growth stages. The 3D radiative transfer model was used to evaluate the effect of canopy structure differences on canopy reflectance during the crop growth cycle, offering insights for precision agriculture management and optimization of crop structure. Importantly, this process is non-destructive, controllable, and quantifiable.
Author Contributions
Conceptualization, H.Y. and G.Y.; methodology, Z.C., H.Y. and Y.J.; validation, Z.C. and Y.J.; formal analysis, Z.C. and H.Y.; performed experiments, Z.C., D.Z., C.Z., B.X., H.F., L.R. and Z.F.; data curation, Z.C. and Y.Z.; writing—original draft preparation, Z.C. and Y.J.; writing—review and editing, H.Y., D.Z. and C.Z. All authors have read and agreed to the published version of the manuscript.
Funding
This research was funded by the National Key Research and Development Program of China (2021YFD2000102), the Natural Science Foundation of China (42371373), and Special Fund for Construction of Scientific and Technological Innovation Ability of Beijing Academy of Agriculture and Forestry Sciences (KJCX20230434).
Data Availability Statement
The raw data supporting the conclusions of this article will be made available by the authors on request.
Conflicts of Interest
The authors declare no conflicts of interest.
References
- van der Velde, M.; d’Andrimont, R.; Taymans, M.; Lemoine, G.; Ceglar, A.; Yordanov, M. Detecting flowering phenology in oil seed rape parcels with Sentinel-1 and-2 time series. Remote. Sens. Environ. 2020, 239, 111660. [Google Scholar] [CrossRef]
- Guo, Y.; Fu, Y.H.; Chen, S.; Bryant, C.R.; Li, X.; Senthilnath, J.; Sun, H.; Wang, S.; Wu, Z.; de Beurs, K. Integrating spectral and textural information for identifying the tasseling date of summer maize using UAV based RGB images. Int. J. Appl. Earth Obs. Geoinf. 2021, 102, 102435. [Google Scholar] [CrossRef]
- Liaqat, W.; Akmal, M.; Ali, J. Sowing dates effect on production of high yielding maize varieties. Sarhad J. Agric. 2018, 34, 102–113. [Google Scholar] [CrossRef]
- Rudnick, D.R.; Irmak, S.; Djaman, K.; Sharma, V. Impact of irrigation and nitrogen fertilizer rate on soil water trends and maize evapotranspiration during the vegetative and reproductive periods. Agric. Water Manag. 2017, 191, 77–84. [Google Scholar] [CrossRef]
- Butler, E.E.; Huybers, P. Variations in the sensitivity of us maize yield to extreme temperatures by region and growth phase. Environ. Res. Lett. 2015, 10, 034009. [Google Scholar] [CrossRef]
- Capristo, P.R.; Rizzalli, R.H.; Andrade, F.H. Ecophysiological yield components of maize hybrids with contrasting maturity. Agron. J. 2007, 99, 1111–1118. [Google Scholar] [CrossRef]
- Grassini, P.; Yang, H.; Cassman, K.G. Limits to maize productivity in western corn-belt: A simulation analysis for fully irrigated and rainfed conditions. Agric. For. Meteorol. 2009, 149, 1254–1265. [Google Scholar] [CrossRef]
- Tollenaar, M.; Ahmadzadeh, A.; Lee, E.A. Physiological basis of heterosis for grain yield in maize. Crop Sci. 2004, 44, 2086–2094. [Google Scholar] [CrossRef]
- McBratney, A.; Whelan, B.; Ancev, T.; Bouma, J. Future directions of precision agriculture. Precis. Agric. 2005, 6, 7–23. [Google Scholar] [CrossRef]
- Shao, M.; Nie, C.; Zhang, A.; Shi, L.; Zha, Y.; Xu, H.; Yang, H.; Yu, X.; Bai, Y.; Liu, S. Quantifying effect of maize tassels on LAI estimation based on multispectral imagery and machine learning methods. Comput. Electron. Agric. 2023, 211, 108029. [Google Scholar] [CrossRef]
- Li, W.; Jiang, J.; Weiss, M.; Madec, S.; Tison, F.; Philippe, B.; Comar, A.; Baret, F. Impact of the reproductive organs on crop BRDF as observed from a UAV. Remote Sens. Environ. 2021, 259, 112433. [Google Scholar] [CrossRef]
- Li, B.; Junhua, B.; Qing, X.; Qinhuo, L.; Ze, Z.; Xin, L.; Linghua, M. Effects of maize tassel at the heading stage on radiation transfer characteristics of canopy reflectance. Trans. Chin. Soc. Agric. Eng. 2019, 35, 162–170. [Google Scholar]
- Zhao, X.; Qi, J.; Xu, H.; Yu, Z.; Yuan, L.; Chen, Y.; Huang, H. Evaluating the potential of airborne hyperspectral LiDAR for assessing forest insects and diseases with 3D radiative transfer modeling. Remote Sens. Environ. 2023, 297, 113759. [Google Scholar] [CrossRef]
- Dash, J.P.; Watt, M.S.; Pearse, G.D.; Heaphy, M.; Dungey, H.S. Assessing very high resolution uav imagery for monitoring forest health during a simulated disease outbreak. ISPRS J. Photogramm. Remote Sens. 2017, 131, 1–14. [Google Scholar] [CrossRef]
- Gastellu-Etchegorry, J.P.; Martin, E.; Gascon, F. DART: A 3D model for simulating satellite images and studying surface radiation budget. Int. J. Remote Sens. 2004, 25, 73–96. [Google Scholar] [CrossRef]
- Qi, J.; Xie, D.; Yin, T.; Yan, G.; Gastellu-Etchegorry, J.-P.; Li, L.; Zhang, W.; Mu, X.; Norford, L.K. LESS: Large-scale remote sensing data and image simulation framework over heterogeneous 3D scenes. Remote Sens. Environ. 2019, 221, 695–706. [Google Scholar] [CrossRef]
- Huang, H.; Qin, W.; Liu, Q. RAPID: A radiosity applicable to porous individual objects for directional reflectance over complex vegetated scenes. Remote Sens. Environ. 2013, 132, 221–237. [Google Scholar] [CrossRef]
- Bechtold, S.; Höfle, B. Helios: A multi-purpose lidar simulation framework for research, planning and training of laser scanning operations with airborne, ground-based mobile and stationary platforms. ISPRS Ann. Photogramm. Remote Sens. Spat. Inf. Sci. 2016, 3, 161–168. [Google Scholar] [CrossRef]
- Qi, J.; Xie, D.; Xu, Y.; Yan, G. Principles and applications of the 3D radiative transfer model LESS. Remote Sens. Technol. Appl. 2019, 34, 914–924. [Google Scholar]
- Jiang, J.; Weiss, M.; Liu, S.; Baret, F. Effective GAI is best estimated from reflectance observations as compared to GAI and LAI: Demonstration for wheat and maize crops based on 3D radiative transfer simulations. Field Crop. Res. 2022, 283, 108538. [Google Scholar] [CrossRef]
- Jiang, J.; Weiss, M.; Liu, S.; Rochdi, N.; Baret, F. Speeding up 3D radiative transfer simulations: A physically based metamodel of canopy reflectance dependency on wavelength, leaf biochemical composition and soil reflectance. Remote Sens. Environ. 2020, 237, 111614. [Google Scholar] [CrossRef]
- Xu, B.; Wan, X.; Yang, H.; Feng, H.; Fu, Y.; Cen, H.; Wang, B.; Zhang, Z.; Li, S.; Zhao, C. TIPS: A three-dimensional phenotypic measurement system for individual maize tassel based on TreeQSM. Comput. Electron. Agric. 2023, 212, 108150. [Google Scholar] [CrossRef]
- Widlowski, J.-L.; Mio, C.; Disney, M.; Adams, J.; Andredakis, I.; Atzberger, C.; Brennan, J.; Busetto, L.; Chelle, M.; Ceccherini, G. The fourth phase of the radiative transfer model intercomparison (RAMI) exercise: Actual canopy scenarios and conformity testing. Remote Sens. Environ. 2015, 169, 418–437. [Google Scholar] [CrossRef]
- Li, W.; Yan, G.; Mu, X.; Tong, Y.; Zhou, K.; Xie, D. Modeling the hotspot effect for vegetation canopies based on path length distribution. Remote Sens. Environ. 2024, 303, 113985. [Google Scholar] [CrossRef]
- Zhao, X.; Qi, J.; Yu, Z.; Yuan, L.; Huang, H. Fine-scale quantification of absorbed photosynthetically active radiation (APAR) in plantation forests with 3D radiative transfer modeling and LiDAR data. Plant Phenom. 2024, 6, 0166. [Google Scholar] [CrossRef] [PubMed]
- Kuester, T.; Spengler, D. Structural and spectral analysis of cereal canopy reflectance and reflectance anisotropy. Remote Sens. 2018, 10, 1767. [Google Scholar] [CrossRef]
- Li, Y.; Gao, J.; Zha, Y. Impact of rice canopy structure on canopy reflectance spectra. In Proceedings of the Remote Sensing and Space Technology for Multidisciplinary Research and Applications, SPIE, Beijing, China, 19–24 May 2005; Volume 6199, pp. 113–122. [Google Scholar]
- Shibayama, M.; Wiegand, C.L. View azimuth and zenith, and solar angle effects on wheat canopy reflectance. Remote Sens. Environ. 1985, 18, 91–103. [Google Scholar] [CrossRef]
- Huang, H.; Liu, Q.; Qin, W. Thermal emission hot-spot effect of crop canopies—Part I: Simulation. IEEE J. Sel. Top. Appl. Earth Obs. Remote Sens. 2010, 3, 313–322. [Google Scholar] [CrossRef]
- Middleton, E.M. Solar zenith angle effects on vegetation indices in tallgrass prairie. Remote Sens. Environ. 1991, 38, 45–62. [Google Scholar] [CrossRef]
- Huang, W.; Wang, Z.; Huang, L.; Lamb, D.W.; Ma, Z.; Zhang, J.; Wang, J.; Zhao, C. Estimation of vertical distribution of chlorophyll concentration by bi-directional canopy reflectance spectra in winter wheat. Precis. Agric. 2011, 12, 165–178. [Google Scholar] [CrossRef]
- Ollinger, S.V. Sources of variability in canopy reflectance and the convergent properties of plants. New Phytol. 2011, 189, 375–394. [Google Scholar] [CrossRef] [PubMed]
- Gutierrez, M.; Reynolds, M.P.; Klatt, A.R. Effect of leaf and spike morphological traits on the relationship between spectral reflectance indices and yield in wheat. Int. J. Remote Sens. 2015, 36, 701–718. [Google Scholar] [CrossRef]


Disclaimer/Publisher’s Note: The statements, opinions and data contained in all publications are solely those of the individual author(s) and contributor(s) and not of MDPI and/or the editor(s). MDPI and/or the editor(s) disclaim responsibility for any injury to people or property resulting from any ideas, methods, instructions or products referred to in the content. |
© 2024 by the authors. Licensee MDPI, Basel, Switzerland. This article is an open access article distributed under the terms and conditions of the Creative Commons Attribution (CC BY) license (https://creativecommons.org/licenses/by/4.0/).