Article

How Useful Are Moderate Resolution Imaging Spectroradiometer Observations for Inland Water Temperature Monitoring and Warming Trend Assessment in Temperate Lakes in Poland?

1
Department of Land Improvement, Environmental Development and Spatial Management, Poznań University of Life Sciences, Piątkowska 94E, 60-649 Poznań, Poland
2
Department of Hydrology and Water Management, Adam Mickiewicz University, Krygowskiego 10, 61-680 Poznań, Poland
3
Department of Meteorology and Climatology, Adam Mickiewicz University, Krygowskiego 10, 61-680 Poznań, Poland
4
College of Hydraulic Science and Engineering, Yangzhou University, Yangzhou 225009, China
*
Author to whom correspondence should be addressed.
Remote Sens. 2024, 16(15), 2727; https://doi.org/10.3390/rs16152727
Submission received: 19 June 2024 / Revised: 16 July 2024 / Accepted: 24 July 2024 / Published: 25 July 2024

Abstract

:
Continuous software development and widespread access to satellite imagery allow for obtaining increasingly accurate data on the natural environment. They play an important role in hydrosphere research, and one of the most frequently addressed issues in the era of climate change is the thermal dynamics of its components. Interesting research opportunities in this area are provided by the utilization of data obtained from the moderate resolution imaging spectroradiometer (MODIS). These data have been collected for over two decades and have already been used to study water temperature in lakes. In the case of Poland, there is a long history of studying the thermal regime of lakes based on in situ observations, but so far, MODIS data have not been used in these studies. In this study, the available products, such as 1-day and 8-day MODIS land surface temperature (LST), were validated. The obtained data were compared with in situ measurements, and the reliability of using these data to estimate long-term thermal changes in lake waters was also assessed. The analysis was conducted based on the example of two coastal lakes located in Poland. The results of 1-day LST MODIS generally showed a good fit compared to in situ measurements (average RMSE 1.9 °C). However, the analysis of long-term trends of water temperature changes revealed diverse results compared to such an approach based on field measurements. This situation is a result of the limited number of satellite data, which is dictated by environmental factors associated with high cloud cover reaching 60% during the analysis period.

1. Introduction

The basis for studying natural processes in both temporal and spatial terms is the availability of reliable and homogeneous datasets that are widely accessible, have an appropriate time horizon, and are collected with high frequency. In relation to hydrological research, the first stationary, systematic measurements were conducted as early as the 19th century and were expanded with new possibilities as civilization progressed. Today, traditional in situ measurements are supplemented or replaced by remote sensing solutions. Generally, these rely on tools such as low-altitude aerial photogrammetry (drones), medium-altitude aerial photogrammetry (airplanes), and high-altitude aerial photogrammetry (satellites), each with its own advantages and disadvantages. Considering the length and frequency of measurements, moderate resolution imaging spectroradiometers (MODIS) are a good tool and have been widely used in various hydrosphere studies today [1,2,3,4]. Specifically, these images are an important source of information regarding the thermal dynamics of lakes. For example, based on water temperature maps of Lake Malawi created from MODIS satellite data, it was found that the lake has a complex character and lacks a consistent distribution pattern [5]. Studies of the surface water temperature of Lake Dianchi (China) based on MODIS data from 2001 to 2017 showed an increase in its annual average value, both during the day (0.09 °C yr−1) and at night, by 0.05 °C per year [6]. Using MODIS data, the scale of water temperature changes in three lakes in Brazil was determined, proving that they have warmed at a rate of 0.3 °C per decade [7].
At this point, it should be noted that despite the widespread use of MODIS satellite images for the study of aquatic ecosystems, they have not yet been utilized for the analysis of lake water temperatures in Poland (despite many years of experience in this area). Hence, the research conducted in the article represents a new approach, relating to lakes located in Central Europe, which arerelatively small on a global scale but significant in a regional context. Generally, it can be stated that thermal studies have primarily relied on in situ measurements conducted as part of hydrological monitoring by the Institute of Meteorology and Water Management, Poland. However, these datasets are relatively small, covering only a few dozen lakes out of more than 7000 [8] that exist in Poland. Against this backdrop, it is important to highlight a few coastal lakes located on the southern coast of the Baltic Sea that differ in terms of origin, morphometric features, and physicochemical properties of the water from the remaining thousands of lakes. As Gardner et al. [9] pointed out, coastal water systems often encompass a complex set of habitats and are susceptible to climate change and human activities, which affect, among other things, hydrology and water quality. Due to their specific nature, these lakes in Poland are the subject of numerous and varied studies [10,11,12,13,14,15,16]. Concerning water temperature, an elementary feature upon which both biotic and abiotic processes depend, long-term measurements have been conducted on the Polish coast for three lakes (Łebsko, Gardno, Jamno). For the remaining lakes, there are no in situ measurements. Modeling studies concerning water temperature based solely on air temperature have shown that coastal lakes had the lowest fit among all analyzed, which may have been influenced by the direct hydraulic connection with marine waters [17]. On the other hand, the results obtained based on remote sensing methods are encouraging for further analysis using these tools. For the three aforementioned lakes, the coefficient of determination of in situ measurements and Landsat images averaged 0.92 [18].
The aim of this study is to validate the 1-day and 8-day land surface temperature (LST) datasets from MODIS Terra and MODIS Aqua for monitoring the thermal conditions of coastal lakes. Additionally, this study assesses the suitability of MODIS data for analyzing the directions and magnitudes of long-term thermal changes in lake waters. This research provides important insights into the performance of various MODIS LST products in detecting thermal changes in water bodies and serves as a starting point for selecting the optimal MODIS LST dataset for water temperature monitoring.

2. Materials and Methods
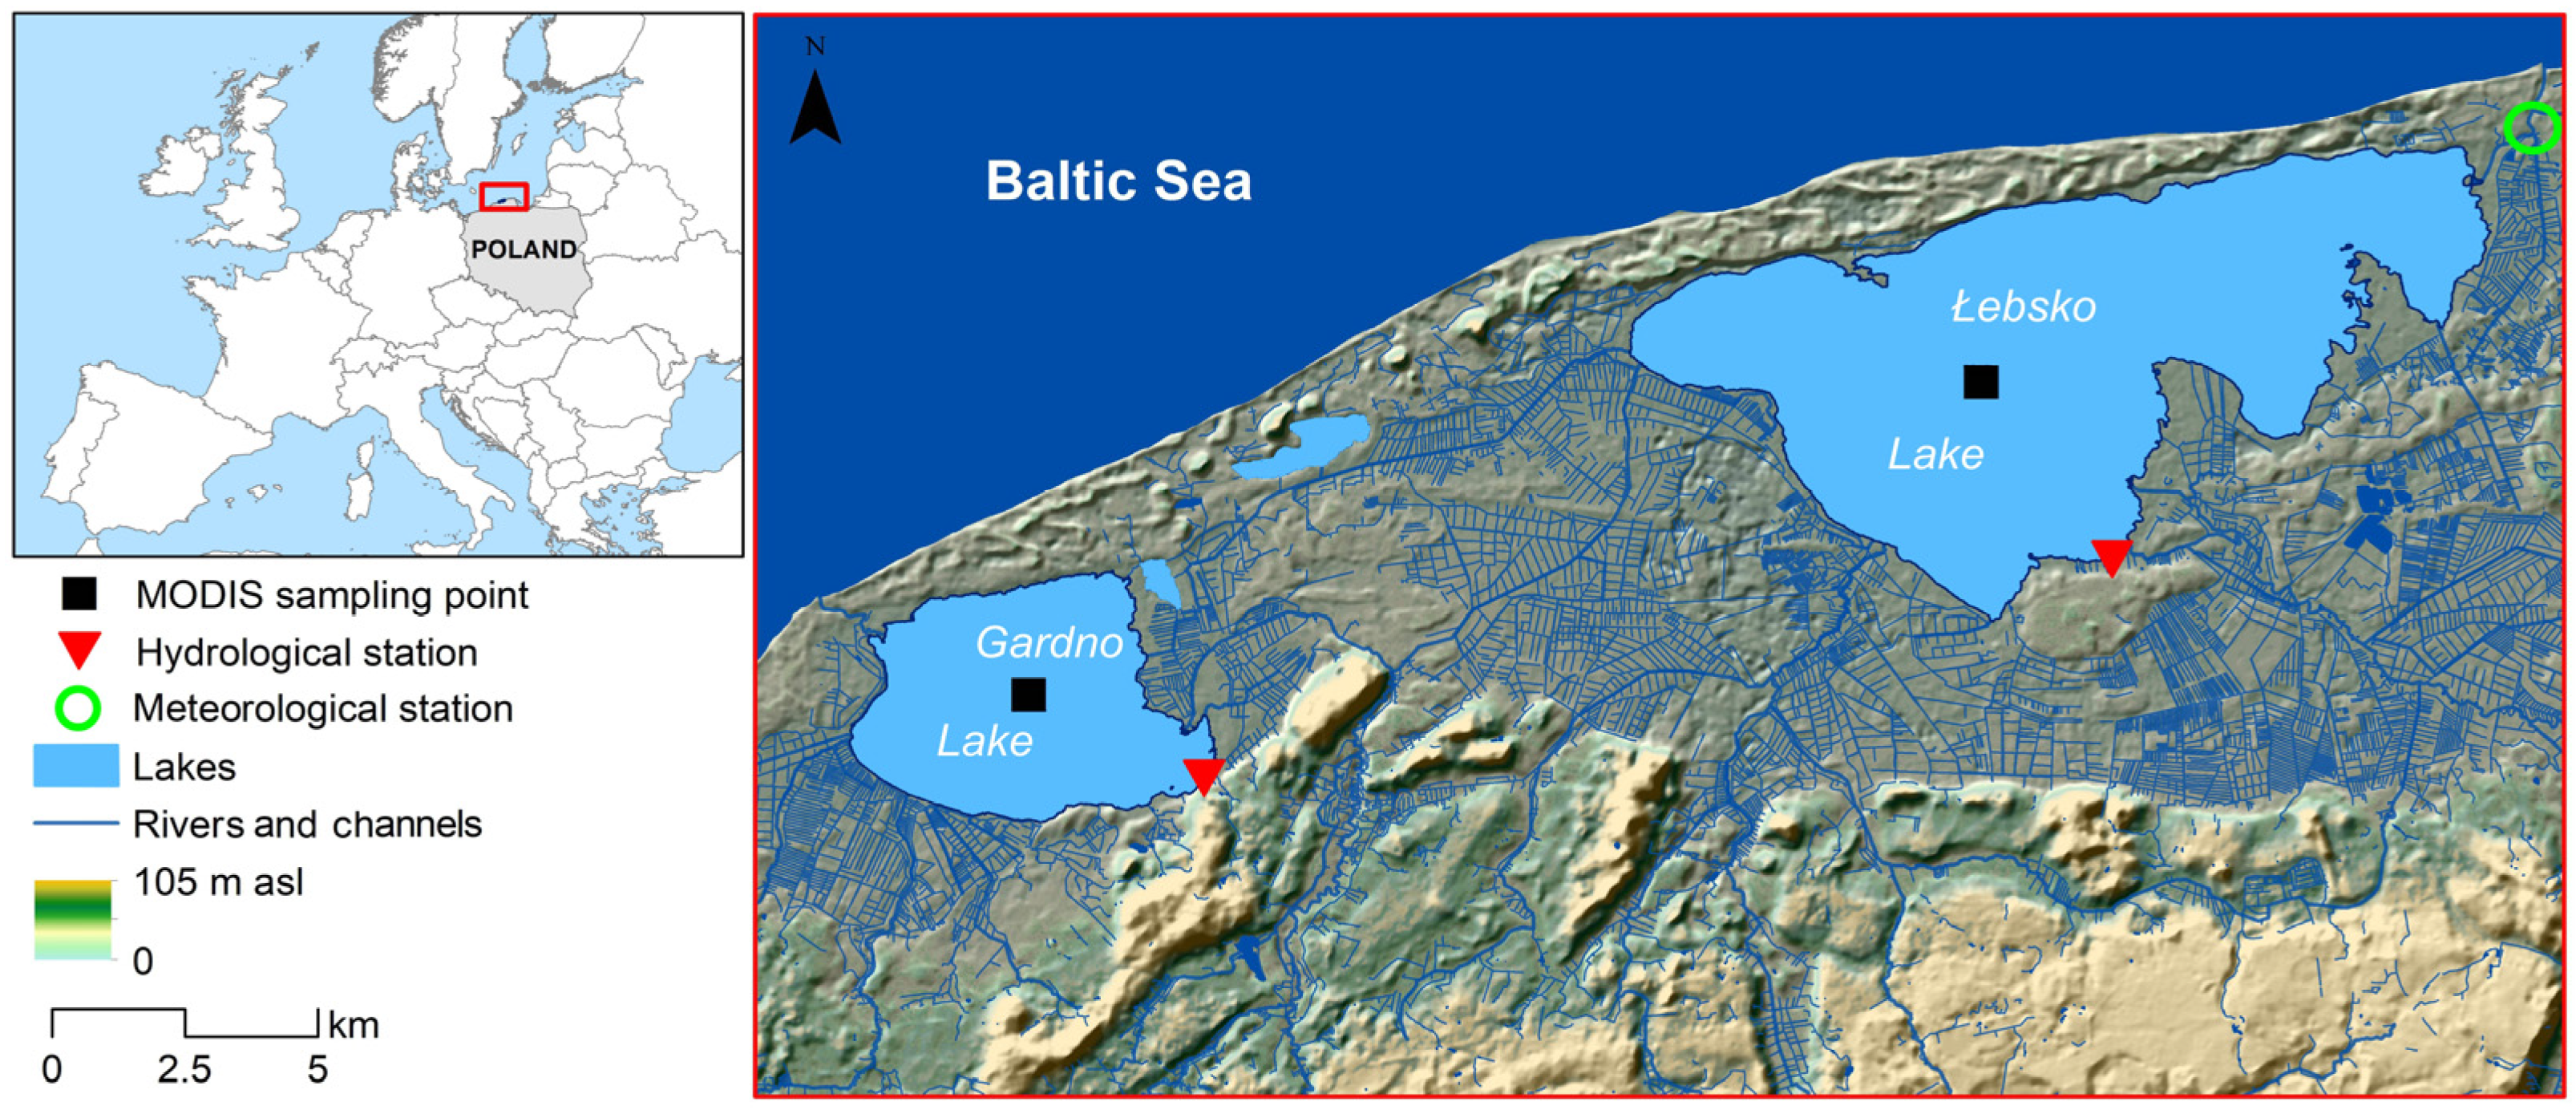
2.1. Study Area

This study focuses on the coastal lakes Łebsko and Gardno, which are located in northern Poland (Figure 1). These lakes are situated within the Słowiński National Park, which was established in 1967. Hydrologically, both lakes are located in the lower parts of the river basins of the Łeba River (Lake Łebsko) and the Łupawa River (Lake Gardno). Additionally, they have direct hydraulic connections to the Baltic Sea through channels. Marine intrusions are conditioned by hydrometeorological situations, such as winds from the northern sector and differences in water levels between the lakes and the sea. The basic morphometric characteristics for Łebsko and Gardno are as follows: area: 7140 ha and 2468.1 ha, average depth: 1.6 m and 1.3 m, maximum depth: 6.3 m and 2.6 m, volume: 117.5 million m³ and 30.9 million m³, shoreline length: 55.88 km and 23.35 km, respectively [19]. In terms of area, they are among the largest lakes in Poland, ranking third and sixth, respectively. Due to their shallow depths, both lakes are polymictic, experiencing multiple mixing events throughout the year. During winter, ice phenomena, including ice cover, occur, effectively isolating the water from external factors.

2.2. Materials

2.2.1. LST Datasets

In this study, data recorded by MODIS sensors carried by the Terra and Aqua satellites were used. MODIS sensors capture data twice a day during both the daytime and nighttime. The spatial resolution of the MODIS land surface temperature products is approximately 1 km. The 1-day datasets used in this study are as follows: MOD11A1.061-MODIS/Terra Land Surface Temperature/Emissivity Daily L3 Global 1 km SIN Grid [20], and MYD11A1.061-MODIS/Aqua Land Surface Temperature/Emissivity Daily L3 Global 1 km SIN Grid [21]. The surface temperature of the inland lakes in these products was obtained using thermal infrared (TIR) bands 31 and 32 and a generalized split-window algorithm. Quality assurance (QA) flags attached to the MODIS LST data were used during data selection for analysis. Mandatory QA flags indicate whether the LST is produced (QA01 = 00 or 01) or not (QA01 = 10 or 11, due to cloud effects or other factors). If the LST is produced, data quality flag QA23 indicates whether data are of good quality (QA23 = 00) and whether data are affected by thin cirrus and/or sub-pixel clouds (QA23 = 01) or not processed due to missing pixels or poor quality (QA23 = 10 or QA23 = 11). This study used all available data QA01 = 00 or 01. The studied lakes are within the coverage of scenes recorded at approximately 9:30 and 19:50 UTC for the Terra satellite and at 12:00 and 1:40 UTC for the Aqua satellite. These products are publicly available from NASA EarthData Search [22]. Additionally, 8-day LST datasets MOD11A2.061 [and MYD11A2.061 were used in this study. The LST values in MOD11A2 [23] and MYD11A2 [24] are the average of all corresponding 1-day LST values from MOD11A1 and MOD11A1 collected over this 8-day period. The locations of the data acquisition points from MODIS sensors are shown in Figure 1. The nearest-neighbor algorithm was used during LST MODIS data acquisition.
In this study, Google Earth Engine was used for the analysis of the 1-day and 8-day LST datasets [25]. The MODIS sensor on the Terra satellite has been recording data since February 2000, while the MODIS sensor on the Aqua satellite has been recording data since July 2002. During the comparative analysis of the quality of the LST datasets, it was decided to standardize the analysis period; thus, data from the years 2003–2022 were used. Due to the potential occurrence of ice phenomena on the lakes from November to March, it was decided that the analysis would cover the period from April to October.

2.2.2. In Situ Datasets

In this study, the results of daily water temperature measurements conducted from 2003 to 2022 by the Institute of Meteorology and Water Management–National Research Institute were used (www.dane.imgw.pl, (accessed on 18 June 2024)). The period from April to October was selected, when there is no ice cover on the analyzed lakes. Water temperature measurements are taken once a day at 6 UTC. The measurement points are located in the coastal zone (Figure 1), and measurements are taken at a depth of 0.4 m below the water surface, with an accuracy of ±0.1 °C. Additionally, cloud cover analysis was performed based on data from the Łeba meteorological station and was provided by the Institute of Meteorology and Water Management–National Research Institute.

2.3. Methods

2.3.1. MODIS Products Validation

The validation of the 1-day and 8-day LST products obtained from MODIS sensors aimed to identify which of these best matched the in situ measurement results. In this study, all 1-day and 8-day datasets were analyzed against the corresponding daily and eight-day average water temperatures from in situ measurements. The following metrics were used to assess the fit of the results: coefficient of determination (R2), root mean square error (RMSE), mean absolute error (MAE), and bias (BIAS) [26]. Calculations were performed for monthly periods, as well as for the period from April to October. Scatter plots and histograms showing the differences between MODIS LST data and in situ data were prepared for the April to October periods. Additionally, corresponding data for day and night, as well as data obtained from Terra and Aqua satellites, were compared. Calculations were performed for both 1-day and 8-day MODIS datasets.

2.3.2. Assessment of the Suitability of MODIS Data for Estimating Water Temperature Trends in Lakes
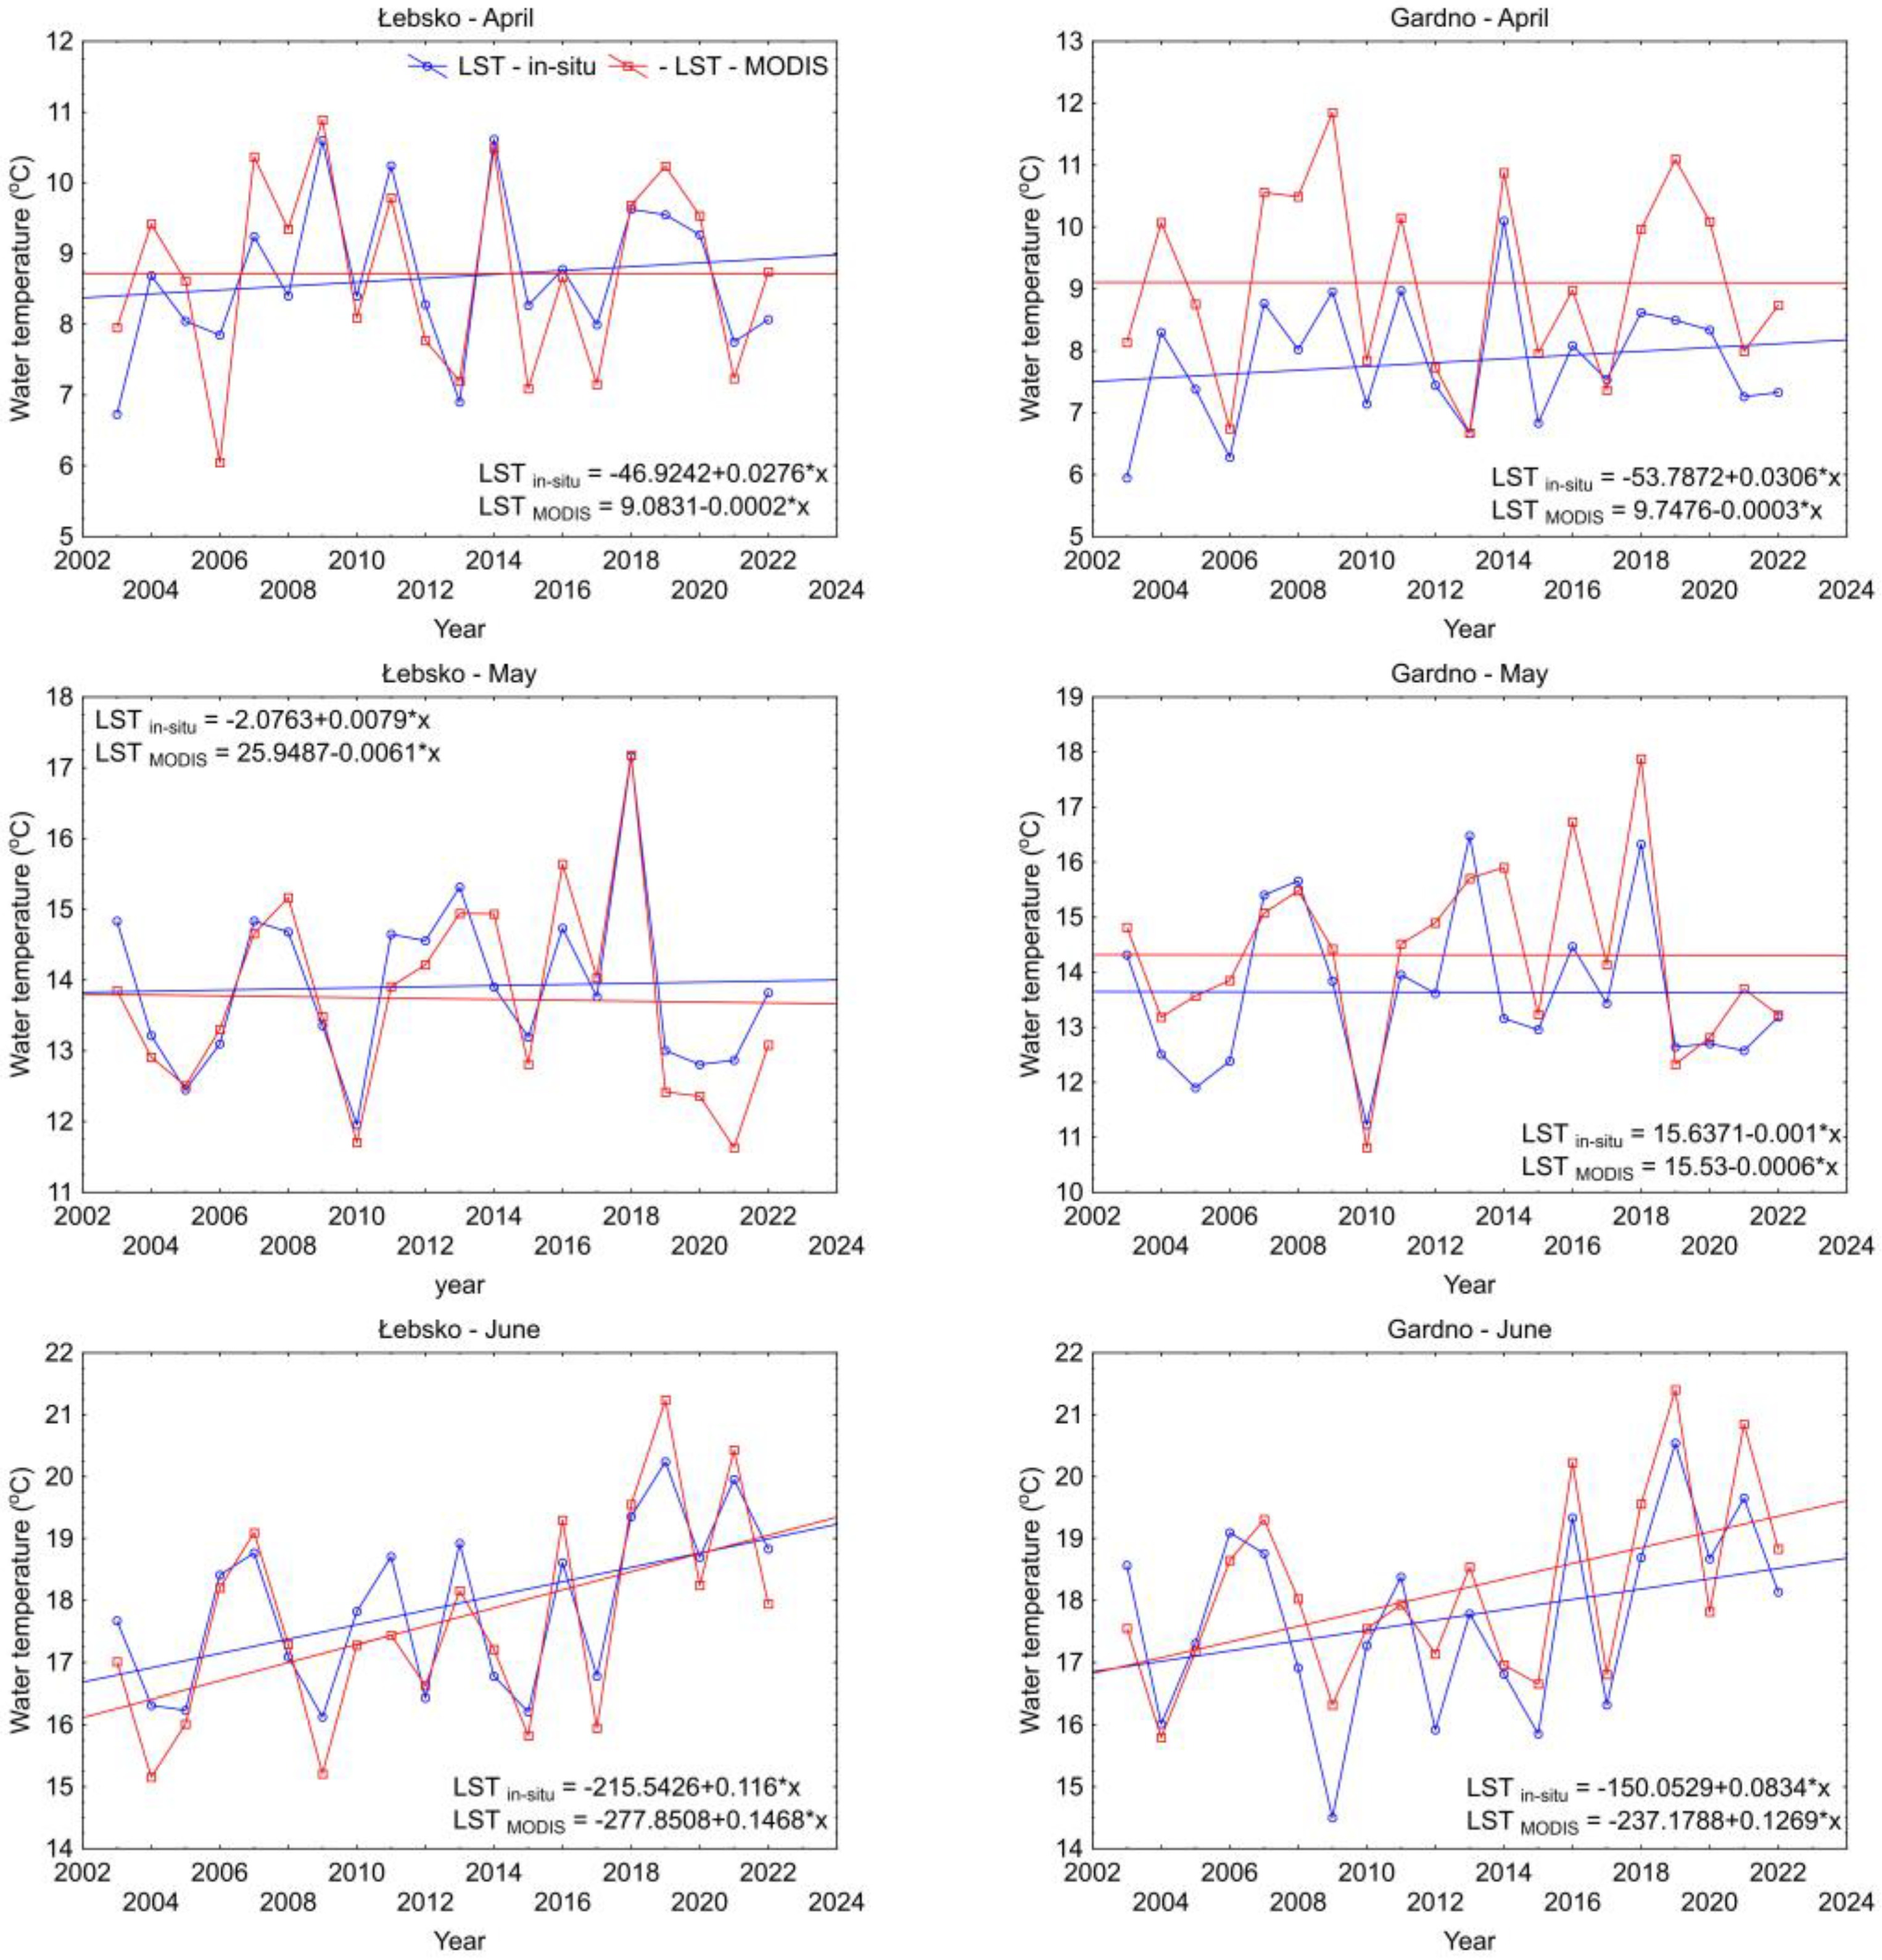
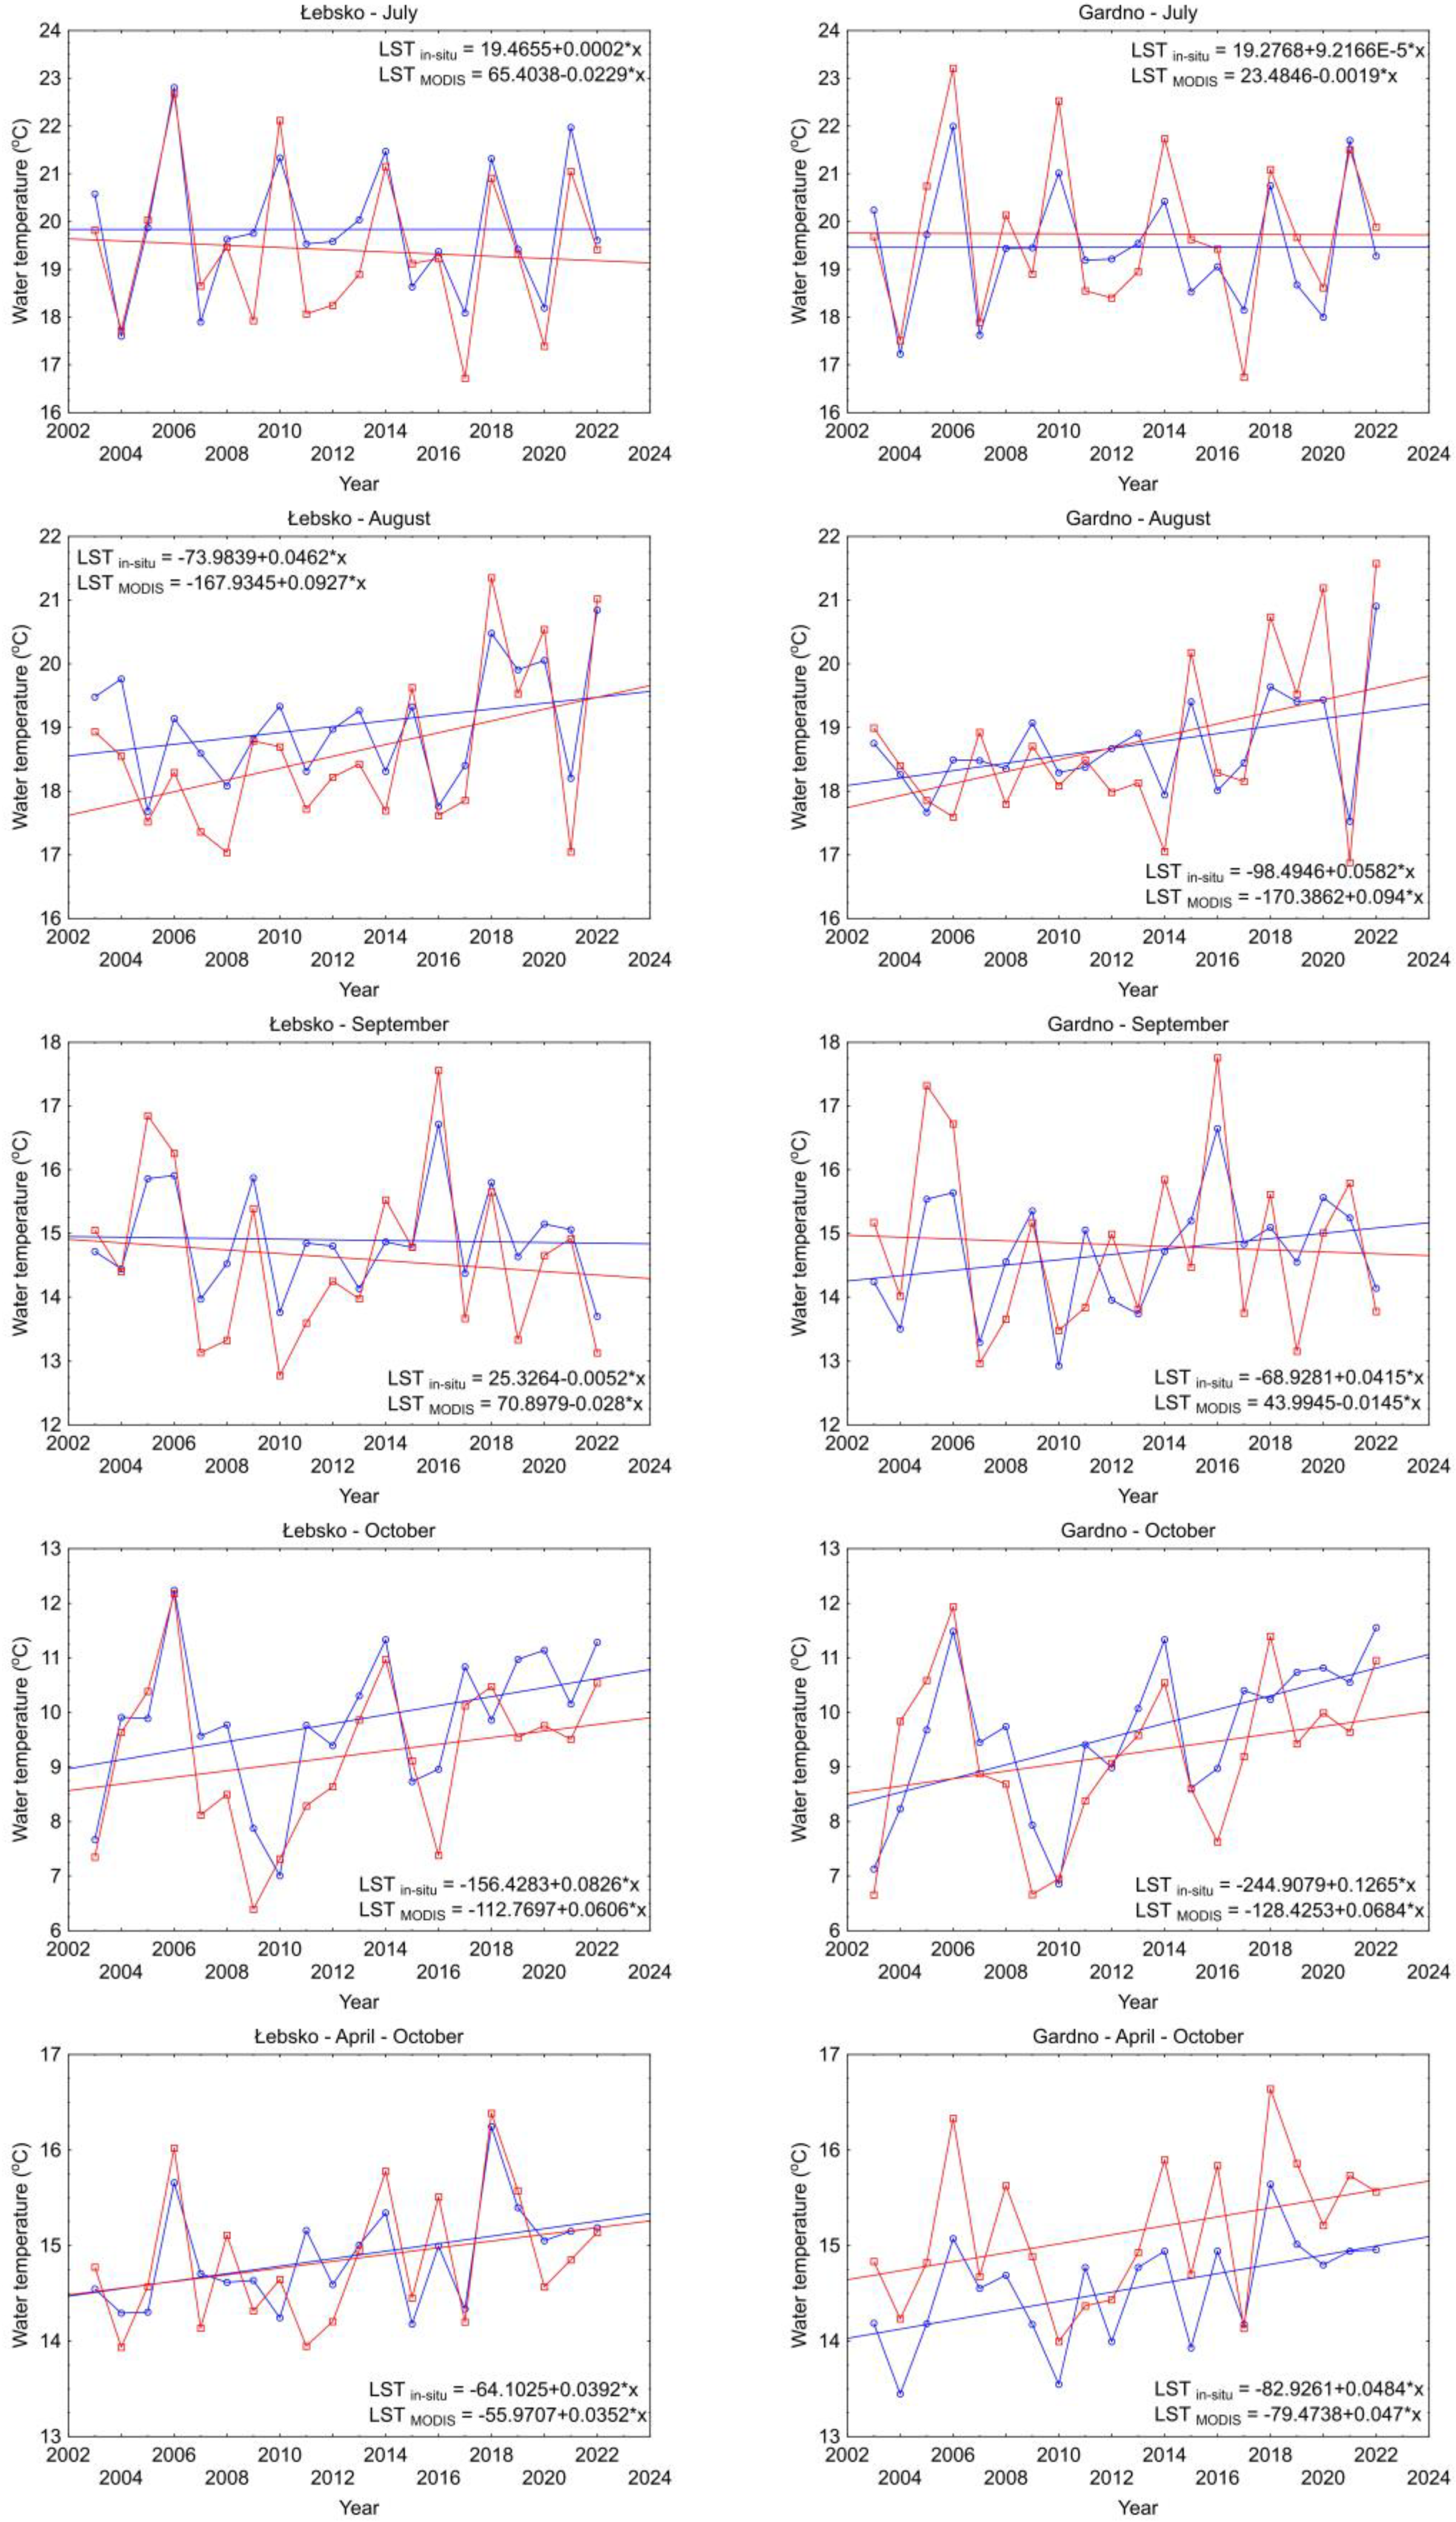
The analysis of the direction and magnitude of water temperature changes is most often performed using the non-parametric Mann–Kendall (MK) and Sen’s tests. The MK test helps determine whether changes in lake water temperature over a specified time period are significant (increase or decrease) or not (no change). The advantage of the MK test is its robustness against the presence of outliers. In this study, the MK test was conducted for the years of 2003–2022 (a 20-year period) based on data from the best-fitting 1-day and 8-day MODIS datasets. The analysis was performed for individual months, as well as for the period from April to October. The MK test was carried out in stages [27]. First, the S statistic value was calculated using the following formula:
S = k = 1 n 1 j = k + 1 n sgn ( x j x k )
where n is the length of the surface water temperature series (n = 20), and xk and xj are the values of time series k, j (j > k). The values of sgn(xjxk) were calculated as follows:
sgn   x j x k = 1   for   x j x k > 0 0   for   x j x k = 0 1   for   x j x k < 0
In the second stage, the variance values Var(S) of the S parameter were calculated, which, when E(S) = 0, are calculated using the following formula:
Var ( S ) = 1 18 · ( n · ( n 1 ) · ( 2 · n + 5 ) )
Given that the main assumption of the MK test is the absence of autocorrelation in the time series, and considering that autocorrelation can occur and lead to underestimation of Var(S), the corrected value Var*(S) was calculated using the following formula:
Var * ( S ) = Var ( S )   ·   n n s *
where n n s * is the effective number of observations that is calculated using the following formula:
n n s * = 1 + 2 n ( n 1 ) ( n 2 ) · k = 1 n 1 ( n k ) ( n k 1 ) ( n k 2 ) ρ k
where k is change, and ρk is significant coefficient of autocorrelation. Finally, the value of standardized statistic Z was calculated based on the following formula:
Z = S 1 V a r ( S )   for   S > 0 0   for   S = 0 S + 1 V a r ( S )   for   S < 0
The Z positive or negative values showed an upward or downward trend, respectively. The null hypothesis of no trend was rejected if the absolute value of Z was greater than 1.96 or lower than −1.96 for a significant level of α = 0.05.
The magnitude of water temperature changes was determined using Sen’s test [27], employing the following formula:
S l o p e i = m e d i a n x j x k j k ( 1 k < j < n )
where xk and xj are the surface water temperature time series k, j (j > k) values, respectively, and Sen’s slope estimator is the median value of Slopei (1 ≤ i < n(n − 1)). Whereas the median value (Slopei = n(n − 1)/2) is used as the slope value if n(n − 1) is odd, the average value of Slopei = (n(n − 1) − 1)/2 and Slopei = (n(n − 1) + 1)/2 is used as the slope value if n(n − 1) is even.
The obtained results for the MK and Sen’s tests for the monthly average values and the period from April to October were based on MODIS 1-day data. Finally, a linear regression analysis was conducted using the monthly averages and the period from April to October water temperatures from in situ measurements and those calculated based on the data from MODIS sensors recorded during the day.

3. Results

The variability of daily in situ water temperatures in the Gardno and Łebsko lakes from 2003 to 2022, during the period from April to October, ranged from 0.1 to 26.3 °C. The lowest temperatures occurred in April, and the highest occurred at the turn of July and August. During the analyzed period, there was considerable variability in the daily temperatures (Figure 2). The average temperatures for the period of 2003–2022 are marked in red, while the minimum and maximum values are marked in blue and green, respectively.
The analysis of 1-day LST results obtained from MODIS sensors compared to in situ measurements for the period from April to October showed that the average BIAS values ranged from −0.7 to 1.4 °C (Figure 3 and Figure 4). The RMSE values ranged from 1.7 to 2.2 °C, with an average value of 1.9 °C, and the MAE values ranged from 1.2 to 1.6 °C, with an average value of 1.6 °C. The R2 values ranged from 0.85 to 0.88. Generally, the RMSE, MAE, and R2 results for the Łebsko and Gardno lakes are approximately at the same level, with differences typically not exceeding 0.2 °C. In both cases, the largest deviations from in situ data were obtained for the 1-day data from the MODIS sensor on the Aqua satellite recording at night. The RMSE values were 2.2 and 2.1 °C, and the MAE values were 1.6 and 1.5 °C. The average BIAS values were 1.4 and 1.2 °C, indicating that the 1-day MODIS results are lower than those recorded in situ. In other cases, the results for Lake Łebsko for the MODIS Terra day, MODIS Terra night, and MODIS Aqua day sensors were at a similar level. The minimum and maximum BIAS values ranged widely, from −8.8 to 10.4 °C, with an average value ranging from 0.1 to 0.8 °C. The averaged RMSE and MAE values are 1.7 and 1.3 °C. A similar pattern of results was obtained for Lake Gardno (Figure 4).
The analysis of 1-day LST values from MODIS sensors compared to in situ data shows that they are generally lower. For Lake Łebsko, particularly in the lower temperature range, up to about 12 °C, the 1-day LST MODIS values deviate more from the in situ measurements. Generally, the linear regression lines (red lines) are almost entirely above the 1:1 slope lines (blue line) (Figure 5). An exception can be observed in the MODIS Aqua-day data for Lake Łebsko, where the red and blue lines intersect at the 16 °C level. For Lake Gardno, in almost all cases, the linear regression line (red) is positioned above and below the 1:1 line (blue line) (Figure 6). This indicates that lower temperatures in the lake are generally underestimated, while higher temperatures are more frequently overestimated. An exception for Lake Gardno is the MODIS Aqua night data, in which the results are underestimated across the entire range.
The example results of 1-day LST for Lake Łebsko, compared to in situ measurements, are presented for the period from April to October 2019 (Figure 7). The lowest RMSE value of 1.7 °C was obtained for the 1-day MODIS Aqua day and Terra day data, while the highest RMSE value of 2.3 °C was for the 1-day Aqua night data. The MAE values ranged from 1.2 °C for the 1-day Terra day and Terra night data to 1.7 °C for the 1-day Aqua night data. The R2 values ranged from 0.86 to 0.89. These results clearly show that for 1-day MODIS Aqua and Terra data recorded during the day, there are noticeable positive and negative deviations. In contrast, for data recorded at night, there are generally high negative deviations, which are particularly evident for MODIS Aqua night data.
Analyzing the obtained results on a monthly basis for Lake Łebsko, the lowest values of RMSE, MAE, and BIAS for 1-day LST were obtained in April and October, while the highest values were obtained in June and July. A detailed summary of these analysis results is presented in Table S1.
Comparing the 1-day LST MODIS data obtained from Terra and Aqua for day and night, it was found that the smallest differences occur between the values recorded during the day by MODIS sensors on Aqua and Terra, for both Lake Łebsko and Lake Gardno. Generally, the 1-day LST daytime temperatures from MODIS Aqua are higher than those from Terra. For Lake Łebsko, the average deviation of these measurements is up to 0.4 °C. The deviation values within the 5th to 95th percentile range were −2.1 to 3.0 °C. During the period from April to October, the average deviation was 0.2 °C (Figure 8), and the deviations for the 5th to 95th percentile range were −1.5 to 1.9 °C. For Lake Gardno, the average deviation of 1-day daytime measurements from Aqua and Terra ranges from 0.2 to 0.5 °C. The deviation values for the 5th to 95th percentile range were −1.7 to 2.6 °C. During the period from April to October, the average deviation of 1-day daytime measurements from Aqua and Terra is 0.4 °C (Figure 8), and the deviation values for the 5th and 95th percentiles were −1.2 and 1.7 °C, respectively.
The next products evaluated for their suitability in assessing water temperature in lakes in Poland were the 8-day LST products from MODIS Aqua and Terra for both day and night. These results were considered because inter-day thermal changes in lake water are not as dynamic as in rivers. This study was conducted in a manner analogous to the 1-day LST analysis, with the difference being that the 8-day LST values were compared with the average values from in situ measurements over 8 days (from day n to n – 7, where n is the day of temperature recording by MODIS). The results are synthetically presented in Table S2.
The results indicate that the RMSE and MAE values for monthly periods and for the period from April to October are higher in every case than the values obtained for 1-day LST. The RMSE values for the period from April to October range from 2.2 to 2.6 °C, and the MAE values range from 1.7 to 2.1 °C. Analyzing the results for individual months, it was shown that RMSE values can reach up to 3.2 °C, and MAE values can reach up to 2.9 °C. This indicates that the suitability of the 8-day MODIS LST products is very limited in limnological studies.
Given that the lowest deviations of MODIS results from in situ measurements occur for daytime imagery, it was decided to integrate the 1-day LST data from MODIS Aqua and Terra. The integration was performed as follows: when data from both MODIS sensors were available on a given day, the results of these measurements were averaged; in other cases, the result recorded by one of the sensors was used. This way, a series was obtained in which the interval between consecutive measurements in individual months ranged from 1.6 to about 1.9 days. Only in October, the average interval between consecutive measurements was 2.3 days. Considering the period from April to October, the interval between consecutive measurements averaged 1.8 days. Based on these available MODIS data, monthly average values and the average value for the period from April to October for the years 2003–2022 were calculated. The corresponding average values from satellite data and in situ measurements were compared by calculating the BIAS, RMSE, MAE, and R2 values (Table 1). The RMSE values for individual months ranged from 0.59 to 1.53 °C, the MAE values ranged from 0.48 to 1.30 °C, the BIAS values ranged from −1.28 to 0.63 °C, and the R2 values ranged from 0.56 to 0.87. The RMSE, BIAS, and MAE statistics for Lake Łebsko were generally lower than those for Lake Gardno.
Finally, Mann–Kendall and Sen’s tests were performed based on the average monthly temperatures and the April to October period using in situ and MODIS data (Table 2). The results show that for Lake Łebsko, a significant increase in water temperatures was demonstrated for June and the period from April to October based on both in situ and MODIS data. However, analyzing the values of Sen’s statistics, which illustrate changes in water thermics from 2003 to 2022, they significantly differ, ranging from −0.36 to 0.47 °C per decade. For Lake Gardno, a significant increase in water temperature based on in situ data was shown for October and the period from April to October. On the other hand, based on MODIS data, an increasing water temperature trend was shown for June. The differences in values between Sen’s coefficient ranged from −0.32 to 0.37 °C per decade.
Similar results were obtained by performing linear regression analysis (Figure 9). The slope values of the regression lines differ significantly for the in situ and MODIS time series.

4. Discussion

Considering the development of satellite data acquisition and processing technologies and their increasing availability, it can be stated that they are widely used in scientific research. As Cretaux and Berge-Nguyen [28] note, satellite data can significantly enhance our understanding of hydrological processes occurring in lakes, reservoirs, and floodplains. Publicly available satellite data serve as an alternative or even the sole source of information on water temperature in lakes [29]. In lakes in which water temperature has not been sufficiently captured by in situ measurements, satellite data can be used [30]. Coastal lakes form a specific group of lakes [31]. Despite this, the state of knowledge in Poland regarding one of the fundamental parameters, water temperature, is limited, and continuous monitoring does not cover all lakes. The research undertaken in this work, utilizing MODIS satellite data, aims to explore their potential based on two reference lakes, for which daily in situ measurements are conducted.
The results obtained indicate that MODIS satellite imagery generally shows good alignment with in situ measurements (average RMSE of 1.9 °C) and is comparable to earlier, similar studies in this field. For Lake Taihu, the R2 for water temperature obtained through MODIS imagery and in situ measurements was higher than 0.96, with an RMSE ranging between 1.2 °C and 1.8 °C [32]. In the case of Lake Ontario, satellite measurements were strongly correlated with in situ measurements, R2 = 0.98 [33]. The results for 22 Finnish lakes show good consistency between MODIS and in situ measurements, with an average BIAS of −1.13 °C [34]. Satellite measurements of water temperatures of the Great Lakes were correlated with in situ observations at an R2 of 0.91, with a deviation of −1.10 °C and an RMSE of 1.39 °C [35]. Comparisons of water temperature information based on MODIS for the Great Salt Lake show a deviation of −1.5 °C relative to field observations [36]. The agreement between MODIS-determined LST and the observed in situ subsurface temperature is highly dependent on the thermal structure of the lake [37]. Better results are obtained during the water mixing period and worse during the stratification period. Yang et al. [37] also show that MODIS LST has good accuracy for the lakes on the Tibetan Plateau, with an RMSE of less than 1.6 °C.
According to the study by Guo et al. [38], the 1-day MODIS dataset was found to be comparable to other satellite LST products, such as those with AVHRR and ARCLake, but it stands out in terms of temporal span and resolution. Oesch et al. [39] point out that one of the main sources of error in acquiring water temperature data is cloud cover. Poland is a country characterized by relatively high levels of cloudiness [40], which is also evident in the coastal zone in which the lakes studied in this work are located. For the Łeba station during the period covered by this study, the average overall cloud cover was 60%. The most frequently observed clouds were stratocumulus (25.4%), followed by cumulus (21%), cirrus (19%), and altocumulus (18%). This situation limited the availability of MODIS imagery and, consequently, led to discrepancies in the analysis of trend changes compared to in situ data. Between 2003 and 2022 (April–October), nearly 4100 in situ measurement records were noted, with only 2300 satellite data records available for analysis. This highlights the limitations of this methodology in regions where environmental factors such as high cloud frequency can prevent long-term analysis. On the other hand, it should be emphasized that in conditions in which there are no factors disrupting the interpretation of satellite data, the results obtained show high consistency with the in situ measurements. Nevertheless, despite the generally good fit, the differences noted at that time can be attributed to several factors, including measurements in different sectors of the lake, measurements at various depths, or measurements at different times of the day. Based on single in situ measurements conducted at two points in Lake Łebsko (the coastal zone and a deep area), it was found that these differences were small, averaging 0.6 °C in 2012 and 0.4 °C in 2013. The surface water layer may differ from deeper layers depending on sunlight or transient variables, such as wind speed and direction. Additionally, the heat exchange rate between the water and atmosphere varies depending on the time of day. To eliminate possible sources of error, future field measurement campaigns should be planned to coincide in depth and timing with the MODIS satellite revisit times. Considering the thermal stability of the water, this creates an alternative for monitoring water temperature in lakes where no field observations are conducted. Although the results indicate that MODIS data can serve as a source for lakes not covered by monitoring, the analyses of monthly trends and the period from April to October differ from those obtained from in situ measurements. This is due to the fact that MODIS LST datasets are not complete (they have gaps) and include outlier values. Contrary to these findings, Yang et al. [41] show that different MODIS LST products have similar performance in monitoring LST trends, suggesting that these products reflect well the variability of the thermal environment, regardless of the specific MODIS LST product used.
The characteristics of coastal lakes, primarily their shallow depths and large surfaces, make them particularly vulnerable to processes related to eutrophication. Therefore, potential actions aimed at minimizing the effects of these threats require extensive knowledge regarding many components. The results obtained in this study may have broader implications, not only for other coastal lakes but also for those where, for various reasons (logistical, economic), stationary observations are not conducted. Despite general regional patterns of lake responses to climatic conditions, each lake may have its own individual characteristics [42]. Therefore, further detailing the scope of data on additional lakes in relation to water temperature creates theoretical foundations for managing water resources in the context of their quantity and quality. This is particularly important in the era of global warming and the observed transformation of aquatic ecosystems. For example, data on lake temperatures in China derived from the MODIS dataset have been used to analyze heatwaves [43].

5. Conclusions

In this study, remote sensing data were used to characterize the thermal conditions of two lakes in the coastal zone of the southern Baltic. Despite long-term observations and studies of the thermal regime of lakes in Poland, the use of data from the MODIS satellite is the first approach of its kind, indicating the usefulness and limitations of the analyzed materials. The average difference between data from satellite images and field measurements for RMSE is 1.9 °C, which corresponds to earlier studies of this type. Due to the influence of environmental elements (high cloudiness), the satellite dataset was nearly half as small as continuous field observations. This constitutes a limitation in continuous long-term analyses, in which the observed trends of changes were mostly varied for both sources. Based on the conducted research, it can be concluded that the usefulness of MODIS images for determining long-term trends in water temperature changes is insufficient. This is conditioned by the climatic characteristics of the studied region and the availability of high-quality images (free from cloud cover). Additionally, it should be noted that the period of the year not analyzed in this study (November–March) has an even higher percentage of cloud cover. Nevertheless, the results obtained in this work are encouraging for further thermal research using the MODIS satellite in relation to lakes where there are no field observations. The implementation of such assumptions should, however, be supported by (even short-term) in situ measurements, allowing for the verification of the obtained results. Expanding knowledge of the thermal regime for as many lakes as possible creates a basis for assessing their response to various environmental variables and, in a longer perspective, constitutes a theoretical basis for their management, including potential remediation actions.

Supplementary Materials

The following supporting information can be downloaded at https://www.mdpi.com/article/10.3390/rs16152727/s1: Table S1. Validation of water temperature estimation in Lakes Łebsko and Gardno on the basis of 1-day MODIS satellite data; Table S2. Validation of water temperature estimation in Lakes Łebsko and Gardno on the basis of 8-day MODIS satellite data.

Author Contributions

Conceptualization M.S. and M.P.; methodology, M.S.; software, M.S.; validation, M.S.; formal analysis, M.S.; investigation, M.S.; resources, M.S. and M.P.; data curation, M.S. and M.P.; writing—original draft preparation, M.S., M.P., K.S.-P. and S.Z.; writing—review and editing, M.S., M.P., K.S.-P. and S.Z., visualization, M.S.; supervision, M.S. and M.P.; project administration, M.P.; funding acquisition, M.P. and K.S.-P. All authors have read and agreed to the published version of the manuscript.

Funding

This research received no external funding.

Data Availability Statement

www.dane.imgw.pl, (accessed on 18 June 2024).

Acknowledgments

The authors acknowledge the Institute of Meteorology and Water Management–National Research Institute in Poland for providing the data used in this study.

Conflicts of Interest

The authors declare no conflicts of interest.

References

  1. Tariq, A.; Shu, H.; Kuriqi, A.; Siddiqui, S.; Gagnon, A.S.; Lu, L.; Linh, N.T.T.; Pham, Q.B. Characterization of the 2014 Indus River Flood Using Hydraulic Simulations and Satellite Images. Remote Sens. 2021, 13, 2053. [Google Scholar] [CrossRef]
  2. Ma, C.; Zhao, J.; Ai, B.; Sun, S.; Yang, Z. Machine Learning Based Long-Term Water Quality in the Turbid Pearl River Estuary, China. J. Geophys. Res. Ocean. 2022, 127, e2021JC018017. [Google Scholar] [CrossRef]
  3. Pamirbekkyzy, M.; Chen, X.; Liu, T.; Duulatov, E.; Gafurov, A.; Omorova, E.; Gafurov, A. Hydrological Forecasting under Climate Variability Using Modeling and Earth Observations in the Naryn River Basin, Kyrgyzstan. Water 2022, 14, 2733. [Google Scholar] [CrossRef]
  4. Petrakis, R.E.; Soulard, C.E.; Waller, E.K.; Walker, J.J. Analysis of Surface Water Trends for the Conterminous United States Using MODIS Satellite Data, 2003–2019. Water Resour. Res. 2022, 58, e2021WR031399. [Google Scholar] [CrossRef]
  5. Chavula, G.; Brezonik, P.; Thenkabail, P.; Johnson, T.; Bauer, M. Estimating the surface temperature of Lake Malawi using AVHRR and MODIS satellite imagery. Phys. Chem. Earth 2009, 34, 749–754. [Google Scholar] [CrossRef]
  6. Wang, Y.; Luo, Y.; Tan, W.; Su, H. Analysis of Temporal and Spatial Variation Process of Dianchi Lake Surface Water Temperature Based on MODIS Remote Sensing Images. IOP Conf. Ser. Earth Environ. Sci. 2021, 658, 012005. [Google Scholar] [CrossRef]
  7. Tavares, M.H.; Cardoso, M.A.; Motta Marques, D.; Bonnet, M.-P.; Fragoso, C.R. High Spring Warming Rates in an Extensive Subtropical Shallow Lakes System Detected Using MODIS Imagery. ACS ES T Water 2024, 4, 1518–1530. [Google Scholar] [CrossRef]
  8. Choiński, A. Katalog Jezior Polski; Wydawnictwo Naukowe UAM: Poznąń, Poland, 2006. [Google Scholar]
  9. Gardner, E.A.; Burningham, H.; Thompson, J.R. Impacts of climate change and hydrological management on a coastal lake and wetland system. Ir. Geogr. 2019, 52, 21–48. [Google Scholar] [CrossRef]
  10. Trojanowski, J.; Antonowicz, J. Właściwości chemiczne osadów dennych jeziora Dołgie Wielkie. Słupskie Pr. Biol. 2005, 2, 123–133. [Google Scholar]
  11. Kujawa-Pawlaczyk, J.; Pawlaczyk, P. Planowanie ochrony siedlisk nadmorskich w obszarze Natura 2000 na przykładzie obszaru Jezioro Wicko i Modelskie Wydmy PLH320068. Przegląd Przyr. 2019, 30, 27–57. [Google Scholar]
  12. Senze, M.; Kowalska-Góralska, M.; Pokorny, P.; Kruszyński, W. Bioaccumulation of Heavy Metals in Hydromacrophytes from Five Coastal Lakes (North-Western Poland, Baltic Sea). Acta Univ. Agric. Silvic. Mendel. Brun. 2017, 65, 1265–1277. [Google Scholar] [CrossRef]
  13. Rychert, K.; Myszka, M.; Wielgat-Rychert, M.; Skuza, E. Importance of tintinnids and Mesodinium rubrum in communities of planktonic ciliates in the shallow brackish lakes Gardno and Lebsko (northern Poland). Balt. Coast. Zone 2017, 21, 233–244. [Google Scholar]
  14. Plewa, K.; Perz, A.; Wrzesiński, D.; Sobkowiak, L. Probabilistic Assessment of Correlations of Water Levels in Polish Coastal Lakes with Sea Water Level with the Application of Archimedean Copulas. Water 2019, 11, 1292. [Google Scholar] [CrossRef]
  15. Mrozińska, N.; Bąkowska, M. Effects of Heavy Metals in Lake Water and Sediments on Bottom Invertebrates Inhabiting the Brackish Coastal Lake Łebsko on the Southern Baltic Coast. Int. J. Environ. Res. Public Health 2020, 17, 6848. [Google Scholar] [CrossRef] [PubMed]
  16. Różyński, G.; Cerkowniak, G.R. Resilience of Coastal Lake Barriers in Poland in Light of Geological and Bathymetric Data and Hydrodynamic Simulations. Front. Mar. Sci. 2022, 9, 815405. [Google Scholar] [CrossRef]
  17. Zhu, S.; Ptak, M.; Yaseend, Z.M.; Daia, J.; Sivakumar, B. Forecasting surface water temperature in lakes: A comparison of approaches. J. Hydrol. 2020, 585, 124809. [Google Scholar] [CrossRef]
  18. Ptak, M.; Choiński, A.; Piekarczyk, J.; Pryłowski, T. Application of Landsat satellite thermal images in the analysis of the temperature of Polish lakes. Pol. J. Environ. Stud. 2017, 26, 2159–2165. [Google Scholar] [CrossRef] [PubMed]
  19. Jańczaka, J. (Ed.) Atlas Jezior Polski: Praca Zbiorowa. T.2, Jeziora Zlewni Rzek Przymorza i Dorzecza Dolnej Wisły; Instytut Meteorologii i Gospodarki Wodnej: Warszawa, Poland, 1997. [Google Scholar]
  20. Wan, Z.; Hook, S.; Hulley, G. MODIS/Terra Land Surface Temperature/Emissivity Daily L3 Global 1km SIN Grid V061 [Data Set]. NASA EOSDIS Land Processes Distributed Active Archive Center. 2021. Available online: https://lpdaac.usgs.gov/products/mod11a1v061/ (accessed on 15 July 2024).
  21. Wan, Z.; Hook, S.; Hulley, G. MODIS/Aqua Land Surface Temperature/Emissivity Daily L3 Global 1km SIN Grid V061 [Data Set]. NASA EOSDIS Land Processes Distributed Active Archive Center. 2021. Available online: https://lpdaac.usgs.gov/products/myd11a1v061/ (accessed on 15 July 2024).
  22. Available online: https://search.earthdata.nasa.gov (accessed on 15 July 2024).
  23. Wan, Z.; Hook, S.; Hulley, G. MODIS/Terra Land Surface Temperature/Emissivity 8-Day L3 Global 1km SIN Grid V061 [Data Set]. NASA EOSDIS Land Processes Distributed Active Archive Center. 2021. Available online: https://lpdaac.usgs.gov/products/mod11a2v061/ (accessed on 15 July 2024).
  24. Wan, Z.; Hook, S.; Hulley, G. MODIS/Aqua Land Surface Temperature/Emissivity 8-Day L3 Global 1km SIN Grid V061 [Data Set]. NASA EOSDIS Land Processes Distributed Active Archive Center. 2021. Available online: https://lpdaac.usgs.gov/products/myd11a2v061/ (accessed on 15 July 2024).
  25. Gorelick, N.; Hancher, M.; Dixon, M.; Ilyushchenko, S.; Thau, D.; Moore, R. Google Earth Engine: Planetary-scale geospatial analysis for everyone. Remote Sens. Environ. 2017, 202, 18–27. [Google Scholar] [CrossRef]
  26. Sojka, M.; Ptak, M. Possibilities of River Water Temperature Reconstruction Using Statistical Models in the Context of Long-Term Thermal Regime Changes Assessment. Appl. Sci. 2022, 12, 7503. [Google Scholar] [CrossRef]
  27. Gilbert, R.O. Statistical Methods for Environmental Pollution Monitorin; Van Nostrand Reinhold Co.: New York, NY, USA, 1987; p. 320. [Google Scholar]
  28. Cretaux, J.F.; Berge-Nguyen, M. Aral Sea hydrology from satellite remote sensing. In The Aral Sea: The Devastation and Partial Rehabilitation of a Great Lake; Micklin, P., Aladin, N.V., Plotnikov, I., Eds.; Springer: Berlin, Germany, 2014; pp. 273–299. [Google Scholar]
  29. Duan, Z.; Bastiaanssen, W.G.M. Characterizing spatial and temporal variations of surface temperature of Lake Tana (Ethiopia) using MODIS data. In Proceedings of the 2013 IEEE International Geoscience and Remote Sensing Symposium—IGARSS, Melbourne, VIC, Australia, 21–26 July 2013. [Google Scholar]
  30. Zhang, X.; Wang, K.; Frassl, M.A.; Boehrer, B. Reconstructing Six Decades of Surface Temperatures at a Shallow Lake. Water 2020, 12, 405. [Google Scholar] [CrossRef]
  31. Choiński, A.; Ptak, M.; Strzelczak, A. Present-day evolution of coastal lakes based on the example of Jamno and Bukowo (the Southern Baltic coast). Oceanol. Hydrobiol. Stud. 2014, 43, 178–184. [Google Scholar] [CrossRef]
  32. Liu, G.; Ou, W.; Zhang, Y.; Wu, T.; Zhu, G.; Shi, K.; Qin, B. Validating and Mapping Surface Water Temperatures in Lake Taihu: Results from MODIS Land Surface Temperature Products. IEEE J. Sel. Top. Appl. Earth Obs. Remote Sens. 2015, 8, 1230–1244. [Google Scholar] [CrossRef]
  33. Watkins, J.M. Comparison of shipboard and satellite measurements of surface water temperature and chlorophyll a in Lake Ontario. Aquat. Ecosyst. Health Manag. 2009, 12, 271–280. [Google Scholar] [CrossRef]
  34. Pour, H.K.; Duguay, C.R.; Solberg, R.; Rudjord, Ø. Impact of satellite-based lake surface observations on the initial state of HIRLAM. Part I: Evaluation of remotelysensed lake surface water temperature observations. Tellus Ser. A Dyn. Meteorol. Oceanogr. 2014, 66, 21534. [Google Scholar]
  35. Moukomla, S.; Blanken, P.D. Remote sensing of the North American Laurentian Great Lakes’ surface temperature. Remote Sens. 2016, 8, 286. [Google Scholar] [CrossRef]
  36. Crosman, E.T.; Horel, J.D. MODIS-derived surface temperature of the Great Salt Lake. Remote Sens. Environ. 2009, 113, 73–81. [Google Scholar] [CrossRef]
  37. Lazhu; Yang, K.; Qin, J.; Hou, J.; Lei, Y.; Wang, J.; Huang, A.; Chen, Y.; Ding, B.; Li, X. A strict validation of MODIS lake surface water temperature on the Tibetan Plateau. Remote Sens. 2022, 14, 5454. [Google Scholar] [CrossRef]
  38. Guo, L.; Zheng, H.; Wu, Y.; Fan, L.; Wen, M.; Li, J.; Zhang, F.; Zhu, L.; Zhang, B. An integrated dataset of daily lake surface water temperature over the Tibetan Plateau. Earth Syst. Sci. Data 2022, 14, 3411–3422. [Google Scholar] [CrossRef]
  39. Oesch, D.C.; Jaquet, J.-M.; Hauser, A.; Wunderle, S. Lake surface water temperature retrieval using advanced very high resolution radiometer and Moderate Resolution Imaging Spectroradiometer data: Validation and feasibility study. J. Geophys. Res. Ocean. 2005, 110, C12014. [Google Scholar] [CrossRef]
  40. Okoniewska, M. Diurnal course of cloud cover in Poland in the following decades of the year (based on years 1990–2000). J. Educ. Health Sport 2016, 6, 730–740. [Google Scholar]
  41. Yang, M.; Zhao, W.; Cai, J.; Yang, Y.; Fu, H. Evaluation of consistency among MODIS land surface temperature products for monitoring surface warming trend over the Tibetan Plateau. Earth Space Sci. 2023, 10, e2022EA002611. [Google Scholar] [CrossRef]
  42. Ptak, M.; Sojka, M.; Choiński, A.; Nowak, B. Effect of environmental conditions and morphometric parameters on surface water temperature in Polish lakes. Water 2018, 10, 580. [Google Scholar] [CrossRef]
  43. Wu, Y.; Ji, F.; Wang, S.; He, Y.; Hu, S. Increased Warming Efficiencies of Lake Heatwaves Enhance Dryland Lake Warming over China. Remote Sens. 2024, 16, 588. [Google Scholar] [CrossRef]
Figure 1. Location of the study lakes.
Remotesensing 16 02727 g001
Figure 2. Minimum (blue), average (red), and maximum (green) in situ water temperatures of Łebsko (a) and Gardno (b) lakes from April to October during the years of 2003–2022.
Remotesensing 16 02727 g002
Figure 3. Daily water temperature deviations measured in situ from the values obtained from the MODIS sensor for Lake Łebsko.
Remotesensing 16 02727 g003
Figure 4. Daily water temperature deviations measured in situ from the values obtained from the MODIS sensor for Lake Gardno.
Remotesensing 16 02727 g004
Figure 5. Scatter plot of daily water temperatures measured in situ and 1 day from the MODIS sensor for Lake Łebsko.
Remotesensing 16 02727 g005
Figure 6. Scatter plot of daily water temperatures measured in situ and 1 day from the MODIS sensor for Lake Gardno.
Remotesensing 16 02727 g006
Figure 7. One-day LST values obtained from MODIS sensors compared to in situ measurements for Lake Łebsko for the period from April to October 2019.
Remotesensing 16 02727 g007
Figure 8. Average deviations between 1-day LST values recorded by MODIS on Aqua and Terra satellites during the day and night.
Remotesensing 16 02727 g008
Figure 9. The slope of the regression lines obtained from in situ measurements (blue color) and MODIS (red color) for Lakes Łebsko and Gardno over the years of 2003–2022.
Remotesensing 16 02727 g009aRemotesensing 16 02727 g009b
Table 1. Differences in average monthly water temperatures and temperatures from the period of April to October in lakes, as measured in situ and calculated based on MODIS data.
MonthŁebskoGardno
RMSE
(°C)
MAE
(°C)
BIAS
(°C)
R2
(-)
RMSE
(°C)
MAE
(°C)
BIAS
(°C)
R2
(-)
April0.770.64−0.050.661.531.30−1.280.72
May0.590.480.170.831.140.88−0.680.66
June0.670.590.240.870.850.74−0.430.77
July0.850.670.440.780.850.75−0.280.77
August0.720.630.440.830.690.56−0.030.79
September0.720.600.280.820.910.80−0.130.56
October0.950.810.630.750.920.810.380.68
April–October0.430.360.030.600.710.64−0.600.74
Table 2. Results of the analysis using the Mann–Kendall and Sen’s tests for Lakes Gardno and Łebsko for the years of 2003–2022.
PeriodS StatisticsZ-ValueSen’s Slope
(°C Per Decade)
p-ValueS StatisticsZ-ValueSen’s Slope
(°C Per Decade)
p-Value
In Situ—ŁebskoMODIS—Łebsko
April30.070.050.944−7−0.21−0.280.834
May30.070.030.944−5−0.14−0.070.889
June672.311.280.021592.031.620.042
July210.700.550.48430.070.070.944
August371.260.610.208351.190.970.234
September150.490.330.624−5−0.14−0.060.889
October411.400.800.162311.050.670.294
April–October491.680.420.093491.680.440.093
PeriodIn Situ—GardnoMODIS—Gardno
April10.000.051.000−7−0.21−0.170.834
May30.070.090.94430.070.100.944
June391.331.160.184571.961.450.050
July170.560.390.57690.280.290.780
August451.540.720.124371.261.040.208
September290.980.500.32790.280.360.780
October672.311.120.021290.980.750.327
April–October632.170.430.030451.540.550.124
Bold and underlined—statistically significant changes at the 0.05 level, bold—significant changes at the 0.1 level.
Disclaimer/Publisher’s Note: The statements, opinions and data contained in all publications are solely those of the individual author(s) and contributor(s) and not of MDPI and/or the editor(s). MDPI and/or the editor(s) disclaim responsibility for any injury to people or property resulting from any ideas, methods, instructions or products referred to in the content.

