Article

Estimation of Forest Stand Volume in Coniferous Plantation from Individual Tree Segmentation Aspect Using UAV-LiDAR

1
College of Information and Electronic Engineering, Hunan City University, Yiyang 413000, China
2
Research Center of Forestry Remote Sensing & Information Engineering, Central South University of Forestry and Technology, Changsha 410004, China
3
National-Local Joint Engineering Laboratory of Geo-Spatial Information Technology, Hunan University of Science and Technology, Xiangtan 411100, China
4
Key Laboratory of Forestry Remote Sensing Based Big Data & Ecological Security for Hunan Province, Changsha 410004, China
*
Author to whom correspondence should be addressed.
Remote Sens. 2024, 16(15), 2736; https://doi.org/10.3390/rs16152736 (registering DOI)
Submission received: 21 April 2024 / Revised: 29 June 2024 / Accepted: 24 July 2024 / Published: 26 July 2024
(This article belongs to the Section Forest Remote Sensing)

Abstract

:
The main problems of forest parameter extraction and forest stand volume estimation using unmanned aerial vehicle light detection and ranging (UAV-LiDAR) technology are the lack of precision in individual tree segmentation and the inability to directly obtain the diameter at breast height (DBH) parameter. To address such limitations, the study proposed an improved individual tree segmentation method combined with a DBH prediction model to obtain the tree height (H) and DBH for calculating the volume of trees, thus realizing the accurate estimation of forest stand volume from individual tree segmentation aspect. The method involves the following key steps: (1) The local maximum method with variable window combined with the Gaussian mixture model were used to detect the treetop position using the canopy height model for removing pits. (2) The measured tree DBH and H parameters of the sample trees were used to construct an optimal DBH-H prediction model. (3) The duality standing tree volume model was used to calculate the forest stand volume at the individual tree scale. The results showed that: (1) Individual tree segmentation based on the improved Gaussian mixture model with optimal accuracy, detection rate r, accuracy rate p, and composite score F were 89.10%, 95.21%, and 0.921, respectively. The coefficient of determination R2 of the accuracy of the extracted tree height parameter was 0.88, and the root mean square error RMSE was 0.84 m. (2) The Weibull model had the optimal model fit for DBH-H with predicted DBH parameter accuracy, the R2 and RMSE were 0.84 and 2.28 cm, respectively. (3) Using the correctly detected trees from the individual tree segmentation results combined with the duality standing tree volume model estimated the forest stand volume with an accuracy AE of 90.86%. In conclusion, using UAV-LiDAR technology, based on the individual tree segmentation method and the DBH-H model, it is possible to realize the estimation of forest stand volume at the individual tree scale, which helps to improve the estimation accuracy.

1. Introduction

Forests are an important component of terrestrial ecosystems and have evolved into the primary carbon pool in the global carbon cycle, playing a decisive role significantly contributing to the mitigation of global climate change impacts [1,2,3]. As an important indicator reflecting the character and condition of forest ecosystems, the forest stand volume finds widespread application in greenhouse gas accounting, global climate change maintenance, and carbon neutralization [4,5,6]. Therefore, timely, accurate, and efficient research on estimation of forest ecosystem stock is of practical significance for sustainable forest resource management and understanding of the global climate change dynamics.
Traditionally, forest stand volume has been traditionally determined through methodologies such as the clearcutting method or the standard tree method. While more precise, it is deemed that destructive sampling is more destructive to the ecological environment [7,8]. At the present stage, most of the methods are based on forest inventory data, using parameters like tree height and diameter at breast height parameters, combined with allometric growth equations to estimate the forest stand volume [9,10]. However, the field sample survey also consumes a large amount of time and economic costs, and only obtains point data, making it difficult to efficiently obtain the macro-distribution and dynamic changes in the stock at the regional scale or a larger scale [11,12,13]. In recent years, with the development of remote sensing technology, the spatial integrity and temporal consistency of the data have been ensured, confirming higher accuracy of forest resource surveys.
Light detection and ranging (LiDAR) is unaffected by varying natural conditions like weather and light, and demonstrates great potential in forest stand volume estimation by transmitting laser pulses towards the branches and leaves of trees and capturing dispersed echo signals conveying three-dimensional spatial data and other information to obtain waveform or point cloud data [14,15,16]. Among them, unmanned aerial vehicle LiDAR (UAV-LiDAR) has lower data acquisition cost and higher pulse sampling density compared to airborne LiDAR [15,17,18]. With a larger operational range and higher data acquisition efficiency than terrestrial LiDAR and mobile backpack LiDAR, it has emerged and rapidly developed in the industry with its unique advantages. After the advent of high-resolution point cloud data, an increasing number of researchers have started to try to estimate forest volume remotely from the perspective of individual tree, and individual tree segmentation has become the premise and foundation of stand volume remote sensing estimation [19,20,21].
Currently, the individual tree segmentation method for unmanned aerial vehicle LiDAR (UAV-LiDAR) data can be divided into two categories based on different data formats: point cloud-based and raster-based [22,23,24]. Segmenting methods based on point cloud data mainly include point cloud segmentation (PCS), density clustering, voxel projection, etc. [25,26,27]. After classifying ground points from forest point clouds, the terrain is normalized, and individual tree clustering is performed using the three-dimensional structural information of the point cloud data to achieve the segmentation of individual tree point clouds. These methods strive to retain all details of the point cloud, but they involve high computational complexity and complex algorithm implementation. Segmentation methods based on raster data utilize the spatial distribution differences in the pixel values of the canopy height model. They often employ algorithms such as watershed, Gaussian mixture model, and local maximum method for treetop detection and crown edge recognition [28,29,30,31,32,33,34,35]. Compared to point cloud segmentation methods, raster-based methods, while losing information during data rasterization, offer simpler data structures and higher efficiency.
The drawback of using UAV-LiDAR for forest stand volume estimation is the difficulty in obtaining the diameter of the chest, another key variable in volume calculation [36,37]. There have been previous studies using UAV-LiDAR with ultra-high point density to directly extract tree diameter at breast height, but they are limited by a variety of factors such as stand structure, canopy size, and forest density [38,39,40,41]. Using the close relationship between diameter at breast height and tree height, constructing a prediction model for breast diameter based on the tree height parameters extracted by UAV-LiDAR is a feasible solution [42,43,44]. Linear regression models (or log-transformed power function models) are the most common form of modeling; however, these equations may be too simple and only applicable to a limited range of tree sizes and stand conditions [45]. Because modeled data are often hierarchically structured, parameter estimation using ordinary least squares (OLS) methods is usually difficult to simultaneously bias parameter estimates towards meeting error assumptions. In addition, many studies have used non-parametric modeling methods, such as the random forest method [46,47]. Non-parametric methods are advantageous due to their reduced reliance on assumptions and higher predictive accuracy. However, the lack of a predetermined model structure poses a challenge in comprehending the underlying relationship between independent variables and the dependent variable [48,49].
Therefore, this paper proposes an improved individual tree segmentation method for UAV-LiDAR point clouds to extract tree heights, and a diameter at breast height prediction model to extract diameter at breast height to estimate forest stand volume from individual tree segmentation aspect. The methodological framework of this study is shown in Figure 1. First, the local maximum method with variable window combined with the Gaussian mixture model were used to detect the treetop position, and the accuracy of individual tree segmentation was evaluated by calculating the detection rate, accuracy, and composite score. Then, the measured tree diameter at breast height and tree height parameters of the sample plots were used to construct an optimal prediction model, and the coefficient of determination and root mean square error between the measured and extracted tree parameters were computed to assess the accuracy of parameter extraction. Finally, the tree height, diameter at breast height, and the duality standing tree volume model were used to calculate the forest volume, and the accuracy of the UAV-LiDAR volume estimation by the relative accuracy.
The rest of the paper is organized as follows: Section 2 describes in detail the field survey and UAV-LiDAR data acquisition and processing methods, as well as the new individual tree segmentation method and individual tree scale forest volume estimation method proposed in this study. Section 3 presents the results of individual tree segmentation and parameter extraction, and Section 4 analyzes and discusses the experimental design and method performance of this study. Section 5 concludes the study.

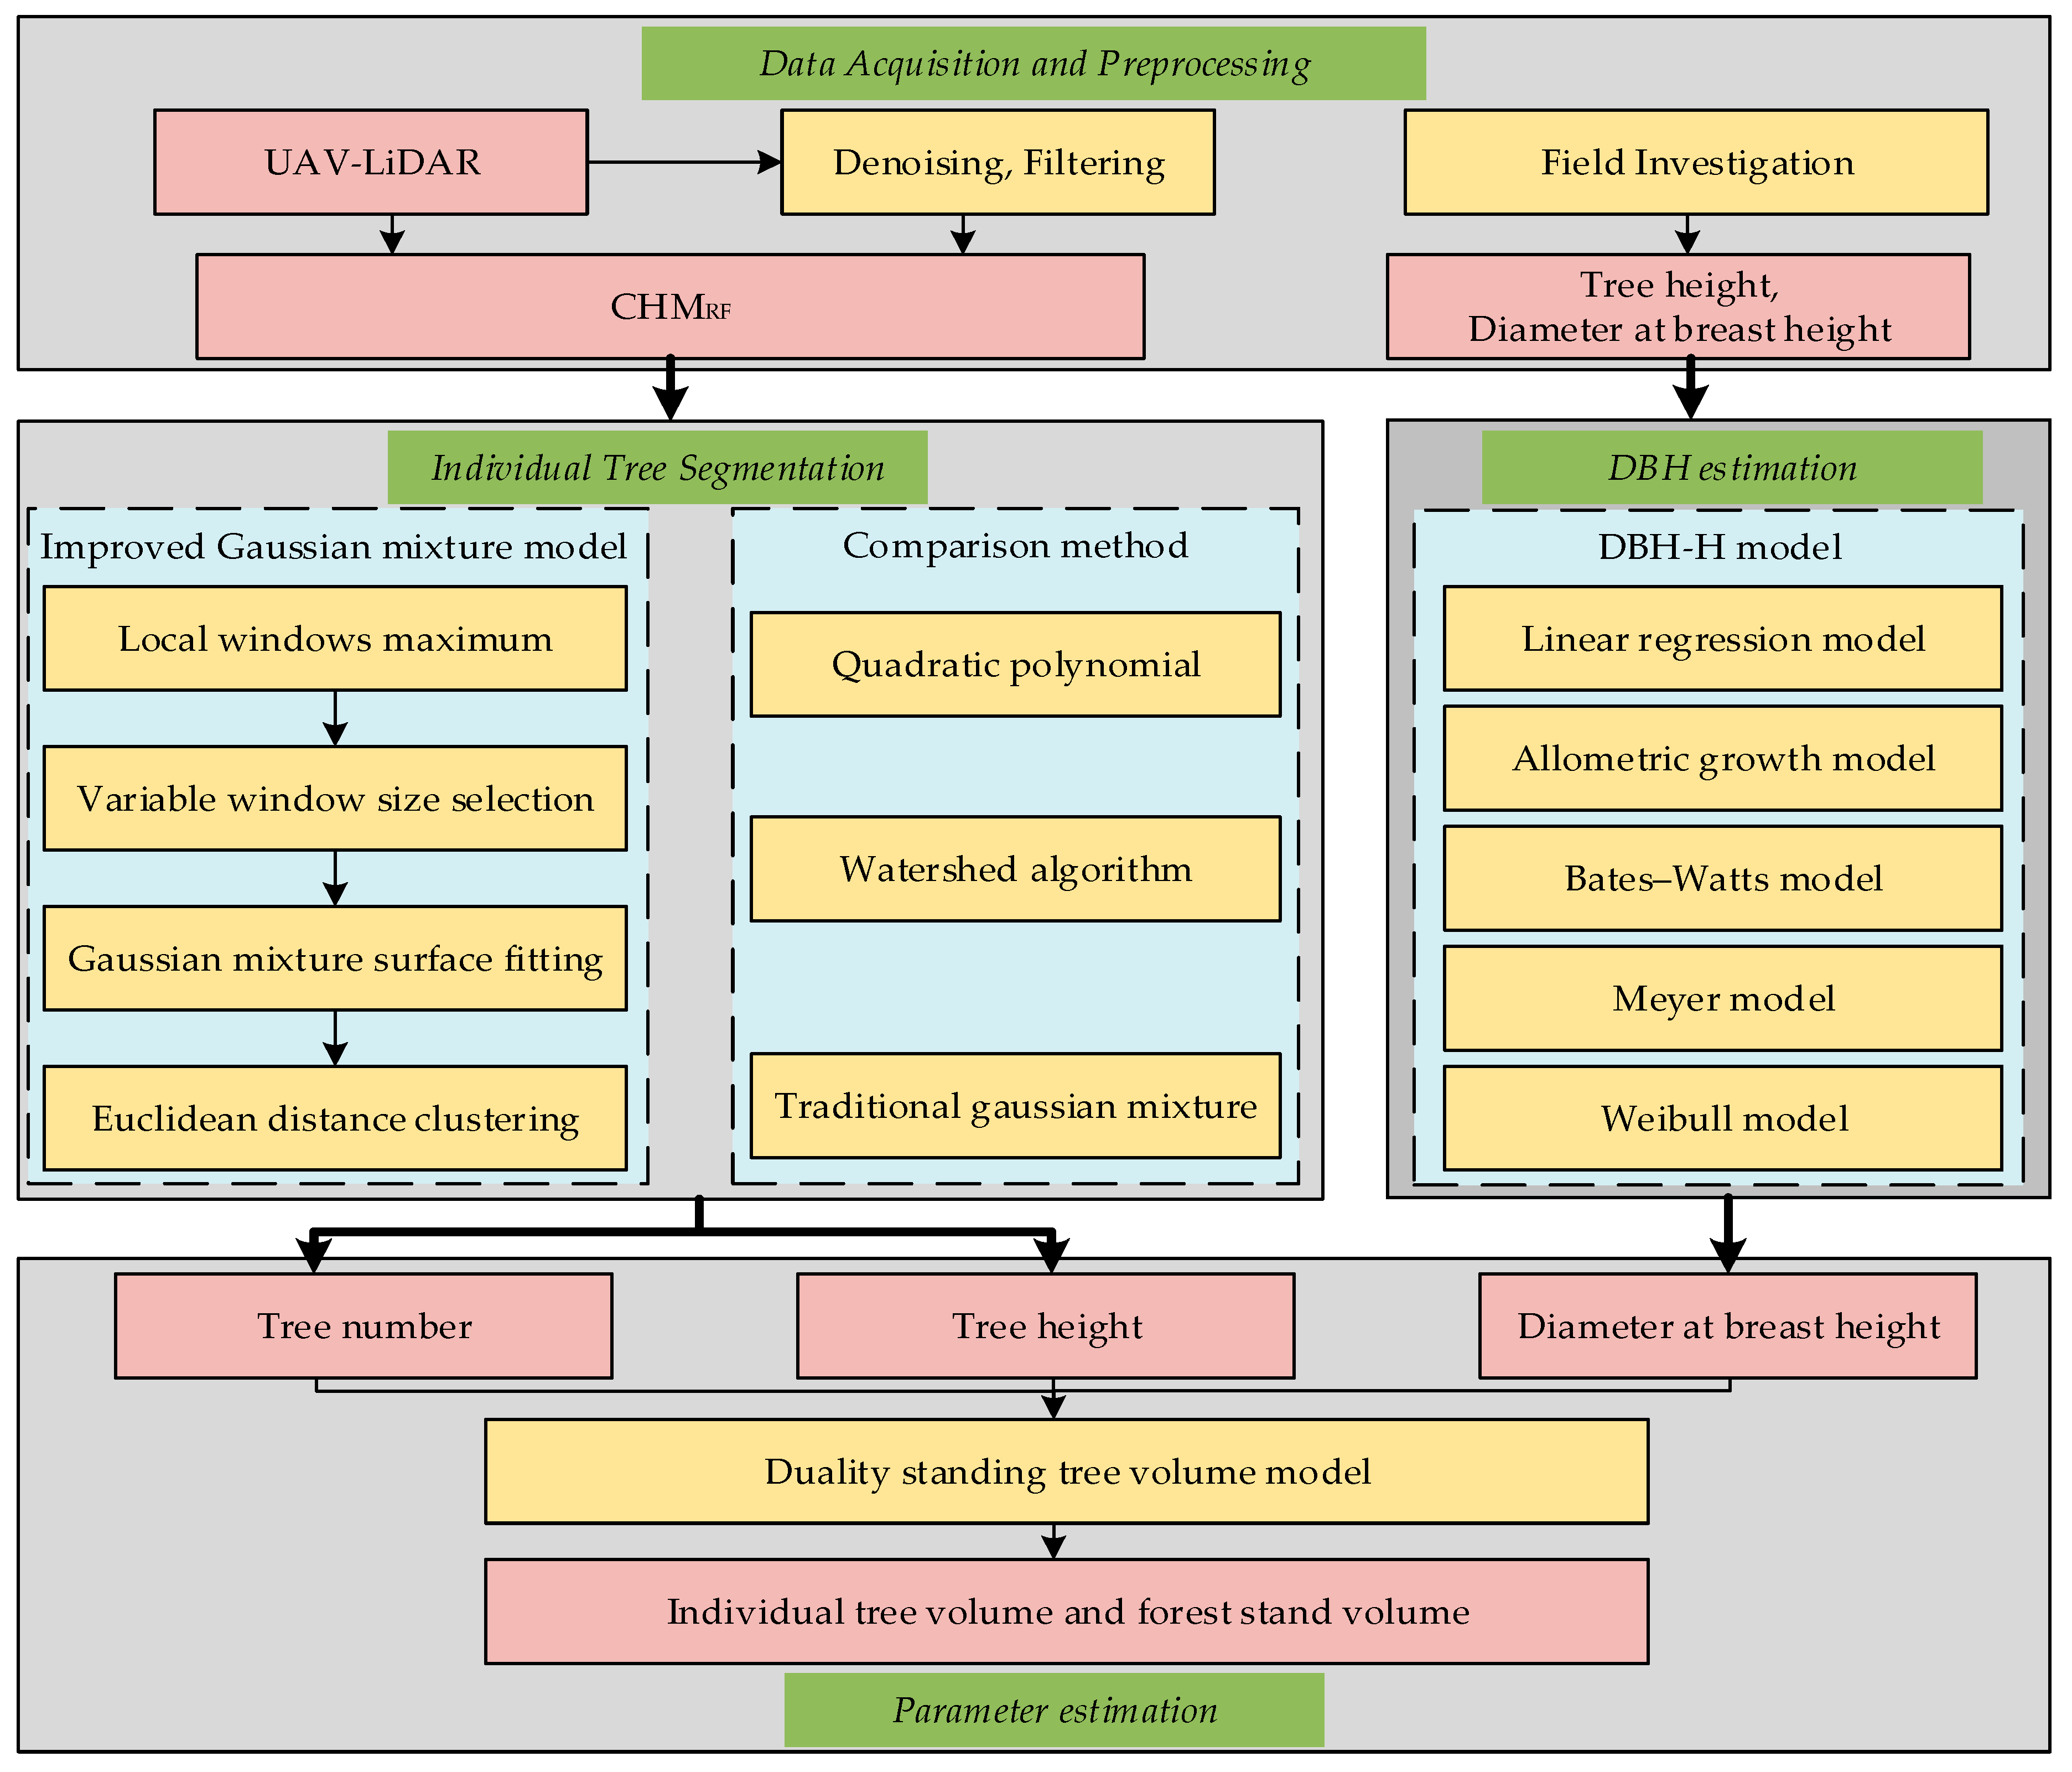
2. Materials and Methods

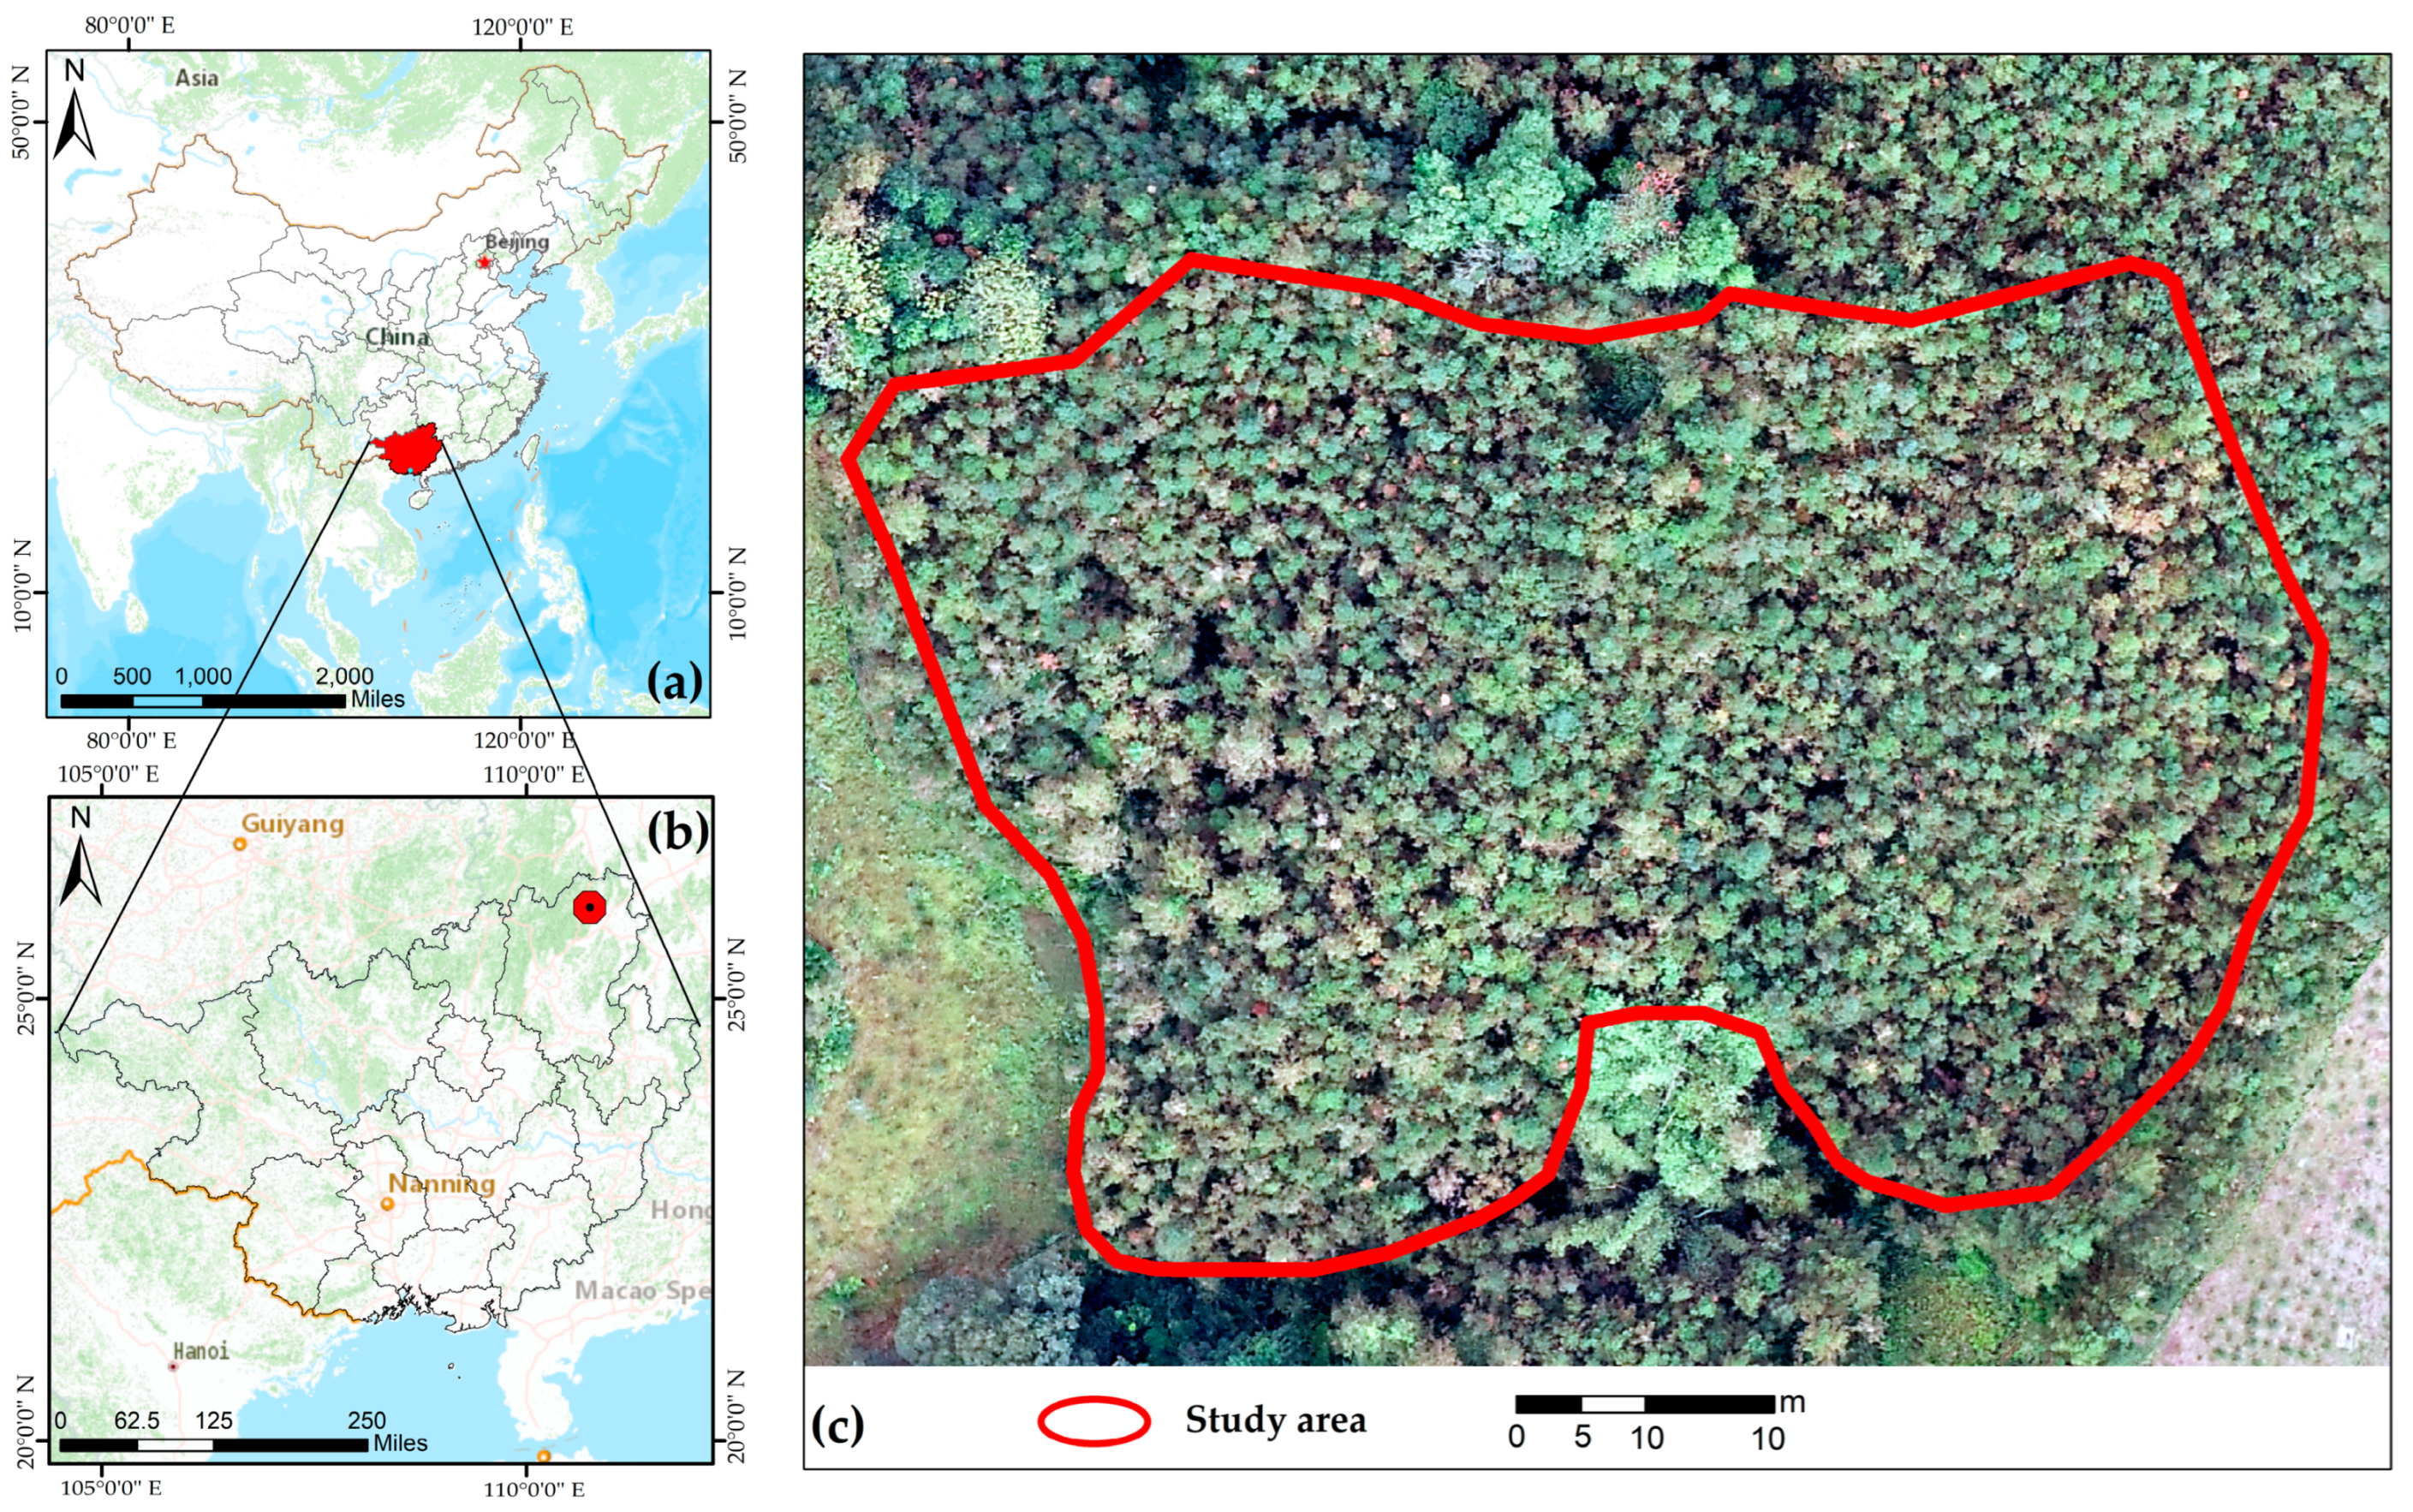
2.1. Study Area and Field Investigation

The study area is located at the northeast of Guilin City, Guangxi Zhuang Autonomous Region, China (110°37′~111°29′ E and 25°29′~26°23′ N; Figure 2). The region is located in the upper reaches of the Xiangjiang River, the territory is mainly mountainous terrain, and there are many rivers. This area experiences a typical continental monsoon climate, the average temperature is 18.1 °C, annual average rainfall is 1566 mm, and forest coverage rate is 68.15%. The climatic conditions are suitable for the growth of forests.
The forest selected for the study was located in a coniferous collective forest area within Guilin City, covering an area of 0.24 hectares, with an elevation of 200 m, a slope of less than 20°, and the dominant tree species was Cunninghamia lanceolata. The forest originated from secondary growth, with a tree density of approximately 600 trees per hectare, an average forest age of about 20 years, and the presence of low shrubs and herbaceous plants under the canopy. All trees within the forest with a diameter at breast height (DBH) greater than 5 cm were measured. We used the TruPulse 200 laser rangefinder to measure the height of Cunninghamia lanceolata trees, with an instrument error of ±0.2 m, and a steel tape measure was used to measure the diameter at breast height at 1.3 m. The size of the canopy was measured by pulling a cross ruler in the east–west and north–south directions of the canopy with the trunk as the center, respectively. We employed the Qianxun SR3 Pro to measure the positions of individual trees, achieving a horizontal positioning accuracy of under 8 mm. The final number of trees measured totaled 156, including 151 Cunninghamia lanceolata trees and 5 other broadleaf trees. The average DBH was 15.1 cm and the average tree height was 12.7 m (Figure 3). Field investigation data were used for accuracy evaluation of individual tree detection and parameter extraction.

2.2. Light Detection and Ranging (LiDAR) Data Acquisition and Preprocessing

2.2.1. Light Detection and Ranging (LiDAR) Data Acquisition

The UAV-LiDAR point cloud data are discrete echo data acquired in December 2020 using DJI Matrice 600 flight platform and RIEGL VUX-1LR sensor. In order to avoid the influence of water vapor and shaking branches and leaves on the data quality, clear and windless weather was chosen to carry out the data acquisition. A vertical cross route design was adopted, starting from the center of the study area, and the flight mode of the UAV and the parameter settings of the sensors were determined according to the altitude and height difference. The flight altitude of the UAV was 100 m, the flight speed was 6 m/s, and the route interval was set at 60 m. The distance measurement error of the sensor was less than 1.5 m. The ranging error of the sensor is less than 10 mm, the emission frequency of the laser pulse is 300 kHz, and the scanning angle is 140°–180° to ensure that the final point cloud density is higher than 150 pts/m2. After the completion of the external flight, the POS data were utilized for route solving, aerial tape splicing, and data correction to finally obtain the UAV-LiDAR point cloud data in the study area.

2.2.2. Point Cloud Preprocessing

Point cloud data preprocessing includes denoising, ground point classification, and canopy height model generation, and all processes are implemented in Lidar 360 V7.0 software. The spatial distance-based denoising algorithm was used to remove the flying bird points, low points, etc., from the UAV laser point cloud data. Cloth Simulation Filtering (CSF) algorithm is used to classify ground and non-ground points [50]. The classified ground laser point cloud was then interpolated using IDW to generate a digital elevation model (DEM), and a digital surface model (DSM) was interpolated using the laser point cloud of the first echo. In order to eliminate the interference of terrain undulation on the elevation of features in DSM, the normalized digital surface elevation model, i.e., canopy height model (CHM), can be obtained by subtracting the DSM and DEM elevations. In CHM, the image element value of each raster indicates the height of the canopy at the location.
Due to the existence of black or gray holes in the original CHM, this in turn affects the detection of treetop points. The maximum point cloud height in the neighborhood of the target image element of the CHM was used to replace the holes on the CHM, and the canopy edge information is enhanced to make the canopy surface smoother. The canopy height model for removing pits (CHMRF) is obtained by linear smoothing of the CHMRF model using the maximum filtering method. Based on the forest type and the distance between trees, the final selected raster resolution is 0.5 m.

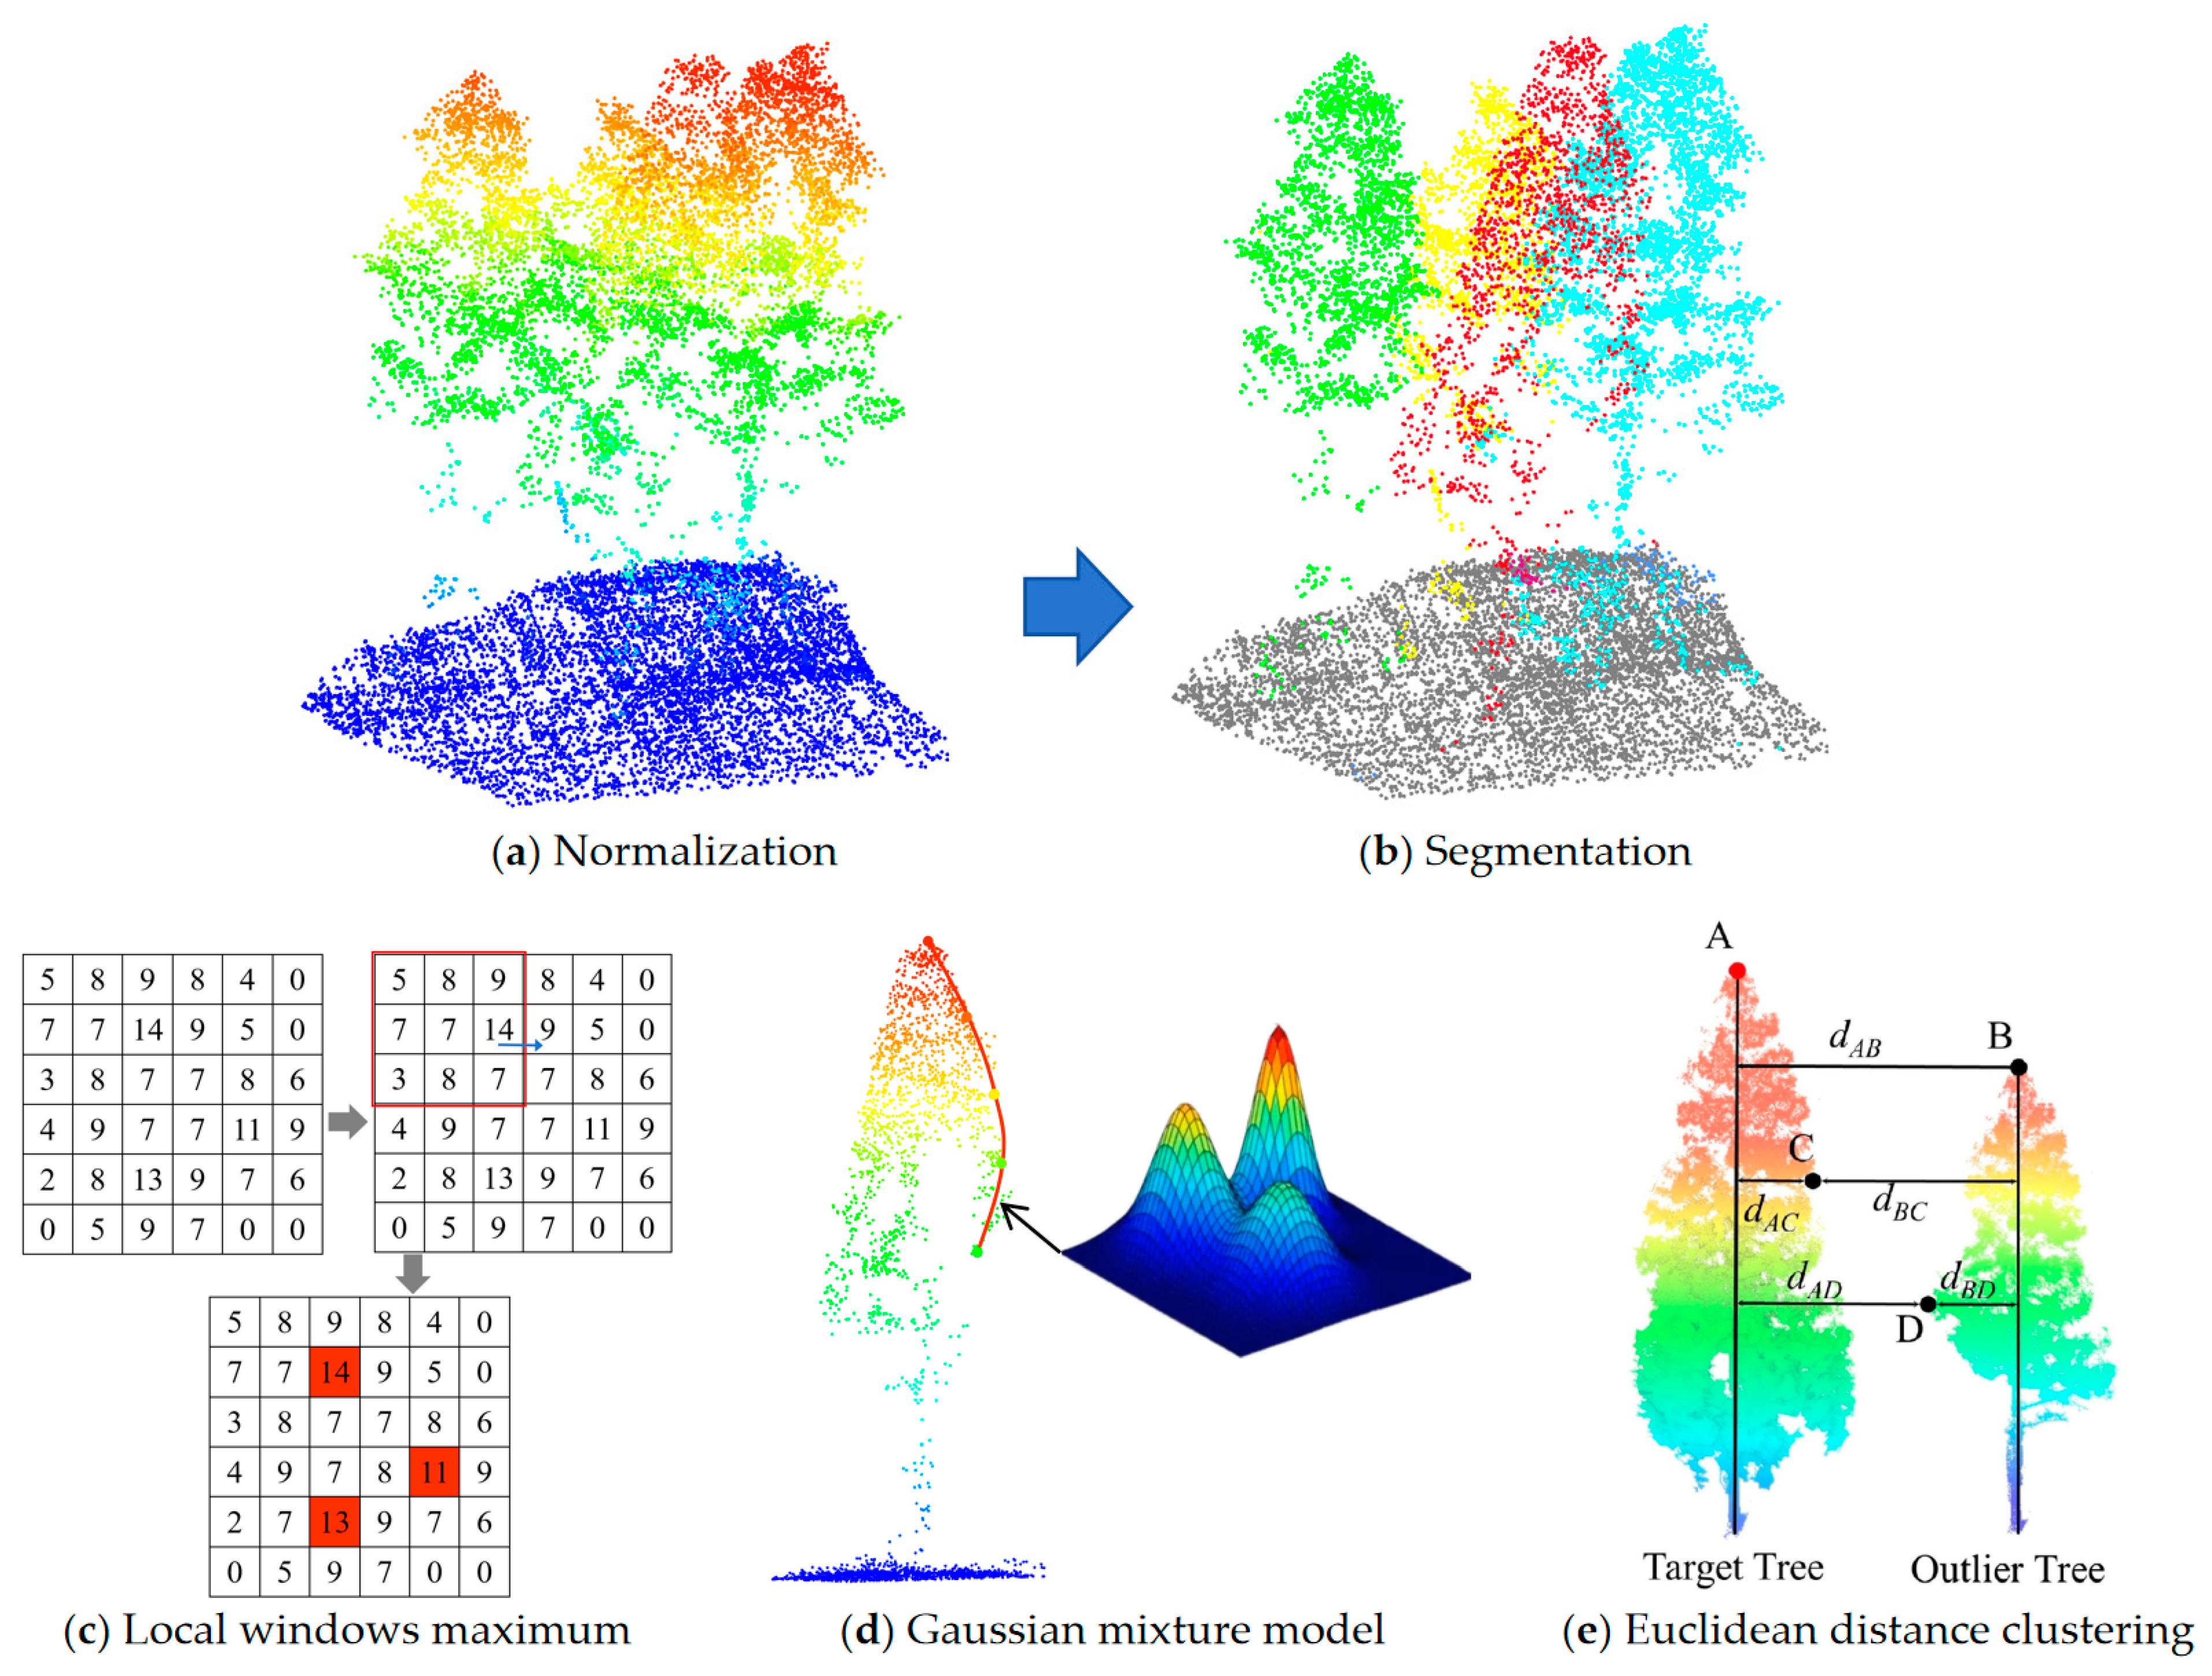
2.3. Individual Tree Segmentation

In this study, we propose an improved individual tree segmentation method for UAV-LiDAR point clouds, including the detection of treetop positions using the local windows maximum method with variable windows, the identification of crown boundaries based on Gaussian mixture model surface fitting, and the use of Euclidean distance clustering to divide the normalized point cloud data into a number of individual tree point cloud ensembles. The logical framework of the improved Gaussian mixture model (IGMM) individual tree segmentation method is shown in Figure 4.
The specific ideas are as follows:
(1)
Local windows maximum
Typically, the upper section of a tree exhibits more distinctive features, with the gray value often higher than that at the crown’s edge. In the context of identifying local maximum points, a comparison is made between the point and its surrounding pixel points to determine if the point’s gray value exceeds that of the adjacent pixel point. Then, the point is stored in an array and the gray values of the points in the array are sorted from high to low. Finally, a fixed size window is created centered on the pixels in the array, if a point with a higher gray value than the gray value is encountered, then the pixel encountered is directly marked as a local maxima; otherwise, it is marked as a local maxima [51].
(2)
Variable window size selection
Due to the factors such as different density and crown size of stand plants, the local windows maximum algorithm using a fixed window often misses or over mentions the phenomenon during the detection of seed points of single trees; therefore, it is necessary to choose a suitable window size for seed point extraction. The study uses local maxima with variable window size. According to the height of the image element where the local maximum is located, the relationship between the height of the tree and the crown size is used to determine the window size. The calculation method is as follows:
R = 2 × L M × C R m e a n H m e a n
where R is the size of the variable window, LM is the local maxima within the window, CRmean is the mean radius of the canopy, and Hmean is the mean tree height.
(3)
Gaussian mixture model surface fitting
The Gaussian mixed model (GMM) surface fitting method for recognizing single tree canopy boundaries has higher accuracy than other methods and can be localized down to the subpixel level [52]. The pixel value anywhere in the image matrix EMN is recorded as P(x, y, A), x = i, y = j are the row and column numbers of CHMRF, and A = eij is the canopy height. Individual tree canopy boundary identification was the process of using a Gaussian surface fitting model (Equation (2)) to determine whether the target pixel value belongs to the diffuse region of the local treetop height maximum by parameters such as the treetop position and canopy height value. Where A is a fixed coefficient, which is the maximum canopy value obtained by the local windows maximum method, and is the Gaussian function mean square deviation, which affects the degree of the blurring effect of the Gaussian surface fitting, and (xo, yo) are the planar position coordinates of the treetop:
f ( x , y ) = A × e x p 1 2 σ 2 ( x x 0 ) 2 + ( y y 0 ) 2
(4)
Euclidean distance clustering
Euclidean distance clustering is used to judge the normalized point cloud classification of tree canopy boundaries using distance to achieve individual tree segmentation of forest stand point clouds. Taking the tree apex as the seed point, the region grows from top to bottom, and iterates over other lower points in turn, combining the distance thresholds set by the canopy boundaries obtained from the GMM to eliminate points with spacing greater than the specified thresholds from the target tree, and categorizing the points with spacing less than the thresholds as the target tree according to the minimum spacing rule. First, the spatial location where the single tree position (xo, yo) is located is defined as the centerline of the individual tree point cloud collection, and the point cloud collection whose distance between the sample and the centerline is less than or equal to d n is extracted. Then, according to the Euclidean distance (Equation (3)) to determine the point cloud cluster whose distance from the centerline is greater than d n , search for the individual tree location with the nearest Euclidean distance in the horizontal direction of the point cloud, and divide the point cloud into individual tree collection. Finally, it stops until all sample points are divided to the corresponding tree set, realizing the individual tree segmentation of the forest tree point cloud, as follows:
d n = ( x n x o ) 2 + ( y n y o ) 2
(5)
Individual Tree Segmentation Accuracy evaluation
In order to validate the performance of the improved UAV-LiDAR point cloud individual tree segmentation method in this study, the measured data were utilized to compare with the individual tree detection results of the three methods, namely, watershed algorithm (WS), quadratic polynomial (QP), and traditional Gaussian mixture model, respectively. The number of correctly segmented single trees (Nc), the number of over segmented single trees (No), and the number of missed single trees (Nm) were recorded. We evaluate the accuracy of individual tree segmentation methods using three metrics: detection rate r (Equation (4)), accuracy rate p (Equation (5)), and composite score F (Equation (6)), as follows:
r = N c N c + N m
p = N c N c + N 0
F = 2 × ( r × p ) r + p

2.4. Construction of Diameter at Breast Height (DBH) Prediction Equation

A total of five models (see Table 1), Linear regression model, Allometric growth model, Bates–Watts model, Meyer model, and Weibull model, were selected as alternative models for the study. And measured tree height (H) was used as the key variable for constructing the DBH prediction model. Model fitting was performed using measured tree height and DBH data for all Cunninghamia lanceolata trees.
In order to evaluate the accuracy of the tree height parameters (HL) extracted by UAV-LiDAR and the diameter at breast height parameters (DBHM) estimated by the model, the study chose the coefficient of determination R2 (Equation (7)), and the root mean square error (RMSE) (Equation (8)). Where n is the number of correctly segmented individual trees, Xi is the extracted height or estimated breast diameter of the trees, x i is the measured height and diameter at breast height of stand tree, and X i ¯ is the mean of the measured height and breast diameter:
R 2 = i = 1 n ( x i x i ¯ ) ( X i X i ¯ ) i = 1 n ( x i x i ¯ ) 2 i = 1 n ( X i X i ¯ ) 2
R M S E = i = 1 n ( X i x ) 2 n

2.5. Forest Stand Volume Estimation

The forest stand volume was obtained by adding up the wood volume of individual tree standing. According to the national standard and the local duality standing tree volume model (Equation (9)) of Cunninghamia lanceolata in Guangxi Zhuang Autonomous Region, the measured height and DBH of cedar trees in the sample plots were utilized to calculate the measured volume, and the height extracted by UAV-LiDAR and the DBH estimated by the model were used to calculate the estimated volume. The accuracy of accumulation estimation was evaluated using the relative accuracy (RA) (Equation (10)), as follows:
V = 0.000065671 × D B H 1.769412 × H 1.069769
R A = V i v i v i × 100 %

3. Results

3.1. Individual Tree Detection

In order to verify the accuracy of individual tree segmentation for the four methods WS, QP, GMM, and IGMM, we perform individual tree matching using the spatial location of the detected tree and the measured tree as a criterion. If the horizontal distance between a detected tree and the corresponding measured tree is less than 2 m, the detected tree is considered to be correctly detected. An individual tree that was not matched to a measured tree was considered to be over detected. On the contrary, a measured tree that is not matched to a detected tree is considered to be a missing detection. The results of correct detection, missing detection, and over detection for the four methods are shown in Figure 5. The experimental results show that the WS-based individual tree segmentation has an insufficient number of plants and a large number of missing detections of trees. The QP and traditional GMM have a larger number of over detections. The individual tree detection results of the IGMM method showed an increase in the number of correct detections, and a decrease in the number of missing detections and over detections. The detailed point cloud map highlights the capability of the IGMM method to accurately segment small trees tightly interconnected within canopies, unlike the other three algorithms that exhibit missing detections in such situations. Analysis of tree matching results and point cloud details for individual tree segmentation reveals that the IGMM-based segmentation effectively addresses false detection in cases of close tree spacing.
The accuracy was evaluated by matching the individual tree segmentation results obtained with the four segmentation methods, as shown in Table 2. The study area comprised 156 individual trees, which was an artificial Cunninghamia lanceolata forest with a relatively simple forest type. The accuracy rate p of all four methods was close to 90% or more, with composite scores (F) surpassing 0.8, indicating a high level of accuracy across the individual tree segmentation methods. At the same time, the number of detected plants of all four methods is smaller than the real number of trees in the study area, which indicates that the defect of the individual tree segmentation methods based on raster data is the lack of individual tree detection ability. The WS algorithm had the lowest number of detected plants and correctly matched trees, only 131 and 116, respectively, with the worst individual tree detection ability, and the detection rate r, accuracy rate p, and composite score F were 74%, 88%, and 0.808, respectively. The QP and GMM methods had comparable performance in individual tree segmentation, showing comparable performance in individual tree segmentation, with similar outcomes in both tree matching and accuracy evaluation, achieving composite scores F of 0.872 and 0.882, respectively. The IGMM method has the best individual tree segmentation results, with 146 and 139 detected individual trees and correct matches, respectively, and detection rate r, accuracy rate p, and composite score F of 89%, 95%, and 0.921, respectively.

3.2. Construction of Diameter at Breast Height (DBH) Estimation Equation

The measured diameter at breast height (DBH) and tree height data of 156 trees were used to fit the parameters in a total of five alternative models, and the model accuracies are shown in Table 3. In the five tree DBH-H regression models, the coefficients of determination R2 were 0.76, 0.78, 0.78, 0.80, and 0.85, respectively, which were all greater than 0.76, indicating that there was a high correlation between the measured tree height and DBH of Cunninghamia lanceolata trees. The highest of these was the Weibull model with the best fit. The RMSE of the five models were 2.086 cm, 1.873 cm, 1.413 cm, 1.439 cm, and 1.024 cm, respectively, and the smallest model was also the Weibull model. Based on the criteria of maximum R2 and minimum RMSE, the Weibull model was finally selected as the DBH-H estimation model for Cunninghamia lanceolata species in this study.

3.3. Parameter Extraction Accuracy

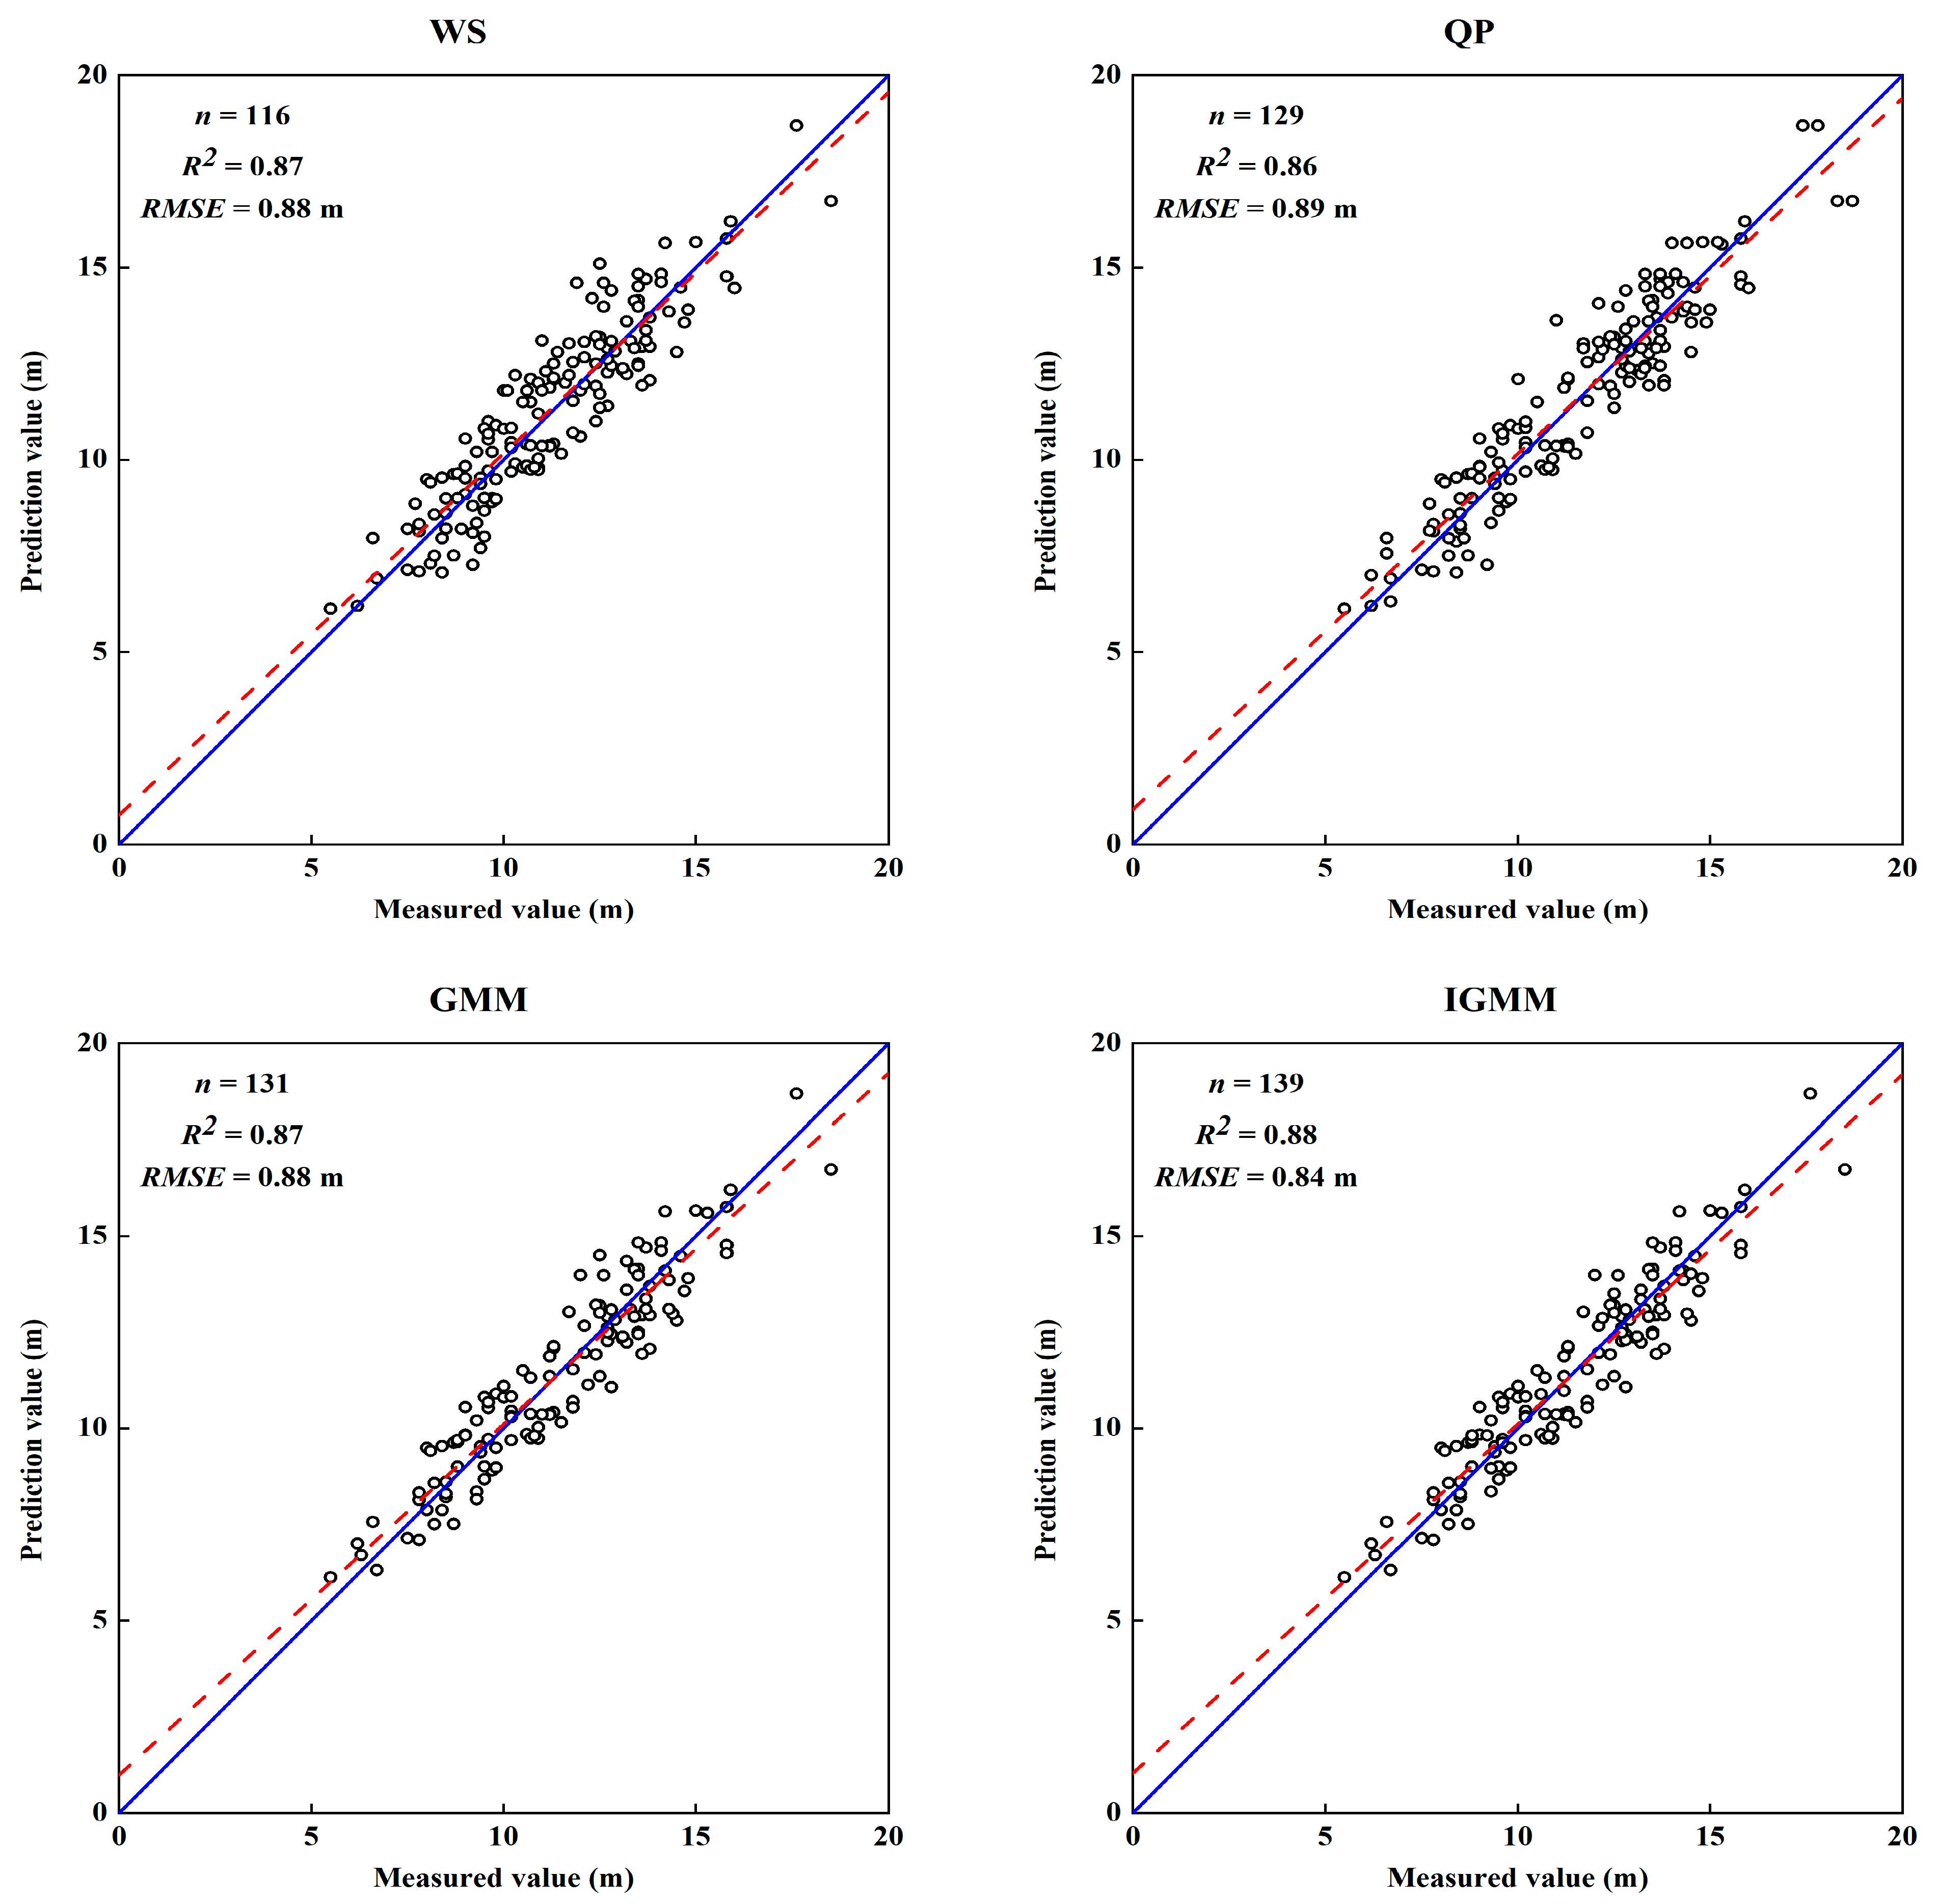
3.3.1. Tree Height Parameter Extracted

The results of the accuracy evaluation of the tree height parameter HL extracted from the individual tree point cloud dataset obtained by four individual tree segmentation methods, namely, WS, QP, GMM, and IGMM, and the measured tree height H are shown in Figure 6. The coefficient of determination R2 between the tree height parameter HL extracted by the four individual tree segmentation methods and the measured tree height H were 0.87, 0.86, 0.87, and 0.88, respectively, which showed an excellent fitting effect. The relative root mean square errors RMSE were 0.88 m, 0.89 m, 0.88 m, and 0.84 m, with errors between 0.8 m and 0.9m, which were in the lower error range. The number of trees n correctly detected by the four individual tree segmentation methods differed greatly, but the accuracy of the tree height parameters extracted from the segmented individual tree point cloud was similar. In addition, most of the parameter extraction results and accuracies of the tree height parameters obtained by the four different individual tree segmentation methods were consistent, and only some of the false matches caused by over detection or missed detection existed, which led to the weak differences in the evaluation indexes of tree height parameter accuracies of the whole forest. Overall, the tree height parameters extracted using the individual tree point cloud were highly accurate and stable.

3.3.2. Prediction of Diameter Parameters

Using the tree height parameters extracted from the point cloud of correctly detected individual trees, combined with the optimal DBH-H model (Weibull model), the corresponding individual tree diameter at breast height parameter (DBHM) was predicted. Accuracy evaluation was carried out with the field measured DBH parameters, and the experimental results are shown in Figure 7. The coefficients of determination R2 of the linear fit between predicted and measured DBH parameters were 0.82, 0.84, 0.83, 0.84, and the RMSE were 2.38 cm, 2.29 cm, 2.34 cm, and 2.28 cm, respectively, using the four individual tree segmentation algorithms and the Weibull DBH-H model. The prediction accuracy of the DBH parameter was consistent with the variation in the tree height parameter extraction results. The experimental results showed that the technical solution of using the tree height parameters extracted from the segmented individual tree point cloud combined with the DBH-H model to predict the DBH parameter is feasible and has high accuracy.

3.4. Estimation of Forest Stand Volume

Using the field-measured diameter at breast height and tree height parameters, the measured volume of 156 trees in the study area was finally calculated using the duality standing tree volume model to be 54.47 m3. And using the tree heights extracted from the four methods of individual tree segmentation by UAV-LiDAR, and the diameter at breast height predicted by the Weibull DBH-H model, the final results of the calculated forest stand volume are shown in Table 4. The forest stand volume estimated by directly using the results of all trees from the four methods of individual tree segmentation were 44.73 m3, 48.01 m3, 49.28 m3, and 50.67 m3, and the accuracy evaluated RA was calculated as 82.12%, 88.14%, 90.47%, and 93.02%, respectively. Whereas the corrected forest stand volumes after matching with the measured trees were 41.94 m3, 45.65 m3, 46.07 m3, and 48.46 m3, the corrected RA was 76.99%, 83.81%, 84.58%, and 90.86%, respectively. Since the number of detected trees was smaller than the number of measured trees for all four individual tree segmentation methods, and the number trees was further reduced after correct matching, the corrected accuracy of accumulation estimation with individual tree matching resulted in a smaller accuracy than that without matching. Among the results of the accuracy of the two types of forest stand volume calculation, based on the IGMM, individual tree segmentation obtained the optimal results.

4. Discussion

4.1. Advantages of the Improved Individual Tree Segmentation Method

In this study, we carried out a study on forest stand volume estimation under the perspective of individual tree segmentation using UAV-LiDAR technology with Cunninghamia lanceolata forests as the research object. We used four individual tree segmentation methods based on raster data in this study, including the three traditional methods of WS, QP, GMM and IGMM method. Raster-based individual tree point cloud segmentation was widely accepted due to the abundance of raster data processing tools and the advantage of small data volume, the method is relatively easy to implement, and satisfactory individual tree segmentation results can be obtained in sparse plantation forests [17], as highlighted by Yang et al. [53]. On the one hand, it is severely limited by the raster resolution, and the process of rasterizing the point cloud data with a large resolution may lead to the loss of details, which further hinders the detection of trees with small crowns, while a very small resolution may lead to the detection of trees with branched canopies as segmentation trees [19]. The study supported this finding as the number of detections from all four methods was notably less than actual measurements in the sample. On the other hand, the accuracy of individual tree segmentation results is limited by the signal-to-noise ratio of the raster data, and a large amount of noise from the understory scrub can cause tree detection to become challenging. The study subjected the CHM to remove pits processing, which effectively mitigated this problem, and the accuracy of all four methods was greater than 88%. The idea of individual tree segmentation for all three traditional methods is to detect the local canopy extremes first, and then use the functional equation to spread in a way similar to the surrounding to detect the canopy boundaries of individual trees. The drawback of these methods is that when the height difference between trees is too large, the taller trees tend to merge with the surrounding smaller trees, resulting in missed detections. A finding supported by Oehmcke et al. [15] and Ma et al. [18] indicated that the accuracy of tree detection is affected by the tree species and crown shape of adjacent trees. The study introduced a segmentation strategy combining local maxima with a variable window and GMM, achieving a segmentation accuracy score of 0.931, significantly enhancing individual tree detection precision.

4.2. Deficiencies in Individual Tree Segmentation

The complexity of the forest environment can hinder the accuracy of individual tree segmentation. Usually, the increase in the complexity of the forest environment, such as compound forests and mixed forests, is prone to over segmentation and missed segmentation phenomena, resulting in a decrease in the accuracy of the segmentation algorithm, which is an observation corroborated by the studies of Yang et al. [34] and Kuželka et al. [36]. In this study, the presence of a small number of broadleaf trees in the forest had a significant effect on the accuracy of individual tree detection. Due to the large branching angle and high crown height of broadleaf trees, the surrounding small trees are often missed when the local maximum algorithm is used to detect the treetop, resulting in low accuracy of the segmentation algorithm. In addition, coupled with the fact that the location of the trees in the field survey is the trunk area, and the location of the individual tree extracted by the algorithm is the pixel of the maximum value of the crown height, there is a certain distance between the two, which brings a certain error to the individual tree matching; this conclusion was also found in our previous study [19]. Therefore, facing the problem of insufficient accuracy of individual tree segmentation in complex samples, the improved algorithm needs to weigh the detection rate r and the accuracy rate p. None of the previous algorithms can ensure high detection rate r and high accuracy rate p, some algorithms increase the detection rate r by separating as many single logs as possible, and have a high tolerance for wrong segmentation results, which may lead to a reduction in the accuracy rate p; some methods assign the highest priority to the accuracy p, focusing on the accuracy of the individual tree segmentation, which also reduces the total number of separated single logs at the expense of the detection rate r. The optimal individual tree segmentation point cloud algorithm must strike a balance between detection rate and accuracy rate to ensure comprehensive forest tree detection while upholding the accuracy of each identified tree [16]. In addition, there are certain limitations when the forest area is relatively large, in addition to the computational power demand caused by increased data. This includes the processing of large-scale point clouds using fixed parameters of a specific individual tree segmentation method, leading to a significant decrease in segmentation accuracy.

4.3. Limitations of Forest Stand Volume Estimation

Tree height (H) and DBH are important factors in estimating forest stand volume. Traditional forest stand volume surveys measure tree height by altimeter and DBH by tape involves manual inspection for each tree. While DBH is easy to measure; however, tree height is more difficult to obtain. In order to realize large-area, automated forest stand volume estimation, it is difficult to obtain the DBH directly through the use of non-contact remote sensing [41,46]. Therefore, in the process of forest stand volume estimation, utilizing the existing survey data, researching and constructing a regression model for DBH-H, and using the extracted tree height to project the difficult-to-obtain DBH, is an effective solution for forest stand volume estimation for segmenting individual trees [38]. At the same time, the credibility of UAV-LiDAR as a technical tool for forest stand volume estimation and survey has not been effectively solved. To realize the application of UAV-LiDAR sample survey, it is necessary to promote the innovation of forest stand volume calculation method. On the one hand, the change in forest survey object. The content of sample plot survey in the current forest inventory is that all trees in a sample plot must be measured. This includes many small trees and shrubs, which have less impact on the overall forest stand volume [37]. If the survey object is only for large trees, it will greatly improve the accuracy of the LiDAR point cloud forest parameter extraction. On the other hand, the survey factor changes. At present, the survey factors for forest stand volume estimation primarily involve tree H and DBH, and it is difficult to obtain DBH parameters directly through UAV-LiDAR technology. And point cloud data can provide the crown area, volume, and other information of an individual tree, which can be applied to the construction of the formula for calculating the individual tree trunk volume [43,44]. This enhances model estimation accuracy and continuous optimization of the methodological process for forest stand volume estimation by UAV-LiDAR technology.

5. Conclusions

The research framework for estimating forest stand volume at the tree scale based on individual tree segmentation by UAV-LiDAR and DBH-H model is fully reliable. In this study, individual tree point clouds segmentation was performed using a canopy height model for removing pits, based on variable window local maxima, Gaussian mixture model surface fitting, and Euclidean distance clustering. The measured tree H and DBH parameters were used to construct an optimal DBH-H model, and the DBH was estimated using the tree height parameters extracted from the individual tree point cloud. The cumulative forest stand volume was also calculated using the duality standing tree volume model. The results showed the following:
(1)
This research based on IGMM algorithm can effectively solve the problem of uneven tree arrangement leading to the lack of precision of individual tree segmentation. Segmentation accuracy significantly improved, achieving a high composite score (F) of 0.921.
(2)
The technical solution of using UAV-LiDAR technology combined with DBH-H model to predict DBH parameters is feasible. The R2 and RMSE of the extraction accuracy of tree height parameters were 0.88 and 0.84 m, and the measured tree H and DBH parameter accuracy were 0.84 and 2.28 cm.
(3)
The estimation of forest stand volume from individual tree segmentation aspect by UAV-LiDAR can meet the accuracy requirements of forest resources investigation. Based on the IGMM individual tree segmentation method and Weibull DBH-H model, the accuracy RA of forest stand volume combined with the duality standing tree volume model can reach 90.86%.
In conclusion, using UAV-LiDAR technology to estimate forest stand volume from the individual tree segmentation aspect can replace the heavy manual survey work in the field, and has the advantages of flexible route planning and design, short data collection period, and high estimation accuracy.

Author Contributions

Conceptualization and methodology, X.Z. and K.M.; validation, K.M. and H.S.; formal analysis, K.M.; investigation, X.Z., K.M., C.L. and Y.W.; draft, X.Z., K.M. and H.S.; supervision, Y.W. and H.S.; review, editing, and revision, X.Z., K.M. and H.S.; funding acquisition, X.Z., C.L. and H.S. All authors have read and agreed to the published version of the manuscript.

Funding

This research was funded by the National Natural Science Foundation of China (No. 31971578 and 42171418), Hunan Provincial Natural Science Foundation of China (No. 2022JJ30078) and Research project of Hunan Provincial Department of Education under Grant 22C0522.

Data Availability Statement

The raw data supporting the conclusions of this article will be made available by the authors on request.

Acknowledgments

We express our gratitude to everyone who helped us to successfully complete this research.

Conflicts of Interest

The authors declare no conflict of interest.

References

  1. Fang, J.; Chen, A.; Peng, C.; Zhao, S.; Ci, L. Changes in Forest Biomass Carbon Storage in China between 1949 and 1998. Science 2001, 292, 2320–2322. [Google Scholar] [CrossRef] [PubMed]
  2. Fang, J.Y.; Yu, G.R.; Liu, L.L.; Hu, S.J.; Chapin, F.S. Climate Change, Human Impacts, and Carbon Sequestration in China. Proc. Natl. Acad. Sci. USA 2018, 115, 4015–4020. [Google Scholar] [CrossRef] [PubMed]
  3. FAO. Voluntary Guidelines on National Forest Monitoring; Food and Agriculture Organization of the United Nations: Rome, Italy, 2017; ISBN 978-92-5-109619-2. [Google Scholar]
  4. Alvites, C.; O’Sullivan, H.; Francini, S.; Marchetti, M.; Santopuoli, G.; Chirici, G.; Lasserre, B.; Marignani, M.; Bazzato, E. High-Resolution Canopy Height Mapping: Integrating NASA’s Global Ecosystem Dynamics Investigation (GEDI) with Multi-Source Remote Sensing Data. Remote Sens. 2024, 16, 1281. [Google Scholar] [CrossRef]
  5. Goldbergs, G. Comparison of Canopy Height Metrics from Airborne Laser Scanner and Aerial/Satellite Stereo Imagery to Assess the Growing Stock of Hemiboreal Forests. Remote Sens. 2023, 15, 1688. [Google Scholar] [CrossRef]
  6. Wang, G.; Zhang, M.; Gertner, G.; Oyana, T.; McRoberts, R.E.; Ge, H. Uncertainties of Mapping Aboveground Forest Carbon Due to Plot Locations Using National Forest Inventory Plot and Remotely Sensed Data. Scand. J. For. Res. 2011, 26, 360–373. [Google Scholar] [CrossRef]
  7. Zhang, H.; Zhang, H.; Xu, K.; Li, Y.; Wang, L.; Liu, R.; Qiu, H.; Yu, L. A Novel Framework for Stratified-Coupled BLS Tree Trunk Detection and DBH Estimation in Forests (BSTDF) Using Deep Learning and Optimization Adaptive Algorithm. Remote Sens. 2023, 15, 3480. [Google Scholar] [CrossRef]
  8. Roise, J.P.; Harnish, K.; Mohan, M.; Scolforo, H.; Chung, J.; Kanieski, B.; Catts, G.P.; McCarter, J.B.; Posse, J.; Shen, T. Valuation and production possibilities on a working forest using multi-objective programming, Woodstock, timber NPV, and carbon storage and sequestration. Scand. J. For. Res. 2016, 31, 674–680. [Google Scholar] [CrossRef]
  9. Ren, W.; Zhu, Z.; Wang, Y.; Su, J.; Zeng, R.; Zheng, D.; Li, X. Comparison of Machine Learning Models in Simulating Glacier Mass Balance: Insights from Maritime and Continental Glaciers in High Mountain Asia. Remote Sens. 2024, 16, 956. [Google Scholar] [CrossRef]
  10. Li, Y.; Liu, S.; Bashiri Khuzestani, R.; Huang, K.; Bao, F. Emission-Based Machine Learning Approach for Large-Scale Estimates of Black Carbon in China. Remote Sens. 2024, 16, 837. [Google Scholar] [CrossRef]
  11. Zhao, P.; Lu, D.; Wang, G.; Liu, L.; Li, D.; Zhu, J.; Yu, S. Forest aboveground biomass estimation in Zhejiang Province using the integration of Landsat TM and ALOS PALSAR data. Int. J. Appl. Earth. Obs. 2016, 53, 1–15. [Google Scholar] [CrossRef]
  12. Rex, F.E.; Silva, C.A.; Dalla Corte, A.P.; Klauberg, C.; Mohan, M.; Cardil, A.; Silva, V.S.D.; Almeida, D.R.A.D.; Garcia, M.; Broadbent, E.N.; et al. Comparison of Statistical Modelling Approaches for Estimating Tropical Forest Aboveground Biomass Stock and Reporting Their Changes in Low-Intensity Logging Areas Using Multi-Temporal LiDAR Data. Remote Sens. 2020, 12, 1498. [Google Scholar] [CrossRef]
  13. Lu, D.; Chen, Q.; Wang, G.; Liu, L.; Li, G.; Moran, E. A survey of remote sensing-based aboveground biomass estimation methods in forest ecosystems. Int. J. Dig. Earth 2016, 9, 63–105. [Google Scholar] [CrossRef]
  14. Ma, Q.; Su, Y.; Niu, C.; Ma, Q.; Hu, T.; Luo, X.; Tai, X.; Qiu, T.; Zhang, Y.; Bales, R.C.; et al. Tree mortality during long-term droughts is lower in structurally complex forest stands. Nat. Commun. 2023, 14, 7467. [Google Scholar] [CrossRef]
  15. Oehmcke, S.; Li, L.; Trepekli, K.; Revenga, J.C.; Nord-Larsen, T.; Gieseke, F.; Igel, C. Deep point cloud regression for above-ground forest biomass estimation from airborne LiDAR. Remote Sens. Environ. 2024, 302, 113968. [Google Scholar] [CrossRef]
  16. Liang, X.; Hyyppä, J.; Kaartinen, H.; Lehtomäki, M.; Pyörälä, J.; Pfeifer, N.; Holopainen, M.; Brolly, G.; Francesco, P.; Hackenberg, J.; et al. International Benchmarking of Terrestrial Laser Scanning Approaches for Forest Inventories. ISPRS J. Photogramm. Remote Sens. 2018, 144, 137–179. [Google Scholar] [CrossRef]
  17. Lu, X.; Guo, Q.; Li, W.; Flanagan, J. A Bottom-up Approach to Segment Individual Deciduous Trees Using Leaf-off LiDAR Point Cloud Data. ISPRS J. Photogramm. Remote Sens. 2014, 94, 1–12. [Google Scholar] [CrossRef]
  18. Ma, Z.; Pang, Y.; Wang, D.; Liang, X.; Chen, B.; Lu, H.; Weinacker, H.; Koch, B. Individual tree crown segmentation of a larch plantation using airborne laser scanning data based on region growing and canopy morphology features. Remote Sens. 2020, 12, 1078. [Google Scholar] [CrossRef]
  19. Ma, K.; Chen, Z.; Fu, L.; Tian, W.; Jiang, F.; Yi, J.; Du, Z.; Sun, H. Performance and Sensitivity of Individual Tree Segmentation Methods for UAV-LiDAR in Multiple Forest Types. Remote Sens. 2022, 14, 298. [Google Scholar] [CrossRef]
  20. Pang, Y.; Wang, W.; Du, L.; Zhang, Z.; Liang, X.; Li, Y.; Wang, Z. Nyström-based spectral clustering using airborne LiDAR point cloud data for individual tree segmentation. Int. J. Dig. Earth 2021, 14, 1452–1476. [Google Scholar] [CrossRef]
  21. Cai, S.; Zhang, W.; Zhang, S.; Yu, S.; Liang, X. Branch architecture quantification of large-scale coniferous forest plots using UAV-LiDAR data. Remote Sens. Environ. 2024, 306, 114121. [Google Scholar] [CrossRef]
  22. Kukko, A.; Kaijaluoto, R.; Kaartinen, H.; Lehtola, V.V.; Jaakkola, A.; Hyyppä, J. Graph SLAM correction for single scanner MLS forest data under boreal forest canopy. ISPRS J. Photogramm. Remote Sens. 2017, 132, 199–209. [Google Scholar] [CrossRef]
  23. Reitberger, J.; Krzystek, P.; Stilla, U. Benefit of airborne full waveform lidar for 3D segmentation and classification of single trees. In Proceedings of the ASPRS 2009 Annual Conference, Baltimal, MD, USA, 9–13 March 2009. [Google Scholar]
  24. Yao, W.; Krzystek, P.; Heurich, M. Tree species classification and estimation of stem volume and DBH based on single tree extraction by exploiting airborne full-waveform LiDAR data. Remote Sens. Environ. 2012, 123, 368–380. [Google Scholar] [CrossRef]
  25. Wang, Y.; Weinacker, H.; Koch, B.; Sterenczak, K. Lidar point cloud based fully automatic 3D single tree modelling in forest and evaluations of the procedure. Int. Arch. Photogramm. Remote Sens. Spat. Inform. Sci. 2008, 37, 4–51. [Google Scholar]
  26. Yan, W.; Guan, H.; Cao, L.; Yu, Y.; Li, C.; Lu, J. A Self-Adaptive Mean Shift Tree-Segmentation Method Using UAV LiDAR Data. Remote Sens. 2020, 12, 515. [Google Scholar] [CrossRef]
  27. Wang, Y.; Hyyppä, J.; Liang, X.; Kaartinen, H.; Yu, X.; Lindberg, E.; Holmgren, J.; Qin, Y.; Mallet, C.; Ferraz, A. International benchmarking of the individual tree detection methods for modeling 3-D canopy structure for silviculture and forest ecology using airborne laser scanning. IEEE Trans. Geosci. Remote Sens. 2016, 54, 5011–5027. [Google Scholar] [CrossRef]
  28. Silva, V.S.D.; Silva, C.A.; Mohan, M.; Cardil, A.; Rex, F.E.; Loureiro, G.H.; Almeida, D.R.A.D.; Broadbent, E.N.; Gorgens, E.B.; Dalla Corte, A.P.; et al. Combined impact of sample size and modeling approaches for predicting stem volume in eucalyptus spp. forest plantations using field and LiDAR data. Remote Sens. 2020, 12, 1438. [Google Scholar] [CrossRef]
  29. Morsdorf, F.; Meiera, E.; Kötza, B.; Ittena, K.I.; Dobbertinc, M.; Allgöwer, B. LiDAR-based geometricreconstruction of boreal type forest stands at single tree level for forest and wildland fire management. Remote Sens. Environ. 2004, 92, 353–362. [Google Scholar] [CrossRef]
  30. Heinzel, J.N.; Weinacker, H.; Koch, B. Prior-knowledge-based single-tree extraction. Int. J. Remote Sens. 2011, 32, 4999–5020. [Google Scholar] [CrossRef]
  31. Brandtberg, T.; Warner, T.A.; Landenberger, R.E.; McGraw, J.B. Detection and analysis of individual leaf-off tree crowns in small footprint, high sampling density lidar data from the eastern deciduous forest in North America. Remote Sens. Environ. 2003, 85, 290–303. [Google Scholar] [CrossRef]
  32. Ene, L.; Næsset, E.; Gobakken, T. Single tree detection in heterogeneous boreal forests using airborne laser scanning and area-based stem number estimates. Int. J. Remote Sens. 2012, 33, 5171–5193. [Google Scholar] [CrossRef]
  33. Smits, I.; Prieditis, G.; Dagis, S.; Dubrovskis, D. Individual tree identification using different LIDAR and optical imagery data processing methods. Biosyst. Inf. Technol. 2012, 1, 19–24. [Google Scholar] [CrossRef]
  34. Yang, J.; Kang, Z.; Cheng, S.; Yang, Z.; Akwensi, P. An individual tree segmentation method based on watershed algorithm and 3D spatial distribution analysis from airborne LiDAR point clouds. IEEE J. Sel. Top. Appl. Earth Obs. Remote Sens. 2020, 99, 1055–1067. [Google Scholar] [CrossRef]
  35. Zhen, Z.; Quackenbush, L.J.; Zhang, L. Trends in automatic individual tree crown detection and delineation-evolution of LiDAR data. Remote Sens. 2016, 8, 333. [Google Scholar] [CrossRef]
  36. Kuželka, K.; Slavík, M.; Surový, P. Very high density point clouds from UAV laser scanning for automatic tree stem detection and direct diameter measurement. Remote Sens. 2020, 12, 1236. [Google Scholar] [CrossRef]
  37. Wieser, M.; Mandlburger, G.; Hollaus, M.; Otepka, J.; Glira, P.; Pfeifer, N. A Case Study of UAS Borne Laser Scanning for Measurement of Tree Stem Diameter. Remote Sens. 2017, 9, 1154. [Google Scholar] [CrossRef]
  38. Liang, X.; Wang, Y.; Pyörälä, J.; Lehtomäki, M.; Yu, X.; Kaartinen, H.; Kukko, A.; Honkavaara, E.; Issaoui, A.; Nevalainen, O.; et al. Forest in situ observations using unmanned aerial vehicle as an alternative of terrestrial measurements. For. Ecosyst. 2019, 6, 20. [Google Scholar] [CrossRef]
  39. Xu, Q.; Li, B.; Maltamo, M.; Tokola, T.; Hou, Z. Predicting tree diameter using allometry described by non-parametric locally estimated copulas from tree dimensions derived from airborne laser scanning. For. Ecol. Manag. 2019, 434, 205–212. [Google Scholar] [CrossRef]
  40. Popescu, S.C. Estimating biomass of individual pine trees using airborne lidar. Biomass Bioenergy 2007, 31, 646–655. [Google Scholar] [CrossRef]
  41. Goodbody, T.R.; Coops, N.C.; Tompaoski, P.; Crawford, P.; Day, K.J. Updatingresidual stem volume estimates using AlS-and UAV-acquiredstereo-photogrammetric point clouds. Int. J. Remote Sens. 2017, 38, 2938–2953. [Google Scholar] [CrossRef]
  42. Tao, S.; Guo, Q.; Li, L.; Xue, B.; Kelly, M.; Li, W.; Xu, G.; Su, Y. Airborne LiDAR-derived volume metrics for aboveground biomass estimation: A comparative assessment for conifer stands. Agric. For. Meteorol. 2014, 198, 24–32. [Google Scholar] [CrossRef]
  43. Paris, C.; Bruzzone, L. A Growth-model-driven technique for tree stem diameter estimation by using airborne LiDAR Data. IEEE Trans. Geosci. Remote Sens. 2018, 99, 1–17. [Google Scholar] [CrossRef]
  44. Dalponte, M.; Bruzzone, L.; Gianelle, D. A system for the estimation of single-tree stem diameter and volume using multireturn LiDAR Data. IEEE Trans. Geosci. Remote Sens. 2011, 49, 2479–2490. [Google Scholar] [CrossRef]
  45. Bi, H.; Fox, J.; Li, Y.; Lei, Y.; Pang, Y. Evaluation of nonlinear equations for predicting diameter from tree height. Can. J. For. Res. 2012, 42, 789–806. [Google Scholar] [CrossRef]
  46. Fu, L.; Zhang, H.; Sharma, R.P.; Pang, L.; Wang, G. A generalized nonlinear mixed-effects height to crown base model for Mongolian oak in northeast China. For. Ecol. Manag. 2017, 384, 34–43. [Google Scholar] [CrossRef]
  47. Fu, L.; Sharma, R.P.; Hao, K.; Tang, S. A generalized interregional nonlinear mixed-effects crown width model for Prince Rupprecht larch in northern China. For. Ecol. Manag. 2017, 389, 364–373. [Google Scholar] [CrossRef]
  48. Fu, L.; Sun, H.; Sharma, R.P.; Lei, Y.; Zhang, H.; Tang, S. Nonlinear mixed-effects crown width models for individual trees of Chinese fir (Cunninghamia lanceolata) in south-central China. For. Ecol. Manag. 2013, 302, 210–220. [Google Scholar] [CrossRef]
  49. Calama, R.; Montero, G. Multilevel linear mixed model for tree diameter increment in stone pine (Pinus pinea): A calibrating approach. Silva Fenn. 2005, 39, 37–54. [Google Scholar] [CrossRef]
  50. Zhang, W.; Qi, J.; Wan, P.; Wang, H.; Xie, D.; Wang, X.; Yan, G. An Easy-to-Use Airborne LiDAR Data Filtering Method Based on Cloth Simulation. Remote Sens. 2016, 8, 501. [Google Scholar] [CrossRef]
  51. Lee, H.; Slatton, K.C.; Roth, B.E.; Cropper, W.P., Jr. Adaptive clustering of airborne LiDAR data to segment individual tree crowns in managed pine forests. Int. J. Remote Sens. 2010, 31, 117–139. [Google Scholar] [CrossRef]
  52. Zhang, Z.; Wang, J.; Li, Z.; Zhao, Y.; Wang, R.; Habib, A. Optimization Method of Airborne LiDAR Individual Tree Segmentation Based on Gaussian Mixture Model. Remote Sens. 2022, 14, 6167. [Google Scholar] [CrossRef]
  53. Yang, Q.; Su, Y.; Jin, S.; Kelly, M.; Hu, T.; Ma, Q.; Li, Y.; Song, S.; Zhang, J.; Xu, G.; et al. The Influence of Vegetation Characteristics on Individual Tree Segmentation Methods with Airborne LiDAR Data. Remote Sens. 2019, 11, 2880. [Google Scholar] [CrossRef]
Figure 1. The methodological framework of this study.
Remotesensing 16 02736 g001
Figure 2. Location of the study area. (a) and (b) illustrate the locations of the study area in Guangxi, China, while (c) presents the forest phase diagram associated with this area.
Remotesensing 16 02736 g002
Figure 3. Distribution of tree height and diameter at breast height.
Remotesensing 16 02736 g003
Figure 4. Logical schematic of the improved Gaussian mixture model individual tree segmentation method. (a,b) illustrate the normalized point cloud and the results of individual tree segmentation. (ce) represent the three key processes of the improved Gaussian mixture model algorithm.
Remotesensing 16 02736 g004
Figure 5. Matching results of individual tree detections with measured positions: (a) WS, (b) QP, (c) GMM, and (d) IGMM.
Remotesensing 16 02736 g005
Figure 6. Plots of the HL extracted from the individual tree point cloud against the measured H. In the figure, a circle denotes the position of a tree within the coordinate system, derived from the extracted tree height obtained using UAV-LiDAR point cloud data and the measured tree height. The red dashed line illustrates the linear fitting relationship between the two height measurements, while the blue line serves as the reference line indicating equality.
Remotesensing 16 02736 g006
Figure 7. Plots of the estimated DBH against the measured DBH. In the figure, a circle denotes the position of a tree within the coordinate system, derived from the extracted tree DBH predicted using Weibull model and the measured tree DBH. The red dashed line illustrates the linear fitting relationship between the two DBH measurements, while the blue line serves as the reference line indicating equality.
Remotesensing 16 02736 g007
Table 1. The five alternative DBH-H models for Cunninghamia lanceolata.
Model NameDBH Prediction Equation
Linear regression model D B H = H a b
Allometric growth model D B H = ( H a ) 1 b
Bates–Watts model D B H = H b a H
Meyer model D B H = ln ( 1 H a ) b
Weibull model D B H = [ ln ( 1 H a ) b ] 1 c
Note: a, b, and c are the unknown parameters that need to be fitted.
Table 2. Comparison of individual tree detection performance among four different methods.
MethodN * (n)Nc * (n)Nm * (n)No * (n)R *p *F *
WS131116401574.36%88.55%0.808
QP140129271182.69%92.14%0.872
GMM141131251083.97%92.91%0.882
IGMM14613917789.10%95.21%0.921
* Note: N, detected number; Nc, correct detection number; Nm, missing detection number; No, over detection; r, detection rate; p, accuracy rate; F, F-score.
Table 3. The DBH-H estimation model for Cunninghamia lanceolata.
Model IDModel NameabcR2RMSE (cm)
ILinear regression model0.5080.039-0.762.086
IIAllometric growth model1.8110.684-0.781.873
IIIBates–Watts model5.4690.048-0.781.513
IVMeyer model7.128−7.532-0.801.439
VWeibull model12.5730.0241.7250.841.024
Note: a, b, and c are the values of the parameter being fitted.
Table 4. Accuracy analysis of stand volume estimation by UAV-LiDAR.
MethodTotal SegmentationCorrect Segmentation
Number (n)Estimated Volume (m3)RA (%)Number (n)Estimated Volume (m3)RA (%)
WS12144.7382.1211641.9476.99%
QP13648.0188.1412945.6583.81%
GMM14149.2890.4713146.0784.58%
IGMM14950.6793.0213948.4690.86%
Disclaimer/Publisher’s Note: The statements, opinions and data contained in all publications are solely those of the individual author(s) and contributor(s) and not of MDPI and/or the editor(s). MDPI and/or the editor(s) disclaim responsibility for any injury to people or property resulting from any ideas, methods, instructions or products referred to in the content.

