Abstract
Images acquired by different sensors exhibit different characteristics because of the varied imaging mechanisms of sensors. The fusion of visible and infrared images is valuable for specific image applications. While infrared images provide stronger object features under poor illumination and smoke interference, visible images have rich texture features and color information about the target. This study uses dual optical fusion as an example to explore fusion detection methods at different levels and proposes a multimodal decision-level fusion detection method based on category probability sets (CPROS). YOLOv8—a single-mode detector with good detection performance—was chosen as the benchmark. Next, we innovatively introduced the improved Yager formula and proposed a simple non-learning fusion strategy based on CPROS, which can combine the detection results of multiple modes and effectively improve target confidence. We validated the proposed algorithm using the VEDAI public dataset, which was captured from a drone perspective. The results showed that the mean average precision (mAP) of YOLOv8 using the CPROS method was 8.6% and 16.4% higher than that of the YOLOv8 detection single-mode dataset. The proposed method significantly reduces the missed detection rate (MR) and number of false detections per image (FPPI), and it can be generalized.
1. Introduction
Target detection is a typical computer vision problem, and because of their broad application potential in image processing and pattern recognition, target detectors have been widely used in various safety systems over the past few decades, such as safe autopilot and drone detection [1,2,3]. To overcome the impact of smoke interference and illumination damage during the detection of ground targets by UAV [4,5], we studied the use of visible and infrared dual-light pods for multimodal target detection as they can provide stronger object features in the case of smoke interference and insufficient illumination [6].
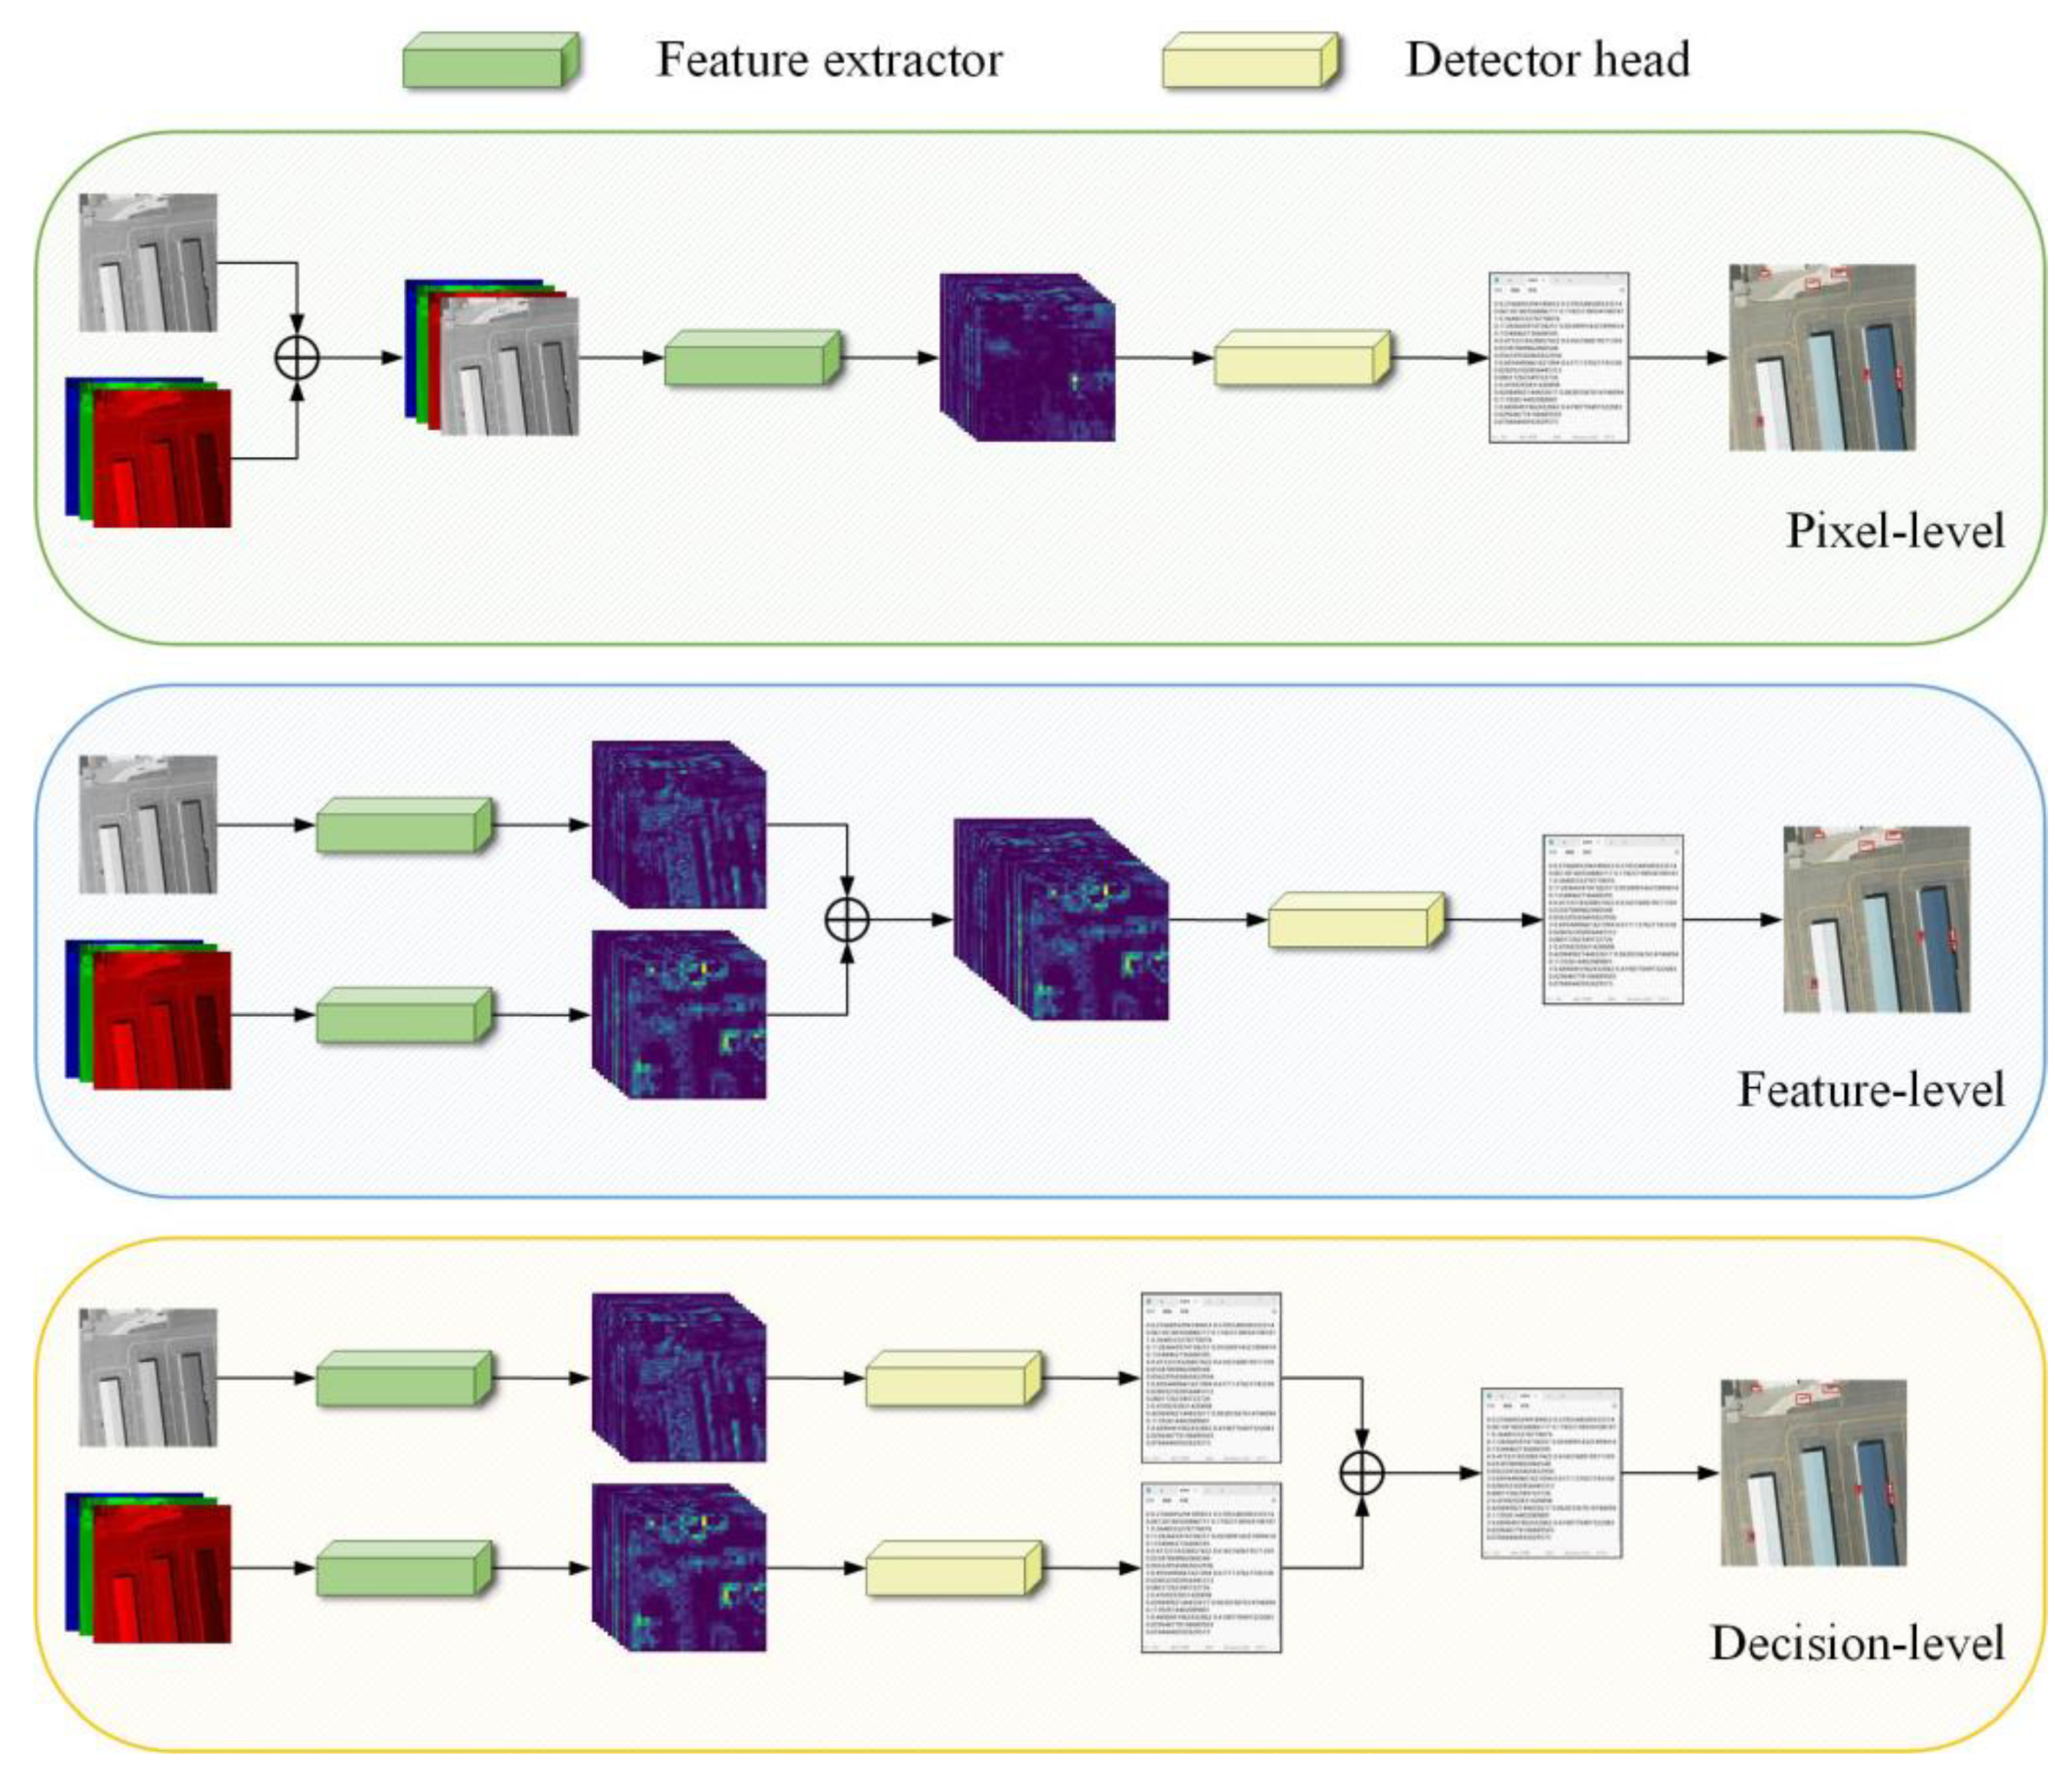
The core problem of multimodal detection is multimodal information fusion, which can be divided into pixel-, feature-, and decision-level fusion according to different multimodal fusion stages [7], as shown in Figure 1. Pixel-level fusion forms a four-channel output by superimposing three-channel RGB and one-channel IR, which then produces the detection result through the detector [8]. Feature-level fusion involves inputting visible and infrared images into the feature extractor and then merging the extracted features into the subsequent detection network [8,9]. Decision-level fusion refers to the fusion of detection results obtained by separately detecting visible and infrared modalities using a fusion decision based on mathematical theorems [10].

Figure 1.
Schematic diagram of fusion in different stages.
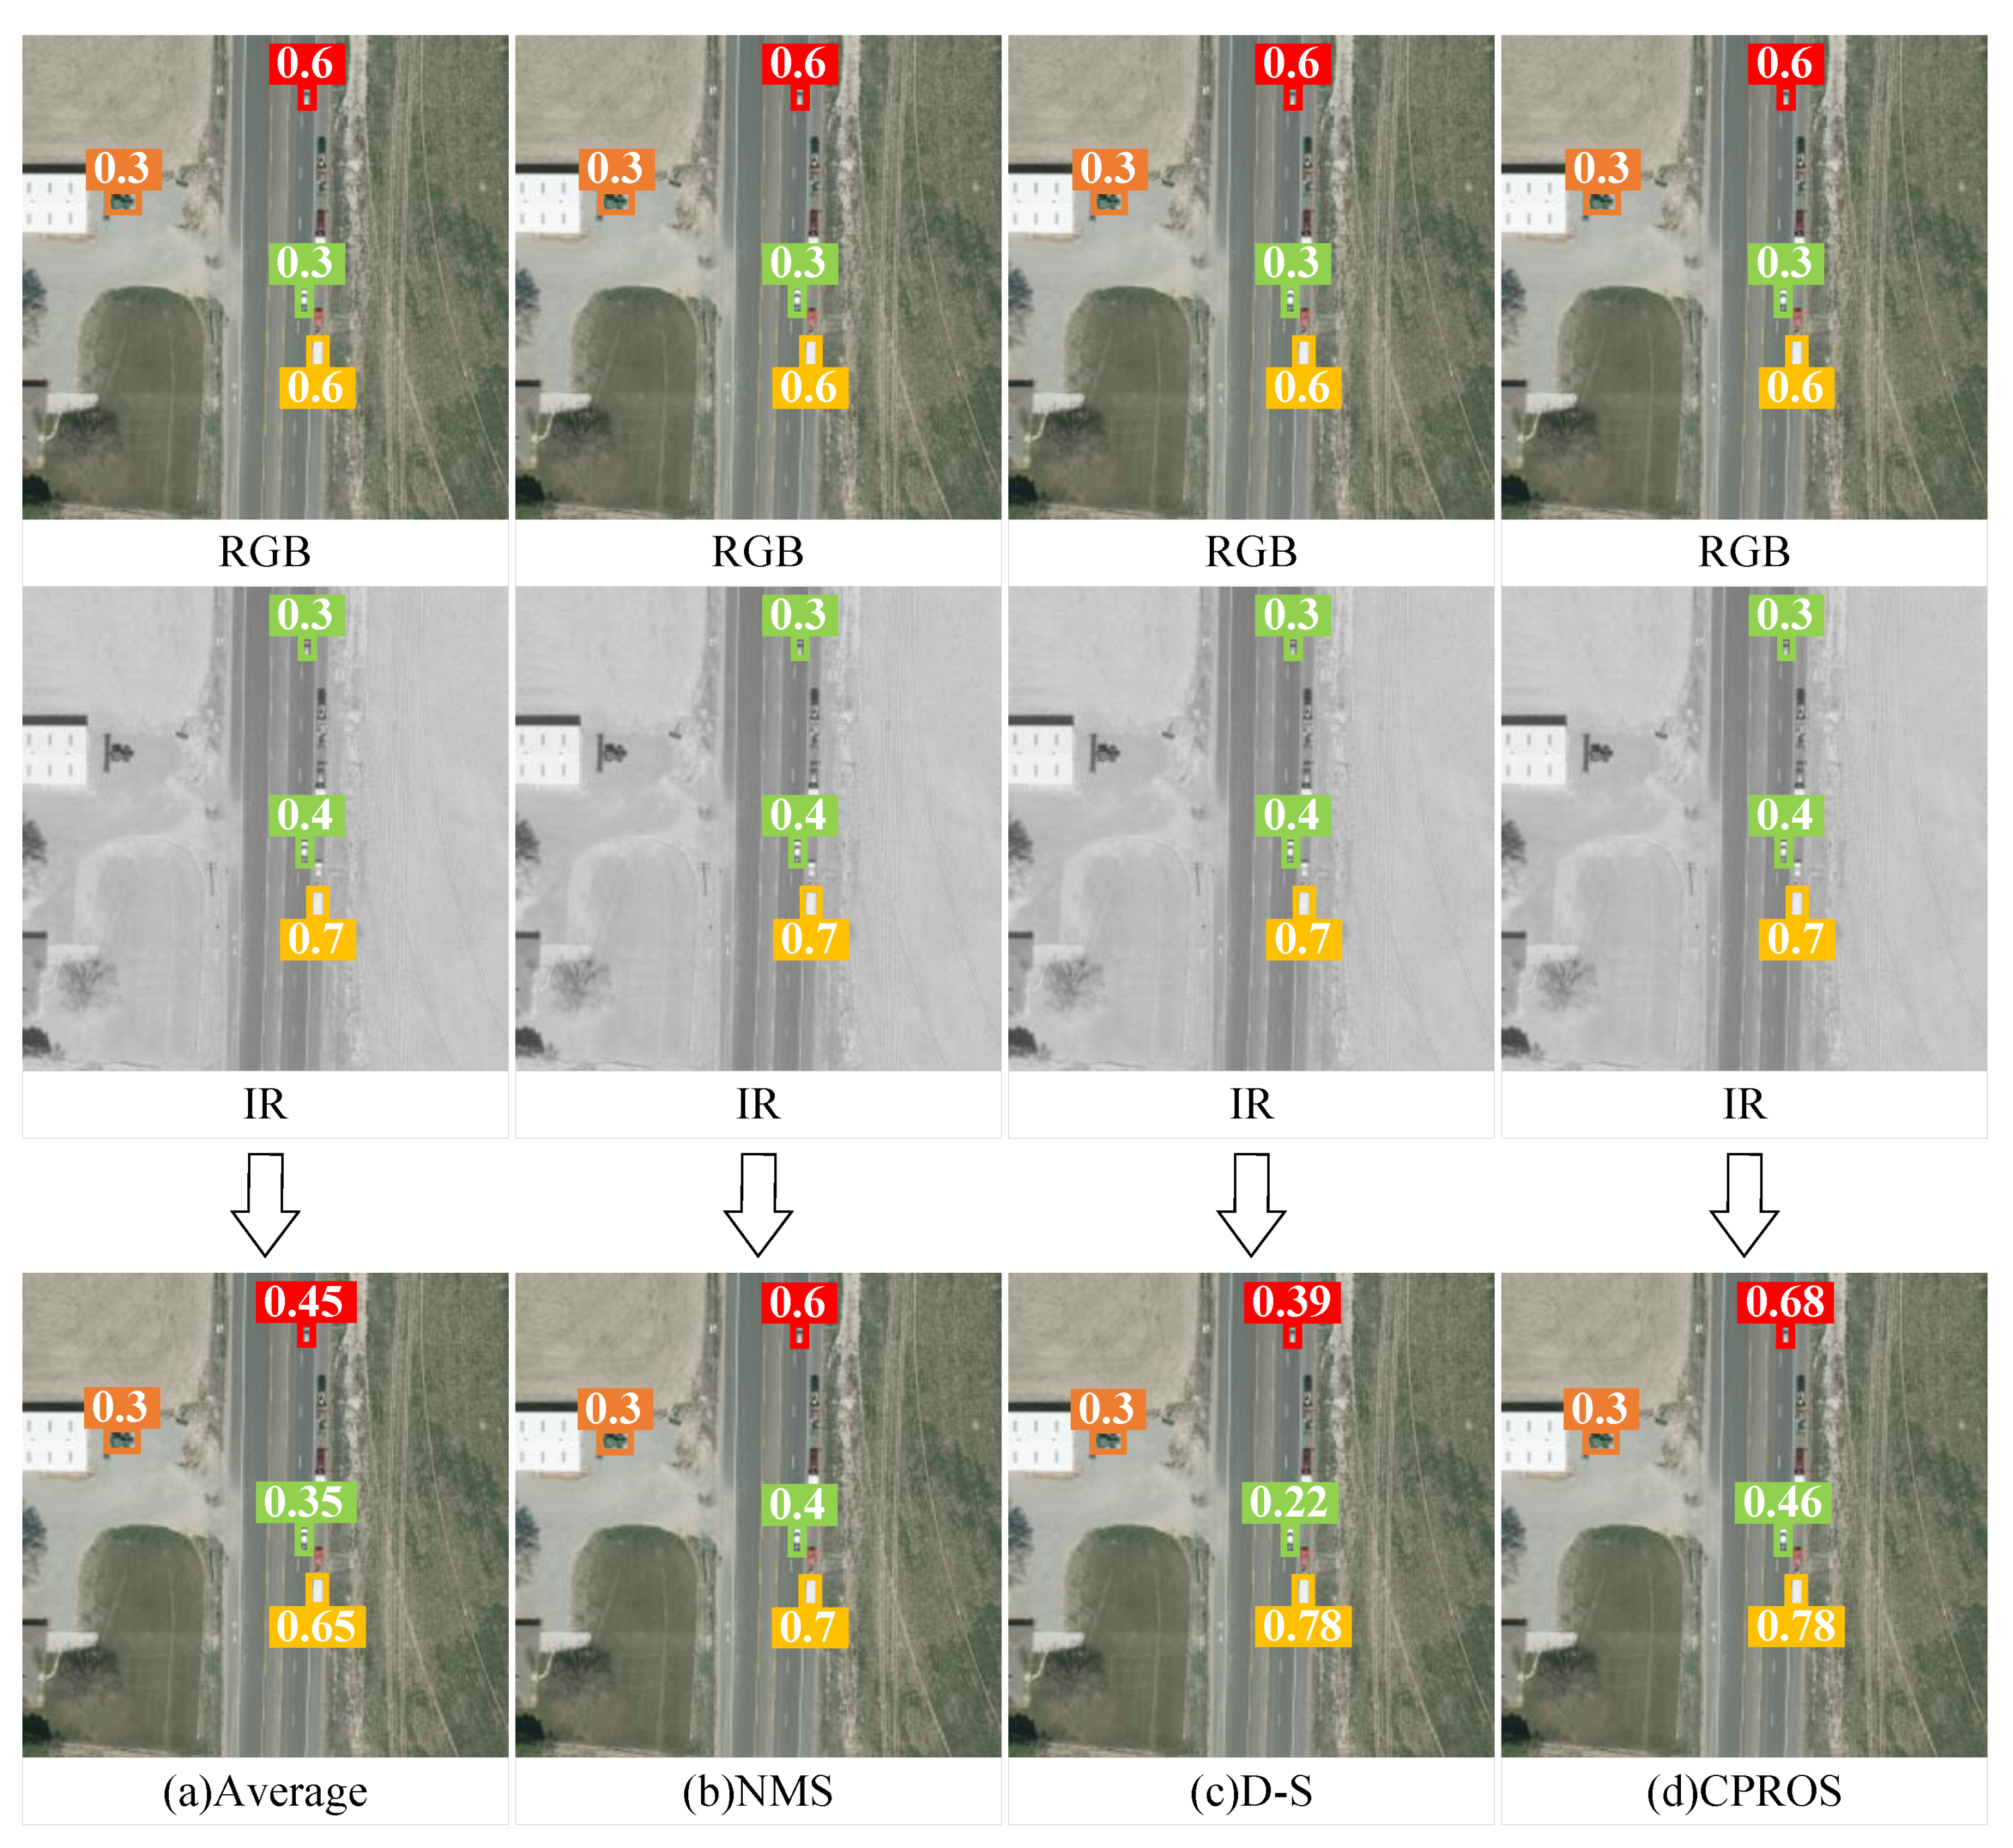
In practical applications, pixel- and feature-level fusion often require a large number of image pairs of different modes with high alignment accuracy for training, which results in a significant workload [11,12], and the advantages of non-learning decision-level fusion are self-evident. Figure 2 illustrates the fusion strategy for multimodal detection by fusing the detection results of the single-mode detector. (a) A simple method involves averaging the scores of overlapping tests; however, this results in lower confidence scores for the test results [13]. (b) To avoid score degradation, non-maximum suppression (NMS) can be applied to suppress overlapping detections from different modes, which always obtains the detection with the highest confidence. Although NMS is a simple and effective fusion strategy, it can only avoid a reduction in confidence scores and cannot effectively improve it [14]. (c) A strategy that can effectively enhance confidence scores is the D-S evidence theory, which can improve the multimodal detection and detection accuracy of targets [15,16]. However, D-S can only improve the scores of test results with high confidence and cannot be applied to test results with low confidence. (d) Therefore, a simple fusion strategy—CPROS—is derived in this study; it fuses a set of category probabilities of the test results to improve the scores for tests with strong evidence from multiple modes.
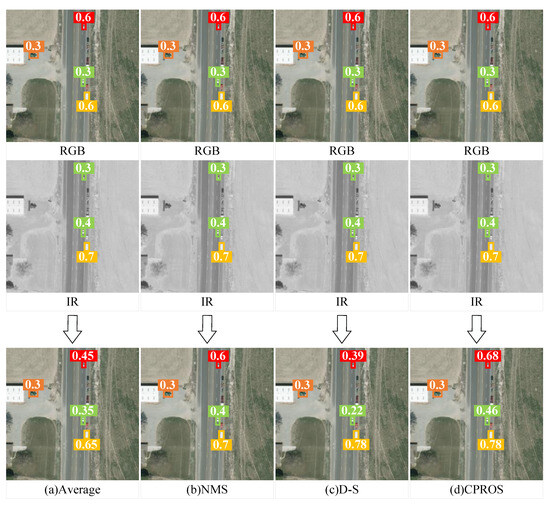
Figure 2.
Illustration of various fusion strategies. (a) Average; (b) NMS; (c) D-S; and (d) CPROS. A single-mode detector is used to detect visible and infrared images separately, obtaining detection results (category, confidence, and detection box). They are then fused through different fusion strategies to output the final result. Different colors represent various categories.
The aim of this study is to obtain detection results under different modes through efficient single-mode detectors trained on different modal datasets and to fuse the detection results of different modes according to fusion strategies designed by mathematical theorems to obtain optimal decision results. Our non-learning CPROS is not only more interpretable than fusion algorithms that need to be learned but also better than previous work. Although this concept is simple, its effectiveness is good.
The main contributions of this study are summarized below. (1) A multimodal decision-level fusion detection method (CPROS) based on category probability sets is proposed. Experimental results on benchmark datasets prove the effectiveness of CPROS. (2) Ablation studies were conducted to verify the superiority of the CPROS by combining different confidence and detection box fusion methods. The experimental results show that CPROS can achieve higher detection accuracy than the three most advanced fusion decisions. (3) The proposed decision-level fusion method, CPROS, is applied to different single-mode detectors, and it is found that the multimodal detector using CPROS has better detection performance than the single-mode detector, proving the generality of CPROS. The remainder of this article is organized as follows. The second section describes the recent progress of research on decision-level fusion. In the third section, the two aspects of probability fusion and box fusion are discussed. In the fourth section, the validity, superiority, and generality of the proposed CPROS method are verified using the VEDAI dataset. Finally, the fifth section presents conclusions and prospects for future work.
2. Related Works
2.1. Multimodal Fusion
Currently, research on multimodal fusion mainly focuses on pixel- and feature-level fusion, with relatively little research on decision-level fusion, which requires strict logic. Pixel-level fusion can achieve fine operations on an image in image processing, but the information of each pixel needs to be considered. Therefore, it requires high computational resources and processing power and is easily affected by noise, resulting in unstable results. Additionally, pixel-level fusion uses relatively little spatial information, which may result in a lack of visual coherence and structure in processed images [17]. Feature-level fusion can better capture the abstract information of an image, reduce data dimensions, and improve computational efficiency. Additionally, the semantic information of the images can be better retained, making subsequent image recognition and classification tasks more accurate and reliable [18]. Most importantly, feature-level fusion can better adapt to inputs of different sizes and shapes, has greater generalization ability, and is suitable for a broader range of image-processing tasks [19].
Pixel- and feature-level fusions based on deep learning require a large amount of alignment data for training to achieve good results in practical image-processing tasks [20,21]. Pixel-level fusion involves the consideration of the information of each pixel; therefore, it requires training data that contain rich image details and data samples from various scenes to ensure that the model can accurately capture and fuse pixel-level information. This means that large-scale image datasets are required for training pixel-level fusion models, and it is necessary to ensure the diversity and representativeness of datasets to improve the generalization ability and adaptability of the models. Although feature-level fusion can reduce the data dimension compared with pixel-level fusion, large-scale image data are still needed to train the feature extractor or feature fusion model [22].
In actual situations, the amount of data in different modes is often unequal, sometimes not even of the same order of magnitude, and the need to obtain image pairs of different modes with high alignment accuracy brings more significant challenges to the training of pixel- and feature-level fusion, and the advantages of non-learning decision-level fusion are self-evident.
2.2. Decision-Level Fusion
Decision-level fusion is the fusion of single-mode detection results, which have been the subject of few research studies and are currently difficult to achieve. For multisensor systems, information is diverse and complex; therefore, the basic requirements for decision-level fusion methods are robustness and parallel processing capabilities. Other requirements include the speed, accuracy, and information sampling capabilities of the algorithm. Generally, mathematical methods based on nonlinear systems can be used as decision-level fusion methods if they exhibit fault tolerance, adaptability, associative memory, and parallel processing capabilities [23]. The following mathematical methods are commonly used.
- Weighted average method [13,24]: The most straightforward and intuitive method is the weighted average method, which weighs the redundant information provided by a group of sensors, and the result is used as the fusion value. This method operates directly utilizing a data source.
- Multi-Bayesian estimation method [25,26]: Each sensor is regarded as a Bayesian estimator, and the associated probability distribution of each object is synthesized into a joint posterior probability distribution function. By minimizing the likelihood function of the joint distribution function, the final fusion value of the multisensor information is obtained, and a prior model of the fusion information and environment is developed to provide a feature description of the entire environment.
- D-S evidence reasoning method [27]: This method is an expansion of Bayesian reasoning; its reasoning structure is top-down and divided into three levels. The first level is the target synthesis, and its role is to synthesize the observation results from the independent sensor into a total output result. The second stage is inference, whose function is to obtain the observation results of the sensor, make inferences, and expand the observation results to the target report. The third level is updated, and the sensors are generally subject to random errors. Therefore, a set of successive reports from the same sensor that is sufficiently independent in time is more reliable than any single report. Therefore, before inference and multisensor synthesis, it is necessary to update the sensor observation data.
Additionally, fuzzy set theory [28,29], rough set theory [30], Z-number theory [31], and D-number theory [32] have been proposed. Among the various decision-level fusion methods using mathematical theory proposed at the present stage, a more straightforward decision-level fusion method is used to aggregate the detection of each mode and then weight the average scores of overlapping detection rather than the less inhibited detection, such as non-maximum suppression; however, this operation will inevitably reduce the reported scores compared with NMS. Intuitively, if two patterns agree on candidate detection, the score of one should improve [13,14,24]. For this reason, Chen et al. introduced the D-S evidence theory into fusion decision-making [33]. When detectors of different modes detect the same object, D-S can gracefully deal with the missing information and significantly improve multimodal detection and the detection accuracy of the target. However, D-S can only improve the scores of detection results with high confidence and is not applicable to detection results with low confidence. Moreover, when the categories detected by the detector are inconsistent, no concrete or feasible decision methods are provided.
In summary, all the fusion decision methods mentioned above use only confidence information in the detection results, focus more on the fusion of confidence, and do not provide effective fusion strategies for categories. Additionally, confidence fusion is less effective at low confidence levels. Accordingly, a decision-level fusion method based on a category probability set is proposed in this study, aiming to make full use of the output of a single-mode detector to provide more efficient and interpretable detection results.
3. Fusion Strategies for Multimodal Detection
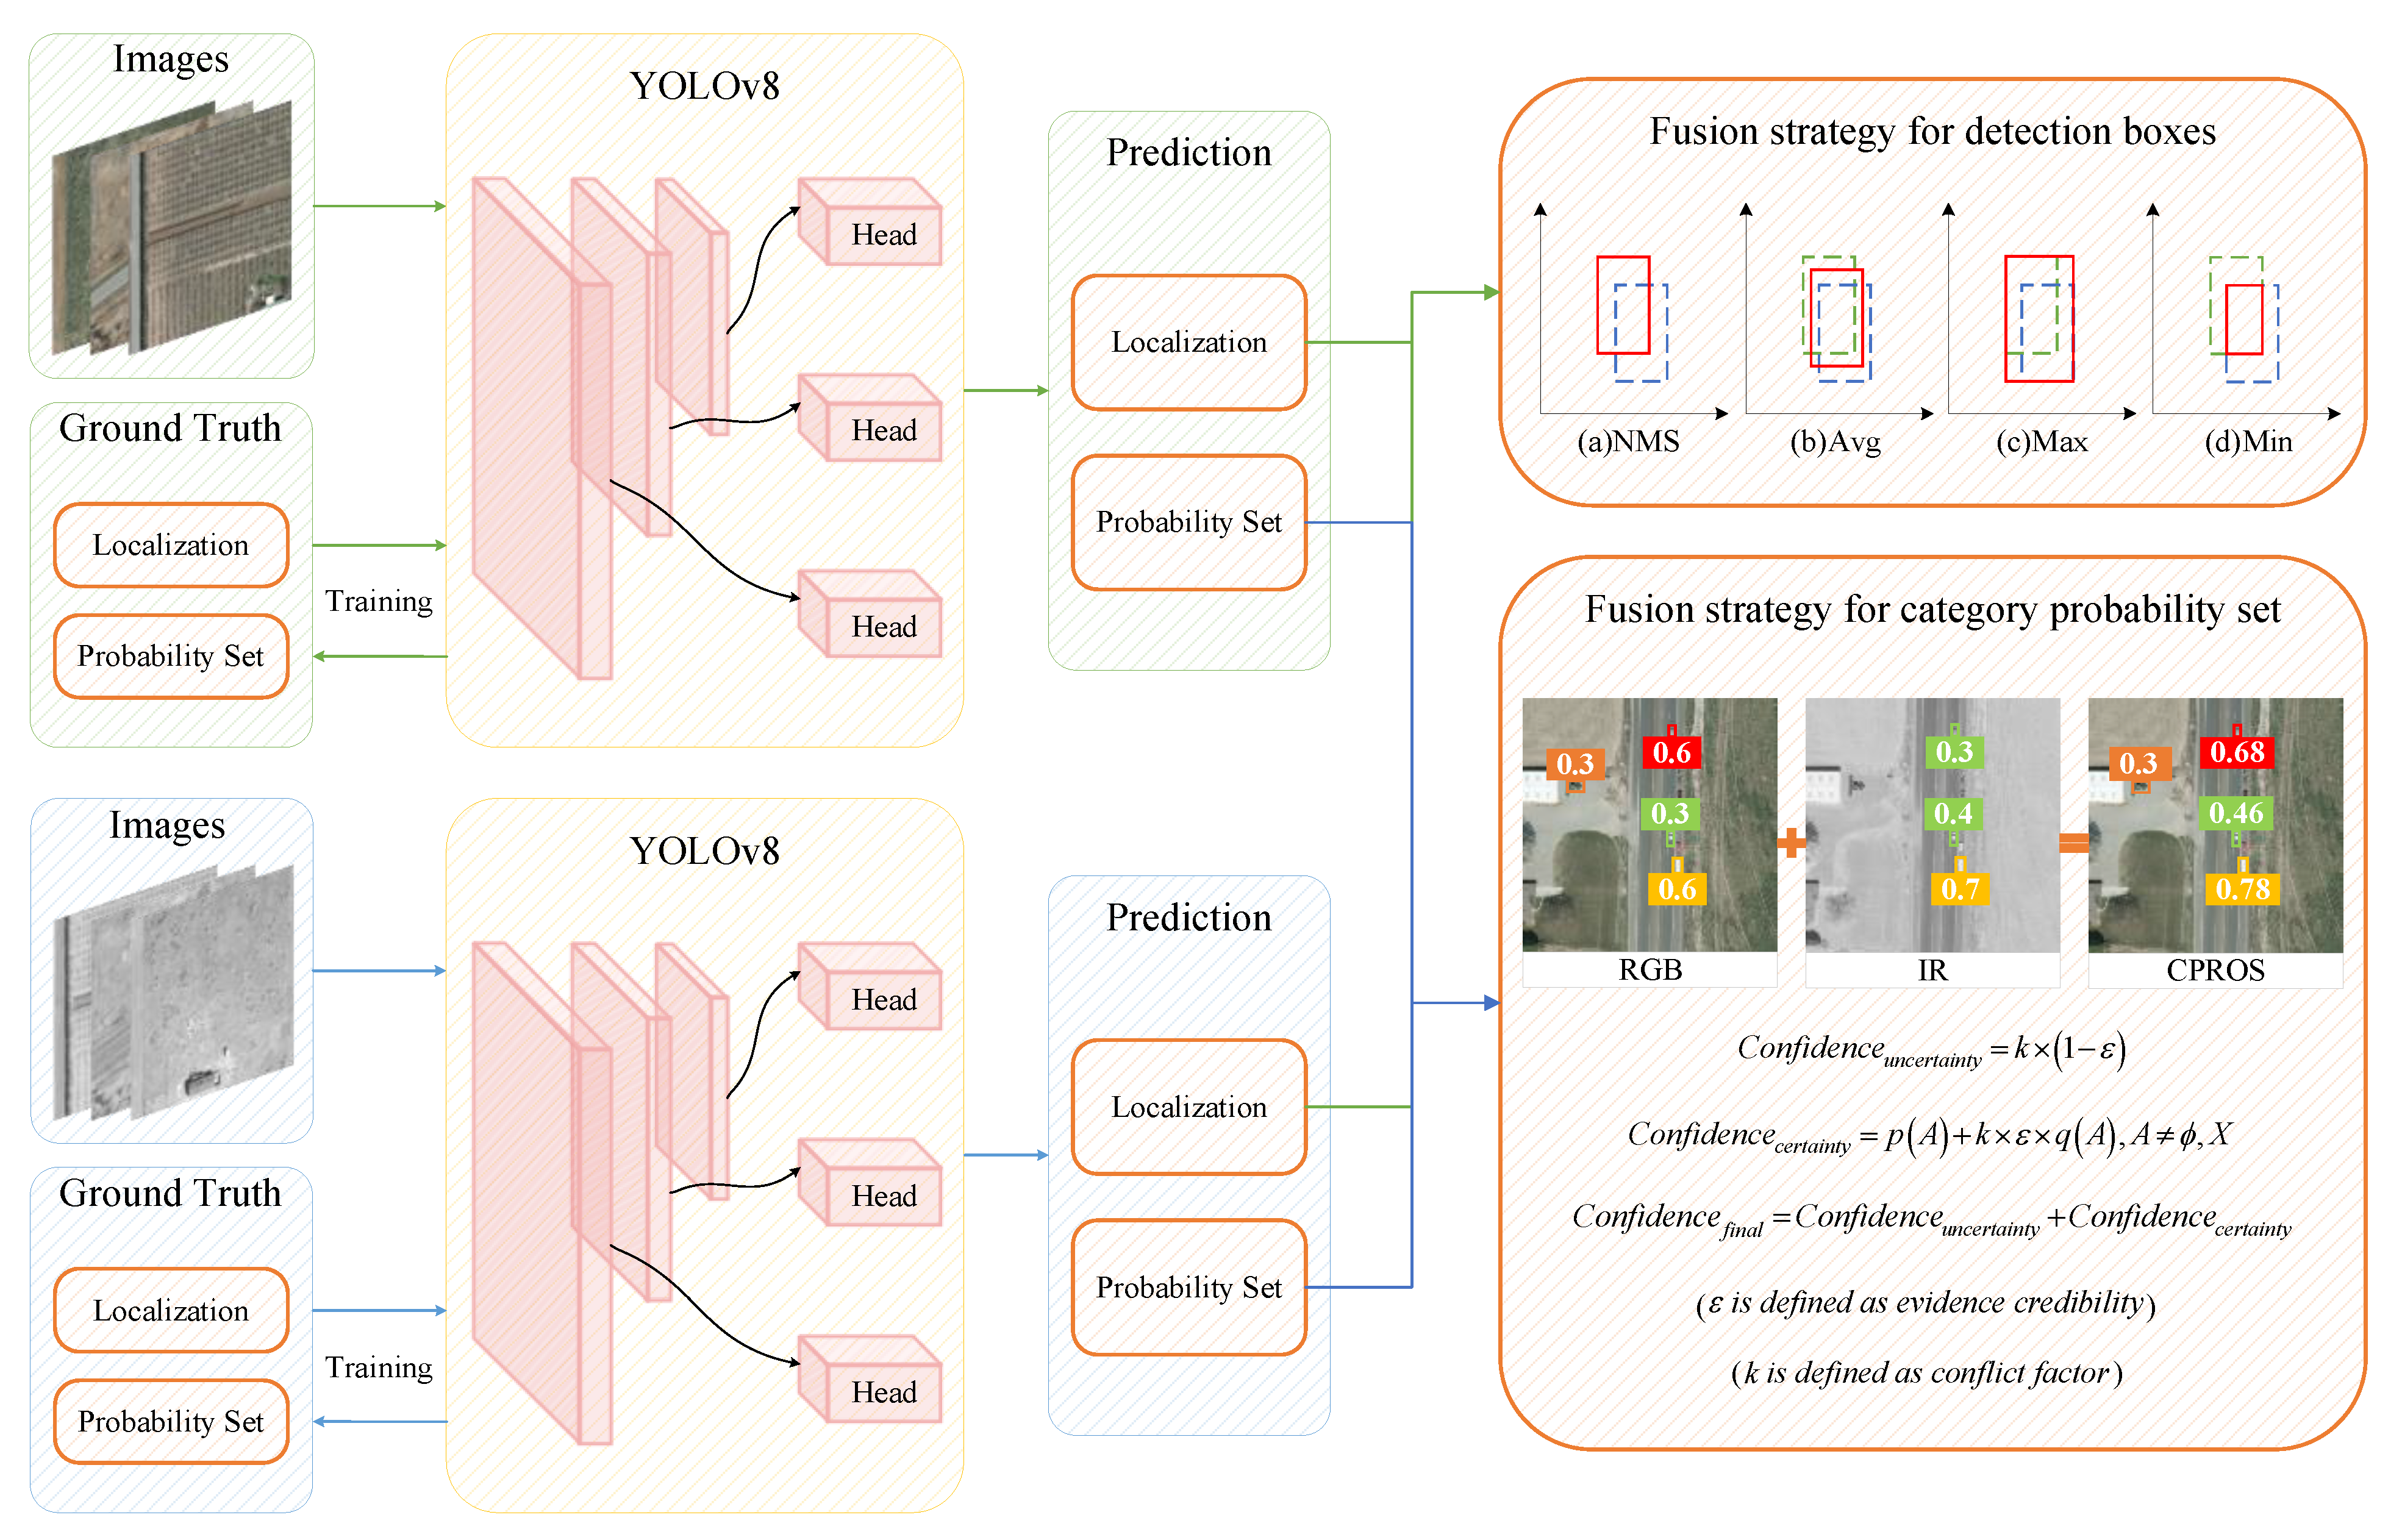
An overview of the detection pipeline using CPROS is presented in Figure 3. First, the visible and infrared images and their corresponding labels were input into the YOLOv8 detection network for training, and a single-mode detector suitable for different modes with good detection performance was developed. In subsequent practical tasks, the detector can obtain detection results based on the characteristics of the target in various modes, and then we can apply our decision-level fusion method to achieve more accurate detection.
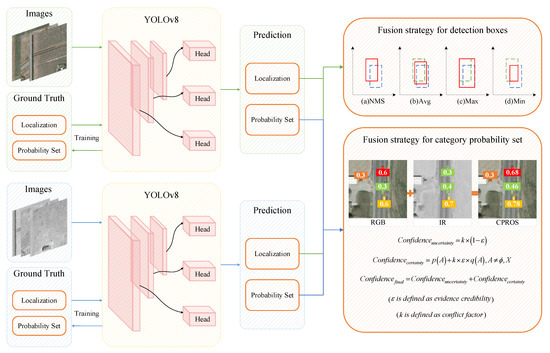
Figure 3.
Overall framework of CPROS.
We derive our fusion method, CPROS, from multiple theorems and rules, which combine the advantages of various fusion decisions proposed at this stage and innovatively introduce the improved Yager formula to solve the problem of poor fusion effects under low-confidence conditions [34,35]. Importantly, CPROS can gracefully handle “missing detection” through probabilistic integration. Because the CPROS is a non-learning strategy based on mathematical rules, it does not require multimodal data for training. Therefore, the CPROS is a general-purpose technology used for integrated detectors.
3.1. Fusion Strategy for Detection Boxes
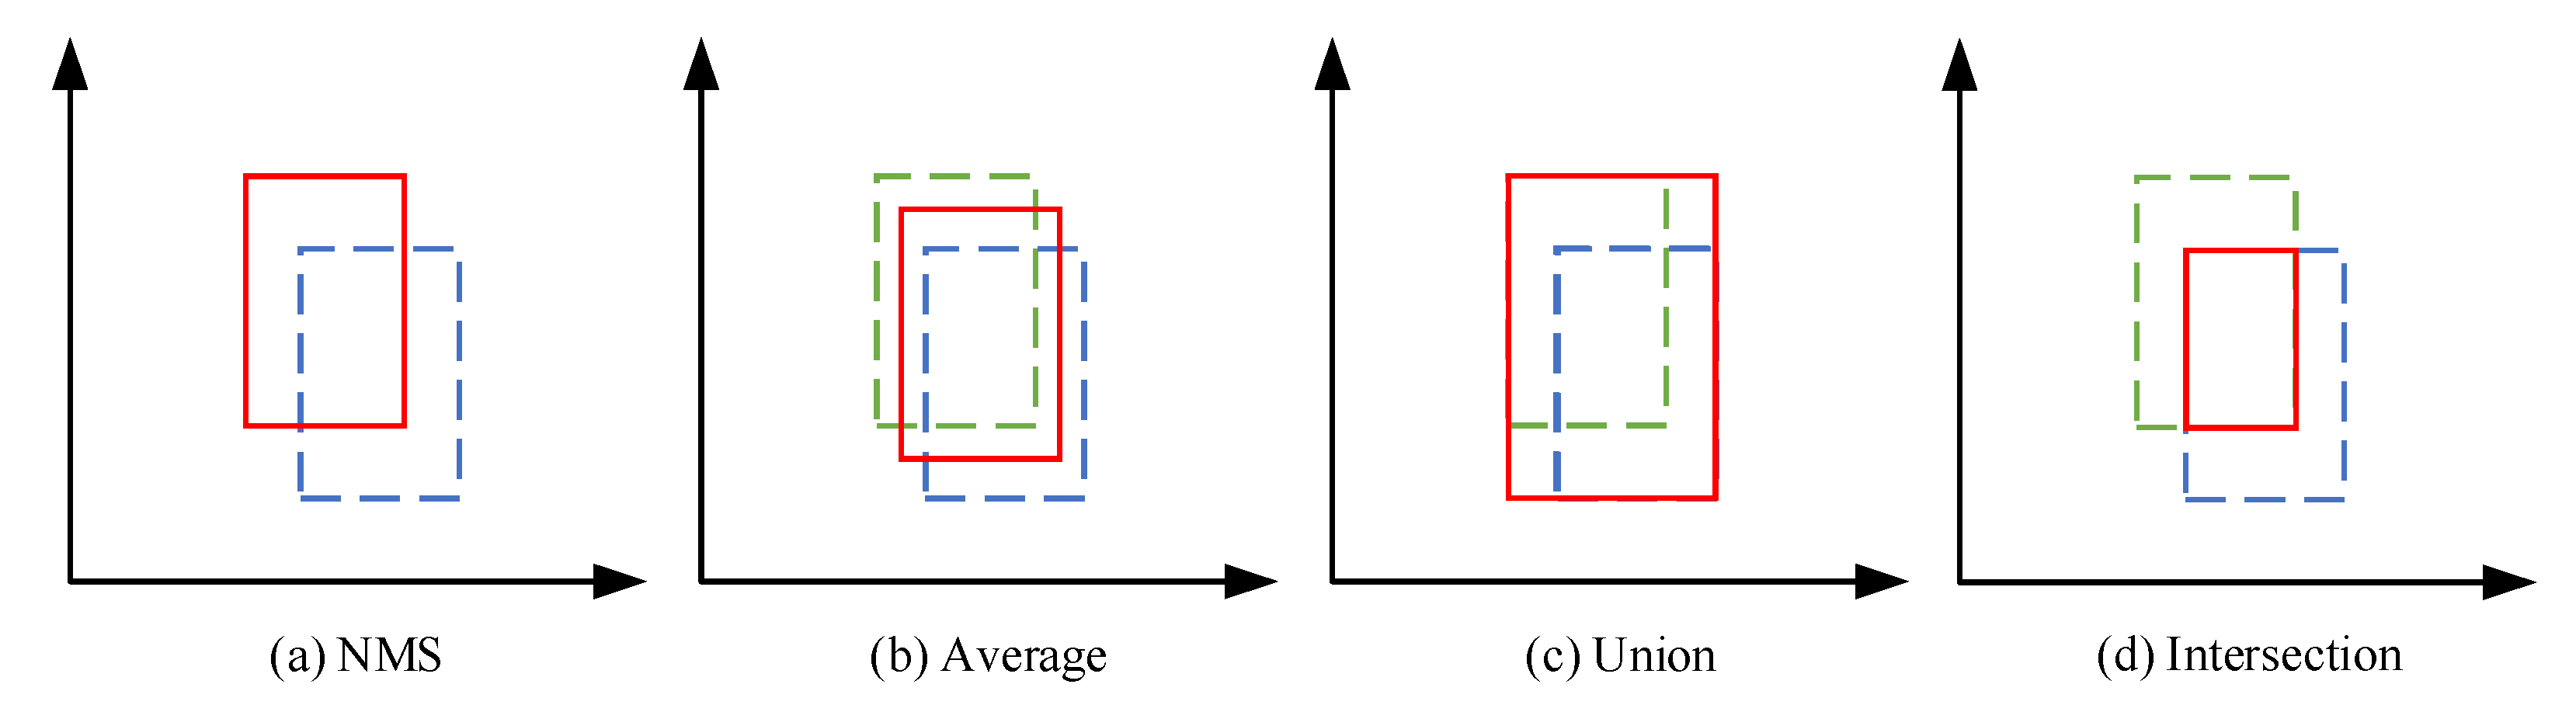
We explored four methods for fusing the detection boxes, as shown in Figure 4. The first method, “NMS”, eliminates redundant detection results by comparing the confidence scores of targets in the overlapping region, but it is not applicable to the problem of box size imbalance, which may lead to missing detection of small targets. The second method, “average”, is equivalent to simply averaging bounding box coordinates, which can reduce the bias of a single detection box and improve the overall position estimation accuracy, but it ignores the differences between different detection boxes. For detection boxes with low overlap or significant size differences, the averaging method may not be applicable. The third method, “union”, can cover the overall position and size of the target more comprehensively, but it will lead to the final detection box being too large, and the box is selected not to belong to the target area. The fourth method, “intersection”, can determine the location and size of the target more accurately but results in the final detection box being too small to cover the entire area of the target entirely. Different methods are suitable for different detection scenarios, so we created a plug-and-play module to obtain the most accurate detection results.
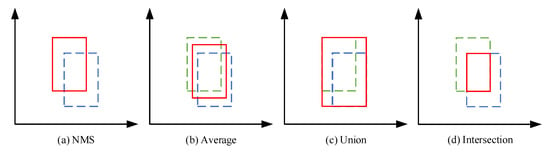
Figure 4.
Different fusion strategies for detection boxes. The blue and green boxes represent the detection boxes of other detectors, while the red box represents the final detection box selected for different decisions. (a) NMS, (b) average, (c) union, and (d) intersection.
3.2. Fusion Strategy for Category Probability Set (CPROS)
The decision-level fusion method of CPROS proposed by us is mainly aimed at solving four problems: (1) the single-mode detector has serious missed detections, (2) we hope to obtain higher confidence for the detection results with high confidence, (3) the existing fusion methods have poor fusion effect for the detection results with low confidence, and (4) we aim to solve the category conflict detected by the single-mode detector. In the previous discussion, we knew that when using D-S evidence theory to identify targets by multimodal fusion, there may be abnormal recognition results; that is, it is considered that highly conflicting evidence cannot make a reasonable decision. Therefore, we introduced the improved Yager formula and proposed a more effective fusion decision.
Suppose that is a detector of different modes, and the corresponding evidence set (probability distribution) is , then represents the decision result of (single category) in the evidence set , and is the mass function of . To quickly describe the degree of conflict in the detection results of different mode detectors, we defined the conflict factor as follows:
The magnitude of the conflict between the detection results of the modes and is:
Here, is defined as evidence credibility and , where , , and are the number of pieces of evidence. is the average sum of the evidence sets, reflecting the degree of conflict between evidence pairs. is a decreasing function of , reflecting the credibility of the evidence; that is, the credibility of the evidence decreases as the conflict between the pieces of evidence increases.
When a conflict is detected between categories, we believe that the statement “ belongs to category , belongs to category ” is unreasonable because there should be a portion of the probability that is wavering, which we call uncertainty probability. Therefore, the statement should be changed to “ belongs to category , belongs to category , is the uncertainty probability, and other decision rules need to be introduced to determine which category this part of the probability belongs to”. The uncertainty probability depends on the degree of conflict and credibility of the evidence and is calculated as follows:
In addition to calculating the uncertainty probability, we must also calculate the certainty probability, which is the and in “ belongs to category , belongs to category ”. It depends on two parts. Part of this is the agreement of the evidence of the different modes in category ; we define it as , and the calculation formula is as follows:
Part is the average support of the evidence for different modes for category ; we define it as , and the calculation formula is as follows:
Then, the certainty probability is calculated as follows:
The first item that can be found, , is precisely the D-S evidence theory synthesis formula. Thus, the new composition formula is actually a weighted sum form, where and are the weighting coefficients. In the first term of the formula, the result of synthesis is similar to that of D-S synthesis. When , the new synthesis formula is equivalent to the D-S synthesis formula. When , the evidence is highly conflicting, and the resultant result will be determined mainly by A. Therefore, for highly contradictory evidence, the consequent results are primarily determined by the evidence confidence and the mean support of the evidence .
The uncertainty probability is not discarded, and its attributes depend on the size of different categories of certainty probability. The uncertainty probability belongs to the category with the largest certainty probability. Therefore, the final confidence calculation formula is
3.3. Fusion
After determining the fusion method, we combined the detection results of the two modalities. We assume that the detection results for the different modalities are and . In order to make the probability sum of detection result categories for each detector equal to 1, we introduce the “background” category, as shown in Table 1.

Table 1.
Category probability set.
Among them, and . In practical situations, the detection probabilities of specific categories are extremely low. To simplify the calculation process, we kept all probabilities to two decimal places. The specific implementation process of the algorithm is shown in Algorithm 1.
| Algorithm 1. Fusion Strategies for Multimodal Detection | |
| 1 | Input: detections from multiple modes. Each detection d = (pro, box, cls, conf) contains category probability set pro = (p1, p2…pn), box coordinates box = (x, y, w, h), tag cls = (0/1/…/n) and confidence conf = (x). |
| 2 | Integrate the detection results of the same image corresponding to different modes. Set D = (d1, d2, … dn). |
| 3 | Traverse the set and place boxes with IOU greater than the threshold together to form a detection set at the same position. Set H = {D1, D2, …, Dn}. |
| 4 | if len(Di) > 1: |
| 5 | Take the two elements with the highest confidence in Di |
| 6 | Fusion strategy for detection boxes |
| 7 | Fusion strategy for category probability set(CPROS) |
| 8 | if len(Di) = 1: |
| 9 | No need for fusion |
| 10 | return set F of fused detections |
4. Experiments
In this section, we briefly introduce the evaluation metrics used to measure the algorithm performance, dataset, and experimental settings. The single-mode detector YOLOv8 with good detection performance was selected as the baseline to validate the effectiveness and generalization ability of the proposed CPROS on the public dataset VEDAI, which was captured from a drone perspective [36]. A series of ablation studies were conducted under the same conditions for evaluation.
4.1. Evaluating Indicator
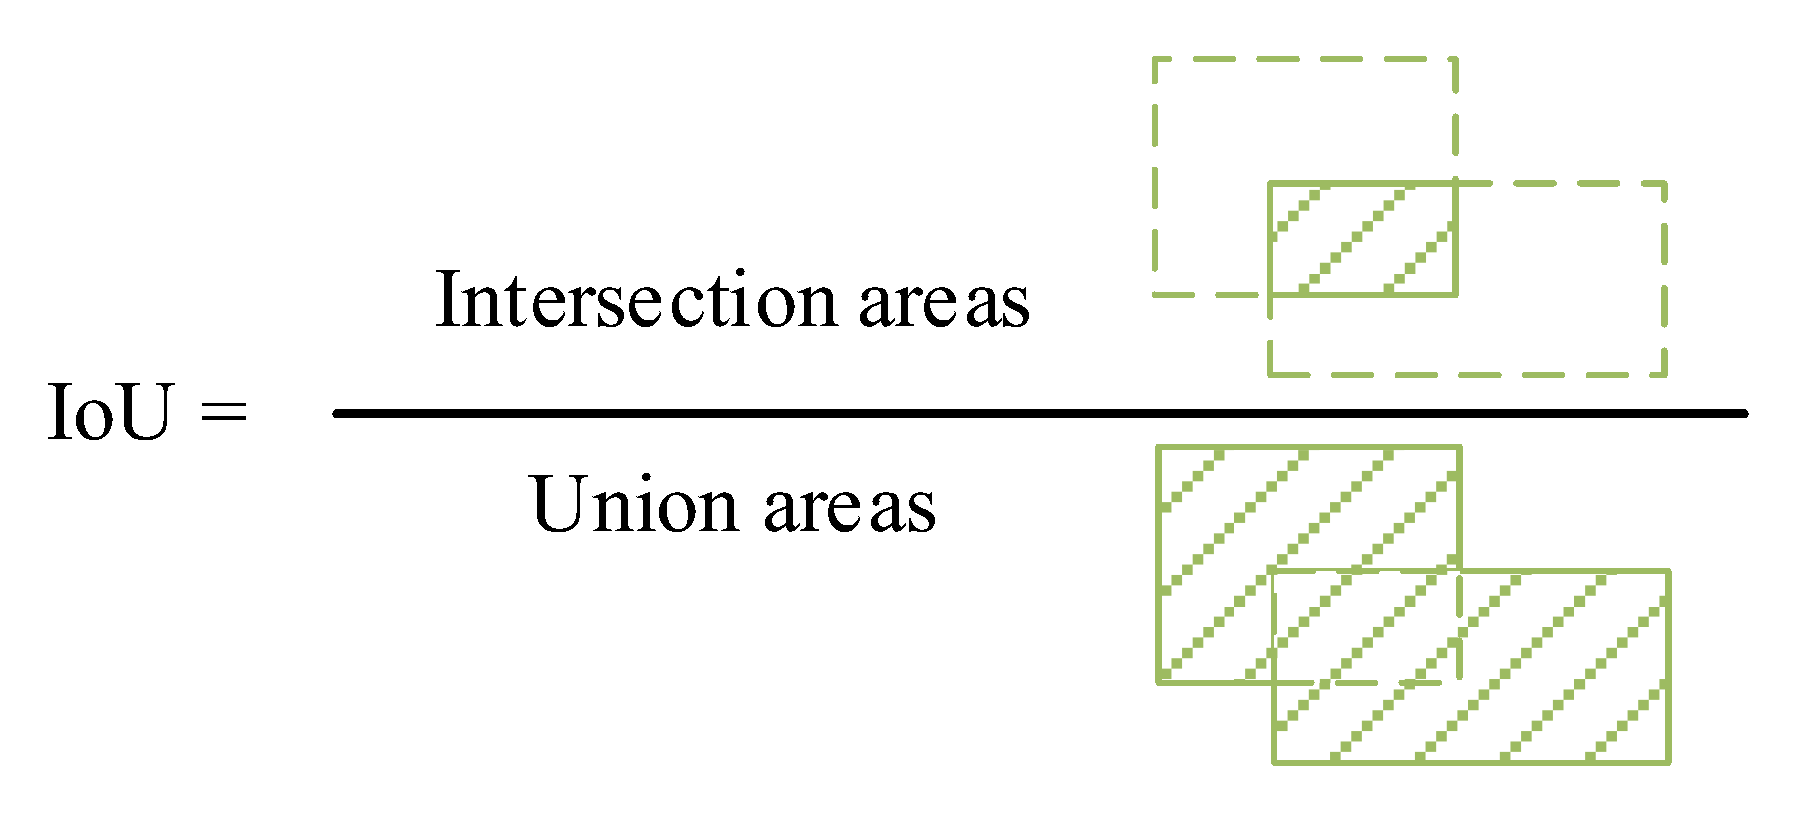
The accuracy of the prediction depends on whether the IoU between the predicted and actual boxes is greater than 0.5. The calculation method for the IoU is shown in Figure 5, which illustrates the intersection union ratio between the predicted and actual boxes. The subsequent calculations of the evaluation metrics were based on this.
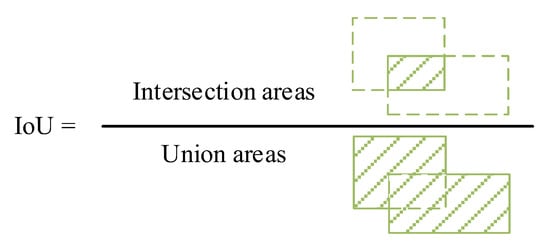
Figure 5.
Schematic diagram of intersection and union ratio calculation.
For the proposed decision-level fusion method, we calculated the mAP, missed detection rate, and false detections per image FPPI for each image based on the final detection results and label files, which is different from typical evaluation index calculation methods. We used the 11-point interpolation method to calculate the average precision (AP) using the following formula:
The 11-point interpolation calculation method selects 11 fixed thresholds because only 11 points are involved in the calculation, , and is the threshold index. The is the maximum value in the sample after the sample point corresponding to the vth threshold.
Assuming that the detection results contain TP (true positives), FN (false negatives), TN (true negatives), and FP (false positives),
4.2. Experiment Settings and Datasets
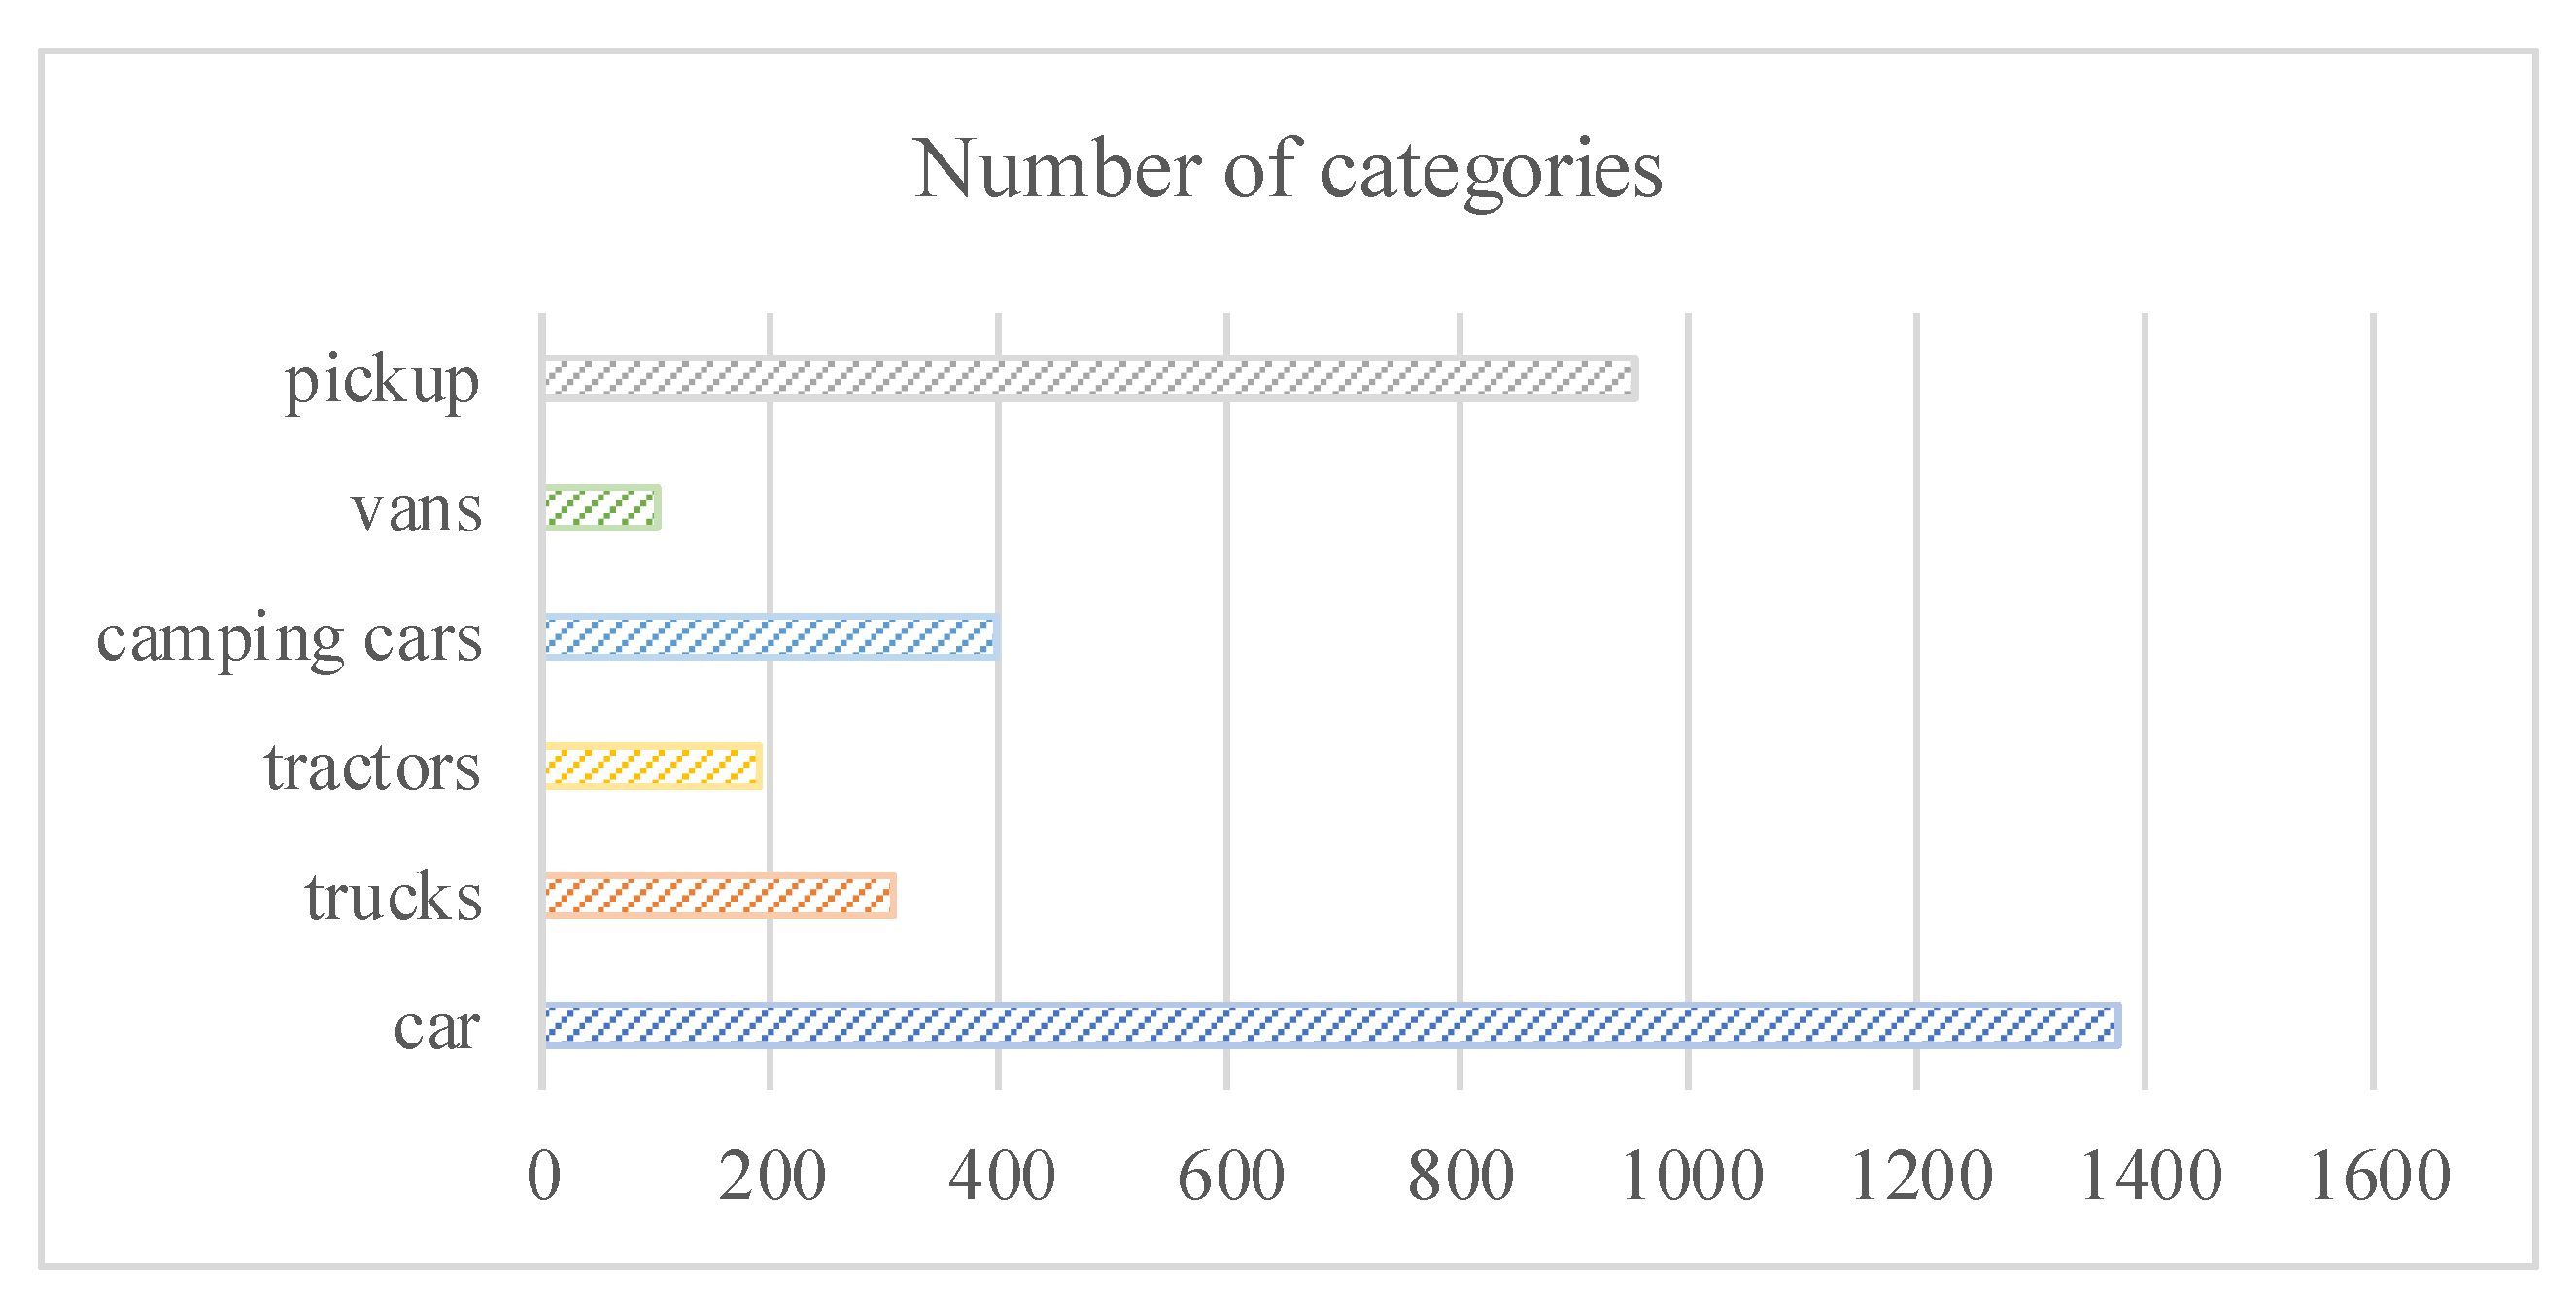
In this study, we employed VEDAI, a well-known dataset for vehicle detection in aerial imagery, as a tool for benchmarking automatic target recognition algorithms in an unconstrained environment. The VEDAI dataset is a dual-mode image dataset containing 1246 pairs of 512 × 512 pixel visible and infrared remote sensing images, which are divided into 935 pairs of training set images and 311 pairs of validation set images. The VEDAI dataset for a single mode contains six categories of vehicle targets that, in addition to their small size, exhibit various variabilities such as multiple orientations, lighting/shadow changes, specular reflection, and occlusion. The number of targets in each category is shown in Figure 6.
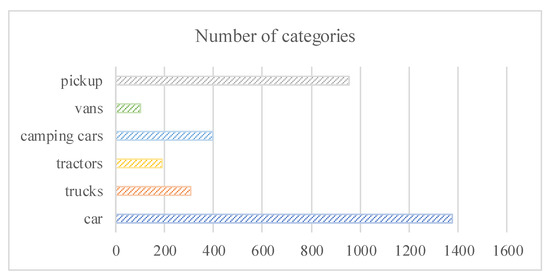
Figure 6.
Statistical chart of the number of targets for six types of vehicles.
The system environment of this study was Ubuntu 22.04LTS, and the software environments were CUDA 11.7 and cuDNN 8500. All models were trained on the PyTorch 2.0.1 framework using a single GPU and an NVIDIA GeForce RTX 3070. The number of epochs was set to 300, and the batch size to 4. SGD was used as the optimizer with a learning rate of 0.01.
4.3. Experimental Results
In this section, we present comparative experiments on single-mode detection, pixel-level fusion detection, feature-level fusion detection, and decision-level fusion detection to evaluate the effectiveness of fusion detection at different stages. Meanwhile, the evaluation of the proposed CPROS and several existing fusion strategies was mainly conducted in the form of ablation studies on the VEDAI using YOLOv8, which has good detection performance and was selected as the baseline method. Finally, we applied the proposed CPROS method to different single-mode detectors to verify its generality. In the tables, the best results for each column are highlighted in bold orange, the second best in bold blue, and the third best in bold green. The decision-level fusion detection results obtained using the proposed method are highlighted in gray in the tables.
4.3.1. Comparative Experimental Results
From Table 2, Table 3 and Table 4, it can be seen that the mAP of YOLOv8 using the CPROS method was 8.6% and 16.4% higher than that of YOLOv8 in detecting single-mode datasets. The missed detection rates were reduced by 3.6% and 8.4%, respectively. The number of false detections per image was reduced by 0.032 and 0.019 (32 and 19 false detections per 1000 frames). From a single-category perspective, our method significantly reduced the missed detection rate, with a maximum reduction of 35.8%. Meanwhile, for most categories, our method can also improve the mAP and reduce the number of false positives per image (the maximum improvement in average detection accuracy can reach 35.1%, and the maximum reduction in false positives per image can reach 0.061). Additionally, by comparing the effects of single-mode detection, pixel-level fusion detection, feature-level fusion detection, and decision-level fusion detection, we found that pixel-level and feature-level fusion detection were only effective for certain specific targets. Overall, the detection effect was not as good as decision-level fusion detection, and the generalization ability was also not as good as decision-level fusion detection.
Table 2.
Comparison of experimental results between fusion detection and non-fusion detection in different stages based on the VEDAI dataset (mAP).
Table 3.
Comparison of experimental results between fusion detection and non-fusion detection in different stages based on the VEDAI dataset (missed detection rate).
Table 4.
Comparison of experimental results between fusion detection and non-fusion detection in different stages based on the VEDAI dataset (the number of false detections per image).
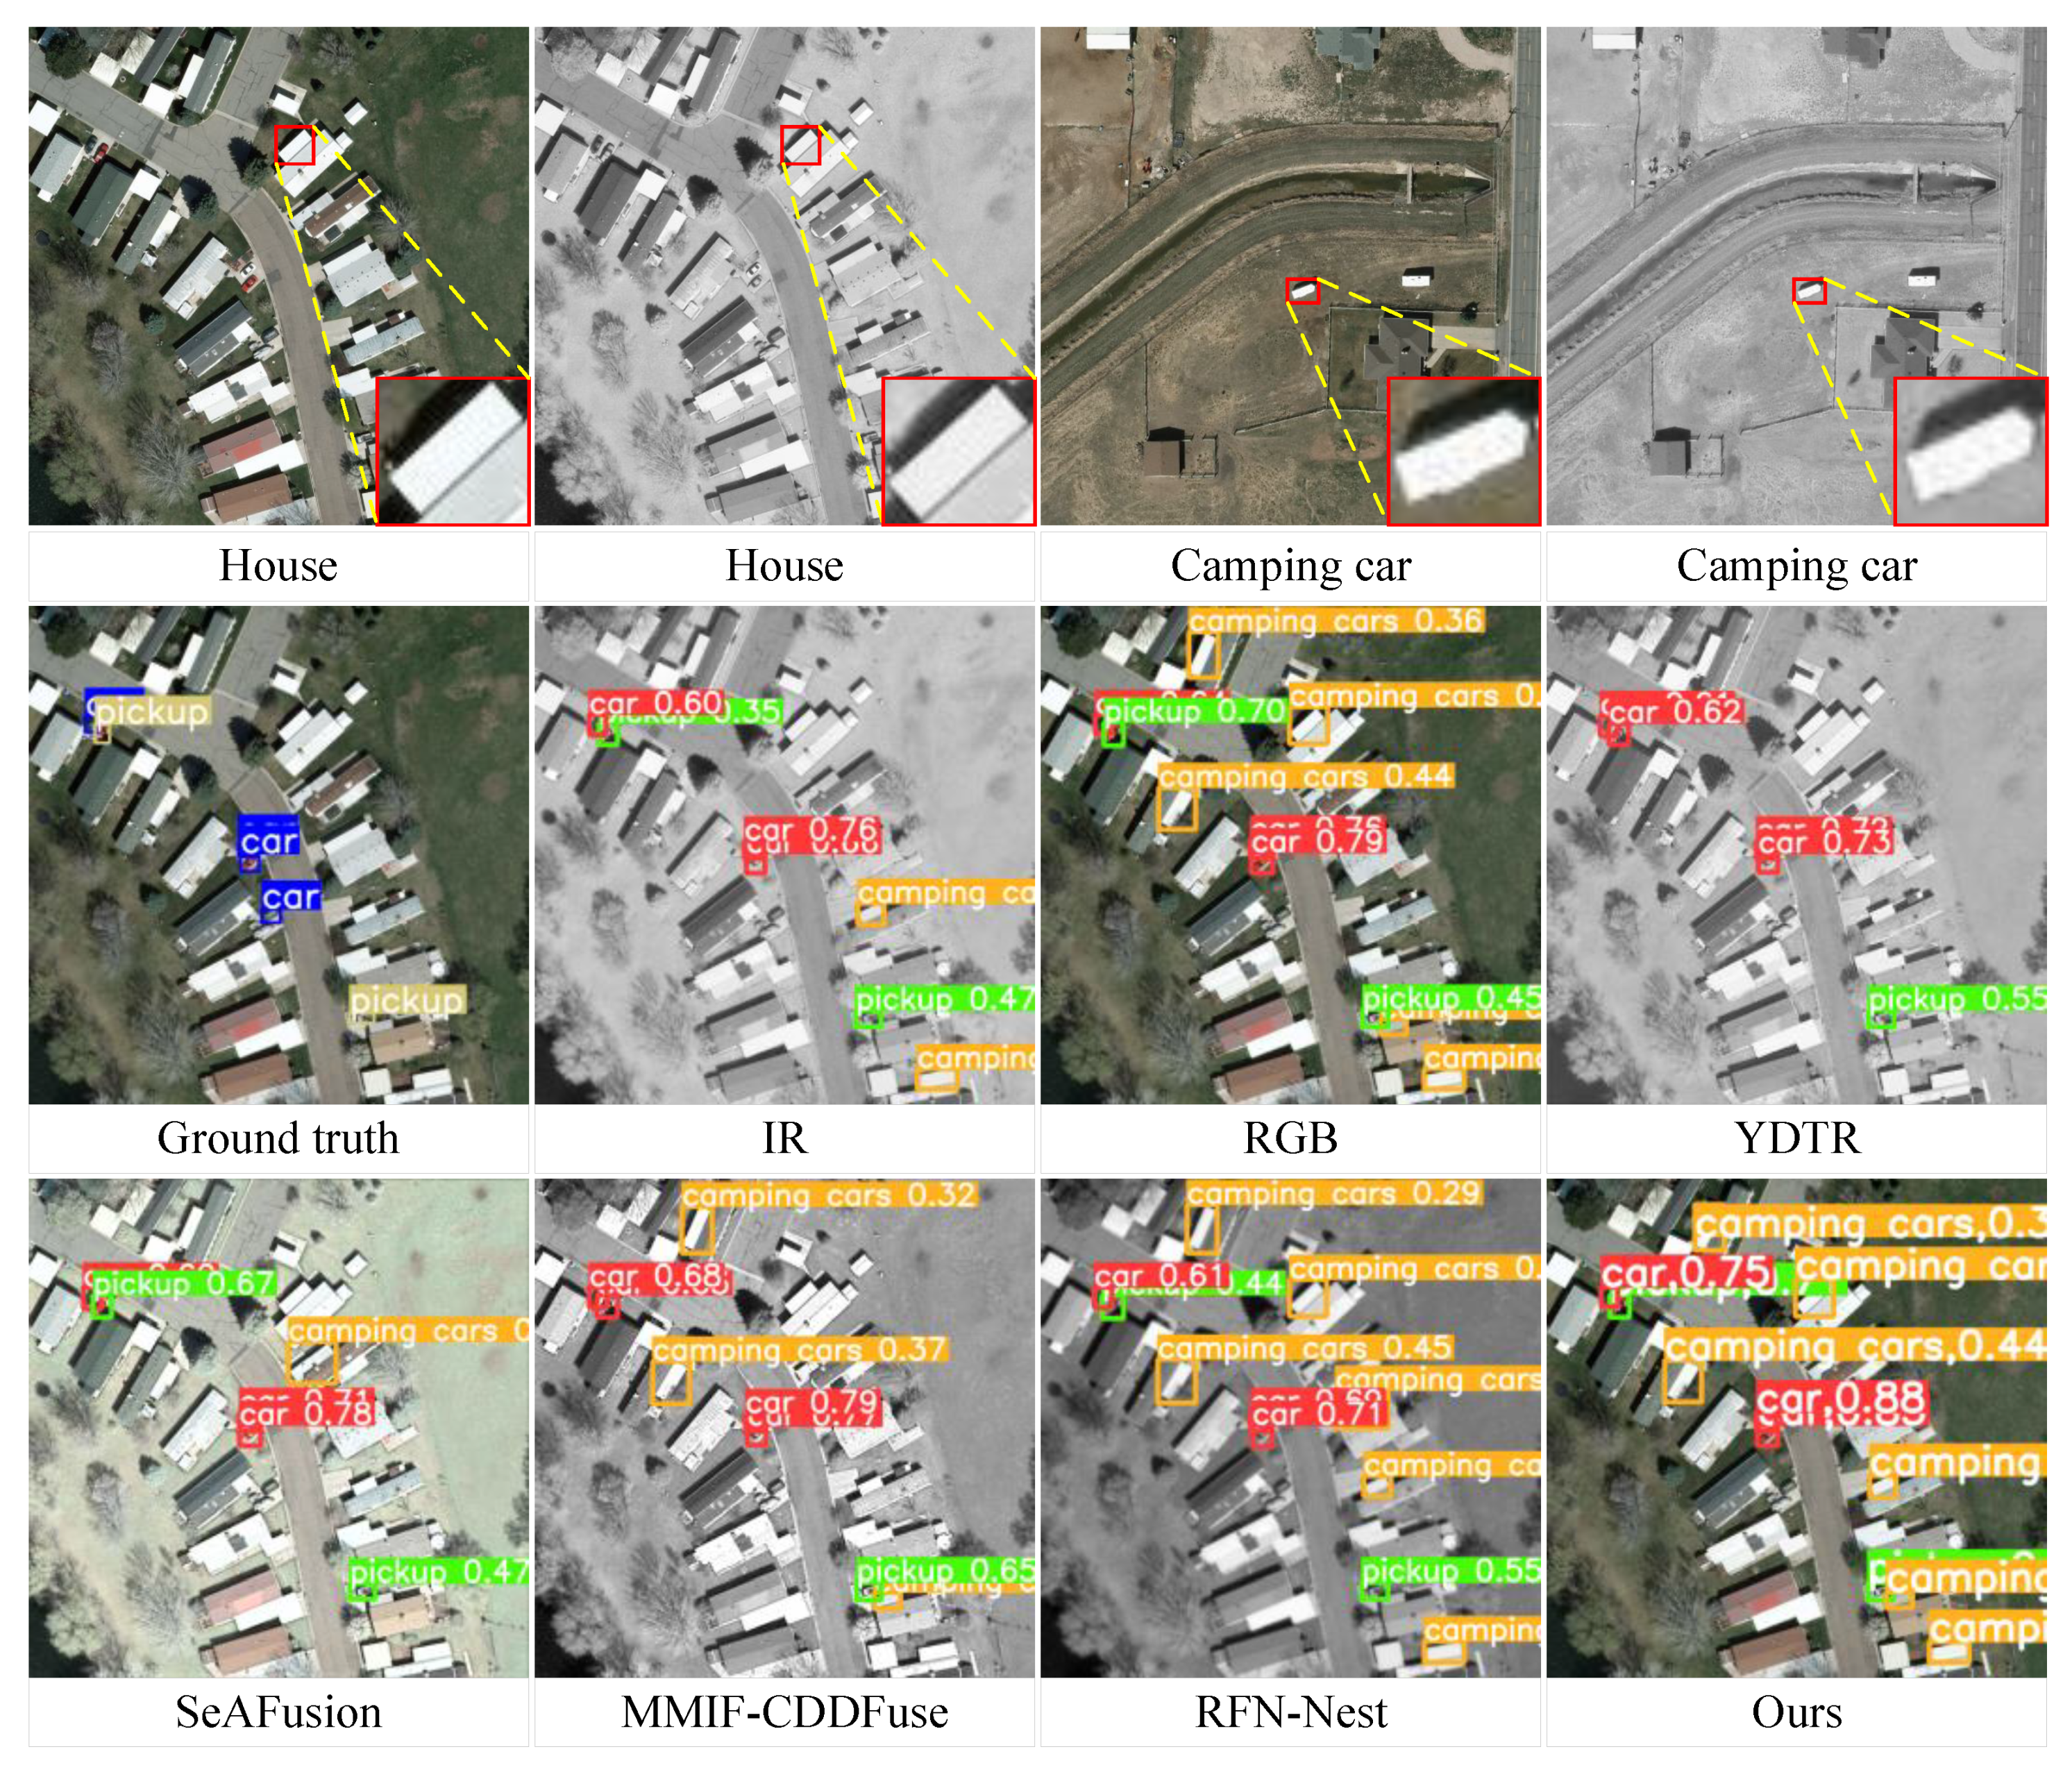
However, as shown in Figure 7, when we focus on the category of camping cars, we find that single-mode detectors generate numerous false alarms when detecting visible and infrared images in the VEDAI dataset. On this basis, if we apply our method again, only the false alarms will increase. In this regard, our algorithm is not as effective as some pixel- or feature-level fusion detection algorithms such as SeAFusion and YDTR. We found a high similarity in shape and color between real shopping car targets and house targets that were falsely detected as camping cars in some VEDAI datasets, which was not conducive to distinguishing between the two. Moreover, there are few camping car targets available for training single-mode detectors in the dataset, and the detectors have not learned enough features, which may lead to an insufficient generalization ability of the model. In practical applications, in addition to improving the detection performance of single-mode detectors, solving such problems can also be considered using Kalman filtering to eliminate false alarms, thereby achieving better fusion results.

Figure 7.
Analysis of experimental results for the category of camping cars.
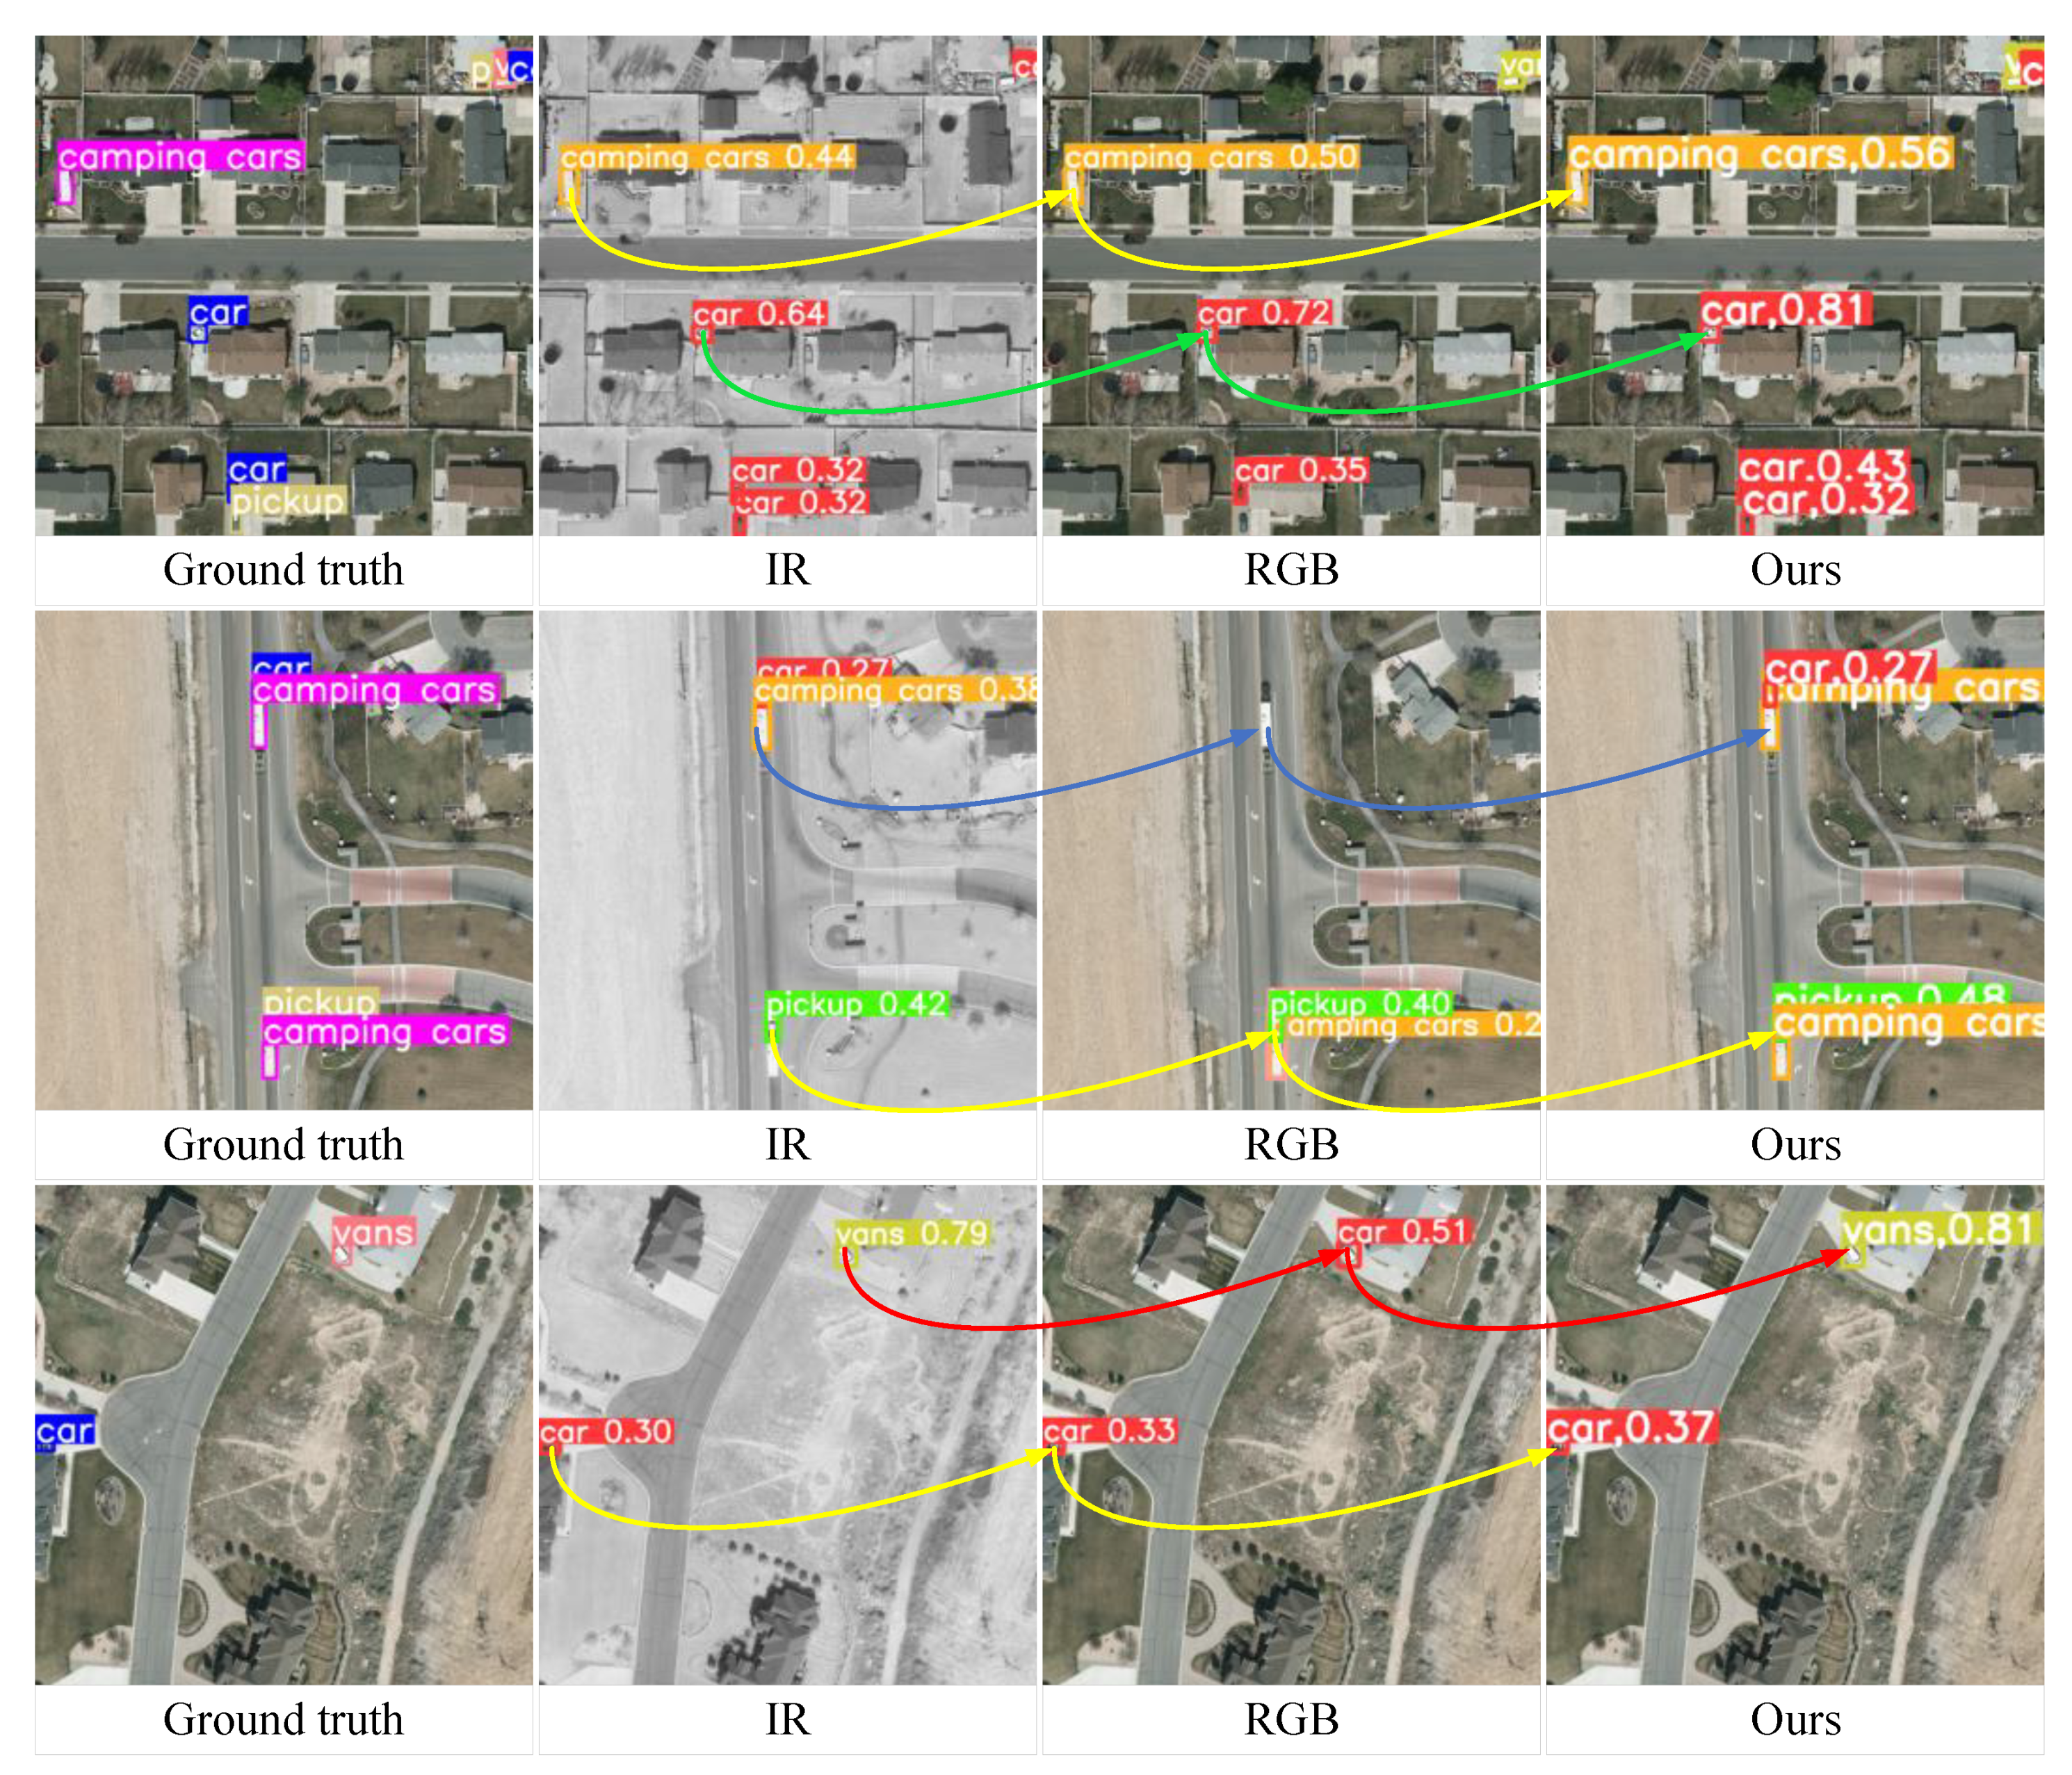
Figure 8 shows a visualization of the real labels and the results of our algorithm. The yellow line represents the fusion of low-confidence detection results, the green line represents the fusion of high-confidence detection results, the blue line represents the fusion of detection results with missed detections, and the red line represents the fusion of detection results with category conflicts. This corresponds to the four issues mentioned in Section 3.2, which must be addressed. From the graph, it can be observed that our method can significantly improve confidence when the categories detected by the detector are identical. When the categories detected by the detector are different, the proposed method eliminates the impact of erroneous detection and improves confidence. Meanwhile, our method can elegantly handle “missing detection” through probability integration.
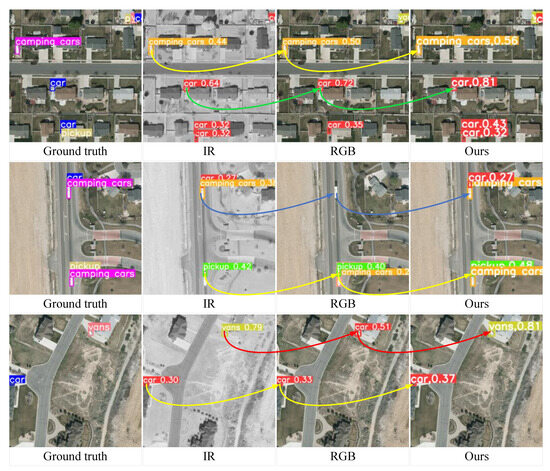
Figure 8.
Realistic labels and visualization of results from our algorithm.
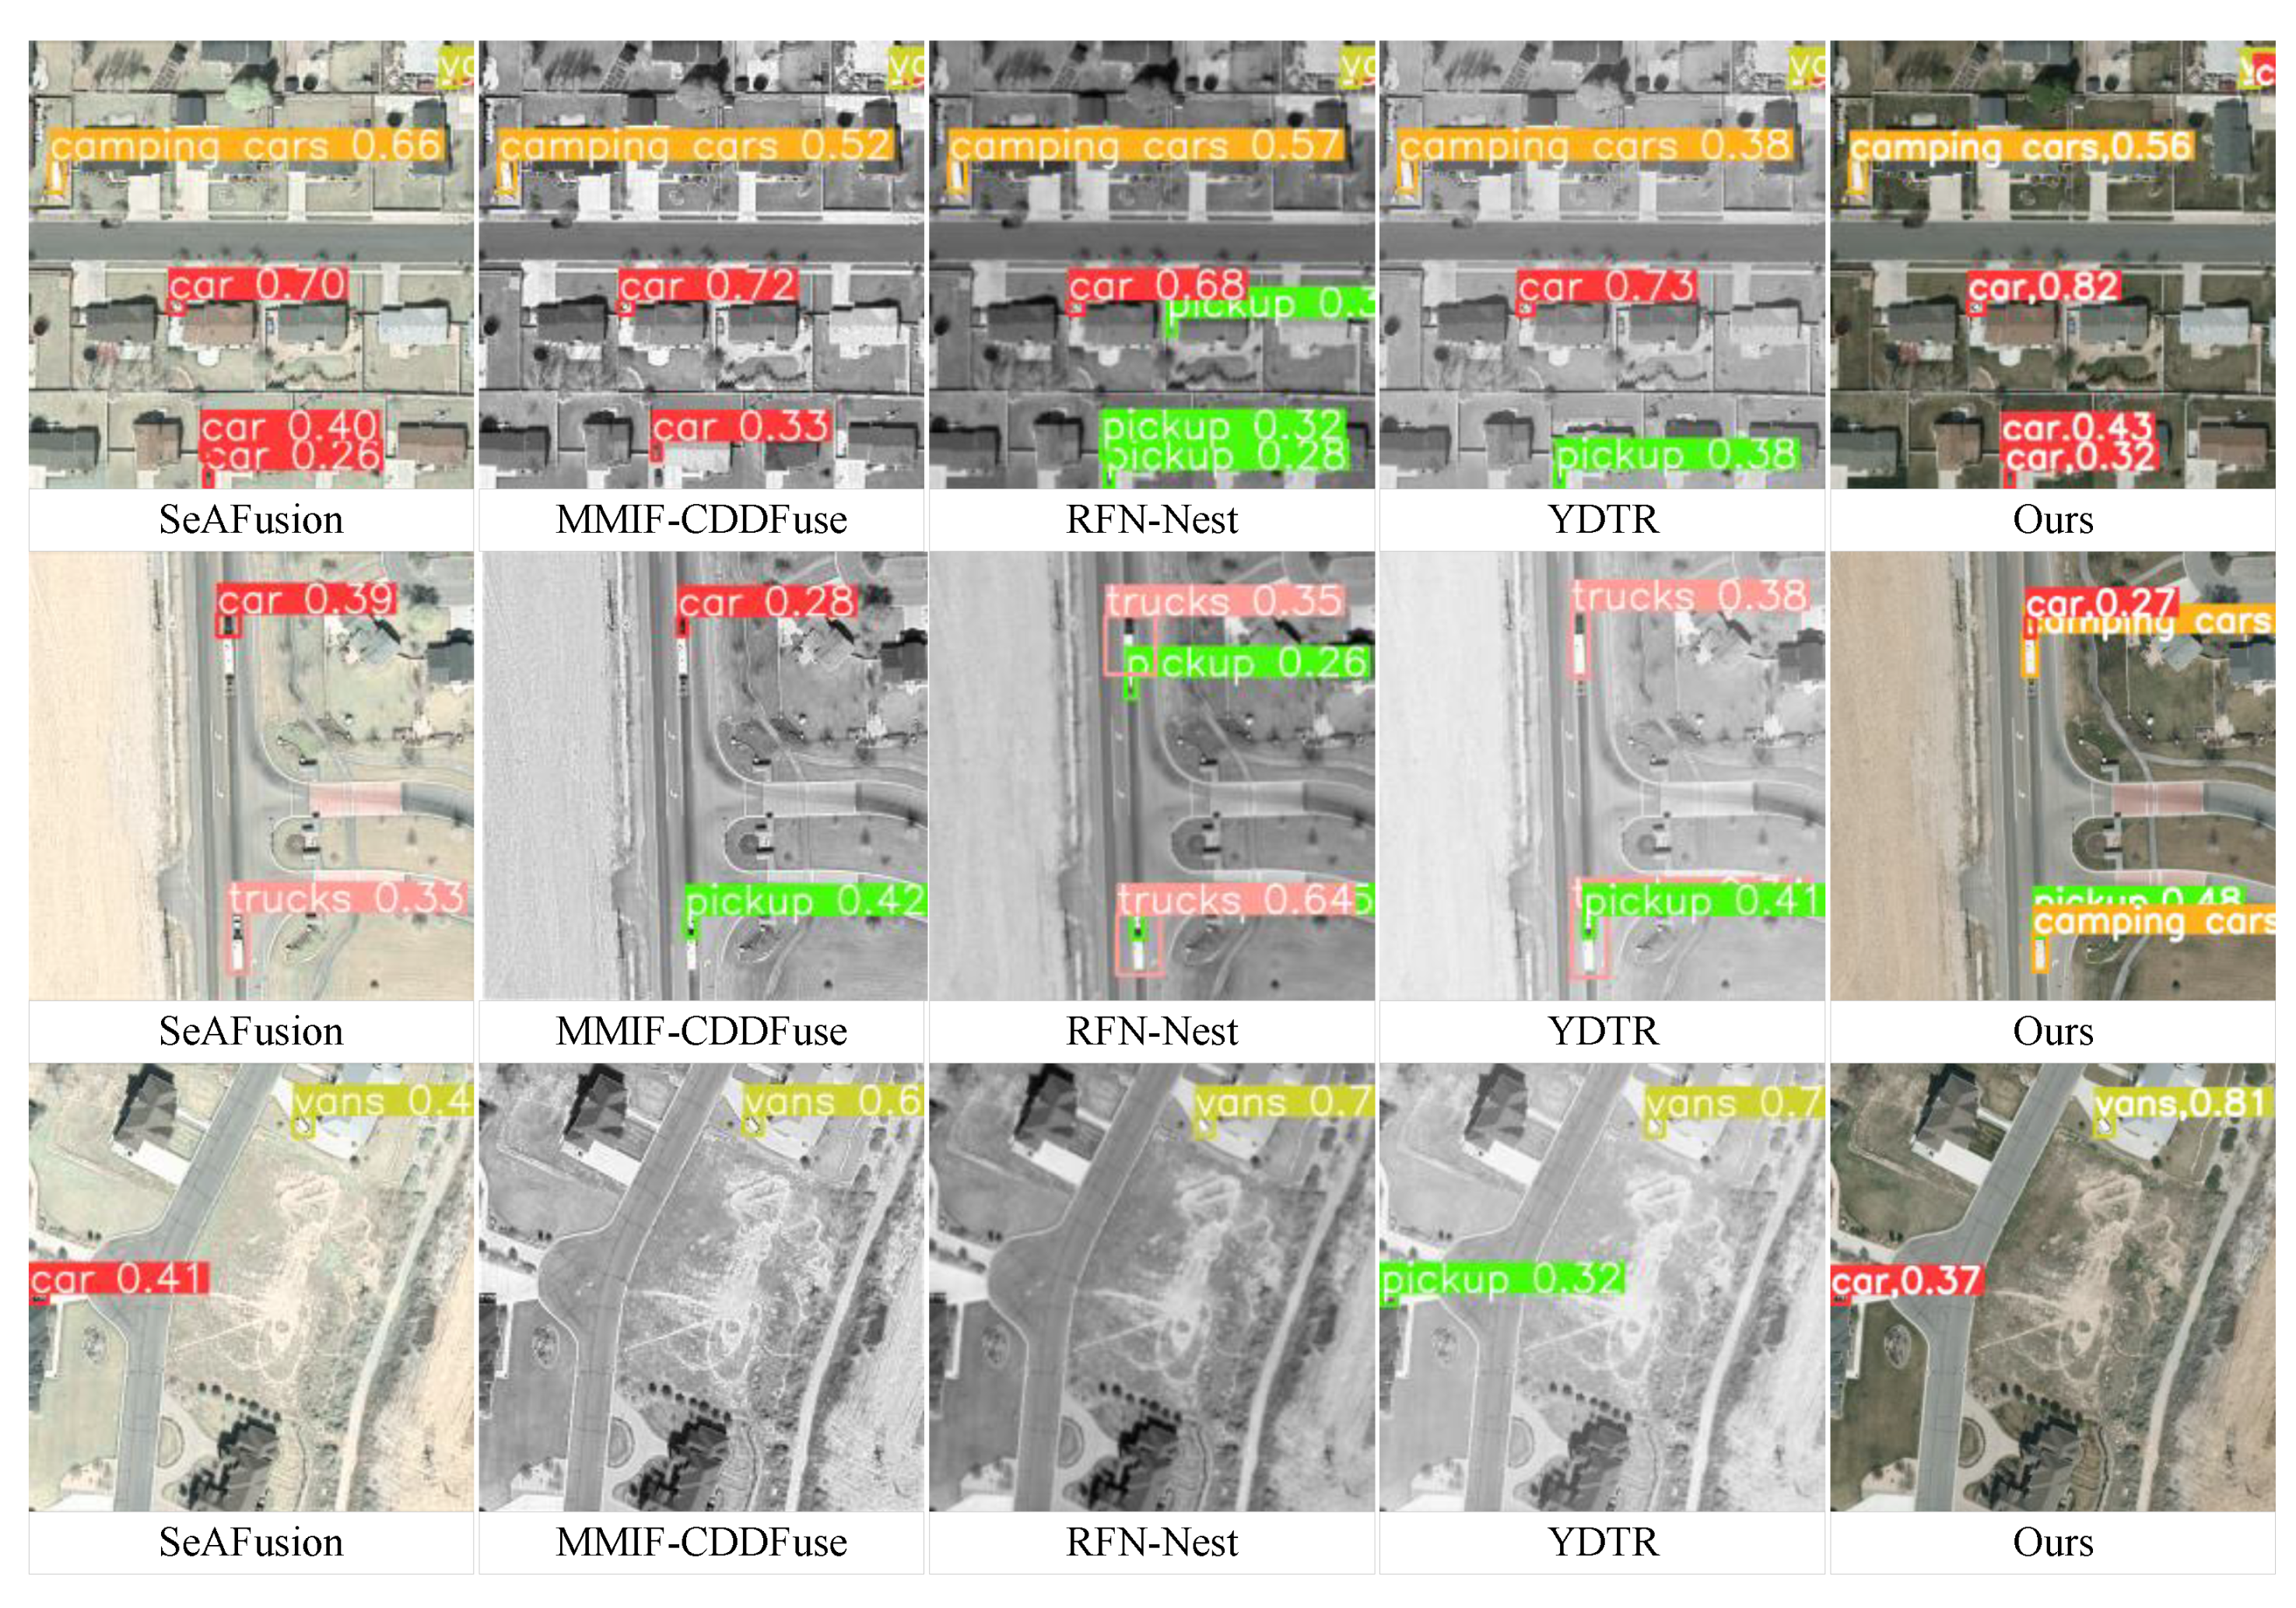
Figure 9 shows a visualization of the results of the fusion detection algorithms for each stage. Comparing the visualization of real labels in Figure 8, it can be seen that our algorithm has fewer missed detections and false positives than the other algorithms, and overall has a higher confidence in object detection.

Figure 9.
Visualization of the results of fusion detection algorithms in each stage.
4.3.2. Results of Ablation Experiment
To verify the superiority of CPROS, we conducted ablation studies by combining four confidence fusion methods and four detection box fusion methods. From Table 5, it can be seen that when the detection box fusion method is fixed, the mAP of the detection results using the four probability fusion methods of average, max, D-S, and our CPROS improves overall in sequence. Taking the averaging method for detection box fusion as an example, the CPROS method for confidence fusion increased by 1%, 0.8%, and 0.6% compared to the average, maximum, and D-S methods, respectively. However, Table 6 and Table 7 show that when the detection box fusion method is fixed, changes in the probability fusion method do not affect the MR and FPPI. The reason behind this is that among the three indicators of mAP, MR, and FPPI, only mAP was affected by changes in confidence. The experimental results show that the proposed CPROS is a reliable decision-level fusion method that improves the detection accuracy of objects compared to the other three methods.
Table 5.
Comparison of mAP between fusion methods with different confidence levels and detection box fusion methods.
Table 6.
Comparison of missed detection rates between fusion methods with different confidence levels and detection box fusion methods.
Table 7.
Comparison of false positives per image using fusion methods with different confidence levels and detection box fusion methods.
Table 8 presents the comparison results of different single-mode detectors before and after using the CPROS method. The results indicate that the experimental results using the CPROS decision-level fusion method are superior to that of single-mode detectors for all indicators. Specifically, by using CPROS to fuse the results obtained from YOLOv8 for detecting visible images with those obtained from YOLOv8 for detecting infrared images, the mAP was 8.6% and 16.4% higher, the MR was 3.6% and 8.4% lower, and the FPPI was 0.032 (reduced by 32 false positives every 1000 frames) and 0.019 lower, respectively. Using CPROS to fuse the results obtained from YOLOv5 detection of visible images with those obtained from YOLOv5 detection of infrared images, the mAP was 6.8% and 12% higher, the MR was 2.1% and 7.7% lower, and the FPPI was 0.045 and 0.051 lower, respectively. Using CPROS to fuse the results obtained from YOLOv8 in detecting visible images with those obtained from YOLOv5 in detecting infrared images, the mAP was 6.8% and 12.3% higher, the MR was 4.1% and 8.9% lower, and the FPPI was 0.003 and 0.067 lower, respectively. The experimental results show that the proposed CPROS is a reliable decision-level fusion method with plug-and-play capabilities and can be widely used for fusion processing between different mode detectors, significantly improving detection performance.
Table 8.
Comparison of performance between different single-mode detectors before and after using the CPROS method.
5. Conclusions
This study followed the approach of first detection and then fusion. The performance of a single-mode detector directly affects the fusion performance in multimodal detection. Based on this, we first explored different fusion strategies for multimodal detection in visible and infrared images using highly tuned YOLOv8 trained on large-scale single-mode datasets and proposed a multimodal decision-level fusion detection method based on category probability sets (CPROS). Numerous experimental results show that our proposed decision-level fusion method based on CPROS is significantly better than a single-mode detector without the decision-level fusion method in terms of detection accuracy. Moreover, it gracefully handles the missed detections of specific modes, significantly reducing the MR and FPPI.
Second, to prove the superiority and generality of the proposed decision-level fusion method, we combined different confidence and detection box fusion methods to perform ablation experiments. We also applied the proposed method to different single-mode detectors to compare detection performance before and after decision-level fusion. The results show that the proposed CPROS is significantly superior to previous methods in terms of detection accuracy. Compared to the single-mode detector, the mAP of multimodal detection using the fusion strategy was improved considerably, and the MR and FPPI were significantly reduced.
In the future, our goals are to (1) study object association methods so that the proposed decision-level fusion method can be applied to unaligned multimodal detection datasets; (2) mount the proposed algorithm framework on the UAV edge computing platform and apply it to real-time target detection tasks; (3) research accurate positioning methods to enable the UAV platform to achieve high positioning performance; and (4) use the Kalman filter algorithm to eliminate noise and improve the detection performance of the algorithm.
Author Contributions
Conceptualization, C.L.; methodology, C.L.; software, C.L.; validation, H.H. and S.Y.; formal analysis, X.T. and C.L.; investigation, Z.D.; resources, C.L.; data curation, S.Y. and Z.D.; writing—original draft preparation, C.L.; writing—review and editing, C.L., H.H. and X.T.; visualization, C.L.; supervision, X.T.; project administration, C.L.; funding acquisition, Z.Z. All authors have read and agreed to the published version of the manuscript.
Funding
This work was supported by the National Natural Science Foundation of China under Grant 52101377 and the National Natural Youth Science Foundation of China under Grant No. 62201598.
Data Availability Statement
The original contributions presented in the study are included in the article, further inquiries can be directed to the corresponding author.
Conflicts of Interest
The authors declare no conflicts of interest.
References
- Xie, Y.; Xu, C.; Rakotosaona, M.-J.; Rim, P.; Tombari, F.; Keutzer, K.; Tomizuka, M.; Zhan, W. SparseFusion: Fusing Multi-Modal Sparse Representations for Multi-Sensor 3D Object Detection. In Proceedings of the IEEE/CVF International Conference on Computer Vision (ICCV), Paris, France, 1–6 October 2023. [Google Scholar]
- Khosravi, M.; Arora, R.; Enayati, S.; Pishro-Nik, H. A Search and Detection Autonomous Drone System: From Design to Implementation. arXiv 2020, arXiv:2211.15866. [Google Scholar] [CrossRef]
- Geiger, A.; Lenz, P.; Urtasun, R. Are We Ready for Autonomous Driving? The KITTI Vision Benchmark Suite. In Proceedings of the 2012 IEEE Conference on Computer Vision and Pattern Recognition, Providence, RI, USA, 16–21 June 2012; IEEE: New York, NY, USA, 2012; pp. 3354–3361. [Google Scholar]
- Devaguptapu, C.; Akolekar, N.; Sharma, M.M.; Balasubramanian, V.N. Borrow from Anywhere: Pseudo Multi-Modal Object Detection in Thermal Imagery. In Proceedings of the 2019 IEEE/CVF Conference on Computer Vision and Pattern Recognition Workshops (CVPRW), Long Beach, CA, USA, 16–17 June 2019; pp. 1029–1038. [Google Scholar]
- Wu, W.; Chang, H.; Zheng, Y.; Li, Z.; Chen, Z.; Zhang, Z. Contrastive Learning-Based Robust Object Detection under Smoky Conditions. In Proceedings of the 2022 IEEE/CVF Conference on Computer Vision and Pattern Recognition Workshops (CVPRW), New Orleans, LA, USA, 19–20 June 2022; IEEE: New York, NY, USA, 2022; pp. 4294–4301. [Google Scholar]
- Mustafa, H.T.; Yang, J.; Mustafa, H.; Zareapoor, M. Infrared and Visible Image Fusion Based on Dilated Residual Attention Network. Optik 2020, 224, 165409. [Google Scholar] [CrossRef]
- Zhang, X.; Demiris, Y. Visible and Infrared Image Fusion Using Deep Learning. IEEE Trans. Pattern Anal. Mach. Intell. 2023, 45, 10535–10554. [Google Scholar] [CrossRef]
- Wagner, J.; Fischer, V.; Herman, M.; Behnke, S. Multispectral Pedestrian Detection Using Deep Fusion Convolutional Neural Networks. In Proceedings of the ESANN 2016: 24th European Symposium on Artificial Neural Networks, Computational Intelligence and Machine Learning, Bruges, Belgium, 27–29 April 2016. [Google Scholar]
- Liu, J.; Zhang, S.; Wang, S.; Metaxas, D.N. Multispectral Deep Neural Networks for Pedestrian Detection. arXiv 2016, arXiv:1611.02644. [Google Scholar]
- Li, Q.; Zhang, C.; Hu, Q.; Fu, H.; Zhu, P. Confidence-Aware Fusion Using Dempster-Shafer Theory for Multispectral Pedestrian Detection. IEEE Trans. Multimed. 2023, 25, 3420–3431. [Google Scholar] [CrossRef]
- Zhang, X.X.; Lu, X.Y.; Peng, L. A Complementary and Precise Vehicle Detection Approach in RGB-T Images via Semi-Supervised Transfer Learning and Decision-Level Fusion. Int. J. Remote Sens. 2022, 43, 196–214. [Google Scholar] [CrossRef]
- Tziafas, G.; Kasaei, H. Early or Late Fusion Matters: Efficient RGB-D Fusion in Vision Transformers for 3D Object Recognition. In Proceedings of the 2023 IEEE/RSJ International Conference on Intelligent Robots and Systems (IROS), Detroit, MI, USA, 1–5 October 2023. [Google Scholar]
- Guan, D.; Cao, Y.; Liang, J.; Cao, Y.; Yang, M.Y. Fusion of Multispectral Data Through Illumination-Aware Deep Neural Networks for Pedestrian Detection. Inf. Fusion 2019, 50, 148–157. [Google Scholar] [CrossRef]
- Zhang, C.; Ma, W.; Xiao, J.; Zhang, H.; Shao, J.; Zhuang, Y.; Chen, L. VL-NMS: Breaking Proposal Bottlenecks in Two-Stage Visual-Language Matching. ACM Trans. Multimed. Comput. Commun. Appl. 2023, 19, 166. [Google Scholar] [CrossRef]
- Xiao, F. A New Divergence Measure of Belief Function in D–S Evidence Theory. Inf. Sci. 2019, 514, 462–483. [Google Scholar] [CrossRef]
- Sentz, K.; Ferson, S. Combination of Evidence in Dempster-Shafer Theory; U.S. Department of Energy: Oak Ridge, TN, USA, 2002; SAND2002-0835; p. 800792.
- Li, S.; Kang, X.; Fang, L.; Hu, J.; Yin, H. Pixel-Level Image Fusion: A Survey of the State of the Art. Inf. Fusion 2017, 33, 100–112. [Google Scholar] [CrossRef]
- Zhang, Z.; Jin, L.; Li, S.; Xia, J.; Wang, J.; Li, Z.; Zhu, Z.; Yang, W.; Zhang, P.; Zhao, J.; et al. Modality Meets Long-Term Tracker: A Siamese Dual Fusion Framework for Tracking UAV. In Proceedings of the 2023 IEEE International Conference on Image Processing (ICIP), Kuala Lumpur, Malaysia, 8–11 October 2023; IEEE: New York, NY, USA, 2023; pp. 1975–1979. [Google Scholar]
- Wu, Y.; Guan, X.; Zhao, B.; Ni, L.; Huang, M. Vehicle Detection Based on Adaptive Multimodal Feature Fusion and Cross-Modal Vehicle Index Using RGB-T Images. IEEE J. Sel. Top. Appl. Earth Obs. Remote Sens. 2023, 16, 8166–8177. [Google Scholar] [CrossRef]
- Yang, K.; Xiang, W.; Chen, Z.; Zhang, J.; Liu, Y. A Review on Infrared and Visible Image Fusion Algorithms Based on Neural Networks. J. Vis. Commun. Image Represent. 2024, 101, 104179. [Google Scholar] [CrossRef]
- Liu, J.; Fan, X.; Jiang, J.; Liu, R.; Luo, Z. Learning a Deep Multi-Scale Feature Ensemble and an Edge-Attention Guidance for Image Fusion. IEEE Trans. Circuits Syst. Video Technol. 2022, 32, 105–119. [Google Scholar] [CrossRef]
- Feng, D.; Haase-Schutz, C.; Rosenbaum, L.; Hertlein, H.; Glaser, C.; Timm, F.; Wiesbeck, W.; Dietmayer, K. Deep Multi-Modal Object Detection and Semantic Segmentation for Autonomous Driving: Datasets, Methods, and Challenges. IEEE Trans. Intell. Transp. Syst. 2021, 22, 1341–1360. [Google Scholar] [CrossRef]
- Chen, X.; Zhang, H.; Zhang, S.; Feng, J.; Xia, H.; Rao, P.; Ai, J. A Space Infrared Dim Target Recognition Algorithm Based on Improved DS Theory and Multi-Dimensional Feature Decision Level Fusion Ensemble Classifier. Remote Sens. 2024, 16, 510. [Google Scholar] [CrossRef]
- Solovyev, R.; Wang, W.; Gabruseva, T. Weighted Boxes Fusion: Ensembling Boxes from Different Object Detection Models. Image Vis. Comput. 2021, 107, 104117. [Google Scholar] [CrossRef]
- Yang, F.-J. An Implementation of Naive Bayes Classifier. In Proceedings of the 2018 International Conference on Computational Science and Computational Intelligence (CSCI), Las Vegas, NV, USA, 12–14 December 2018; IEEE: New York, NY, USA, 2018; pp. 301–306. [Google Scholar]
- Zhou, H.; Dong, C.; Wu, R.; Xu, X.; Guo, Z. Feature Fusion Based on Bayesian Decision Theory for Radar Deception Jamming Recognition. IEEE Access 2021, 9, 16296–16304. [Google Scholar] [CrossRef]
- Ghosh, M.; Dey, A.; Kahali, S. Type-2 Fuzzy Blended Improved D-S Evidence Theory Based Decision Fusion for Face Recognition. Appl. Soft Comput. 2022, 125, 109179. [Google Scholar] [CrossRef]
- Song, Y.; Fu, Q.; Wang, Y.-F.; Wang, X. Divergence-Based Cross Entropy and Uncertainty Measures of Atanassov’s Intuitionistic Fuzzy Sets with Their Application in Decision Making. Appl. Soft Comput. 2019, 84, 105703. [Google Scholar] [CrossRef]
- Zhang, S.; Rao, P.; Hu, T.; Chen, X.; Xia, H. A Multi-Dimensional Feature Fusion Recognition Method for Space Infrared Dim Targets Based on Fuzzy Comprehensive with Spatio-Temporal Correlation. Remote Sens. 2024, 16, 343. [Google Scholar] [CrossRef]
- Zhang, P.; Li, T.; Wang, G.; Luo, C.; Chen, H.; Zhang, J.; Wang, D.; Yu, Z. Multi-Source Information Fusion Based on Rough Set Theory: A Review. Inf. Fusion 2021, 68, 85–117. [Google Scholar] [CrossRef]
- Kang, B.; Deng, Y.; Hewage, K.; Sadiq, R. A Method of Measuring Uncertainty for Z-Number. IEEE Trans. Fuzzy Syst. 2019, 27, 731–738. [Google Scholar] [CrossRef]
- Lai, H.; Liao, H. A Multi-Criteria Decision Making Method Based on DNMA and CRITIC with Linguistic D Numbers for Blockchain Platform Evaluation. Eng. Appl. Artif. Intell. 2021, 101, 104200. [Google Scholar] [CrossRef]
- Chen, Y.-T.; Shi, J.; Ye, Z.; Mertz, C.; Ramanan, D.; Kong, S. Multimodal Object Detection via Probabilistic Ensembling. In Proceedings of the European Conference on Computer Vision, Tel Aviv, Israel, 23–27 October 2022. [Google Scholar]
- Yager, R.R. On the Dempster-Shafer Framework and New Combination Rules. Inf. Sci. 1987, 41, 93–137. [Google Scholar] [CrossRef]
- Sun, Q.; Ye, X.; Gu, W. A New Combination Rules of Evidence Theory. Acta Electron. Sin. 2000, 28, 117–119. [Google Scholar]
- Razakarivony, S.; Jurie, F. Vehicle Detection in Aerial Imagery: A Small Target Detection Benchmark. J. Vis. Commun. Image Represent. 2016, 34, 187–203. [Google Scholar] [CrossRef]
Disclaimer/Publisher’s Note: The statements, opinions and data contained in all publications are solely those of the individual author(s) and contributor(s) and not of MDPI and/or the editor(s). MDPI and/or the editor(s) disclaim responsibility for any injury to people or property resulting from any ideas, methods, instructions or products referred to in the content. |
© 2024 by the authors. Licensee MDPI, Basel, Switzerland. This article is an open access article distributed under the terms and conditions of the Creative Commons Attribution (CC BY) license (https://creativecommons.org/licenses/by/4.0/).