Abstract
Cellular automata (CA) models have been extensively employed to predict and understand the spatiotemporal dynamics of land use. Driving factors play a significant role in shaping and driving land-use changes. Mining land-use transition rules from driving factors and quantifying the contribution of driving factors to land-use dynamics are fundamental aspects of CA simulation. However, existing CA models have limitations in obtaining accurate transition rules and reliable interpretations simultaneously for multiple land-use simulations. In this study, we constructed a CA model based on a tree-based deep learning algorithm, deep cascade forest (DCF), to improve multiple land-use simulations and driving factors analysis. The DCF algorithm was utilized to mine accurate multiple land-use transition rules without overfitting to improve CA simulation accuracy. Additionally, a novel ensemble mean decrease of impurity (MDI) factor importance analysis method (DCF-MDI), which leverages the cascade structure of the DCF model, was proposed to qualify the contribution of each driving factor to land-use dynamics stably and efficiently. To evaluate the effectiveness of the proposed DCF-CA, we applied the model to simulate land-use distributions and explore the driving mechanisms of land-use dynamics in the Pearl River Delta (PRD), China, from 2000 to 2010. Compared to existing models, the proposed DCF-CA model exhibits the highest accuracy (FoM = 23.79%, PA = 39.77%, UA = 36.35%, OA = 91.50%), which demonstrates its superiority in mining accurate transition rules for capturing multiple land-use dynamics. Factor importance analysis reveals that the proposed DCF-MDI method yields more stable ranking orders and lower standard deviation of contribution weights (<0.10%) compared to the traditional method, indicating its robustness to random disturbances and effectiveness in elucidating the driving mechanisms of land-use dynamics. The DCF-CA model proposed in this study, demonstrating high simulation accuracy and reliable interpretability simultaneously, can provide substantial support for sustainable land use management.
1. Introduction
The land use (land cover) on the earth’s surface has been profoundly altered by numerous human activities, such as agricultural intensification [1,2], livestock production [3,4], deforestation [5,6], urbanization [7,8], energy mining [9,10], etc. In turn, land-use changes exert far-reaching impacts on global change, which have led to significant problems, such as ecological degradation [11], biodiversity loss [12], flooding [13], and heat waves [14], threatening the sustainable development of humanity [15]. To mitigate these problems and maintain human–land coordination, administrators must make informed land-use policies and plans [16]. Simulating future land-use changes can provide valuable insights into the potential impacts of land-use changes under different pathways [17,18,19,20]. Hence, land-use simulation has attracted significant attention from both scholars and officials [21,22].
There have been numerous land-use simulation models developed and applied in recent decades [23,24,25,26]. Among these, cellular automata (CA) is one of the most effective tools, which can capture land-use dynamics and simulate overall patterns bottom-up using simple iteration rules without complex mathematical equations [24]. CA models have been successfully applied to modeling land-use changes across diverse regions and scales, providing valuable support for sustainable land-use management [27,28,29].
To achieve higher land-use simulation performance, substantial efforts have been dedicated to enhancing various components of CA, encompassing cell definition [30,31,32], neighborhood configuration [27,33,34], and transition rule [35,36]. Previous research has demonstrated a significant role for various socioeconomic and environmental factors in shaping and driving land-use changes [37]. Hence, transition rules, which model the nonlinear relationship between land-use changes and driving factors, constitute the core component of CA.
Transition rules are commonly expressed as transition probabilities of land-use changes or suitability probabilities of land-use distribution in CA [25]. The performance of CA heavily relies on the accuracy of the mined transition rules [16,38]. Consequently, many methods have been developed for mining transition rules. Machine learning is the most commonly used technology for extracting transition rules in CA. These methods include, for example, logistic regression [39], geographically weighted regression [40], artificial neural networks [41], support vector machines [42], maximum entropy analysis [43], decision trees [44], random forests [45,46], fuzzy c-means [47], and naïve Bayes [48]. However, the representation learning capabilities of machine learning methods are limited, hindering the extraction of accurate land-use transition rules. As an advanced variant of the artificial neural network, the deep neural network (DNN) has recently been introduced for mining land-use transition rules in CA [16]. Various network architectures have been investigated, such as utilizing CNN [49] or U-Net [50] to extract multi-scale neighborhood information, employing LSTM [51] or GRU [52] to capture temporal dependence information, combining LSTM with CNN for mining spatiotemporal dependence information [53], and implementing the transformer structure to capture global information [54].
The DNN models, characterized by their deep hierarchical architecture, can capture high-level representations and possess powerful learning capabilities [55]. Previous studies have demonstrated that through adequate calibration and training, DNN can achieve higher simulation accuracy than machine learning methods [16]. However, DNN exhibits several limitations in mining land-use transition rules. Firstly, the network structure (hyperparameters) of DNN is intricate and sensitive, significantly impacting the model’s performance [56]. Numerous combinations of network structures have been explored; however, a consensus on the optimal design has yet to be reached. Secondly, the computation complexity involved in DNN is high, leading to significant time costs even when utilizing a GPU, which poses challenges for high-resolution or large-scale simulation [57]. Another severe issue arises from the black-box nature of DNN, which hinders the derivation of feature explanations and exploration of underlying mechanisms of land-use changes [31].
Interpretability is essential in modeling land-use dynamics [25]. Revealing core drivers of land-use changes can significantly enhance confidence in the simulated results, which is crucial in supporting effective land-use management policies [54]. However, most research on CA modeling concentrates on mining accurate transition rules from driving factors to improving the simulation accuracy, while fewer efforts are devoted to identifying core factors driving land-use changes [58].
To elucidate driving mechanisms underlying land-use changes, initial research focuses on example-based qualitative studies to determine what socioeconomic and natural environmental factors affect specific land-use changes [59]. Furthermore, to address the limitations of qualitative methods, linear models with explainable coefficients, such as linear regression [60] and principal component analysis [61], are introduced to quantify driving factors’ contribution weights. However, the linear hypothesis is problematic as the spatiotemporal land use dynamics, driven by multiple factors, exhibit highly nonlinear behavior [24]. Moreover, the accuracy of the linear model is limited, which compromises the reliability of the interpretation [62]. Therefore, much mainstream research integrates complex nonlinear methods and model-agnostic interpretation methods to mine transition rules and assess the importance of driving factors in CA [45].
Permutation analysis is a commonly used model-agnostic interpretation method, which quantifies a feature’s importance by evaluating the error caused by permuting its values [63]. However, the additional calculation process in permutation analysis incurs significant computation costs. Moreover, some complicated methods, such as Shapley additive explanations (SHAP), are applied [31]. SHAP quantifies the contribution of each feature of each instance based on coalitional game theory, resulting in substantially higher time costs than permutation analysis [64]. As a nonlinear and interpretable method, the random forest (RF) model, which addresses the limitations of linear models and avoids the substantial computation time costs associated with model-agnostic interpretation methods, is a promising method for mining accurate transition rules and identifying core driving factors simultaneously [65]. The RF model quantifies the importance of features by measuring the mean decrease of impurity (MDI) of variables during model training [66]. However, the RF-MDI method suffers from instability due to variable correlation, which can lead to underestimation of the importance of some related variables [65]. Moreover, unlike DNN, the RF model cannot mine high-level representations and exhibits lower accuracy.
Therefore, a new method is needed to overcome the limitations of existing models in mining transition rules and gain interpretations from driving factors. Recently, a tree-based deep learning method, deep cascaded forest (DCF), has been proposed [67]. The DCF model is constructed by cascading multiple RF models layer by layer, which enables the model to mine high-level representations similar to DNN, making the DCF model obtain higher accuracy than traditional machine learning models [68]. As a tree-based ensemble model, the DCF model has a simple structure and few hyperparameters, resulting in substantially lower computational complexity than DNN [67].
The DCF model has been successfully applied in many fields, achieving impressive performance [69,70,71]. The DCF model has also been introduced to CA simulation. For example, Yang used the DCF model to extract transition rules for urban expansion simulation [72]. Zhuang integrated the DCF model into vector-CA to achieve high simulation accuracy in urban land-use simulation [38]. These studies have shown the superior performance of DCF for mining urban transition rules. However, the application of DCF in mining multiple land-use change transition rules has not been explored. More importantly, as an ensemble of RF models, the interpretability of the DCF model has not been fully utilized to understand the driving mechanism of land-use dynamics. Only one or a few RF models were used to quantify the importance of features in existing studies [38]. It is necessary to propose a method to fully utilize the cascade structure of the DCF model to improve the stability and reliability of factor importance analysis.
Therefore, the purpose of this study is to develop a CA model, DCF-CA, based on the deep cascade forest algorithm to improve multiple land-use simulations and driving factors analysis simultaneously. Using the DCF algorithm, accurate multiple land-use transition rules were mined from driving factors to improve CA simulation performance. Additionally, an ensemble MDI feature importance analysis method (DCF-MDI) based on the cascade structure of the DCF model was proposed to qualify each driving factor’s contribution to land-use dynamics reliably. To verify the effectiveness of the proposed DCF-CA model, we simulated land-use patterns and explored underlying driving mechanisms of land-use dynamics from 2000 to 2010 in the Pearl River Delta area (PRD), China, using the DCF-CA model. By comparing the proposed DCF-CA model with existing CA models, we demonstrated the superiority of the model in accuracy, robustness, and interpretability.
2. Materials and Methods
2.1. Study Area and Data
2.1.1. Study Area
The Pearl River Delta (PRD) region was selected as the research area in this study, which encompasses nine cities within Guangdong Province located in southern China: Guangzhou, Shenzhen, Huizhou, Dongguan, Zhuhai, Foshan, Zhaoqing, and Jiangmen (Figure 1). With the rapid economic growth, the PRD has emerged as one of the most developed urban agglomerations in China, covering an administrative area of about 55,000 km2, supporting a GDP of nearly CNY 8 trillion, and hosting a population exceeding 63 million as of 2018. Urbanization and rapid economic development in the PRD have resulted in significant changes in land use, leading to various issues, including uncontrolled urban expansion, occupation of farmland, and ecological degradation [57]. Addressing these challenges and formulating effective policies to guide orderly development are urgent concerns in this region. Therefore, the PRD region is a good study area for validating and applying land-use change simulation models [16].
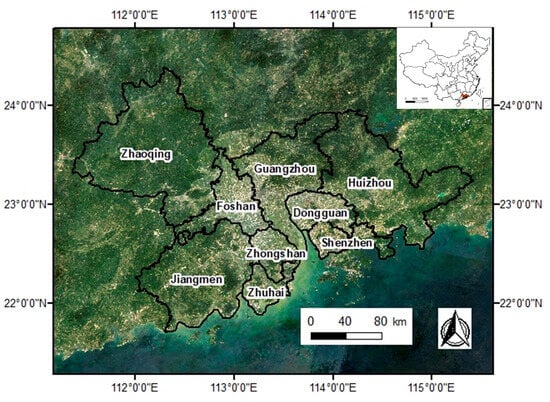
Figure 1.
Administrative divisions and location of the study area (PRD).
2.1.2. Data
Multi-temporal land-use maps and diverse natural environmental and socioeconomic driving factors were used in this study. The land-use datasets for 2000 and 2010 were collected from China land use/cover data (CLUD). The CLUD dataset was produced using a human–machine interactive interpretation method, which exhibits a high overall accuracy of over 95% [73]. The CLUD dataset contains six primary land-use types: farmland, woodland, grassland, water, urban, and bare land [74]. The grassland and bare land are sparse in the PRD region, accounting for only 1.85% and 0.04%, respectively, in 2000 and further decreasing to 1.75% and 0.02% in 2010. The limited grassland and bare land areas pose challenges for accurate land-use change simulations [57]. Therefore, based on existing studies, we combined grassland and woodland into one vegetation type while omitting bare land [16,57]. Finally, the classification comprises four land-use types: farmland, vegetation, water, and urban.
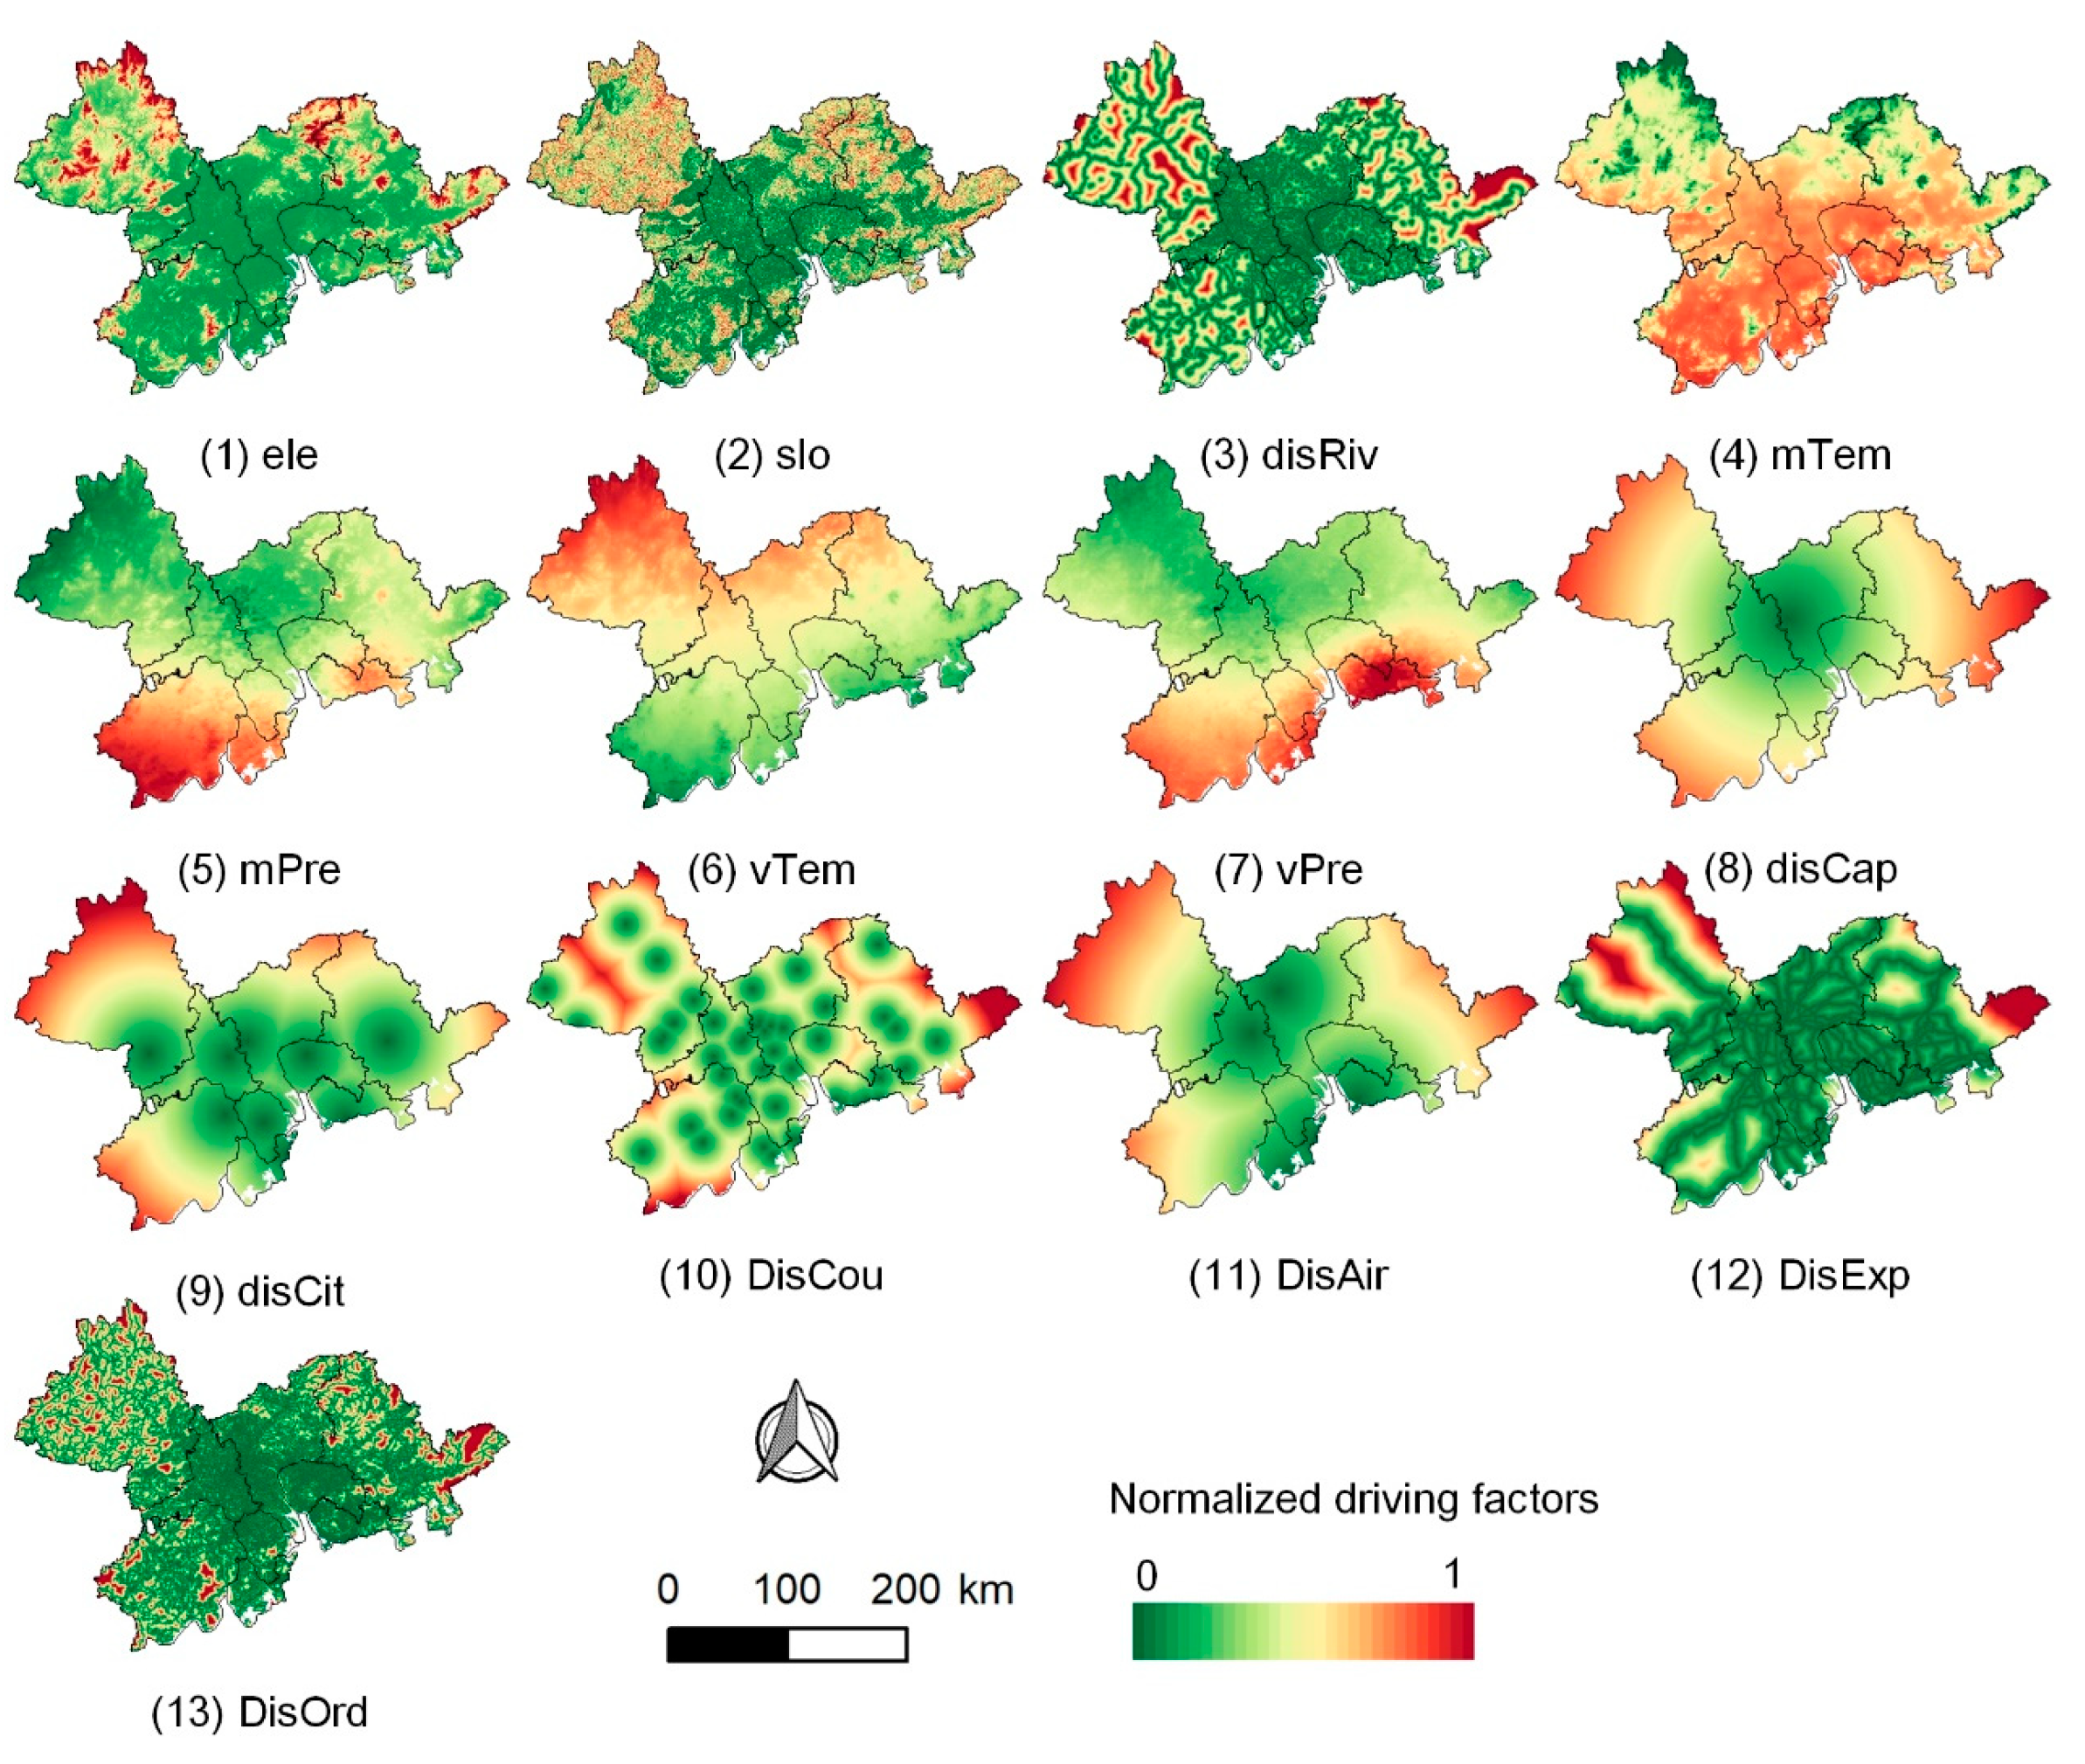
It is well known that land-use dynamics are strongly influenced by various natural environment and socioeconomic driving factors [75]. Thus, this study constructed a comprehensive dataset of 13 driving factors (Figure 2) to model land-use change, encompassing 7 natural environment factors and 6 socioeconomic factors. Table A1 presents the details of the driving factors. Previous studies have validated the representativeness and effectiveness of the driving factors selected in this study [17,76,77]. The elevation data used in this study were directly obtained from the DEM produced by ALOS [78], while the slope was generated from DEM using the surface analysis tool. The historical average climate data (temperature, precipitation) used in this study were collected from WorldClim2 [79]. The remaining distance factors were generated by calculating the Pythagorean distance between each pixel and its nearest spatial feature. The spatial feature database employed in this study was constructed by integrating data from Gaode POI, OSM road network, and river datasets [80].
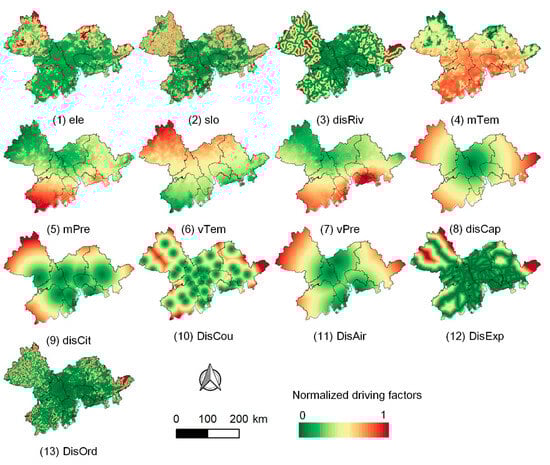
Figure 2.
Driving factors used in this study. (1) Elevation (ele), (2) slope (slo), (3) distance to rivers (disRiv), (4) annual average temperature (mTem), (5) annual average precipitation (mPre), (6) seasonal temperature variation (sTem), (7) seasonal precipitation variation (sPre), (8) distance to provincial capitals (disCap), (9) distance to city centers (disCit), (10) distance to county centers (disCou), (11) distance to airports (disAir), (12) distance to expressways (disExp), and (13) distance to ordinary roads (disOrd).
The computation complexity involved in deep learning is high, leading to significant time costs even when utilizing GPU, which poses challenges for large-scale high-resolution simulation. Therefore, based on existing studies, the spatial resolution of all datasets was resampled to 100 m for efficient modeling of the proposed DCF-CA and multiple comparison models [16,31]. The majority sampling method was employed to resample land-use data, while the bilinear interpolation method was used to resample the driving factors. Moreover, to mitigate the scale effect, all driving factors were normalized to 0–1.
2.2. Methodology
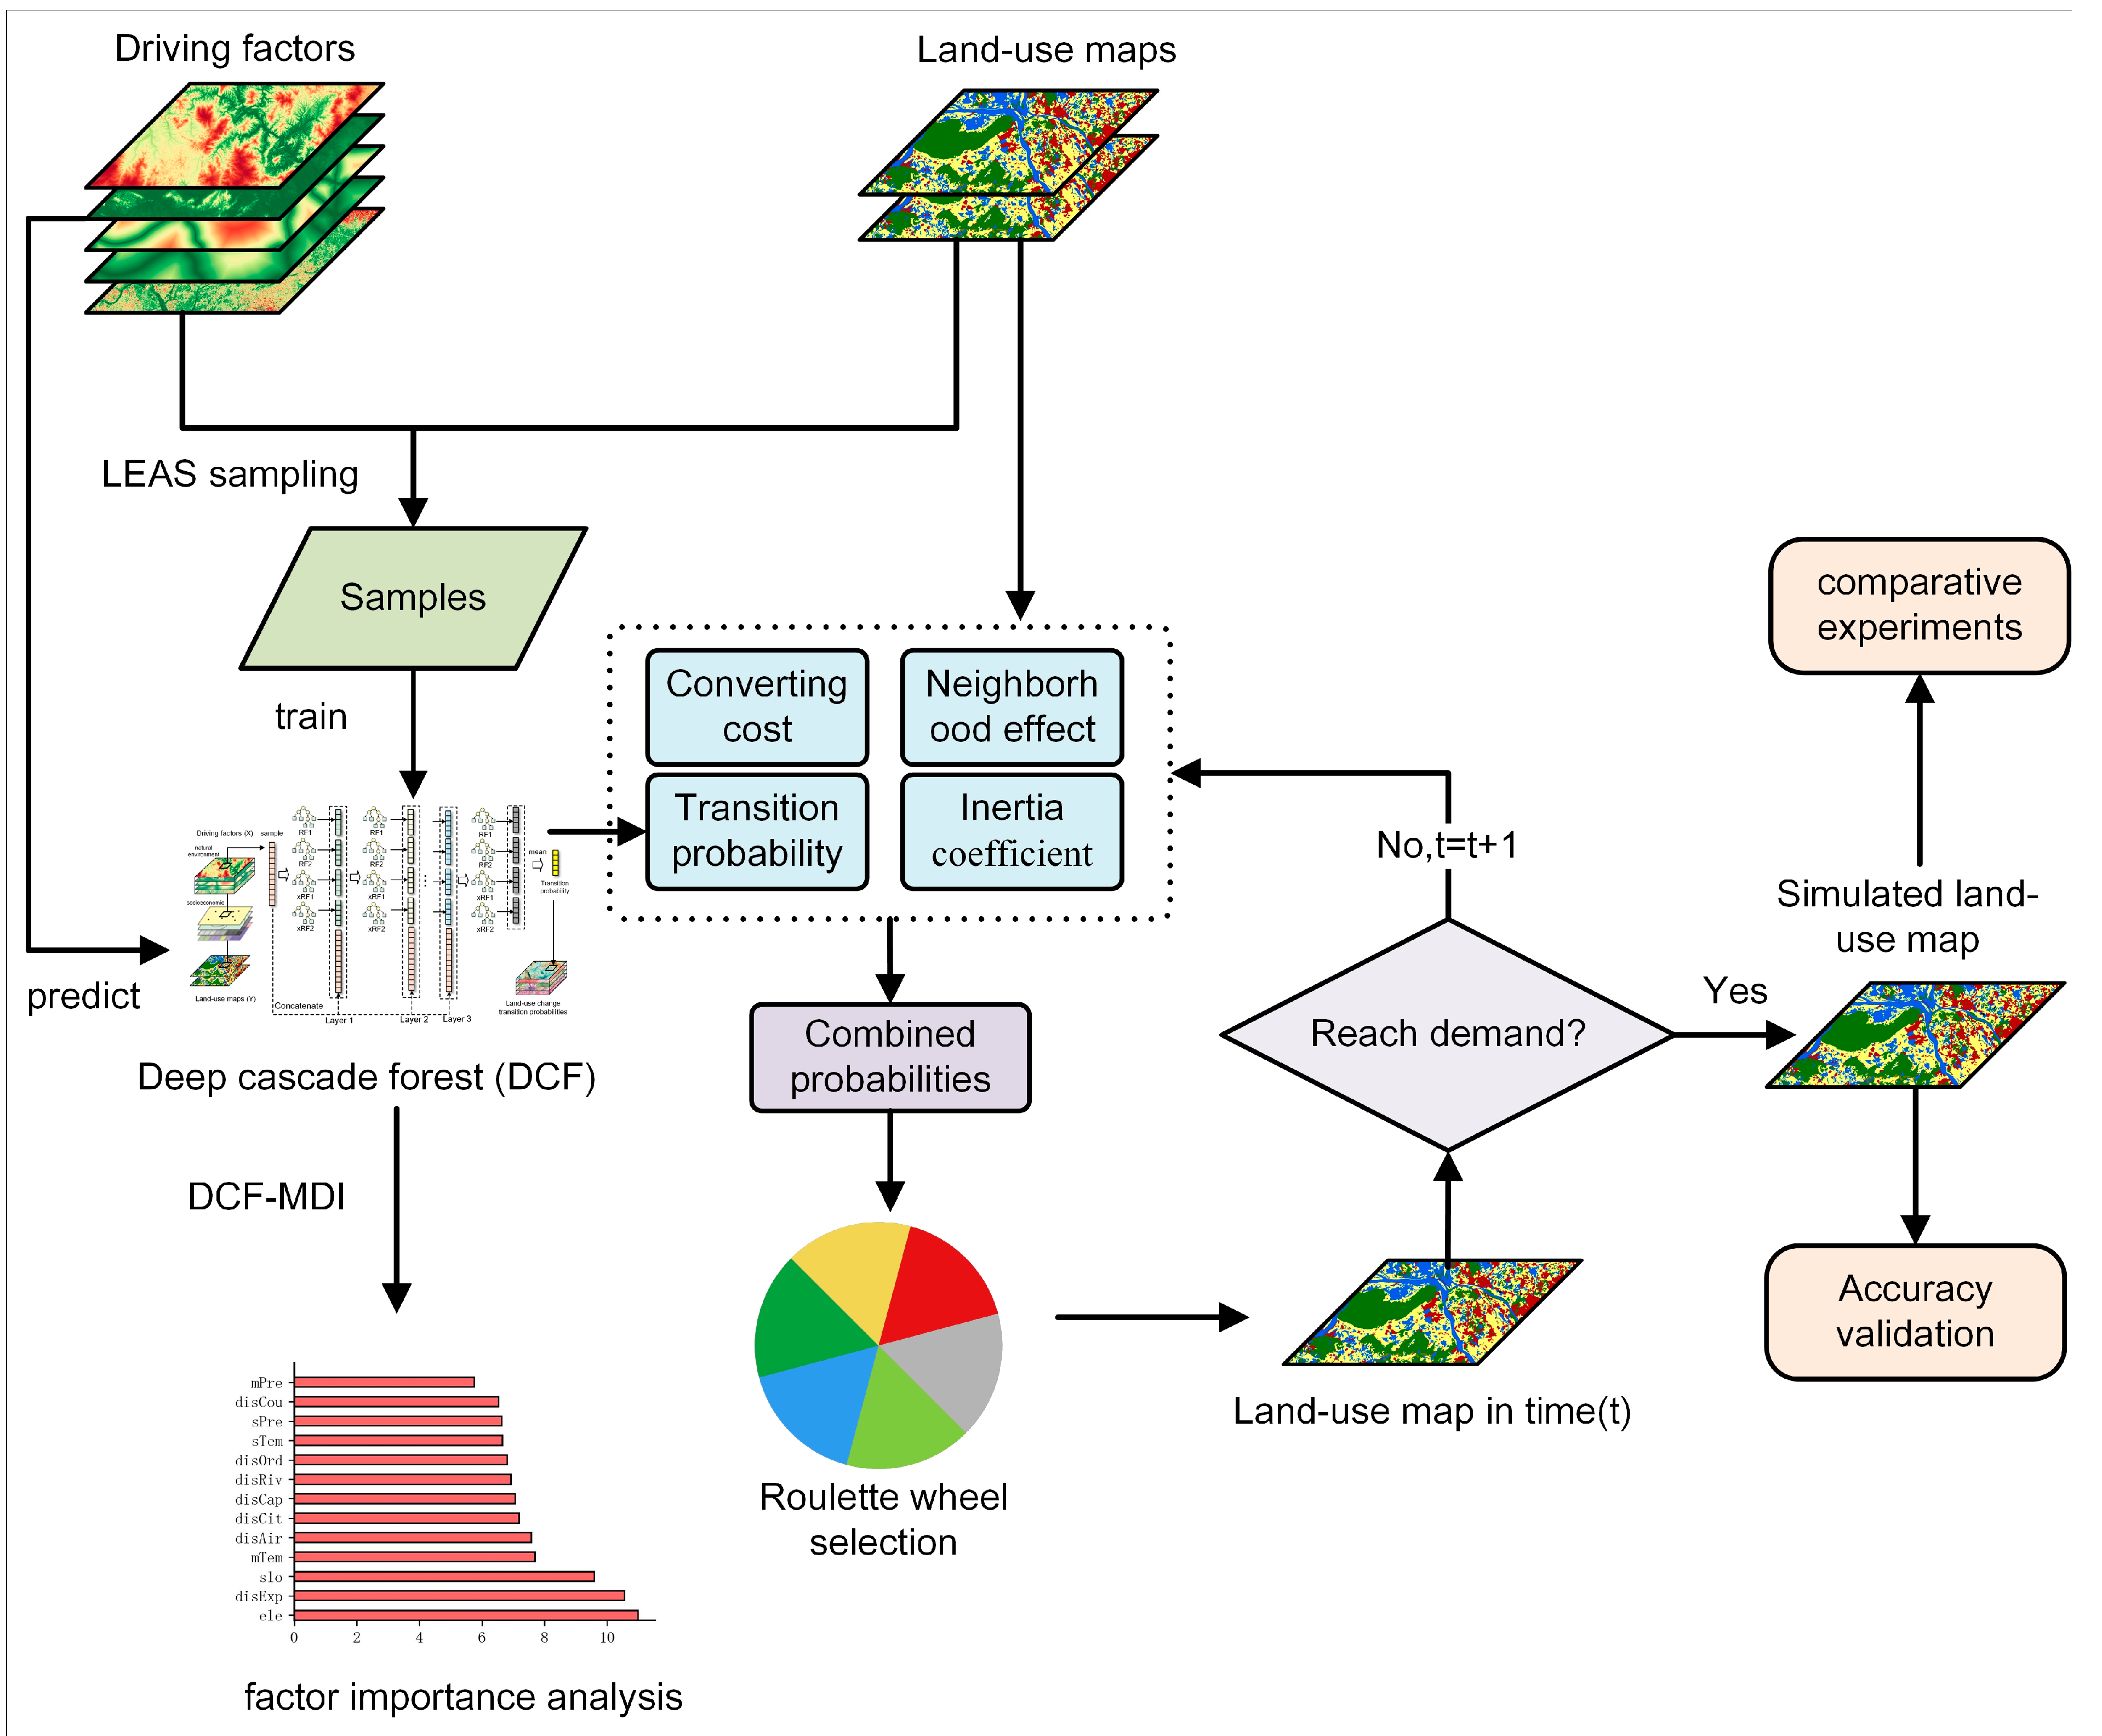
This study developed a CA model based on deep cascade forest (DCF-CA) to simulate land-use patterns and understand the driving mechanism of land-use dynamics simultaneously. Figure 3 presents the overall framework of the study, encompassing three components: (1) training the DCF model to capture the relationship between land-use changes and driving factors for mining transition rules of multiple land-use changes; (2) constructing the DCF-CA model by integrating transition rules, neighborhood effects, inertia coefficients, and conversion costs for multiple land-use simulations; (3) quantifying the stable contribution of driving factors to land-use changes using the DCF-MDI method.
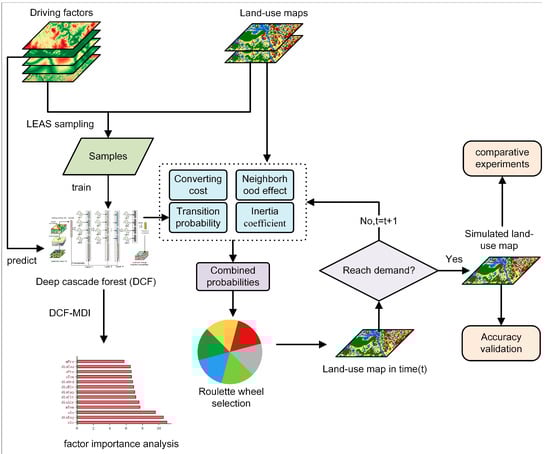
Figure 3.
The overall flowchart for simulating land-use patterns and understanding the driving mechanism of land-use dynamics simultaneously by DCF-CA.
2.2.1. Mining Transition Rules of Multiple Land-Use Changes Using the DCF Model
This study proposes to utilize the DCF algorithm for mining transition rules of multiple land-use. Specifically, when the land-use change types are defined as Y and the driving factors as X, the DCF algorithm is employed to capture the nonlinear relationship Y = f(X) and derive the land-use change transition probability surface f(x).
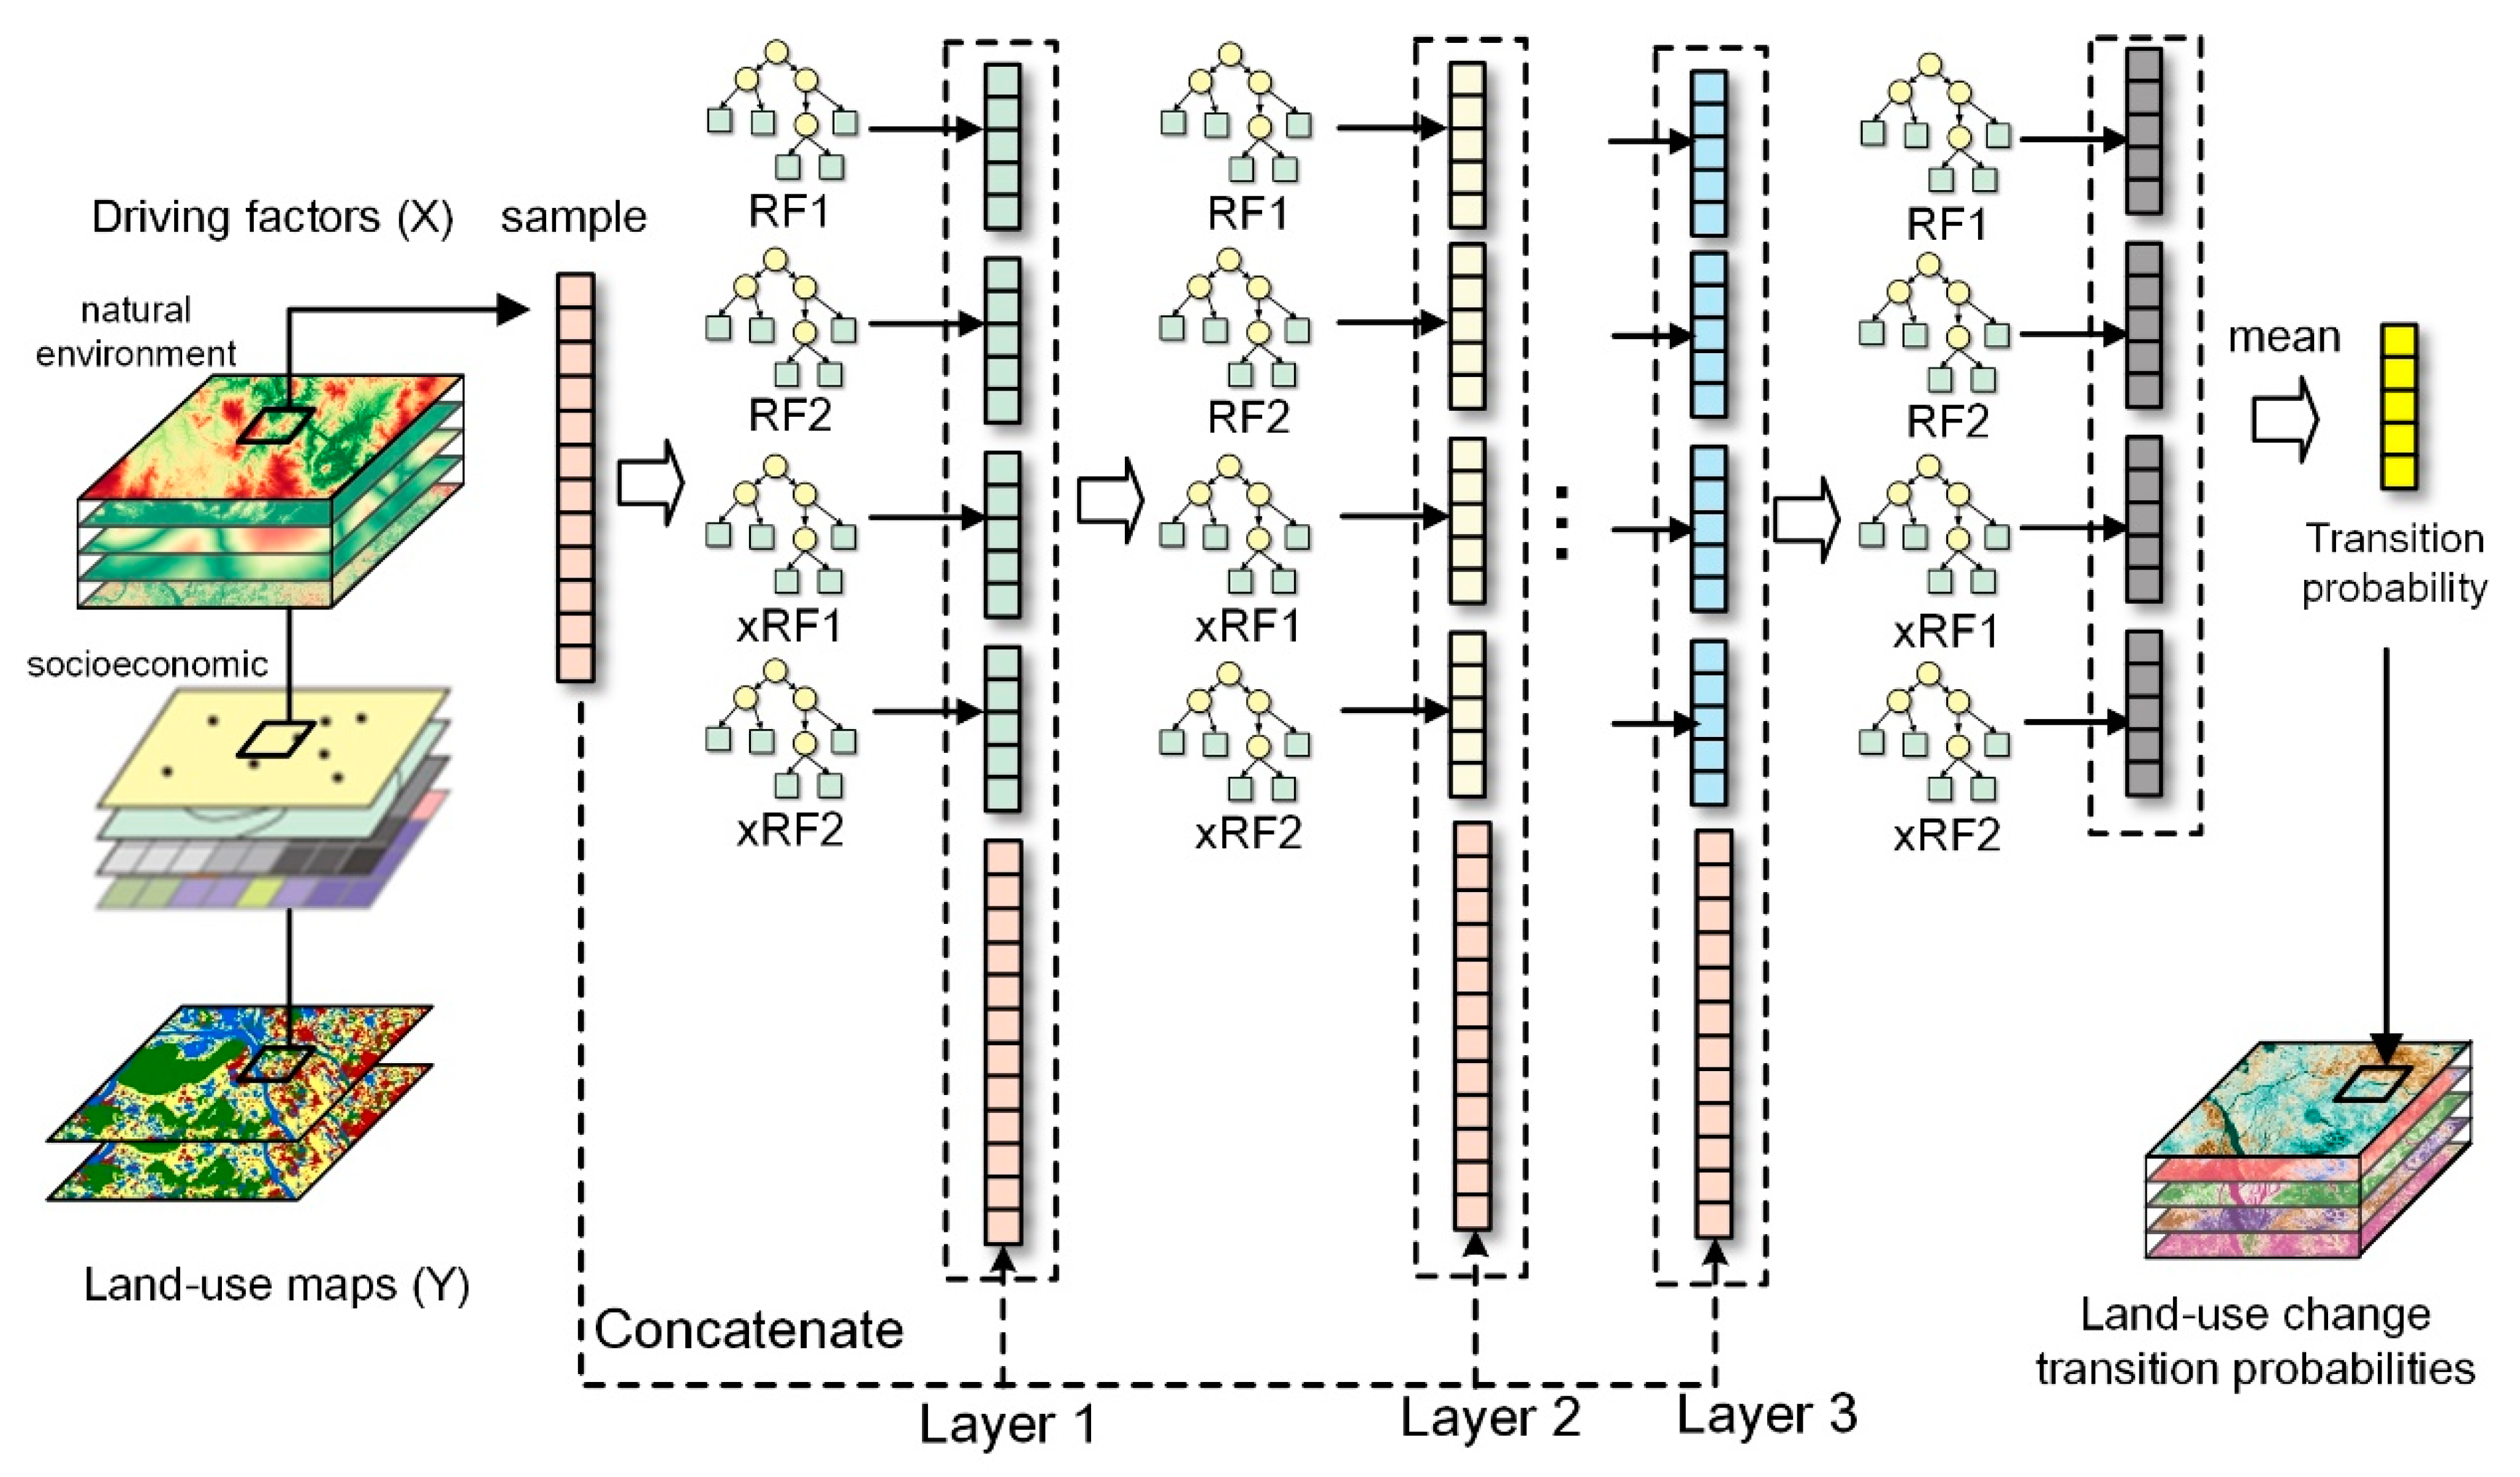
As a deep ensemble model of random forest (RF), the DCF model combines the simplicity and interpretability of RF with the strong representation learning ability of DNN [67]. The architecture of the DCF model is illustrated in Figure 4. Characterized by a hierarchical architecture similar to DNN, the DCF model is constructed by cascading multiple RF models layer by layer, which enables the model to mine high-level representations, resulting in higher fitting accuracy than RF [68]. The hierarchical structure of DCF consists of multiple layers, each composed of multiple RF models. To improve the representation learning ability of DCF, two kinds of RF models, standard RF and extreme RF (xRF), are employed, which increase the diversity of the basic components within the DCF model [67]. The xRF model employs a more stochastic approach to construct internal decision trees, resulting in greater generalization and lower fitting ability than the RF model [81].
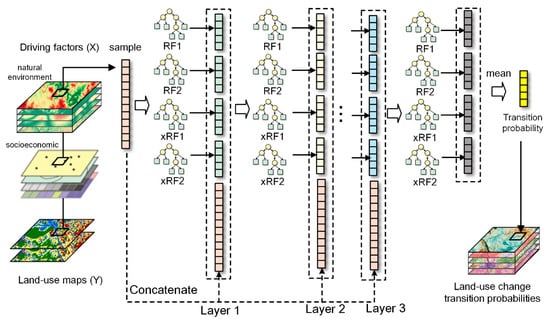
Figure 4.
Architecture of the deep cascade forest model for mining multiple land-use changes transition rules from driving factors.
The DCF model poses a layer-by-layer feature transformation capability similar to DNN [52]. Assuming there are m distinct land-use change types, each RF model within the DCF model generates a transition probability vector of length m based on the input features. Thus, in a DCF model comprising n RF models per layer, each layer within the hierarchical structure produces m × n high-level features, which are concatenated with the original driving factors to constitute inputs for RF models in the next layer. In order to mitigate the problem of overfitting, each RF model in the DCF model is trained using K-fold cross-validation [67]. Additionally, the DCF model features a simple structure, permitting the adaptive determination of model complexity (number of layers) based on the problem’s scale and characteristics [82]. Upon training a new layer, the validation accuracy of the DCF model is estimated by K-fold cross-validation. When the discrepancy between the current round’s validation accuracy and the highest recorded validation accuracy falls below a threshold, the training of the DCF model ceases. The output land-use transition probabilities are calculated by averaging the transition probabilities obtained from the RF models at the final layer [67].
2.2.2. Factor Importance Analysis Using the DCF-MDI Method
In this study, we propose a stable feature importance analysis method based on DCF and MDI (DCF-MDI) to quantify each driving factor’s contribution and comprehend driving mechanisms of land-use dynamics.
The traditional MDI method based on RF (RF-MDI) calculates the importance of a feature by measuring the reduction in impurity when nodes are split based on the feature [63]. Important features with higher discrimination ability exhibit greater impurity reduction. Thus, the mean decrease in impurity (MDI), computed as the weighted average of impurity decreases across all nodes of RF, can be utilized to quantify driving factor importance [83]. The RF-MDI factor importance analysis method overcomes the limitations of linear models and mitigates the computation time costs associated with model-agnostic interpretation methods. However, the MDI method suffers from instability due to variable correlation and randomness, which can lead to underestimation of the importance of some variables, resulting in inaccurate explanations [84]. To overcome the limitations of the traditional MDI method, the DCF-MDI feature importance analysis method was developed using an ensemble learning strategy. In this method, the MDI calculated during the training of each forest within DCF is averaged to calculate the ensemble MDI, which provides a stable measure of factor importance. The validation accuracy of the internal RF models serves as weights during averaging. The ensemble MDI of feature m () can be calculated using Equation (1).
where denotes the MDI attributed to feature m in the RF model i of layer l; denotes the validation accuracy of the RF model. The obtained of original features is normalized to denote contribution weights of driving factors, with the MDI of high-level features ignored.
The proposed ensemble factor importance analysis method effectively mitigates the impact of random disturbance on the traditional MDI method and achieves higher stability. The high simulation accuracy provided by the cascade structure of the DCF model also enhances the reliability of the interpretation. Additionally, the computation of variable importance is efficient as it synchronized with the model training process, incurring no additional time cost.
2.2.3. DCF-CA for Multiple Land-Use Simulation
This study developed DCF-CA for multiple land-use change simulations based on principles of well-established demand-driven CA models [85]. The DCF-CA model comprises four components: transition rules (), neighborhood effects (), inertia coefficients (), and conversion costs (). Multiplying these four components determines the total conversion probability () of a cell transitioning from its current type to its target type k. Then, the target type is determined using a roulette selection process [24].
In CA, transition rules represent the land-use change transition probability determined by various natural environmental and socioeconomic factors. Transition rules constitute the core component of CA, and the performance of CA heavily relies on the accuracy of the mined transition rules [35]. Hence, this study proposed to use an innovative tree-based deep learning method, DCF, to capture the nonlinear relationship between land-use changes and driving factors to obtain optimal transition probabilities of land-use changes.
The neighborhood effect is important to CA by serving two functions: receiving impacts from peripheral cells and avoiding chaotic land-use patterns [86]. These two local neighborhood functions empower CA with the capacity for local self-organizational evolution. In this study, the neighborhood effect () of type k is expressed as the proportion of cells with the type k in the Moore neighborhood of the center cell at time t [24].
where denotes the type of the neighboring cell, n denotes the size of the Moore neighborhood, and con is an indicator function that returns 1 when and 0 otherwise.
The inertia coefficient is a crucial component of demand-driven CA models as it facilitates the convergence of simulations [24]. By adjusting the land-use change rates, the inertia coefficient can ensure that the evolution trend of micro dynamics meets the macro land area demand. The inertia coefficient is expressed as:
where and denote the inertia coefficients of type k at time t − 1 and t, respectively; and represent the gap between the present and target area of type k at time t − 2 and t − 1, respectively. The initial value of the inertia coefficient is set to 1. A land-use type’s inertia coefficient remains unchanged if its micro evolution trend aligns with the macro demand. Otherwise, the inertia coefficient will be dynamically increased or decreased in the next iteration to correct the development trend of that type [24].
The conversion cost, which represents the difficulty of transitioning between different land-use types, serves as an important constraint that shapes the land-use pattern. For example, urbanization is typically irreversible, entailing high costs of transitioning from urban to other land-use types [18]. Based on regional expert knowledge, this study defines the conversion cost between the current type c and the target type k as a value ranging from 0 to 1 [24].
According to the preceding components, the total conversion probability () of a cell transitioning to a type k at time t can be calculated by Equation (4).
The estimated combined probability is deterministic, insufficiently reflecting the inherent uncertainty in actual land-use dynamics. To incorporate random perturbation into the DCF-CA model, a roulette selection process is employed to simulate the stochastic competition and determine the target type [24]. Specifically, the roulette selection process selects the final target type by randomly sampling from the combined probability distribution of all types [87].
2.2.4. Accuracy Assessment
In this study, the performance of the model was evaluated using four quantitative metrics: overall accuracy (OA), user’s accuracy (UA), producer’s accuracy (PA), and figure of merit (FoM) [88]. OA assesses the consistency of observed and simulated land-use patterns in the target year.
where denoted the number of cells with observed type j and simulated type i. Since most cells remain unchanged during land-use changes, OA may overestimate model performance [88]. UA, PA, and FoM are calculated by the changed cells, ignoring the persistence cells in the simulation process, providing a more thorough evaluation of model performance [22]. UA represents land-use change simulation accuracy, PA measures real-world land-use change recall, and FoM combines UA and PA. These metrics can be calculated as follows:
where A represents omissions caused by the observed change being simulated as persistence; B represents true hits resulting from consistent land-use change types observed and simulated; C represents false hits arising from inconsistent land-use change types observed and simulated; D represents false alarms caused by the observed persistence cells being simulated as change [89]. Moreover, the stability of the proposed factor importance calculation method was assessed using uncertainty analysis.
3. Results
3.1. Model Implementation
This study proposed the DCF-CA model to simulate land-use patterns and understand the driving mechanism of land-use dynamics simultaneously. To calibrate and evaluate the model, historical land-use simulations from 2000 to 2010 were conducted in the PRD region.
To develop the DCF-CA model, representative samples must be collected from historical land-use data. This research employed the land expansion analysis strategy (LEAS) to gather these samples [25]. LEAS samples cells from areas of change identified by overlaying land-use maps. This approach ignores the source type of land-use transitions, focusing solely on the target type, thereby significantly reducing the complexity of sampling and model training [25]. The LEAS method was used to collect samples for training and validating the model using historical land-use maps between 2000 and 2010. This study modeled four land-use transition types: unchanged (type 0), transition to farmland (type 1), transition to vegetation (type 2), and transition to urban (type 3). In comparison to other land-use changes, the change in water bodies is minor. Therefore, water bodies were assumed to remain unchanged during the simulation, and transitions to water were excluded [16,31,45]. Due to the uneven distribution of multiple changes, a stratified random sampling method was used [90]. For types 1, 2, and 3, 5% of samples were collected, resulting in 1084, 2960, and 13,917 samples, respectively. An equivalent number of type 0 samples was also collected. In total, 35,922 samples were obtained.
To assess the performance of DCF-CA, three existing CA models, random forest–CA (RF-CA) [91], artificial neural network–CA (ANN-CA) [41], and convolutional neural network–CA (CNN-CA) [16], were constructed and compared. Except for the algorithms for mining transition rules of multiple land-use changes, all other components of the four models were identical.
The parameters for these components were specified based on existing studies and preliminary experiments. Specifically, a 3 × 3 Moore neighborhood and a rigid conversion cost matrix (Table A2) were selected [24]. Basic or default hyperparameters were used for the algorithm that mines transition rules to guarantee reproducibility and fairness in the comparison. In the RF model, 100 decision trees were used. The ANN model used a three-layer network with 13, 100, and 4 neurons per layer. For the CNN model, an eight-layer VGG-based network was implemented [16]. The sampling window size was set to 32 to obtain input patches. To train the model, Adam optimizers with cross-entropy loss functions, learning rates of 1 × 10⁻³, and 100 training epochs were used [16,31]. It is worth noting that window size, network architecture, batch size, optimizer, learning rate, and loss function are all hyperparameters that significantly influence the accuracy of the CNN-CA model [55]. Tuning these parameters to optimize the CNN-CA model is challenging [16]. However, in this study, these parameters were not optimized but were specified based on practices in existing research to compare the simulation accuracy of different models without incurring significant parameter tuning costs. The DCF model was implemented in Python with the hyperparameters set to the recommended default values: two forests per layer and 100 decision trees per forest [67]. Since the DCF model consists of two types of RF in each layer, each layer actually comprises four forests when the number of forests is two.
3.2. Model Validation
Based on the four calibrated CA models, land-use changes in PRD between 2000 and 2010 were simulated. The simulation was constrained by the actual land area demand in 2010. Figure 5 illustrates the simulated and observed land-use distributions of PRD in 2010.
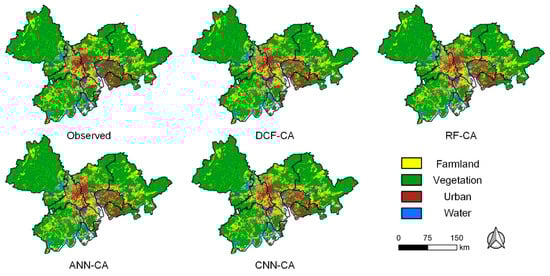
Figure 5.
Simulated and observed land-use distributions of the PRD region in 2010.
Table 1 presents the simulation accuracy of four models between 2000 and 2010. As shown in the table, DCF-CA exhibits the highest accuracy, with a FoM of 23.79%. Meanwhile, RF-CA and ANN-CA achieve FoM values of 21.76% and 21.93%, respectively, while CNN-CA yields the lowest FoM of 20.31%. Previous studies have indicated that achieving accurate land-use simulation is challenging due to the path dependence effect, and the FoM of existing CA models typically ranges between 2% and 30% [29,75,92]. Moreover, the FoM demonstrates a positive correlation with the magnitude of land-use change. The change rate of land use in PRD from 2000 to 2010 was 11.23%, while the simulation achieved FoM values exceeding 20%. Therefore, the simulation accuracy achieved in this study is deemed adequate [89]. Moreover, the DCF-CA model obtained the highest PA and UA. The PA of DCF-CA increased by 3.97–11.06% over the other three models, and the UA increased by 6.26–20.44%, which demonstrates that the DCF-CA model achieved optimal performance in terms of both accuracy and recall. The OA metric considers changing and unchanging cells, which may lead to overestimating of simulation accuracy. In this study, the OA for all four models exceeds 90%, with the DCF-CA model achieving the highest OA value of 91.50%, exhibiting the superiority of DCF-CA in maintaining an orderly overall spatial pattern.

Table 1.
Simulation accuracy (%) between 2000 and 2010 for the four CA models.
The CNN-CA model in this study employs a complex VGG network comprising eight layers [31]. Previous research has emphasized the significant impact of network architecture and parameter configurations on the performance of CNN [16]. However, default parameters are employed in this study without optimization, which may cause the model to overfit historical trends. Thus, the CNN-CA model demonstrates the lowest simulation accuracy. The DCF model, as a tree-based deep learning model, has a simpler architecture and fewer hyperparameters than CNN. Additionally, the DCF model allows for adaptive model complexity adjustment based on the problem’s scale and characteristics [67]. Thus, the DCF-CA model can achieve high simulation accuracy even with default parameters, addressing the challenges of high parameter tuning cost and computational complexity of CNN. Compared to DCF-CA, RF-CA cannot mine high-level features from driving factors, which limits the model’s fitting ability and results in lower simulation accuracy [80].
In addition, the accuracy of each type (i.e., farmland, vegetation, and urban) was further evaluated to investigate the performance of the four models. As shown in Table 2, DCF-CA obtained the highest accuracy across all land-use types, indicating its superior performance in mining transition rules for various land-use types. Urban simulation consistently yielded higher accuracy than farmland and vegetation across all models. This can be due to the concentrated nature of urban expansion compared to the change in vegetation and farmland, making it more predictable by the CA models [29]. Moreover, given the positive correlation between FoM values and the magnitude of change [89], the relatively higher proportion of urban change (+5.60%) compared to farmland (−4.43%) and vegetation (−0.95%) in the study area contributed to the observed higher FoM values of urban.
Table 2.
FoM (%) of simulation of three types of land-use change between 2000 and 2010.
Furthermore, the simulation accuracy of four CA models was compared across different cities within the study area. As presented in Table 3, the DCF-CA model obtained the highest FoM value across all cities, indicating that DCF can effectively mine transition rules across different regions. The accuracy of DCF-CA varies significantly among various cities, ranging from 10.19% to 42.09%. Among them, Dongguan exhibits the highest simulation accuracy (FoM = 42.09%), which may be owing to its rapid urbanization between 2000 and 2010, resulting in substantial urban expansion. The CA model can effectively capture this cluster urban expansion phenomenon, thus achieving high simulation accuracy. Conversely, Zhaoqing obtains the lowest simulation accuracy (FoM = 10.19%), which may be due to its peripheral location within the PRD region, characterized by predominantly forested areas with scattered land-use changes, posing challenges for accurate simulation.
Table 3.
FoM (%) of simulation between 2000 and 2010 in different cities of the PRD region.
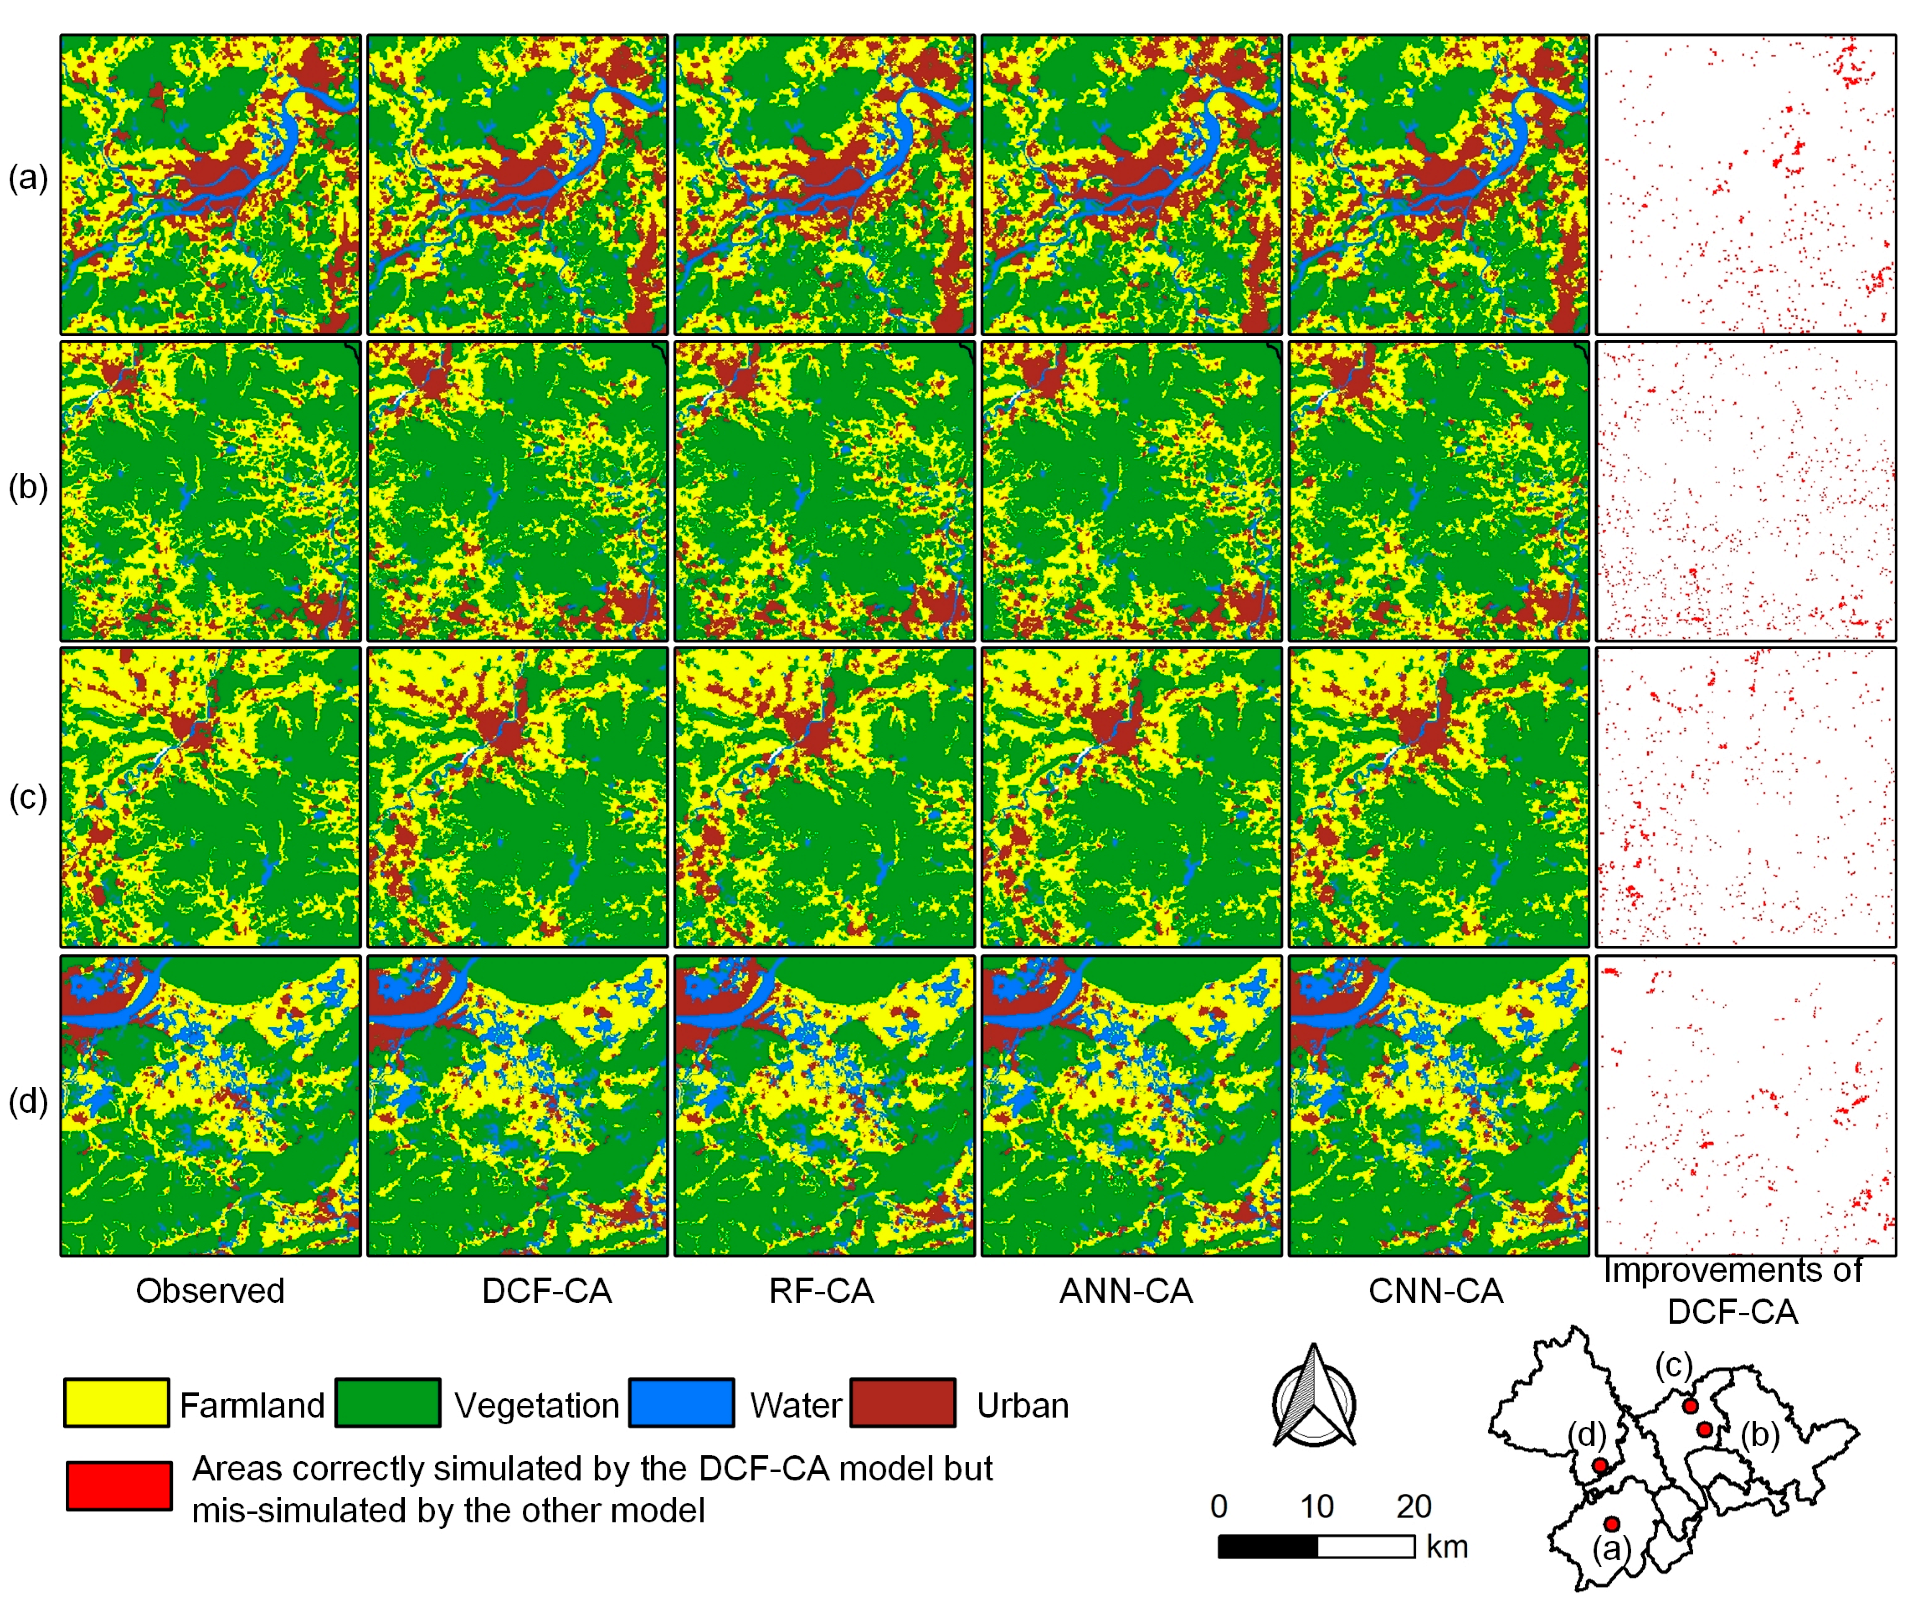
Four typical regions in the PRD area were selected to illustrate the details of the simulated results in 2010 (Figure 6). The figure reveals a high level of consistency between the simulated patterns and the actual land-use patterns, with slight discrepancies in certain details. Given the inherent stochastic nature of land-use dynamics, it is unrealistic to expect an exact alignment between the observed land-use pattern and the simulation result [93]. Comparing the simulation results of different models indicates that DCF-CA demonstrates superior accuracy in matching the actual patterns. The areas correctly simulated by DCF-CA but mis-simulated by other models are delineated in Figure 6, which further illustrates the effectiveness of DCF-CA in capturing land-use dynamics. The DCF model, as a tree-based deep learning model, integrates the robustness of tree models with the representation learning ability of deep learning models, enabling it to extract high-level information from driving factors without overfitting [67]. Therefore, the model outperforms other methods in mining multiple land-use transition rules and achieves high simulation accuracy.
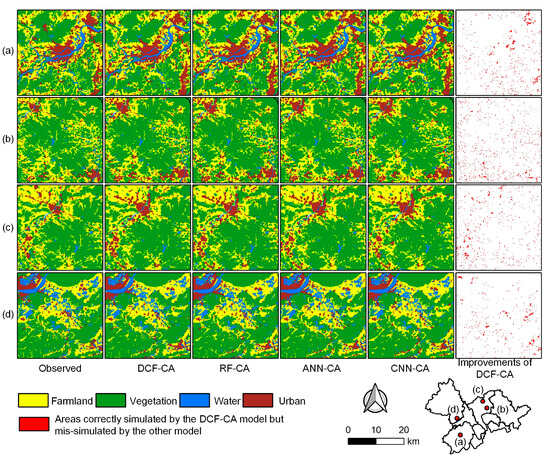
Figure 6.
Comparison of the details of the simulated results in 2010.
3.3. Parameters Sensitivity Analysis
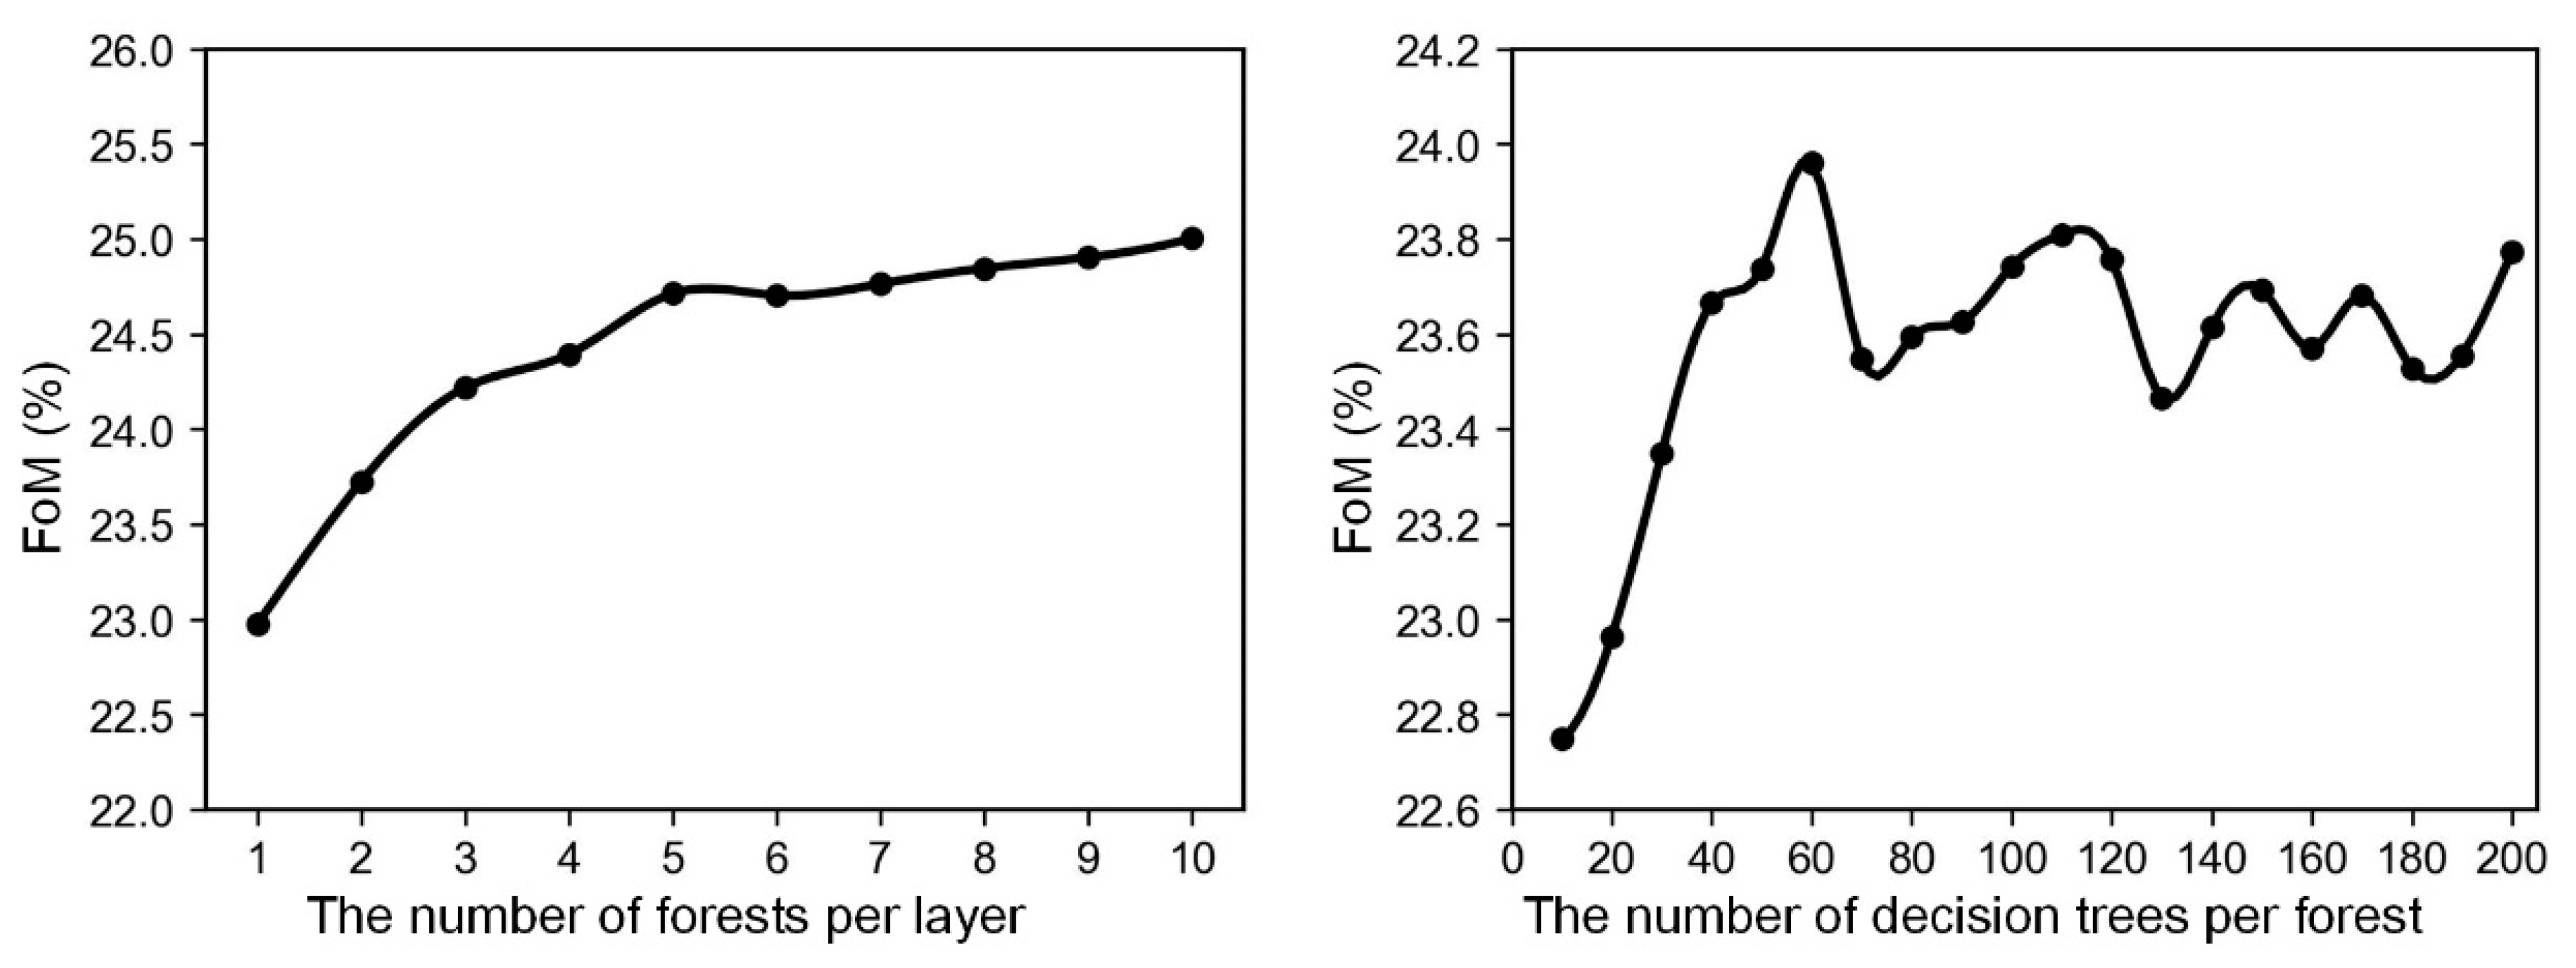
The preceding experiments in this study have demonstrated that DCF-CA achieves optimal performance with default parameter configurations. Here, we further evaluate the parameter sensitivity of DCF to comprehensively assess the model’s performance. The DCF algorithm contains two hyperparameters: the number of forests per layer and trees per forest [67]. To examine the impact of these parameters on simulation accuracy, multiple experiments were conducted for land use simulation in PRD between 2000 and 2010 using DCF-CA with various configurations.
Twenty experiments were conducted to examine the impact of the number of decision trees. In each experiment, the number of decision trees in the forest increased from 10 to 200, with an increment of 10, while the default number of forests (2) was used for each layer. Figure 7 presents the FoM values of DCF-CA with varying numbers of decision trees, ranging from 22.75% to 23.96%. The highest FoM is observed at 60 decision trees. The simulation accuracy gradually increases at the beginning (trees < 60), and then the accuracy tends to be stable, exhibiting slight fluctuations.
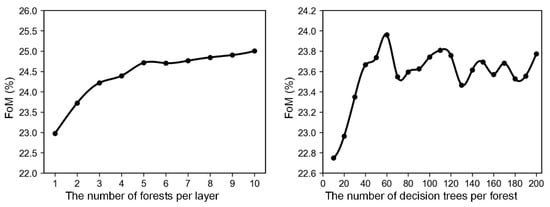
Figure 7.
Relationship between the hyperparameter configuration of the DCF model and the accuracy of simulated results.
Furthermore, we investigate the impact of the number of forests per layer on the accuracy of the DCF-CA model. We conducted 10 experiments, where the number of forests increased from 1 to 10, and the default number of decision trees (100) was used in each forest. Figure 7 shows FoM values of simulations with different numbers of forests per layer. The simulation accuracy of DCF-CA ranges from 22.97% to 25.00%, demonstrating a significant increasing trend as the number of forests per layer increases. Augmenting forests per layer in DCF enhances the generation of high-level features, thus improving the model’s representation learning ability [67]. However, increasing the number of forests per layer significantly raised the computational cost while the marginal improvement in accuracy diminished.
The parameters sensitivity analysis result indicates that the performance of DCF-CA tends to be stable when the number of decision trees and forests exceeds a threshold. Moreover, the accuracy of DCF-CA fluctuates within a limited range (22.75–25.00%) across various configurations, indicating that DCF-CA is insensitive to hyperparameters, and the model can achieve satisfactory performance even with default settings, making it easily applicable to different regions.
3.4. Factor Importance Analysis
Revealing core drivers of land-use changes can help planners and administrators comprehend the underlying driving mechanism of land-use dynamics and increase confidence in the simulated results, which is crucial in supporting the formulation of effective land-use management policies to guide sustainable development.
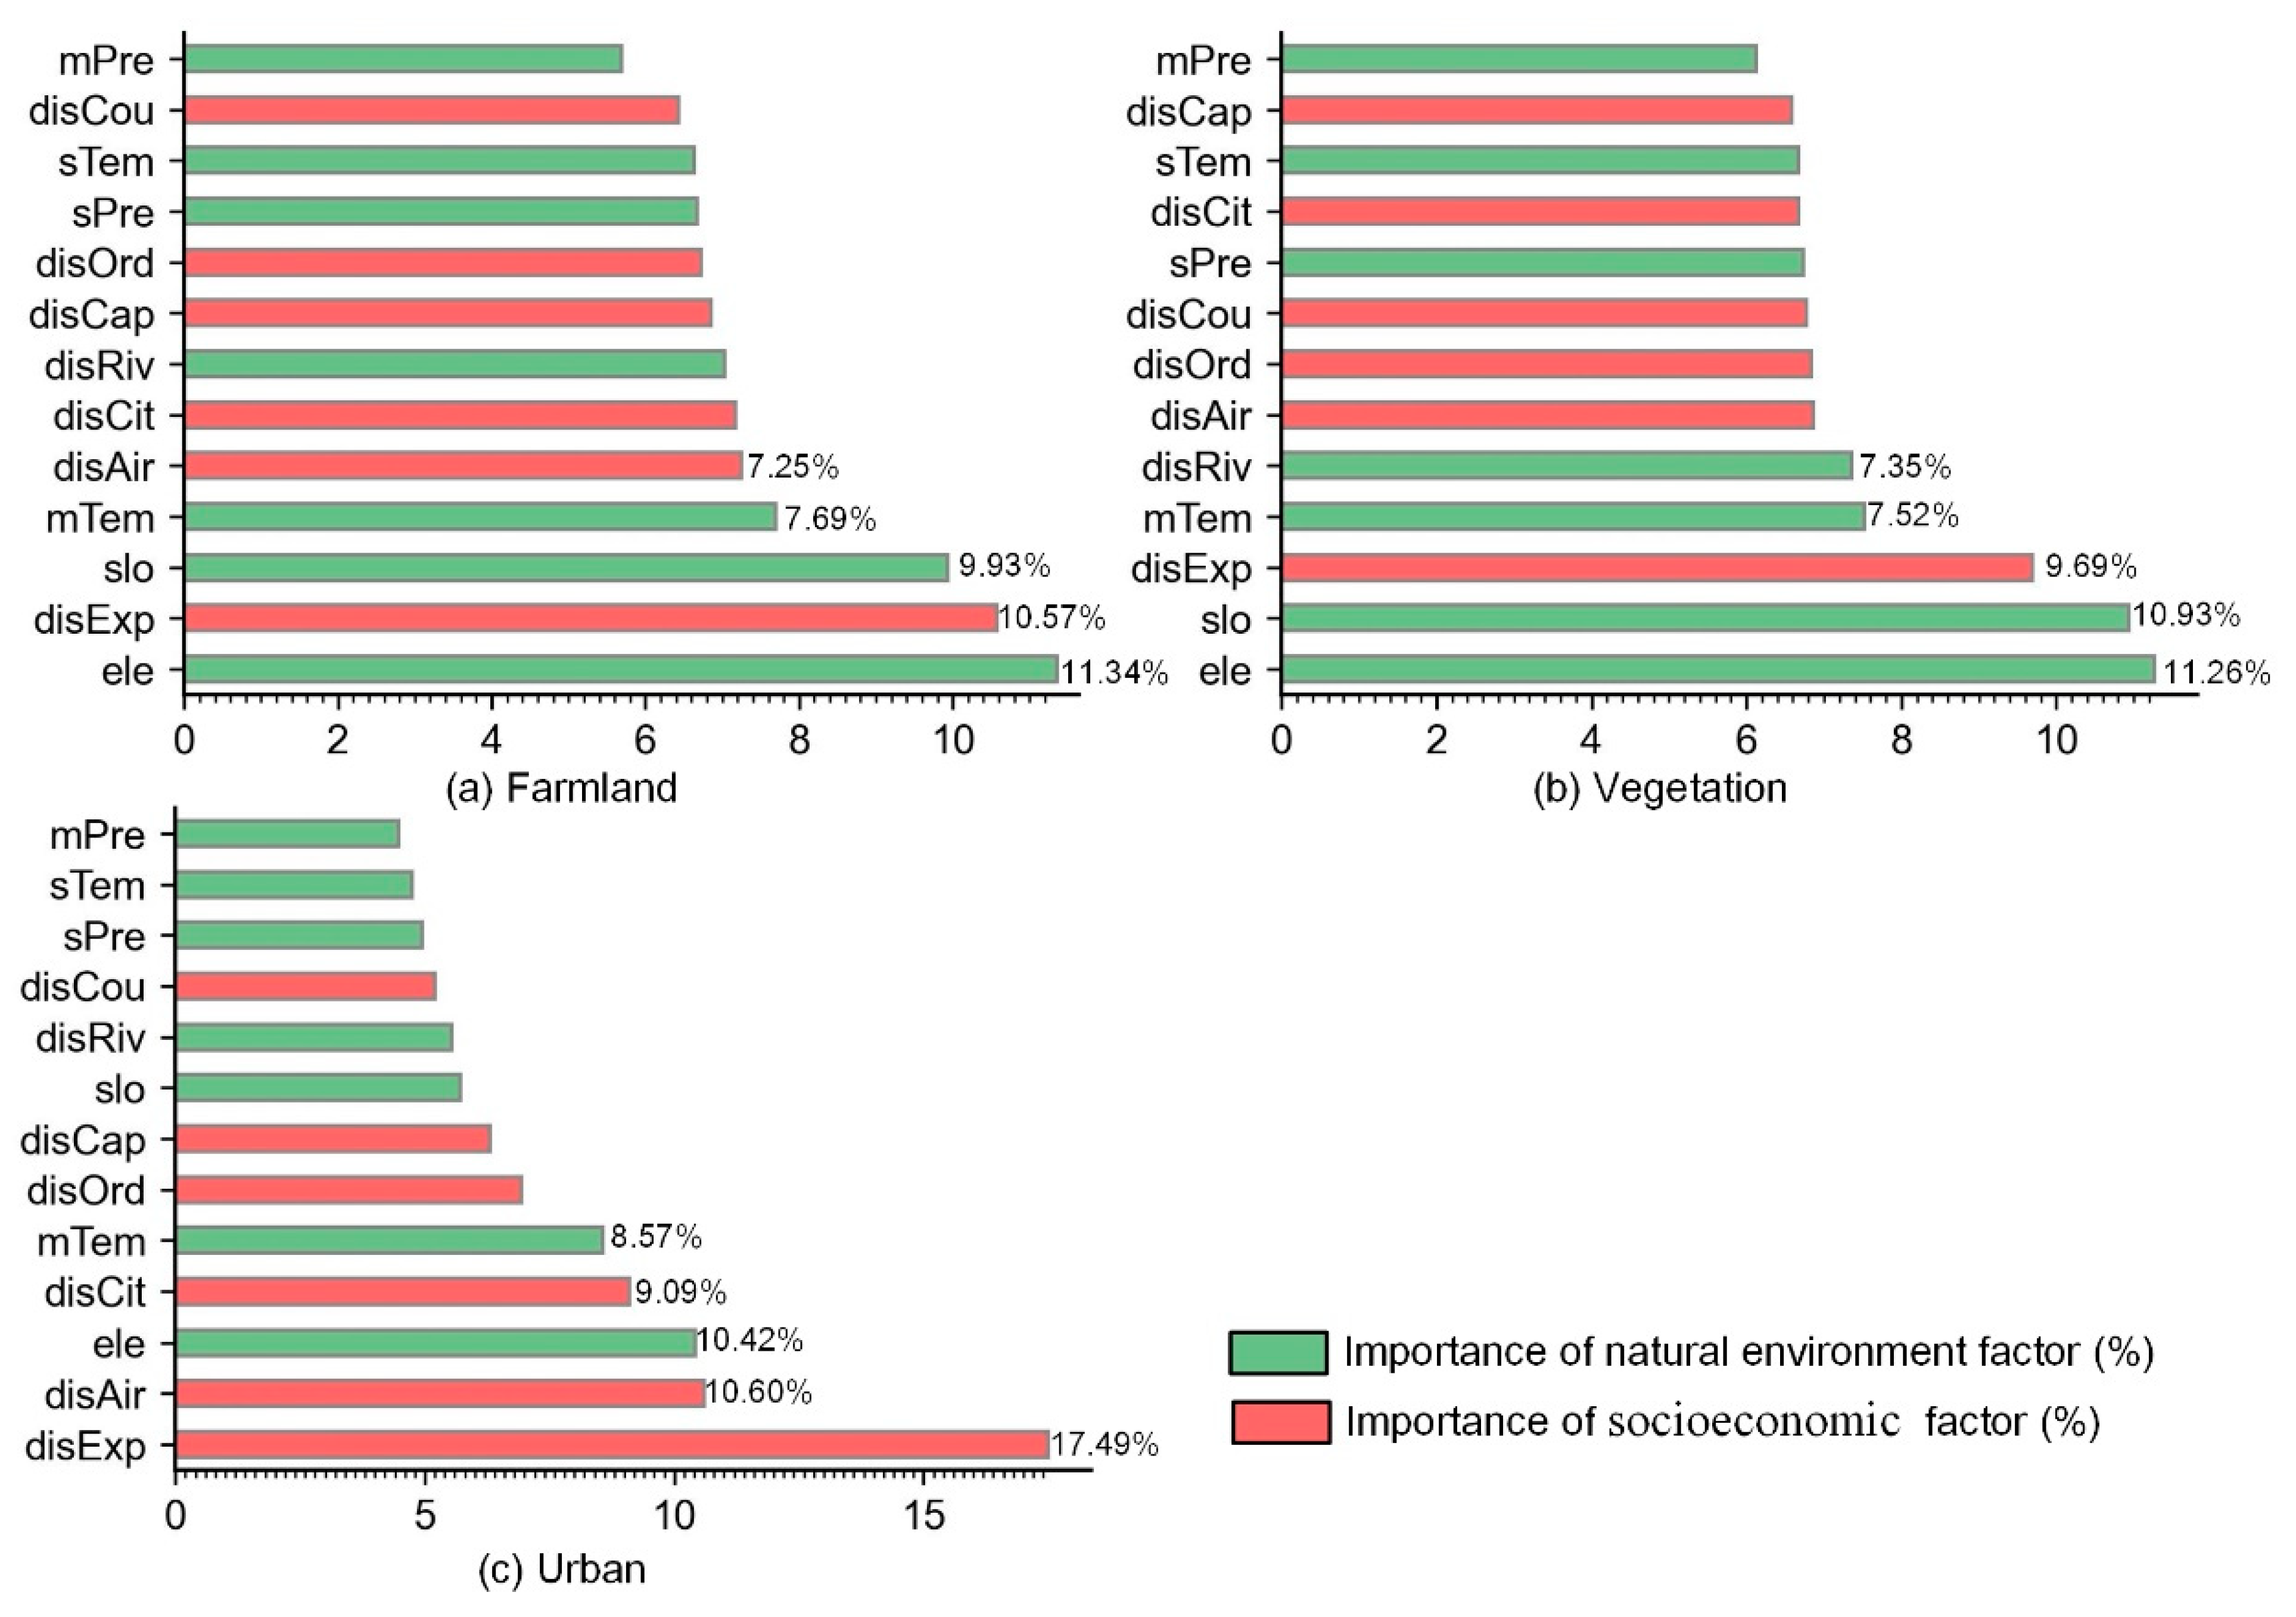
This study proposes a stable feature importance analysis method, DCF-MDI, to quantify each driving factor’s contribution to changes in farmland, vegetation, and urban in the PRD region between 2000 and 2010. The contribution weights of 13 driving factors to three types of land-use change calculated by the proposed DCF-MDI method are illustrated in Figure 8. As shown in the figure, the top five factors driving farmland change are elevation, distance to expressways, slope, annual average temperature, and distance to airports, indicating the compound impact of social and natural factors on farmland land-use dynamics. Agricultural production is heavily influenced by the natural environment, which makes topography and climate factors significantly contribute to farmland land-use change. Additionally, convenient transportation is crucial for the circulation of agricultural products, making the proximity to main transit roads the second most influential factor affecting farmland changes. Compared to farmland, vegetation change is primarily influenced by natural factors, with elevation, slope, annual average temperature, and distance to rivers and expressways being the leading driving factors. The influence of social factors on vegetation change is relatively minimal, mainly because the interaction between vegetation and human activities is less significant than farmland [25]. Conversely, urban land-use changes are heavily influenced by human activity, with socioeconomic factors contributing over 55%. Nevertheless, natural environmental factors also have a significant impact on urban development.

Figure 8.
Contribution weights of 13 driving factors to three types of land-use change in PRD between 2000 and 2010.
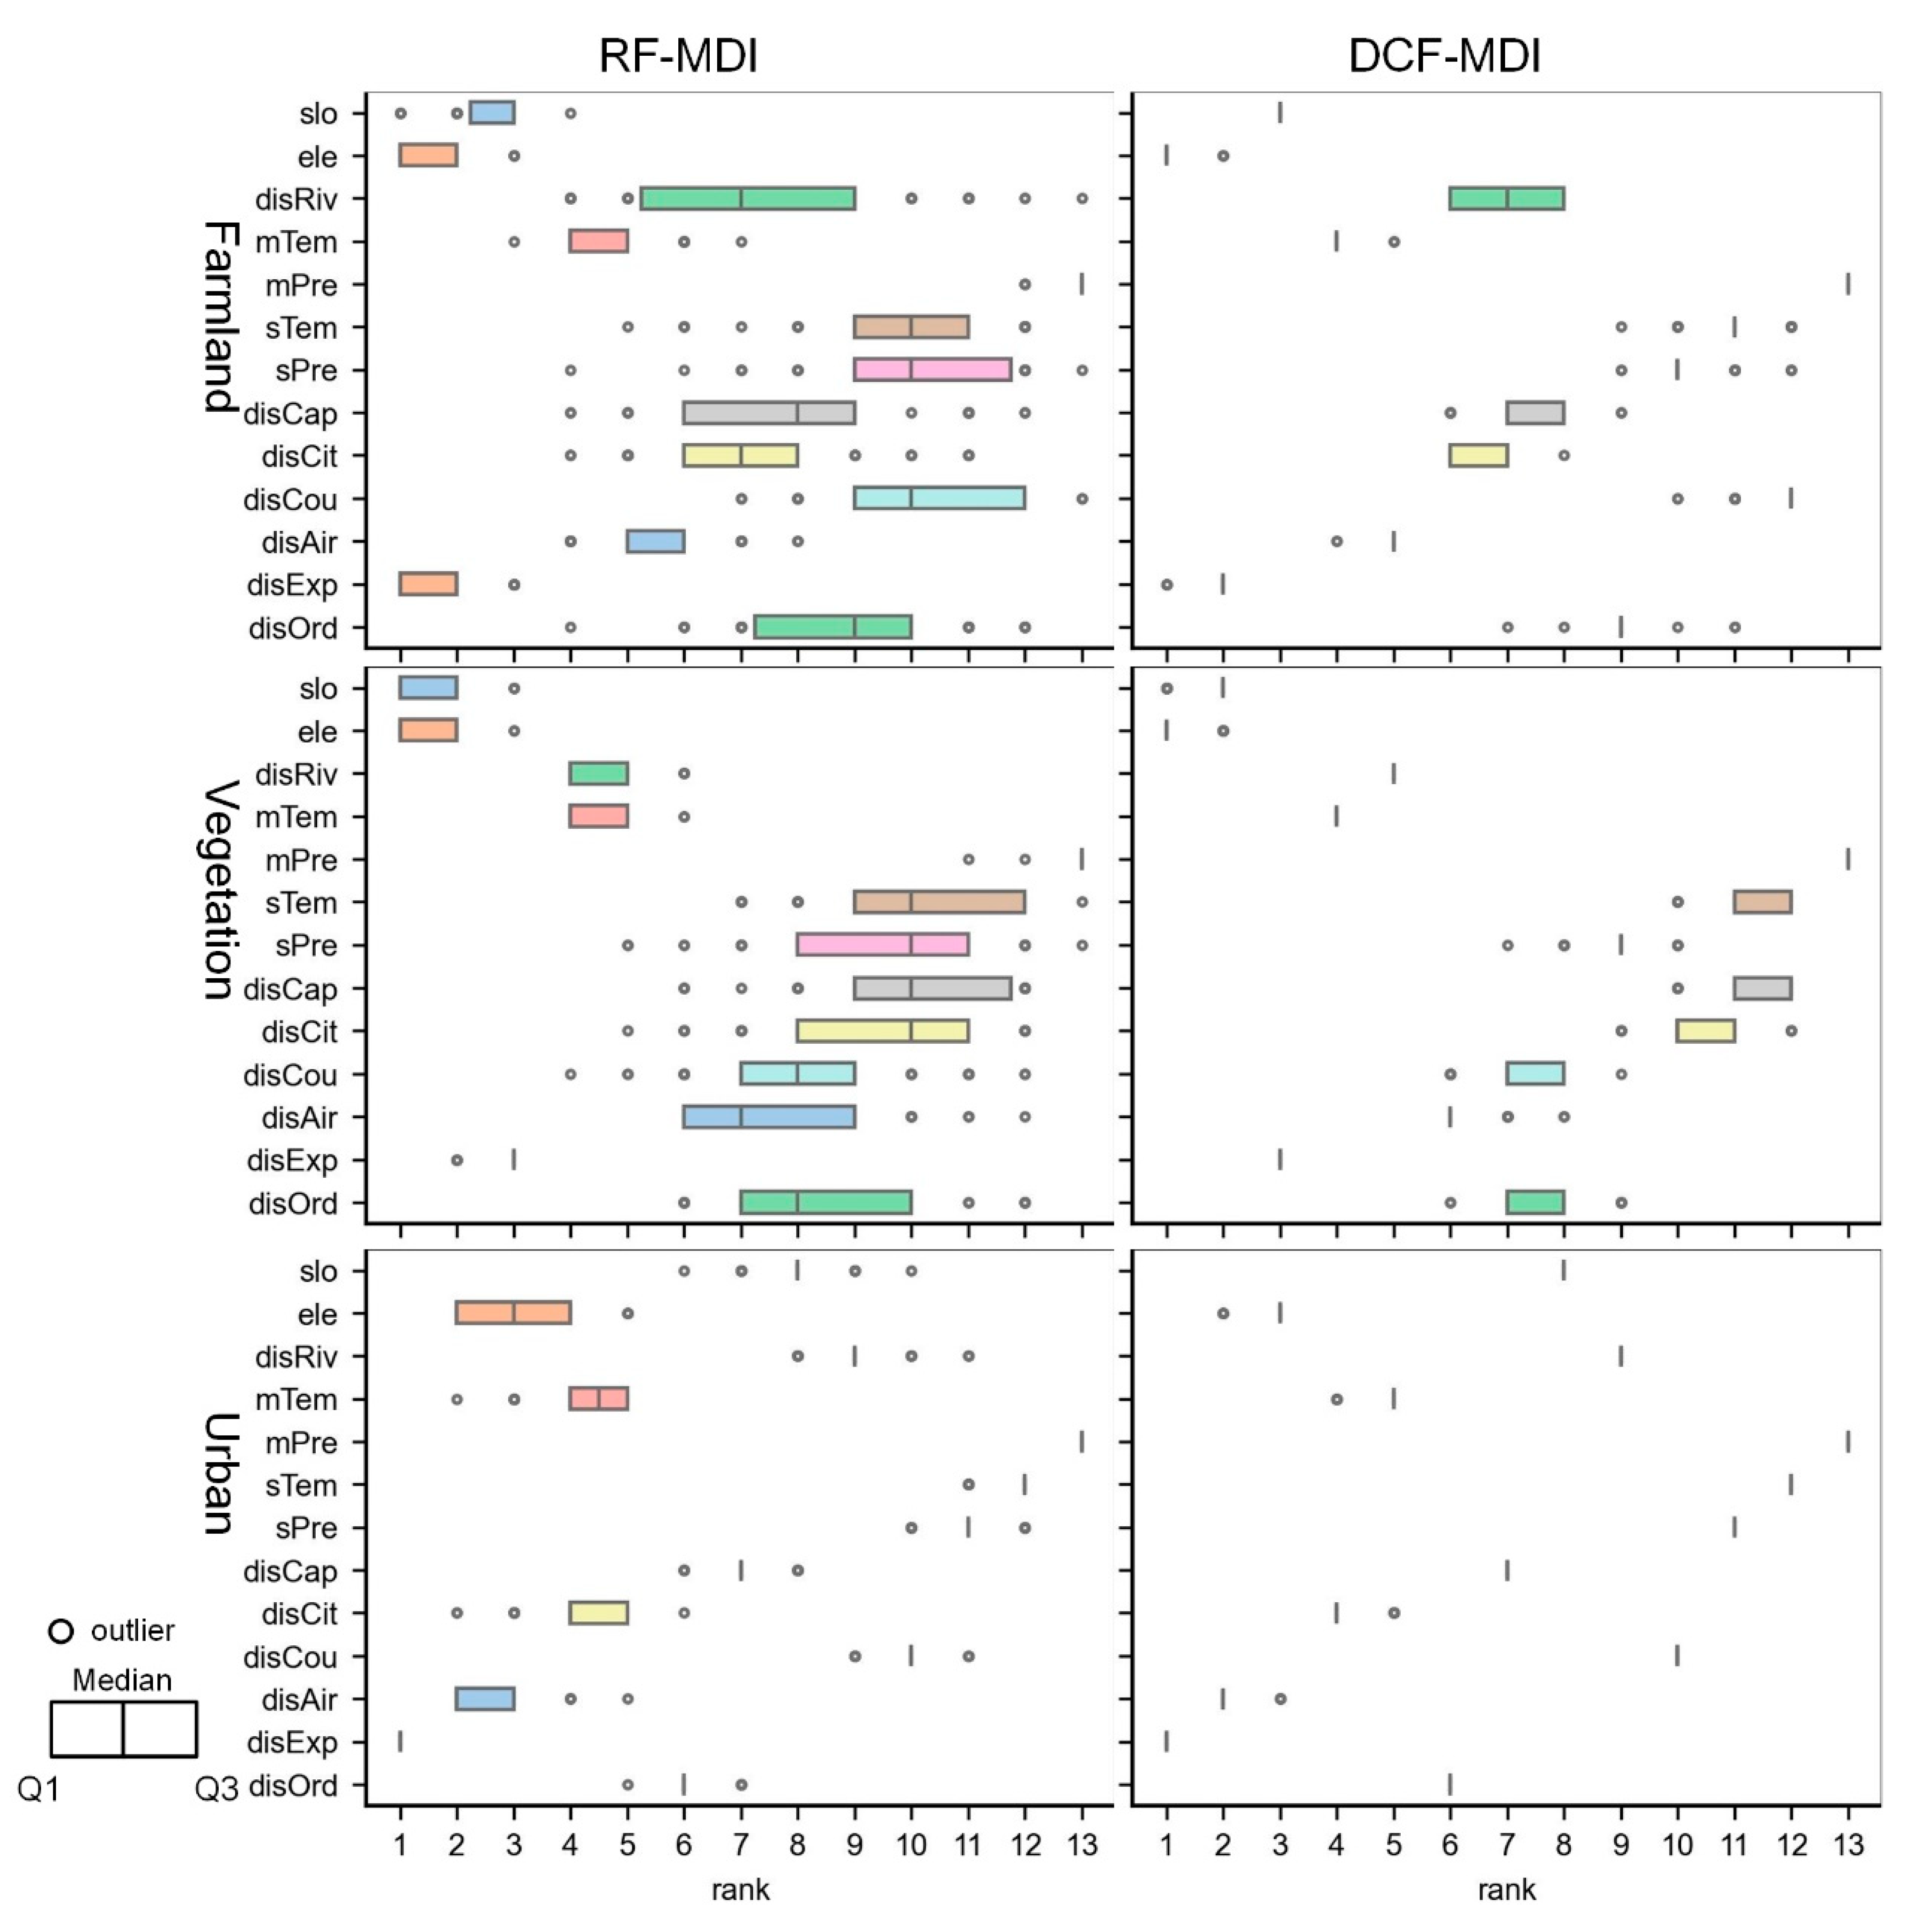
Furthermore, we repeatedly calculated the contribution weights of driving factors 50 times using the proposed DCF-MDI and the traditional RF-MDI method to evaluate the stability of factor importance analysis. Figure 9 shows the ranks of driving factors generated by the DCF-MDI and RF-MDI methods, with the boxplot representing the distribution of the 50 ranking orders. The extensive ranges of the boxplots indicate that random disturbance significantly influences the factor importance analysis method based on MDI, which may lead to insufficient quantifying of the relative importance of correlated variables [84]. However, the proposed DCF-MDI method produces more stable ranking orders than the traditional RF-MDI method, indicating its robustness to random disturbances and superiority in uncovering driving mechanisms of land-use dynamics. DCF-MDI employs an ensemble learning strategy to quantify feature importance. The method integrates MDI calculated by internal RF models, weighted by validation accuracy, thereby mitigating the impact of random disturbances without incurring additional computation costs.
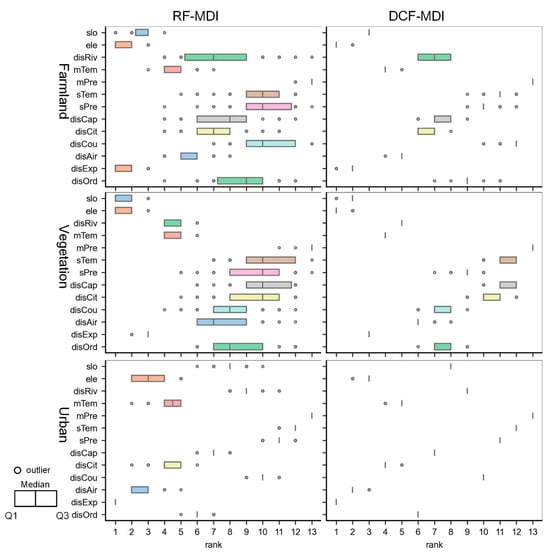
Figure 9.
Comparison of the stability of factor importance ranking calculated using RF-MDI and DCF-MDI methods.
Moreover, we computed the standard deviation of the contribution weight of each driving factor across 50 experiments. As shown in Table 4, the average standard deviation of contribution weights obtained using the RF-MDI is 0.51% (farmland), 0.30% (vegetation), and 0.54% (urban), whereas those calculated by the DCF-MDI method are 0.10% (farmland), 0.06% (vegetation) and 0.10% (urban), respectively. On average, the standard deviation of the RF-MDI method is 5.33 times greater than that of the DCF-MDI method, indicating that the DCF-MDI method achieves higher stability and effectively mitigates the randomness associated with the MDI-based importance analysis method. Moreover, the results indicate that the proposed importance analysis method demonstrates high standard deviation stability in analyzing the driving mechanisms of vegetation and high ranking stability in analyzing the driving mechanisms of urban.
Table 4.
Comparison of the standard deviation of factor contribution weights calculated using RF-MDI and DCF-MDI methods (%).
4. Discussion and Conclusions
CA models have been extensively employed to predict and understand the spatiotemporal dynamics of land use. Numerous socioeconomic and environmental factors have been demonstrated to play a significant role in shaping and driving land-use changes. Therefore, mining accurate transition rules from driving factors to achieve high land-use simulation accuracy and measuring contribution weights of driving factors to reveal mechanisms of land-use dynamics constitute the core components of CA. However, existing CA models based on traditional methods have limitations in obtaining accurate transition rules and reliable interpretations simultaneously for multiple land-use simulations.
In this study, we proposed the DCF-CA model based on deep cascaded forest (DCF) to overcome the challenges of mining accurate multiple land-use transition rules from various spatial driving factors and understanding drivers of multiple land-use changes simultaneously. The DCF algorithm, a tree-based deep learning method, was utilized to mine accurate transition rules of multiple land-use changes to improve simulation accuracy. Additionally, a novel ensemble mean decrease in impurity (MDI) factor importance analysis method (DCF-MDI), which leverages the cascade structure of the DCF model, was proposed to qualify each driving factor’s contribution to land-use dynamics stably.
To assess the effectiveness of the proposed DCF-CA, we applied the model to simulate land-use distributions and explore the underlying driving mechanisms of land-use dynamics in the Pearl River Delta (PRD), China, from 2000 to 2010. In comparison to three existing models, RF-CA, ANN-CA, and CNN-CA, the proposed DCF-CA exhibits the highest accuracy (FoM = 23.79%, PA = 39.77%, UA = 36.35%, OA = 91.50%) in the simulation from 2000 to 2010. Additionally, the DCF-CA model achieved the highest simulation accuracy for each land-use type and each sub-region, demonstrating its superiority in mining diverse transition rules for capturing multiple land-use dynamics of different regions. As a tree-based deep learning model, the DCF algorithm integrates the robustness of tree models with the feature representation learning capability of deep learning models, which enables the model to extract high-level features from driving factors to mine accurate transition rules, thus achieving high simulation accuracy without overfitting [67].
The proposed DCF-CA can attain the highest simulation accuracy with default parameter configurations. To comprehensively assess the performance of DCF-CA, we further investigated the parameter sensitivity of the model. The results indicated that the accuracy of DCF-CA fluctuates within a limited range (FoM: 22.75–25.00%) across various configurations. These findings demonstrate that the DCF-CA model is robust and not sensitive to hyperparameters, facilitating its application for land-use simulations in diverse regions.
Based on the DCF-CA model, we propose an ensemble learning-based MDI feature importance analysis method (DCF-MDI) to measure the importance of each driving factor in land-use dynamics stably and efficiently. Using the proposed DCF-MDI factor importance analysis method, we delineated the combined influence of natural and social factors on farmland dynamics in PRD. In contrast, vegetation change is primarily shaped by natural factors, while urban change is predominantly driven by human activity. Uncertainty analysis reveals that the DCF-MDI method yields more stable ranking orders and lower standard deviation of contribution weights (<0.10%) compared to the traditional RF-MDI method, indicating its robustness against random disturbances and effectiveness in elucidating the driving mechanism of land-use dynamics.
Land-use change is a complex and stochastic process influenced by many driving factors [37]. Employing deep learning technology to extract transition rules of land-use changes represents a promising approach for improving the performance of land-use simulation [16,38]. The CNN is a typical deep learning algorithm used in previous studies [16,31,49]. In this study, a VGG-based CNN network with eight layers was constructed for comparison [16]. The network architecture of CNN is intricate and sensitive, significantly impacting model performance. Despite ongoing efforts, optimizing CNN architecture remains an open problem, with no consensus on the optimal design [55]. The feature representation learning ability of a CNN after complete optimization is higher than that of a DCF. However, robustness, computational complexity, and interpretability are still problems when using CNN for land use simulation. Additionally, the trade-off between training speed and simulation accuracy requires further investigation to determine a suitable architecture. Conversely, the DCF algorithm, as a tree-based deep learning model, combines the robustness and interpretability of tree models with the feature representation learning capability of deep-learning models, which allows for it to extract high-level features from driving factors without overfitting, thus achieving high simulation accuracy [94]. Moreover, the proposed DCF-MDI factor importance analysis method addresses the limitation of interpretability associated with black-box CNN methods [67].
There are still some limitations in this study. The neighborhood influence of driving factors plays a crucial role in mining transition rules, which can be extracted by a CNN-based feature extractor [49]. However, in this study, the neighborhood effect of driving factors was ignored in the DCF-CA model due to the high time cost of parameter tuning in the CNN model. In the future, integrating the DCF-CA and optimized CNN models may improve land-use simulation accuracy. Moreover, the proposed DCF-MDI factor importance analysis method effectively mitigates the impact of random disturbance on the traditional MDI method, achieving higher stability with a simple ensemble learning strategy. However, since many high-level features are generated in the DCF model, tracing the information flow from original features to high-level features layer by layer may further improve the feature importance calculation process [95]. Furthermore, in this study, the spatial resolution of all datasets was resampled to facilitate efficient modeling of the CA models. However, the potential impact of spatial resolution on simulation accuracy and factor importance analysis remains unknown. In the future, it is necessary to investigate the impact of data resolution on land-use change modeling to improve land-use simulations and driving factors analysis [96]. Moreover, due to the challenges of obtaining dynamic driving factors, static driving factors are commonly employed in land-use change modeling [24,97]. Similarly, this study utilized static environment and socioeconomic factors for multiple land-use simulations and driving factors analysis, which may introduce bias in understanding land-use dynamics. In the future, constructing a hybrid environment–economy–land simulation model could further enhance our understanding of cooperative dynamics of land use [98].
In summary, the DCF-CA model proposed in this study overcomes limitations in obtaining accurate transition rules and reliable interpretations simultaneously for multiple land-use simulations. Given the acceleration of climate change, simulating land-use changes and uncovering their underlying driving mechanisms play an increasingly important role in addressing challenges to sustainable development. The proposed DCF-CA model, demonstrating high simulation accuracy, strong robustness, and reliable interpretability, can provide substantial support for sustainable land use management.
Author Contributions
Conceptualization, H.Z. and X.L.; Formal analysis, H.Z., X.L., Y.Y. and B.L.; Funding acquisition, X.L.; Methodology, H.Z., X.L. and W.L.; Project administration, X.L.; Resources, X.L.; Validation, B.L. and C.W.; Writing—original draft, H.Z.; Writing—review and editing, H.Z., X.L., Y.Y., B.L., C.W. and W.L. All authors have read and agreed to the published version of the manuscript.
Funding
This research was funded by the National Science Fund for Distinguished Young Scholars of China (Grant no. 42225107) and the Scientific Research Foundation for the Talents of Jiaying University (Grant no. 2023RC66).
Data Availability Statement
The data presented in this study are openly available in FigShare at https://figshare.com/s/d239cbdc4a13a83cfbab (accessed on 26 July 2024).
Conflicts of Interest
The authors declare no conflicts of interest.
Appendix A
Table A1.
Diverse natural environmental and socioeconomic driving factors used in this study.
Table A1.
Diverse natural environmental and socioeconomic driving factors used in this study.
| No. | Name | Abbreviation | Resolution | Source |
|---|---|---|---|---|
| 1 | Elevation | ele | 30 m | ALOS |
| 2 | Slope | slo | 30 m | ALOS |
| 3 | Distance to rivers | disRiv | Vector | OSM river |
| 4 | Annual average temperature | mTem | 1 km | WorldClim2 |
| 5 | Annual average precipitation | mPre | 1 km | WorldClim2 |
| 6 | Seasonal temperature variation | sTem | 1 km | WorldClim2 |
| 7 | Seasonal precipitation variation | sPre | 1 km | WorldClim2 |
| 8 | Distance to provincial capitals | disCap | 1 km | Gaode POI |
| 9 | Distance to city centers | disCit | Vector | Gaode POI |
| 10 | Distance to county centers | disCou | Vector | Gaode POI |
| 11 | Distance to airports | disAir | Vector | Gaode POI |
| 12 | Distance to expressways | disExp | Vector | OSM road |
| 13 | Distance to ordinary roads | disOrd | Vector | OSM road |
Table A2.
Conversion cost matrix of various land types.
Table A2.
Conversion cost matrix of various land types.
| Land-Use Types | Farmland | Vegetation | Water | Urban |
|---|---|---|---|---|
| Farmland | 0 | 0 | 1 | 0 |
| Vegetation | 0 | 0 | 1 | 0 |
| Water | 1 | 1 | 0 | 1 |
| Urban | 1 | 1 | 1 | 0 |
References
- Huber, V.; Neher, I.; Bodirsky, B.L.; Höfner, K.; Schellnhuber, H.J. Will the World Run out of Land? A Kaya-Type Decomposition to Study Past Trends of Cropland Expansion. Environ. Res. Lett. 2014, 9, 024011. [Google Scholar] [CrossRef]
- Barretto, A.G.O.P.; Berndes, G.; Sparovek, G.; Wirsenius, S. Agricultural Intensification in Brazil and Its Effects on Land-Use Patterns: An Analysis of the 1975–2006 Period. Glob. Chang. Biol. 2013, 19, 1804–1815. [Google Scholar] [CrossRef]
- Qian, S.; Wang, L.Y.; Gong, X.F. Climate Change and Its Effects on Grassland Productivity and Carrying Capacity of Livestock in the Main Grasslands of China. Rangel. J. 2012, 34, 341–347. [Google Scholar] [CrossRef]
- Phelps, L.N.; Kaplan, J.O. Land Use for Animal Production in Global Change Studies: Defining and Characterizing a Framework. Glob. Chang. Biol. 2017, 23, 4457–4471. [Google Scholar] [CrossRef]
- Meyfroidt, P.; Lambin, E.F. Global Forest Transition: Prospects for an End to Deforestation. Annu. Rev. Environ. Resour. 2011, 36, 343–371. [Google Scholar] [CrossRef]
- De Sy, V.; Herold, M.; Achard, F.; Beuchle, R.; Clevers, J.; Lindquist, E.; Verchot, L. Land Use Patterns and Related Carbon Losses Following Deforestation in South America. Environ. Res. Lett. 2015, 10, 124004. [Google Scholar]
- Liu, X.; Huang, Y.; Xu, X.; Li, X.; Li, X.; Ciais, P.; Lin, P.; Gong, K.; Ziegler, A.D.; Chen, A.; et al. High-Spatiotemporal-Resolution Mapping of Global Urban Change from 1985 to 2015. Nat. Sustain. 2020, 3, 564–570. [Google Scholar] [CrossRef]
- Darrel Jenerette, G.; Potere, D. Global Analysis and Simulation of Land-Use Change Associated with Urbanization. Landsc. Ecol. 2010, 25, 657–670. [Google Scholar] [CrossRef]
- Sonter, L.J.; Moran, C.J.; Barrett, D.J.; Soares-Filho, B.S. Processes of Land Use Change in Mining Regions. J. Clean. Prod. 2014, 84, 494–501. [Google Scholar] [CrossRef]
- Worlanyo, A.S.; Jiangfeng, L. Evaluating the Environmental and Economic Impact of Mining for Post-Mined Land Restoration and Land-Use: A Review. J. Environ. Manag. 2021, 279, 111623. [Google Scholar] [CrossRef]
- Ouyang, Z.; Zheng, H.; Xiao, Y.; Polasky, S.; Liu, J.; Xu, W.; Wang, Q.; Zhang, L.; Xiao, Y.; Rao, E.; et al. Improvements in Ecosystem Services from Investments in Natural Capital. Science 2016, 352, 1455–1459. [Google Scholar] [CrossRef] [PubMed]
- Mcdonald, R.I.; Kareiva, P.; Forman, R.T.T. The Implications of Current and Future Urbanization for Global Protected Areas and Biodiversity Conservation. Biol. Conserv. 2008, 141, 1695–1703. [Google Scholar] [CrossRef]
- Rentschler, J.; Avner, P.; Marconcini, M.; Su, R.; Strano, E.; Vousdoukas, M.; Hallegatte, S. Global Evidence of Rapid Urban Growth in Flood Zones since 1985. Nature 2023, 622, 87–92. [Google Scholar] [CrossRef] [PubMed]
- Luo, M.; Wu, S.; Ngar-Cheung Lau, G.; Pei, T.; Liu, Z.; Wang, X.; Ning, G.; Chan, T.O.; Yang, Y.; Zhang, W. Anthropogenic Forcing Has Increased the Risk of Longer-Traveling and Slower-Moving Large Contiguous Heatwaves. Sci. Adv. 2024, 10, eadl1598. [Google Scholar] [CrossRef] [PubMed]
- Fu, Y.; Huang, M.; Gong, D.; Lin, H.; Fan, Y.; Du, W. Dynamic Simulation and Prediction of Carbon Storage Based on Land Use/Land Cover Change from 2000 to 2040: A Case Study of the Nanchang Urban Agglomeration. Remote Sens. 2023, 15, 4645. [Google Scholar] [CrossRef]
- He, J.; Li, X.; Yao, Y.; Hong, Y.; Jinbao, Z. Mining Transition Rules of Cellular Automata for Simulating Urban Expansion by Using the Deep Learning Techniques. Int. J. Geogr. Inf. Sci. 2018, 32, 2076–2097. [Google Scholar] [CrossRef]
- Li, X.; Chen, G.; Liu, X.; Liang, X.; Wang, S.; Chen, Y.; Pei, F.; Xu, X. A New Global Land-Use and Land-Cover Change Product at a 1-Km Resolution for 2010 to 2100 Based on Human–Environment Interactions. Ann. Am. Assoc. Geogr. 2017, 107, 1040–1059. [Google Scholar] [CrossRef]
- Chen, G.; Li, X.; Liu, X.; Chen, Y.; Liang, X.; Leng, J.; Xu, X.; Liao, W.; Qiu, Y.; Wu, Q.; et al. Global Projections of Future Urban Land Expansion under Shared Socioeconomic Pathways. Nat. Commun. 2020, 11, 537. [Google Scholar] [CrossRef]
- Liao, W.; Liu, X.; Xu, X.; Chen, G.; Liang, X.; Zhang, H.; Li, X. Projections of Land Use Changes under the Plant Functional Type Classification in Different SSP-RCP Scenarios in China. Sci. Bull. 2020, 65, 1935–1947. [Google Scholar] [CrossRef]
- Wang, K.; He, T.; Xiao, W.; Yang, R. Projections of Future Spatiotemporal Urban 3D Expansion in China under Shared Socioeconomic Pathways. Landsc. Urban Plan. 2024, 247, 105043. [Google Scholar] [CrossRef]
- Li, X.; Chen, Y.; Liu, X.; Xu, X.; Chen, G. Experiences and Issues of Using Cellular Automata for Assisting Urban and Regional Planning in China. Int. J. Geogr. Inf. Sci. 2017, 31, 1606–1629. [Google Scholar] [CrossRef]
- Wang, H.; Guo, J.; Zhang, B.; Zeng, H. Simulating Urban Land Growth by Incorporating Historical Information into a Cellular Automata Model. Landsc. Urban Plan. 2021, 214, 104168. [Google Scholar] [CrossRef]
- Lu, W.; Zhang, D.; Ren, Q.; Qi, T.; He, C. Impacts of Future Urban Expansion on Natural Habitats Will Intensify in China: Scenario Analysis with the Improved LUSD-Urban Model. Landsc. Ecol. 2023, 38, 2547–2567. [Google Scholar] [CrossRef]
- Liu, X.; Liang, X.; Li, X.; Xu, X.; Ou, J.; Chen, Y.; Li, S.; Wang, S.; Pei, F. A Future Land Use Simulation Model (FLUS) for Simulating Multiple Land Use Scenarios by Coupling Human and Natural Effects. Landsc. Urban Plan. 2017, 168, 94–116. [Google Scholar] [CrossRef]
- Liang, X.; Guan, Q.; Clarke, K.C.; Liu, S.; Wang, B.; Yao, Y. Understanding the Drivers of Sustainable Land Expansion Using a Patch-Generating Land Use Simulation (PLUS) Model: A Case Study in Wuhan, China. Comput. Environ. Urban Syst. 2021, 85, 101569. [Google Scholar] [CrossRef]
- Feng, Y.; Tong, X. A New Cellular Automata Framework of Urban Growth Modeling by Incorporating Statistical and Heuristic Methods. Int. J. Geogr. Inf. Sci. 2020, 34, 74–97. [Google Scholar] [CrossRef]
- Zhang, B.; Li, X.; Wang, H.; He, S.; Zeng, H.; Cao, X.; Song, Y.; Tung, C.L.; Hu, S. Modeling Self-Organized Urban Growth by Incorporating Stakeholders’ Interactions into the Neighborhood of Cellular Automata. Cities 2024, 149, 104976. [Google Scholar] [CrossRef]
- Zeng, L.; Liu, X.; Li, W.; Ou, J.; Cai, Y.; Chen, G.; Li, M.; Li, G.; Zhang, H.; Xu, X. Global Simulation of Fine Resolution Land Use/Cover Change and Estimation of Aboveground Biomass Carbon under the Shared Socioeconomic Pathways. J. Environ. Manag. 2022, 312, 114943. [Google Scholar] [CrossRef] [PubMed]
- Zhuang, H.; Chen, G.; Yan, Y.; Li, B.; Zeng, L.; Ou, J.; Liu, K.; Liu, X. Simulation of Urban Land Expansion in China at 30 m Resolution through 2050 under Shared Socioeconomic Pathways. GISci. Remote Sens. 2022, 59, 1301–1320. [Google Scholar] [CrossRef]
- Liang, X.; Guan, Q.; Clarke, K.C.; Chen, G.; Guo, S.; Yao, Y. Mixed-Cell Cellular Automata: A New Approach for Simulating the Spatio-Temporal Dynamics of Mixed Land Use Structures. Landsc. Urban Plan. 2021, 205, 103960. [Google Scholar] [CrossRef]
- Wu, X.; Liu, X.; Zhang, D.; Zhang, J.; He, J.; Xu, X. Simulating Mixed Land-Use Change under Multi-Label Concept by Integrating a Convolutional Neural Network and Cellular Automata: A Case Study of Huizhou, China. GISci. Remote Sens. 2022, 59, 609–632. [Google Scholar] [CrossRef]
- Chen, Y.; Liu, X.; Li, X. Calibrating a Land Parcel Cellular Automaton (LP-CA) for Urban Growth Simulation Based on Ensemble Learning. Int. J. Geogr. Inf. Sci. 2017, 31, 2480–2504. [Google Scholar] [CrossRef]
- Zhang, B.; Hu, S.; Wang, H.; Yang, J.; Wang, Z. Incorporating Spatial Heterogeneity to Model Spontaneous and Self-Organized Urban Growth. Appl. Geogr. 2024, 163, 103196. [Google Scholar] [CrossRef]
- Song, Y.; Wang, H.; Zhang, B.; Zeng, H.; Li, J.; Zhang, J. A Methodology to Geographic Cellular Automata Model Accounting for Spatial Heterogeneity and Adaptive Neighborhoods. Int. J. Geogr. Inf. Sci. 2024, 38, 699–725. [Google Scholar] [CrossRef]
- Zhang, B.; Xia, C. The Effects of Sample Size and Sample Prevalence on Cellular Automata Simulation of Urban Growth. Int. J. Geogr. Inf. Sci. 2022, 36, 158–187. [Google Scholar] [CrossRef]
- Bastos Moroz, C.; Sieg, T.; Thieken, A.H. Spatial Constraints in Cellular Automata-Based Urban Growth Models: A Systematic Comparison of Classifiers and Input Urban Maps. Comput. Environ. Urban Syst. 2024, 110, 102118. [Google Scholar] [CrossRef]
- Allan, A.; Soltani, A.; Abdi, M.H.; Zarei, M. Driving Forces behind Land Use and Land Cover Change: A Systematic and Bibliometric Review. Land 2022, 11, 1222. [Google Scholar] [CrossRef]
- Zhuang, H.; Liu, X.; Yan, Y.; Zhang, D.; He, J.; He, J.; Zhang, X.; Zhang, H.; Li, M. Integrating a Deep Forest Algorithm with Vector-Based Cellular Automata for Urban Land Change Simulation. Trans. GIS 2022, 26, 2056–2080. [Google Scholar] [CrossRef]
- Soares-Filho, B.S.; Cerqueira, G.C.; Pennachin, C.L. DINAMICA—A Stochastic Cellular Automata Model Designed to Simulate the Landscape Dynamics in an Amazonian Colonization Frontier. Ecol. Modell. 2002, 154, 217–235. [Google Scholar] [CrossRef]
- Chen, S.; Feng, Y.; Tong, X.; Liu, S.; Xie, H.; Gao, C.; Lei, Z. Modeling ESV Losses Caused by Urban Expansion Using Cellular Automata and Geographically Weighted Regression. Sci. Total Environ. 2020, 712, 136509. [Google Scholar] [CrossRef]
- Li, X.; Yeh, A.G.O. Neural-Network-Based Cellular Automata for Simulating Multiple Land Use Changes Using GIS. Int. J. Geogr. Inf. Sci. 2002, 16, 323–343. [Google Scholar] [CrossRef]
- Yang, Q.; Li, X.; Shi, X. Cellular Automata for Simulating Land Use Changes Based on Support Vector Machines. Comput. Geosci. 2008, 34, 592–602. [Google Scholar] [CrossRef]
- Zhang, Y.; Liu, X.; Chen, G.; Hu, G. Simulation of Urban Expansion Based on Cellular Automata and Maximum Entropy Model. Sci. China Earth Sci. 2020, 63, 701–712. [Google Scholar] [CrossRef]
- Al-Sharif, A.A.A.; Pradhan, B. A Novel Approach for Predicting the Spatial Patterns of Urban Expansion by Combining the Chi-Squared Automatic Integration Detection Decision Tree, Markov Chain and Cellular Automata Models in GIS. Geocarto Int. 2015, 30, 858–881. [Google Scholar] [CrossRef]
- Zhang, D.; Liu, X.; Wu, X.; Yao, Y.; Wu, X.; Chen, Y. Multiple Intra-Urban Land Use Simulations and Driving Factors Analysis: A Case Study in Huicheng, China. GISci. Remote Sens. 2019, 56, 282–308. [Google Scholar] [CrossRef]
- Huang, M.; Gong, D.; Zhang, L.; Lin, H.; Chen, Y.; Zhu, D.; Xiao, C.; Altan, O. Spatiotemporal Dynamics and Forecasting of Ecological Security Pattern under the Consideration of Protecting Habitat: A Case Study of the Poyang Lake Ecoregion. Int. J. Digit. Earth 2024, 17, 2376277. [Google Scholar] [CrossRef]
- Liang, X.; Liu, X.; Chen, G.; Leng, J.; Wen, Y.; Chen, G. Coupling Fuzzy Clustering and Cellular Automata Based on Local Maxima of Development Potential to Model Urban Emergence and Expansion in Economic Development Zones. Int. J. Geogr. Inf. Sci. 2020, 34, 1930–1952. [Google Scholar] [CrossRef]
- Xiao, R.; Yu, X.; Zhang, Z.; Wang, X. Built-up Land Expansion Simulation with Combination of Naive Bayes and Cellular Automaton Model—A Case Study of the Shanghai-Hangzhou Bay Agglomeration. Growth Chang. 2021, 52, 1804–1825. [Google Scholar] [CrossRef]
- Zhai, Y.; Yao, Y.; Guan, Q.; Liang, X.; Li, X.; Pan, Y.; Yue, H.; Yuan, Z.; Zhou, J. Simulating Urban Land Use Change by Integrating a Convolutional Neural Network with Vector-Based Cellular Automata. Int. J. Geogr. Inf. Sci. 2020, 34, 1475–1499. [Google Scholar] [CrossRef]
- Wang, J.; Hadjikakou, M.; Hewitt, R.J.; Bryan, B.A. Simulating Large-Scale Urban Land-Use Patterns and Dynamics Using the U-Net Deep Learning Architecture. Comput. Environ. Urban Syst. 2022, 97, 101855. [Google Scholar] [CrossRef]
- Xing, W.; Qian, Y.; Guan, X.; Yang, T.; Wu, H. A Novel Cellular Automata Model Integrated with Deep Learning for Dynamic Spatio-Temporal Land Use Change Simulation. Comput. Geosci. 2020, 137, 104430. [Google Scholar] [CrossRef]
- Xiao, B.; Liu, J.; Jiao, J.; Li, Y.; Liu, X.; Zhu, W. Modeling Dynamic Land Use Changes in the Eastern Portion of the Hexi Corridor, China by Cnn-Gru Hybrid Model. GISci. Remote Sens. 2022, 59, 501–519. [Google Scholar] [CrossRef]
- Zhou, Z.; Chen, Y.; Liu, X.; Zhang, X.; Zhang, H. A Maps-to-Maps Approach for Simulating Urban Land Expansion Based on Convolutional Long Short-Term Memory Neural Networks. Int. J. Geogr. Inf. Sci. 2024, 38, 503–526. [Google Scholar] [CrossRef]
- Zhu, Y.; Geiß, C.; So, E.; Bardhan, R.; Taubenböck, H.; Jin, Y. Urban Expansion Simulation with an Explainable Ensemble Deep Learning Framework. Heliyon 2024, 10, e28318. [Google Scholar] [CrossRef] [PubMed]
- He, K.; Zhang, X.; Ren, S.; Sun, J. Deep Residual Learning for Image Recognition. In Proceedings of the IEEE Computer Society Conference on Computer Vision and Pattern Recognition, Las Vegas, NV, USA, 27–30 June 2016; IEEE: Las Vegas, NV, USA, 2016; Volume 2016, pp. 770–778. [Google Scholar]
- Kattenborn, T.; Leitloff, J.; Schiefer, F.; Hinz, S. Review on Convolutional Neural Networks (CNN) in Vegetation Remote Sensing. ISPRS J. Photogramm. Remote Sens. 2021, 173, 24–49. [Google Scholar] [CrossRef]
- Zhuang, H.; Liu, X.; Liang, X.; Yan, Y.; He, J.; Cai, Y.; Wu, C.; Zhang, X.; Zhang, H. Tensor-CA: A High-Performance Cellular Automata Model for Land Use Simulation Based on Vectorization and GPU. Trans. GIS 2022, 26, 755–778. [Google Scholar] [CrossRef]
- Cao, M.; Tang, G.; Shen, Q.; Wang, Y. A New Discovery of Transition Rules for Cellular Automata by Using Cuckoo Search Algorithm. Int. J. Geogr. Inf. Sci. 2015, 29, 806–824. [Google Scholar] [CrossRef]
- Sneath, D. State Policy and Pasture Degradation in Inner Asia. Science 1998, 281, 1147–1148. [Google Scholar] [CrossRef]
- Serra, P.; Pons, X.; Saurí, D. Land-Cover and Land-Use Change in a Mediterranean Landscape: A Spatial Analysis of Driving Forces Integrating Biophysical and Human Factors. Appl. Geogr. 2008, 28, 189–209. [Google Scholar] [CrossRef]
- Zhao, R.; Chen, Y.; Shi, P.; Zhang, L.; Pan, J.; Zhao, H. Land Use and Land Cover Change and Driving Mechanism in the Arid Inland River Basin: A Case Study of Tarim River, Xinjiang, China. Environ. Earth Sci. 2013, 68, 591–604. [Google Scholar] [CrossRef]
- Du, M.; Liu, N.; Hu, X. Techniques for Interpretable Machine Learning. Commun. ACM 2019, 63, 68–77. [Google Scholar] [CrossRef]
- Pei, L.; Lai, Y.; Piao, P.; Yang, F. Margin Based Permutation Variable Importance: A Stable Importance Measure for Random Forest. In Proceedings of the 2017 12th International Conference on Intelligent Systems and Knowledge Engineering (ISKE 2017), Nanjing, China, 24–26 November 2017; Volume 2018, pp. 1–8. [Google Scholar]
- Lundberg, S.M.; Lee, S.I. A Unified Approach to Interpreting Model Predictions. In Proceedings of the Advances in Neural Information Processing Systems, Long Beach, CA, USA, 4–9 December 2017; Volume 2017, pp. 4766–4775. [Google Scholar]
- Wu, H.; Lin, A.; Xing, X.; Song, D.; Li, Y. Identifying Core Driving Factors of Urban Land Use Change from Global Land Cover Products and POI Data Using the Random Forest Method. Int. J. Appl. Earth Obs. Geoinf. 2021, 103, 102475. [Google Scholar] [CrossRef]
- Zhang, F.; Yang, X. Improving Land Cover Classification in an Urbanized Coastal Area by Random Forests: The Role of Variable Selection. Remote Sens. Environ. 2020, 251, 112105. [Google Scholar] [CrossRef]
- Zhou, Z.H.; Feng, J. Deep Forest. Natl. Sci. Rev. 2019, 6, 74–86. [Google Scholar] [CrossRef] [PubMed]
- Zhang, Y.-L.; Zhou, J.; Zheng, W.; Feng, J.; Li, L.; Liu, Z.; Li, M.; Zhang, Z.; Chen, C.; Li, X.; et al. Distributed Deep Forest and Its Application to Automatic Detection of Cash-Out Fraud. ACM Trans. Intell. Syst. Technol. 2019, 10, 55. [Google Scholar] [CrossRef]
- Yin, L.; Sun, Z.; Gao, F.; Liu, H. Deep Forest Regression for Short-Term Load Forecasting of Power Systems. IEEE Access 2020, 8, 49090–49099. [Google Scholar] [CrossRef]
- Zhao, K.; Xu, Z.; Zhang, T.Z.; Tang, Y.; Yan, M. Simplified Deep Forest Model Based Just-in-Time Defect Prediction for Android Mobile Apps. IEEE Trans. Reliab. 2021, 70, 848–859. [Google Scholar] [CrossRef]
- Sun, L.; Mo, Z.; Yan, F.; Xia, L.; Shan, F.; Ding, Z.; Song, B.; Gao, W.; Shao, W.; Shi, F.; et al. Adaptive Feature Selection Guided Deep Forest for COVID-19 Classification with Chest CT. IEEE J. Biomed. Health Inform. 2020, 24, 2798–2805. [Google Scholar] [CrossRef]
- Yang, J.; Tang, W.; Gong, J.; Shi, R.; Zheng, M.; Dai, Y. Simulating Urban Expansion Using Cellular Automata Model with Spatiotemporally Explicit Representation of Urban Demand. Landsc. Urban Plan. 2023, 231, 104640. [Google Scholar] [CrossRef]
- Liu, J.; Zhang, Z.; Xu, X.; Kuang, W.; Zhou, W.; Zhang, S.; Li, R.; Yan, C.; Yu, D.; Wu, S.; et al. Spatial Patterns and Driving Forces of Land Use Change in China during the Early 21st Century. J. Geogr. Sci. 2010, 20, 483–494. [Google Scholar] [CrossRef]
- Kuang, W.; Liu, J.; Dong, J.; Chi, W.; Zhang, C. The Rapid and Massive Urban and Industrial Land Expansions in China between 1990 and 2010: A CLUD-Based Analysis of Their Trajectories, Patterns, and Drivers. Landsc. Urban Plan. 2016, 145, 21–33. [Google Scholar] [CrossRef]
- Chen, Y.; Li, X.; Liu, X.; Zhang, Y.; Huang, M. Tele-Connecting China’s Future Urban Growth to Impacts on Ecosystem Services under the Shared Socioeconomic Pathways. Sci. Total Environ. 2019, 652, 765–779. [Google Scholar] [CrossRef]
- Chen, G.; Li, X.; Liu, X. Global Land Projection Based on Plant Functional Types with a 1-Km Resolution under Socio-Climatic Scenarios. Sci. Data 2022, 9, 125. [Google Scholar] [CrossRef] [PubMed]
- Chen, G.; Zhuang, H.; Liu, X.; Chen, G. Cell-Level Coupling of a Mechanistic Model to Cellular Automata for Improving Land Simulation Land Simulation. GISci. Remote Sens. 2023, 60, 2166443. [Google Scholar] [CrossRef]
- Tadono, T.; Ishida, H.; Oda, F.; Naito, S.; Minakawa, K.; Iwamoto, H. Precise Global DEM Generation by ALOS PRISM. ISPRS Ann. Photogramm. Remote Sens. Spat. Inf. Sci. 2014, 2, 71. [Google Scholar] [CrossRef]
- Fick, S.E.; Hijmans, R.J. WorldClim 2: New 1-Km Spatial Resolution Climate Surfaces for Global Land Areas. Int. J. Climatol. 2017, 37, 4302–4315. [Google Scholar] [CrossRef]
- Yao, Y.; Liu, X.; Li, X.; Liu, P.; Hong, Y.; Zhang, Y.; Mai, K. Simulating Urban Land-Use Changes at a Large Scale by Integrating Dynamic Land Parcel Subdivision and Vector-Based Cellular Automata. Int. J. Geogr. Inf. Sci. 2017, 31, 2452–2479. [Google Scholar] [CrossRef]
- Geurts, P.; Ernst, D.; Wehenkel, L. Extremely Randomized Trees. Mach. Learn. 2006, 63, 3–42. [Google Scholar] [CrossRef]
- Liu, X.; Wang, R.; Cai, Z.; Cai, Y.; Yin, X. Deep Multigrained Cascade Forest for Hyperspectral Image Classification. IEEE Trans. Geosci. Remote Sens. 2019, 57, 8169–8183. [Google Scholar] [CrossRef]
- Louppe, G.; Wehenkel, L.; Sutera, A.; Geurts, P. Understanding Variable Importances in Forests of Randomized Trees. In Proceedings of the 26th International Conference on Neural Information Processing Systems-Volume 1, Lake Tahoe, NV, USA, 5–10 December 2013; Volume 2013, pp. 431–439. [Google Scholar]
- Calle, M.L.; Urrea, V. Stability of Random Forest Importance Measures. Brief. Bioinform. 2011, 12, 86–89. [Google Scholar] [CrossRef]
- Lv, J.; Wang, Y.; Liang, X.; Yao, Y.; Ma, T.; Guan, Q. Simulating Urban Expansion by Incorporating an Integrated Gravitational Field Model into a Demand-Driven Random Forest-Cellular Automata Model. Cities 2021, 109, 103044. [Google Scholar] [CrossRef]
- Zhang, B.; Wang, H. A New Type of Dual-Scale Neighborhood Based on Vectorization for Cellular Automata Models. GISci. Remote Sens. 2021, 58, 386–404. [Google Scholar] [CrossRef]
- Chen, Y.; Li, X.; Wang, S.; Liu, X.; Ai, B. Simulating Urban Form and Energy Consumption in the Pearl River Delta under Different Development Strategies. Ann. Assoc. Am. Geogr. 2013, 103, 1567–1585. [Google Scholar] [CrossRef]
- Tong, X.; Feng, Y. A Review of Assessment Methods for Cellular Automata Models of Land-Use Change and Urban Growth. Int. J. Geogr. Inf. Sci. 2020, 34, 866–898. [Google Scholar] [CrossRef]
- Pontius, R.G.; Walker, R.; Yao-kumah, R.; Arima, E.; Aldrich, S.; Caldas, M.; Vergara, D. Accuracy Assessment for a Simulation Model of Amazonian Deforestation. Ann. Assoc. Am. Geogr. 2007, 97, 677–695. [Google Scholar] [CrossRef]
- Liu, X.; Li, X.; Liu, L.; He, J.; Ai, B. A Bottom-up Approach to Discover Transition Rules of Cellular Automata Using Ant Intelligence. Int. J. Geogr. Inf. Sci. 2008, 22, 1247–1269. [Google Scholar] [CrossRef]
- Gounaridis, D.; Chorianopoulos, I.; Symeonakis, E.; Koukoulas, S. A Random Forest-Cellular Automata Modelling Approach to Explore Future Land Use/Cover Change in Attica (Greece), under Different Socio-Economic Realities and Scales. Sci. Total Environ. 2019, 646, 320–335. [Google Scholar] [CrossRef]
- Li, X.; Chen, Y. Projecting the Future Impacts of China’s Cropland Balance Policy on Ecosystem Services under the Shared Socioeconomic Pathways. J. Clean. Prod. 2020, 250, 119489. [Google Scholar] [CrossRef]
- Brown, D.G.; Page, S.; Riolo, R.; Zellner, M.; Rand, W. Path Dependence and the Validation of Agent-Based Spatial Models of Land Use. Int. J. Geogr. Inf. Sci. 2005, 19, 153–174. [Google Scholar] [CrossRef]
- Ganaie, M.A.; Hu, M.; Malik, A.K.; Tanveer, M.; Suganthan, P.N. Ensemble Deep Learning: A Review. Eng. Appl. Artif. Intell. 2022, 115, 105151. [Google Scholar] [CrossRef]
- He, Y.-X.; Lyu, S.-H.; Jiang, Y. Interpreting Deep Forest through Feature Contribution and MDI Feature Importance. ACM Trans. Knowl. Discov. Data 2024. [Google Scholar] [CrossRef]
- Li, X.; Chen, G.; Zhang, Y.; Yu, L.; Du, Z.; Hu, G.; Liu, X. The Impacts of Spatial Resolutions on Global Urban-Related Change Analyses and Modeling. iScience 2022, 25, 105660. [Google Scholar] [CrossRef] [PubMed]
- Chen, G.; Xie, J.; Li, W.; Li, X.; Hay Chung, L.C.; Ren, C.; Liu, X. Future “Local Climate Zone” Spatial Change Simulation in Greater Bay Area under the Shared Socioeconomic Pathways and Ecological Control Line. Build. Environ. 2021, 203, 108077. [Google Scholar] [CrossRef]
- Tu, W.; Gao, W.; Li, M.; Yao, Y.; He, B.; Huang, Z.; Zhang, J.; Guo, R. Spatial Cooperative Simulation of Land Use-Population-Economy in the Greater Bay Area, China. Int. J. Geogr. Inf. Sci. 2024, 38, 381–406. [Google Scholar] [CrossRef]


Disclaimer/Publisher’s Note: The statements, opinions and data contained in all publications are solely those of the individual author(s) and contributor(s) and not of MDPI and/or the editor(s). MDPI and/or the editor(s) disclaim responsibility for any injury to people or property resulting from any ideas, methods, instructions or products referred to in the content. |
© 2024 by the authors. Licensee MDPI, Basel, Switzerland. This article is an open access article distributed under the terms and conditions of the Creative Commons Attribution (CC BY) license (https://creativecommons.org/licenses/by/4.0/).