Article

Predictions of Aboveground Herbaceous Production from Satellite-Derived APAR Are More Sensitive to Ecosite than Grazing Management Strategy in Shortgrass Steppe

by
Erika S. Peirce
1,
Sean P. Kearney
1,
Nikolas Santamaria
2,
David J. Augustine
1 and
Lauren M. Porensky
1,*
1
Rangeland Resources and Systems Research Unit, US Department of Agriculture (USDA)—Agricultural Research Service (ARS), Fort Collins, CO 80526, USA
2
Applied Data Science Program, New College of Florida, Sarasota, FL 34243, USA
*
Author to whom correspondence should be addressed.
Remote Sens. 2024, 16(15), 2780; https://doi.org/10.3390/rs16152780
Submission received: 16 May 2024 / Revised: 15 July 2024 / Accepted: 24 July 2024 / Published: 30 July 2024

Abstract

:
The accurate estimation of aboveground net herbaceous production (ANHP) is crucial in rangeland management and monitoring. Remote and rural rangelands typically lack direct observation infrastructure, making satellite-derived methods essential. When ground data are available, a simple and effective way to estimate ANHP from satellites is to derive the empirical relationship between ANHP and plant-absorbed photosynthetically active radiation (APAR), which can be estimated from the normalized difference vegetation index (NDVI). While there is some evidence that this relationship will differ across rangeland vegetation types, it is unclear whether this relationship will change across grazing management regimes. This study aimed to assess the impact of grazing management on the relationship between ground-observed ANHP and satellite-derived APAR, considering variations in plant communities across ecological sites in the shortgrass steppe of northeastern Colorado. Additionally, we compared satellite-predicted biomass production from the process-based Rangeland Analysis Platform (RAP) model to our empirical APAR-based model. We found that APAR could be used to predict ANHP in the shortgrass steppe, with the relationship being influenced by ecosite characteristics rather than grazing management practices. For each unit of added APAR (MJ m−2 day−1), ANHP increased by 9.39 kg ha−1, and ecosites with taller structured herbaceous vegetation produced, on average, 3.92–5.71 kg ha−1 more ANHP per unit APAR than an ecosite dominated by shorter vegetation. This was likely due to the increased allocation of plant resources aboveground for C3 mid-grasses in taller structured ecosites compared to the C4 short-grasses that dominate the shorter structured ecosites. Moreover, we found that our locally calibrated empirical model generally performed better than the continentally calibrated process-based RAP model, though RAP performed reasonably well for the dominant ecosite. For our empirical models, R2 values varied by ecosite ranging from 0.49 to 0.67, while RAP R2 values ranged from 0.07 to 0.4. Managers in the shortgrass steppe can use satellites to estimate herbaceous production even without detailed information on short-term grazing management practices. The results from our study underscore the importance of understanding plant community composition for enhancing the accuracy of remotely sensed predictions of ANHP.

1. Introduction

Rangelands include vast expanses of grassland, savanna, shrubland, desert, and tundra on which the indigenous vegetation is predominantly grasses, forbs, or shrubs and which are often managed in terms of the abundance and distribution of native and domestic herbivores. Rangelands cover about 50% of the Earth’s land surface [1], provide 70% of the forage for ruminant livestock [2], and are often located in remote, rural areas. Aboveground net herbaceous production (ANHP) estimates are critical to many rangeland management and monitoring efforts. They are used to estimate potential carrying capacity for herbivores [3], understand the effects of management decisions and natural drivers on ecosystem structure and function [4,5], predict fire risk and behavior [6,7], inform grazing management decisions [8], and calibrate and validate ecological models (e.g., carbon cycling, wildlife habitat; [9]). Given the vast extent and remote nature of most rangelands, spatially explicit maps of ANHP are desirable to provide information for locations where intensive ground data collection is cost-prohibitive or impractical.
Satellite imagery has proven valuable for estimating production parameters such as gross primary production (GPP), net primary production (NPP), aboveground net primary production (ANPP), and ANHP (which is the herbaceous-only fraction of ANPP). Satellite-based estimates of plant production tend to rely on radiation use efficiency logic [3,10]. In short, this logic assumes that plant production is a function of the amount of incoming photosynthetically active radiation (PAR) absorbed by the plant canopy and the proportion of that radiation that is converted into plant biomass. One of the simplest approaches to estimating plant-absorbed photosynthetically active radiation (APAR) from satellites is to use the normalized difference vegetation index (NDVI), which can be calculated from the red and near-infrared reflectance bands obtained by many land surface monitoring satellites. NDVI has been shown to be related to leaf area index (LAI) [11] and the fraction of photosynthetically active radiation (fPAR) absorbed by plants [11]. By measuring or estimating incoming PAR, fPAR can be translated into APAR, which, in turn, can be used to estimate plant production by applying processed-based or empirical models [3,12].
Spatially coarse estimates of GPP from satellites have been available for decades [13]. The most widely used comes from the Moderate Resolution Imaging Spectroradiometer (MODIS) and uses the processed-based MOD17 algorithm [14,15], originally designed for global coverage at 0.5–1 km spatial resolution. Empirical models have also been tested using MODIS-derived APAR (250 m) with strong relationships at the paddock scale between cumulative APAR and ANHP estimated from ground-based clipping [3]. ANHP estimates at finer spatial scales are needed to monitor and manage heterogeneous rangeland landscapes. Fine-scale ANHP estimates are particularly important to rangeland managers since herbaceous production is directly related to available forage for livestock and provides habitat for wildlife species. Recent improvements in computational capacity and satellite coverage, combined with clever downscaling and data fusion techniques, have allowed for advancements in fine-scale estimates of ANHP using both processed-based and empirical approaches.
For example, the Rangeland Analysis Platform (RAP) builds on the MOD17 algorithm. RAP estimates APAR from Landsat NDVI (30 m) for rangelands across the United States every 16 days, then uses a process-based model to convert APAR to GPP, partition GPP by vegetation type, and ultimately estimate the portion of GPP allocated to aboveground herbaceous biomass [16]. This process is used to provide, among other things, an estimate of ANHP every 16 days at 30 m resolution [17]. In another approach, Gaffney et al. (2018) [12] used Landsat-MODIS fusion data (30 m) to estimate daily APAR from NDVI and then fit an empirical model to predict ground-clipped ANHP using integrated (cumulative) growing season APAR (iAPAR) in the shortgrass prairies of Colorado, USA. Theoretically this approach could estimate daily production at 30 m resolution, although it was only validated at peak production.
When sufficient ground data are available, empirical approaches such as that used by Gaffney et al. (2018) [12] are appealing for developing more locally specific estimates of ANHP, for example, at the ranch scale. By contrast, process-based models such as RAP require a number of assumptions about biophysical parameters (e.g., light use efficiency, respiration rates) and meteorological forcing (e.g., responses to climatic stressors). These parameters can vary by plant community or even individual species, making it challenging to produce them at locally relevant scales, both because the parameters are not always known and because information on dominant plant types is not always available in a spatially explicit form. Empirical models can be a simple way to directly use the observed relationship between iAPAR and ANHP, allowing for separate models or coefficients for different dominant plant types [3,12].
In either case, little is known about the effects of grazing by large herbivores on the relationship between satellite-derived APAR and ANHP. Herbivory can reduce, enhance, or fail to affect ANPP and ANHP, depending on plant community characteristics and the evolutionary history of herbivory [18,19,20]. For process-based models, herbivory likely changes some of the underlying biophysical assumptions used due to its effects on plant regrowth. However, it is also possible that grazing may change the assumed relationships between NDVI and LAI or NDVI and fPAR, which would affect both process-based and empirical models. For example, if grazing removes the upper canopy layers of vegetation and exposes lower layers with different reflectance properties, it may alter satellite-observed NDVI regardless of actual changes in production on the ground. Furthermore, while GPP estimates can be validated on the ground using flux towers which can capture the effects of grazing, it is more challenging to measure ANPP and ANHP in a grazed setting [21]. In grazed grasslands, ANHP is typically estimated from vegetation clipped in cages that exclude grazing during the current growing season. Therefore, production at the scale seen by satellites (i.e., grazed vegetation at the 30 m pixel scale) may be different from the production estimates used to calibrate and validate models (i.e., ungrazed biomass in a <1 m2 cage), either as a result of under-compensation (reduced production) or over-compensation (increased production) in response to grazing [20]. In central North American grasslands, ground-based estimates of ANHP also typically exclude primary production by species such as cacti (Opuntia polyacantha) and low-statured woody plants (e.g., Guterizzia sarothrae), which comprise only a small fraction of ANPP and are not grazed by livestock.
Considering the potential disparities when calibrating and developing models, we aim to expand on previous research conducted by Gaffney et al. (2018) [12] at the Central Plains Experimental Range (CPER) on the shortgrass step of northeast Colorado, USA. Here, our main objective was to determine whether grazing management affects the relationship between ANHP and satellite-derived iAPAR while accounting for differences in plant community type. For rangelands of the western United States, plant community types are strongly driven by soil properties and processes in combination with climate, which have been used to delineate “ecological sites”, or groups of mapped soil types that support similar plant communities and respond similarly to management and disturbance [22]. At both CPER and in the broader surrounding region of the shortgrass steppe, the two most widespread ecological sites are Loamy Plains [23], which is typically dominated by C4 shortgrasses (Bouteloua gracilis, B. dactyloides) with sub-dominant C3 mid-height perennial graminoids (Pascopyrum smithii, Hesperostipa comata, Carex duriscula), and Sandy Plains [24], which is typically co-dominated by C4 shortgrasses and C3 mid-height graminoids. Less widespread soil types characterized by increased alkalinity support the Salt Flats ecological site, which is dominated by C4 mid-height grasses (Sporobolus airoides, Distichlis spicata) in combination with mid-height C3 graminoids [25]. Both Sandy Plains and Salt Flats support significantly greater ANHP and more vertically oriented vegetation than the Loamy Plains ecological site [8]. As a result, our prior work developing a model relating temporal variation in iAPAR to ANHP [12] found a significantly greater slope for mid-height structured communities (Sandy Plains and Salt Flats) compared to the more prostrate plant community on Loamy Plains. However, our previous models were calibrated only using sites grazed season-long (May–Oct) at a moderate stocking rate. Where rangeland managers employ adaptive, multipaddock (AMP) rotational grazing over the growing season, the sward is expected to experience a much different temporal pattern of defoliation, which is expected to change the shape and the seasonal NDVI and APAR curves.
We evaluated two main hypotheses associated with our main objective. First, we expected that the slope of iAPAR as a predictor of ANHP would vary by ecological site. Second, we expected that grazing management would not affect the relationship between iAPAR and ANHP in this study area. Grazing seems unlikely to change the underlying relationship between NDVI and fPAR for the relatively short-structured herbaceous vegetation dominant in this region. Furthermore, previous ground-based research in semi-arid shortgrass systems has shown that, within a single growing season, the potential for substantial over- or under-compensation is limited by the semi-arid climate [26].
Our study also pursued a secondary objective, in which we compared satellite-predicted biomass production from the process-based RAP model to our empirical iAPAR-based model across different grazing management regimes and ecosites at CPER. We expected that our empirical model would better account for variation across ecosites since it is calibrated to the location and explicitly accounts for the effects of ecosite on the ANHP-iAPAR relationship. We also evaluated how the RAP model performed across ecosites and grazing management regimes since the parameters of RAP’s underlying process-based GPP model were calibrated at ungrazed grassland sites with taller structured vegetation.

2. Materials and Methods

2.1. Study Area

This research was conducted at the USDA-ARS Central Plains Experimental Range (CPER) in northeastern Colorado (40.833°N, 104.733°W), which is a Long-Term Agroecosystem Research network site [27] (Figure 1). Soil composition ranges from fine sandy loams on the upland pains to alkaline salt flats near drainages. Long-term mean annual precipitation is 340 mm, with most of this occurring between April and September [28]. The mean annual temperature is 8.6 °C, and average monthly temperatures range from 22 °C in the summer to −4 °C in the winter.
The study area is dominated by shortgrass steppe vegetation, with a mix of perennial warm-season and cool-season graminoids. Here, we examine the aboveground productivity of plant communities associated with the Loamy Plains, Sandy Plains, and Salt Flats ecological sites managed with moderate stocking rates. However, the study pastures experience very different management regimes in terms of the timing of grazing within and across growing seasons. Ten of the study pastures (130 ha each) each experience continuous, season-long grazing from mid-May to early October each year (Traditional Rangeland Management; TRM) at a moderate stocking rate. These 10 pastures were paired in terms of ecological site and topography to a second set of 10 130-ha pastures assigned to a Collaborative Adaptive Rangeland Management (CARM) treatment. CARM pastures are grazed by the same total number of cattle as the TRM pastures each year, but CARM cattle are managed as a single herd rotated among pastures during the growing season. Details of the cattle management strategy applied to the CARM pastures were decided by an 11-member stakeholder group that developed an initial grazing management plan in 2013 and subsequently met three times annually to review results from prior grazing seasons and decide on the stocking rate and grazing sequence for the subsequent grazing season based on a suite of criteria tied to management objectives [29,30]. Within the CARM treatment, one or more of the pastures are rested (i.e., remain ungrazed for the entire growing season) each year, while the remainder experience pulsed grazing by the CARM herd for time periods varying from 7 to 40 days depending on forage conditions and rotation criteria used in a given year. TRM pastures are each grazed by a separate herd that is ~10 times smaller than the CARM herd.
In addition to these 20 pastures, we compiled data from three additional pastures that were managed using season-long, continuous grazing at a heavy stocking rate. These pastures were located on the Loamy Plains ecological site and had a prior history of season-long grazing at a moderate stocking rate. Beginning in 2019, these pastures were stocked at a rate 50% higher than the TRM and CARM pastures.

2.2. Ground-Based Measurements

Ground-based measurements were compiled over the period 2014–2022 from the 20 pastures included in the Collaborative Adaptive Rangeland Management (CARM) experiment, which contrasts the effects of traditional versus adaptive grazing management. Each pair of CARM/TRM pastures (i.e., block) contained a similar distribution of ecological sites, with 4 composed entirely of Loamy Plains, one entirely of Sandy Plains, and 5 composed of a mixture of Loamy Plains, Sandy Plains, and/or Salt Flats (see map in Davis et al., 2020 [31]). In pastures with only Loamy and/or Sandy Plains, we established 4 vegetation monitoring plots located on the ecological sites in proportion to their extent. In pastures that additionally contained Salt Flats (3 blocks), we established 6 vegetation monitoring plots, with 4 plots on Sandy and/or Loamy Plains and 2 plots on Salt Flats, giving a total of 92 plots in the study. Each plot contained a systematic grid of four 30-m transects spaced 106 m apart, where we measured various vegetation metrics. Of the four transects per plot, two are used to measure ANHP by clipping biomass in one 0.18 m2 quadrat inside a movable grazing cage located ~10 m and ~20 m along each transect. Cages are moved to a new, random location in the vicinity of the transect prior to the start of the growing season each year and are clipped in early August (as recommended by Milchunas and Lauenroth 2008 [26]). This provides an estimate of aboveground production of vegetation that was not grazed in the current year but was subjected to that pasture’s grazing management in prior years.
For this study, if a CARM pasture was not grazed before the date of ANHP data collection, it was recategorized as ‘ungrazed’. Thus, for a given year, each of the 20 pastures was classified into one of three possible management categories—season-long grazing, pulse grazing, or ungrazed. The season-long grazing management always occurred on the same 10 pastures, while the other 10 pastures fell into either the pulse-grazed or ungrazed category, depending on the year. For 2019-2022, we also included ANHP data collected using the same methods from the three heavily stocked pastures.
Vegetation from each clipped quadrat was separated into current-year production by functional groups (C4 perennial grasses, C3 perennial graminoids, annual grasses, forbs, and subshrubs) plus standing dead biomass from the prior growing season. The ANHP data were aggregated at the plot level, with mean and variance calculated for each set of quadrats (N = 4). Since subshrubs are a minor component of ANPP, they were excluded from our estimates of aboveground net herbaceous production (ANHP). A meteorological station located at CPER measured hourly incoming photosynthetically active radiation (PAR). PAR measurements were aggregated at a daily time step and subsequently used in the calculation of the absorbed photosynthetically active radiation (APAR) time series.

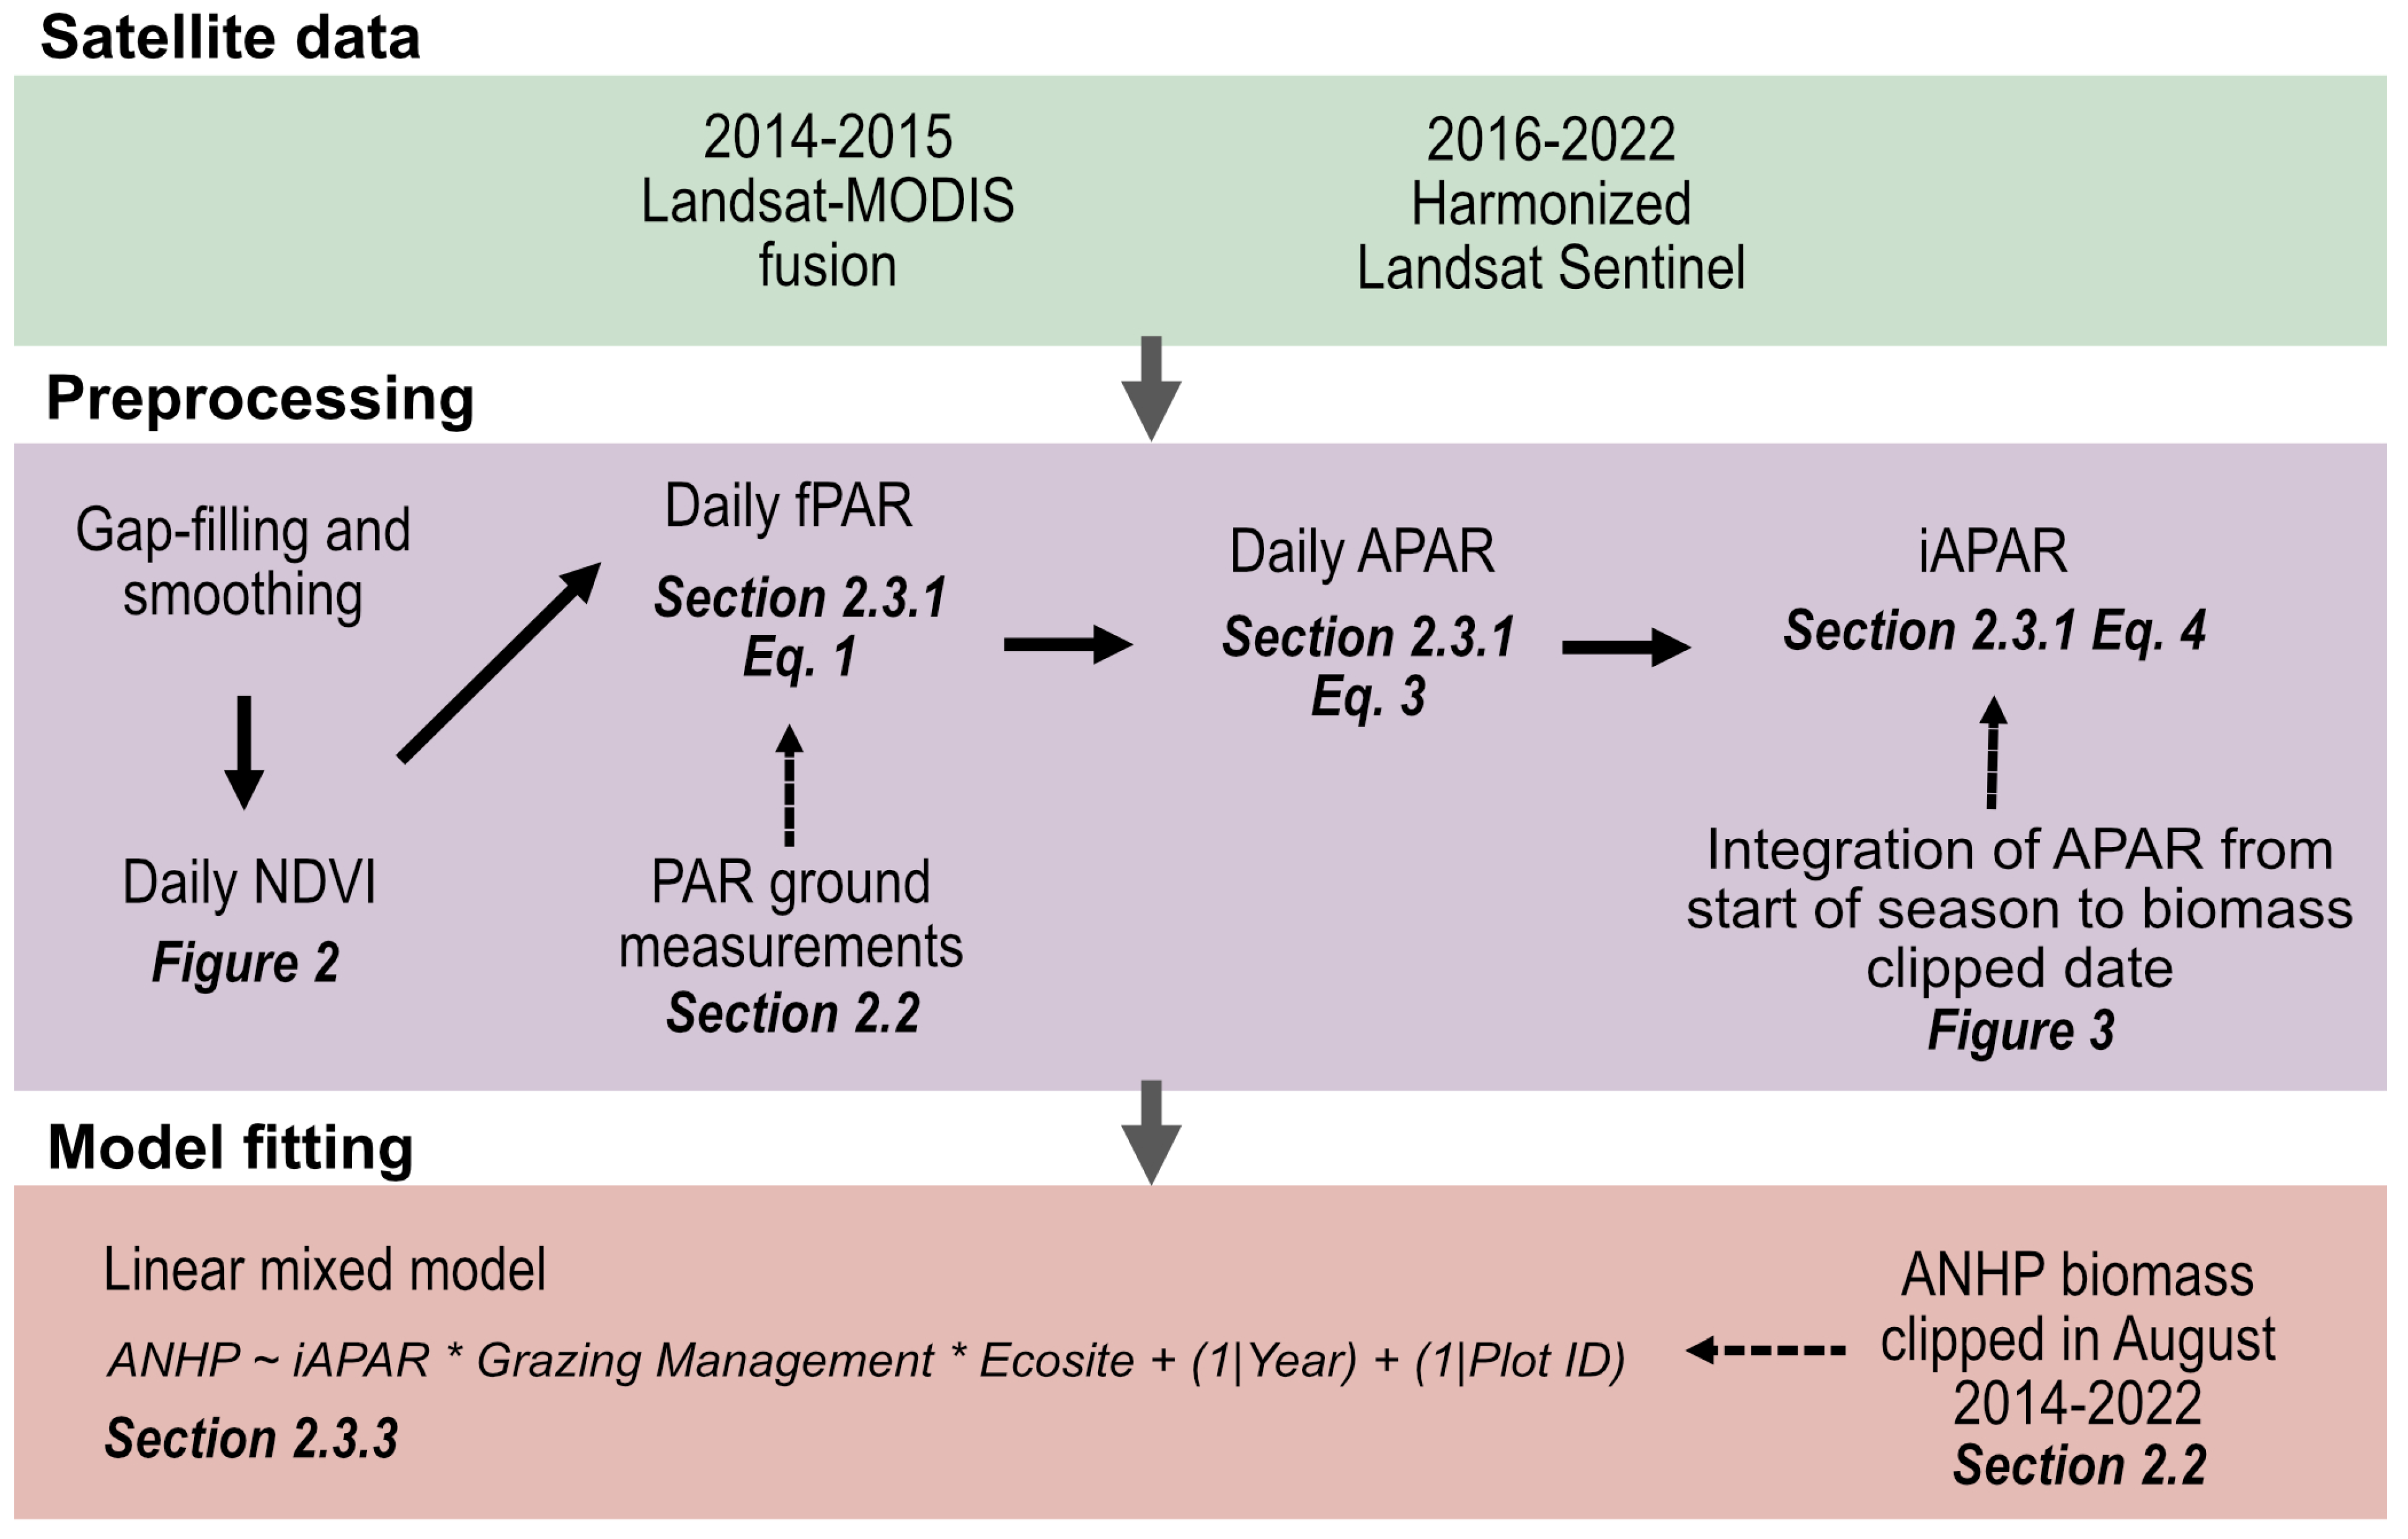
2.3. Remotely Sensed Measurements

Python version 3.10.9 was used to collect remote sensing data. R version 4.3.2 was used to run the statistical analysis and create graphics [32].

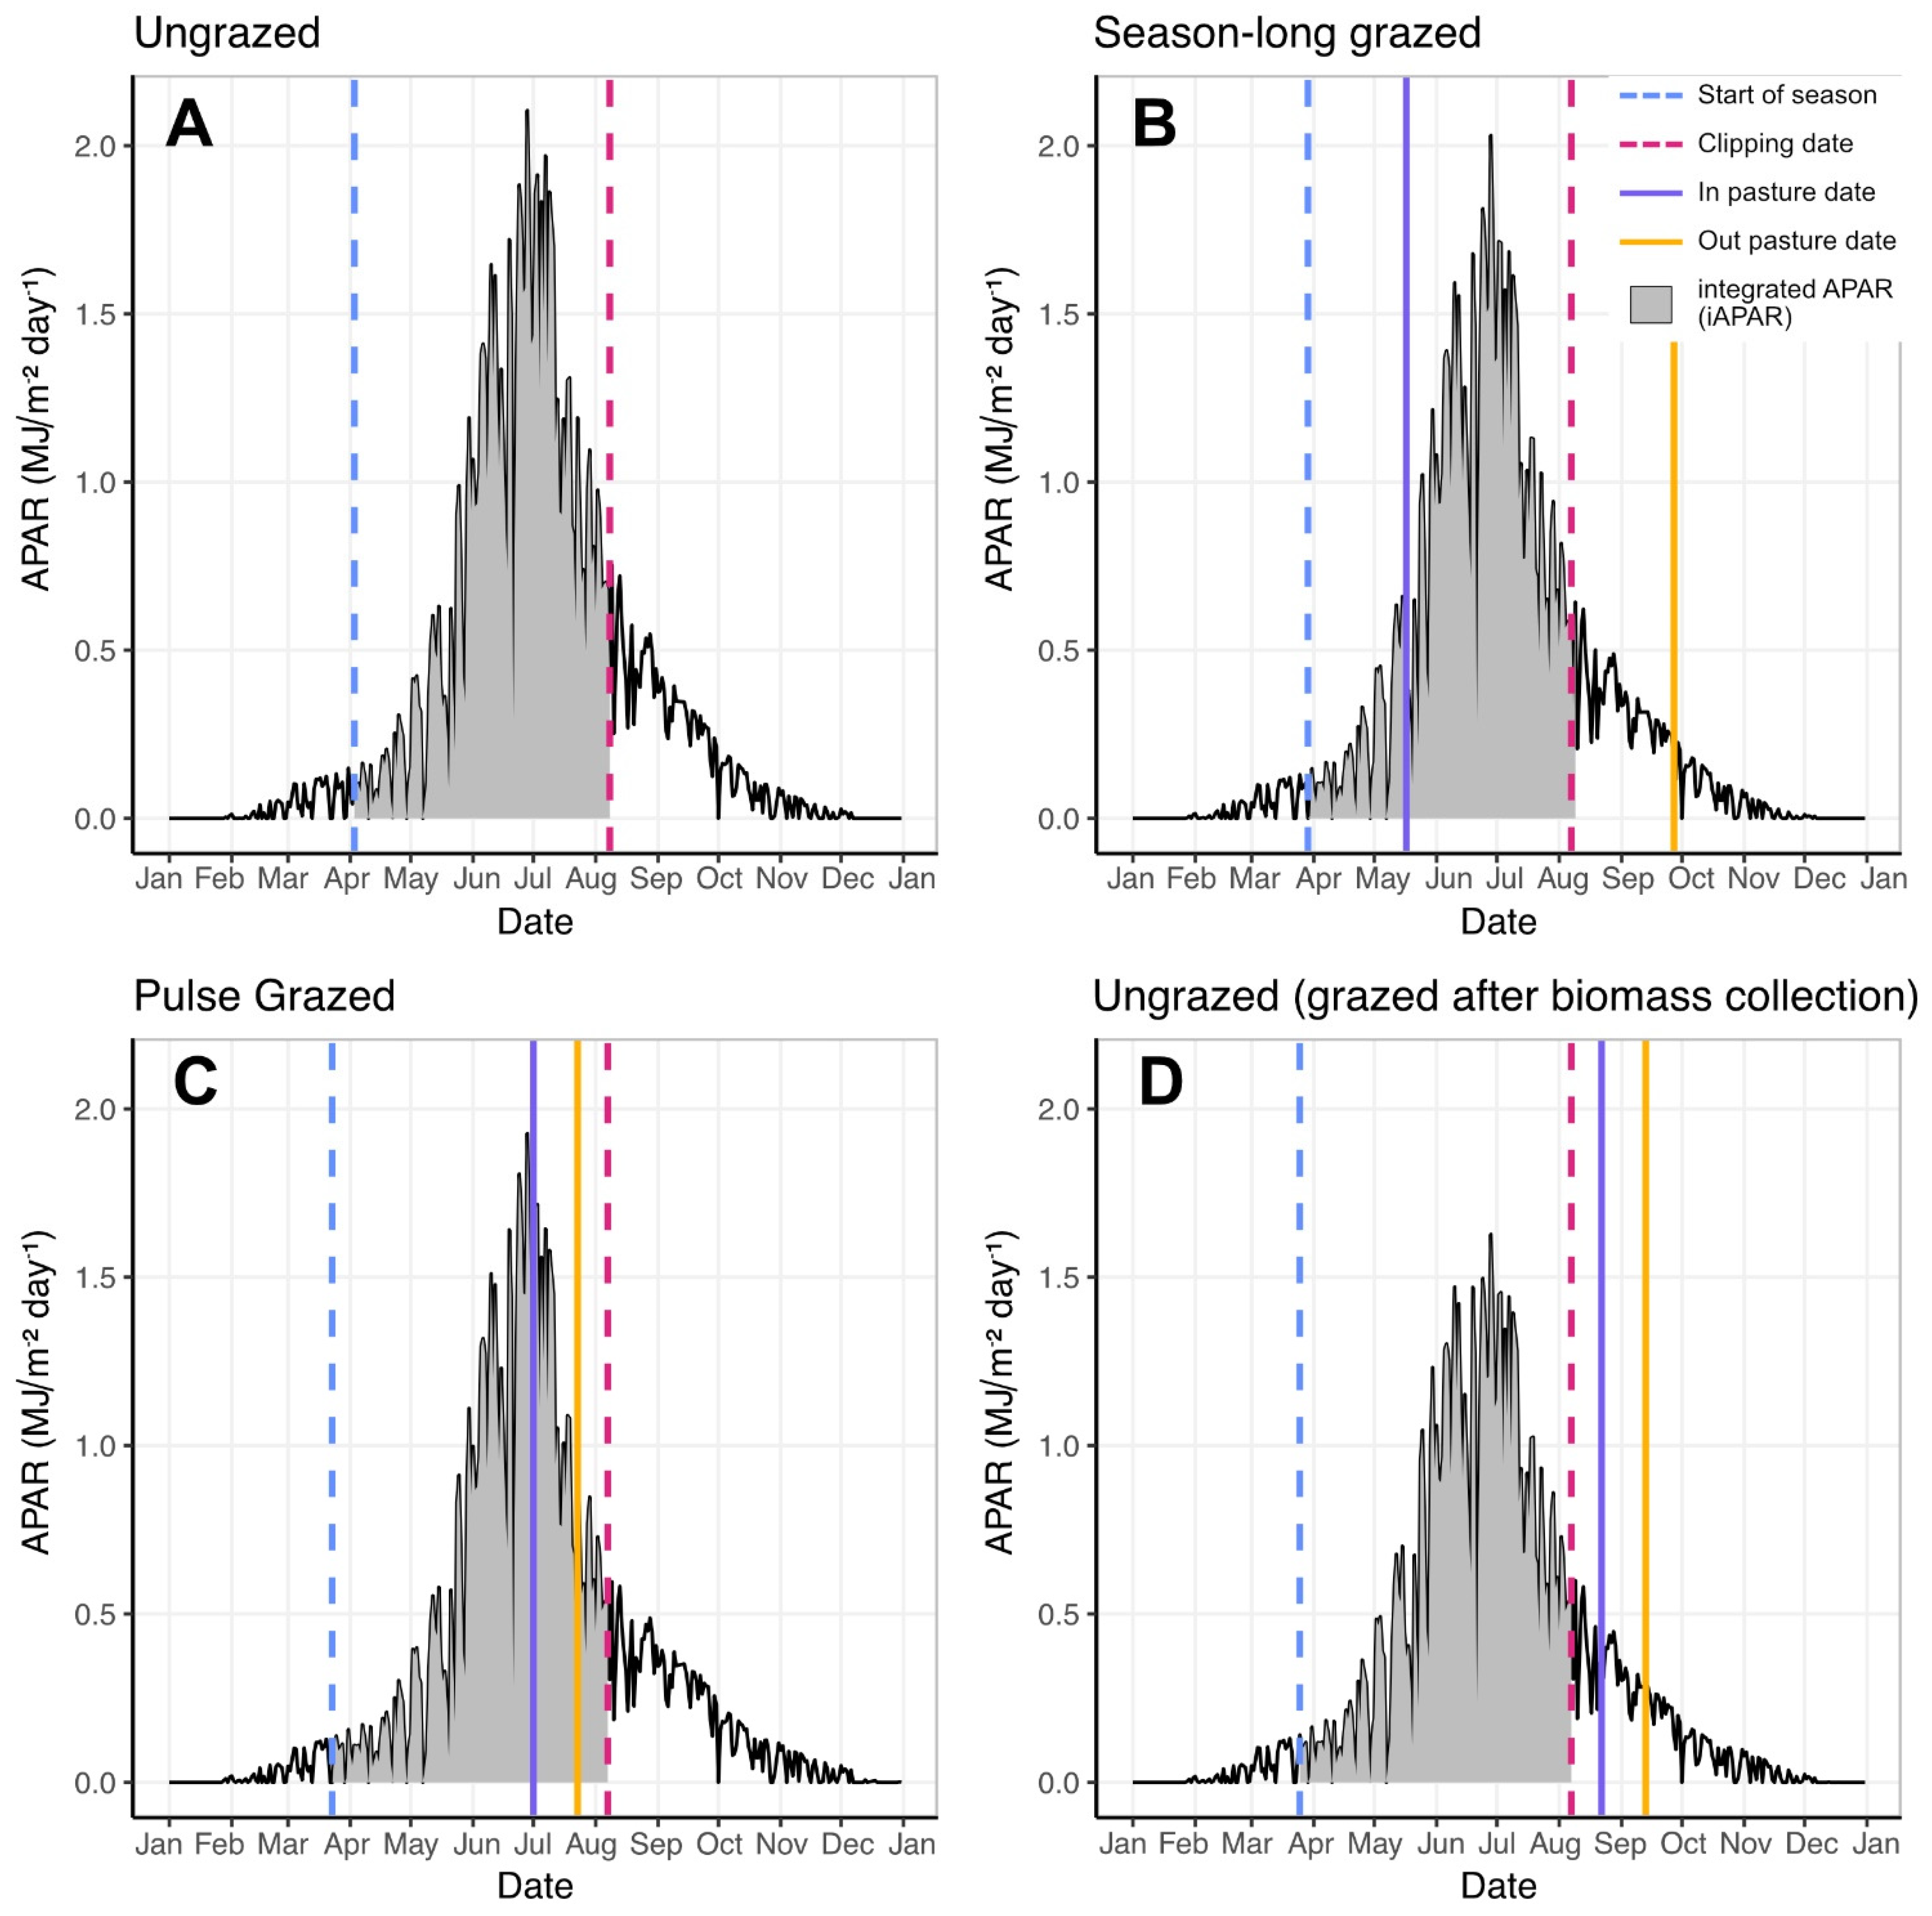
2.3.1. Calculating iAPAR

We used gap-filled and smoothed daily plot-scale mean NDVI (Figure 2) to calculate iAPAR for each plot on the date of clipping (Figure 3). NDVI data for 2014–2015 came from a Landsat-MODIS fusion (LMF) product created using the STARFM algorithm [33,34]. NDVI data for 2016–2022 were derived from the Harmonized Landsat Sentinel (HLS) satellite time series [35]. In both cases, we applied a gap-filling and smoothing procedure using linear interpolation followed by 3rd-order Savitzky–Golay smoothing to arrive at a daily estimate of NDVI at a spatial resolution of 30 m (more details for LMF can be found in [33,34] and for HLS in [36].
We converted NDVI to APAR using methods described by Gaffney et al. (2018) [12]. Briefly, we first converted the daily NDVI time series to fPAR using an exponential function between fPAR and NDVI (Grigera et al., 2007 [3]; Equations (1) and (2)).
f P A R = S R S R m a x S R m i n ( S R m a x S R m i n )
S R = 1 + N D V I 1 N D V I
where SR is the simple ratio index (see [3], and Equation (2)), SRmin = 1.11, based on an average CPER-wide minimum NDVI of 0.05, and SRmax = 11.62, based on Grigera et al. (2007) [3].
To calculate APAR, we multiplied the daily fPAR values by the amount of incoming daily photosynthetically active radiation (PAR) measured at the CPER meteorological station (Equation (3)). We then derived cumulative APAR (iAPAR) by integrating from the start of the season to the quadrat clip date and between the base APAR value and the APAR time series (Equation (4)) (Figure 3). We include the base APAR value in the iAPAR calculation to minimize errors associated with the start of the growing season calculation (see below) and heterogeneity associated with bare soil reflectance values (Gaffney et al. 2018 [12]).
A P A R = f P A R × P A R
i A P A R = t = s t a r t   o f   s e a s o n t = c l i p   d a t e ( A P A R t A P A R b a s e ) d t
To estimate the start of the season (SOS) for each year and plot, we used the NDVI time series. We calculated the SOS in several steps. First, an NDVI threshold (Threshold 1) was calculated as the 40th percentile of the NDVI values between 1 April and 19 July (the typical window for SOS). Next, we identified the earliest date after 1 February that NDVI first rose above Threshold 1. We then took a 25-day moving average of the first differential of NDVI values up until the date Threshold 1 was reached. Working backward from this date, we identified the SOS as the latest date that NDVI was below the 35th percentile of these values. This approach helped avoid “false stars” in the growing season that come with small peaks in NDVI observed prior to the sustained increase in NDVI associated with the growing season. Data processing is shown graphically in Figure 4 flowchart.

2.3.2. Extracting Rangeland Analysis Platform Estimates

The Rangeland Analysis Platform (RAP) provides a 16-day annual aboveground herbaceous biomass using a process-based model [17]. Data are accessible through Google Earth Engine https://rangelands.app/rap/ (accessed on 27 February 2024). Initially, the data are provided as a two-band image consisting of annual and perennial forbs and grasses. We combined these to obtain a total herbaceous biomass estimate. Using the 16-day data, we calculated cumulative herbaceous biomass production up to 20 August, which is the latest date on which CPER biomass was clipped.

2.3.3. Estimating ANHP from iAPAR

We fit a linear mixed effects regression model using R (version 4.3.2) and the package lme4 [37] to estimate ANHP from iAPAR for the 20 pastures in the CARM experiment. We fit a single model designed to test whether the relationship between iAPAR and ANHP varied by grazing management and ecosite, using the following formula (in R language notation, where ‘~’ denotes a function, ‘ ’ denotes an interaction in addition to the additive fixed effects, and ‘1|x’ denotes a random intercept for the variable x):
A N H P   ~   i A P A R G M E S + 1 Y e a r + ( 1 | P l o t   I D )
where GM is the grazing management category (one of season-long, pulse grazing, or ungrazed), ES is the ecosite (one of Loamy Plains, Sandy Plains, or Salt Flats), and random intercepts are fit for each year and plot ID. We asked whether the slope of the iAPAR to ANHP relationship varied by grazing management treatment, which would be indicated by coefficients significantly different from zero for one or more of the GM:iAPAR interaction variables, with the ungrazed treatment set as the reference. Ecosite was included because we also expected the relationship between iAPAR and ANHP to vary with plant community type [12]. By including ecosite as a fixed effect, we were able to assess the temporal relationship between iAPAR and ANHP while also accounting for the primary source of spatial variation in the dataset (i.e., soil type). We included the three-way interaction among iAPAR, grazing management, and ecosite because the effect of grazing management on the iAPAR to ANHP relationship could differ by ecosite. Including year and plot ID terms allowed intercepts to vary randomly across plots and years and accounted for the repeated measures design of the data collection. Model assumptions were checked using residual diagnostic plots. We explored square-root transforming the data to achieve more normally distributed residuals, but the improvements to fit were negligible and we would have lost information on high and low values in the dataset, so data were not transformed. All multiple comparisons were adjusted using the Tukey HSD method with a significance level of 0.05.
To determine whether season-long grazing with a heavier stocking rate affected the iAPAR to ANHP relationship, we also fit a model comparing season-long heavy grazing management to other grazing management treatments for the subset of data available from the corresponding years (2019–2022) and ecosite (Loamy Plains). We fit the same model as before but without the ecosite (ES) term since all data came from the Loamy Plains ecosite. We tested the same model assumptions and asked whether the GM:iAPAR interaction was significantly different for the ungrazed vs. season-long heavy grazing treatment.

2.4. Comparing RAP and iAPAR Model Results

To compare RAP predictions to ANHP predicted by iAPAR, we fit a linear model including any significant predictors from the previous analysis and excluding any random effects. To compare our predictions against the ANHP ground data, we calculated several model metrics. Mean absolute error (MAE; absolute value of observed minus predicted value) was used to model error. We used MAE percent to put the overall error into perspective (MAE %; the percentage of the mean absolute error relative to the mean of the response variables). We calculated mean absolute percent error (MAPE; mean of the absolute values of observed minus predicted divided by the observed values) to evaluate the percent error that is balanced across the dataset values. We used mean percent error (MPE; the mean of the observed value minus the predicted value divided by the observed value) to obtain a sense of bias. We used R2 (explained variance = 1 − residual sum of squares/by the total sum of squares, coefficient of determination) to evaluate the overall model fit and r (Pearson correlation coefficient) to understand the relative fit within the data set. We calculated these metrics for ecosites separately and then recalculated the metrics for all ecosites and grazing management regimes.

3. Results

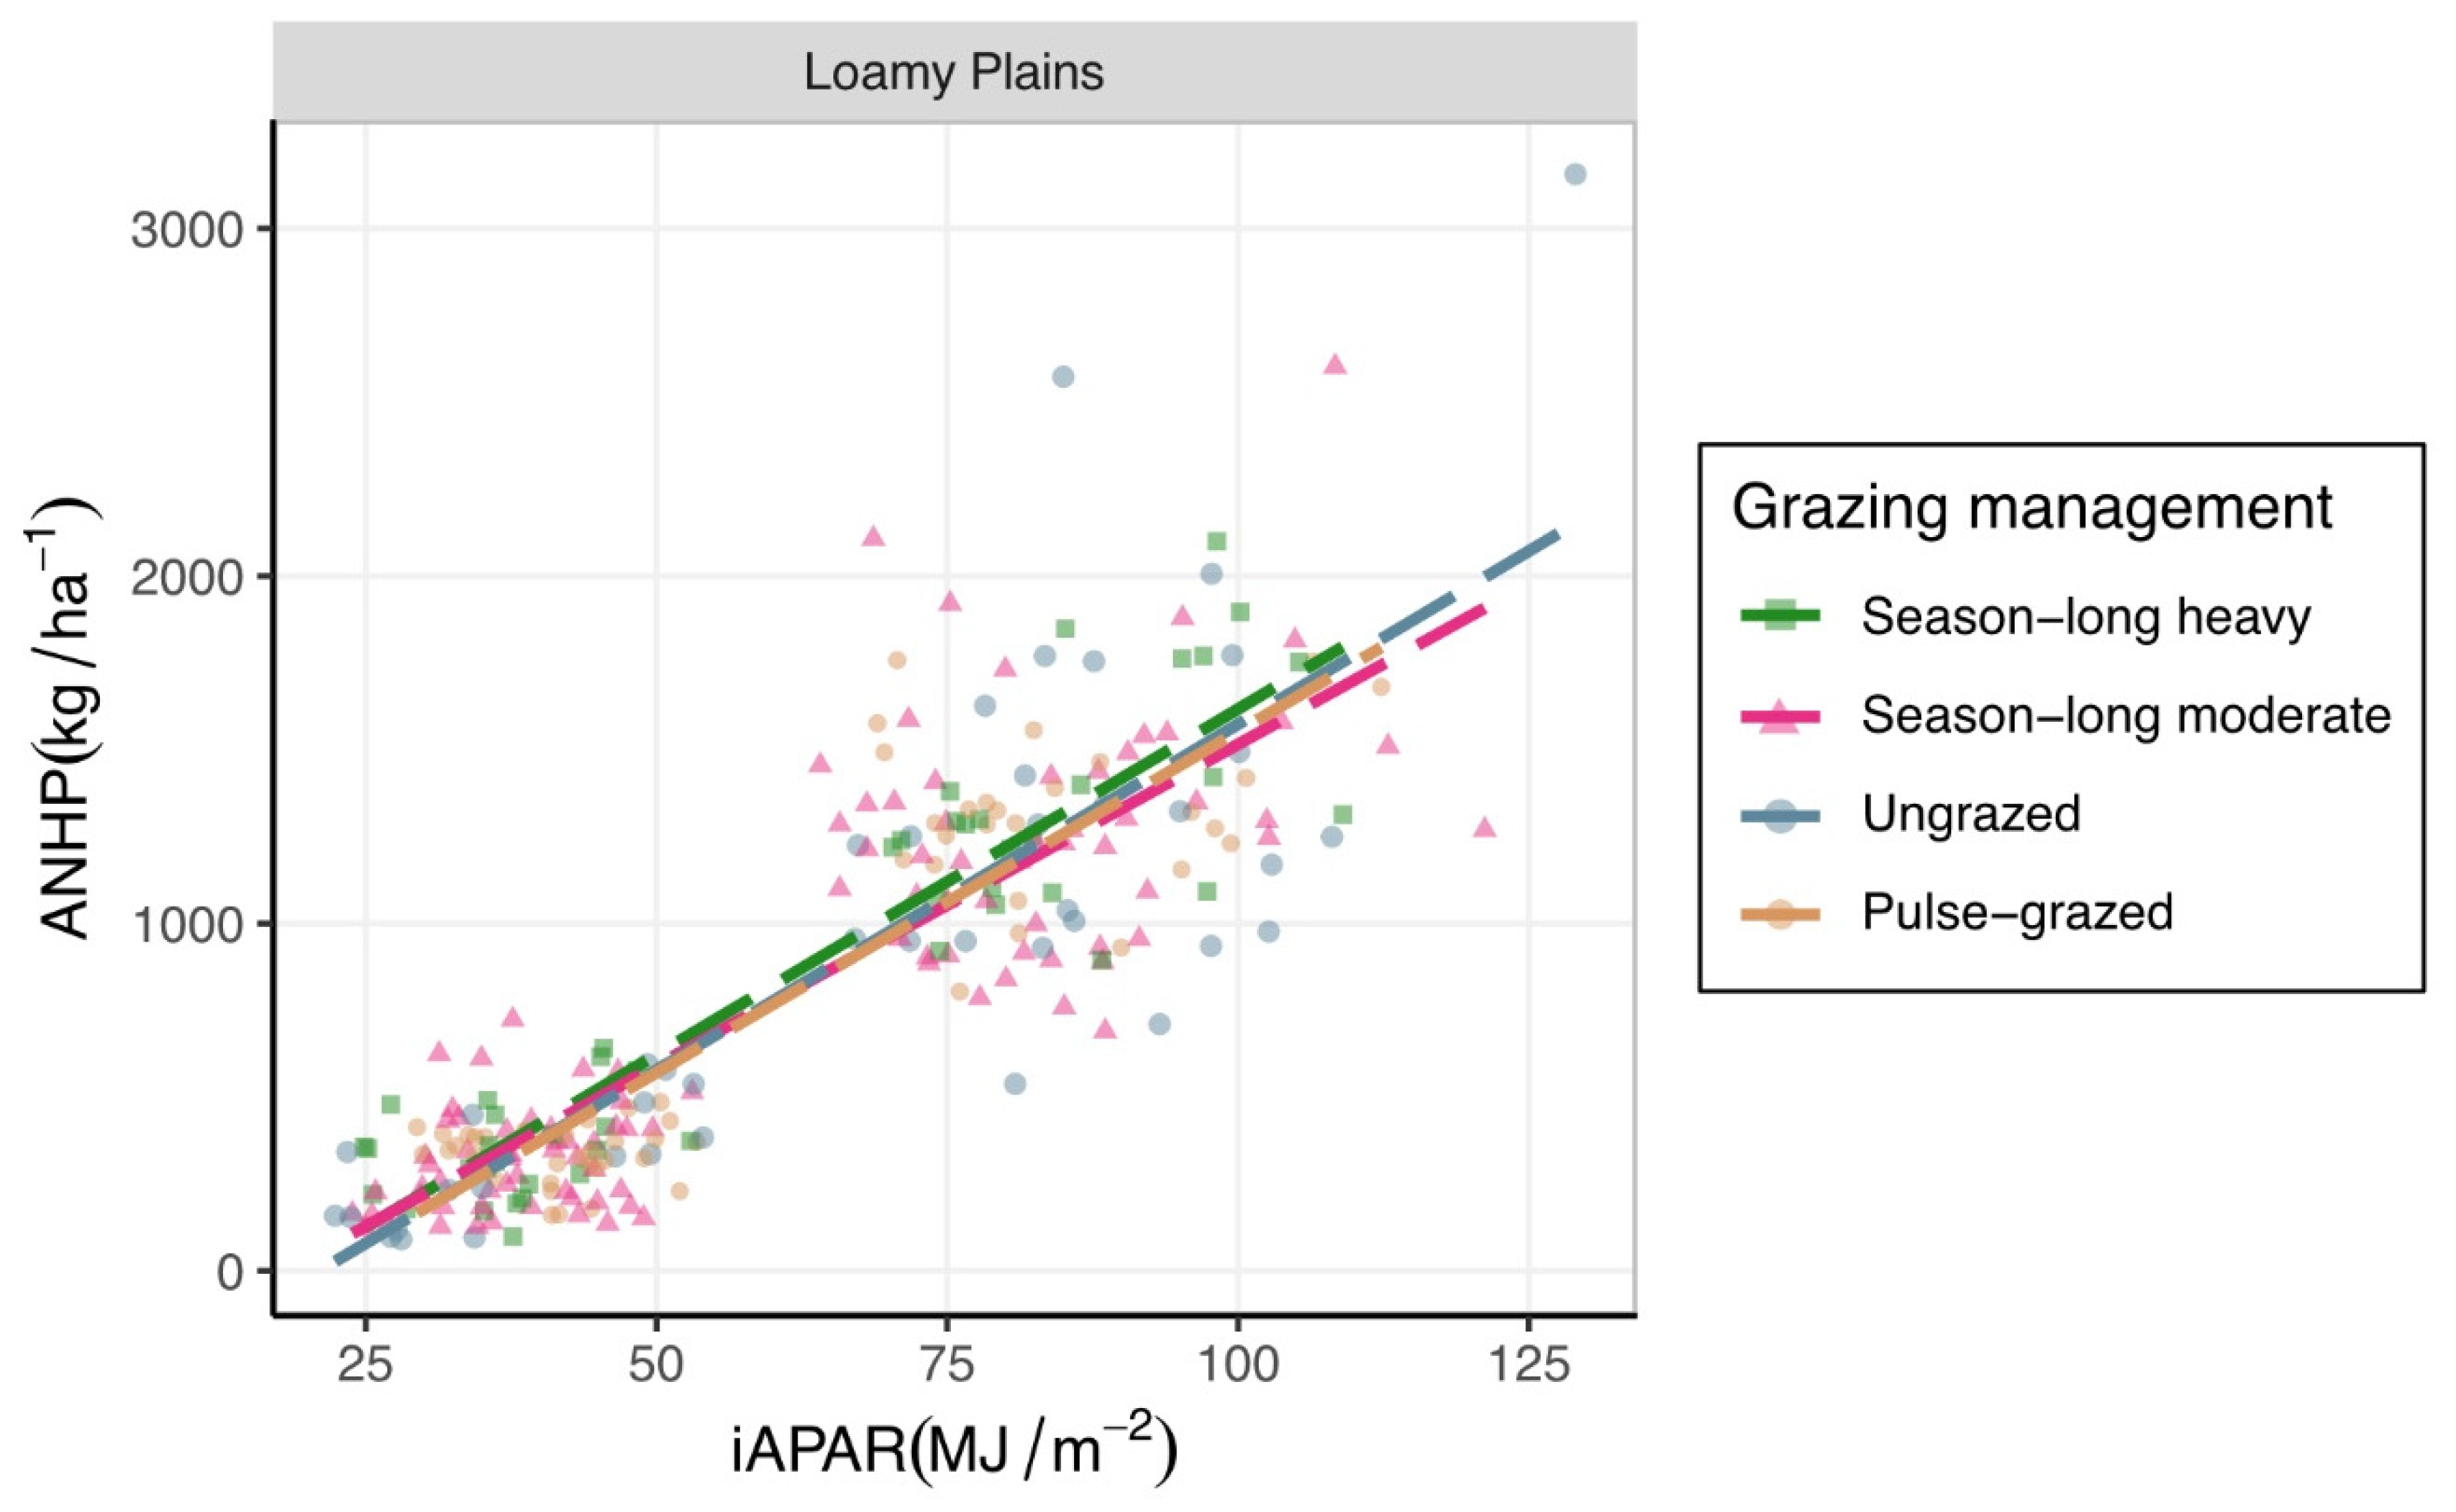
3.1. Estimating ANHP from iAPAR

We observed a strong and positive relationship between iAPAR and ANHP. On average, for each unit of added iAPAR, ANHP increased by 9.39 kg/ha (χ2 = 64.31, df = 1, p < 0.001; Table 1; Figure 5). As predicted, the effect of iAPAR on ANHP varied significantly by ecosite (χ2 = 28.5, df = 2, p < 0.001; Figure 5). The interaction coefficient between iAPAR:Sandy Plains ecosite was 3.92 ± 0.96, indicating an increase in the amount of ANHP produced per unit of iAPAR, relative to the reference ecosite (Loamy Plains) (“:” denotes interaction) (Figure 6). Similarly, the interaction coefficient for iAPAR:Salt Flats ecosite was 5.71 ± 1.2, signifying an even greater increase in ANHP produced per unit of iAPAR compared to the Loamy Plains ecosite (Figure 6). The effect of iAPAR on ANHP did not vary based on grazing management treatments (χ2 = 0.69, df = 2, p = 0.71), and the effect of grazing management on the iAPAR-ANHP relationship did not vary by ecosite (three-way interaction χ2 = 7.49, df = 4, p = 0.11).
To examine whether more intensive grazing may influence the relationship between ANHP and iAPAR, we separately fit a model predicting ANHP from iAPAR and grazing management treatments for a subset of the data for which we also had a higher stocking rate grazing management treatment, referred to as ‘season-long heavy’ (2019–2022, Loamy Plains ecosite plots only) (Figure 7). For this subset of data, neither grazing management (χ2 = 1.1, df = 3, p = 0.76) nor the interaction between iAPAR and grazing management (χ2 = 2.23, df = 3, p = 0.52) significantly influenced ANHP.

3.2. iAPAR and RAP Model Comparison

When comparing our empirical iAPAR model to the process-based RAP model, we found that both models tended to underpredict high values and overpredict low values of ANHP, but this bias was more pronounced for RAP than the iAPAR model (Figure 8). Overall, RAP predictions were strongly correlated with ground observations but explained less variance (R2 = 0.40) compared to the iAPAR model (R2 = 0.62), and RAP exhibited higher absolute and relative errors (Table 2). The RAP model tended to underpredict (MPE: −28.57%) more than the iAPAR model (MPE: −14.97%), and RAP consistently underpredicted when observed biomass was greater than ~1500 kg ha−1 (Figure 8).
When data were broken down by ecosite, both RAP and iAPAR had lower MAE%, MPE%, and MAPE%, less biased MPE% (i.e., closer to 0), and higher r (correlation) values in the taller structured Salt Flats and Sandy Plains ecosites compared to the Loamy Plains ecosite (Table 2). The iAPAR model also had higher R2 values in taller structured ecosites, whereas RAP had a higher R2 in the Loamy ecosite than the other ecosites (Table 2). The two models had comparable overall error rates in Loamy and Sandy Plains ecosites, with RAP having only about 6% higher MAE% than the iAPAR model. The RAP error was noticeably higher than iAPAR error in the tallest-structured Salt Flats ecosite (Table 2; MAE 494.03 kg/ha−1 vs. 295.75 kg/ha−1; MAE% 33.27 vs. 19.92). As was found for the iAPAR model, the accuracy of RAP predictions varied less across grazing management classes than across ecosites (Tables S1 and S2).

4. Discussion

Using 8 years of ground-based aboveground net herbaceous production (ANHP) data, we asked whether satellite-based predictions of ANHP were sensitive to ecosite, grazing management strategy, or prediction model type (process-based model vs. empirical model). We found that iAPAR could be used to predict ANHP in the shortgrass steppe and that the relationship between these two variables was sensitive to ecosite but not grazing management strategy. Moreover, we found that a locally calibrated empirical model generally performed better than a continentally calibrated process-based model, though the latter was still moderately correlated with ground observations and performed reasonably well for the dominant ecosite.

4.1. Effects of Ecosite

We found steeper slopes for the iAPAR to ANHP relationship in ecosites with taller structured vegetation, which aligns with previous results from the same site [12]. There could be at least two mechanisms driving this finding. First, taller structured herbaceous vegetation may be allocating more resources aboveground per unit of APAR. This seems reasonable considering that the shorter structured herbaceous vegetation in this area predominantly consists of drought-tolerant C4 shortgrasses, which allocate a considerable amount of resources to belowground root mass [38]. By contrast, the taller structured herbaceous vegetation consists of mid-height cool-season grasses and warm-season saltgrasses, which devote more resources to leaves and seeds. Indeed, cool-season grasses in this system are known to produce more aboveground biomass per unit of received precipitation than warm-season grasses [39].
Second, taller structured vegetation may have overlapping leaf canopies, in which case the satellite would not see the entire leaf surface area and may be underestimating APAR. This seems less likely in our semi-arid study area since even in the tall structured communities, plant height rarely exceeds 50 cm, and the dominant species do not have vertically complex leaf structures. Regardless of the mechanism, our study reinforces prior work suggesting that aboveground plant structure can be an important modifier of satellite-based iAPAR-ANHP relationships [3,12].

4.2. Effects of Grazing Management

The relationship between ANHP and iAPAR was insensitive to grazing management treatments applied at our semi-arid shortgrass steppe study site. Importantly, we investigated differences in spatio-temporal grazing patterns (continuous grazing vs. pulse grazing) at the same stocking rate, as well as differences in within-year grazing intensity (none, moderate, and heavy). In all cases, a given plant community type produced roughly the same amount of ANHP per unit of iAPAR. This result is powerful because it means managers can feasibly use satellites to estimate herbaceous production across broad regions of the shortgrass steppe, even if short-term grazing management details are unknown or changing for many pastures.
We note that our analysis excluded sites for which grazing management differences have been in place long enough to actually shift plant community type. In the shortgrass steppe, this type of plant community shift in response to sustained grazing intensity treatments can take over 30 years to manifest [5,40]. Our ecosite results suggest that the ANHP-iAPAR relationship is indeed sensitive to plant community type. Thus, we would hypothesize that long-term, sustained grazing treatments may eventually lead to shifts in the ANHP-iAPAR predictive relationship via their effects on the plant community.
We expect that the ANHP-iAPAR relationship might be more sensitive to grazing in mesic systems with higher production and more regrowth capacity for at least two reasons. First, it is harder to estimate production using traditional ground-based methods in the presence of ample regrowth. Unless production is estimated multiple times within the growing season via movable cages (e.g., [6,41,42]), within-season over-compensation can alter the relationship between caged (ungrazed) and uncaged (grazed) productivity, and this bias could affect efforts to estimate caged production using satellite imagery of uncaged areas. Second, and more importantly, grazing may have larger within-season effects on vegetation structure and reflectance in more productive systems. For example, in systems with dense, overlapping canopies, it is possible that the removal of upper canopy layers via grazing could expose lower canopy layers with different APAR properties. Our analysis was unable to examine the effects of season-long heavy grazing on the more productive Sandy Plains or Salt Flats ecosites, which could shed some light on this question. Overall, we recommend that future work focus on evaluating empirical relationships between ANHP and iAPAR for a broader variety of management, ecological, and climatic conditions.

4.3. Process-Based vs. Empirical Modeling

Unsurprisingly, our locally calibrated empirical model performed better for our local site than a continental-scale, process-based model (RAP). We stress that these results are not intended to undermine the value of RAP as a tool. RAP was calibrated to work well when comparing sites across vast spatial scales encompassing highly variable biophysical and climatic conditions. However, good performance at broad scales may tradeoff with good performance at fine scales. In particular, the production assumptions built into RAP may not be detailed enough to capture variation among ecosites within the same region. Our study demonstrates that the relationship between APAR and ANHP does vary by ecosite, but RAP currently uses the same parameters to convert APAR to GPP (and eventually to ANHP) for all grasslands, which were calibrated using data from more humid, productive, and taller structured grassland sites in Oklahoma and California [16]. In our study area, RAP tended to predict biomass production in a fairly narrow range and was especially poor at predicting when observed biomass was high (1500~3500 kg ha−1 for this study). This suggests that RAP’s underlying parameters may be (a) overestimating plant maintenance respiration, (b) underestimating APAR, or (c) underestimating light use efficiency in this system. For example, with respect to (c), it is possible that RAP’s parameters overestimate the limitations of temperature extremes and high vapor pressure deficit on vegetation in the shortgrass prairie, which has evolved under highly volatile temperature and precipitation regimes. While the underlying reasons for inconsistencies warrant further investigation, in the meantime, managers trying to understand production differences at fine spatial scales may need to recognize that the performance of RAP may vary across different regions and different conditions within a given region.

4.4. Implications

For the shortgrass steppe, our analysis reinforces prior work, suggesting that this ecosystem is very resistant to grazing [26] and opens a path for more extensive mapping and monitoring of ANHP across the region. Importantly, our model provides a means of tracking fine-scale variation in forage production associated with topo-edaphic variability within and among pastures on a given ranching operation to assist with grazing management decisions such as stocking rates, movement of livestock among pastures and monitoring of long-term trends in ANHP. However, our analyses show that increasing accuracy in remotely sensed predictions of forage production relies on knowledge of plant community composition. Maps of ecological sites derived from the National Soil Survey provide one means to initially stratify a focal area but will likely also need refinement via local expert knowledge to account for inaccuracies of soil mapping combined with other historical factors affecting community composition. Plant community maps derived from hyperspectral imagery collected by UAVs or manned aircraft [43] provide another potential avenue for improving satellite-based estimates of forage production for grazing management decision support.

Supplementary Materials

The following supporting information can be downloaded at: https://www.mdpi.com/article/10.3390/rs16152780/s1, Table S1: Comparing predictions from RAP and the empirical iAPAR model. Model metrics used included: mean absolute error (MAE; absolute value of observed minus predicted value), MAE percent (MAE %; the percentage of the mean absolute error relative to the mean of the response variables), mean percent error (MPE %; mean of the observed value minus the predicted value divided by the observed value), mean absolute percent error (MAPE %; mean of the absolute values of observed minus predicted divided by the observed values), R2 (coefficient of determination), and r (Pearson correlation coefficient) to evaluate model fit. The metrics were calculated for all grazing management. Table S2: Comparing predictions from RAP and the empirical iAPAR model. Model metrics used included: mean absolute error (MAE; absolute value of observed minus predicted value), MAE percent (MAE %; the percentage of the mean absolute error relative to the mean of the response variables), mean percent error (MPE %; mean of the observed value minus the predicted value divided by the observed value), mean absolute percent error (MAPE %; mean of the absolute values of observed minus predicted divided by the observed values), R2 (coefficient of determination), and r (Pearson correlation coefficient) to evaluate model fit. The metrics were calculated for all ecosites and individual ecosites and grazing management.

Author Contributions

Formal analysis, Writing—Original draft preparation, visualization, E.S.P.; Writing—Original draft preparation, formal analysis, S.P.K.; formal analysis N.S.; conceptualization, data curation, Writing—Review and Editing D.J.A.; conceptualization, Writing—Review and Editing, supervision, L.M.P. All authors have read and agreed to the published version of the manuscript.

Funding

Partial salary for E.S.P. and S.P.K. was supported by the Foundation for Food and Agriculture Research (FFAR grant number: DSnew-0000000028), The Noble Institute, Greenacres Foundation, and Butcherbox. The content of this publication is solely the responsibility of the authors and does not necessarily represent the official views of our funders. This research and the salary for NS used resources provided by the SCINet project and/or the AI Center of Excellence of the USDA Agricultural Research Service, ARS project numbers 0201-88888-003-000D and 0201-88888-002-000D.

Data Availability Statement

Data and R code is available through the Ag Data Commons, a digital repository hosted by the National Agricultural Library.

Acknowledgments

Crow Valley Livestock Cooperative, Inc., for providing the cattle for the CARM experiment. Thanks to the CPER LTAR and all the associated staff and field technicians, including Mary Ashby, Jeff Thomas, Matt Mortenson, Melissa Johnston, and Nick Dufek, for conducting the extensive field measurements used in this study. Thanks to Nicole Kaplan for data management support. This research was a contribution from the Long-Term Agroecosystem Research (LTAR) network. LTAR is supported by the United States Department of Agriculture.

Conflicts of Interest

The authors declare no conflicts of interest.

References

  1. Holechek, J.; Pieper, R.D.; Herbel, C.H. Range Management: Principles and Practices, 6th ed.; Prentice Hall: Boston, MA, USA, 2011; ISBN 978-0-13-501416-5. [Google Scholar]
  2. Holechek, J.L. Global Trends in Population, Energy Use and Climate: Implications for Policy Development, Rangeland Management and Rangeland Users. Rangel. J. 2013, 35, 117. [Google Scholar] [CrossRef]
  3. Grigera, G.; Oesterheld, M.; Pacín, F. Monitoring Forage Production for Farmers’ Decision Making. Agric. Syst. 2007, 94, 637–648. [Google Scholar] [CrossRef]
  4. Hoover, D.L.; Pfennigwerth, A.A.; Duniway, M.C. Drought Resistance and Resilience: The Role of Soil Moisture–Plant Interactions and Legacies in a Dryland Ecosystem. J. Ecol. 2021, 109, 3280–3294. [Google Scholar] [CrossRef]
  5. Porensky, L.M.; Derner, J.D.; Augustine, D.J.; Milchunas, D.G. Plant Community Composition After 75 Yr of Sustained Grazing Intensity Treatments in Shortgrass Steppe. Rangel. Ecol. Manag. 2017, 70, 456–464. [Google Scholar] [CrossRef]
  6. Charles, G.K.; Porensky, L.M.; Riginos, C.; Veblen, K.E.; Young, T.P. Herbivore Effects on Productivity Vary by Guild: Cattle Increase Mean Productivity While Wildlife Reduce Variability. Ecol. Appl. 2017, 27, 143–155. [Google Scholar] [CrossRef] [PubMed]
  7. Hannusch, H.J.; Rogers, W.E.; Lodge, A.G.; Starns, H.D.; Tolleson, D.R. Semi-arid Savanna Herbaceous Production and Diversity Responses to Interactive Effects of Drought, Nitrogen Deposition, and Fire. J. Veg. Sci. 2020, 31, 255–265. [Google Scholar] [CrossRef]
  8. Augustine, D.J.; Derner, J.D.; Fernández-Giménez, M.E.; Porensky, L.M.; Wilmer, H.; Briske, D.D. Adaptive, Multipaddock Rotational Grazing Management: A Ranch-Scale Assessment of Effects on Vegetation and Livestock Performance in Semiarid Rangeland. Rangel. Ecol. Manag. 2020, 73, 796–810. [Google Scholar] [CrossRef]
  9. Monroe, P.H.M.; Barreto-Garcia, P.A.B.; Barros, W.T.; de Oliveira, F.G.R.B.; Pereira, M.G. Physical Protection of Soil Organic Carbon through Aggregates in Different Land Use Systems in the Semi-Arid Region of Brazil. J. Arid Environ. 2021, 186, 104427. [Google Scholar] [CrossRef]
  10. Reinermann, S.; Asam, S.; Kuenzer, C. Remote Sensing of Grassland Production and Management—A Review. Remote Sens. 2020, 12, 1949. [Google Scholar] [CrossRef]
  11. Myneni, R.B.; Ramakrishna, R.; Nemani, R.; Running, S.W. Estimation of Global Leaf Area Index and Absorbed Par Using Radiative Transfer Models. IEEE Trans. Geosci. Remote Sens. 1997, 35, 1380–1393. [Google Scholar] [CrossRef]
  12. Gaffney, R.; Porensky, L.; Gao, F.; Irisarri, J.; Durante, M.; Derner, J.; Augustine, D. Using APAR to Predict Aboveground Plant Productivity in Semi-Aid Rangelands: Spatial and Temporal Relationships Differ. Remote Sens. 2018, 10, 1474. [Google Scholar] [CrossRef]
  13. Tucker, C.J.; Fung, I.Y.; Keeling, C.D.; Gammon, R.H. Relationship between Atmospheric CO2 Variations and a Satellite-Derived Vegetation Index. Nature 1986, 319, 195–199. [Google Scholar] [CrossRef]
  14. Smith, W.; Reed, S.C.; Cleveland, C.C.; Ballantyne, A.P.; Anderegg, W.R.L.; Wieder, W.R.; Liu, Y.Y.; Running, S.W. Large Divergence of Satellite and Earth System Model Estimates of Global Terrestrial CO2 Fertilization. Nat. Clim. Chang. 2016, 6, 306–310. [Google Scholar] [CrossRef]
  15. Running, S.W.; Nemani, R.R.; Heinsch, F.A.; Zhao, M.; Reeves, M.; Hashimoto, H. A Continuous Satellite-Derived Measure of Global Terrestrial Primary Production. BioScience 2004, 54, 547. [Google Scholar] [CrossRef]
  16. Robinson, N.P.; Allred, B.W.; Smith, W.K.; Jones, M.O.; Moreno, A.; Erickson, T.A.; Naugle, D.E.; Running, S.W. Terrestrial Primary Production for the Conterminous United States Derived from Landsat 30 m and MODIS 250 m. Remote Sens. Ecol. Conserv. 2018, 4, 264–280. [Google Scholar] [CrossRef]
  17. Jones, M.O.; Robinson, N.P.; Naugle, D.E.; Maestas, J.D.; Reeves, M.C.; Lankston, R.W.; Allred, B.W. Annual and 16-Day Rangeland Production Estimates for the Western United States. Rangel. Ecol. Manag. 2021, 77, 112–117. [Google Scholar] [CrossRef]
  18. McNaughton, S.J. Compensatory Plant Growth as a Response to Herbivory. Oikos 1983, 40, 329. [Google Scholar] [CrossRef]
  19. Milchunas, D.G.; Lauenroth, W.K. Quantitative Effects of Grazing on Vegetation and Soils Over a Global Range of Environments: Ecological Archives M063-001. Ecol. Monogr. 1993, 63, 327–366. [Google Scholar] [CrossRef]
  20. Ramula, S.; Paige, K.N.; Lennartsson, T.; Tuomi, J. Overcompensation: A 30-year Perspective. Ecology 2019, 100, e02667. [Google Scholar] [CrossRef]
  21. McNaughton, S.J.; Milchunas, D.G.; Frank, D.A. How Can Net Primary Productivity Be Measured in Grazing Ecosystems? Ecology 1996, 77, 974–977. [Google Scholar] [CrossRef]
  22. Duniway, M.C.; Bestelmeyer, B.T.; Tugel, A. Soil Processes and Properties That Distinguish Ecological Sites and States. Rangelands 2010, 32, 9–15. [Google Scholar] [CrossRef]
  23. United States Department of Agriculture, N.R.C.S. Ecological Site Description for Loamy Plains (R067BY002CO). Available online: https://edit.jornada.nmsu.edu/catalogs/esd/067B/R067BY002CO (accessed on 11 March 2024).
  24. United States Department of Agriculture, N.R.C.S. Ecological Site Description for Sandy Plains (R067BY024CO). Available online: https://edit.jornada.nmsu.edu/catalogs/esd/067B/R067BY024CO (accessed on 11 March 2024).
  25. United States Department of Agriculture, N.R.C.S. Ecological Site Description for Salt Flat (R067BY033CO). Available online: https://edit.jornada.nmsu.edu/catalogs/esd/067B/R067BY033CO (accessed on 11 March 2024).
  26. Milchunas, D.G.; Lauenroth, W.K. Effects of Grazing on Vegetation. In Ecology of the Shortgrass Steppe; Oxford University Press: Oxford, UK, 2008; ISBN 978-0-19-513582-4. [Google Scholar]
  27. Spiegal, S.; Bestelmeyer, B.T.; Archer, D.W.; Augustine, D.J.; Boughton, E.H.; Boughton, R.K.; Cavigelli, M.A.; Clark, P.E.; Derner, J.D.; Duncan, E.W.; et al. Evaluating Strategies for Sustainable Intensification of US Agriculture through the Long-Term Agroecosystem Research Network. Environ. Res. Lett. 2018, 13, 034031. [Google Scholar] [CrossRef]
  28. Lauenroth, W.K.; Burke, I.C. Ecology of the Shortgrass Steppe: A Long-Term Perspective; Oxford University Press: Oxford, UK, 2008. [Google Scholar]
  29. Fernández-Giménez, M.E.; Augustine, D.J.; Porensky, L.M.; Wilmer, H.; Derner, J.D.; Briske, D.D.; Stewart, M.O. Complexity Fosters Learning in Collaborative Adaptive Management. Ecol. Soc. 2019, 24, art29. [Google Scholar] [CrossRef]
  30. Wilmer, H.; Augustine, D.J.; Derner, J.D.; Fernández-Giménez, M.E.; Briske, D.D.; Roche, L.M.; Tate, K.W.; Miller, K.E. Diverse Management Strategies Produce Similar Ecological Outcomes on Ranches in Western Great Plains: Social-Ecological Assessment. Rangel. Ecol. Manag. 2018, 71, 626–636. [Google Scholar] [CrossRef]
  31. Davis, K.P.; Augustine, D.J.; Monroe, A.P.; Derner, J.D.; Aldridge, C.L. Adaptive Rangeland Management Benefits Grassland Birds Utilizing Opposing Vegetation Structure in the Shortgrass Steppe. Ecol. Appl. 2020, 30, e02020. [Google Scholar] [CrossRef]
  32. R Core Team. In R: A Language and Environment for Statistical Computing; R Foundation for Statistical Computing: Vienna, Austria, 2023.
  33. Gao, F.; Hilker, T.; Zhu, X.; Anderson, M.; Masek, J.; Wang, P.; Yang, Y. Fusing Landsat and MODIS Data for Vegetation Monitoring. IEEE Geosci. Remote Sens. Mag. 2015, 3, 47–60. [Google Scholar] [CrossRef]
  34. Gao, F.; Masek, J.; Schwaller, M.; Hall, F. On the Blending of the Landsat and MODIS Surface Reflectance: Predicting Daily Landsat Surface Reflectance. IEEE Trans. Geosci. REMOTE Sens. 2006, 44, 2207–2218. [Google Scholar]
  35. Claverie, M.; Ju, J.; Masek, J.G.; Dungan, J.L.; Vermote, E.F.; Roger, J.-C.; Skakun, S.V.; Justice, C. The Harmonized Landsat and Sentinel-2 Surface Reflectance Data Set. Remote Sens. Environ. 2018, 219, 145–161. [Google Scholar] [CrossRef]
  36. Kearney, S.P.; Porensky, L.M.; Augustine, D.J.; Gaffney, R.; Derner, J.D. Monitoring Standing Herbaceous Biomass and Thresholds in Semiarid Rangelands from Harmonized Landsat 8 and Sentinel-2 Imagery to Support within-Season Adaptive Management. Remote Sens. Environ. 2022, 271, 112907. [Google Scholar] [CrossRef]
  37. Bates, D.; Machler, M.; Bolker, B.M.; Walker, S.C. Fitting Linear Mixed-Effects Models Using Lme4. J. Stat. Softw. 2015, 67, 1–48. [Google Scholar] [CrossRef]
  38. Augustine, D.J.; Dijkstra, F.A.; William Hamilton Iii, E.; Morgan, J.A. Rhizosphere Interactions, Carbon Allocation, and Nitrogen Acquisition of Two Perennial North American Grasses in Response to Defoliation and Elevated Atmospheric CO2. Oecologia 2011, 165, 755–770. [Google Scholar] [CrossRef] [PubMed]
  39. Irisarri, J.G.N.; Derner, J.D.; Porensky, L.M.; Augustine, D.J.; Reeves, J.L.; Mueller, K.E. Grazing Intensity Differentially Regulates ANPP Response to Precipitation in North American Semiarid Grasslands. Ecol. Appl. 2016, 26, 1370–1380. [Google Scholar] [CrossRef] [PubMed]
  40. Augustine, D.J.; Derner, J.D.; Milchunas, D.; Blumenthal, D.; Porensky, L.M. Grazing Moderates Increases in C3 Grass Abundance over Seven Decades across a Soil Texture Gradient in Shortgrass Steppe. J. Veg. Sci. 2017, 28, 562–572. [Google Scholar] [CrossRef]
  41. Boughton, E.H.; Gomez-Casanovas, N.; Swain, H.; Bernacchi, C.; Boughton, R.K.; Brinsko, K.; Li, H.; Rivero, A.; DeLucia, E.H.; Sparks, J. Patch-Burn Grazing Impacts Forage Resources in Subtropical Humid Grazing Lands. Rangel. Ecol. Manag. 2022, 84, 10–21. [Google Scholar] [CrossRef]
  42. Schoenecker, K.A.; Zeigenfuss, L.C.; Augustine, D.J. Can Grazing by Elk and Bison Stimulate Herbaceous Plant Productivity in Semiarid Ecosystems? Ecosphere 2022, 13, e4025. [Google Scholar] [CrossRef]
  43. Gaffney, R.; Augustine, D.J.; Kearney, S.P.; Porensky, L.M. Using Hyperspectral Imagery to Characterize Rangeland Vegetation Composition at Process-Relevant Scales. Remote Sens. 2021, 13, 4603. [Google Scholar] [CrossRef]
Figure 1. Location map of the Central Plains Experimental Range (CPER) along with CPER pasture boundaries, treatments, and locations of plots. Each plot includes four transects, two of which were used to measure aboveground net herbaceous production (ANHP) by clipping biomass in one 0.18 m2 quadrat inside each of two movable grazing cages per transect. Cages were located ~10 m and ~20 m along each transect.
Remotesensing 16 02780 g001
Figure 2. Example NDVI curves of three grazing management strategies. All pastures are located on a Loamy Plains ecosite. (A) NDVI curves for an ungrazed pasture compared to a pasture that was grazed season-long. (B) NDVI curves for an ungrazed pasture and a pasture that was pulse-grazed.
Remotesensing 16 02780 g002
Figure 3. Example APAR curves for four grazing management strategies. All pastures are located on a Loamy Plains ecosite in 2019. (A) Pasture ungrazed for the entire growing season. (B) Pasture experiencing season-long grazing (C) Pasture experiencing pulse grazing, (D) Pasture considered ungrazed since grazing occurred after the biomass clipping date.
Remotesensing 16 02780 g003
Figure 4. Flow chart of data processing to develop iAPAR model. (PAR) Photosynthetically active radiation. (APAR) Plant-absorbed photosynthetically active radiation, (NDVI) normalized difference vegetation index.
Remotesensing 16 02780 g004
Figure 5. Ground-collected Above Ground Net Herbaceous Production (ANHP) values to satellite-based iAPAR values. The analysis involved assessing the slopes of the linear relationships after allowing random intercepts to vary by year and plot ID (top panels). We also visualize a more realistic prediction scenario where only fixed effects are considered when predicting ANHP (bottom panels). Points represent the ground-collected data, with colors and shapes denoting different grazing managements. Lines depict linear relationships between predicted ANHP and iAPAR values. Lines sharing letters did not have significantly different slopes (Tukey HSD; p < 0.05).
Remotesensing 16 02780 g005
Figure 6. Coefficients with 95% confidence intervals for a linear mixed model predicting ANHP based on iAPAR, ecosite, grazing management treatment, and interactions of these factors. Large circles denote mean coefficients, and lines display 95% confidence intervals. Interaction terms included denoted by “:”.
Remotesensing 16 02780 g006
Figure 7. Ground-collected Aboveground Net Herbaceous Production (ANHP) values compared to satellite-based iAPAR values. The season-long heavy treatment was only conducted from 2019 to 2022 on the Loamy Plains ecosite, so we subset data for other grazing management treatments to only include those years and ecosite. The analysis involved assessing the slopes of the linear relationship between iAPAR and ground-based ANHP. Points represent ground-collected data, with colors and shapes denoting different grazing management treatments. Lines display linear relationships between ANHP and iAPAR values. No significant differences were found among grazing treatments (Tukey HSD; p > 0.05).
Remotesensing 16 02780 g007
Figure 8. Ground-collected Above Ground Net Herbaceous Production (ANHP) values compared to satellite-based predicted ANHP using either the Rangeland Analysis Platform output (top panels) or our empirical model derived from iAPAR (bottom panels). Points represent the ground data, with colors and shapes denoting different grazing managements. Lines display linear relationships between observed (ground-based) ANHP and predicted (satellite-based) ANHP. The solid black line represents the 1:1 relationship.
Remotesensing 16 02780 g008
Table 1. Estimated coefficients, standard errors, and significance levels for the fixed effects obtained from the empirical linear mixed model. The reference level for the ecosite was Loamy Plains, and for grazing management, the reference level was season-long grazing.
Dependent Variable:
ANHP (SE) (kg/ha −1)
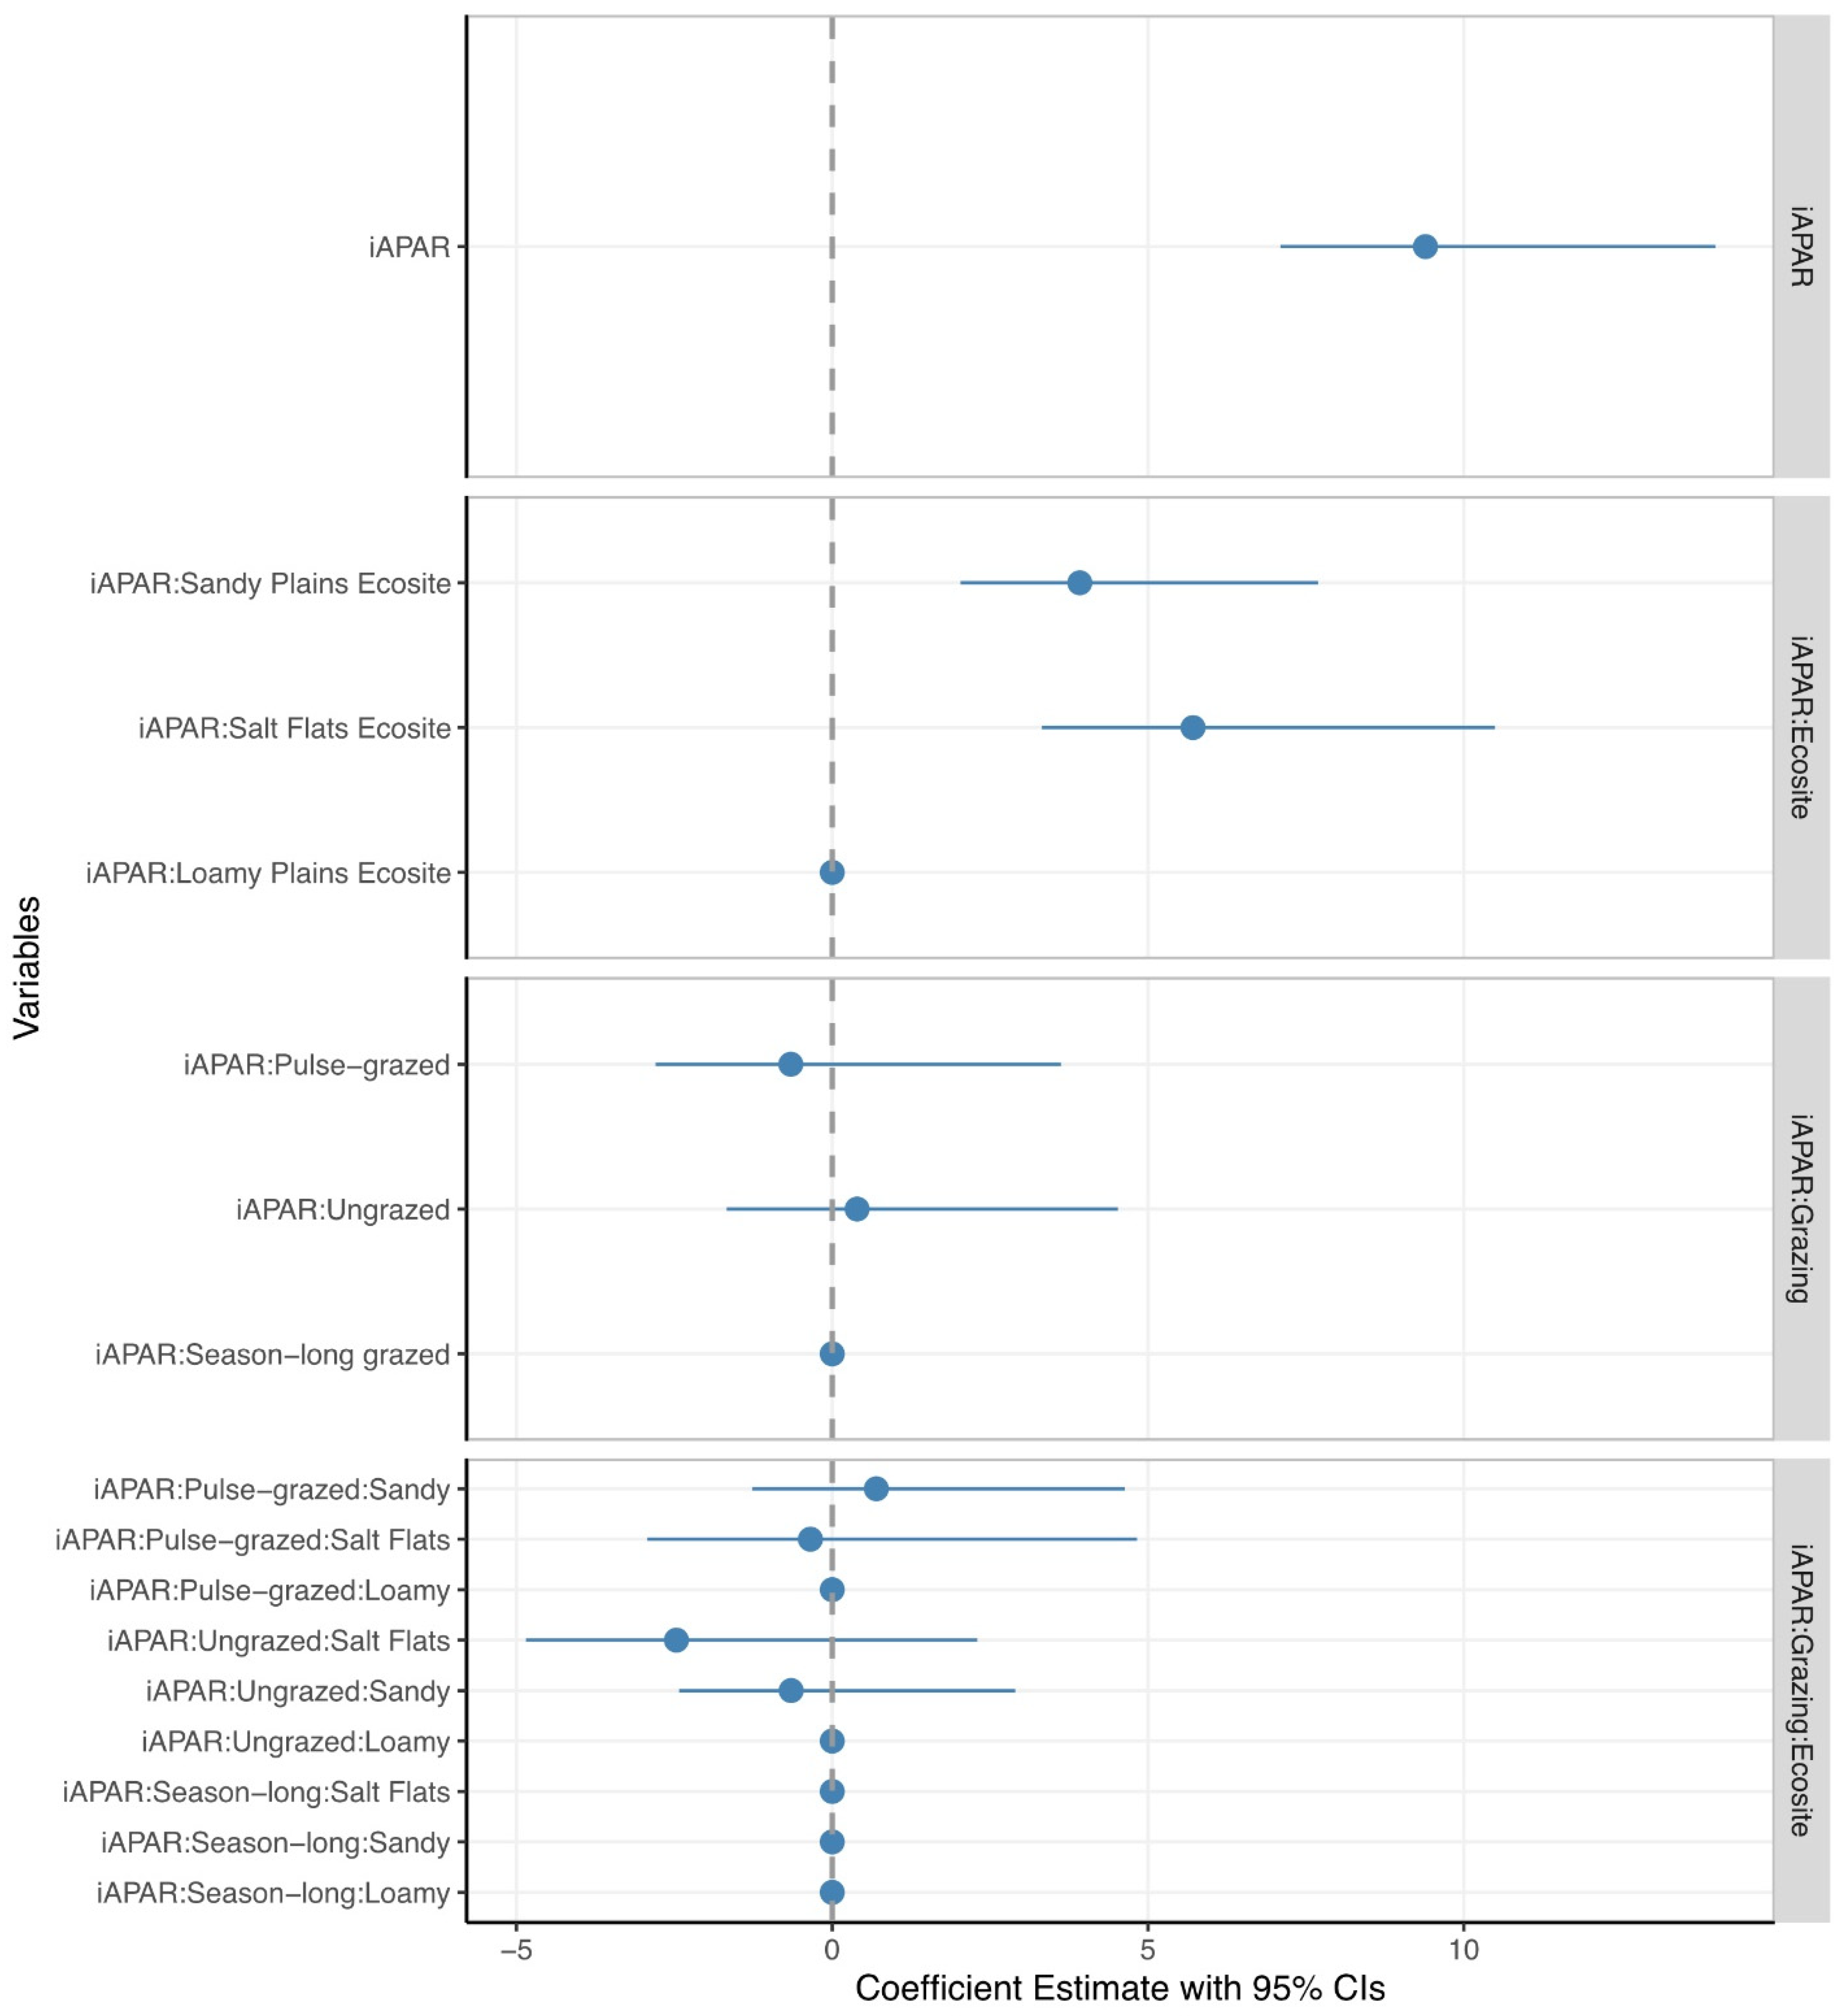
iAPAR9.39 *** (1.17)
Grazing management: Ungrazed−11.96 (92.45)
Grazing management: Pulse-grazed55.44 (78.54)
Ecosite Sandy Plains−28.11 (77.39)
Ecosite Salt Flats94.16 (110.03)
iAPAR: Grazing management: Ungrazed0.39 (1.05)
iAPAR: Grazing management: Pulse-grazed−0.65 (1.09)
iAPAR: Ecosite Sandy Plains3.92 *** (0.96)
iAPAR: Ecosite Salt Flats5.71 *** (1.22)
iAPAR: Grazing management: Ungrazed: Ecosite Sandy Plains−0.65 (0.90)
iAPAR: Grazing management: Pulse-grazed: Ecosite Sandy Plains0.69 (1.00)
iAPAR: Grazing management: Ungrazed: Ecosite Salt Flats−2.46 * (1.21)
iAPAR: Grazing management: Pulse-grazed: Ecosite Salt Flats−0.34 (1.32)
Constant149.95 (119.99)
Observations852
Log Likelihood−6037.74
Akaike Inf. Crit.12,109.50
Bayesian Inf. Crit.12,190.20
Note: * p < 0.05; *** p < 0.001.
Table 2. Comparing predictions from RAP and the empirical iAPAR model. Model metrics used included mean absolute error (MAE; absolute value of observed minus predicted value), MAE percent (MAE%; the percentage of the mean absolute error relative to the mean of the response variables), mean percent error (MPE; mean of the observed value minus the predicted value divided by the observed value), mean absolute percent error (MAPE; mean of the absolute values of observed minus predicted divided by the observed values), R2 (coefficient of determination), and r (Pearson correlation coefficient) to evaluate model fit. The metrics were calculated for all ecosites together and for individual ecosites. To see a breakdown of error metrics by ecosite and grazing management, see Supplemental Table S1.
SourceEcositeMAE (kg/ha−1)MAE%MPE%MAPE%R2r
iAPARAll268.5125.60−14.9732.640.620.78
RAP343.0832.71−28.5749.590.400.72
iAPARLoamy Plains249.2128.00−17.1635.510.490.70
Sandy Plains290.5825.32−13.9431.600.580.76
Salt Flats295.7519.92−8.1422.860.670.82
RAPLoamy Plains301.7733.90−47.9859.670.400.72
Sandy Plains354.0830.85−12.0839.760.360.74
Salt Flats494.0333.2713.4031.020.070.80
Disclaimer/Publisher’s Note: The statements, opinions and data contained in all publications are solely those of the individual author(s) and contributor(s) and not of MDPI and/or the editor(s). MDPI and/or the editor(s) disclaim responsibility for any injury to people or property resulting from any ideas, methods, instructions or products referred to in the content.

