Abstract
Deep learning techniques are increasingly applied to point cloud semantic segmentation, where single-modal point cloud often suffers from accuracy-limiting confusion phenomena. Moreover, some networks with image and LiDAR data lack an efficient fusion mechanism, and the occlusion of images may do harm to the segmentation accuracy of a point cloud. To overcome the above issues, we propose the integration of multi-modal data to enhance network performance, addressing the shortcomings of existing feature-fusion strategies that neglect crucial information and struggle with matching modal features effectively. This paper introduces the Multi-View Guided Point Cloud Semantic Segmentation Model (MVG-Net), which extracts multi-scale and multi-level features and contextual data from urban aerial images and LiDAR, and then employs a multi-view image feature-aggregation module to capture highly correlated texture information with the spatial and channel attentions of point-wise image features. Additionally, it incorporates a fusion module that uses image features to instruct point cloud features for stressing key information. We present a new dataset, WK2020, which combines multi-view oblique aerial images with LiDAR point cloud to validate segmentation efficacy. Our method demonstrates superior performance, especially in building segmentation, achieving an F1 score of 94.6% on the Vaihingen Dataset—the highest among the methods evaluated. Furthermore, MVG-Net surpasses other networks tested on the WK2020 Dataset. Compared to backbone network for single point modality, our model achieves overall accuracy improvement of 5.08%, average F1 score advancement of 6.87%, and mean Intersection over Union (mIoU) betterment of 7.9%.
1. Introduction
Point clouds, consisting of unstructured three-dimensional coordinate data, offer an accurate and detailed portrayal of the physical world [1]. With the advent of sophisticated hardware technologies, such as 3D sensors, the acquisition of point cloud data has become increasingly feasible, leading to a surge in their utilization across diverse fields including geographical research, computer vision, architecture, heritage preservation, and mining operations [2]. Among the various applications of point clouds, semantic segmentation has garnered significant attention as it aims to assign meaningful labels to each point in the cloud, facilitating the understanding of large-scale outdoor scenes and enabling various downstream tasks such as object detection and autonomous navigation.
Historically, traditional approaches to point cloud semantic segmentation have primarily relied on handcrafted features and heuristic rules for object classification. While methods like random forests and support vector machines have shown some promise [3], they often suffer from limitations in capturing the intricate relationships between neighboring points, leading to suboptimal segmentation outcomes in complex scenes.
In recent years, the application of deep learning techniques has revolutionized point cloud processing, offering more robust and accurate segmentation capabilities. Depending on the number of data sources utilized during model training and inference, point cloud deep learning semantic segmentation tasks can be broadly categorized into single-modal and multi-modal methods.
Single-modal point cloud semantic segmentation strictly relies on the point cloud data themselves and their inherent attributes for the task of assigning semantic labels to each point. To enhance the segmentation accuracy, some methods incorporate additional information, such as density, return number, spectral data, etc. [4,5], leading to improvements in segmentation precision [6,7]. Nevertheless, due to the inherent limitations of single-modal point cloud data, such methods often encounter challenges at the boundaries of different land covers in complex environments, resulting in confusion and reduced accuracy. To address these limitations, scholars have increasingly explored the integration of multi-modal data for semantic segmentation tasks.
Multi-modal point cloud semantic segmentation refers to the joint utilization of data from multiple types of sensors to achieve semantic segmentation of point clouds. It has attracted considerable attention because the rich texture information contained in image data can complement the spatial information provided by LiDAR data, thereby enhancing the segmentation accuracy of point clouds. However, how to fuse the data features of different modalities poses a challenge.
Some scholars have attempted to integrate 2D features from different modalities using projection-based approaches. For example, Madawi et al. [8] introduced a projection method that maps LiDAR point cloud onto a spherical surface, generating dense 2D images. These images were then processed by an encoder to extract spatial and texture features, which were subsequently concatenated in the decoder to enrich the feature dimensionality of the point cloud. Similarly, PointPainting [9] performs semantic segmentation on 2D images and projects the resulting pixel-wise labels onto the point cloud attributes. This approach leverages the rich semantic information from 2D images to enhance the segmentation accuracy of the point cloud. However, these projection-based methods primarily emphasize 2D data, often neglecting the inherent spatial representation capabilities of point clouds. Converting point clouds from their high-dimensional space to a lower-dimensional representation can result in the loss of crucial spatial information, thereby limiting the overall performance of the model.
To address this limitation and avoid information loss from projection, researchers have increasingly turned their attention to direct processing of raw data. Zhao et al. [10] exploited calibration data to establish a precise correspondence between point cloud and images. They fused features extracted by backbone networks from both modalities at intermediate layers, effectively improving model performance. Yuan et al. [11] further advanced this concept by introducing a teacher–student structure with a cross-modal fusion module. This architecture concatenates features from popular backbone networks at multiple encoder levels, facilitating knowledge transfer and enhancing segmentation accuracy. Scholars have proposed various optimization strategies [12], for instance Yan et al. [13] introduced a multi-scale fusion framework that merges features extracted from both image and point cloud modalities. This approach involves obtaining point-wise image features from backbone networks designed for image processing and extracting point features from voxelized point clouds using separate backbone networks. A key aspect of their method is the integration of a multi-layer perceptron fusion module, which effectively distills knowledge from 2D to 3D representations, thereby improving the accuracy of point cloud segmentation. Zhuang et al. [14] took a different approach by developing a perception-based multi-sensor fusion module. Their method focuses on optimizing the original point cloud features by aggregating complementary information from connected features. This is achieved through the construction of a residual fusion structure within the encoder stage, enabling the integration of diverse data sources to enhance overall model performance.
Although these multimodal fusion methods have a certain effect on improving segmentation accuracy, they all fail to consider the weight distribution of different modal data features in the segmentation task, leading to flaws in the final fusion mechanism and fusion model, which limits the further improvement of segmentation accuracy. Additionally, due to the occlusion relationships between ground objects, it is difficult to achieve a complete match between single-view image pixels and point clouds, causing fusion errors and limiting the potential for enhancing network performance.
To address these issues, this paper proposes a multi-view guided point cloud semantic segmentation network (MVG-NET). This network leverages multi-angle texture information and an attention-based feature-fusion mechanism to realize the weight distribution of different modal features, thereby enhancing the focus on critical regions of point features and optimizing the outcome of point semantic segmentation.
The main contributions of this paper can be summarized as follows:
- (1)
- We propose MVG-NET, a multi-view guided LiDAR point cloud semantic segmentation model. This model directly integrates diverse modal data into the backbone network for feature extraction, significantly enhancing the interaction and fusion of features across different modalities.
- (2)
- We introduce two innovative modules: the perspective-based multi-view image feature-aggregation module and the image-guided feature-fusion module. The former reduces redundant information by aggregating texture features from multiple perspectives, while the latter highlights key point cloud features through attention-based fusion across multiple scales.
- (3)
- We develop a joint loss function designed for global optimization. This loss function not only computes the loss for single-modal semantic segmentation tasks but also considers the similarity between point-wise label predictions derived from pixels and points.
- (4)
- We establish a comprehensive dataset named WK2020 to validate the performance of our network. This dataset comprises aerial images captured from five distinct perspectives, providing both top and side views of buildings. Additionally, it includes intrinsic and extrinsic parameters for each image, facilitating the establishment of precise correspondences between point cloud and images.
2. Related Works
2.1. Single-Modal Semantic Segmentation for Point Clouds
In recent years, the single-modal semantic segmentation models for point clouds have achieved great development. While PointNet-based models [15,16] have proved the great ability of Multi Layer Perceptron (MLP) in extracting spatial features from 3D point cloud data, most sampling operations among similar models are computationally inefficient for large-scale point cloud-segmentation tasks. To address these issues, RandLANet [17] utilizes random sampling to expedite the downsampling process during encoding. The model also incorporates attention mechanisms and position encoding of points to emphasize relationships between neighboring points, ensuring segmentation accuracy and computational efficiency.
Point convolutional operators are considered reliable for emphasizing local features, such as PointCNN [18]. Models like PointConv [19] and KPConv [20] further build point convolutional kernels for the extraction of point features. However, these methods require a large number of preset kernel parameters, resulting in lower model robustness.
Projection-based models have also garnered great attention. Initially, 3D points are projected onto 2D planes to generate multiple comprehensive images, and later image-based backbone networks (such as FCN [21]) are utilized to extract pixel features, which are then back-projected onto 3D points for further segmentation [22,23,24]. Some models project 3D points into higher dimensional spaces to acquire extra features for model optimization [25]. However, the transformation of dimensions inevitably results in the loss of geometric information and spatial relationships.
Nevertheless, networks based on voxelized point clouds are also widely applied in large-scale point cloud semantic segmentation [26,27]. However, due to the high consumption of 3D convolutional kernels, the networks usually adopt large sizes of voxel during the downsampling process, making it difficult to capture the features of small-scale objects on each layer, which to some extent limits the segmentation performance of the model.
Some scholars have integrated features from various representations of point clouds to optimize segmentation results. For example, Cylinder3D [28] integrates features from points and voxels, while RPVNet [29] integrates features from voxels, points, and depth images. The fusion of multi-scale and multi-style features also improves point cloud-segmentation accuracy, but fundamentally, they are still aggregations of sparse point cloud spatial features, lacking dense texture information to optimize segmentation results.
2.2. View Selection and Aggregation
Multi-view images are often employed in 3D reconstruction tasks, with many related studies optimizing the Next Best View (NBV) selection problem [30,31] to achieve the best texture mapping and camera pose parameters are crucial for selecting relevant images and obtaining precise texture information.
For point cloud semantic segmentation tasks that integrate multi-view oblique images, there exists a many-to-one relationship between images and corresponding point cloud regions. Similarly, the camera pose can also play an important role in improving the accuracy of texture features from multiple images. For instance, Robert et al. [32] first construct view condition features based on the camera pose parameters of multi-view images. Later, view condition features are used to calculate attention scores and weight the corresponding image features to realize the refinement, and then refined image features are concatenated with the point features for subsequent coding, which effectively improves the accuracy of point segmentation.
Multi-view images are also commonly utilized in shape-recognition tasks, in which view-aggregation operations are widely applied. For instance, the MVCNN [33] extracts and connects features with CNN architecture to recognize 3D objects. Wang et al. [34] employ CNNs to extract image features and construct view similarity graphs as the relevant weights for the fusion of multi-view image features. Similarly, RotationNet [35] utilizes CNN structure to extract distribution maps of categories from images with different perspectives, and later the recognition results can be optimized with multi-view distribution maps of high relevance. Inspired by the aforementioned model structures, using multi-view images for convolutional encoding aggregation can effectively identify texture features strongly correlated with land cover objects. Although it is convincing that the end-to-end neutral network can effectively find the potential information of images, pure CNN structures still have certain limitations in extracting global and contextual features, and aggregation mechanisms from above models can hardly eliminate redundant information from multi-view images.
On the other hand, aggregation of multi-view image features is widely applied in the field of autonomous driving, in particular the studies about BEV (Bird’s Eye View) perception. Typically, the structure of Lift–Splat–Shoot (LSS) [36] estimates 3D coordinates of pixel features on multi-view images with projection relationships and depth estimation, and then “3D” features are splatted to the BEV plane to obtain BEV features of multi-view images, which are finally generated through sum pooling. Although the procedure can greatly utilize the rich information from multi-view images, the depth estimation on each image is not accurate enough, and simple sum pooling of multi-view image features ignores the contribution of texture information from different perspectives.
2.3. Strategies for Modality Fusion
Currently, the strategies for modality fusion in networks can be roughly divided into three categories: prior-level, feature-level, and decision-level [37].
Prior-level fusion refers to incorporating information provided by other modalities as prior knowledge, which is jointly imported into models along with the point cloud attributes. Chen et al. [38] first imported optical images into SegNet [39] to obtain point-wise image segmentation results, which were then incorporated into point features to optimize the point cloud-segmentation results. Similarly, Ballouch et al. [40] utilized the classification results of aerial images as prior knowledge for point clouds and incorporated them into RandLANet for learning, achieving an improvement in segmentation accuracy compared to single-modal segmentation models for point clouds. Compared to solely inputting point cloud data, incorporating prior knowledge from other modalities can enhance the discriminability of point clouds. However, this strategy only utilizes fixed-level image features and may not fully leverage features at different scales in images.
Feature-level fusion means the combination of multi-scale and multi-level features obtained from different modalities. The fused features can be utilized for subsequent coding. For instance, the 2DPASS [13] strengthens the features extracted from the backbone network through a knowledge-distillation module based on the relationships between depth images and point clouds. The MSeg3D model proposed by Li et al. [41] builds an attention structure with three sets of features, generated from points, images, and fused features, to obtain the final point cloud-segmentation results. Compared to using only point clouds, voxels, or depth images for point cloud semantic segmentation, the above methods have achieved superior improvements in segmentation accuracy. However, due to occlusion between single-view images and point clouds, the segmentation accuracy of the above networks can be awfully affected. Apart from segmentation tasks, the LSS-based 3D detection model BEVFusion [42] manages to fuse the LiDAR BEV features and the projected 3D BEV features generated from multi-view image features. The improvements in detection accuracy prove the feasibility of self-attention scores within the fused multi-modal features. However, the fusion scale of these models is still fixed at the same level, and the utilization of information on different scales from various modalities continues to be inadequate.
Decision-level fusion refers to the fusion of features encoded or segmentation results from different modalities at the end of the feature-extraction network to obtain the final result. Qin et al. [43] first constructed V-Net to acquire features of voxelized points and segmentation results, and then built the P-Net to obtain the classification results of point-wise pixels from images of projection. The final segmentation probability for point clouds is calculated as a weighted sum of the results from the two networks. Decision-level fusion can correct misclassifications to some extent, but the weights of prediction results from different modalities have a significant impact on the final result, and there is minimal exchange of deep features between modalities [44].
2.4. Loss Function for Multi-Modal Fusion Networks
Cross-entropy loss has been widely used in classification tasks and is frequently employed in both image semantic segmentation tasks [45,46] and point cloud semantic segmentation tasks [47] to measure the difference between predicted results and true labels of target categories. Some loss functions based on object labels and predicted probability distributions, such as smooth L1 loss and Lovasz loss [41], are also used to measure the differences between predicted values and true values in unbalanced sample sets. However, for multi-modal fusion models, single-task loss functions are ineffective in adjusting the computational parameters of other backbone networks, and the relationships between modalities are relatively loose.
To further enhance the interaction between modal segmentation tasks, some point cloud semantic segmentation models utilize KL divergence [13] as the loss function when incorporating images. By calculating the similarity between the probability distributions of corresponding pixels on the point cloud and the image, the network can globally update model parameters, strengthening the one-way knowledge-distillation process from image textures to point cloud, thus effectively improving segmentation accuracy. However, matching errors between single-view images and point clouds are common in complex urban areas. For instance, points labeled as trees may be consider as buildings in an aerial image due to occlusion caused by a fixed shooting angle. These mistakes further lead to errors in calculating KL divergence and problems in updating model parameters.
3. Dataset
Although many studies provide rich remote sensing data, datasets with well-matched imagery and LiDAR point cloud data are not common. The ISPRS Vaihingen Dataset is widely used for single-modal data-segmentation tasks, providing orthoimages and point clouds, along with geometric correspondence parameters. However, while the point cloud contains labels for nine classes, the imagery only includes labels for six classes of land cover objects. The mismatch of different modalities in labels leads to challenges in data preprocessing and loss function computation. Additionally, researchers have established the N3C-California dataset [48], which offers well-matched orthoimages and LiDAR coverage, facilitating the use of raw data for model training and testing. Regretfully, the labels of images in the N3C dataset contain a considerable amount of noise, affecting the training of the imagery data to some extent.
To avoid the impact of misaligned and incomplete labels in multimodal data on the model and further validate the performance of the proposed multi-view guided point cloud semantic segmentation model, we constructed a dataset named WK2020, which covers urban and rural areas and includes three classes of land cover objects: buildings, impervious surfaces, and land vegetation. In addition to LiDAR data, the dataset also provides multi-view oblique aerial images from five angles (forward left, right, backward, and nadir). Each captured aerial image consists of 14,192 × 10,640 pixels. Compared to the N3C dataset, the number of noise pixels in the image labels of this dataset has been significantly reduced.The WK2020 Dataset comes from actual production tasks, using the latest Leica CityMap equipment to obtain standard data. It is a typical set of data with a much larger data volume than the Vaihingen Dataset provided by ISPRS. The ground coverage area is 4.6 square kilometers, and the volume of data in sum is 167.3 GB, including 67.3 GB of oblique images and 100 GB of LiDAR points.
This dataset selected two large-scale point cloud regions, one of which contains about 16.6 million points covering about 0.33 km for the training and validation set, and the other one contains about 2 million points covering about 0.12 km for the test set. To rapidly start the experiments and meet the restriction of our workstation, we resample the points for convenience. The average point density of two areas is 15 pt/m2. While constructing the image samples, we select 10 original images as the source of the training and validation set, and choose the other 12 images as the source of the test set. Both modalities of data contain three identical land cover labels: buildings, impervious surfaces, and land vegetation. The distribution of various types of points in the two point cloud area is shown in Table 1.

Table 1.
The distribution of categories in the point cloud area.
We first select 4096 neighboring points from the point cloud area as one point cloud sample. Then, five downsampled oblique images are randomly selected from different viewpoints in the original image data. These downsampled images are then split into corresponding regions of size 224 × 224, serving as a set of multi-view oblique image samples for the respective point cloud region. After sampling, 4000 samples are chosen as the training set and 1000 samples are chosen as the validation set, while 2000 samples are chosen as the test set. An illustration of the sampling process is shown in Figure 1.
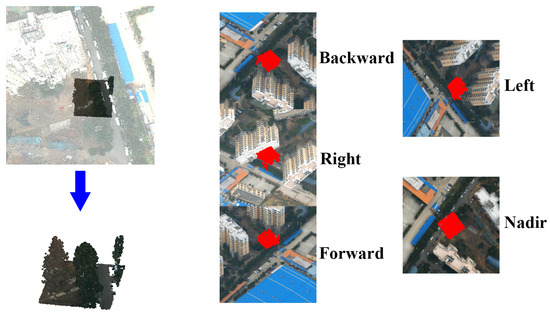
Figure 1.
The sampling illustration of the WK2020 Dataset.
4. Methodology
4.1. Network Structure
To better optimize the fusion of texture and spatial information to improve the accuracy of the point cloud segmentation task, we propose a new multi-modal point cloud semantic segmentation model based on feature-level fusion, named MVG-Net, as illustrated in Figure 2.

Figure 2.
Network structure of MVG-Net.
The MVG-Net model consists of the following core components:
- We design parallel backbone networks for feature extraction of image and LiDAR data, and the similar U-shape encoder–decoder structure manages to acquire features of multiple layers and scales, while the skip connection can preserve detailed information.
- In each upsample layer of the decoder, the multi-view image features can be well matched with point features through geometric matching based on projection relationships.
- Before the fusion of features from two modalities, we design the perspective-based multi-view feature-aggregation module (PMFA) for generating prominent features from multi-view images while reducing information redundancy.
- After the aggregation of multi-view image features, we propose the image-guided feature-fusion module (IGF) to enhance key information of point cloud features with the attention score from aggregated image features. The layer-by-layer fusion of image and LiDAR features achieves the accumulation and the transmission of reinforced information.
- a global joint loss function is designed to update model parameters by computing similarity measurement between the predicted probability distribution of strongly correlated image pixels and point clouds.
4.2. Backbone Networks and Geometric Matching
Considering that aggregating texture information displayed at different scales in images can effectively enhance object distinction, we construct the Unet-like network structure as the image feature-extraction backbone network to transmit texture information from different scales and levels. Moreover, to strengthen the communication within the window of image features, the Swin-Transformer [45] structure is applied to provide abundant local and contextual information from multi-view images.
The inspiration for the point cloud feature-extraction backbone network of MVG-Net comes from RandLANet [17], which proposes the LFA module (Local Feature Aggregation) that aggregates local features with spatial neighborhood encoding and self-attention mechanisms for point clouds. Combined with skip connections and upsampling operations, the network effectively expands the feature scales of the point cloud. The two networks take hardware limitations into account while achieving the extraction of multi-level, multi-dimensional features from each modality, moreover preserving texture and spatial information at different scales.
Geometric matching primarily relies on the geographic coordinate information of point cloud and the orientation parameters of images, such as affine transformation parameters in TIFF World File and the extrinsic and intrinsic parameters of the oblique cameras. The coordinate refers to the spatial information (XYZ) of each point, while the orientation parameters contain the transformation relationships between the pixel coordinates and the corresponding 3D spatial points. With these parameters, the position of each spatial point in the image can be obtained, allowing for the extraction of corresponding pixel features.
For orthophotos, the matching relationship for alignment can be calculated as follows:
where X, Y mean true geographic coordinates of points, and x, y mean the image coordinates of corresponding points. The parameters A to F represent the Pixel resolution, parameters of rotation and the geographic coordinates of the pixel center in the upper left corner of the image.
For oblique images, the matching relationship for alignment can be calculated as follows:
where represents the matrix of rotation, are the geographic coordinates of target point, are the position of the camera, are the focal lengths in two directions, are the pixel coordinates of the image principal, and are the pixel coordinates of the target point after projection. Based on the camera parameters provided by each oblique image, the pixel coordinates of each point in the point cloud on that image can be determined.
4.3. Perspective-Based Multi-View Feature-Aggregation Module
Although the point-to pixel relationships can be easily constructed, it is still difficult to distinguish whether the corresponding pixels correctly represent the true texture of the target position. Texture information from different perspectives can be well integrated with the perspective-based multi-view feature-aggregation module, which can realize the extraction of prominent features and the filter of redundant information from features of multi-view images. The specific structure of this module is illustrated in Figure 3.
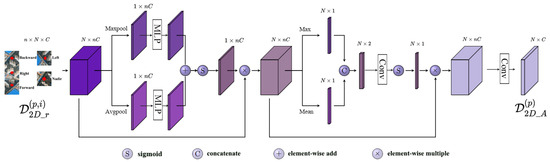
Figure 3.
Structure of perspective-based multi-view feature-aggregation module.
After geometric matching, the original multi-view image features can be extracted as pixel features corresponding to N points. We first calculate the weight score of images from different perspectives.
Based on the camera parameters provided by the oblique images, the normal vectors of each image can be obtained. The normal vector estimation of the point cloud adopts a neighborhood search method based on KDtree. First, a fixed number of points in the target point’s neighborhood are queried, and then a plane is constructed using the least squares fitting method. The normal vector of the plane represents the normal direction of the target point. The cosine value of the angle between two normal vectors can be calculated as follows:
When capturing a land cover object from the front, the normal of points on the object and the normal direction of the image are almost identical. Therefore, the smaller the angle between the normal of the image and the normal of the target point, the more comprehensive the texture of the object included in the image, and the greater the correlation between the image and point cloud modalities, as shown in Figure 4.
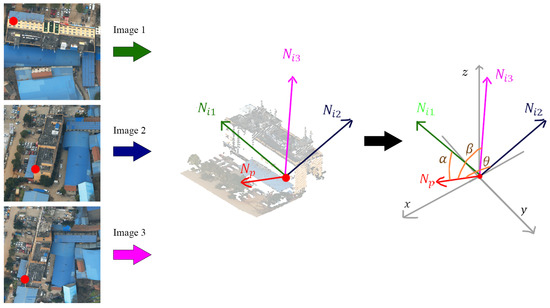
Figure 4.
The angle between image normals and point cloud normals.
Then, the angle between normals can be used to perform a weighted summation with pixel features to obtain the global features of multi-view images. Subsequently, the original pixel features are subtracted by the global features, further reducing the impact of redundant information among the multi-view images; the calculation can be summarized as follows:
where means the refined pixel features.
Later, inspired by the CBAM mechanism [49], we apply the approach to the processing of the channel field and spatial field in 1D data, and highlight the key features with the help of channel attention and spatial attention modules. The refined pixel features from n images are first concatenated on the channel dimension, recorded as .
The channel attention module can be described as follows:
where and , respectively, represent global max pooling and global average pooling operations. The fully connected layer sequence consists of 1 × 1 1D convolutional layers, ReLU activation functions, and another set of 1 × 1 1D convolutional layers, used for non-linear encoding of features. After the processed features are element-wise summed, the sigmoid function is used to compute the channel attention score. The original input feature is then weighted with the score to obtain the channel attention optimized features .
Subsequently, the optimized features are then subjected to a spatial attention module to emphasize the importance of the spatial position within the point cloud. This process can be described as follows:
where the symbol ⊕ means the concatenation operation. Similar to the channel attention, the max-pooling operation and average-pooling operation are applied to the weighted feature in the channel field. The two pooled feature maps are then concatenated along the channel dimension, and a convolutional layer and the sigmoid function are used to obtain the spatial attention scores. Finally, the spatial attention optimized image features are obtained by weighting.
Finally, the feature consists of channels from several image features, so another convolutional layer is applied to reduce the dimension of the channel, and the aggregated feature is acquired.
With the assistance of the multi-view image feature-aggregation module, precise acquisition of potential features from point-wise multi-view image features in both spatial and channel fields can be achieved, thereby reducing the impact of redundant information.
4.4. Image-Guided Feature-Fusion Module
Due to the fixed size of convolution kernels, the upsampling process in the point cloud backbone networks somehow ignores the interaction of information within different point cloud regions, while the contextual texture information provided by image features can effectively guide the local spatial features of points. We design an image feature guided multi-modal feature-fusion module that reasonably allocates the information provided by each modality. The specific structure of the module is illustrated in Figure 5.
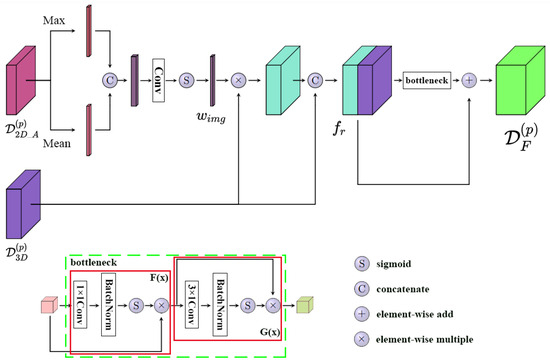
Figure 5.
The structure of image-guided feature-fusion module.
The procedure of feature fusion is as follows:
where represents the image features extracted pointwise based on set matching, and represents the corresponding point cloud features. and , respectively, denote the maximum and average operations along the channel dimension, which are used to identify prominent and potential features of point-wise pixels. Then, the two processed features are concatenated along the channel dimension, and a convolution operation is applied for feature integration. The sigmoid function is constructed to calculate the final attention score of the input image features. Later, the raw point cloud spatial features are weighted with the score to output the optimized point cloud features. To preserve the original spatial feature of the point cloud, it is concatenated with the weighted feature maps for subsequent processing.
A bottleneck module is utilized to enhance the fused feature, and the specific calculation is as follows:
where represents the output fused feature, consists of a sequence of 1 × 1 convolutional layer, batch normalization layer, and Sigmoid layer, while function has a similar structure but with a convolutional kernel size of 3 × 1. This structure aggregates information across multiple scales and adds it to the original fused feature, thereby preserving original information while emphasizing key features.
The fusion module facilitates the guidance effects of image texture information on point cloud spatial information, allowing interaction between features at different scales and increasing the diversity of descriptions for LiDAR point cloud. As the upsampling process goes, critical information of multi-scales can be transmitted along the layers.
4.5. Global Joint Loss Function
The global joint loss function of MVG-Net consists of two parts: the loss from two single-modal segmentation tasks and the similarity loss between point-wise segmentation results. By reinforcing the constraint relationship, it achieves the overall optimization of both single-modal backbone networks and global model parameters. Its definition is as follows:
where and represent input data from two modalities, and represents the output prediction distribution map of classes. represent cross-entropy loss and Dice loss, respectively, and is Kullback–Leibler divergence used to compute the similarity loss. mean the weight scores in the loss function of the image branch, which are set as 0.6 and 0.4.
For single-modal segmentation tasks, the main optimization of parameters is achieved through cross-entropy loss. Its definition is as follows:
where N represents the number of points or pixels, M represents the number of segmentation classes. represents the probability distribution of the segmentation result, and is used to determine whether the true label of the point or pixel is equal to the predicted category. Cross-entropy loss measures the difference between the predicted probability distribution and the actual target labels.
In addition, to better optimize the image model, the Dice loss is applied to the image-segmentation tasks. Its definition is as follows:
where N represents the number of pixels, represents the probability of the segmentation result, and is used to determine whether the true label of the pixel is equal to the predicted category. Dice loss is a region-based loss that balances the difference between positive and negative samples, showing good performance in image-segmentation networks.
We further consider the relationship between the segmentation results of the two modalities. Inspired by the knowledge-distillation loss function in current multi-modal semantic segmentation tasks [50], Kullback–Leibler divergence is further applied to strengthen the constraints between modalities, defined as follows:
where represent probability distribution maps from two modalities. In the calculation of the loss function, we consider the image-segmentation results as soft targets. By computing the difference in probability distributions between the segmentation results of image and point cloud objects at the same position, Kullback–Leibler divergence can more rigorously constrain the segmentation results, strengthening the interaction of information between modalities.
Especially when integrating multi-view oblique images, probability distribution maps of different perspectives can be obtained. Since KL divergence can only be calculated with prediction distribution maps of the same size, two methods can be used to compute inter-modality similarity loss, as illustrated in Figure 6.
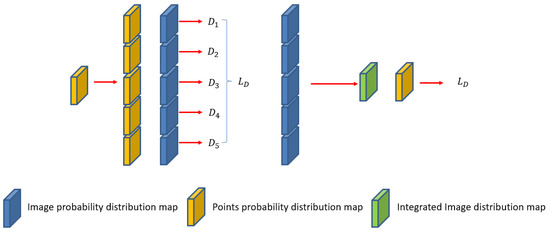
Figure 6.
Strategies of calculating K-L divergence with multi-view images.
For the left strategy, KL divergence values between the point cloud and point-wise pixels of each image are calculated, and the final loss is represented by the sum of these values. We adopts the right strategy to obtain the loss, which first aggregates the probability distribution maps of each image to obtain the most probable predicted probabilities as input for loss calculation, as shown in the following formula:
where represents the probability distribution of a point-wise pixel, represents the predicted class for that pixel on each image from the multi-view images, means the counts of the predictions about the pixel, and the function is used to obtain the pixel-distribution probability represented by the most frequently occurring predicted value. By selecting the most likely predicted class, the index of the image with the highest relevance can be obtained, and the point-wise probability of the image predictions is also available for loss calculation.
5. Experiment
5.1. Experiment Settings and Evaluation Metrics
The experiments were conducted on Ubuntu 20.24 using an NVIDIA GeForce RTX 3060 12G GPU. The deep learning framework was built on PyTorch 1.12 and CUDA 11.6.
The experiments primarily utilized the multi-view oblique images and LiDAR dataset provided by WK2020, with additional validation conducted on the orthoimages and LiDAR datasets from Vaihingen and N3C-California to assess the applicability of the proposed model.
For the WK2020 Dataset, this paper conducted four ablation studies: ablation study for the PMFA module, for the IGF module structure, for the IGF module scales, and for the loss function. Comparison experiments with state-of-the-art (SOTA) methods are also proposed.
The hyperparameters used for the model on the WK2020 Dataset were as follows: batch size of 4, maximum number of iterations set to 32, Adam optimizer chosen for the point cloud backbone network with a learning rate of 0.01, SGD optimizer chosen for the image backbone network with a learning rate of 0.05, weight decay set to 0.0001, and momentum set to 0.9.
On the Vaihingen Dataset, this paper compared the obtained results with some excellent methods. The hyperparameters used for the model were as follows: batch size of 4, maximum number of iterations set to 32, Adam optimizer chosen for the point cloud backbone network with a learning rate of 0.001, SGD optimizer chosen for the image backbone network with a learning rate of 0.001, weight decay set to 0.0001, and momentum set to 0.9. Due to the requirement of input data uniformity for semantic segmentation models, it was necessary to preprocess the multi-modal data. The paper segmented the orthophoto images into 512 × 512 size, and selected 4096 points from the point cloud data in the same area as a dataset sample.
On the N3C-California dataset, this paper conducted comparative experiments with some point-based semantic segmentation models and multi-modal models. Due to the large scale of the N3C-California dataset, the batch size was set to 2 and the maximum number of iterations was set to 32. The Adam optimizer was chosen for the point cloud backbone network with a learning rate of 0.001, while the SGD optimizer was chosen for the image backbone network with a learning rate of 0.001. Additionally, weight decay was set to 0.0001, and momentum was set to 0.9. Due to memory limitations, we downsampled the original point cloud data samples to 40960.
This paper primarily employs three metrics for evaluation: Overall Accuracy (OA), F1 score, and mean Intersection over Union (mIoU). OA measures the overall segmentation performance. F1 score combines precision and recall to assess the status of misclassification and omission. mIoU indicates the accuracy of each class and can also depict the extent of segmentation errors.
5.2. Experimental Results on WK2020
5.2.1. Comparing with SOTA Methods
In this section, we compare the proposed model with some state-of-the-art (SOTA) methods applicable to the WK2020 Dataset, such as PointNet, PointNet++, KPConv, and RandLANet, which are pure point cloud methods, as well as MSeg3D and 2DPASS, which are multi-modal fusion networks. Except for KPConv, which uses the SGD optimizer, all other relevant models have the same hyperparameters as mentioned in the previous chapters. The models primarily use point cloud coordinates (XYZ) as input without other attributes, and the segmentation results are shown in Table 2.
Table 2.
Comparison experiments with SOTA methods on WK2020 Dataset. The values are percentages (%).
In Table 2, the main indicators of PointNet++ and RandLANet are close, but typically the segmentation performance of the latter one is better than the former on some datasets. This phenomenon may be attributed to the relatively small size of point cloud samples in this paper, resulting in their similar capabilities to extract spatial features from small samples. Although the segmentation performance is similar, RandLANet still maintains a significant lead in efficiency due to the advantage of random sampling. Furthermore, RandLANet performs best among the single-modal models, which also demonstrates its capability in spatial feature extraction.
Compared to single-modal methods, the performance of the two multi-modal fusion segmentation models in the experiment actually deteriorated. This is largely attributed to fusion errors caused by the incomplete matching between the point cloud and point-wise pixels as mentioned. Our approach first analyzes the features of the respective data and implements the fusion of feature maps to extract key information while reducing redundant information. By leveraging texture information in the neighborhood of terrain objects, our method enhances the description of terrain features by the point cloud semantic segmentation model, resulting in improved accuracy.
To further visually demonstrate the performance of each model, we present the prediction results of several networks on the test set, highlighting the locations where segmentation errors are obvious. The results are shown in Figure 7.
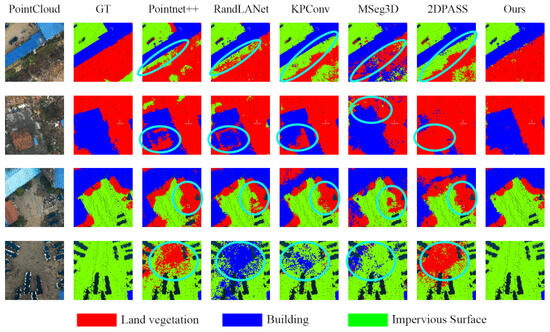
Figure 7.
Segmentation result of the SOTA networks and our model.
Comparing the segmentation results of our model with those of the single-modal networks, it can be observed that our model utilizes texture information from the images to correct some obvious confusion areas, such as misclassifications between impervious surfaces and land. The boundaries between these two classes are better delineated, and cases of misclassification between buildings and vegetation, as well as between impervious surfaces and land, are alleviated.
Additionally, guided by the image branch, our model can more accurately segment point cloud regions with similar layouts, such as mixed areas of trees and buildings. From the table and the figures, it can be seen that the impervious surface metrics in our model are lower than those of other classes. This is mainly due to two factors. Firstly, some impervious surface areas are structurally and color-wise similar to land areas, making it difficult to separate the points. What is more, labeling mistakes lead to errors during model training.
5.2.2. Ablation Study for the PMFA Module Structure
The PMFA module proposed in this paper employs attention mechanisms in both channel and spatial dimensions to extract salient features from the aerial images. In this experiment, we employ random choice, Slot Attention, and MLP methods for aggregating multi-view image features, and the comparative results with our proposed model are shown in Table 3.
Table 3.
Ablation study for the multi-view feature-aggregation module. The values are percentages (%).
Table 3 indicates that the aggregation module shows a greater improvement in accuracy compared to simply randomly selecting image features (random choice). Information from different images is effectively organized and significant features are highlighted through the aggregation module. The proposed aggregation module successfully emphasizes significant features in multi-view oblique images through channel and spatial attention processing, outperforming the slot attention module [51]. Compared to the simple MLP structure, the OA of segmentation result with our method is higher by 0.47%, while mIoU and average F1 score are higher by 1.05% and 0.84% respectively. This suggests that our proposed multi-view image-aggregation module can better enhance spatial feature representation and differentiate between different land features.
To show the impact of different aggregation mechanisms on segmentation results, we present selected segmentation results from the test set. The results are shown in Figure 8. The pictures show that the edge of an impervious road is often segmented as land vegetation with other aggregation strategies.
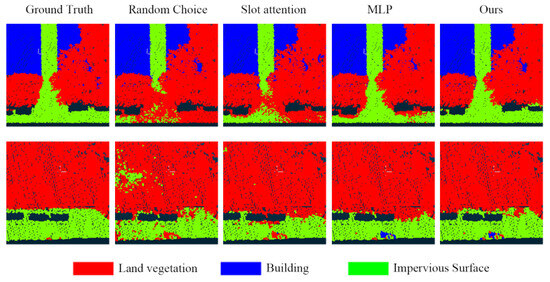
Figure 8.
Segmentation result with different aggregation modules.
5.2.3. Ablation Study for the IGF Module Structure
In this section, we design the ablation experiment for the IGF module structure to verify its advantages. We compare the performance by adjusting the fusion objects of the modules, as shown in Table 4, where RandLANet represents the point cloud semantic segmentation backbone network proposed in this paper.
Table 4.
Ablation study for the IGF module structure. The values are percentages (%).
The symbol ⊕ means the concatenation operation, while bottleneck column indicate whether the bottleneck module participates in the fusion module after concatenation. means the original point features, means the aggregated features from multi-view images, and means the preliminarily refined point features guided by image features.
The results indicate that employing appropriate methods to fuse multi-modal data features helps improve the model’s performance. Simple concatenation of original point cloud features and image features at the same level also helps improve accuracy, while the guidance of image feature attention can realize greater optimization on point cloud features.
Moreover, by adding a bottleneck structure, we aim to reduce the impact of additional redundant information after the concatenation of the optimized and the original point features, and further highlight the prominent information. The results show that the bottleneck structure slightly improves the accuracy of land cover segmentation. Compared to models lacking the bottleneck structure, the proposed model achieves a slight improvement.
To straightly assess the impact of different fusion structures on the performance of the model, this section compares their segmentation results, as shown in Figure 9.
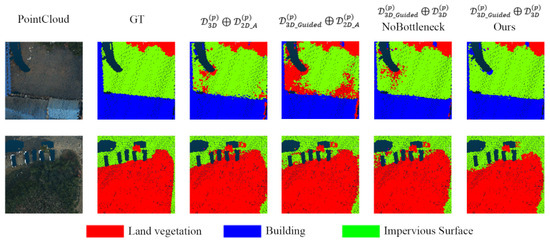
Figure 9.
Segmentation results with different fusion structures.
The segmentation results illustrate that compared to other fusion structures, our method can effectively allocate the contribution of different modal features. This approach ensures that image information guides the point cloud, highlights significant regions within the point cloud features, and reduces confusion in the segmentation results.
5.2.4. Ablation Study for the IGF Module Scales
Additionally, we design the ablation experiment for IGF module scales to verify the advantages of the module in this study. To begin with, the number of IGF modules was gradually increased during the upsampling process in the point cloud branch. The results of the ablation study are shown in Table 5.
Table 5.
Ablation study for the multi-modal feature fusion scales. The values are percentages (%).
The fusion column in Table 5 represents the number of multimodal feature-fusion modules in the upsampling process of the point cloud branch of the model in this chapter. From the table, it can be inferred that as the fusion modules stack, the richer the scale of feature maps, the better the performance of the model. This proves that our model can integrate information with the upsampling process of the decoder, effectively improving the segmentation accuracy of ground point cloud. Compared to a single fusion module, OA of our network increased by 4.92%, mIoU increased by 7.66%, and the AvgF1 value increased by 6.54%. This section selects segmentation results from ablation experiments for comparative display, as shown in Figure 10.
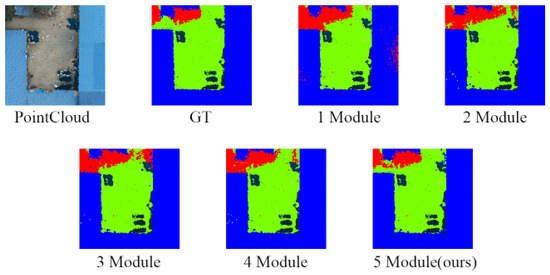
Figure 10.
Segmentation results with different fusion scales.
It can be seen that as the number of fusion modules increases, some scattered misclassification points in the point cloud-segmentation results are significantly reduced, indicating that with the stacking of fusion modules, key information in the point cloud is highlighted.
5.2.5. Ablation Study for the Loss Function
We employ Kullback–Leibler (KL) divergence as an additional loss function to enhance the constraint between the two backbone networks. Since the primary modality is the point cloud, the prediction results of the image branch are considered as soft targets for calculating the divergence. The experimental results are shown in Table 6, where the loss column illustrates the overall loss function structure. denotes the cross-entropy loss function, represents the dice loss function, represents the KL divergence loss function, means the KL divergence calculated based on strongly correlated segmentation results of multi-view images, and n denotes the number of images from different perspectives.
Table 6.
Ablation study for the loss function. The values are percentages (%).
From the table, it can be observed that the strongly related global joint loss can further enhance the performance of semantic networks. Due to occlusion issues, calculating the sum of divergence between multiple images and corresponding points will inevitably result in matching errors and a decrease in segmentation accuracy. We select the segmentation results from above experiments to make a comparison, as is shown in Figure 11.

Figure 11.
Segmentation result with different loss functions.
Obviously, the performance of the segmentation network is significantly decreased by summing up divergences. It is evident that the positions of trees are classified as buildings.
5.3. Experimental Results on Vaihingen Dataset
In this section, we conduct experiments using single-view orthoimages and point cloud data provided by ISPRS on point cloud semantic segmentation models such as RandLANet, and PointNet++, as well as the proposed model in this paper. Additionally, segmentation results from other high-performing models like IIS_7, NANJ2, WHuY4, and RIT_1 are selected for comparison to validate the stability and applicability of our model. The experimental results are shown in Table 7, with the best values in each metric highlighted in bold. The categories in the table mean Powerline, Low vegetation, Impervious surface, Car, Fence, Roof, Façade, Shrub, and Tree.
Table 7.
Comparison experiments with some benchmark networks on Vaihingen Dataset. The values are percentages (%).
From Table 7, it can be observed that the segmentation accuracy of our model on the Vaihingen Dataset is at a moderate level, primarily due to three reasons. Firstly, most methods in the list utilize additional point cloud attribute features as prior knowledge. For instance, IIS_7 applies spectral and geometric features, while NANJ2 and WHuY4 use attributes such as height, intensity, roughness, and color of the point cloud as input feature vectors. In contrast, our model only utilizes point coordinates and image colors as input, resulting in a lack of prior knowledge due to different data sources, which somewhat limits our model’s performance. Secondly, there is a mismatch between the point cloud and image label categories in the dataset. For example, the Vaihingen Dataset categorizes points into nine land cover classes, while the orthoimages contain only six land cover labels. This imbalance in label quantity affects the calculation of the multi-modal feature-fusion module and inevitably exacerbates semantic confusion, especially among categories like low vegetation, shrubs, and trees. Thirdly, the single-view images provided by ISPRS do not perfectly match the point cloud, and some features from the images may mislead the point cloud features, resulting in a decrease in the final segmentation accuracy of the point cloud. On the other hand, our approach performs best on powerlines and roof objects. Compared to the RandLANet backbone network, the improved model further strengthen the importance of prominent land cover objects. Among the segmentation results of MVG-Net, the F1 score of roof objects is 3.8% higher than that of the RandLANet backbone network and performs best among all models. In addition, multi-scale image texture features help the model pay attention to objects of different sizes. It can be seen that the segmentation accuracy of cars and fences significantly improves. We present the prediction results on the test set for several models with good performance metrics, aiming to analyze the characteristics of our model, as shown in Figure 12.
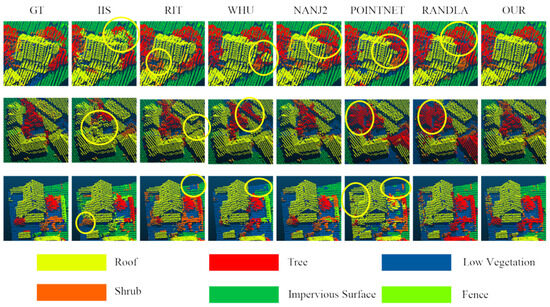
Figure 12.
Segmentation results of the benchmark networks and our model.
From Figure 12, it can be observed that our method effectively distinguishes between building roofs and complex areas. Since the imbalance in labels, the segmentation results between trees, bushes, and low vegetation are somewhat confused, but major categories can be clearly distinguished. For instance, in some complex boundary areas, other models often misclassify roofs as trees, while our model shows fewer confusions in the boundary areas between trees and buildings. Moreover, compared to the backbone network RandLANet, misclassified points labeled as roofs are corrected, validating the guiding role of the image. In the third row, although the segmentation performance for small-scale objects like fences is not ideal, our model achieves good segmentation results for other categories such as impervious surfaces.
5.4. Experimental Results on N3C-California Dataset
We apply popular single-modal point cloud semantic segmentation models like PointNet++, RandLANet, and KPConv, along with stable multi-modal fusion networks like MSeg3D and 2DPASS, to the N3C-California dataset. Comparing them with our segmentation results, we aim to demonstrate the superiority of our model. To ensure fairness, all points have identical input attributes. The results of the comparative experiments are shown in Table 8.
Table 8.
Comparison with some excellent networks on N3C-California Dataset.The values are percentages (%).
Compared to single-modal point cloud-segmentation models, our model performs better on the N3C dataset. Our model utilizes image texture information to guide the spatial information of the point cloud, and the metrics demonstrate the effect of error correction with the utilization of image information. Compared to the point cloud semantic segmentation backbone network RandLANet, our model shows improvements of 1.7% in OA, 1.8% in AvgF1, and 2.9% in mIoU. These advantages indicate that multi-modal fusion models for point cloud semantic segmentation can better distinguish point cloud objects. Compared to the state-of-the-art fusion models like MSeg3D, our methods outperform in AvgF1 and mIoU, which indicates the relatively good segmentation performance of our model.
We present the prediction results on the test set for several models with good performance metrics to compare the performance visually, as shown in Figure 13. From a global perspective in Figure 13, RandLANet shows some advantages in segmenting buildings but tends to misclassify trees as buildings. By optimizing point cloud features with image texture features, our proposed model can correct some areas that are incorrectly defined. Compared to other multi-modal models, our model exhibits fewer misclassifications at the boundaries between objects, especially at the junctions of buildings and trees. In the segmentation results of Mseg3D and 2DPASS, the tops of buildings are often classified as trees, or land is classified as trees, whereas our model achieves relatively better segmentation results for trees.
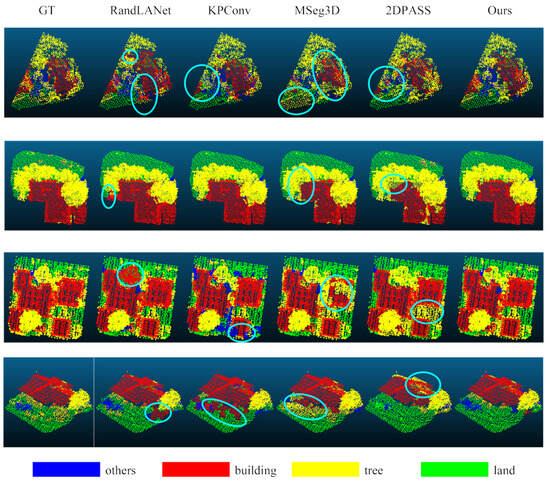
Figure 13.
Segmentation results of some excellent networks and our model. The blue circles represent regions with great discrepancies from the ground truth labels.
6. Discussion
When the total number of urban points is large, segmentation strategies can play a crucial role in model training, and the multi-modal data fusion model imposes stricter requirements on data preprocessing. A well-organized multi-modal dataset can make the train process of networks more stable, resulting in more convincing segmentation results.
We investigate the impact of two different sampling strategies on the proposed model. The first method, similar to RandLANet, randomly selects a point within the entire point cloud and retrieves neighboring points using a pre-built KD tree. The second one is arranged to create a fixed-size bounding box on the horizontal plane and randomly selects a fixed number of points within this region. The former one yields densely sampled points, while the other results in sparse and evenly distributed points within the area. The distribution of sampled points is illustrated in Figure 14. To show the different influence of sampling, the experiment was designed to compare segmentation results between the two sampling methods. The segmentation results metrics for both sampling methods are presented in Table 9.
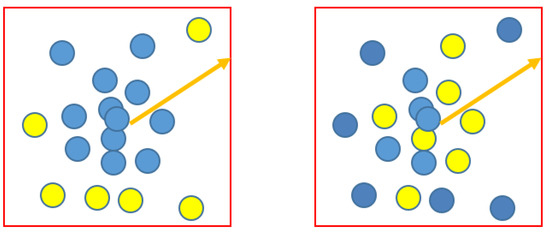
Figure 14.
Sampling methods for point clouds within the region.
Table 9.
Experiment on the influence of different sampling strategies on segmentation results. The values are percentages (%).
The table illustrates the varying performance of two sampling methods, indicating that region-based sampling is more suitable for our model. Due to the unordered nature of point clouds, the first method results in widely varying spatial distributions of sampled points based on point density, while the second method constrains the distribution of points within a defined area, resulting in closer proximity of sampled points, which benefits model learning. In the process of urban point cloud segmentation, the scale of input points is a crucial factor.
Moreover, our model can better utilize the spectral and context information provided by images compared to instantly inputting the color as prior knowledge. As is shown in Table 10, the model with false prior color had a worse performance than the baseline model RandLANet due to the occlusion between the point cloud and oblique images from WK2020.
Table 10.
Experiment on the influence of prior knowledge from color on segmentation results on the WK2020 Dataset. The values are percentages (%).
When it comes to the ISPRS Vaihingen Dataset, we can indicate from Table 11 that the prior color does help improve the segmentation accuracy as occlusion problems are less common in orthophoto images, but our model performed better since we extracted texture features of multi-scales to strengthen the expression of targets.
Table 11.
Experiment on the influence of prior knowledge from color on segmentation results on the Vaihingen Dataset. The values are percentages (%).
Compared to the benchmark methods provided by the Vaihingen Dataset, our approach may not achieve entirely satisfactory overall accuracy (OA) and average F1 score (Avg F1). However, it is evident that despite some limitations, our model achieves the best results in roof segmentation. The focus of the image model on building texture information further optimizes the features of the point cloud model and helps to distinguish the prominent land cover objects. When tested with the same inputs on the N3C California Dataset and WK2020 Dataset, our method demonstrates the best segmentation accuracy across almost all categories, further validating the superiority of our model.
Apart from input attributes, the feature-extraction backbone networks matter a lot. Building upon RandLANet, our point cloud model incorporates the advantages of random sampling algorithms, alleviating the pressure on hardware memory, while the LFA structure successfully expands the dimensions of point descriptions. Meanwhile, The image branch utilizes the window partitioning method to save computational resources, while the powerful capabilities of the Swin-Transformer and shift-window algorithm enable effective communication of information between partitioned windows within the input feature map; the window self-attention mechanism ensures the extraction of local features.
The multi-view feature-aggregation module designed in this paper effectively extracts prominent features from images, and further a well-designed fusion module is constructed for guiding the point features by rich texture information from aggregated image features, which effectively mitigates the impact of redundant information in point features, alleviating edge blurring in urban objects and confusion in boundary regions of ground objects.
However, there are still limitations to our research. Firstly, there are few universal rules for dataset preprocessing, and strict geometric matching is required during sampling to ensure correspondence between multiple modalities, though preprocessing plays an important role in network training. Secondly, the high computational cost of the two parallel deep learning networks can hardly be ignored, and hardware limitations may affect improvements in model performance. Thirdly, class imbalance in different datasets can lead to significant confusion in the final results. In addition, datasets containing both LiDAR and oblique imagery are very scarce. While the effectiveness of our model has been demonstrated on single-view image datasets such as Vaihingen and N3C California, further research is needed to validate the performance of the model in optimizing point cloud semantic segmentation results by integrating multi-view oblique imagery.
7. Conclusions
This paper introduces MVG-net, a multi-modal fusion architecture network that combines multi-view oblique images with LiDAR data for point cloud semantic segmentation. The model utilizes two parallel backbone networks for feature extraction across different scales and levels. To alleviate the influence of redundant information, A multi-view image feature-aggregation module is designed to highlight key information from multi-view oblique images. Additionally, an image-guided fusion module is constructed to concentrate on prominent spatial features by image attention. A joint loss function is also employed to enhance constraints between strong-relevant units of modalities. The comparative experiments on the Vaihingen and N3C California Datasets demonstrate the strong performance of our model in point cloud segmentation through the integration of the point cloud with single-view images, particularly showcasing notable improvements in the accuracy of building segmentation. What is more, the construction of the WK2020 Dataset addresses the scarcity of large-scale LiDAR and multi-view image datasets, facilitating the validation of our model. Extensive ablation experiments on WK2020 confirm the effectiveness of the proposed model’s structure in reducing boundary confusion in segmentation results.
However, our model can be further developed. Firstly, dataset preprocessing significantly influences the performance of fusion models. Finding a universal segmentation method or voxelization approach for cross-modal interaction is necessary to ensure uniformity in data-processing methods. Moreover, leveraging the geometric properties and intrinsic parameters of oblique images for correction is acceptable to enhance the final accuracy of land cover segmentation and further overcome confusion in boundary regions.
Author Contributions
Conceptualization, Y.L. (Yongchang Liu) and Y.L. (Yawen Liu); methodology, Y.L. (Yongchang Liu); software, Y.L. (Yongchang Liu); validation, Y.L. (Yongchang Liu); investigation, Y.L. (Yongchang Liu); data curation, Y.L. (Yongchang Liu); writing—original draft preparation, Y.L. (Yongchang Liu); writing—review and editing, Y.L. (Yongchang Liu), Y.L. (Yawen Liu) and Y.D.; project administration, Y.L. (Yawen Liu). All authors have read and agreed to the published version of the manuscript.
Funding
This study was supported by National Key Research and Development Program of China, No. 2023YFB3905704.
Data Availability Statement
The Vaihingen Dataset is now available on the official ISPRS website: https://www.isprs.org/education/benchmarks/UrbanSemLab/Default.aspx (accessed on 29 July 2024). The N3C-California dataset is available on Github: https://github.com/wymqqq/IKDNet-pytorch (accessed on 29 July 2024).
Conflicts of Interest
The authors declare no conflicts of interest.
References
- Rusu, R.B.; Cousins, S. 3D is here: Point cloud library (pcl). In Proceedings of the IEEE International Conference on Robotics and Automation, Shanghai, China, 9–13 May 2011; pp. 1–4. [Google Scholar]
- Poux, F.; Neuville, R.; Hallot, P.; Billen, R. Smart point cloud: Definition and remaining challenges. ISPRS Ann. Photogramm. Remote Sens. Spat. Inf. Sci. 2016, 4, 119–127. [Google Scholar] [CrossRef]
- Kang, Z.; Yang, J.; Zhong, R. A bayesian-network-based classification method integrating airborne lidar data with optical images. IEEE J. Sel. Top. Appl. Earth Obs. Remote Sens. 2016, 10, 1651–1661. [Google Scholar] [CrossRef]
- Yousefhussien, M.; Kelbe, D.J.; Ientilucci, E.J.; Salvaggio, C. A multi-scale fully convolutional network for semantic labeling of 3D point clouds. ISPRS J. Photogramm. Remote Sens. 2018, 143, 191–204. [Google Scholar] [CrossRef]
- Zhang, H.; Ren, K.; Zheng, N.; Hao, M. A Multiscale Convolutional Neural Network With Color Vegetation Indices for Semantic Labeling of Point Cloud. IEEE Geosci. Remote Sens. Lett. 2021, 19, 1–5. [Google Scholar] [CrossRef]
- Zhao, R.; Pang, M.; Wang, J. Classifying airborne LiDAR point clouds via deep features learned by a multi-scale convolutional neural network. Int. J. Geogr. Inf. Sci. 2018, 32, 960–979. [Google Scholar] [CrossRef]
- Li, D.; Shi, G.; Wu, Y.; Yang, Y.; Zhao, M. Multi-scale neighborhood feature extraction and aggregation for point cloud segmentation. IEEE Trans. Circuits Syst. Video Technol. 2020, 31, 2175–2191. [Google Scholar] [CrossRef]
- El Madawi, K.; Rashed, H.; El Sallab, A.; Nasr, O.; Kamel, H.; Yogamani, S. Rgb and lidar fusion based 3D semantic segmentation for autonomous driving. In Proceedings of the 2019 IEEE Intelligent Transportation Systems Conference (ITSC), Auckland, New Zealand, 27–30 October 2019; pp. 7–12. [Google Scholar]
- Vora, S.; Lang, A.H.; Helou, B.; Beijbom, O. Pointpainting: Sequential fusion for 3D object detection. In Proceedings of the IEEE/CVF Conference on Computer Vision and Pattern Recognition, Seattle, WA, USA, 13–19 June 2020; pp. 4604–4612. [Google Scholar]
- Zhao, L.; Zhou, H.; Zhu, X.; Song, X.; Li, H.; Tao, W. Lif-seg: Lidar and camera image fusion for 3D lidar semantic segmentation. arXiv 2021, arXiv:2108.07511. [Google Scholar] [CrossRef]
- Yuan, Z.; Yan, X.; Liao, Y.; Guo, Y.; Li, G.; Cui, S.; Li, Z. X-trans2cap: Cross-modal knowledge transfer using transformer for 3D dense captioning. In Proceedings of the IEEE/CVF Conference on Computer Vision and Pattern Recognition, New Orleans, LA, USA, 18–24 June 2022; pp. 8563–8573. [Google Scholar]
- Chang, X.; Pan, H.; Sun, W.; Gao, H. A multi-phase camera-lidar fusion network for 3D semantic segmentation with weak supervision. IEEE Trans. Circuits Syst. Video Technol. 2023, 33, 3737–3746. [Google Scholar] [CrossRef]
- Yan, X.; Gao, J.; Zheng, C.; Zheng, C.; Zhang, R.; Cui, S.; Li, Z. 2dpass: 2d priors assisted semantic segmentation on lidar point clouds. In Proceedings of the European Conference on Computer Vision, Tel Aviv, Israel, 23–27 October 2022; pp. 677–695. [Google Scholar]
- Zhuang, Z.; Li, R.; Jia, K.; Wang, Q.; Li, Y.; Tan, M. Perception-aware multi-sensor fusion for 3D lidar semantic segmentation. In Proceedings of the IEEE/CVF International Conference on Computer Vision, Montreal, BC, Canada, 11–17 October 2021; pp. 16280–16290. [Google Scholar]
- Qi, C.R.; Su, H.; Mo, K.; Guibas, L.J. Pointnet: Deep learning on point sets for 3D classification and segmentation. In Proceedings of the IEEE Conference on Computer Vision and Pattern Recognition, Honolulu, HI, USA, 21–26 July 2017; pp. 652–660. [Google Scholar]
- Qi, C.R.; Yi, L.; Su, H.; Guibas, L.J. Pointnet++: Deep hierarchical feature learning on point sets in a metric space. In Proceedings of the 31st Conference on Neural Information Processing Systems (NIPS 2017), Long Beach, CA, USA, 4–9 December 2017; Volume 30. [Google Scholar]
- Hu, Q.; Yang, B.; Xie, L.; Rosa, S.; Guo, Y.; Wang, Z.; Trigoni, N.; Markham, A. Randla-net: Efficient semantic segmentation of large-scale point clouds. In Proceedings of the IEEE/CVF Conference on Computer Vision and Pattern Recognition, Seattle, WA, USA, 14–19 June 2020; pp. 11108–11117. [Google Scholar]
- Li, Y.; Bu, R.; Sun, M.; Wu, W.; Di, X.; Chen, B. Pointcnn: Convolution on x-transformed points. In Proceedings of the Advances in Neural Information Processing Systems 31 (NeurIPS 2018), Montréal, QC, Canada, 3–8 December 2018; Volume 31. [Google Scholar]
- Wu, W.; Qi, Z.; Fuxin, L. Pointconv: Deep convolutional networks on 3D point clouds. In Proceedings of the IEEE/CVF Conference on Computer Vision and Pattern Recognition, Long Beach, CA, USA, 15–20 June 2019; pp. 9621–9630. [Google Scholar]
- Thomas, H.; Qi, C.R.; Deschaud, J.-E.; Marcotegui, B.; Goulette, F.; Guibas, L.J. Kpconv: Flexible and deformable convolution for point clouds. In Proceedings of the IEEE/CVF International Conference on Computer Vision, Seoul, Republic of Korea, 27 October–2 November 2019; pp. 6411–6420. [Google Scholar]
- Long, J.; Shelhamer, E.; Darrell, T. Fully convolutional networks for semantic segmentation. In Proceedings of the IEEE Conference on Computer Vision and Pattern Recognition, Boston, MA, USA, 7–12 June 2015; pp. 3431–3440. [Google Scholar]
- Boulch, A.; Le Saux, B.; Audebert, N. Unstructured point cloud semantic labeling using deep segmentation networks. In Proceedings of the 3Dor’17: Proceedings of the Workshop on 3D Object Retrieval, Lyon, France, 23–24 April 2017; Volume 3, pp. 1–8.
- Tatarchenko, M.; Park, J.; Koltun, V.; Zhou, Q.-Y. Tangent convolutions for dense prediction in 3D. In Proceedings of the IEEE Conference on Computer Vision and Pattern Recognition, Salt Lake City, UT, USA, 18–22 June 2018; pp. 3887–3896. [Google Scholar]
- Yang, J.; Lee, C.; Ahn, P.; Lee, H.; Yi, E.; Kim, J. Pbp-net: Point projection and back-projection network for 3D point cloud segmentation. In Proceedings of the 2020 IEEE/RSJ International Conference on Intelligent Robots and Systems (IROS), Las Vegas, NV, USA, 25–29 October 2020; pp. 8469–8475. [Google Scholar]
- Su, H.; Jampani, V.; Sun, D.; Maji, S.; Kalogerakis, E.; Yang, M.-H.; Kautz, J. Splatnet: Sparse lattice networks for point cloud processing. In Proceedings of the IEEE Conference on Computer Vision and Pattern Recognition, Salt Lake City, UT, USA, 18–23 June 2018; pp. 2530–2539. [Google Scholar]
- Huang, J.; You, S. Point cloud labeling using 3D convolutional neural network. In Proceedings of the 2016 23rd International Conference on Pattern Recognition (ICPR), Cancun, Mexico, 4–8 December 2016; pp. 2670–2675. [Google Scholar]
- Graham, B.; Engelcke, M.; Van Der Maaten, L. 3D semantic segmentation with submanifold sparse convolutional networks. In Proceedings of the IEEE Conference on Computer Vision and Pattern Recognition, Salt Lake City, UT, USA, 18–23 June 2018; pp. 9224–9232. [Google Scholar]
- Zhou, H.; Zhu, X.; Song, X.; Ma, Y.; Wang, Z.; Li, H.; Lin, D. Cylinder3D: An effective 3D framework for driving-scene lidar semantic segmentation. arXiv 2020, arXiv:2008.01550. [Google Scholar]
- Xu, J.; Zhang, R.; Dou, J.; Zhu, Y.; Sun, J.; Pu, S. Rpvnet: A deep and efficient range-point-voxel fusion network for lidar point cloud segmentation. In Proceedings of the IEEE/CVF International Conference on Computer Vision, Montreal, BC, Canada, 11–17 October 2021; pp. 16024–16033. [Google Scholar]
- Scott, W.R.; Roth, G.; Rivest, J.-F. View planning for automated three-dimensional object reconstruction and inspection. ACM Comput. Surv. (CSUR) 2003, 35, 64–96. [Google Scholar] [CrossRef]
- Vasquez-Gomez, J.I.; Sucar, L.E.; Murrieta-Cid, R. View/state planning for three-dimensional object reconstruction under uncertainty. Auton. Robot. 2017, 41, 89–109. [Google Scholar] [CrossRef]
- Robert, D.; Vallet, B.; Landrieu, L. Learning multi-view aggregation in the wild for large-scale 3D semantic segmentation. In Proceedings of the IEEE/CVF Conference on Computer Vision and Pattern Recognition, New Orleans, LA, USA, 18–24 June 2022; pp. 5575–5584. [Google Scholar]
- Su, H.; Maji, S.; Kalogerakis, E.; Learned-Miller, E. Multi-view convolutional neural networks for 3D shape recognition. In Proceedings of the IEEE International Conference on Computer Vision, Santiago, Chile, 7–13 December 2015; pp. 945–953. [Google Scholar]
- Wang, C.; Pelillo, M.; Siddiqi, K. Dominant set clustering and pooling for multi-view 3D object recognition. arXiv 2019, arXiv:1906.01592. [Google Scholar]
- Kanezaki, A.; Matsushita, Y.; Nishida, Y. Rotationnet: Joint object categorization and pose estimation using multiviews from unsupervised viewpoints. In Proceedings of the IEEE Conference on Computer Vision and Pattern Recognition, Salt Lake City, UT, USA, 18–22 June 2018; pp. 5010–5019. [Google Scholar]
- Philion, J.; Fidler, S. Lift, splat, shoot: Encoding images from arbitrary camera rigs by implicitly unprojecting to 3D. In Proceedings of the Computer Vision–ECCV 2020: 16th European Conference, Glasgow, UK, 23–28 August 2020; Proceedings, Part XIV 16. pp. 194–210. [Google Scholar]
- Feng, D.; Haase-Schütz, C.; Rosenbaum, L.; Hertlein, H.; Glaeser, C.; Timm, F.; Wiesbeck, W.; Dietmayer, K. Deep multi-modal object detection and semantic segmentation for autonomous driving: Datasets, methods, and challenges. IEEE Trans. Intell. Transp. Syst. 2020, 22, 1341–1360. [Google Scholar] [CrossRef]
- Chen, Y.; Liu, X.; Xiao, Y.; Zhao, Q.; Wan, S. Three-Dimensional Urban Land Cover Classification by Prior-Level Fusion of LiDAR Point Cloud and Optical Imagery. Remote Sens. 2021, 13, 4928. [Google Scholar] [CrossRef]
- Badrinarayanan, V.; Kendall, A.; Cipolla, R. Segnet: A deep convolutional encoder-decoder architecture for image segmentation. IEEE Trans. Pattern Anal. Mach. Intell. 2017, 39, 2481–2495. [Google Scholar] [CrossRef] [PubMed]
- Ballouch, Z.; Hajji, R.; Poux, F.; Kharroubi, A.; Billen, R. A prior level fusion approach for the semantic segmentation of 3D point clouds using deep learning. Remote Sens. 2022, 14, 3415. [Google Scholar] [CrossRef]
- Li, J.; Dai, H.; Han, H.; Ding, Y. Mseg3D: Multi-modal 3D semantic segmentation for autonomous driving. In Proceedings of the IEEE/CVF Conference on Computer Vision and Pattern Recognition, Vancouver, BC, Canada, 17–24 June 2023; pp. 21694–21704. [Google Scholar]
- Liang, T.; Xie, H.; Yu, K.; Xia, Z.; Lin, Z.; Wang, Y.; Tang, T.; Wang, B.; Tang, Z. Bevfusion: A simple and robust lidar-camera fusion framework. Adv. Neural Inf. Process. Syst. 2022, 35, 10421–10434. [Google Scholar]
- Qin, N.; Hu, X.; Wang, P.; Shan, J.; Li, Y. Semantic labeling of ALS point cloud via learning voxel and pixel representations. IEEE Geosci. Remote Sens. Lett. 2019, 17, 859–863. [Google Scholar] [CrossRef]
- Yang, H.; Wang, T.; Yin, L. Adaptive multimodal fusion for facial action units recognition. In Proceedings of the 28th ACM International Conference on Multimedia, Seattle, WA, USA, 12–16 October 2020; pp. 2982–2990. [Google Scholar]
- Cao, H.; Wang, Y.; Chen, J.; Jiang, D.; Zhang, X.; Tian, Q.; Wang, M. Swin-unet: Unet-like pure transformer for medical image segmentation. In Proceedings of the European Conference on Computer Vision, Tel Aviv, Israel, 23–27 October 2022; pp. 205–218. [Google Scholar]
- Ronneberger, O.; Fischer, P.; Brox, T. U-net: Convolutional networks for biomedical image segmentation. In Proceedings of the Medical Image Computing and Computer-Assisted Intervention–MICCAI 2015: 18th International Conference, Munich, Germany, 5–9 October 2015; Proceedings, part III 18. pp. 234–241. [Google Scholar]
- Hang, R.; Li, Z.; Ghamisi, P.; Hong, D.; Xia, G.; Liu, Q. Classification of hyperspectral and LiDAR data using coupled CNNs. IEEE Trans. Geosci. Remote Sens. 2020, 58, 4939–4950. [Google Scholar] [CrossRef]
- Wang, Y.; Wan, Y.; Zhang, Y.; Zhang, B.; Gao, Z. Imbalance knowledge-driven multi-modal network for land-cover semantic segmentation using aerial images and LiDAR point clouds. ISPRS J. Photogramm. Remote Sens. 2023, 202, 385–404. [Google Scholar] [CrossRef]
- Woo, S.; Park, J.; Lee, J.-Y.; Kweon, I.S. Cbam: Convolutional block attention module. In Proceedings of the European Conference on Computer Vision (ECCV), Munich, Germany, 8–14 September 2018; pp. 3–19. [Google Scholar]
- Liu, Y.; Chen, K.; Liu, C.; Qin, Z.; Luo, Z.; Wang, J. Structured knowledge distillation for semantic segmentation. In Proceedings of the IEEE/CVF Conference on Computer Vision and Pattern Recognition, Long Beach, CA, USA, 15–20 June 2019; pp. 2604–2613. [Google Scholar]
- Locatello, F.; Weissenborn, D.; Unterthiner, T.; Mahendran, A.; Heigold, G.; Uszkoreit, J.; Dosovitskiy, A.; Kipf, T. Object-centric learning with slot attention. Adv. Neural Inf. Process. Syst. 2020, 33, 11525–11538. [Google Scholar]

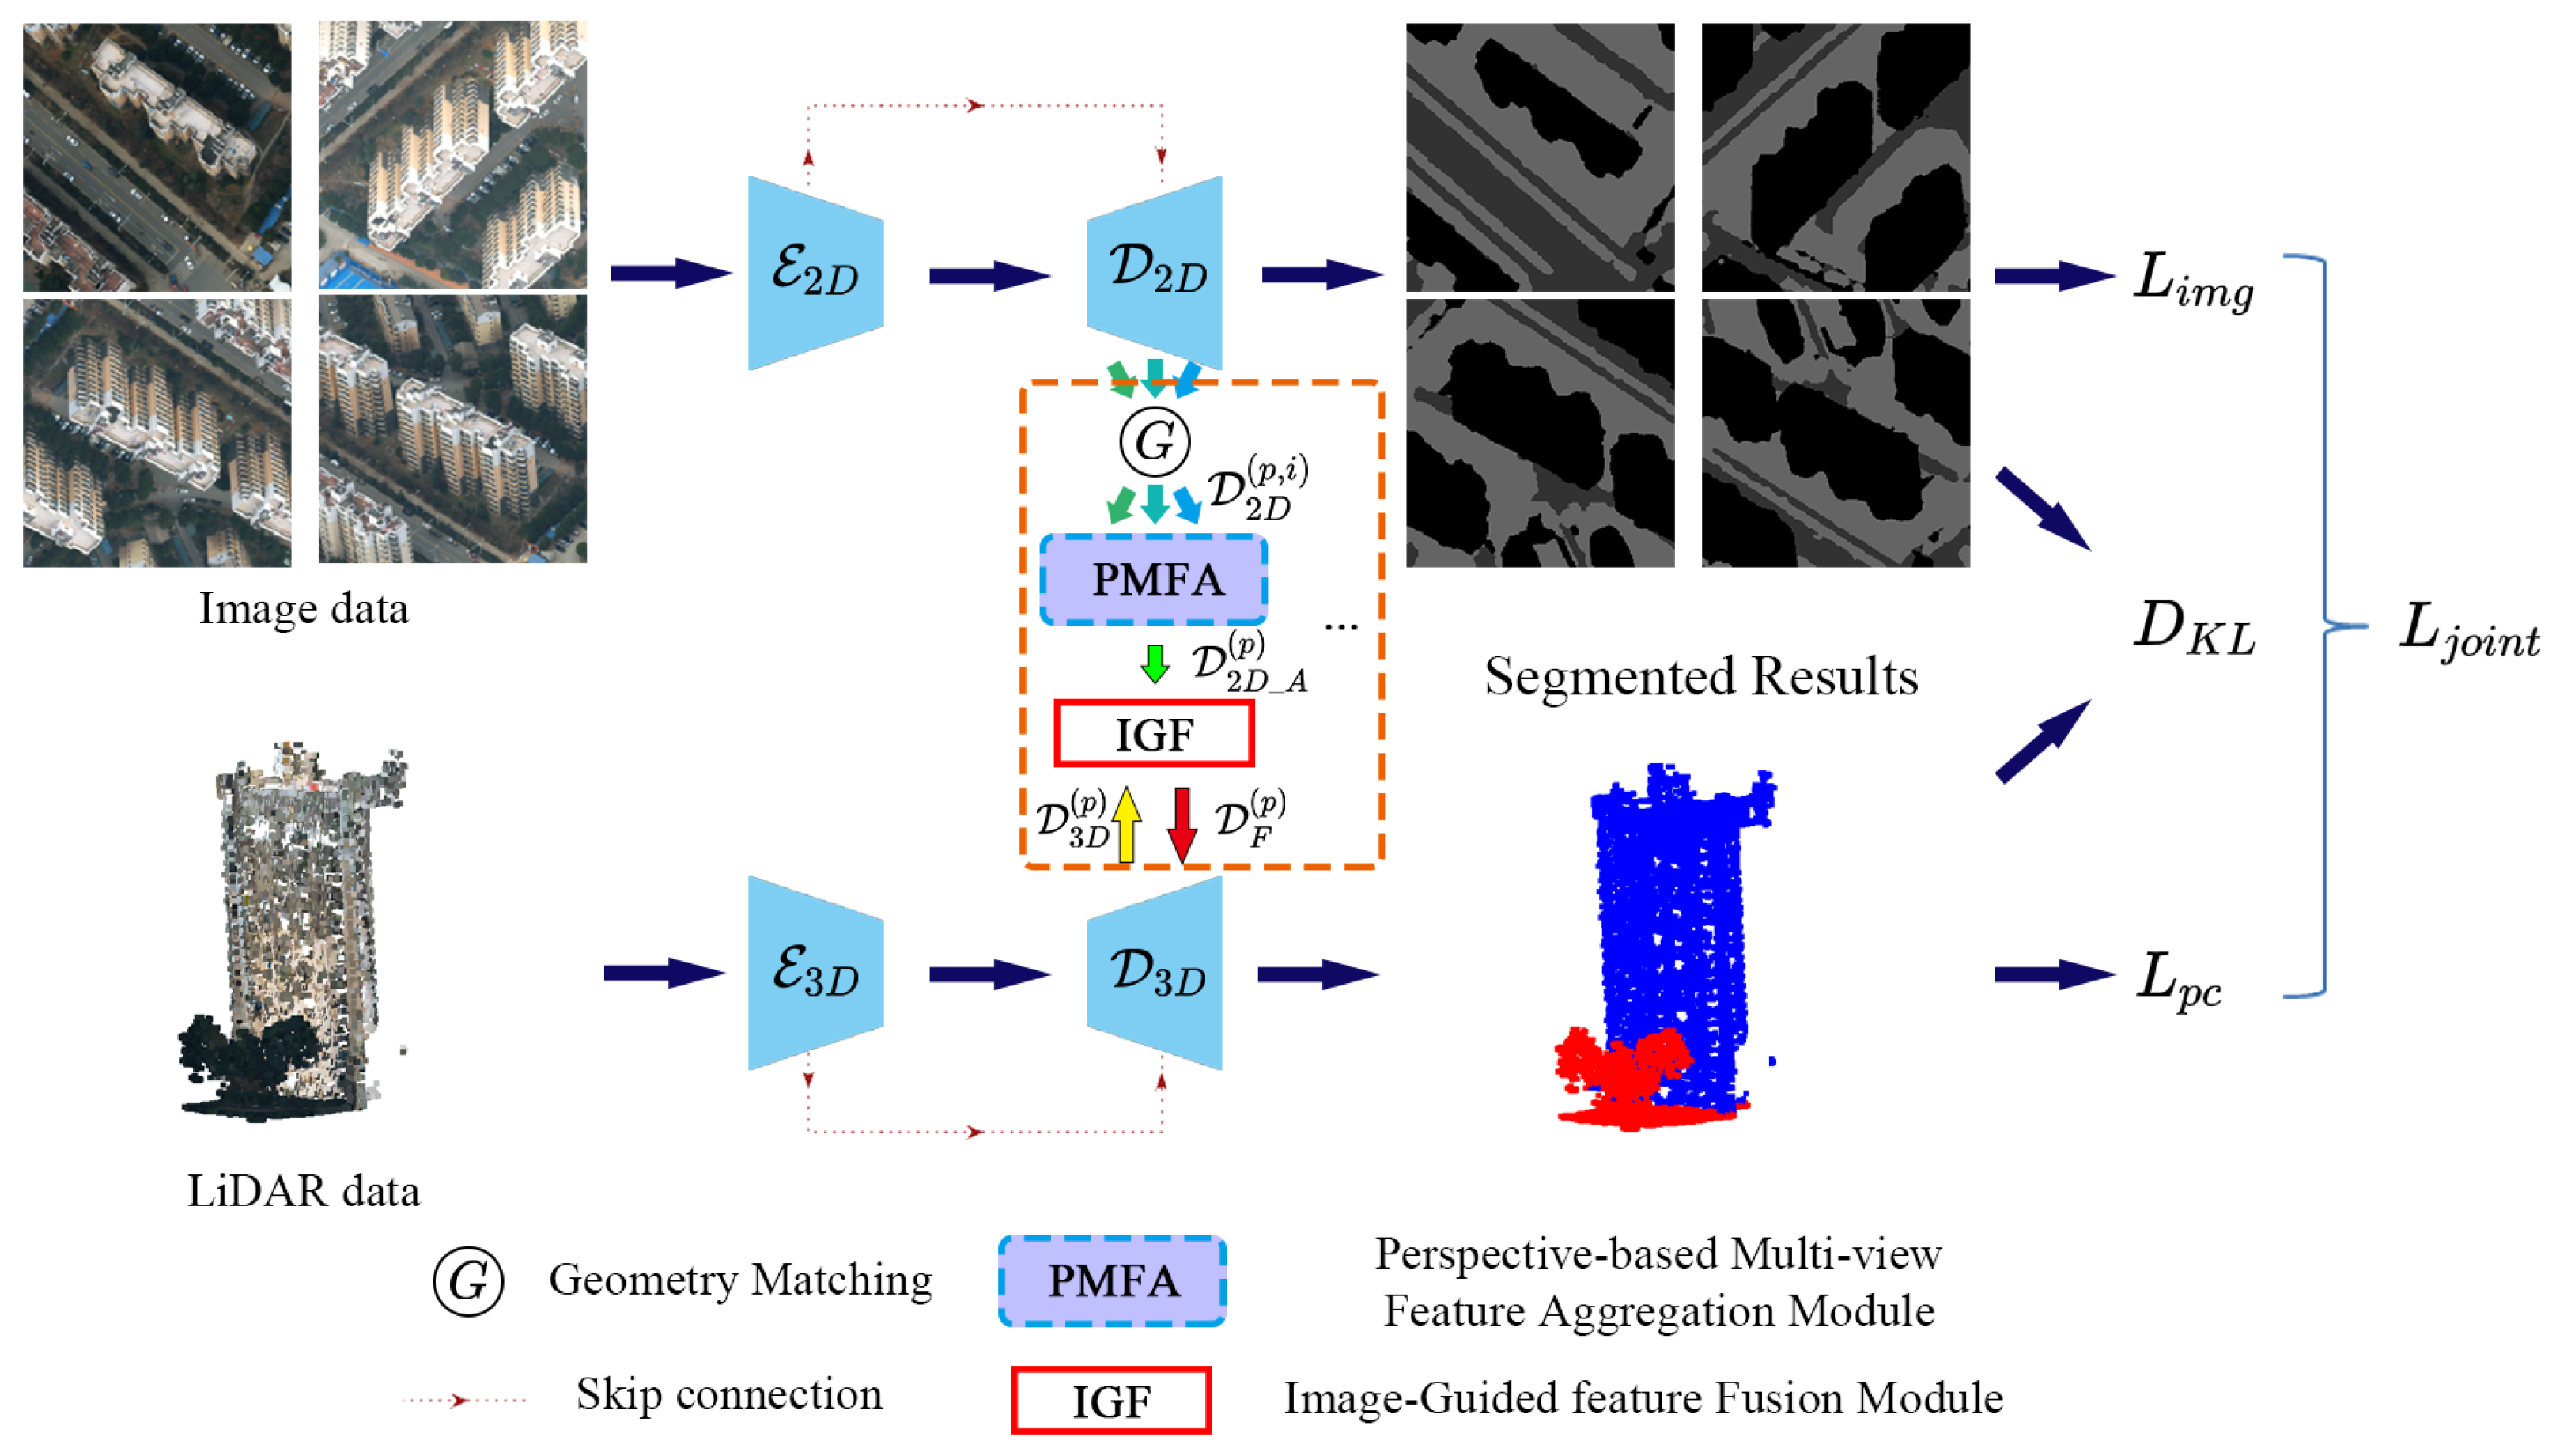
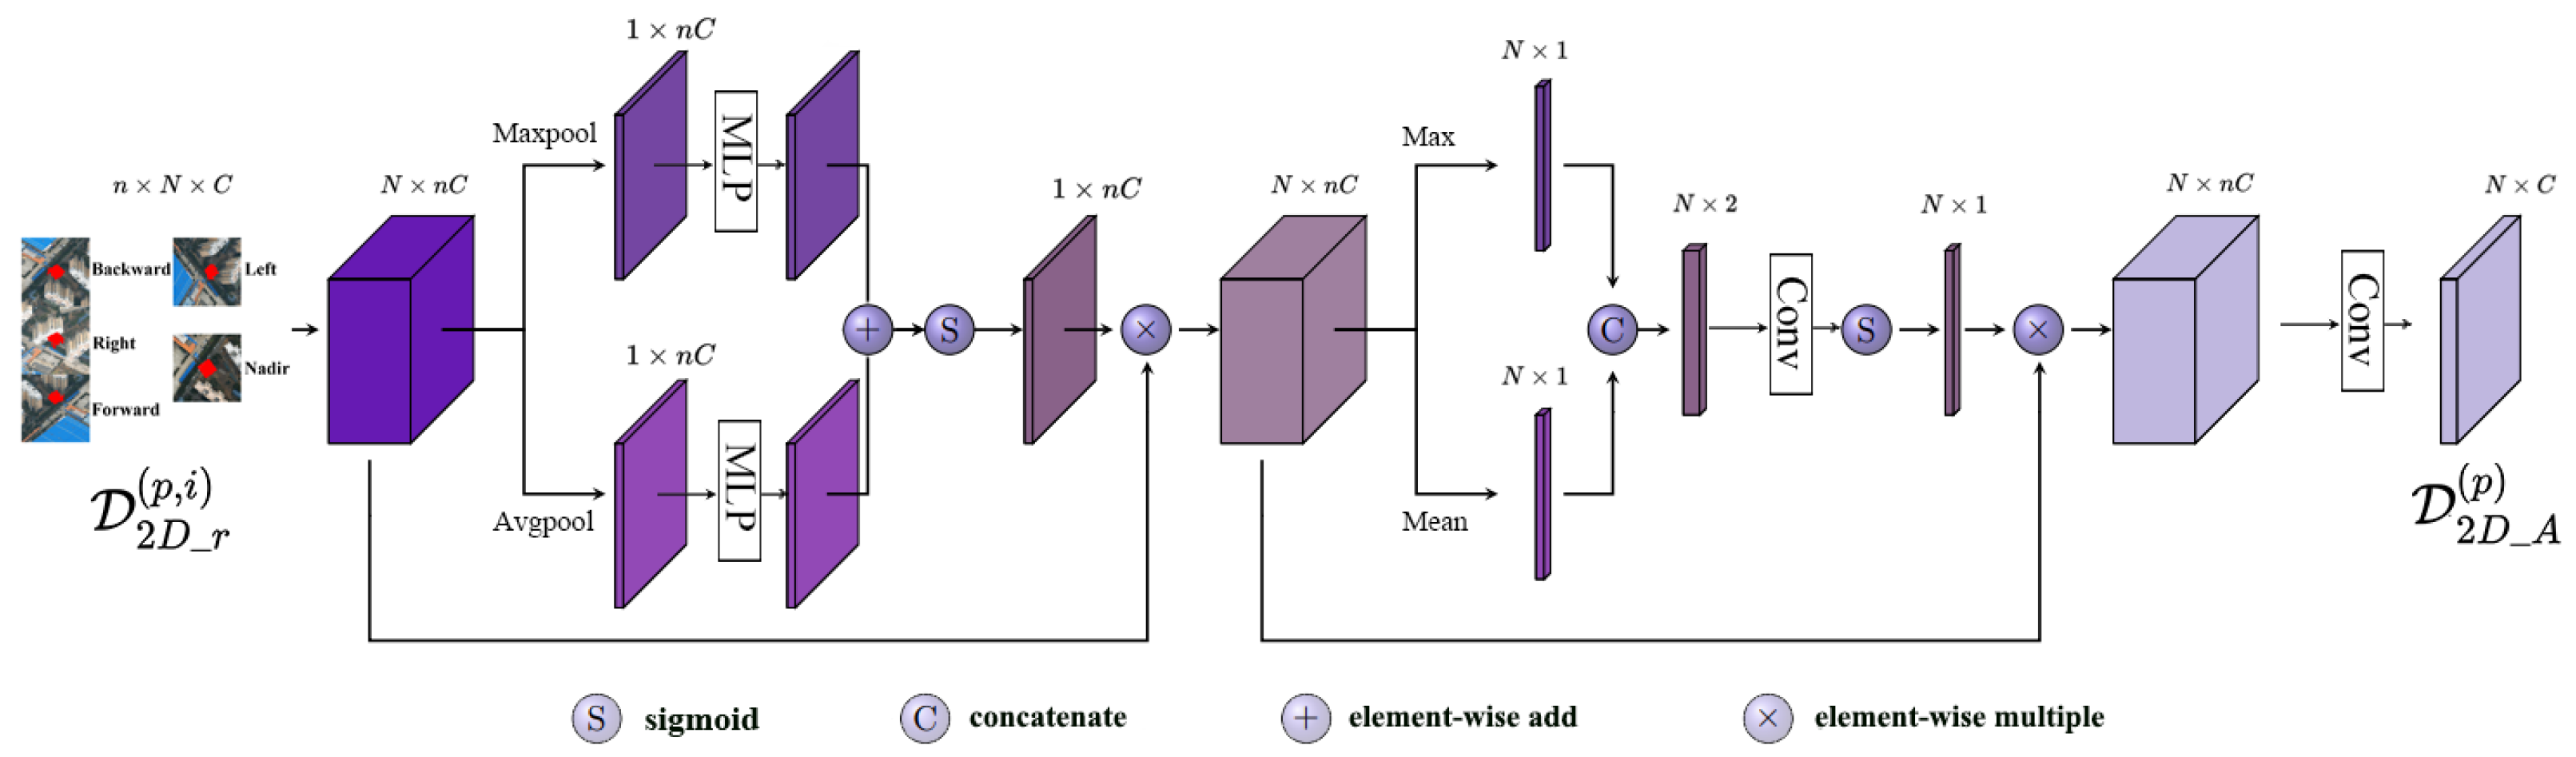
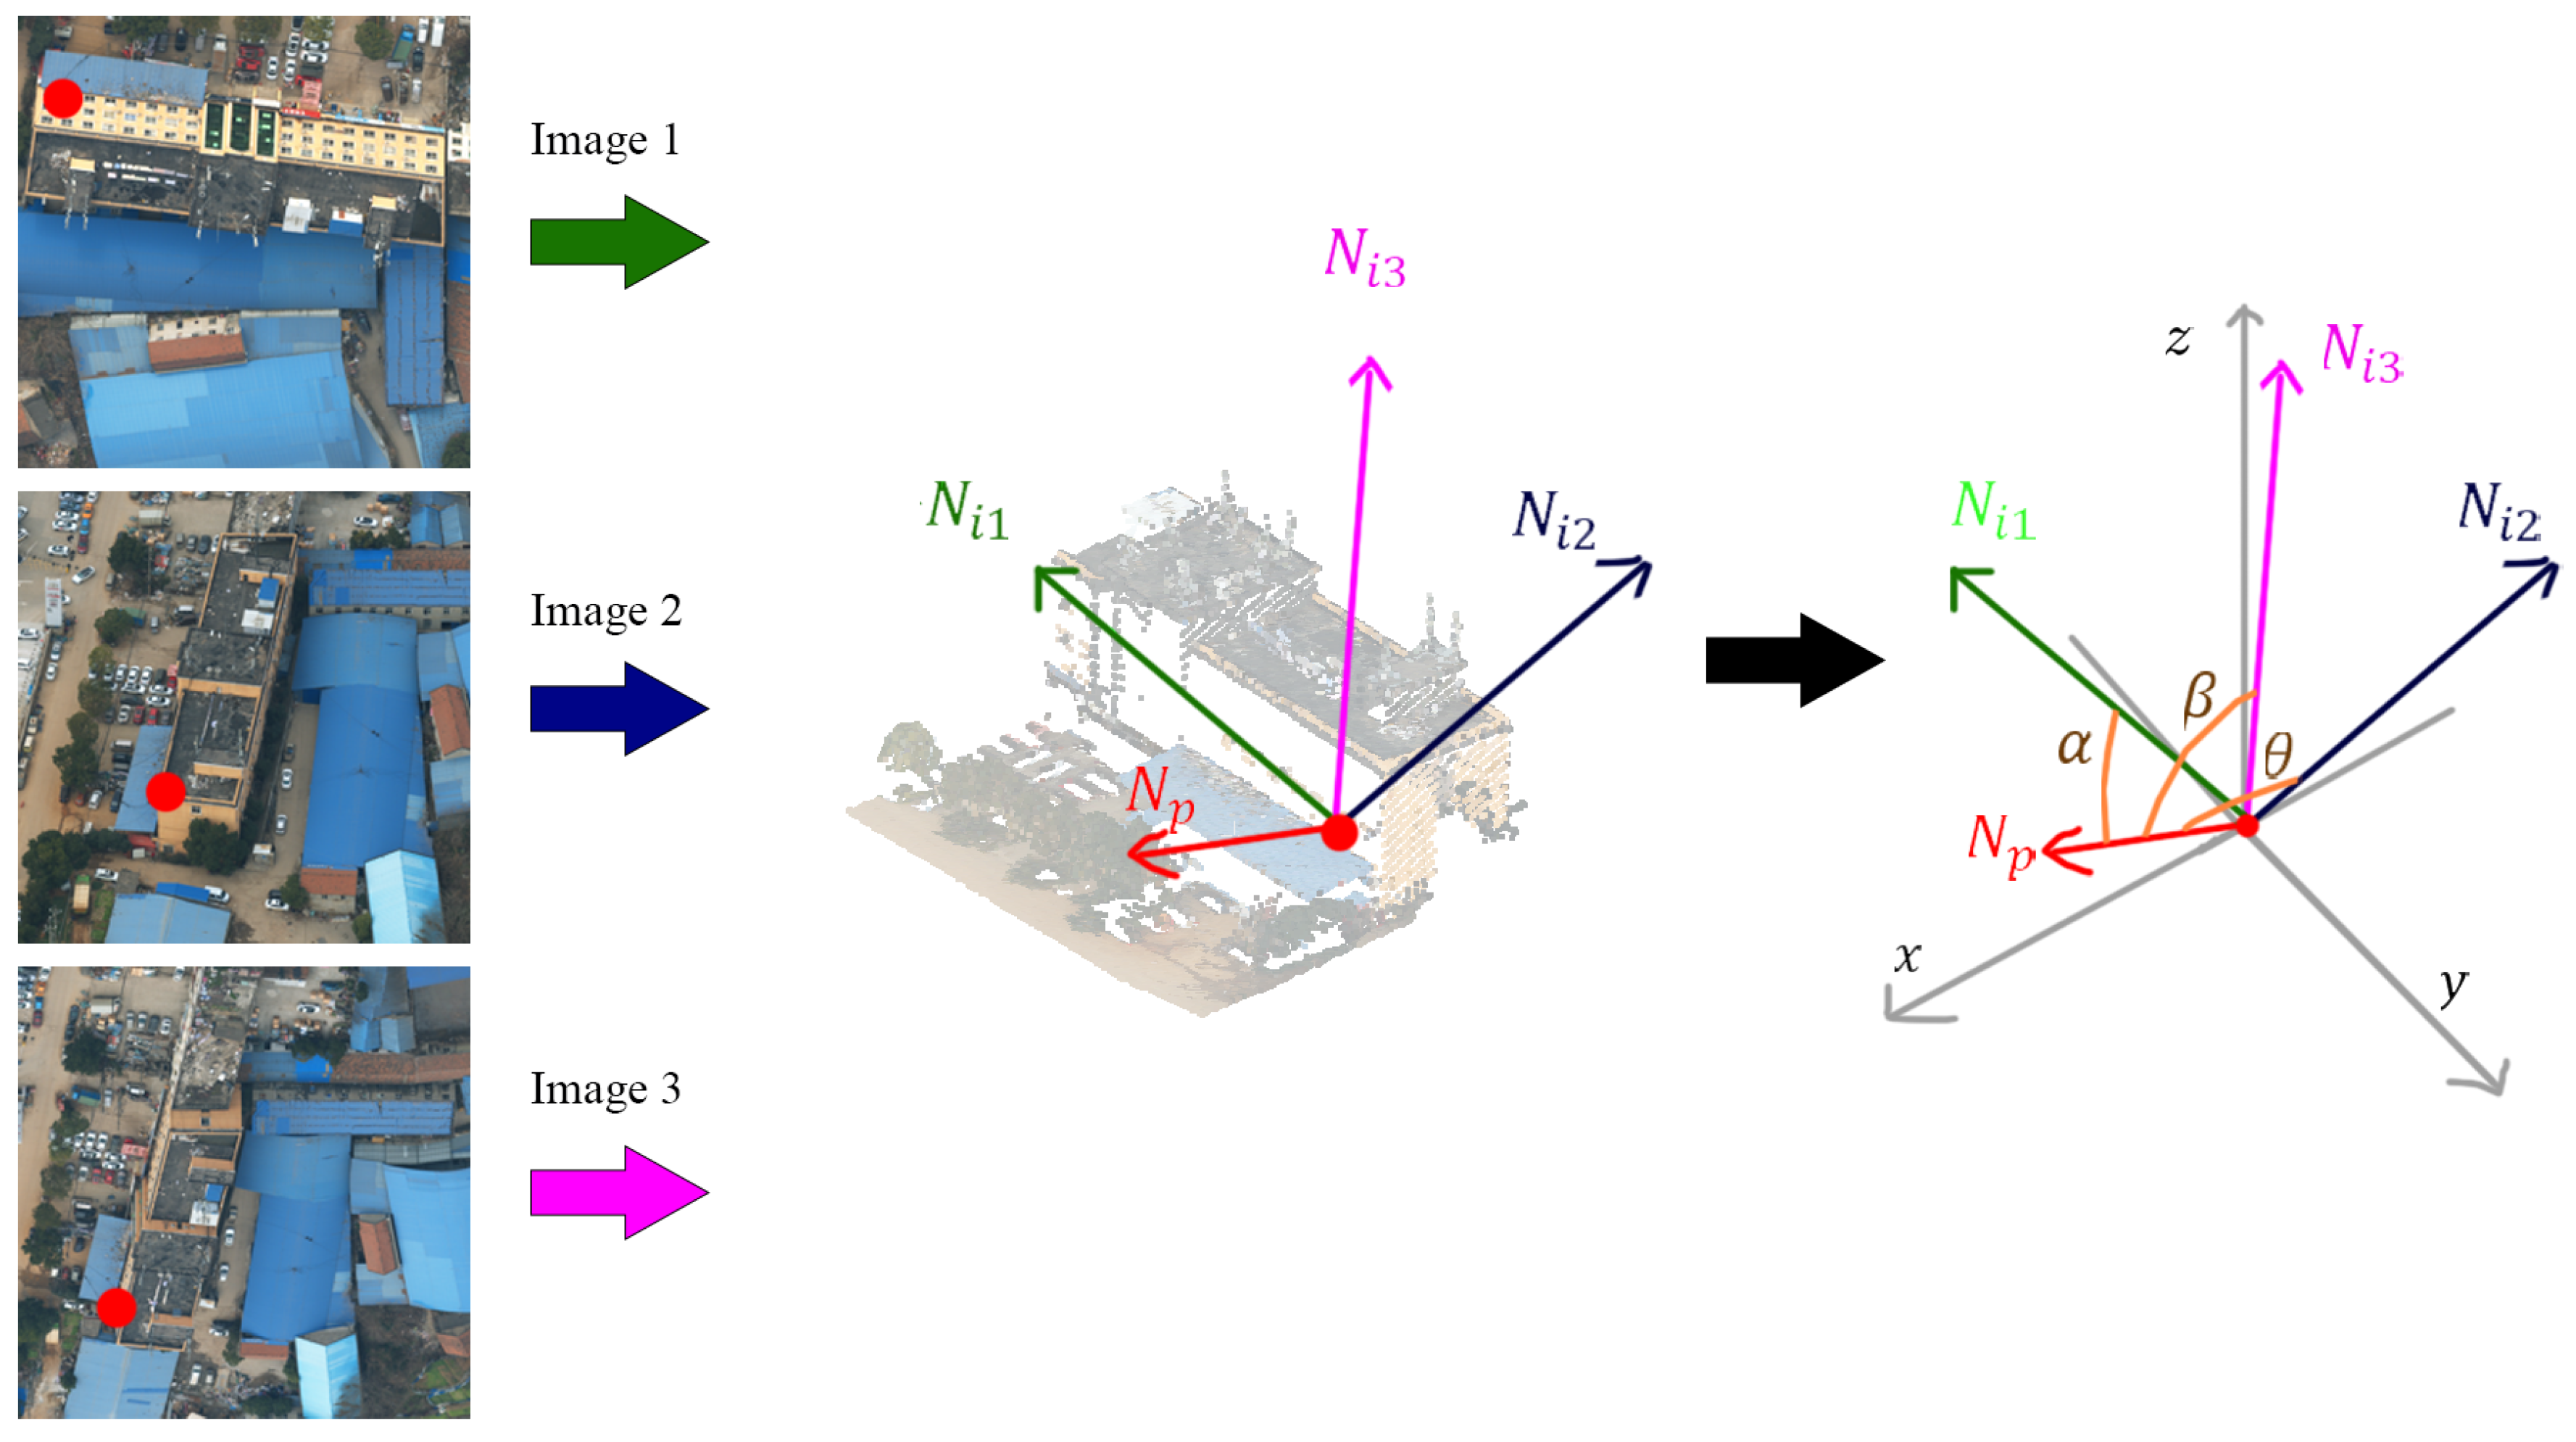
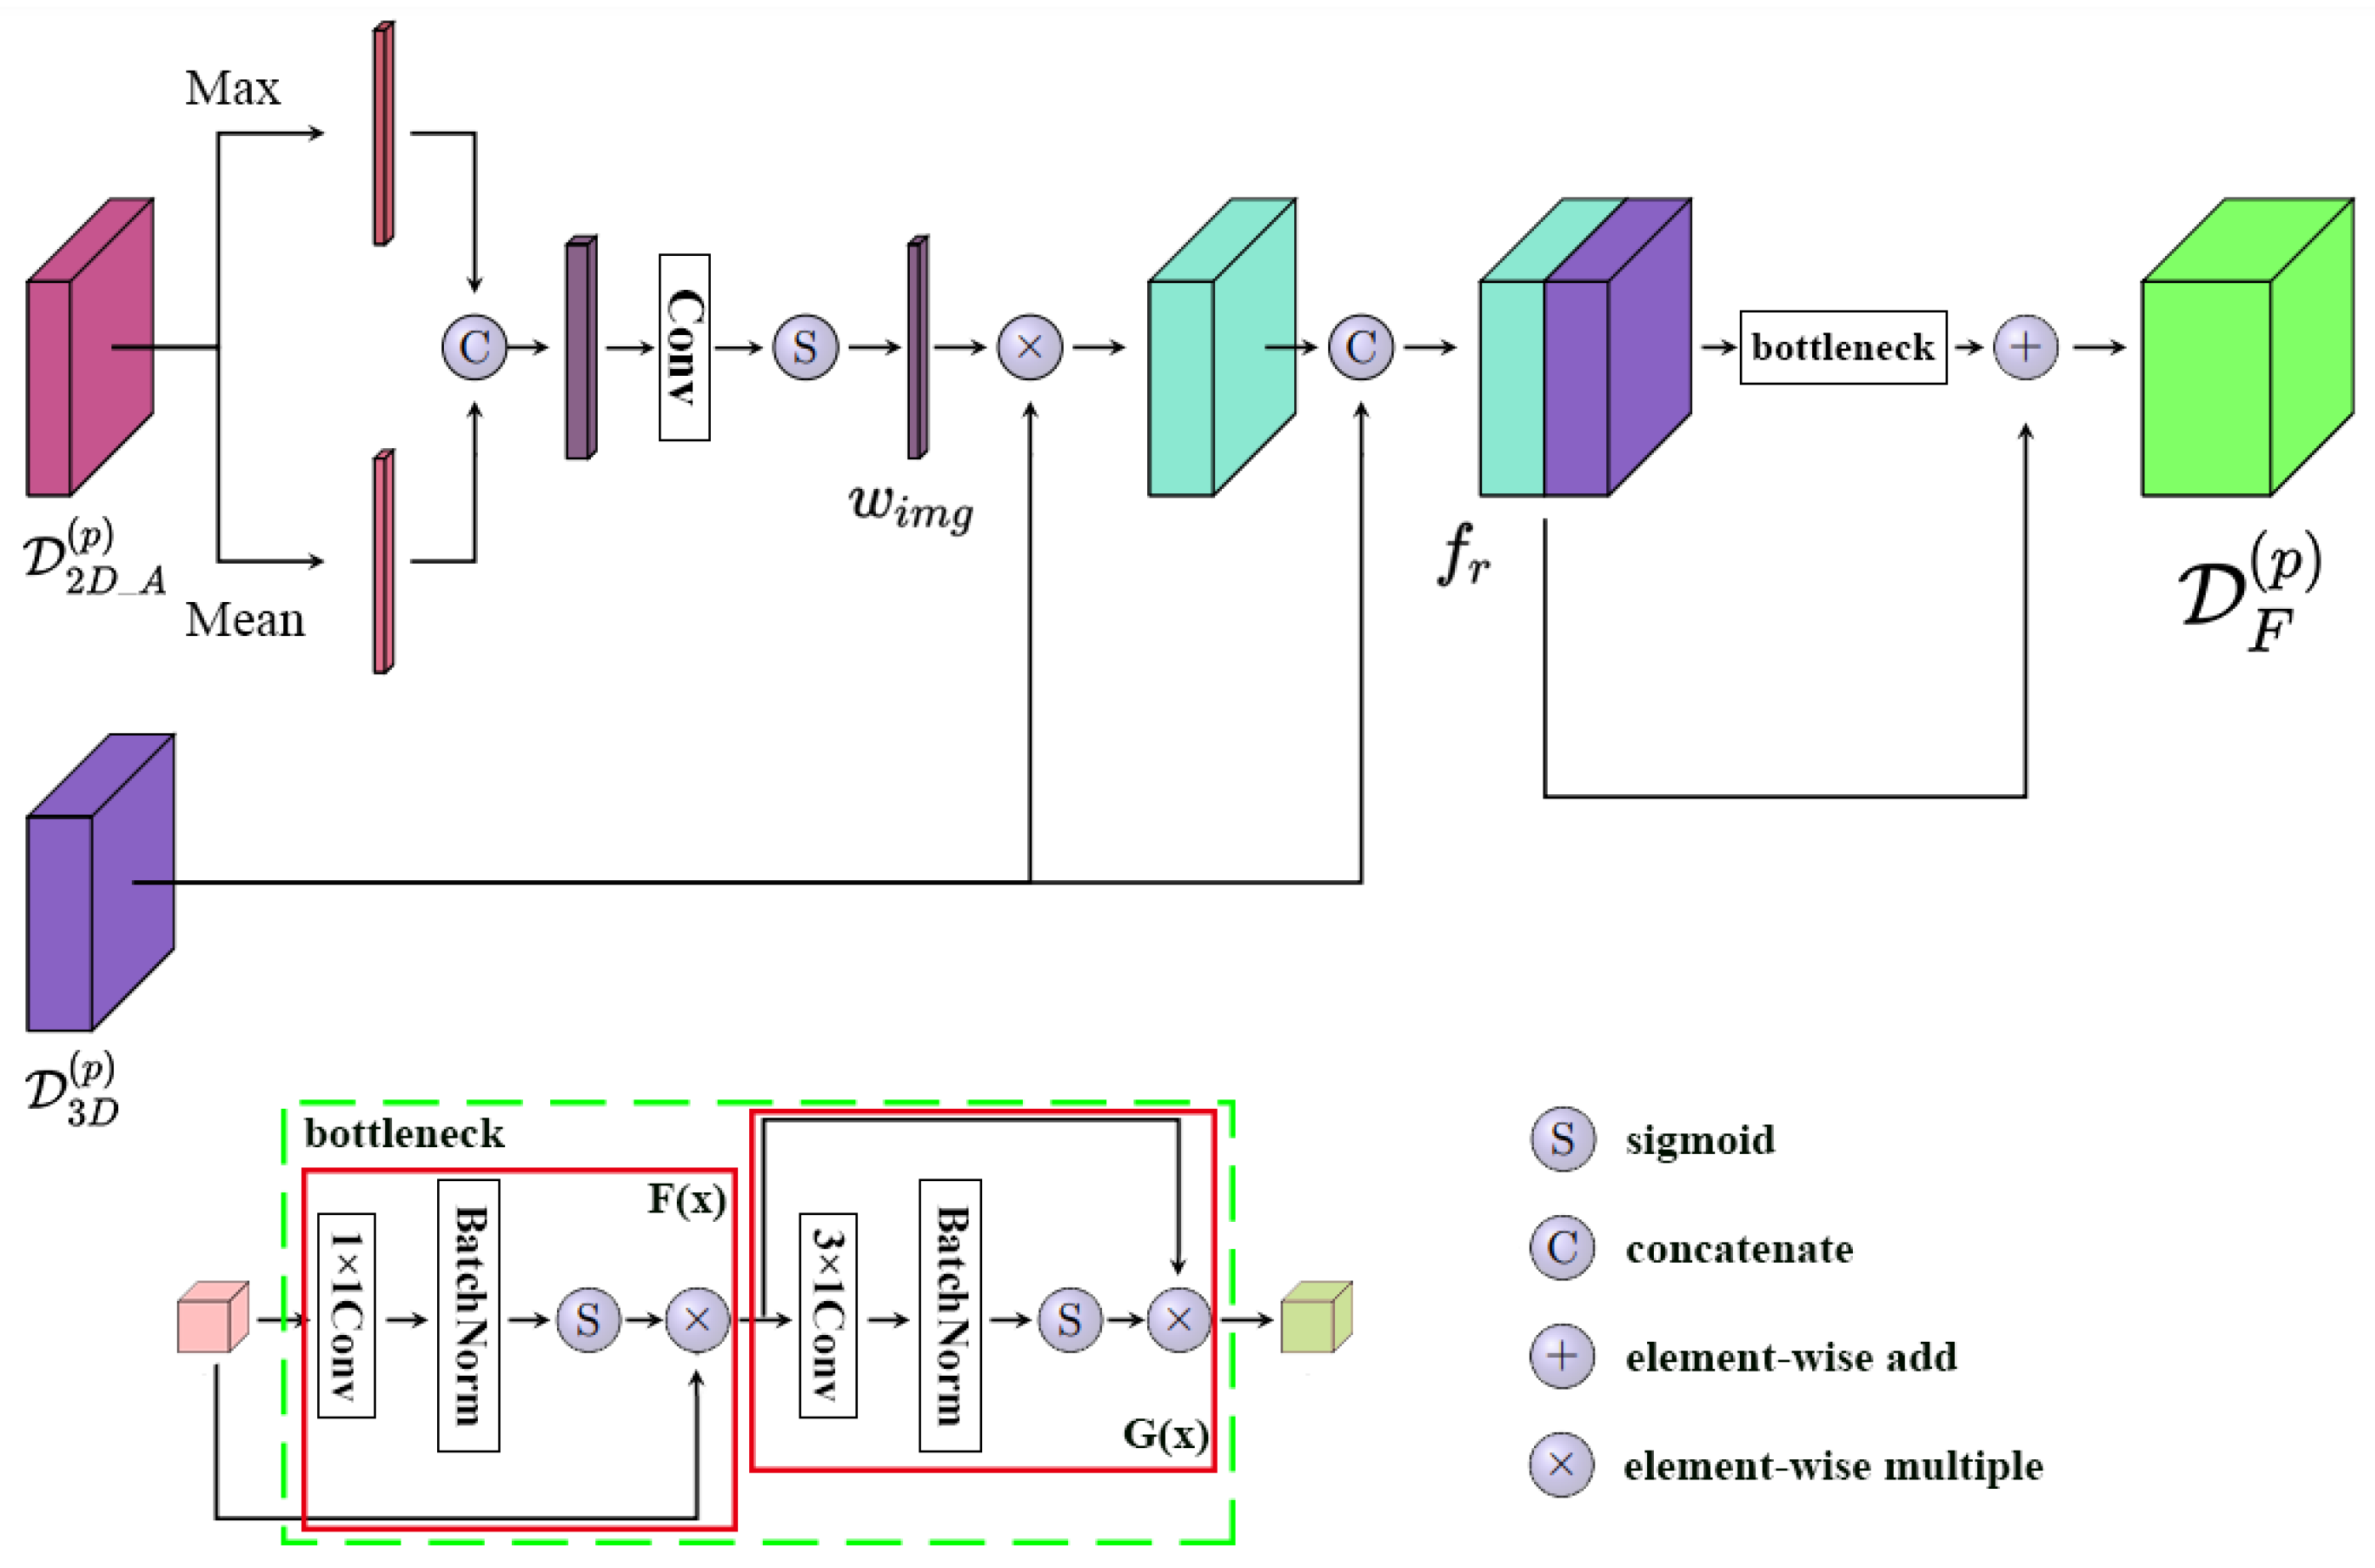

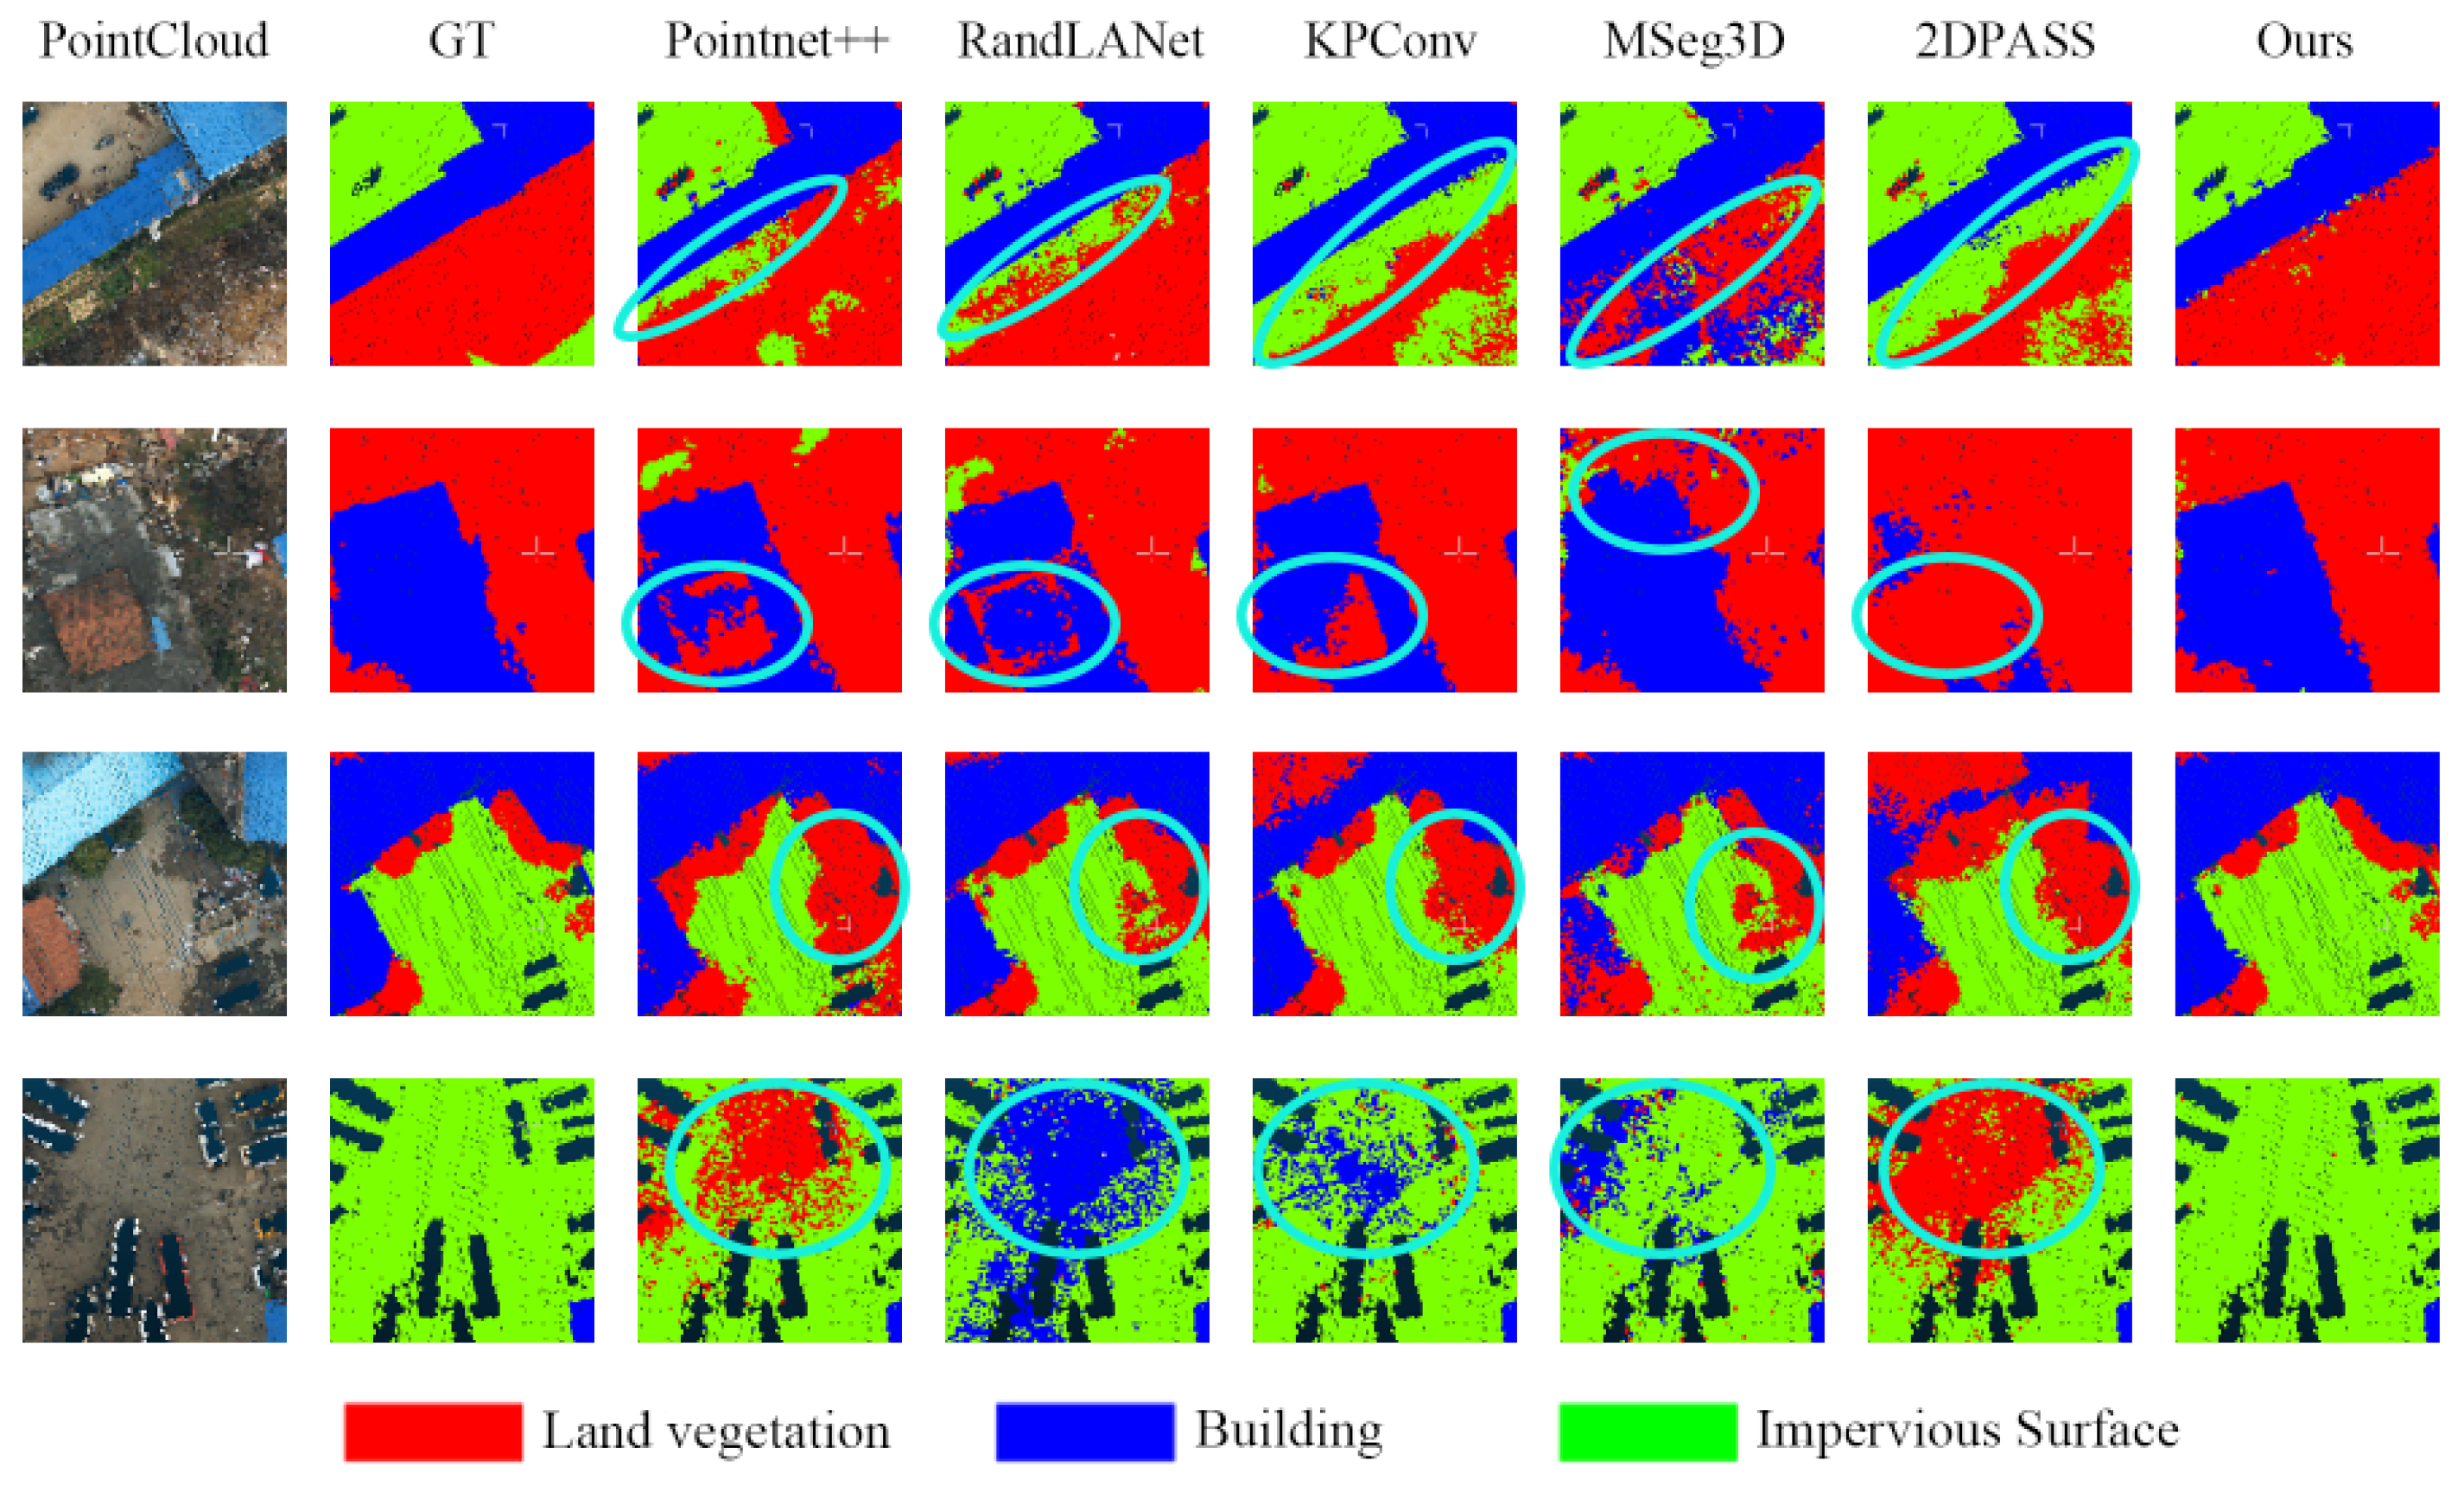
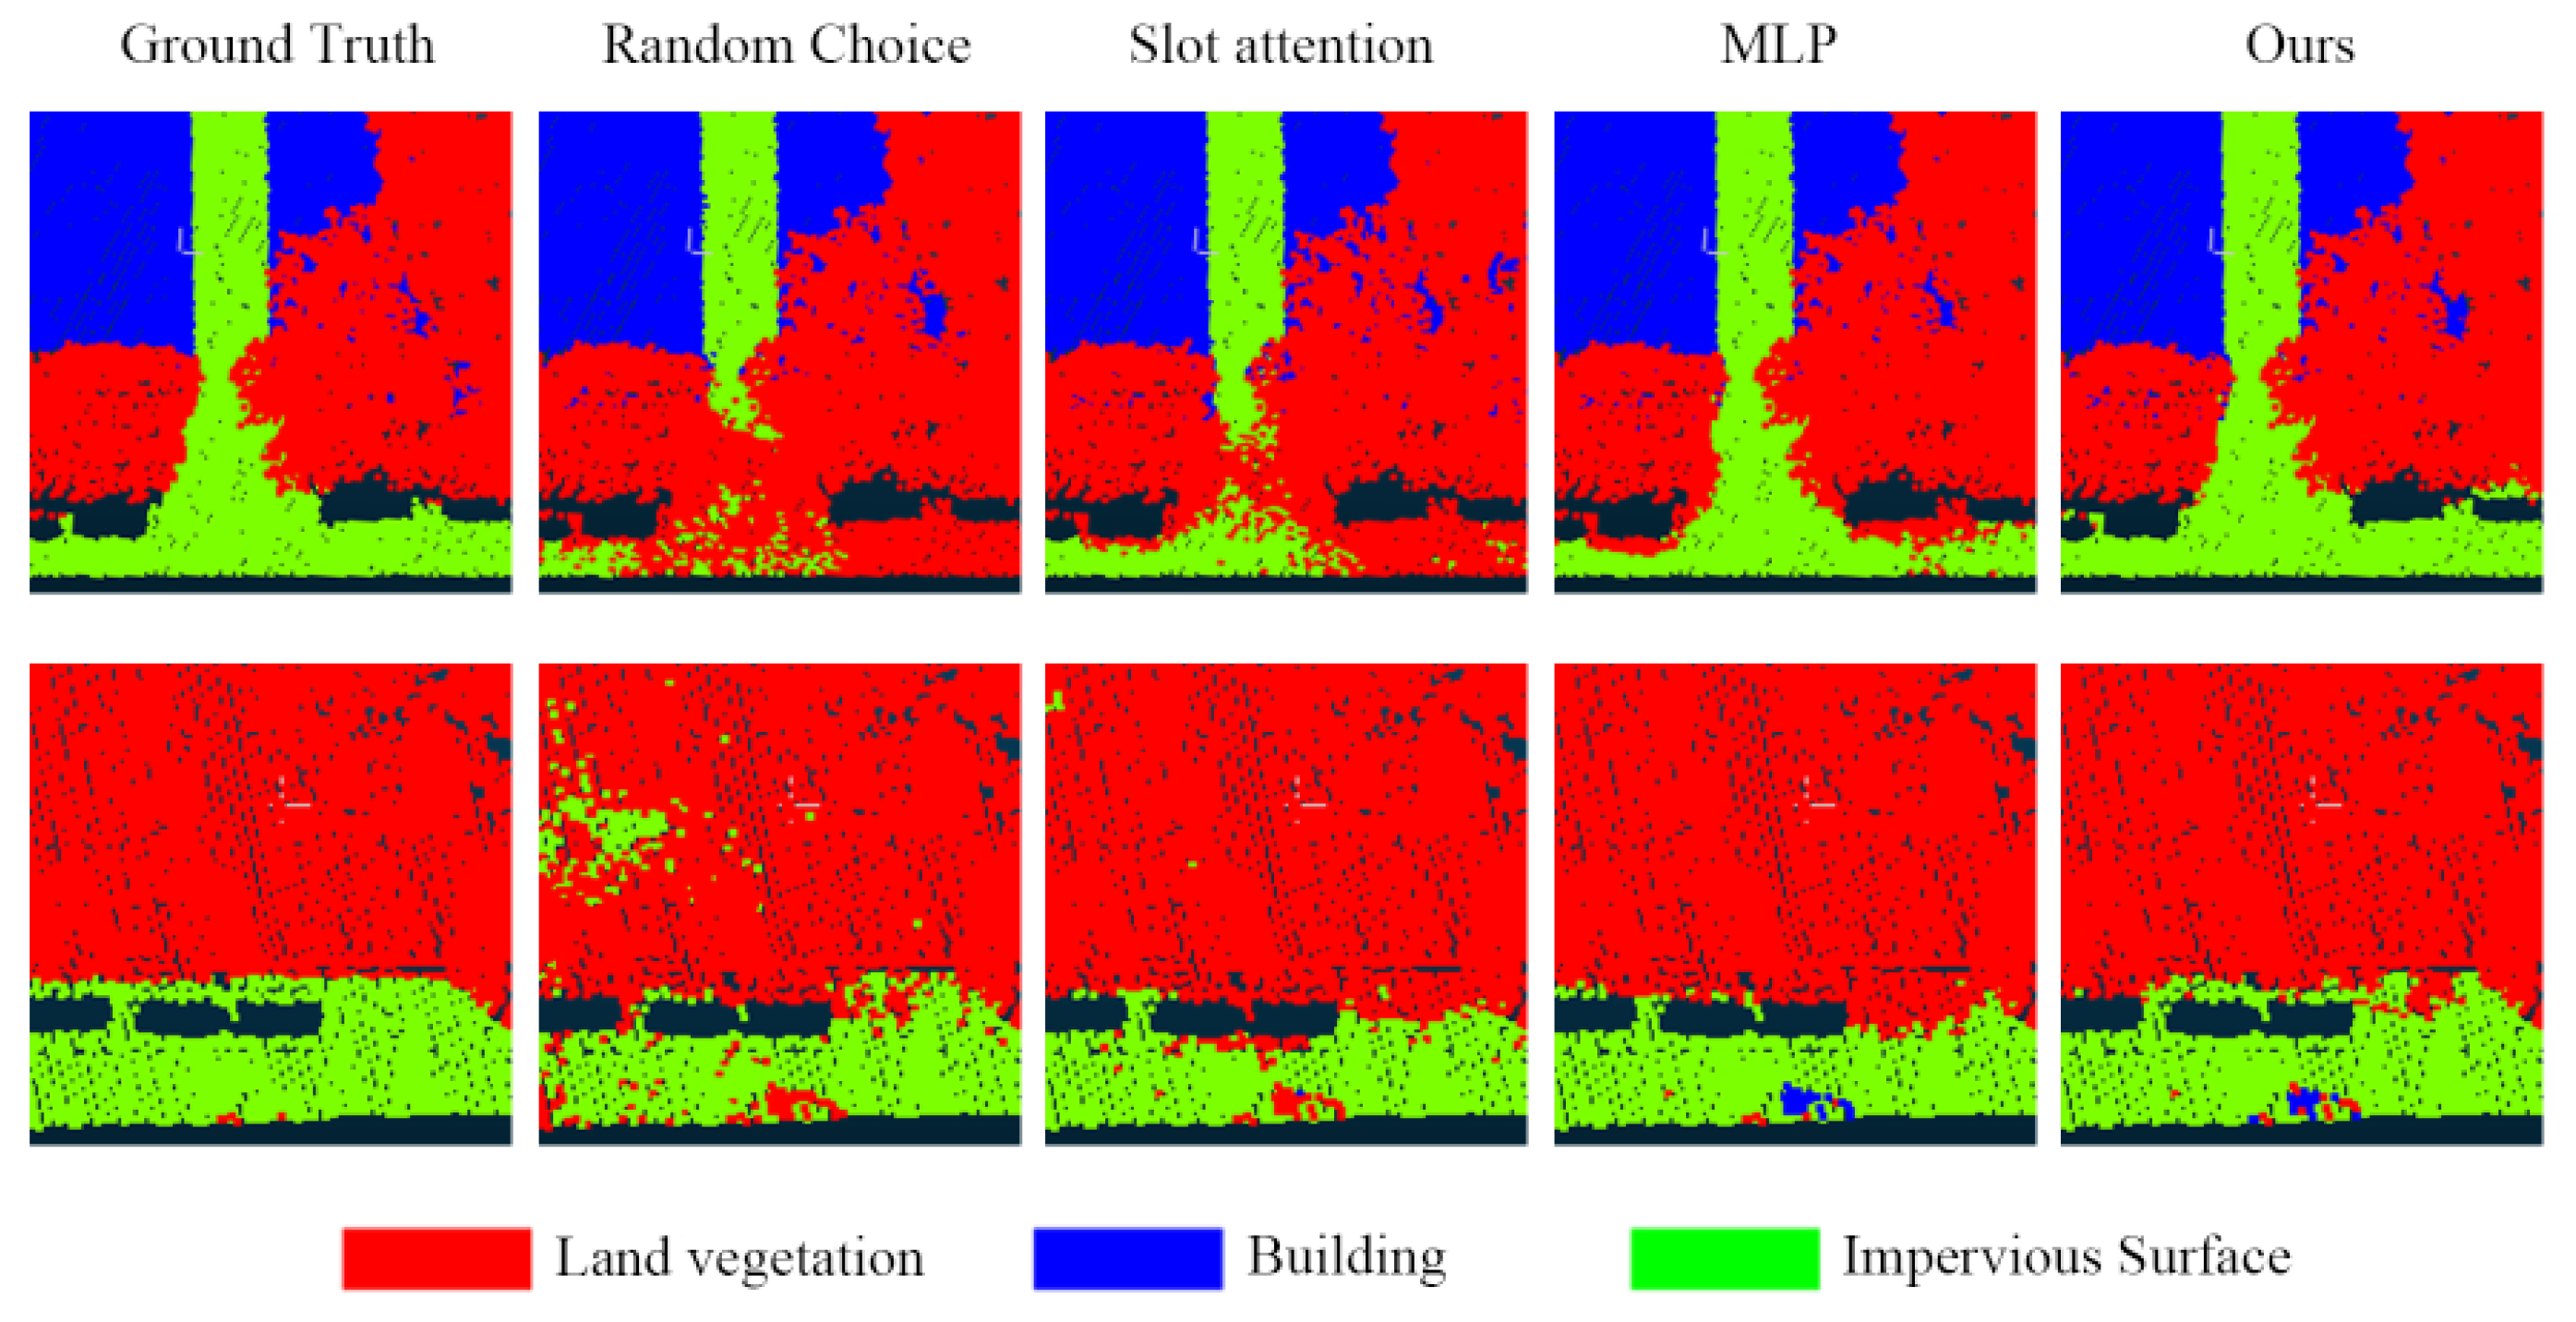
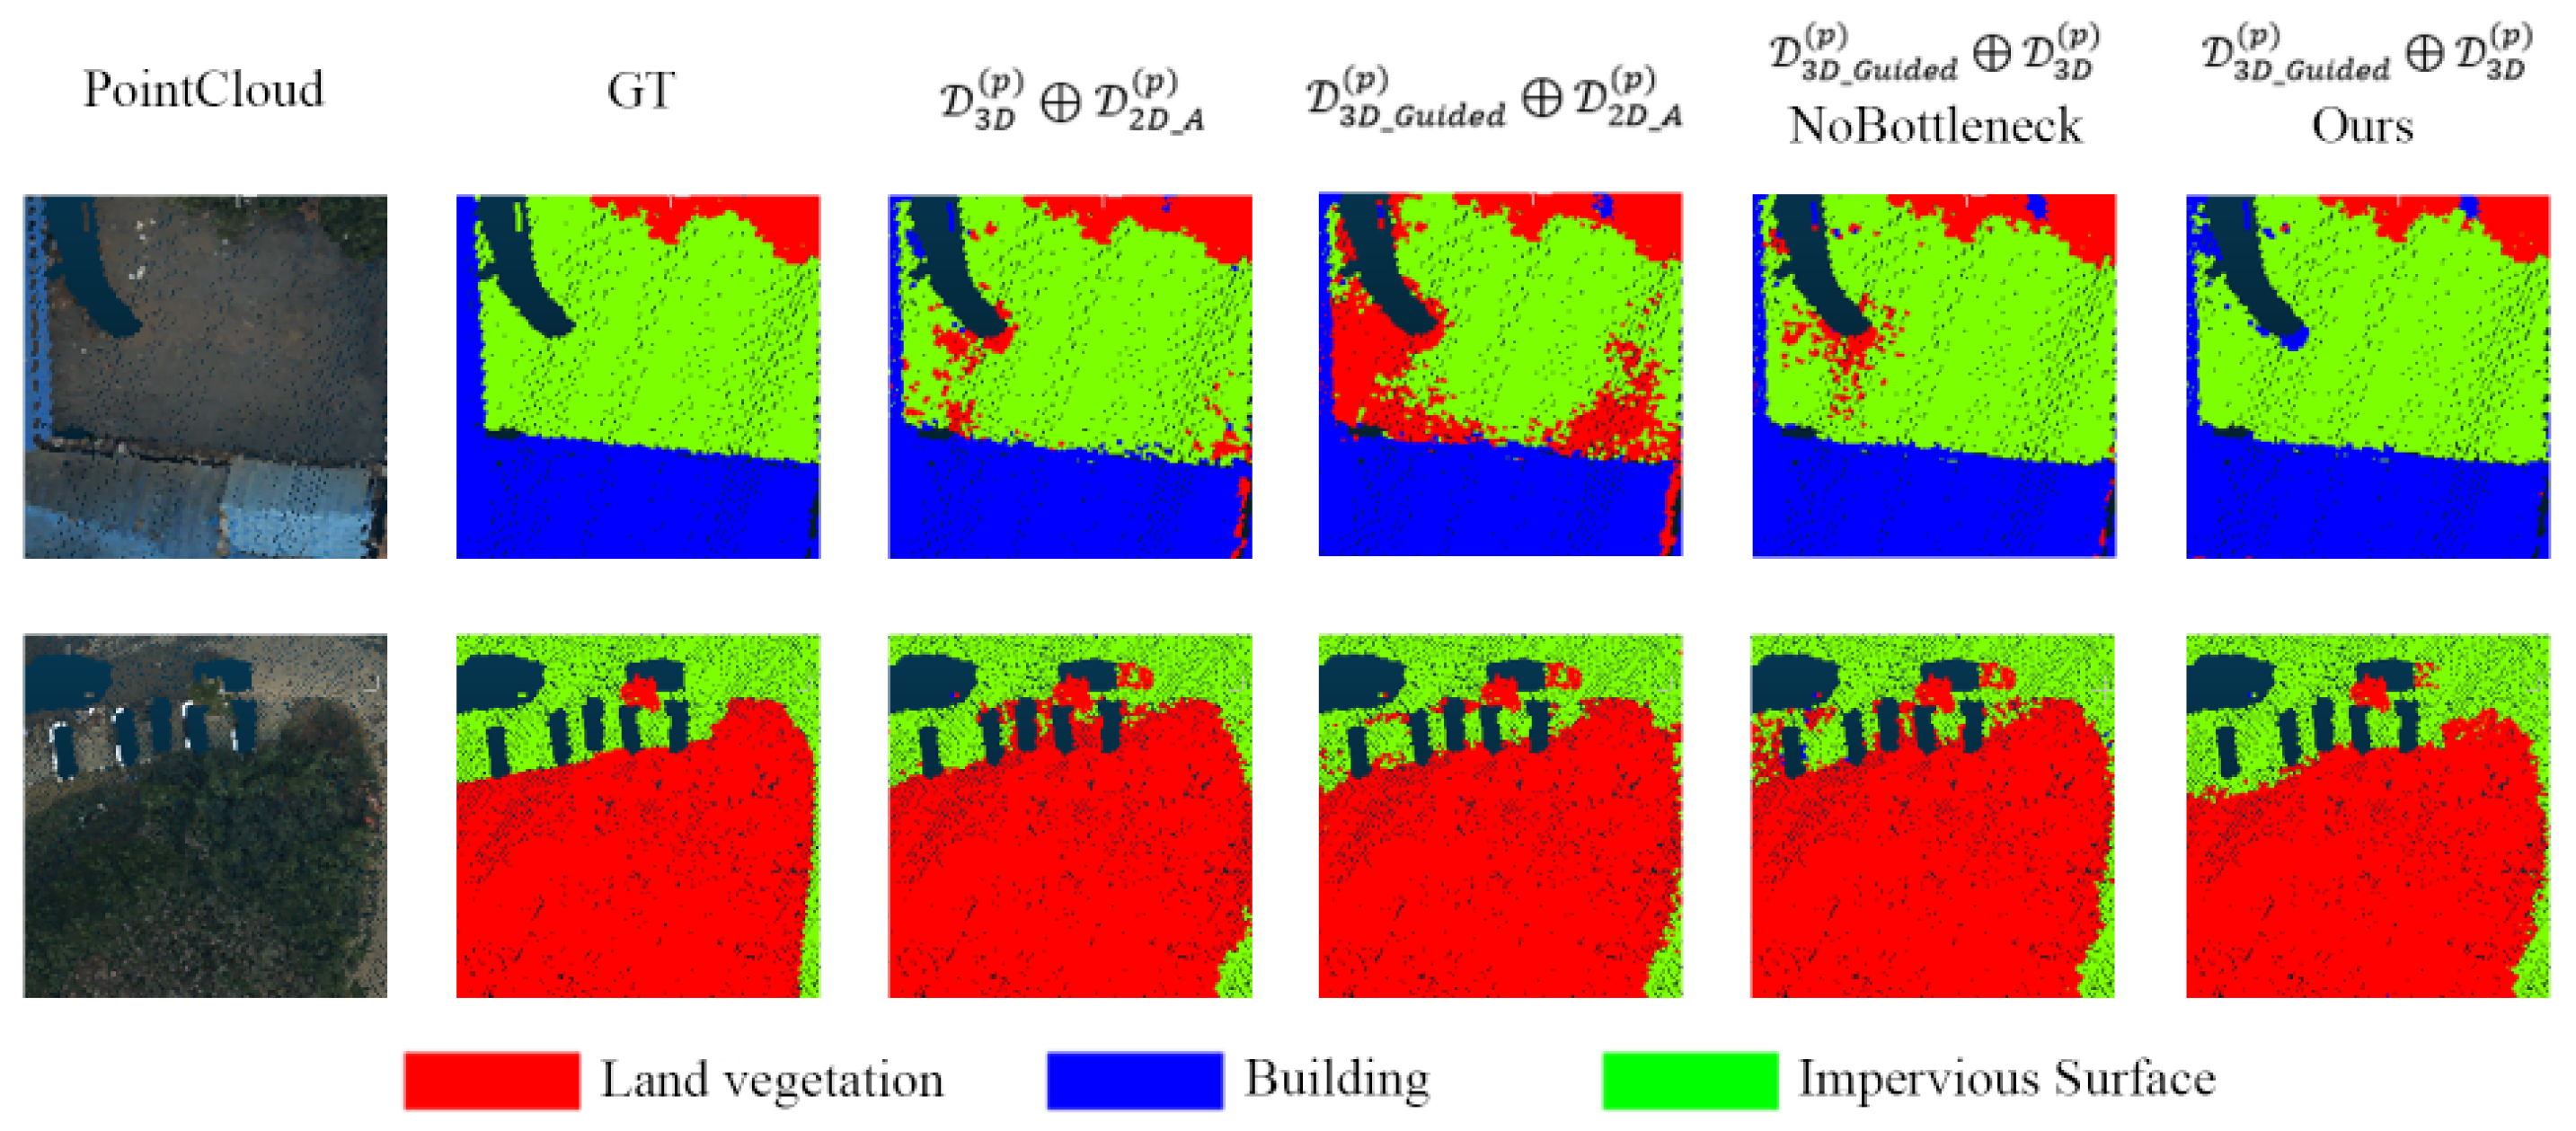

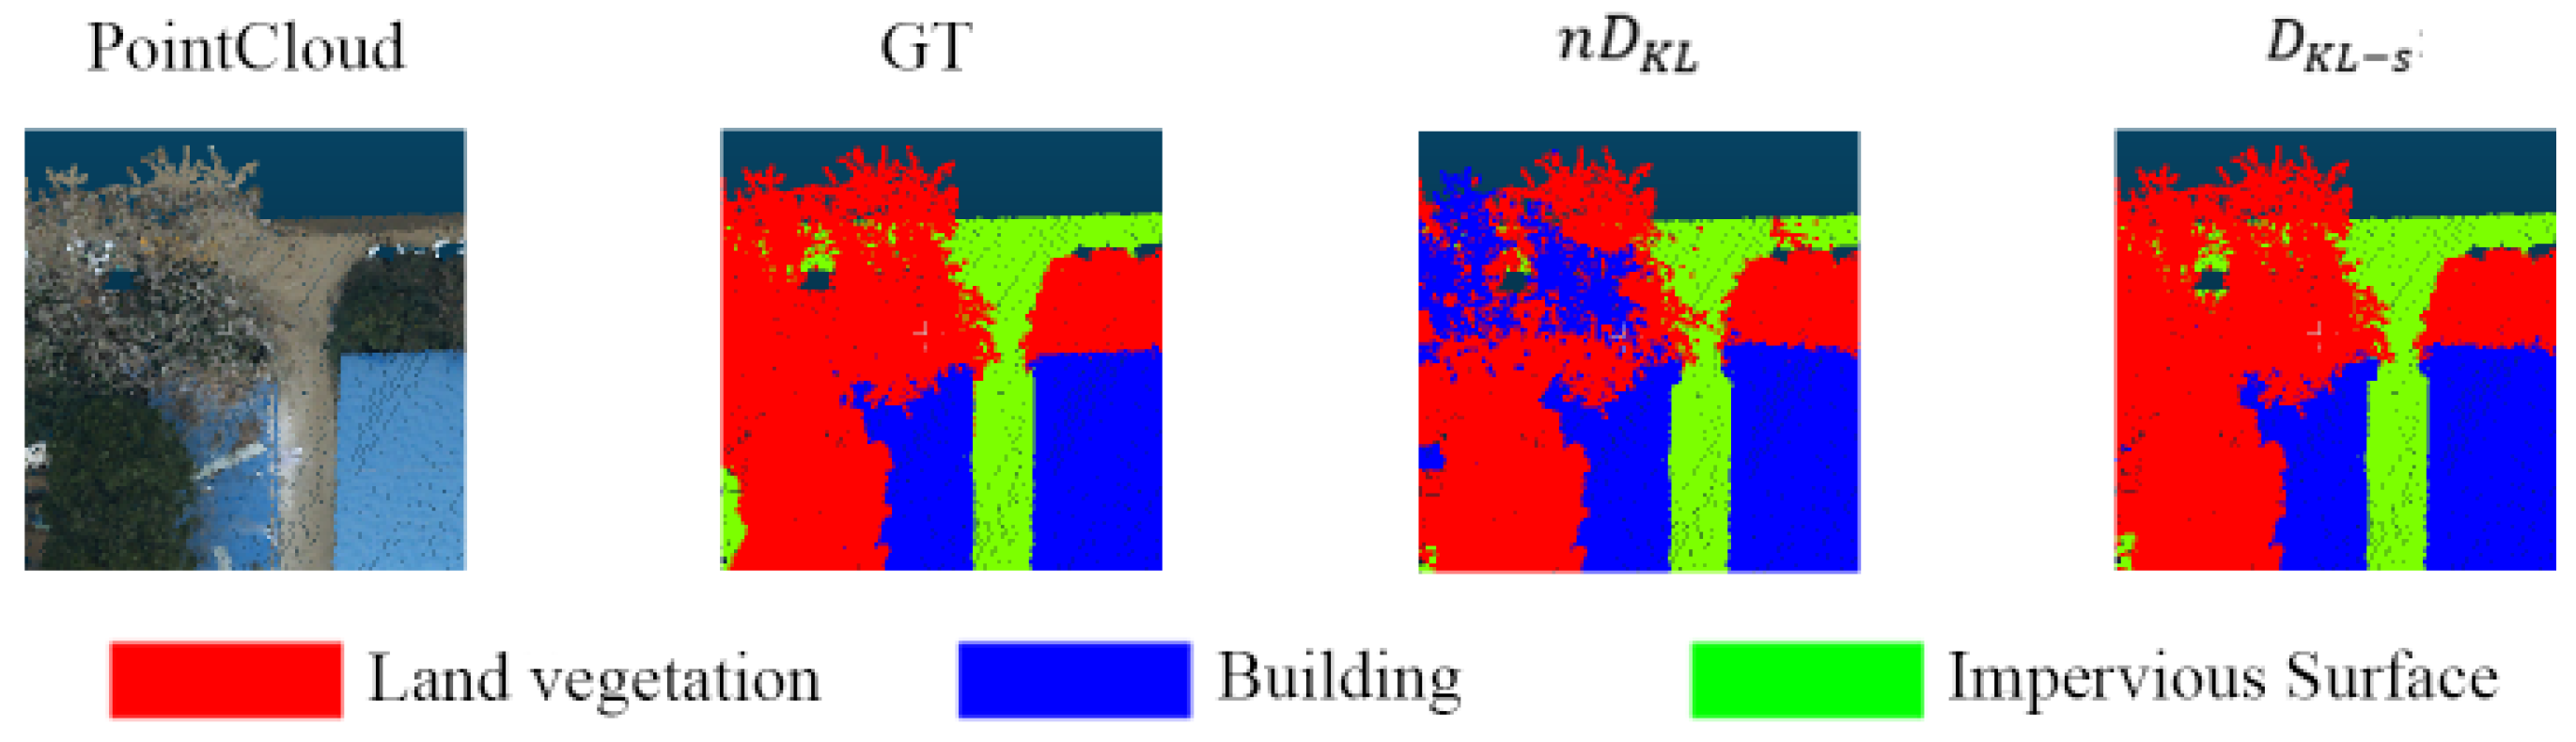
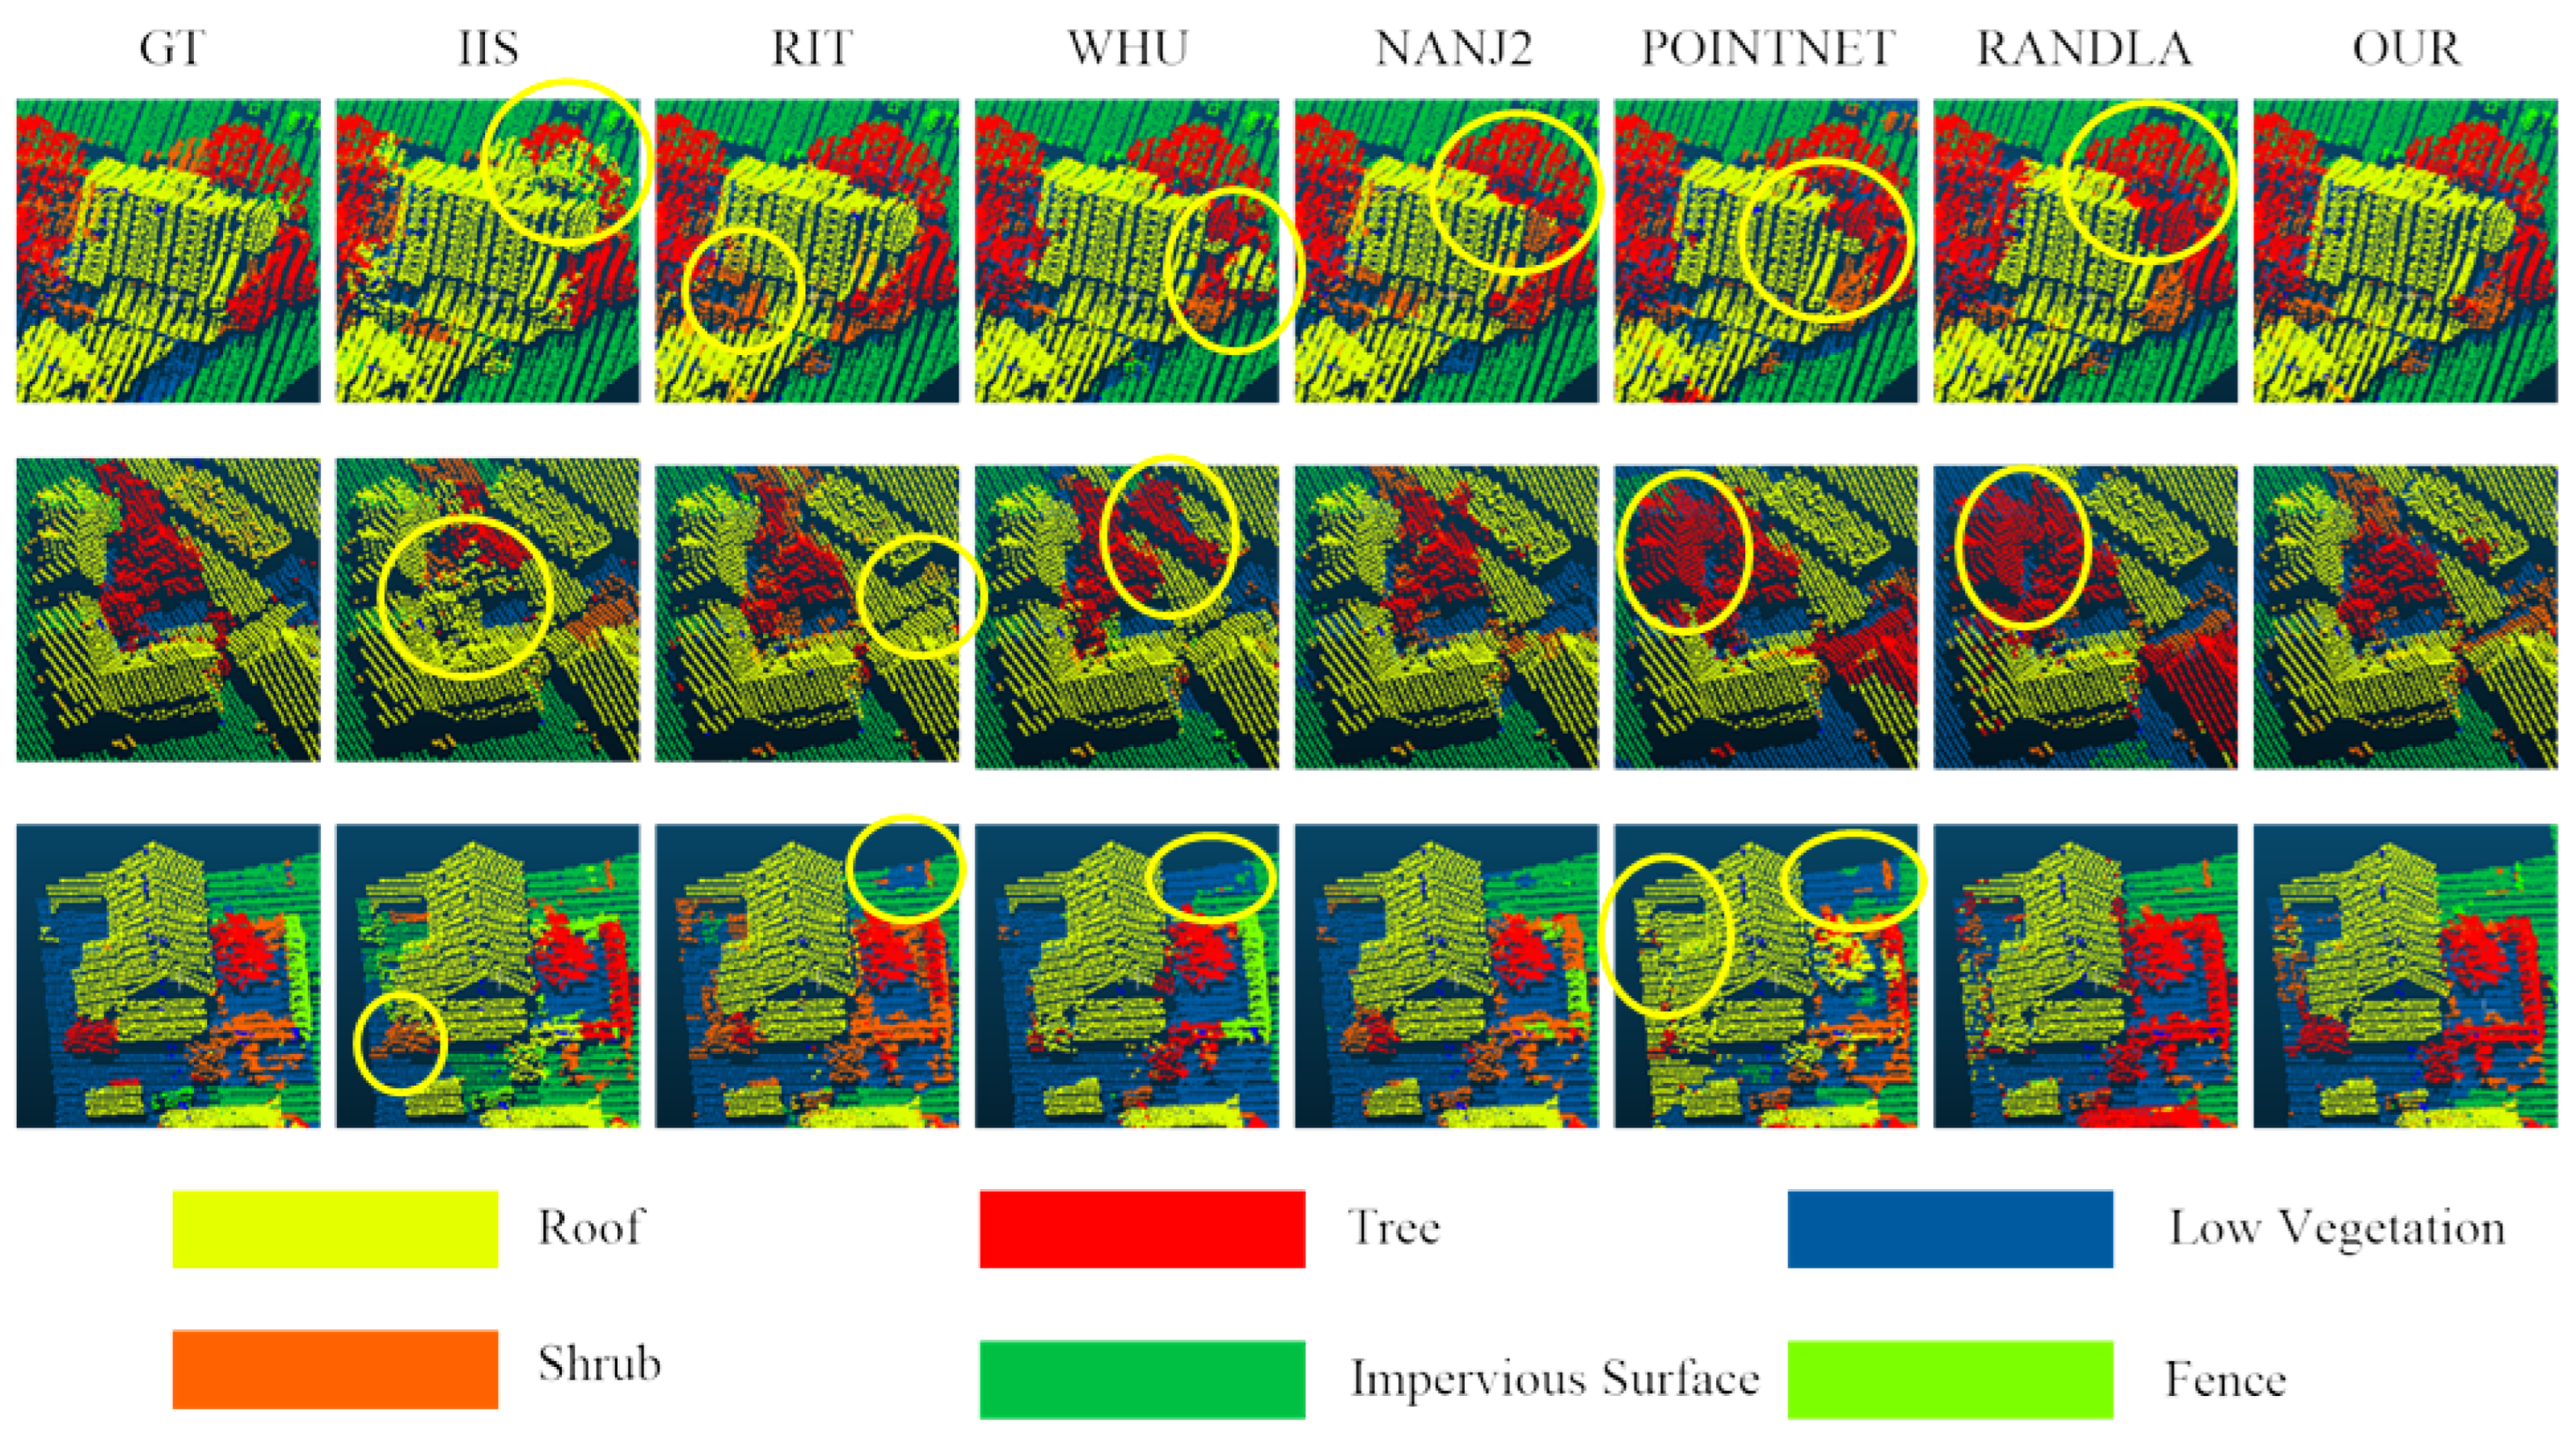
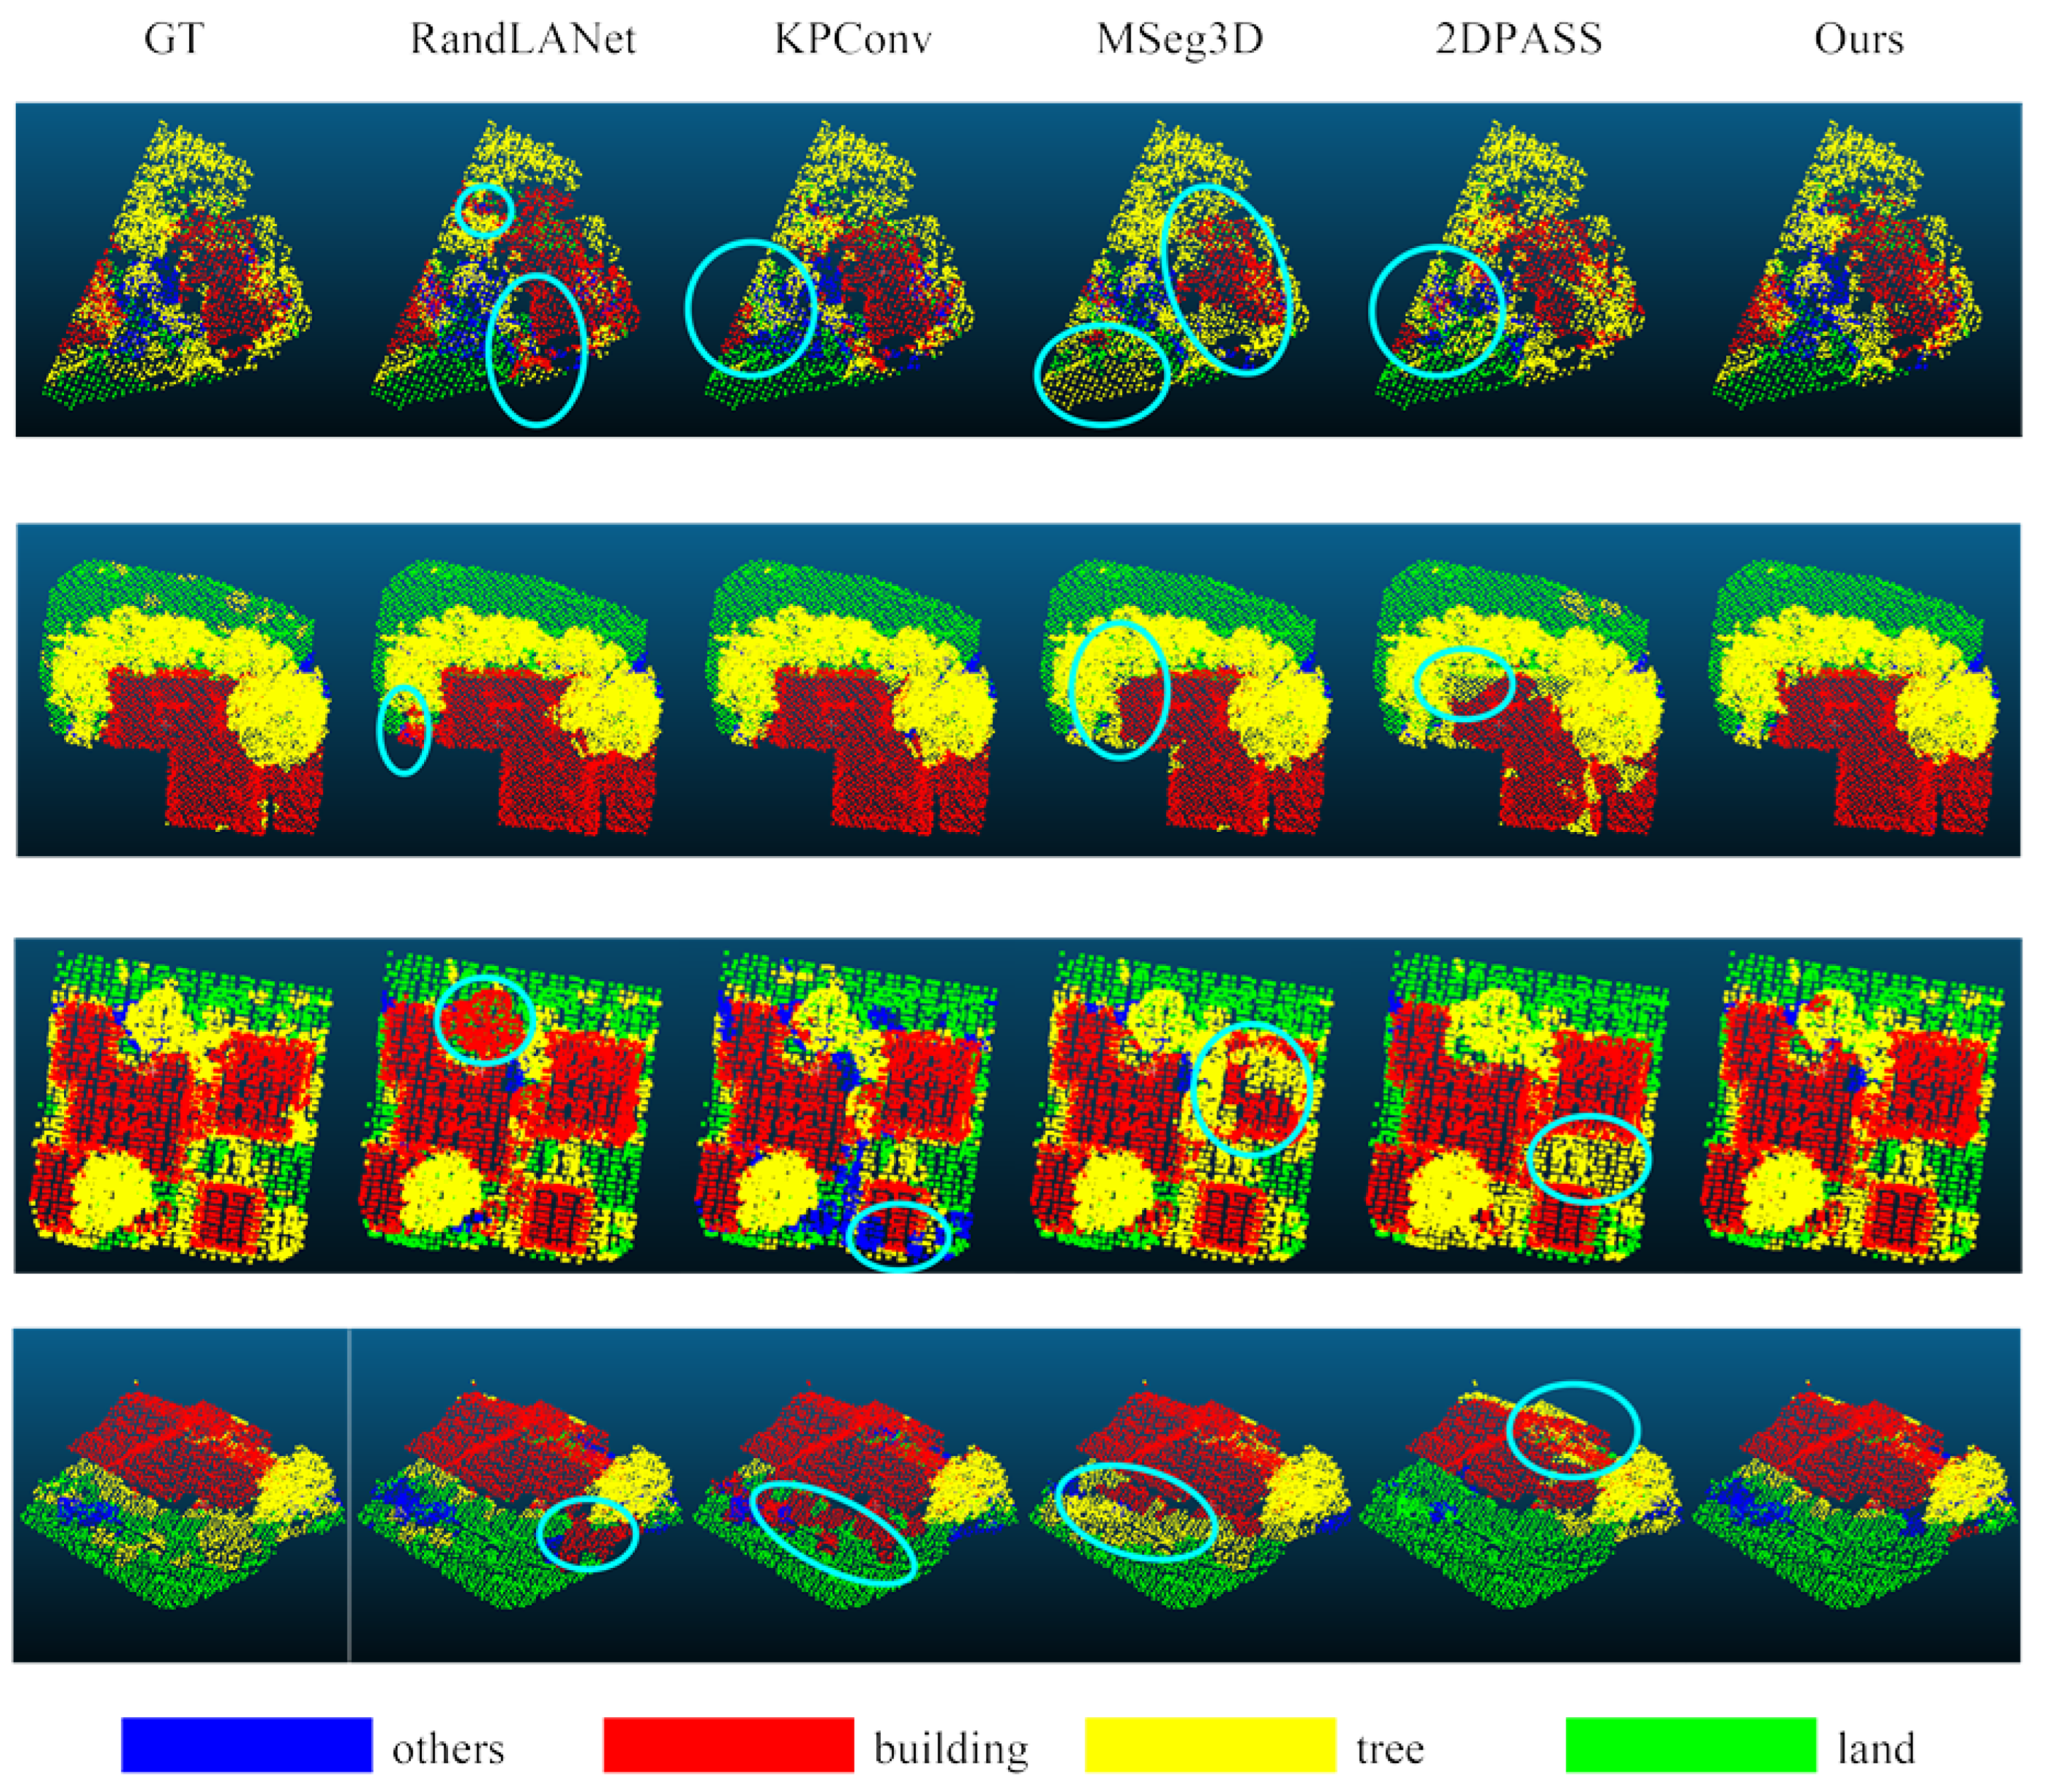
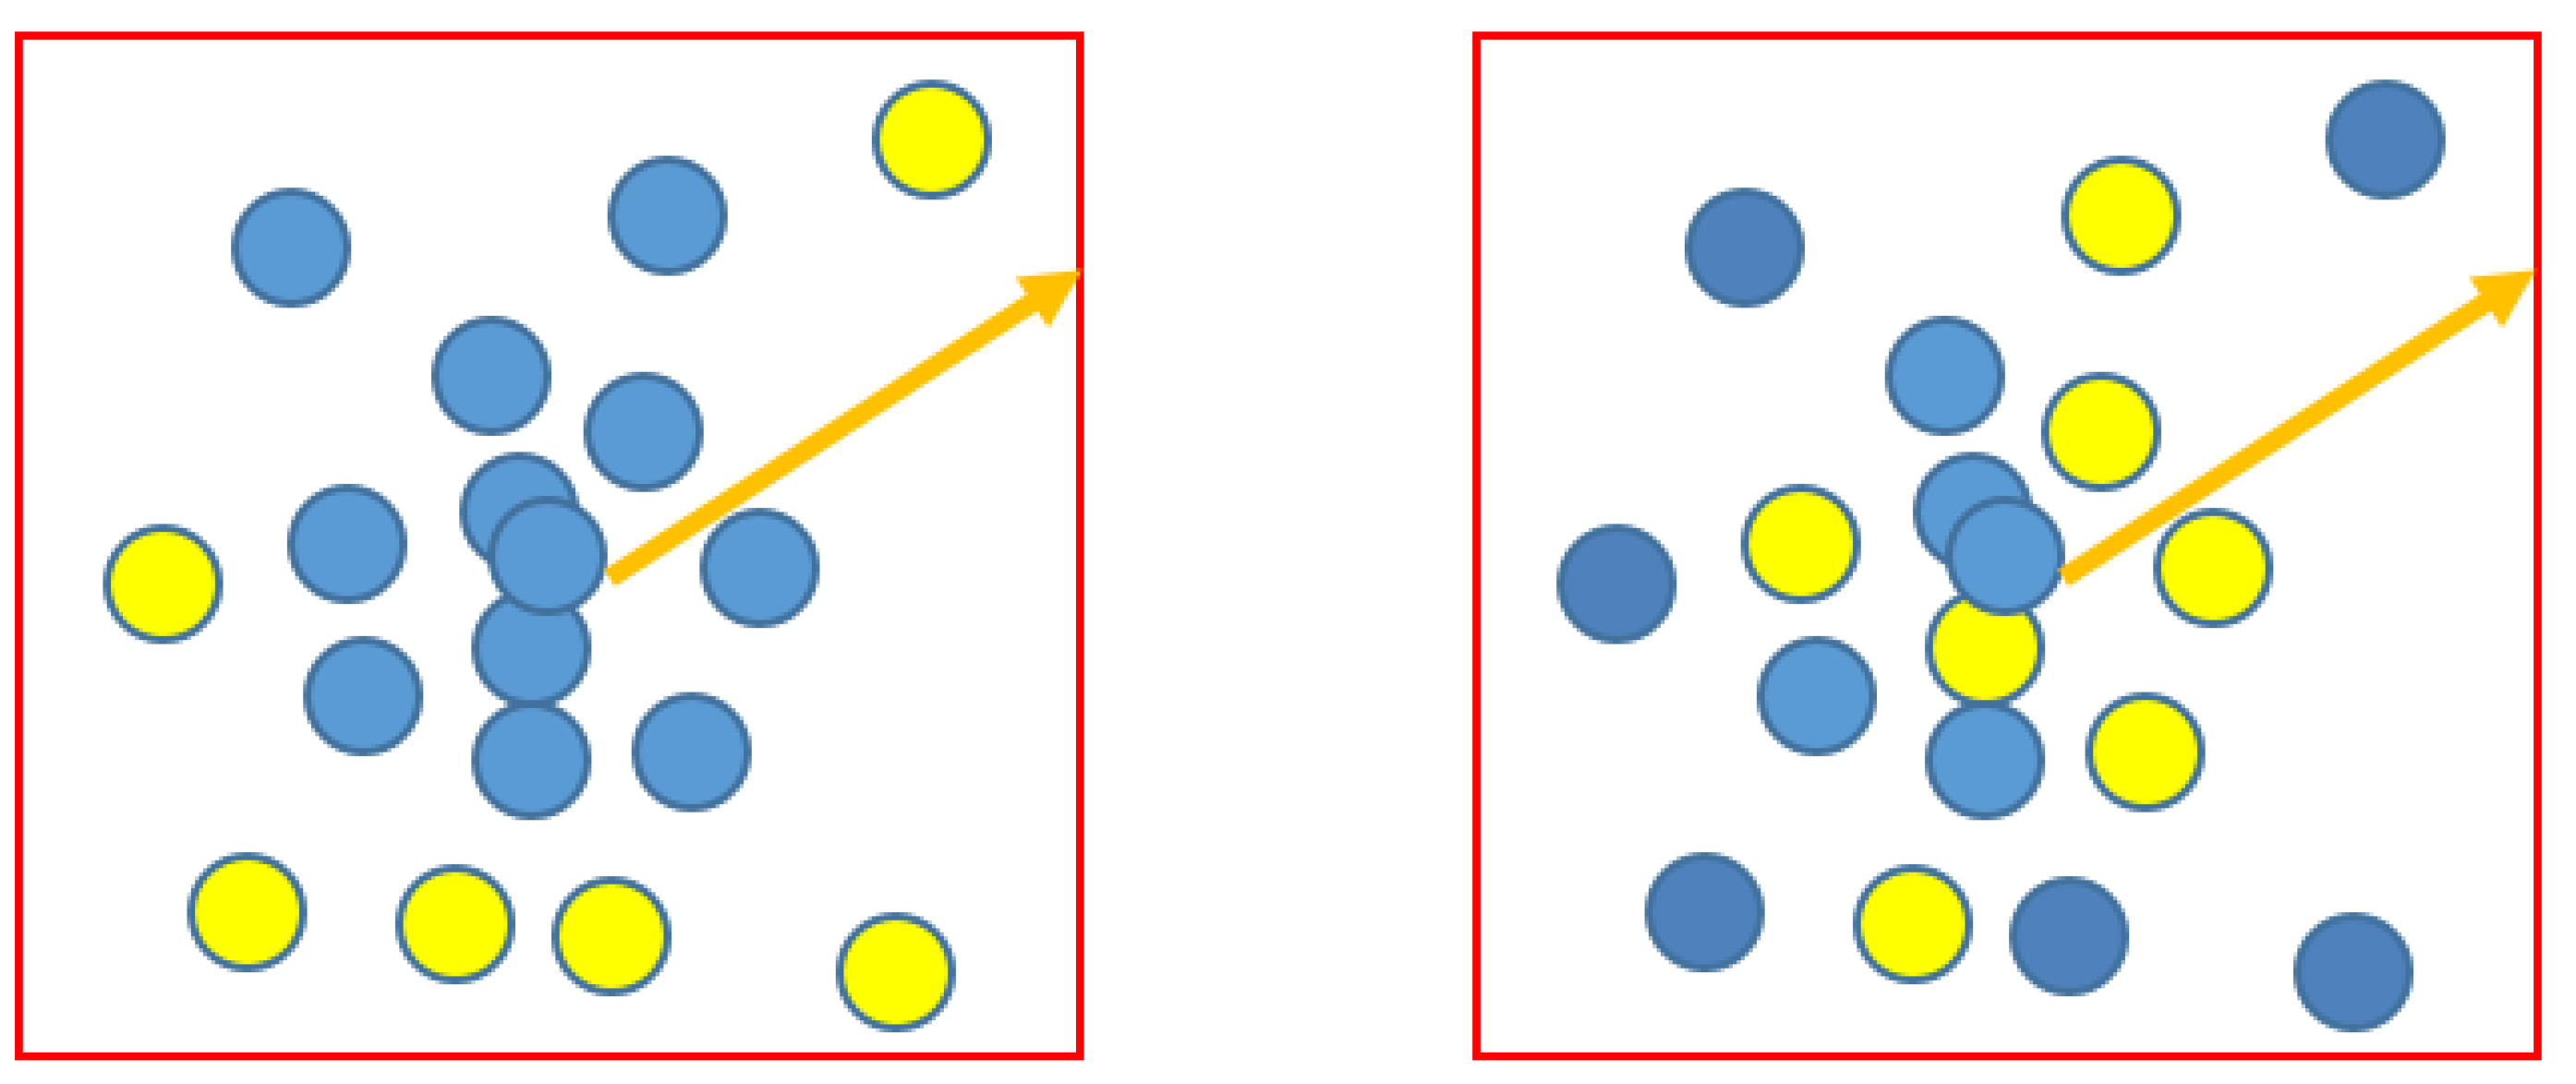
Disclaimer/Publisher’s Note: The statements, opinions and data contained in all publications are solely those of the individual author(s) and contributor(s) and not of MDPI and/or the editor(s). MDPI and/or the editor(s) disclaim responsibility for any injury to people or property resulting from any ideas, methods, instructions or products referred to in the content. |
© 2024 by the authors. Licensee MDPI, Basel, Switzerland. This article is an open access article distributed under the terms and conditions of the Creative Commons Attribution (CC BY) license (https://creativecommons.org/licenses/by/4.0/).