Article

Nonlinear Evolutionary Pattern Recognition of Land Subsidence in the Beijing Plain

1
School of Earth Sciences, Institute of Disaster Prevention, Langfang 065201, China
2
Hebei Key Laboratory of Earthquake Dynamics, Langfang 065201, China
3
Langfang Key Laboratory of Earth Exploration and Information Technology, Langfang 065201, China
4
College of Resources Environment and Tourism, Capital Normal University, Beijing 100048, China
5
Laboratory Cultivation Base of Environment Process and Digital Simulation, Beijing 100048, China
*
Author to whom correspondence should be addressed.
Remote Sens. 2024, 16(15), 2829; https://doi.org/10.3390/rs16152829
Submission received: 9 June 2024 / Revised: 23 July 2024 / Accepted: 30 July 2024 / Published: 1 August 2024
(This article belongs to the Special Issue Analysis of SAR/InSAR Data in Geoscience)

Abstract

:
Beijing is a city on the North China Plain with severe land subsidence. In recent years, Beijing has implemented effective measures to control land subsidence. Since this implementation, the development of time-series land subsidence in Beijing has slowed and has shown nonlinearity. Most previous studies have focused on the linear evolution of land subsidence; the nonlinear evolutionary patterns of land subsidence require further discussion. Therefore, we aimed to identify the evolution of land subsidence in Beijing, based on Envisat ASAR and Radarsat-2 images from 2003 to 2020, using permanent scatterer interferometric synthetic aperture radar (PS-InSAR) and cubic curve polynomial fitting methods. The dates of the extreme and inflection points were identified from the polynomial coefficients. From 2003 to 2020, the subsidence rate reached 138.55 mm/year, and the area with a subsidence rate > 15 mm/year reached 1688.81 km2. The cubic polynomials fit the time-series deformation well, with R2 ranging from 0.86 to 0.99 and the RMSE ranging from 1.97 to 60.28 mm. Furthermore, the subsidence rate at 96.64% of permanent scatterer (PS) points first increased and then decreased. The subsidence rate at 86.58% of the PS points began to decrease from 2010 to 2015; whereas the subsidence rate at 30.51% of the PS point reached a maximum between 2015 and 2019 and then decreased. The cumulative settlement continued to increase at 69.49% of the PS points. These findings imply that groundwater levels are highly correlated with the temporal evolution of subsidence in areas with pattern D (Vs+-, S+), with increasing and then decelerating rates and increasing amounts. In regions with a thickness of compressible clay layer over 210 m, subsidence follows pattern E (Vs+, S+), with increasing rates and amounts. Fractures such as the Gaoliying and Sunhe fractures significantly influence the spatial distribution of subsidence patterns, showing distinct differences on either side. Near the Global Resort Station, pattern E (Vs+, S+) intensifies in subsidence, potentially due to factors like land use changes and construction activities.

1. Introduction

Land subsidence is a global geological problem defined as the gradual or abrupt sinking of the Earth’s surface caused by the removal or relocation of materials beneath the earth [1,2]. Land subsidence causes wall cracking, pipeline damage, seawater intrusion, and other ecological problems [3,4]. Various regions worldwide, e.g., China [5,6], Japan [7,8], Mexico [9,10], USA [11,12], and India [13,14], have experienced subsidence due to accelerated extraction of natural resources in order to meet the increasing demand for industrial and domestic purposes. Beijing is one of the cities in China that suffers from severe land subsidence. Since the first report of land subsidence in 1935, Beijing has experienced land subsidence issues for several decades [15]. From 1955 to 2013, the area with land subsidence exceeding 50 mm in the Beijing Plain reached 4300 km2, with a maximum cumulative subsidence of 1495 mm [16]. From 2010 to 2020, the maximum average annual surface displacement rate reached 133.9 mm/year in Beijing’s subsidence center [17].
Traditional land subsidence monitoring methods include high-precision leveling, stratified markers, and global positioning system (GPS) measurements, which are suitable for small-scale urban land subsidence monitoring [18,19,20]. With the development of remote sensing, interferometric synthetic aperture radar (InSAR) technology has been widely employed for land subsidence monitoring [21,22,23]. In particular, the permanent scatterer InSAR (PS-InSAR) method effectively overcomes the influence of spatiotemporal decorrelation and reduces the error component caused by atmospheric delay [24,25]. The deformation information of ground targets with stable scattering characteristics under a long time-series can be obtained, and the accuracy can reach the millimeter level. The PS-InSAR method can also effectively capture the abrupt or accelerated stage of land subsidence caused by changes in groundwater level or complex geological conditions, making it suitable for the monitoring and analysis of long time-series land subsidence [26,27].
Identifying the time-series evolution pattern of land subsidence can reveal its time-series evolution mechanism and provide a basis for the prediction and prevention of urban land subsidence [28,29]. Linear and nonlinear models are used to study the temporal evolution pattern of land subsidence. Linear models usually assume that the relationship between land subsidence and time is linear, and the settlement rate is also the result of linear fitting. Existing studies have used the change in settlement rate to discuss the evolution of time-series settlement. Lyu et al. used the land subsidence rate as an index to analyze the changes in areas with different subsidence rates in Beijing from 2003 to 2017 and found that the subsidence rate of certain areas and subsidence centers showed a slowing trend after the south–north water transfer to Beijing for its water supply [30]. Zhu et al. and Shi et al. used the PS-InSAR method to monitor land subsidence in Beijing based on a large number of permanent scatterer (PS) points and selected feature points to discuss the evolutionary characteristics of long-term land subsidence [31,32]. Most studies have focused on the linear evolution characteristics of time-series subsidence [27,33,34]. However, long-series linear models may not be able to capture abrupt or accelerated phases in the land subsidence process, especially in the case of changes in the groundwater level or complex geological conditions. In contrast, nonlinear models can better describe the complex relationship between land subsidence and time. Zuo et al. used a complex parameter, permutation entropy, to determine the time-series evolution pattern of land subsidence in Beijing [28]. Park et al. used a nonlinear hyperbolic model to estimate the nonlinear land subsidence in Busan, Republic of Korea. However, the establishment of nonlinear models and the determination of parameters are often complicated and difficult [35]. Using relatively simple and efficient nonlinear models to study the long-term nonlinear evolutionary pattern of large-scale land subsidence requires further exploration.
To address these gaps in the knowledge, this study used PS-InSAR technology to monitor land subsidence using a long time-series in the Beijing Plain from 2003 to 2020 based on Envisat ASAR and Radarsat-2 images. The nonlinear evolution patterns of land subsidence in Beijing were mined for pattern recognition and classification. Finally, correlation analysis was conducted between the nonlinear evolution pattern and the groundwater level, geological background, land use, and other factors to explore the causes of the nonlinear evolution pattern of land subsidence in the Beijing Plain.
In this paper, Section 2 provides a comprehensive overview of the study area and datasets. Subsequently, Section 3 delves into the utilization of PS-InSAR and the methodology employed for temporal evolution pattern recognition. A meticulous depiction of the PS-InSAR results and temporal evolution patterns observed in Beijing Plain is presented in Section 4. Finally, a discussion of the causes of different temporal evolution patterns is given in Section 5. The main conclusions are summarized in Section 6.

2. Study Area and Dataset
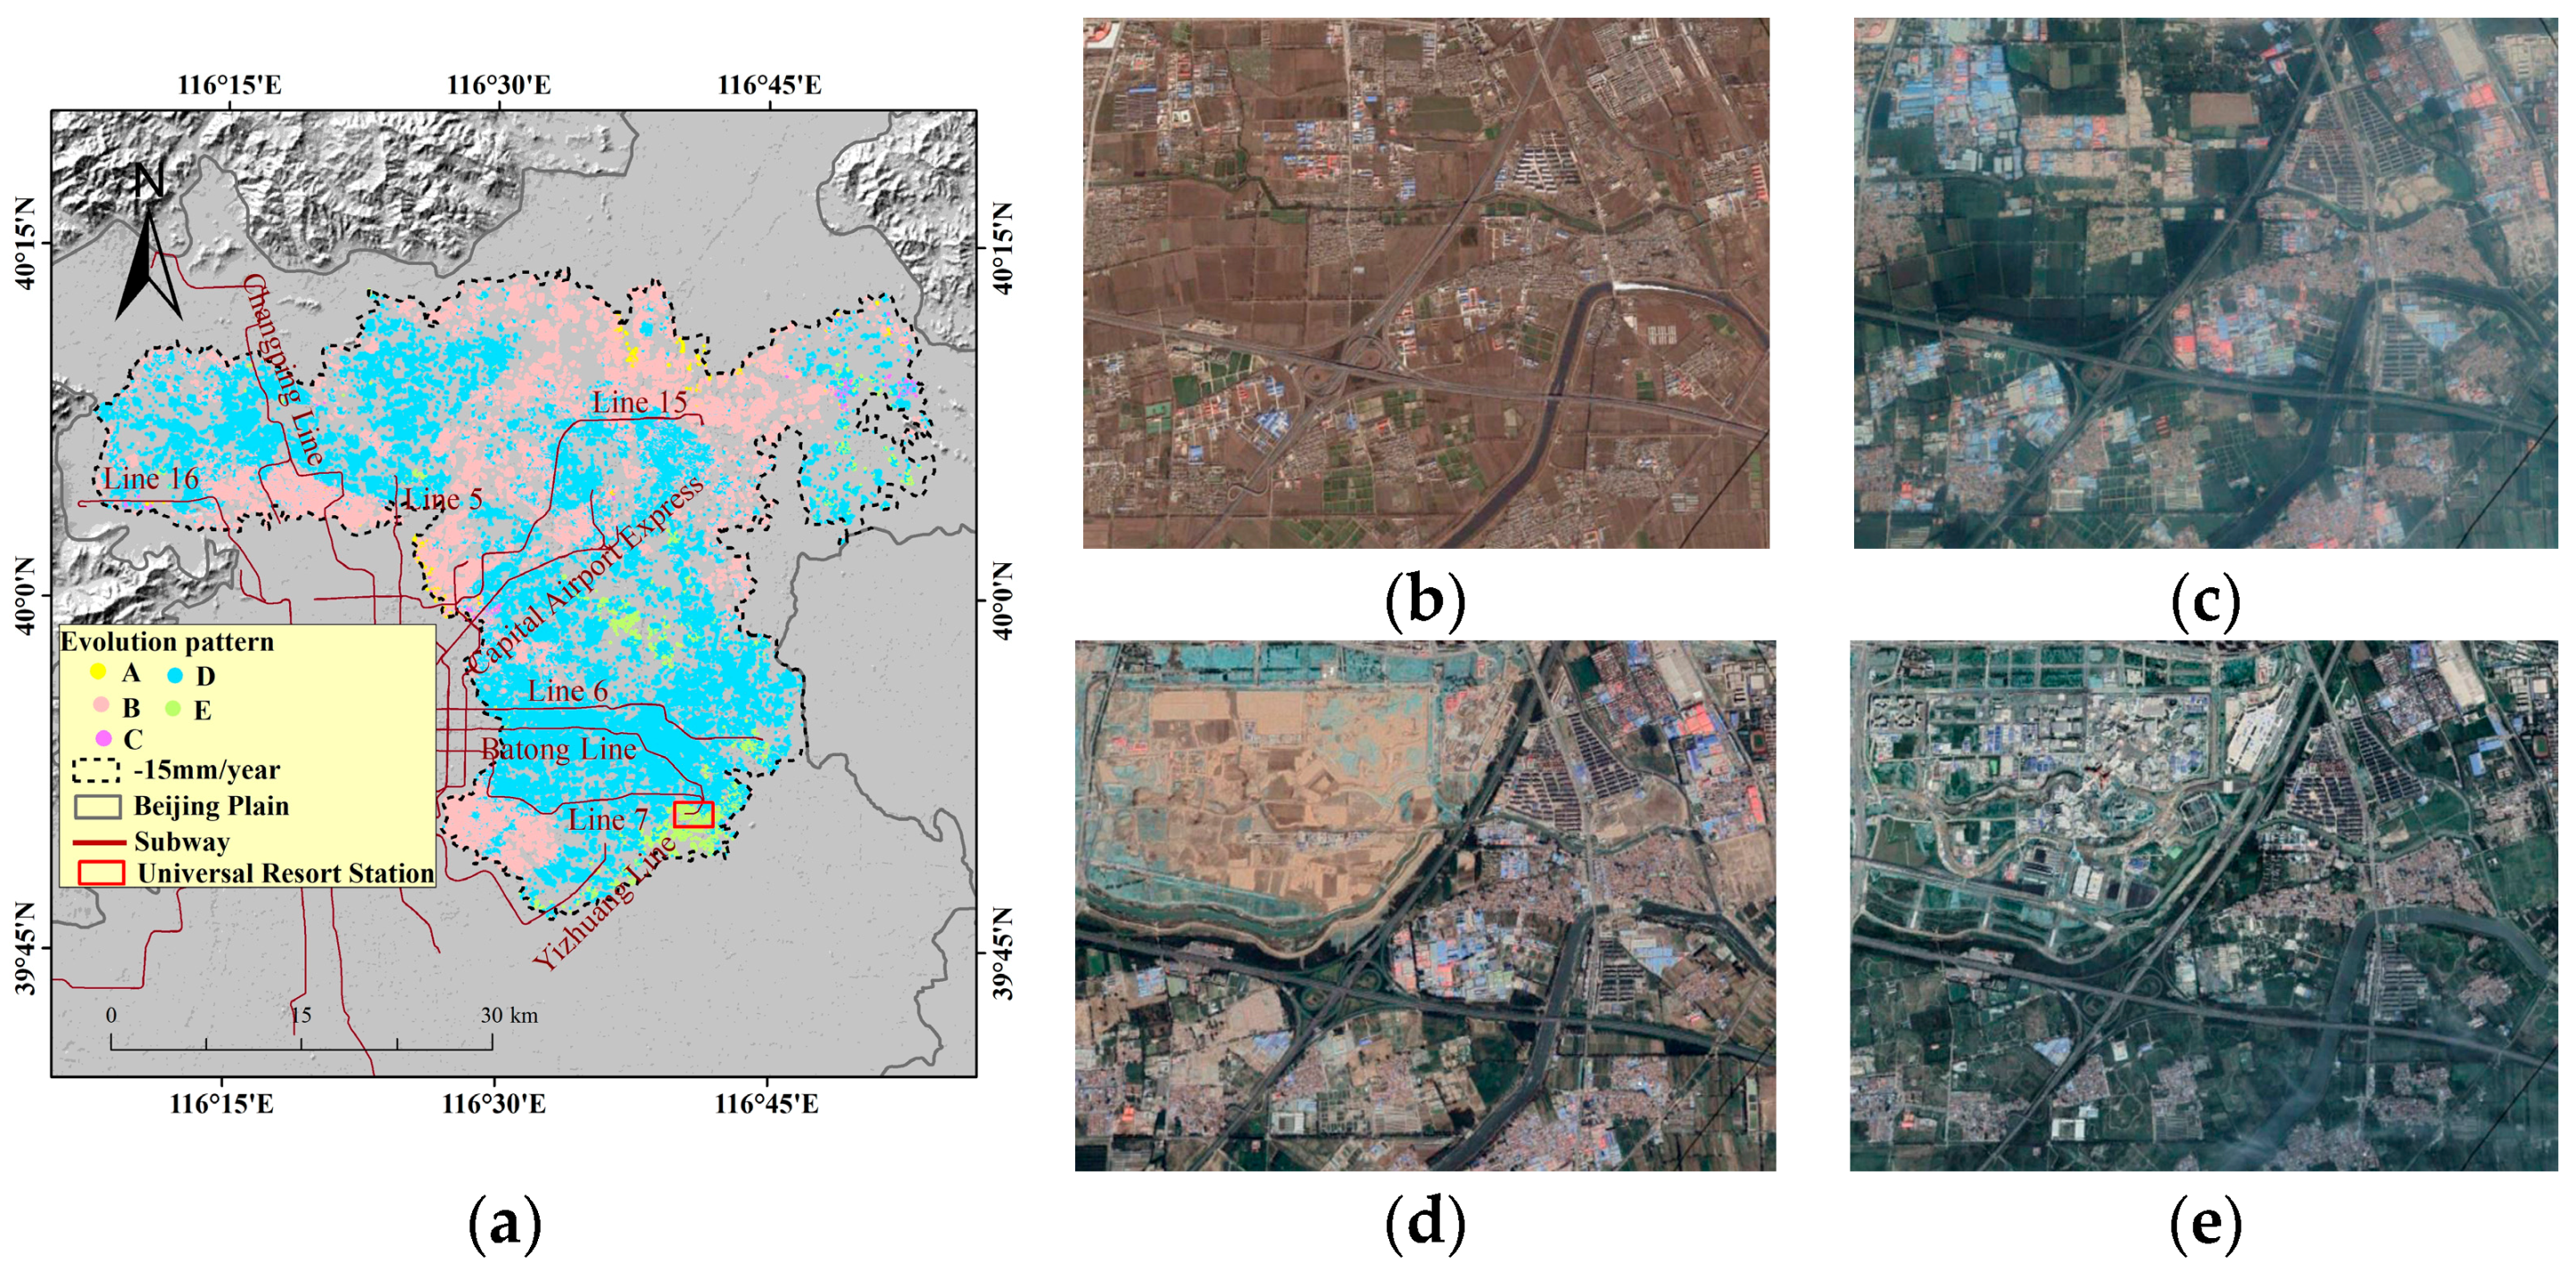
2.1. Study Area

The Beijing Plain is a piedmont alluvial fan plain crossed by five rivers: the Ju, Juma, Yongding, Wenyu, and Chaobai [36]. The total area is approximately 6236 km2, accountings for 38% of the total area of Beijing [37] (Figure 1). The northwest piedmont alluvial fan plain is higher than the southeast plain. From the top to the bottom of the alluvial fan, the particles of the aquifer change from coarse to fine, and the water-bearing layers gradually change from a single sand and pebble layer to a multilayered sand, pebble, and sand layer [38].
The Beijing Plain is characterized by a typical warm-temperate, sub-humid, semi-arid continental monsoon climate with four distinct seasons, and rainfall is concentrated in the summer. The average temperature throughout the year is 11–13 °C, and the average annual precipitation is 585 mm.

2.2. Datasets

In total, 135 scenes of Envisat ASAR and Radarsat-2 data were used to obtain land subsidence information for the study area from 2003 to 2020. Envisat was an Earth observation satellite launched on 1 March 2002 by the European Space Agency (ESA). Envisat ASAR operates in the C-band with a wavelength of 5.6 cm. The Radarsat-2 satellite, launched on 14 December 2007, operates in the C-band. We employed 55 Envisat ASAR (18 June 2003–19 September 2010) and 80 Radarsat-2 images (37 from 22 November 2010 to 21 October 2016 and 43 from 25 January 2017 to 10 January 2020). Envisat ASAR was operated in image mode with a resolution of 30 m. Radarsat-2 was operated in standard mode with a medium resolution of 30 m for the first set of images and in the extra-fine mode with a high resolution of 5 m for the second set (Table 1). The spatial coverage of the images is shown in Figure 1.

3. Methods

3.1. PS-InSAR Monitoring for Time-Series Deformation

PS-InSAR is a method, proposed by Ferretti et al. [25], that obtains points with stable scattering characteristics from time-series SAR images as PS points and uses the phase information of PS points to invert the temporal surface deformation. This study used GAMMA software (GAMMA 2017) to process the 135 satellite images using the PS-InSAR method. First, the main image was selected based on the spatiotemporal baseline and Doppler centroid frequency, and other auxiliary images were registered and resampled to the main image. Differential interferograms were generated through differential interference, PS points were extracted using the amplitude dispersion method, and a time-series analysis was performed on their differential phases to obtain the deformation rate results, deformation sequence information, digital elevation model (DEM) residuals, and atmospheric delay errors at the millimeter level for PS points. The line of sight (LOS) deformation results obtained by PS-InSAR can be decomposed into vertical, east–west, and north–south components.
In this study, we ignored the horizontal deformation component, due to the main deformation in Beijing being land subsidence and uplift [15]. We used ArcGIS to project the LOS deformation variable onto a vertical deformation variable using Equation (1).
D = D L O S C o s θ
D and D L O S represent the vertical deformation and LOS deformation of a PS point, respectively. θ represents the SAR viewing angle. Positive (“+”) and negative (“−“) values of the vertical deformation variables represent the occurrence of surface uplift and subsidence, respectively.

3.2. Temporal Evolution Pattern Recognition

Several previous studies revealed a nonlinear trend in deformation development in Beijing owing to the overexploitation of groundwater and the implementation of the South-to-North Water Diversion Project [39,40,41]. Polynomial fitting is a method that approximates the relationship between data points through polynomial equations. It is widely applied in the processing of time-series data [42,43], because it can effectively capture the complex nonlinear patterns and trends in data. Additionally, time-series data may exhibit significant fluctuations within certain periods. Polynomial fitting can adapt to these local changes, providing more accurate predictions. In this study, we used cubic polynomials to model the time-series cumulative deformation for each PS point [27]. The first derivative, D′, of time-series deformation D represents the rate of change in the cumulative variable of change, that is, the deformation rate VD, in mm/year. The deformation rate in the subsidence area was negative, and the subsidence rate VS = −VD. When deformation rate D′ = 0, the time-series variable reaches the minimum value, Dmin (i.e., the cumulative settlement S reaches the maximum, Smax), or the maximum, Dmax (i.e., the cumulative settlement S reaches the minimum, Smin), and the corresponding time, t, is the period tmax or tmin, in which the extreme value of subsidence occurs. The second derivative, D″, represents the rate of change in the deformation rate. When D″ = 0, the rate of change in the deformation rate is 0, and the corresponding period is the inflection point K of the cubic polynomial function. The deformation rate reaches a maximum or minimum value at K, and in the settlement region, it corresponds to the subsidence rate reaching the minimum or maximum VS. The formulas for the extreme period and the inflection point K are as follows:
D = a t 3 + b t 2 + c t + d
D = 3 a t 2 + 2 b t + c
D = 6 a t + 2 b
t m a x , m i n = 2 b ± 4 b 2 12 a c 6 a
K = b 3 a
where a, b, c, and d represent the coefficients of a cubic polynomial.
By identifying patterns of evolution, one may completely comprehend the process of land subsidence disaster occurrence and development by grasping the features of time-series deformation at each PS point. This study mainly considered the differences in the development state of the time-series cumulative settlement before and after the extreme value period t m a x   and the inflection point period K and classified the evolution patterns of land subsidence (Table 2). The specific classification principle is that, from 2003 to 2020, if there are inflection points and extreme points, the time-series curve of land subsidence needs to be discussed in stages. Before and after the inflection point, the state of change in the subsidence rate is different; before and after the extreme value point, the state of change in the cumulative settlement is different; and within the same stage, the state of change in both the subsidence rate and cumulative volume is consistent.

4. Results

4.1. PS-InSAR Results

This study was based on 55 Envisat ASAR and 80 Radarsat-2 (37 standard mode, resolution 30 m, and 43 extra-fine mode; resolution: 5 m) images, which were acquired using the PS-InSAR method with GAMMA software (GAMMA 2017) to indicate the long time-series vertical surface deformation information in the Beijing Plain area from 2003 to 2020. As shown in Figure 2a, the spatial distribution of land subsidence rates in the Beijing Plain varied greatly with clear inhomogeneity. The land subsidence centers were primarily located in the east, northeast, and north of the Beijing Plain. The areas of the subsidence center gradually expanded and connected, becoming the areas with the most severe land subsidence disasters in Beijing. The maximum subsidence rate is 138.55 mm/year, located in the Dongbalizhuang–Dajiaoting subsidence center in the Chaoyang District. The area with a subsidence rate greater than 15 mm/year reached 1688.81 km2, accounting for 17.12% of the Beijing Plain.
It can be seen that deformation rates during different time periods correlate well (Figure 2b,c). Specifically, there is a robust correlation coefficient (R2) of 0.82 between the results of Envisat ASAR (2003–2010) and Radarsat-2 (2010–2016). Additionally, the correlation between the results of Radatsat-2 (2010–2016) and Radarsat-2 (2017–2020) exhibits an R2 of 0.74. Approximately 92.2% of PS points showed an increased rate of displacement from 2010 to 2016, while 86.1% exhibited a decrease from 2017 to 2020. This means that the land subsidence rate in the Beijing Plain area changes obviously, and the time-series land subsidence shows obvious nonlinear characteristics.
6 benchmarks from 2005 to 2013, 11 benchmarks from 2015 to 2016 and 3 bench-marks from 2013 to 2018 were selected to verify the accuracy of the PS-InSAR results (Figure 3a–c). For these three periods, the error range of PS-InSAR monitoring results were 0.23-14.20 mm/year, 12.39 mm/year and 4.02−9.35mm/year, respectively. For the periods of 2005 to 2013 and 2015 to 2016, the linear regression correlation coefficients, R2, between the two were 0.94 and 0.95, respectively. The root mean square errors (RMSEs) were 7.9 and 7.3 mm/year, respectively. This shows that the PS-InSAR monitoring results are relatively accurate, and the accuracy meets the requirements.

4.2. Temporal Evolution Pattern Recognition

The National Ground Settlement Prevention (NGSP 2011–2020) clearly states the goal of controlling subsidence in Beijing: its aim was to control the rate of ground subsidence in Beijing to below 15 mm/year by 2020 [27]. Therefore, in this study, the key subsidence control areas with an average subsidence rate exceeding 15 mm/year from 2003 to 2020 (Figure 2a) were selected and defined as subsidence zones to analyze the evolution of ground subsidence.

4.2.1. Cubic Polynomial Fitting of Nonlinear Time-Series Settling Curves

Two PS points (P1 and P2) were selected, located at the center and the edge of the land subsidence funnel (Figure 2a). Using different polynomials to fit the time-series settlement of two PS points from 2003 to 2020, compared with the linear and quadratic polynomial fitting methods, the fitting curves of the cubic and quartic polynomials were consistent with the time-series settlement curve (Figure 4a,b). Comparing the R2 and RMSE of the fitted settlement at all PS points with the linear regression analysis of the settlement monitored by PS-InSAR, the cubic and quartic polynomials exhibited a better fitting effect on the overall area, the R2 range was 0.86–0.99, and the ranges of RMSE were 1.97–60.28 and 1.77–39.45 mm, respectively (Figure 4c,d). Higher degree polynomials can fit the data more closely, but they can also lead to overfitting, where the model starts to capture noise in the data rather than the underlying trend [44]. Higher-degree polynomials can be more computationally intensive and harder to interpret. Compared with complex quartic polynomials, the cubic polynomials were solved with fewer parameters, were computationally efficient, and could fit the time-series settlement curves better.

4.2.2. Recognition of Nonlinear Evolution Patterns of Ground Subsidence

Figure 5 shows the spatial distribution characteristics of the time when the maximum settlement occurs and the time at the inflection point of the fitted curve. Figure 6 shows the statistical results of the corresponding period of occurrence. The results show that the period of occurrence of the maximum settlement was concentrated between 2015 and 2020. The period of occurrence of maximum settlement at 30.51% of the PS points was concentrated from 2015 to 2019, and these points were concentrated near the edge of the subsidence region; 69.49% of the PS points with maximum settlement were concentrated in 2020, and these points were located in the subsidence center (Figure 5a and Figure 6a). This indicates that the land subsidence center continued to increase during the period of 2003–2020, and sedimentation in the edge region began to decrease from 2015 to 2019. During the period of 2003–2020, 96.64% of the PS points had inflection points in their time-series subsidence curves. The inflection periods of 86.58% of the time-series subsidence curves of the PS points were concentrated between 2010 and 2015, indicating that the subsidence rate of these areas reached its maximum in 2010–2015 and then decreased. Meanwhile, 4.82% of the time-series subsidence curves of the PS points were concentrated in 2016–2020. Furthermore, these PS points were concentrated in the subsidence center region of Chaoyang and the subsidence edge region of Tongzhou (Figure 5b and Figure 6b). Notably, 2.33% of the PS points had inflection periods after 2020, and these PS points were most concentrated in the Tongzhou subsidence edge area.
Figure 7a shows the spatial distribution of PS points for different evolution patterns. The PS points of evolution pattern D (Vs+-, S+) were the most numerous and had the widest distribution range. The PS points of the evolution pattern B (Vs+-, S+-) were primarily concentrated in the western and northern edge areas, where the subsidence rate was relatively small. The PS points of evolution pattern E (Vs+, S+) were also concentrated in the spatial distribution and were located in the central and southeastern edge of the subsidence zone. The PS points of the evolution pattern A (Vs−, S+-) and C (Vs−, S+) were sporadically distributed in the northern and western margins of the subsidence zone. The time-series evolution of the ground subsidence of the five evolution patterns differed significantly (Figure 7b–f). In this study, two leveling points selected from 2005 to 2016 were located in Chaoyang District. Their evolution patterns are consistent with those of the most recent PS points, which all belong to evolution pattern D (Vs+-, S+). The rate of ground subsidence decreased gradually after the inflection period (Figure 7g,h). This also proved the reliability and rationality of the method of evolution pattern identification used in this study.
In summary, the evolution pattern of the subsidence zone was dominated by two evolutionary features: the subsidence rate increased and then decreased, and the cumulative amount of subsidence continued to increase or increased and then decreased. From 2010 to 2015, the subsidence rate began to decrease in most regions and ground subsidence disasters were alleviated. In the central and edge parts of the subsidence area in Tongzhou, the subsidence rate and cumulative amount continued to increase and land subsidence disasters were aggravated.

5. Analysis of Influencing Factors

5.1. Relationship between Temporal Evolutionary Features and Groundwater

Groundwater extraction triggers land subsidence predominantly through the compaction of vulnerable aquifer systems, consisting of unconsolidated alluvial or basin-fill deposits, resulting in a decrease in subsurface volume and corresponding descent in the ground surface [18]. The most important cause of ground subsidence in Beijing is the long-term overexploitation of groundwater. In Beijing, two-thirds of water consumption originates from groundwater extraction [45]. Since 2003, Beijing has built four large-scale emergency water sources to meet increasing water demand [46]. Overexploitation of groundwater causes a drastic decline in the groundwater level and the emergence of large-scale groundwater funnels, which, in turn, induce ground subsidence [47,48]. In this study, data from four groundwater level monitoring stations were selected for correlation analysis with the subsidence time-series at the nearest PS points (Figure 8). The results show a higher correlation between the time-series subsidence and the groundwater level in Chaoyang, Tongzhou, and Changping, with R2 values of 0.89, 0.74, and 0.72, respectively (Figure 8a–c). The land subsidence is more serious in these areas, especially in Chaoyang and Tongzhou, which is mainly caused by overexploitation of groundwater [17,27]. The correlation coefficient of the time-series of subsidence in the Shunyi area was lower, with an R2 value of 0.17 (Figure 8d). The regional geological environment of Shunyi monitoring station is characterized by its relative fragility, presence of developed hidden faults, strong crustal activity, frequent seismic events, and limited groundwater resources, leading to complex causes of land subsidence. In addition, the lagging effect existing in the deformation and groundwater-level variations is notable [30,49,50].
The time-series subsidence at the four nearest PS points were in the evolution pattern D (Vs+-, S+). From 2003 to 2020, the inflection point period K of the subsidence during the period was 2019, 2015, 2012, and 2011, respectively. By comparing the rate of groundwater level change before and after the inflection point, the time when the rate of ground subsidence started to decrease was found to be more consistent with the time of groundwater level rebound. The fluctuations in the groundwater level in the Beijing area are influenced by a variety of factors, among which relevant policies play an important role as regulatory measures. Since the end of 2014, the South-to-North Water Diversion’s Middle Route (SNWD-MR) has effectively diverted water to Beijing, thereby substantially reducing the accumulated depletion of groundwater [40,51,52,53]. This volume of water accounts for an impressive 40% of the total recovery of groundwater storage [54]. Figure 9 shows that with the relatively abundant precipitation level, groundwater extraction further decreased, the annual average extraction dropped to 15.03 × 10⁸ m3, and the groundwater level rose from 2015 to 2020. In addition, related policies such as the gradual closure of self-provided wells, the reduction in groundwater extraction, and the suppression of emergency water withdrawals in Beijing have eased the pressure on the groundwater supply, thus slowing the rate of subsidence in most subsidence zones in Beijing [41,46,55]. Relevant studies have shown that after the 2015 replacement of captive wells, the groundwater level in most areas of Tongzhou began to rebound, and ground subsidence slowed [46,56]. The Changping Plain is located in the groundwater overexploitation zone, and the groundwater in the Changping area also began to recover year by year after the implementation of the “Water Ten Rules” and the high-efficiency water-saving projects for grain and vegetable fields [57]. In summary, changes in groundwater level have an important influence on the temporal evolution pattern of ground subsidence.

5.2. Relationship between Temporal Evolution Pattern and Geological Setting

Clay has high compressibility compared with gravel and sand layers; therefore, it is an important material for generating ground settlement [58]. For groundwater overexploitation, the clay layer releases water and compresses and consolidates it, resulting in rapid subsidence. The distribution of the thickness of the compressible clay layer in Beijing is consistent with the spatial distribution of the subsidence center [36,37]. The PS points in Chaoyang District, where ground subsidence was in the evolution pattern E (Vs+, S+), were primarily located where the thickness of the compressible soil layer was greater than 210 m. The rate and cumulative amount of land subsidence in this area continued to increase (Figure 10a). This indicates that thicker compressible clay provides favorable material conditions for ground subsidence, promoting the rapid development of ground subsidence in this region.
The subsidence study area includes several active fractures. Among them, the Huangzhuang, Gaoliying, Shunyi, and Nanyuan–Tongxian fractures are SW–NE oriented, while the Sunhe and Zhangjiawan fractures are NW–SE oriented. Figure 10b indicates clear differences in the development trends of ground subsidence on both sides of certain ruptures. The ground subsidence in the footwall of the Sunhe Fracture, the upper wall of the Gaoliying Fracture, and the intersection of the Sunhe and Shunyi Fractures belonged to evolution pattern D (Vs+-, S+), whereas the ground subsidence in the upper wall of the Sunhe Fracture, the footwall of the Gaoliying Fractures, and the intersection of the two fractures belonged to evolution pattern B (Vs+-, S+-). Thus, the development trend of ground subsidence in the upper wall and the footwall in areas of the two ruptures shows noticeable differences, with obvious disparities in subsidence. The Gaoliying and Sunhe fractures are concealed active fractures characterized by stick-slip to creep-slip activity. Combined with existing studies and borehole data, the Gaoliying and Sunhe Fractures have a controlling effect on the thickness of Quaternary sediments, and there are clear differences in the thickness of sediments and the sedimentation rate of different tectonic units [59]. This is the main reason for the inconsistency in the subsidence evolution patterns between the upper and lower sides of the fractures. In summary, this shows that several fractures in the Beijing area have a controlling effect on the spatial pattern of ground subsidence evolution.

5.3. Relationship between Temporal Evolution Pattern and Land Use

Beijing was the first city in China to open a subway; by the end of 2019, there were 23 subway lines in Beijing, with a total length of 699.3 km [60]. Eleven subway lines are located in the subsidence zone (Figure 11a). There were evident differences in the evolutionary patterns of ground subsidence on both sides of the subway lines. On the north side of Subway Line 7, the land subsidence belongs to evolution pattern D (Vs+-, S+); that is, the rate of settlement increases and then decreases, and the amount of settlement continues to increase. The southwest side belongs to evolution pattern B (Vs+-, S+-); that is, the rate of settlement and the amount of settlement both increased first and then decreased. The regional settlement evolution patterns along Subway Line 6 and the Batong Line are consistent, with both classified as evolution pattern D (Vs+-, S+). There are differences in the settlement evolution patterns along certain sections of Subway Lines 5 and 16, the Changping Line, and the Capital Airport Line. On both sides of the subway and along sections of the line, uneven land settlement evolution patterns can affect the structure of the subway track and route smoothness [40,41]. For subway lines with evident differences in evolution patterns, the prevention and control of ground settlement should be conducted to ensure the safe operation of the subway.
Land use changes are correlated with the spatial distribution of ground subsidence [30,45]. Land subsidence in most areas of Tongzhou belongs to evolution pattern D (Vs+-, S+), with a decreasing trend in the rate of subsidence. However, the southeastern subsidence zone belongs to evolution pattern E (Vs+, S+); both the rate and amount of subsidence continue to increase, and the ground subsidence hazard is aggravated. The Universal Resort Station is located in the southwest of the Tongzhou subsidence area, with evolution pattern E (Vs+, S+) (Figure 11a). The construction of the station began in December 2016 and the operation began in August 2021. In this study, the regional land use change near the Universal Resort Station was selected (Figure 11b–e). There was a significant increase in rural construction land in the area from 2003 to 2012. Local domestic water use was groundwater pumped from captive wells, resulting in a continuous decline in the groundwater level, and the rate of subsidence showed a continuously increasing trend from 2003 to 2011. In 2011, nearby villages began to be demolished sequentially, ending in 2013. Figure 11e shows that, in 2020, large areas of land near the Universal Resort Station were under construction, resulting in significant pit precipitation. Relevant studies have shown that, during pit excavation, groundwater level drops, soil loss, and additional stress from groundwater movement caused by pit precipitation can easily lead to ground subsidence [61,62]. In addition, with the gradual growth of the Beijing Municipal Administrative Center in recent years, a large number of transportation and construction projects have been conducted in Tongzhou [63], which, to a certain extent, have aggravated the development of local ground settlements.

6. Conclusions

In this study, based on Envisat ASAR and Radarsat-2 images, the nonlinear evolution patterns of land subsidence in the Beijing Plain Area from 2003 to 2020 were identified using the PS-InSAR technique and cubic polynomials to fit the subsidence time-series, and its influencing factors were discussed. We arrived at the following conclusions.
(1)
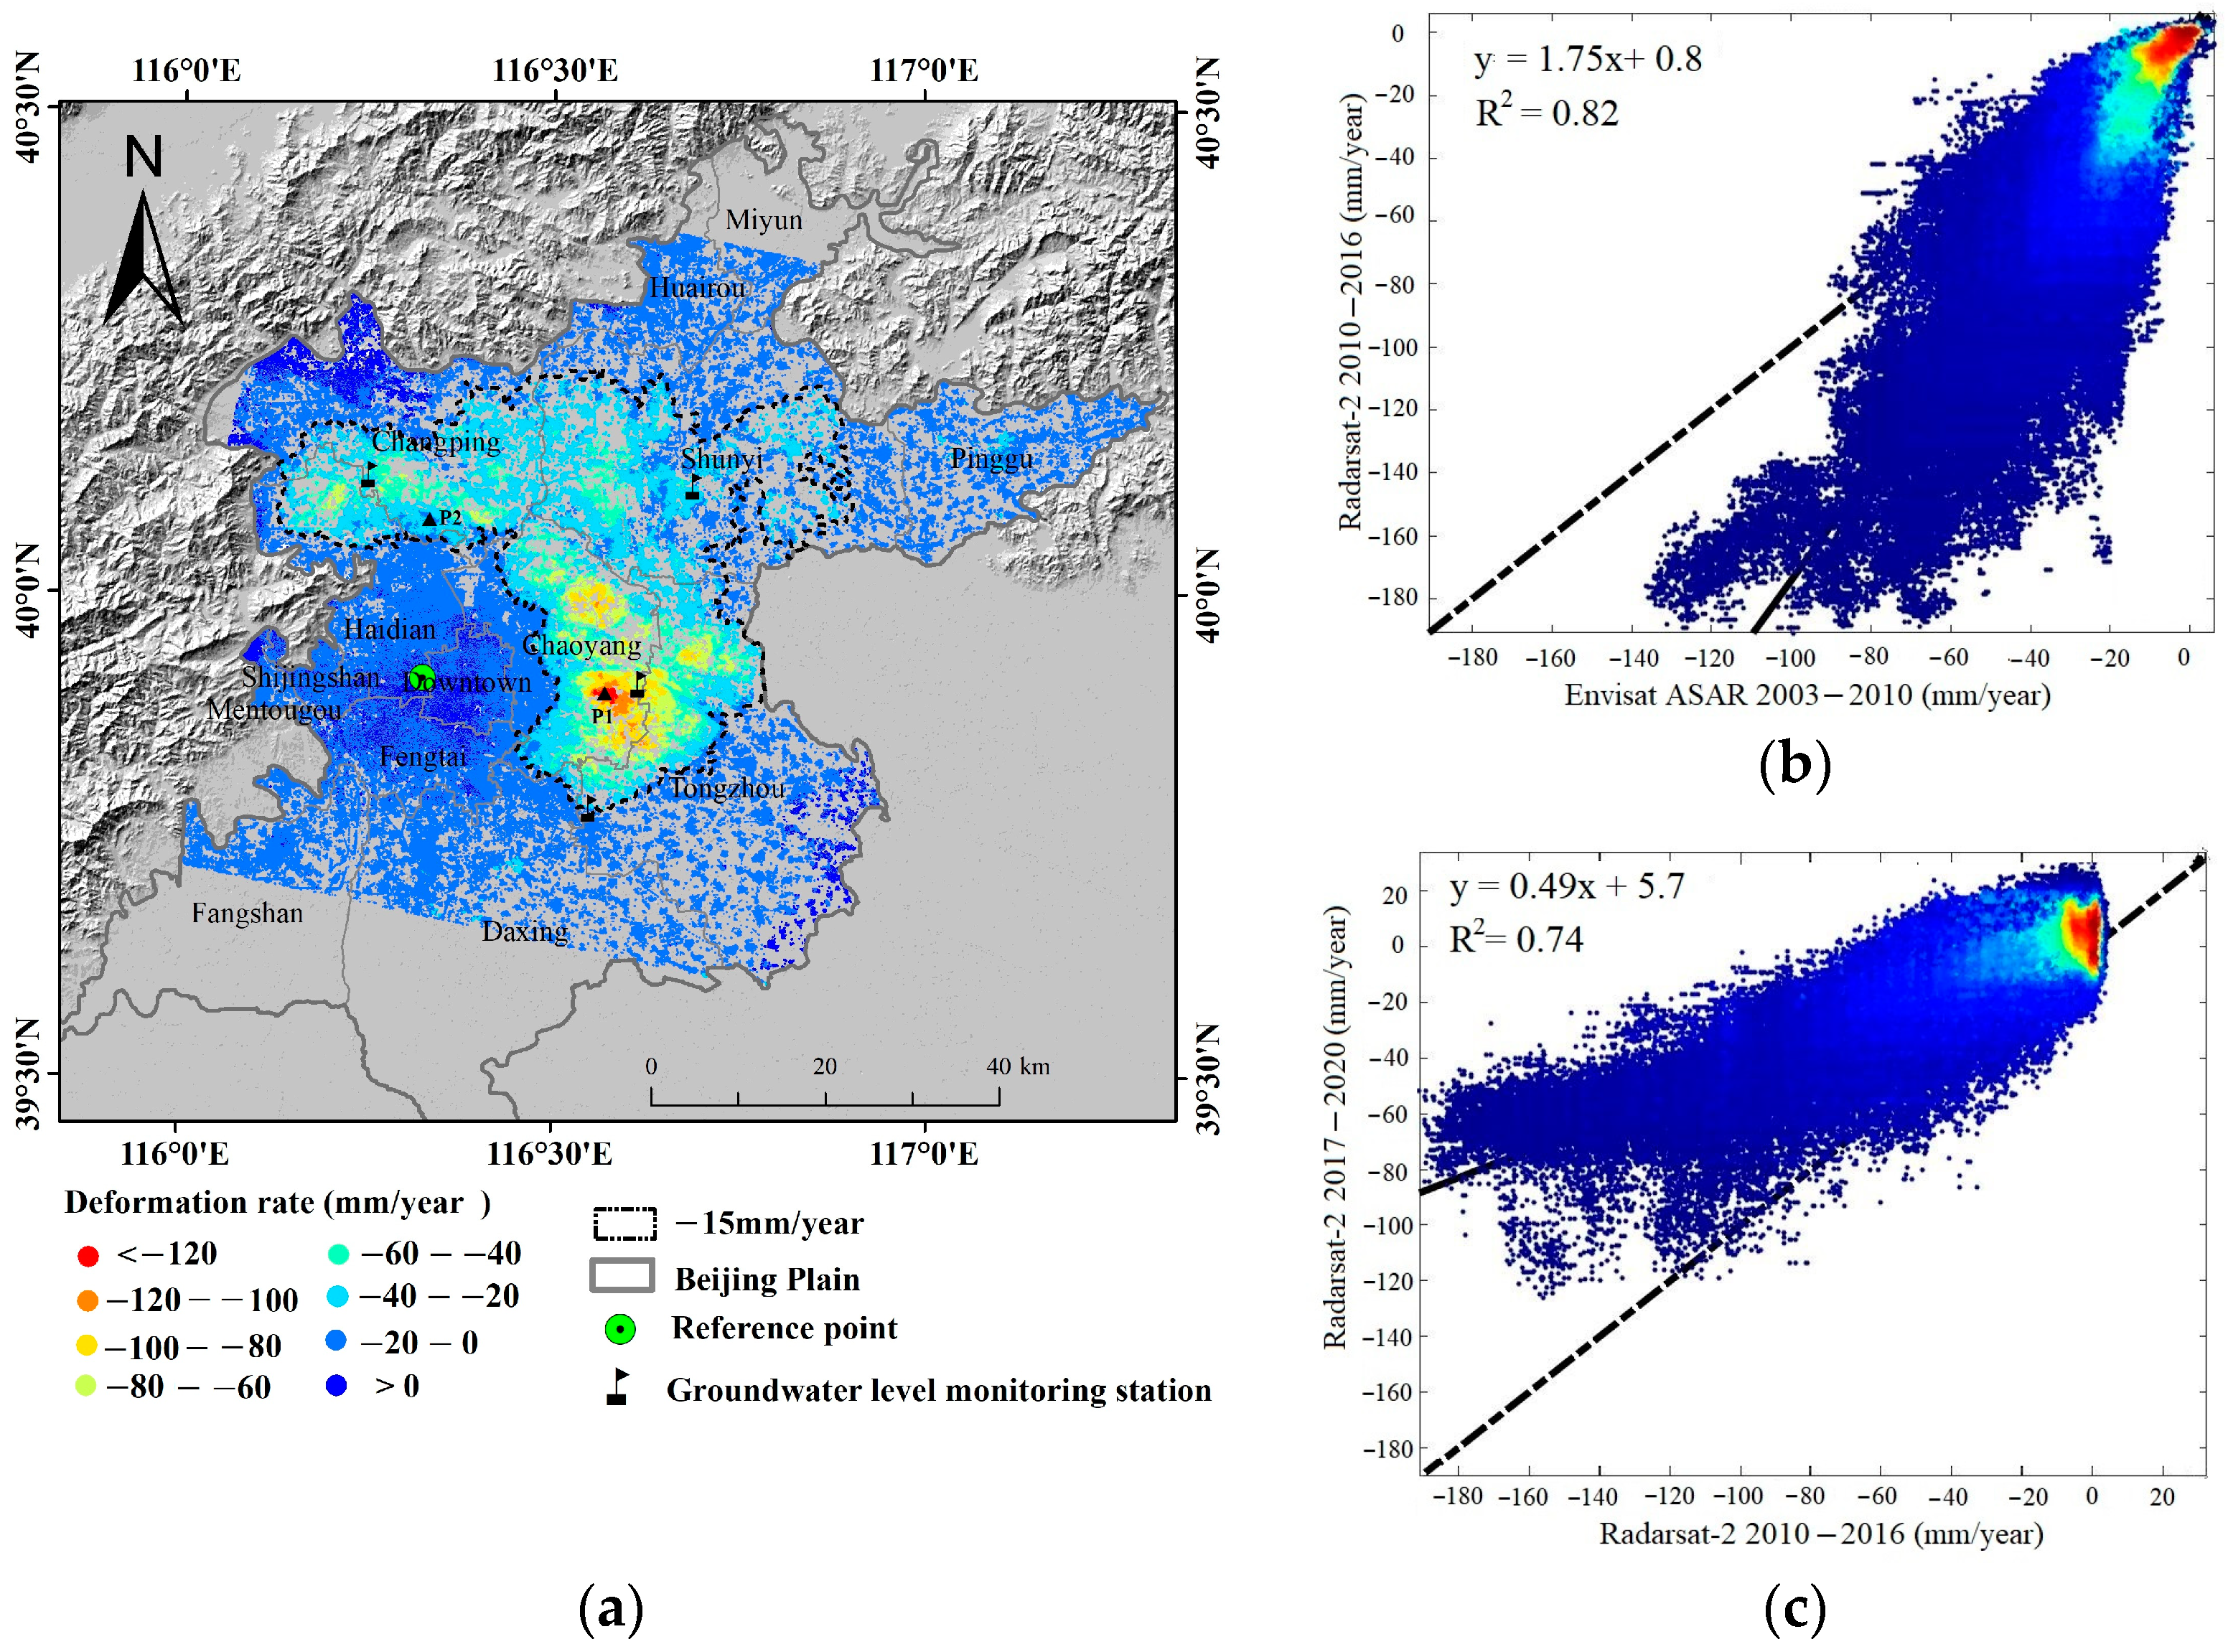
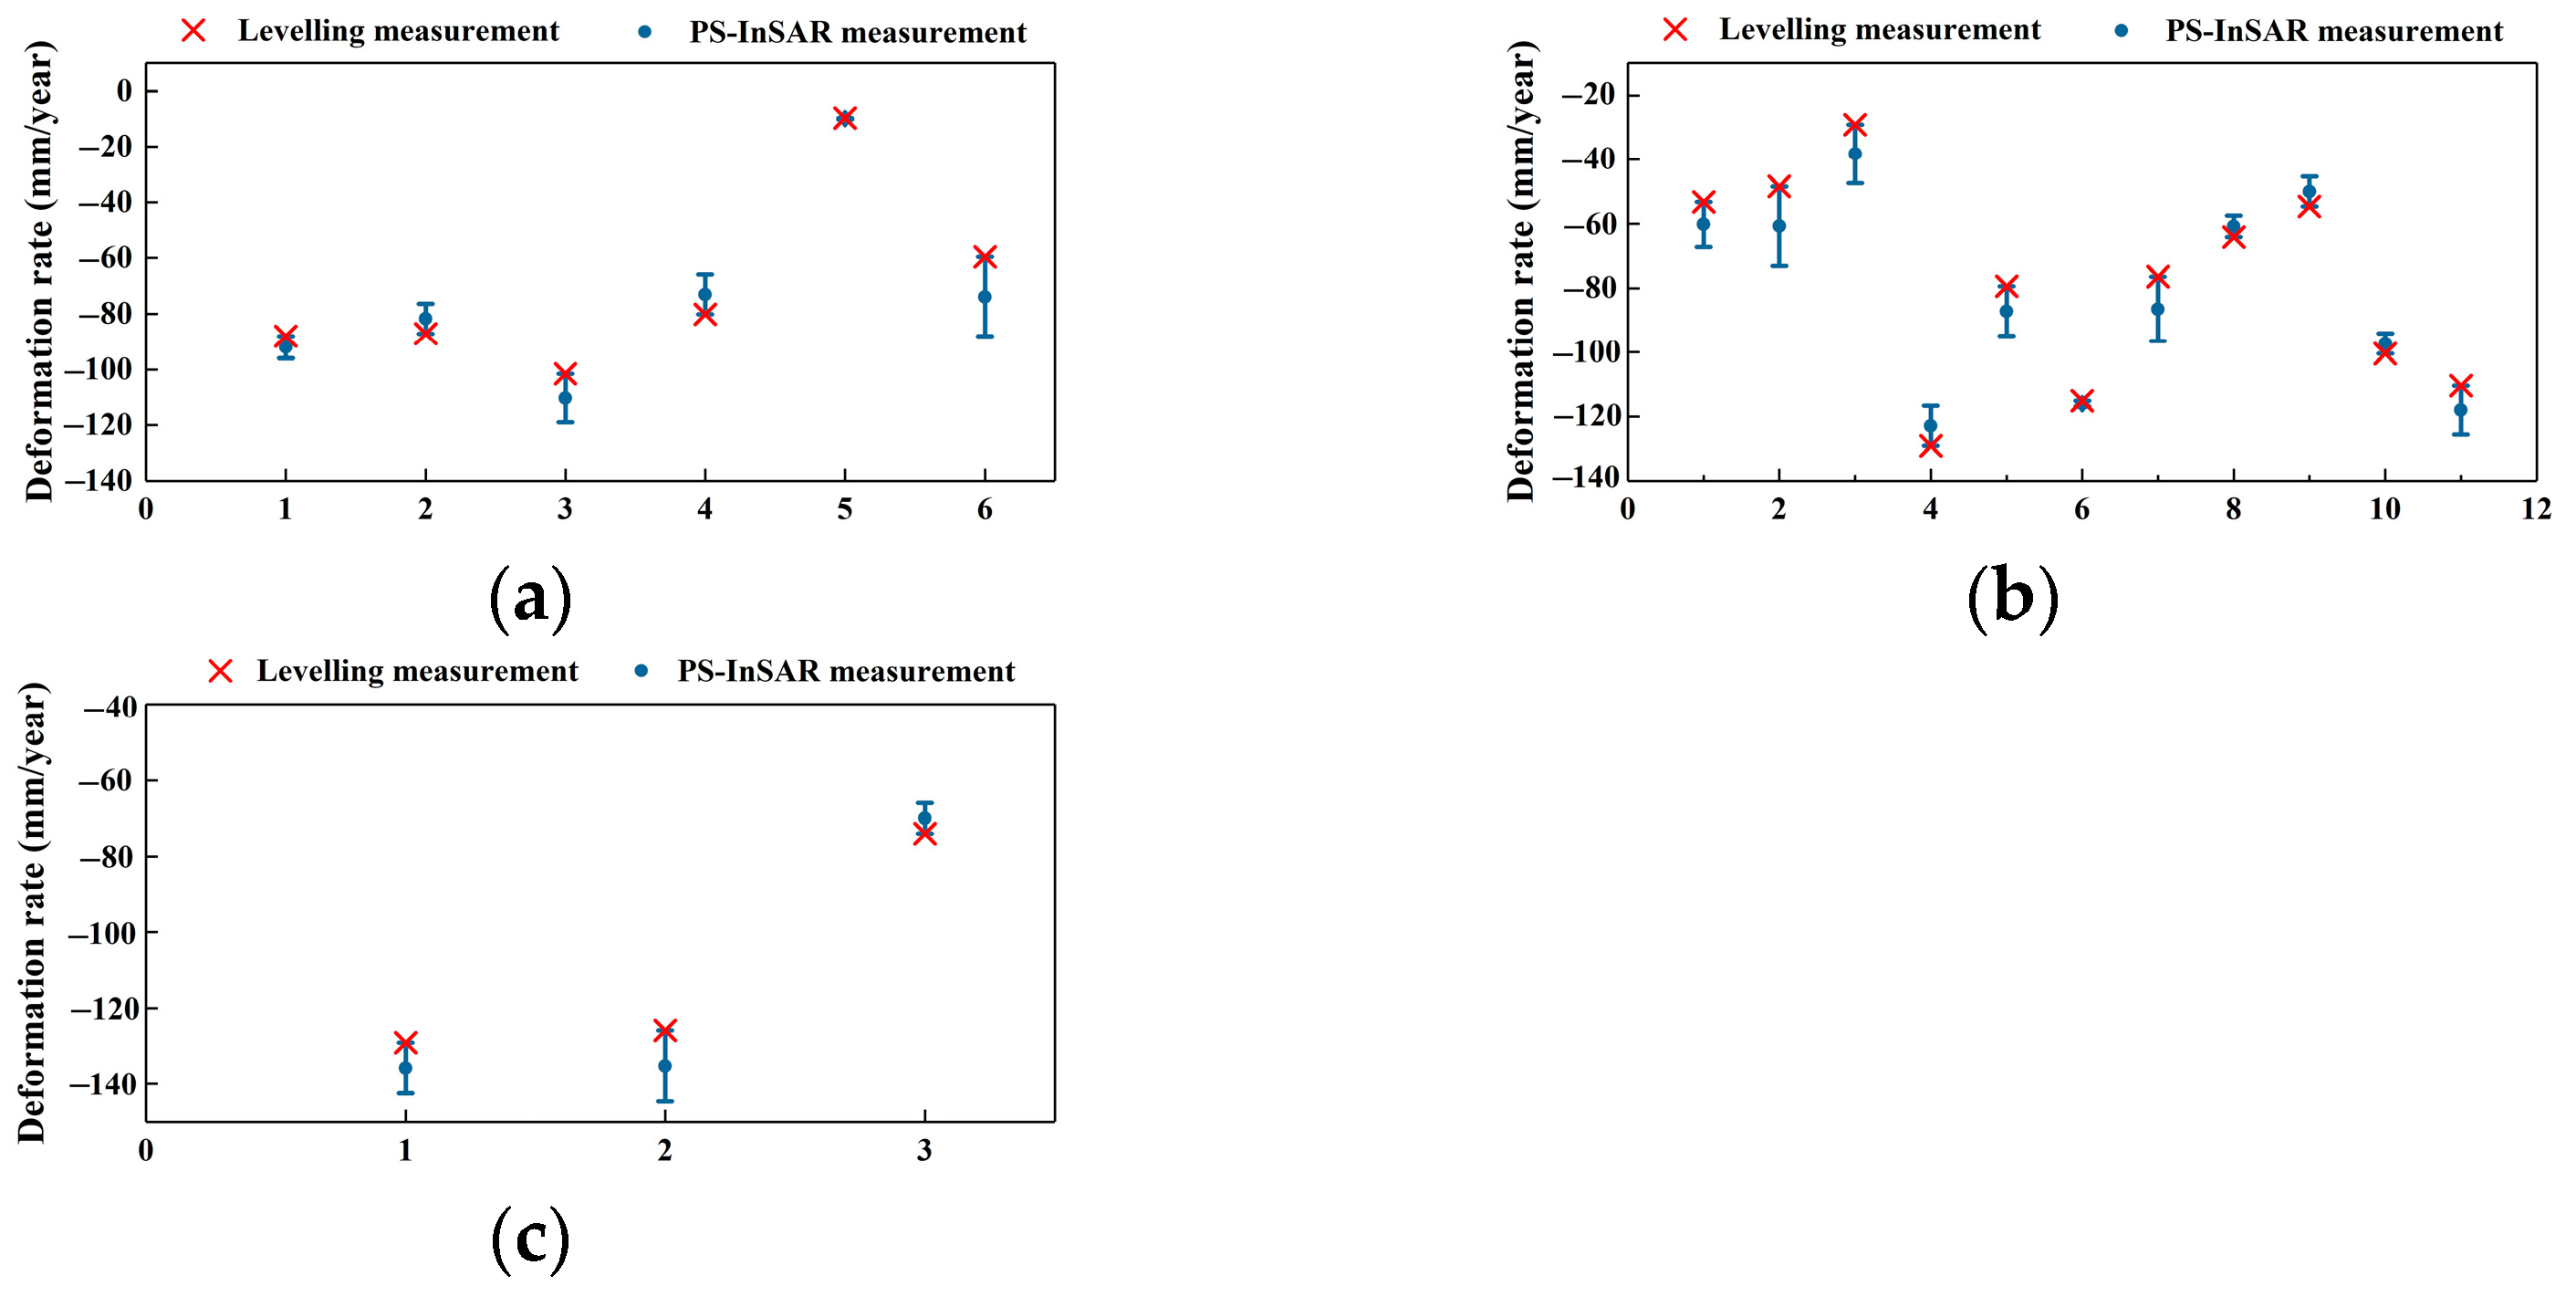
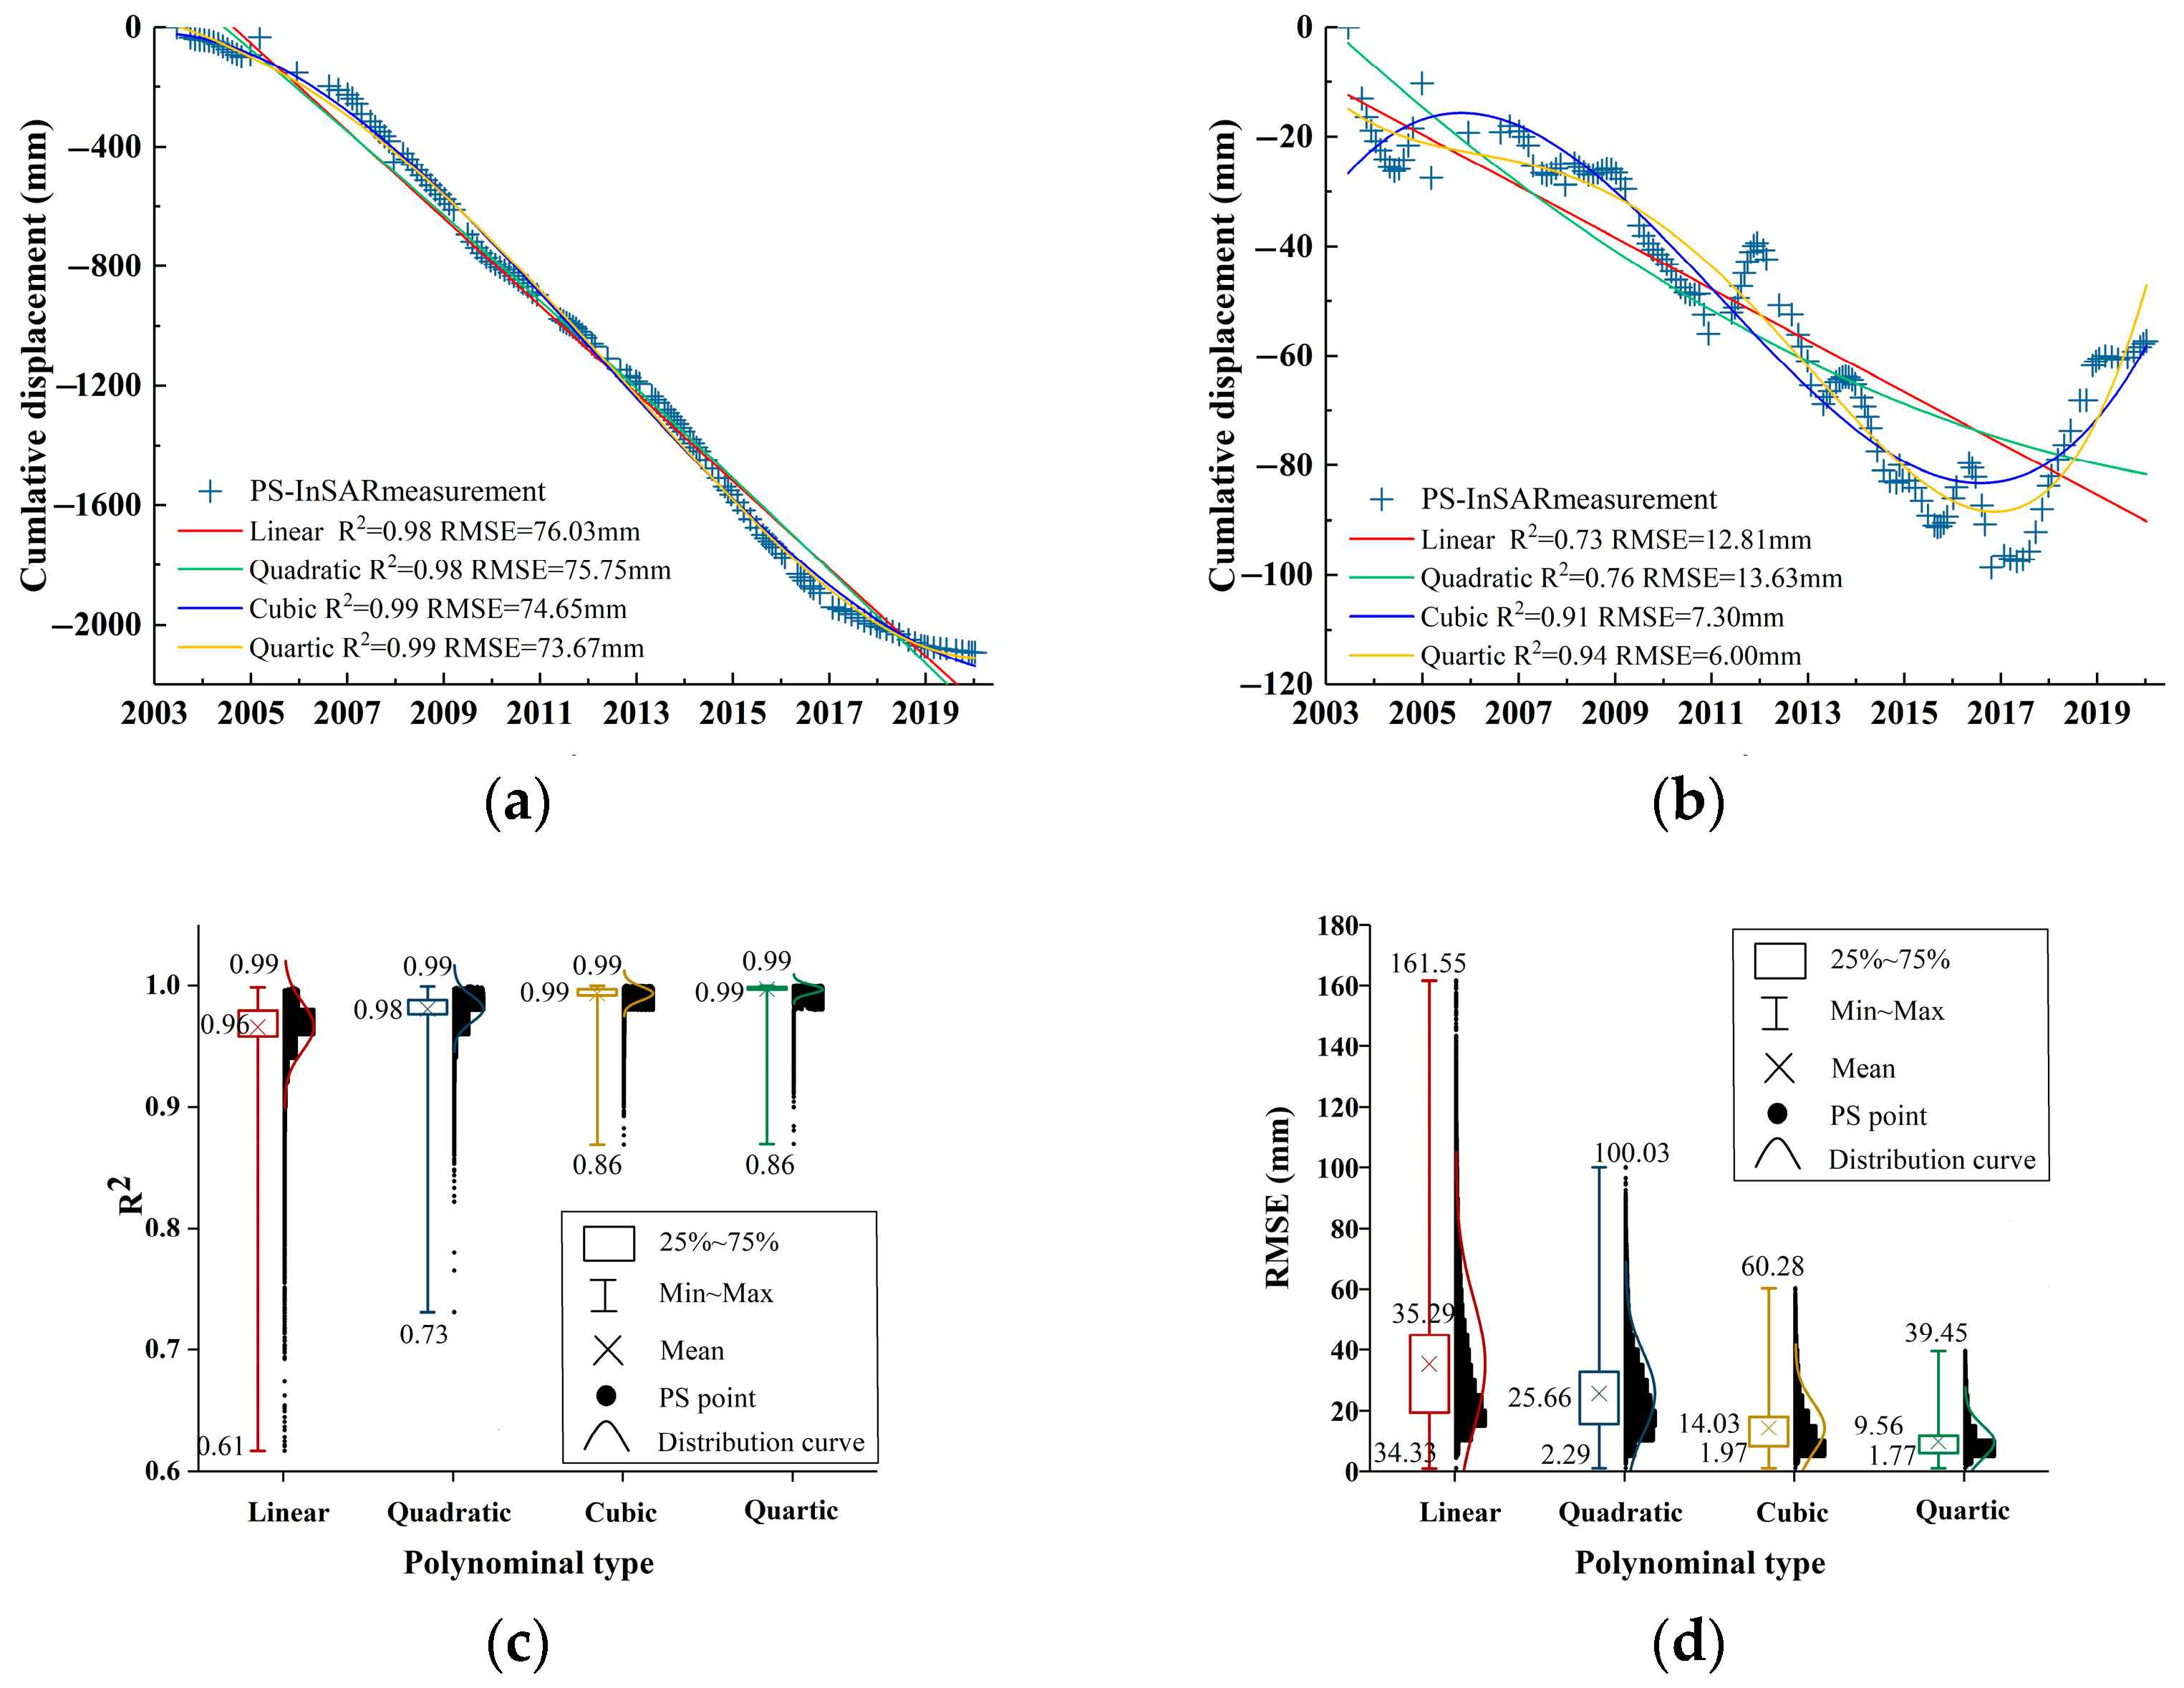
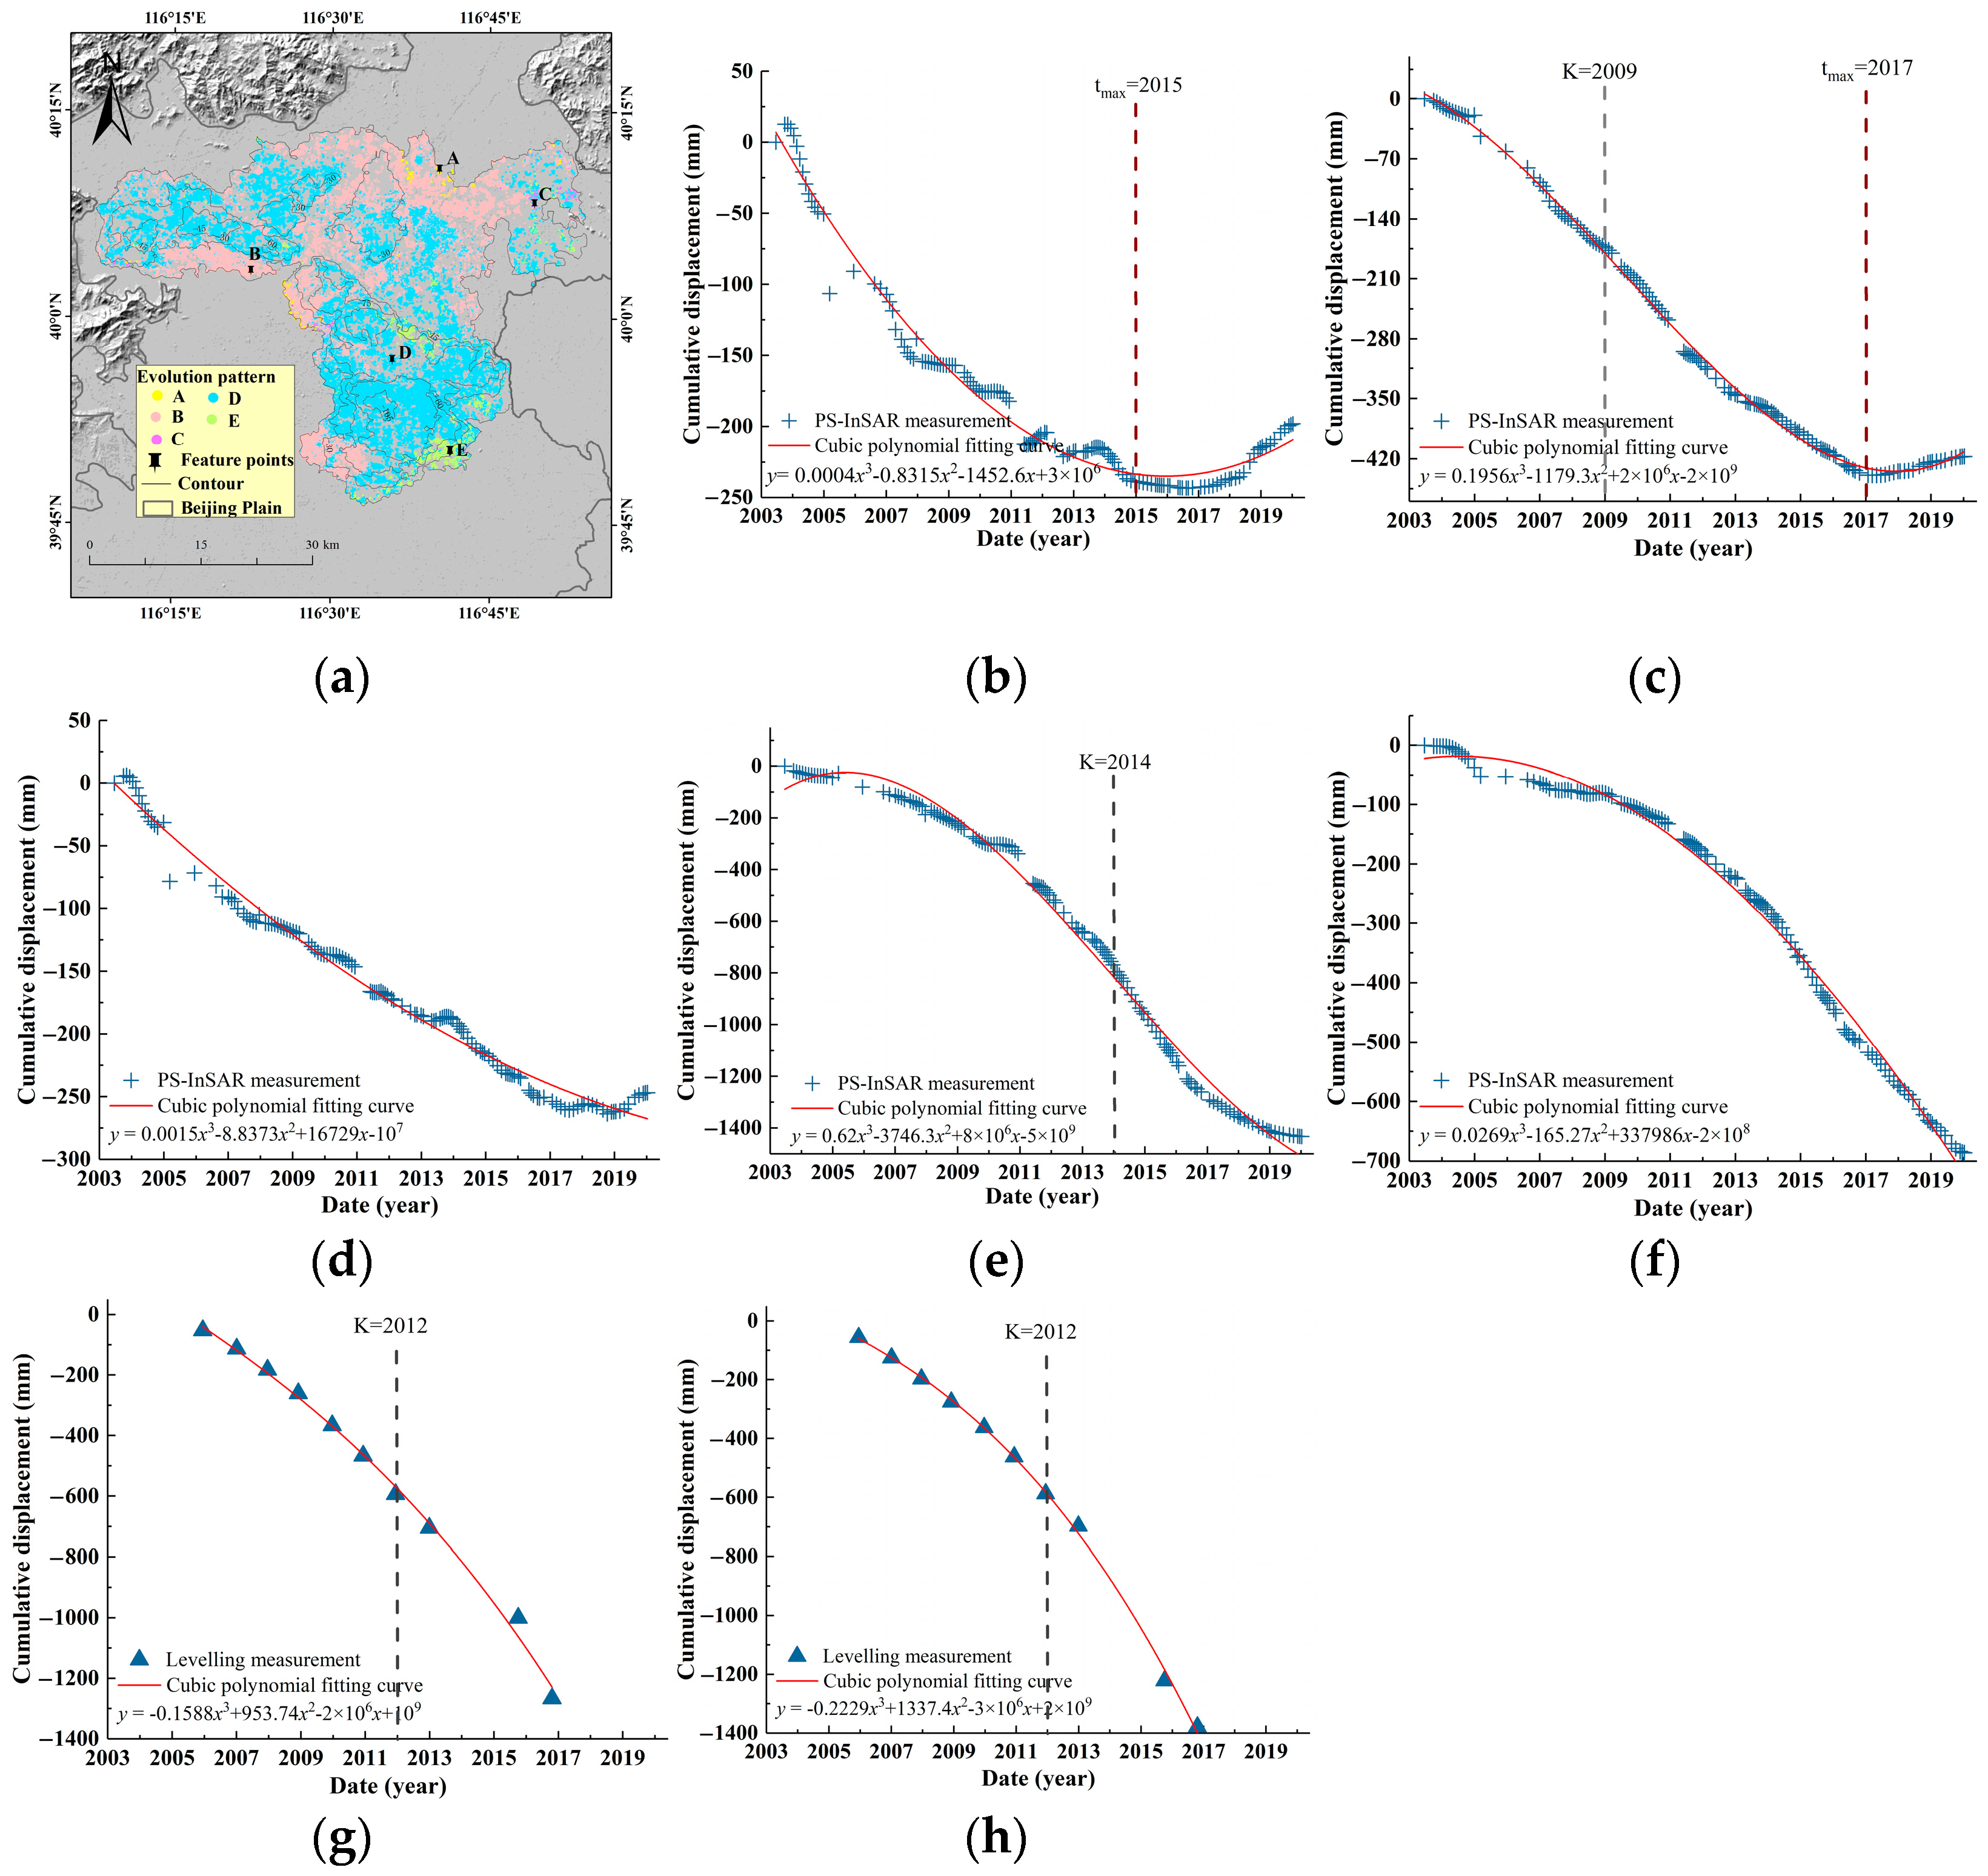
The spatial distribution of ground subsidence in the Beijing Plain area is clearly uneven, and the subsidence centers are located in the eastern, northeastern, and northern areas of the plain; the subsidence centers gradually grow larger and more connected. The maximum annual average subsidence rate from 2003 to 2020 reached 138.55 mm/year, in the Dongbalizhuang–Dajiaoting subsidence center in Chaoyang. Compared with linear, quadratic, and quartic polynomials, cubic polynomials can better characterize the nonlinear evolution of ground subsidence over a long time-series. Comparing the fitted subsidence with the PS-InSAR results, the R2 was greater than 0.86, the RMSE was less than 60.28 mm, and the accuracy met the requirements of the study.
(2)
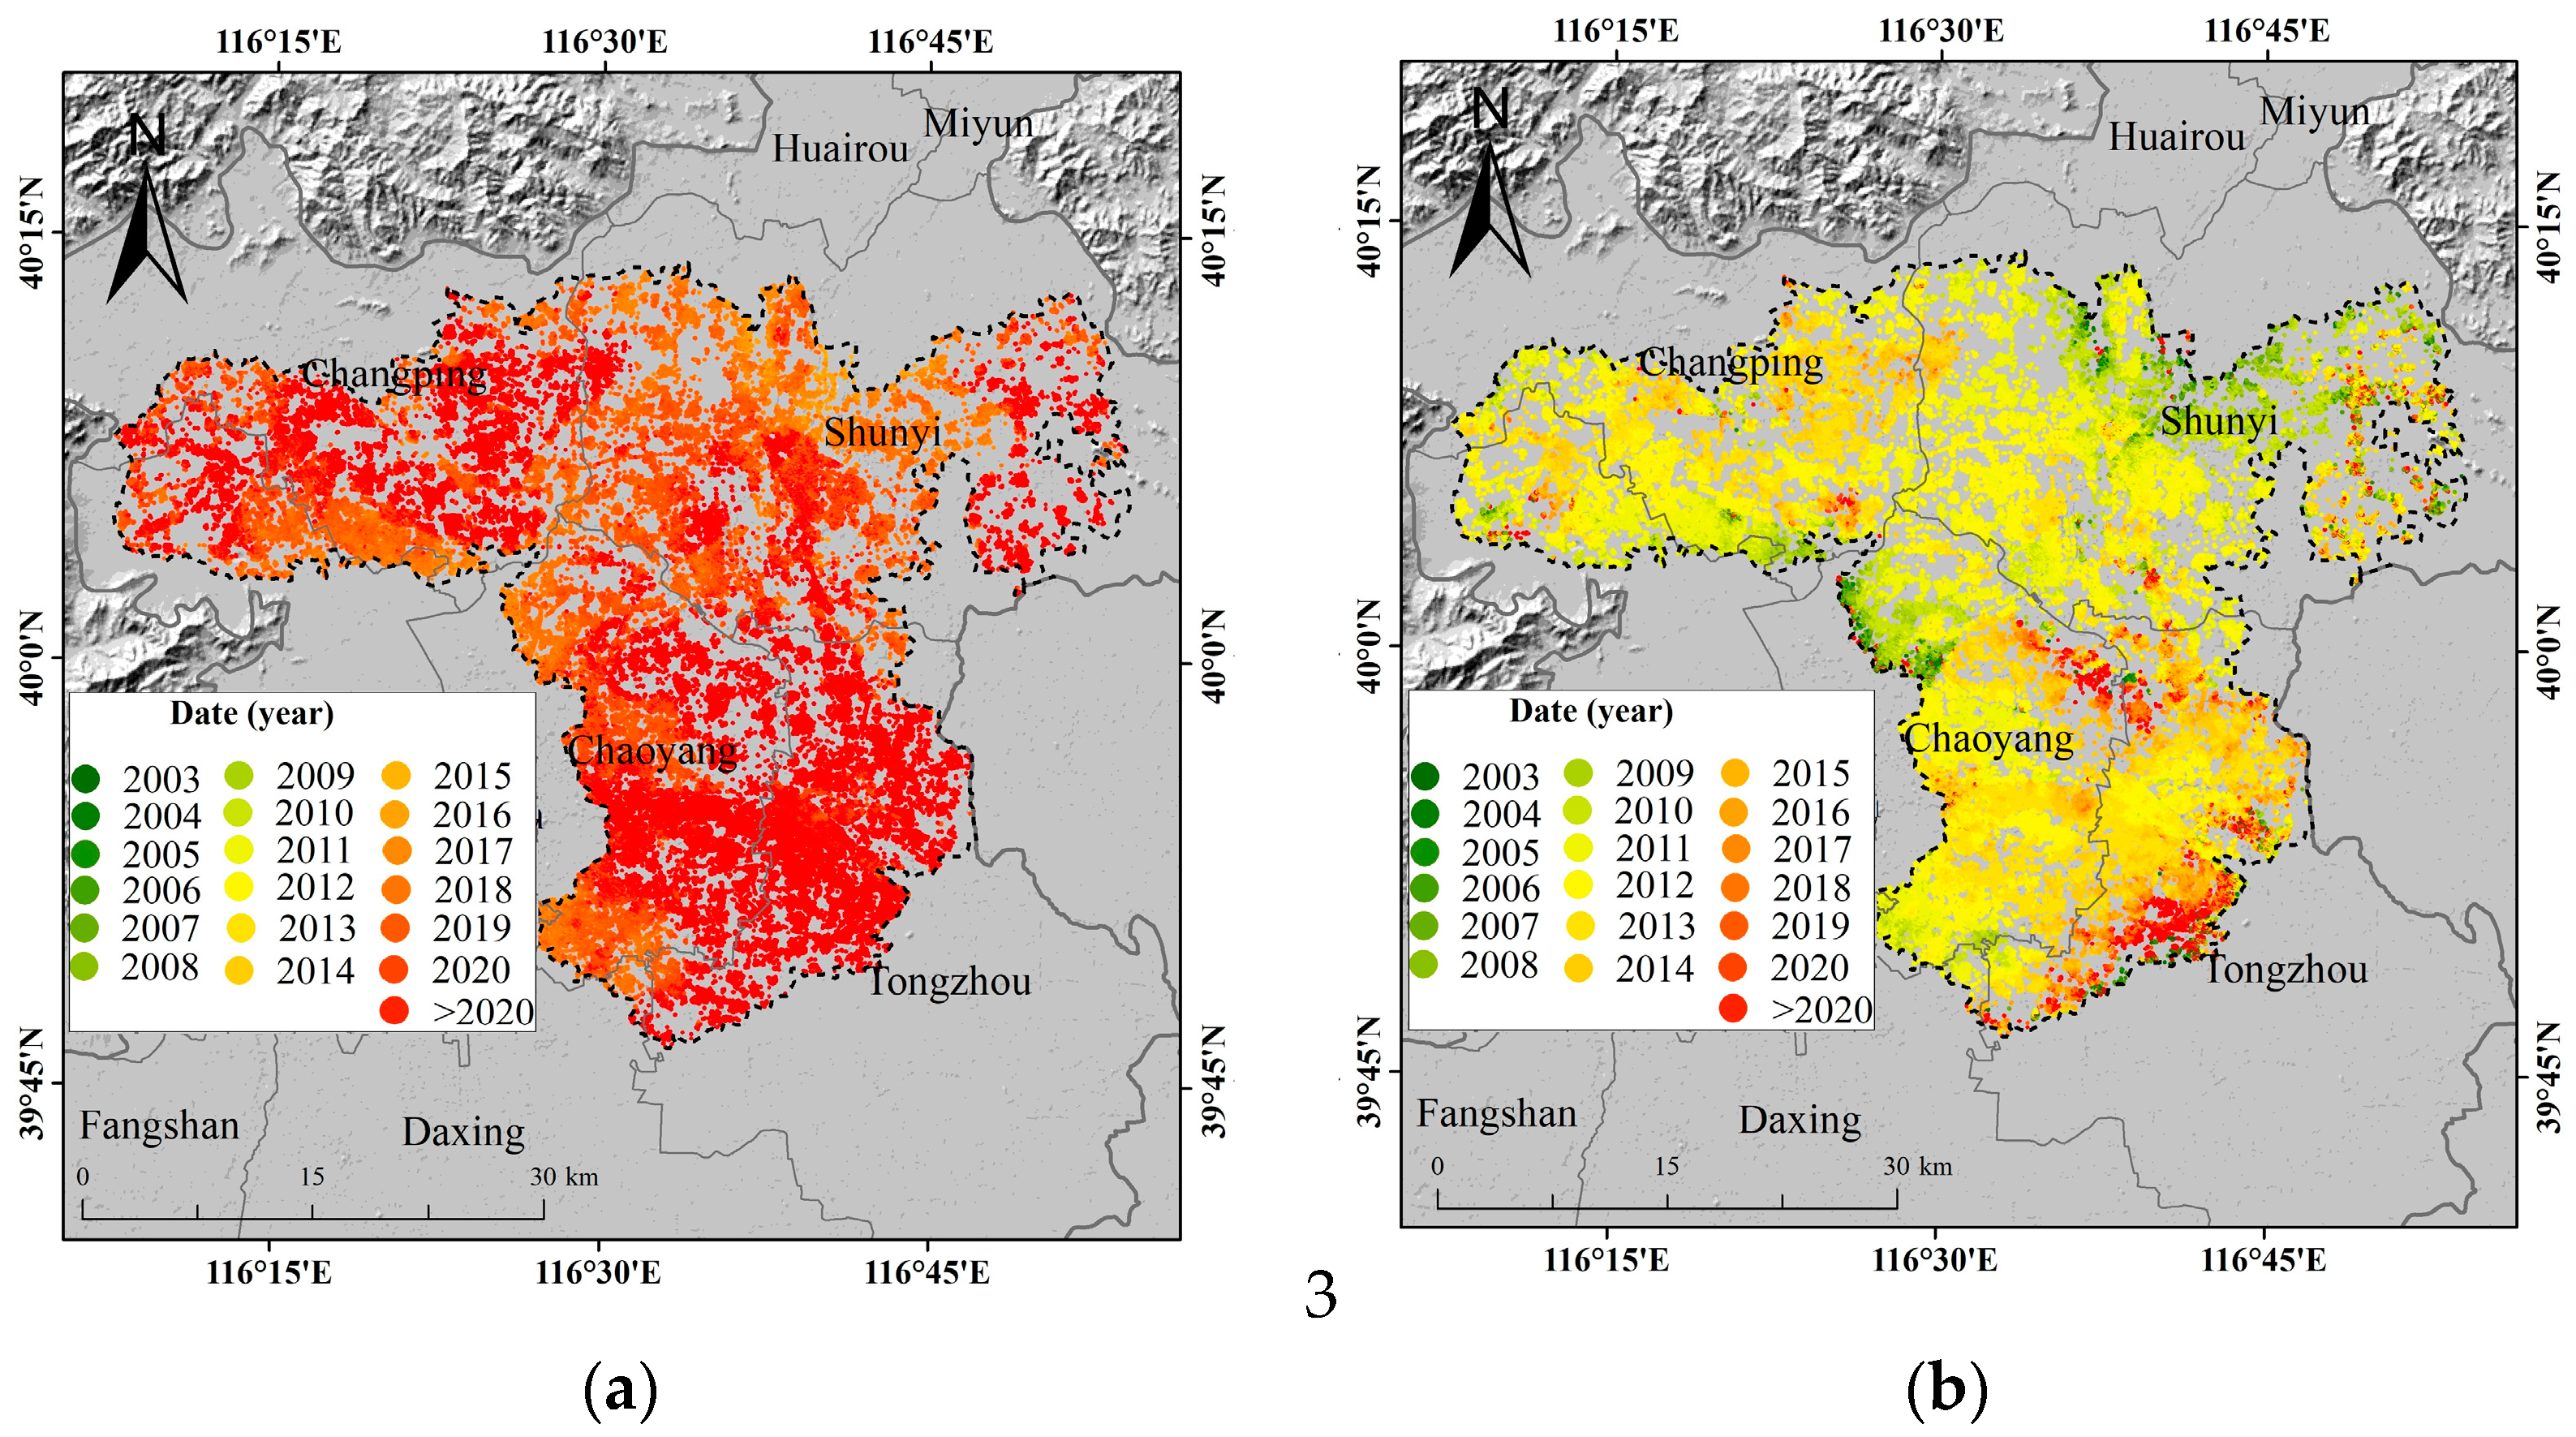
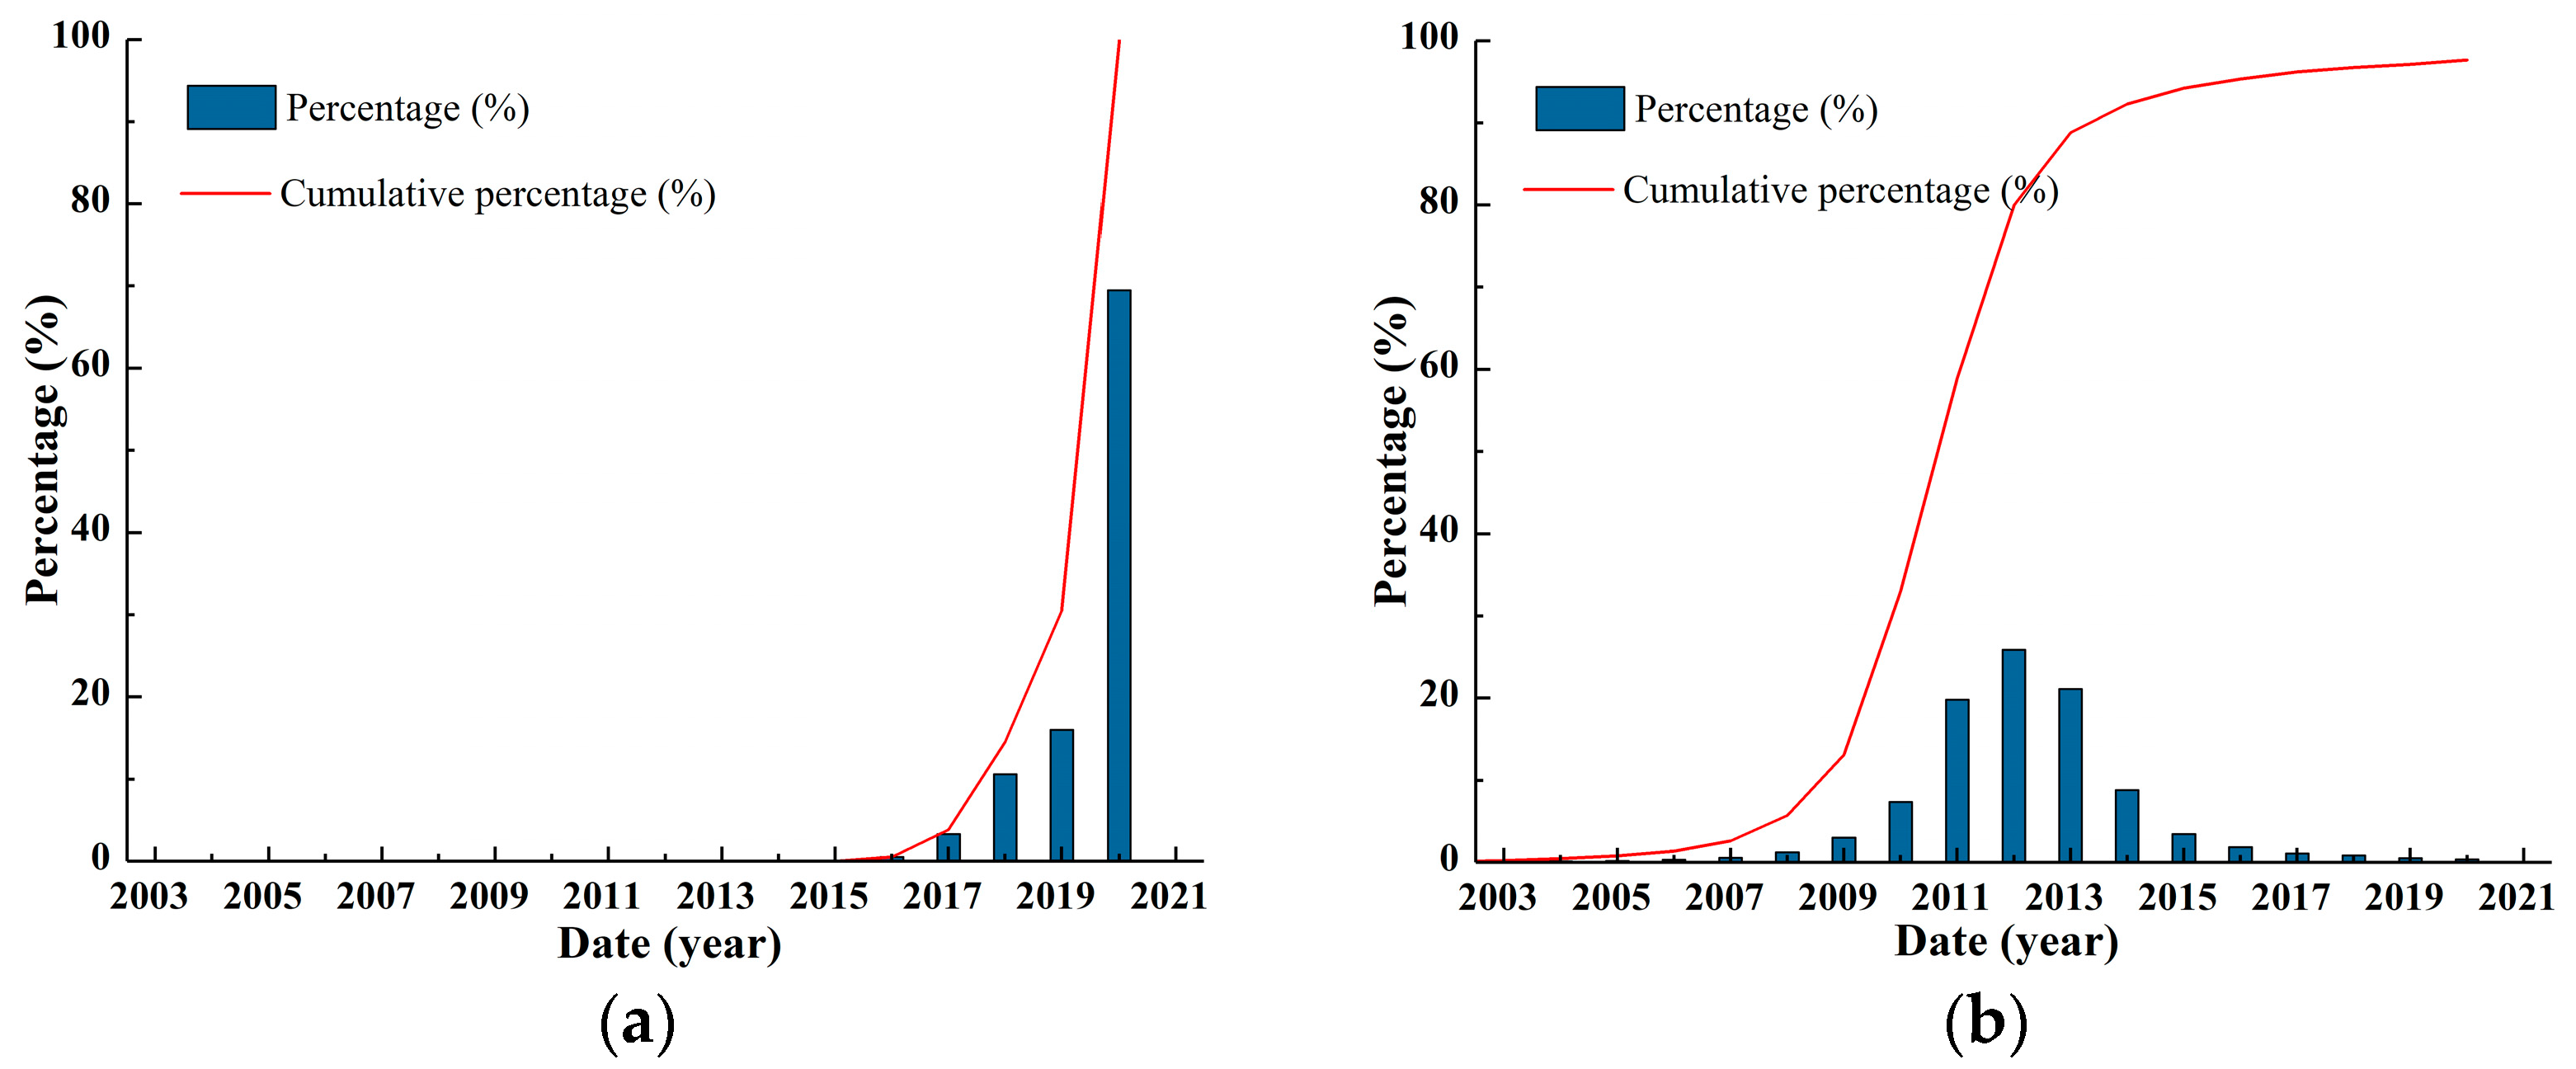
In the subsidence zone, 86.58% of the PS point subsidence rates began to decrease in 2010–2015, 30.51% of the PS point subsidence reached a maximum in 2015–2019 and then decreased, and 69.49% continued to increase. The evolutionary pattern of the subsidence zone was dominated by two evolutionary features: the subsidence rate first increased and then decreased, and the amount of subsidence continued to increase (evolution pattern D (Vs+-, S+)); the rate of subsidence first increased and then decreased, and the amount of subsidence increased and then decreased (evolution pattern B (Vs+-, S+-)). In 2010–2015, the rate of subsidence began to decrease in most areas, and ground subsidence disasters were somewhat alleviated. In the central part of the subsidence zone and fringe area of Tongzhou, the subsidence rate and amount of subsidence continued to increase, and ground subsidence disasters intensified. With the rapid development of the Chaoyang and Tongzhou subsidence areas, attention should be paid to subsidence prevention and control.
(3)
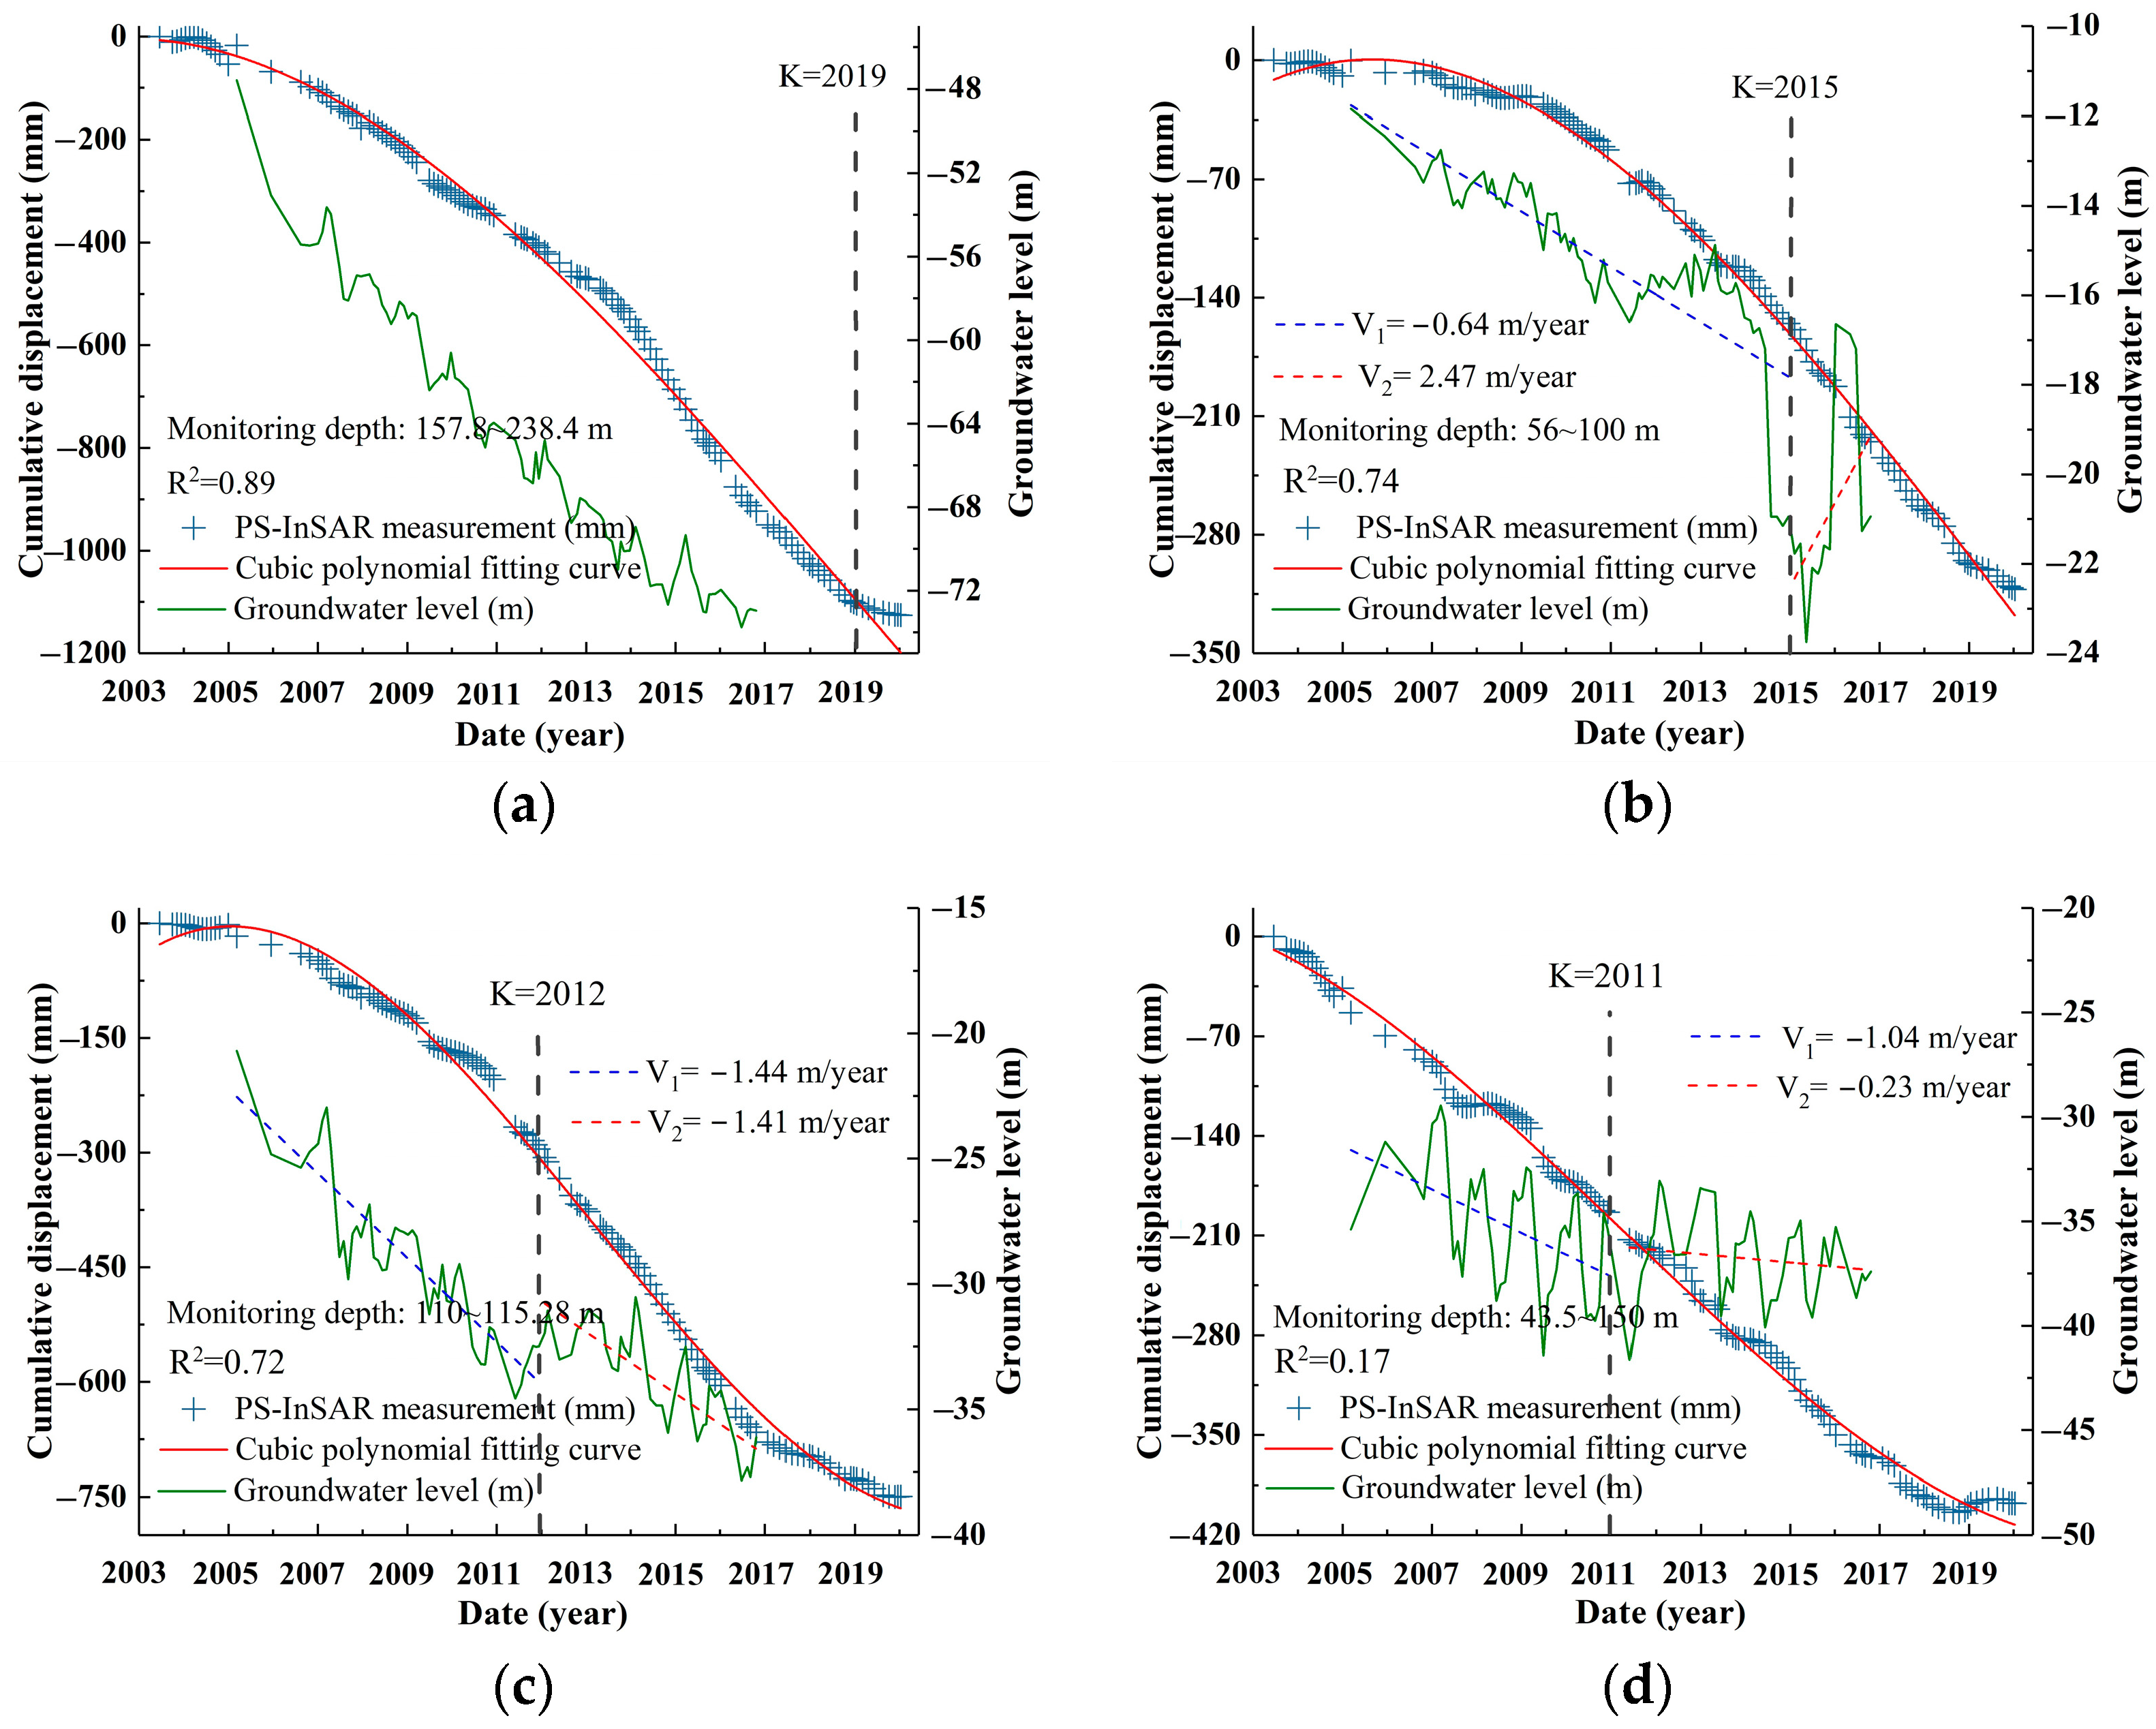
Considering the relationship between groundwater level, geological background, land use and the evolutionary pattern of ground subsidence, in areas where the subsidence belongs to evolution pattern D (Vs+-, S+), a high correlation exists between the groundwater level and time-series evolutionary characteristics of ground subsidence; the correlation between the ground subsidence and the water table reaches 0.89, and the period of the decrease in the subsidence rate similar to that of the groundwater level rebounds. In areas where the thickness of the compressible clay layer is greater than 210 m, the ground subsidence belongs to evolution pattern E (Vs+, S+), and the subsidence rate and amount continue to increase. The thicker compressible clay provides favorable conditions for the rapid development of ground subsidence. On both sides of the Gaoliying and Sunhe fractures, settlement evolutionary patterns have clear differences, and the fracture has a certain controlling effect on the spatial pattern of settlement evolution. The settlement near the terminal station of Line 7, the Global Resort Station, displays evolution pattern E (Vs+, S+) and the rate of settlement is increasing; the changes in land use, construction precipitation, etc., may be the factors that lead to the rapid development of ground subsidence in this area.
In summary, our research provides a new method to identify the nonlinear evolution pattern of land subsidence, and the relevant results are significant for subsidence hazard management. It should be noted that the method proposed in this study is more suitable for the scenario with nonlinear evolution characteristics of long-term land subsidence, but there may be some limitations in the relevant research on linear and seasonal characteristics.

Author Contributions

Conceptualization, X.L.; methodology, M.L. and Y.K.; software, M.L.; validation J.J. and L.Z.; formal analysis, Z.S.; investigation, Z.X.; resources, H.G.; data curation, L.G. and H.G; writing—original draft preparation, M.L. and Z.X.; writing—review and editing, X.L. and L.W.; visualization, P.T.; supervision, P.T.; project administration, X.L.; funding acquisition, X.L. and M.L. All authors have read and agreed to the published version of the manuscript.

Funding

This research was funded by the Natural Science Foundation of China under grant 42271487; Fundamental Research Funds for the Central Universities under grant ZY20230212; University-Industry Collaborative Education Program under grant number 230902313201033.

Data Availability Statement

Upon reasonable request, the corresponding author, Professor Xiaojuan Li, Ph.D., can provide the data that support this study’s conclusions.

Acknowledgments

We thank the authors of all references for their theoretical contributions to the work of this study, as well as the editors and reviewers for their valuable comments and suggestions.

Conflicts of Interest

The authors declare no conflicts of interest.

References

  1. Hasan, M.F.; Smith, R.; Vajedian, S.; Pommerenke, R.; Majumdar, S. Global land subsidence mapping reveals widespread loss of aquifer storage capacity. Nat. Commun. 2023, 14, 6180. [Google Scholar] [CrossRef] [PubMed]
  2. Herrera-Garcia, G.; Ezquerro, P.; Tomas, R.; Bejar-Pizarro, M.; Lopez-Vinielles, J.; Rossi, M.; Mateos, R.M.; Carreon-Freyre, D.; Lambert, J.; Teatini, P.; et al. Mapping the global threat of land subsidence. Science 2021, 371, 34–36. [Google Scholar] [CrossRef] [PubMed]
  3. Gong, H.; Pan, Y.; Zheng, L.; Li, X.; Zhu, L.; Zhang, C.; Huang, Z.; Li, Z.; Wang, H.; Zhou, C.; et al. Long-term groundwater storage changes and land subsidence development in the North China Plain (1971–2015). Hydrogeol. J. 2018, 26, 1417–1427. [Google Scholar] [CrossRef]
  4. Tzampoglou, P.; Ilia, I.; Karalis, K.; Tsangaratos, P.; Zhao, X.; Chen, W. Selected Worldwide Cases of Land Subsidence Due to Groundwater Withdrawal. Water 2023, 15, 1094. [Google Scholar] [CrossRef]
  5. Ye, S.; Xue, Y.; Wu, J.; Yan, X.; Yu, J.; Galloway, D.L.; Kuniansky, E.L.; Rowland, J.C. Progression and mitigation of land subsidence in China. Hydrogeol. J. 2016, 24, 685–693. [Google Scholar] [CrossRef]
  6. Ao, Z.; Hu, X.; Tao, S.; Hu, X.; Wang, G.; Li, M.; Wang, F.; Hu, L.; Liang, X.; Xiao, J.; et al. A national-scale assessment of land subsidence in China’s major cities. Science 2024, 384, 301–306. [Google Scholar] [CrossRef] [PubMed]
  7. Sato, H.P.; Abe, K.; Ootaki, O. GPS-measured land subsidence in Ojiya City, Niigata Prefecture, Japan. Eng. Geol. 2003, 67, 379–390. [Google Scholar] [CrossRef]
  8. Aimaiti, Y.; Yamazaki, F.; Liu, W. Multi-Sensor InSAR Analysis of Progressive Land Subsidence over the Coastal City of Urayasu, Japan. Remote Sens. 2018, 10, 1304. [Google Scholar] [CrossRef]
  9. Chaussard, E.; Wdowinski, S.; Cabral-Cano, E.; Amelung, F. Land subsidence in central Mexico detected by ALOS InSAR time-series. Remote Sens. Environ. 2014, 140, 94–106. [Google Scholar] [CrossRef]
  10. Cigna, F.; Tapete, D. Present-day land subsidence rates, surface faulting hazard and risk in Mexico City with 2014–2020 Sentinel-1 IW InSAR. Remote Sens. Environ. 2021, 253, 112161. [Google Scholar] [CrossRef]
  11. Faunt, C.C.; Sneed, M.; Traum, J.; Brandt, J.T.; Galloway, D.L.; Kuniansky, E.L.; Rowland, J.C. Water availability and land subsidence in the Central Valley, California, USA. Hydrogeol. J. 2016, 24, 675–684. [Google Scholar] [CrossRef]
  12. Sun, H.; Grandstaff, D.; Shagam, R. Land subsidence due to groundwater withdrawal; potential damage of subsidence and sea level rise in southern New Jersey, USA. Environ. Geol. 1999, 37, 290–296. [Google Scholar] [CrossRef]
  13. Kumar, H.; Syed, T.H.; Amelung, F.; Agrawal, R.; Venkatesh, A.S. Space-time evolution of land subsidence in the National Capital Region of India using ALOS-1 and Sentinel-1 SAR data: Evidence for groundwater overexploitation. J. Hydrol. 2022, 605, 127329. [Google Scholar] [CrossRef]
  14. Riyas, M.; Syed, T.; Kumar, H.; Kuenzer, C. Detecting and analyzing the evolution of subsidence due to coal fires in Jharia Coalfield, India using Sentinel-1 SAR data. Remote Sens. 2021, 13, 1521. [Google Scholar] [CrossRef]
  15. Gao, M.; Gong, H.; Li, X.; Chen, B.; Zhou, C.; Shi, M.; Guo, L.; Chen, Z.; Ni, Z.; Duan, G. Land Subsidence and Ground Fissures in Beijing Capital International Airport (BCIA): Evidence from Quasi-PS InSAR Analysis. Remote Sens. 2019, 11, 1466. [Google Scholar] [CrossRef]
  16. Lei, K.; Luo, Y.; Chen, B.; Guo, G.; Zhou, Y. Distribution characteristics and influence factors of land subsidence in Beijing area. Geol. China 2016, 43, 2216–2225. [Google Scholar]
  17. Zhu, X.; Zhu, W.; Guo, L.; Yinghai, K.; Li, X.; Zhu, L.; Sun, Y.; Liu, Y.; Chen, B.; Tian, J.; et al. Study on Land Subsidence Simulation Based on a Back-Propagation Neural Network Combined with the Sparrow Search Algorithm. Remote Sens. 2023, 15, 2978. [Google Scholar] [CrossRef]
  18. Galloway, D.L.; Burbey, T.J. Review: Regional land subsidence accompanying groundwater extraction. Hydrogeol. J. 2011, 19, 1459–1486. [Google Scholar] [CrossRef]
  19. Poland, M.; Burgmann, R.; Dzurisin, D.; Lisowski, M.; Masterlark, T.; Owen, S.E.; Fink, J.; Poland, M.; Newman, A. Constraints on the mechanism of long-term, steady subsidence at Medicine Lake Volcano, Northern California, from GPS, leveling, and InSAR. J. Volcanol. Geoth. Res. 2006, 150, 55–78. [Google Scholar] [CrossRef]
  20. Osmanoglu, B.; Dixon, T.H.; Wdowinski, S.; Cabral-Cano, E.; Jiang, Y. Mexico City subsidence observed with Persistent Scatterer InSAR. Int. J. Appl. Earth Obs. 2011, 13, 1–12. [Google Scholar] [CrossRef]
  21. Liu, Y.; Zhang, Y.; Zhao, F.; Ding, R.; Zhao, L.; Niu, Y.; Qu, F.; Ling, Z. Multi-Source SAR-Based Surface Deformation Monitoring and Groundwater Relationship Analysis in the Yellow River Delta, China. Remote Sens. 2023, 15, 3290. [Google Scholar] [CrossRef]
  22. Zheng, Y.; Peng, J.; Li, C.; Chen, X.; Peng, Y.; Ma, X.; Huang, M. Long-Term SAR Data Analysis for Subsidence Monitoring and Correlation Study at Beijing Capital Airport. Remote Sens. 2024, 16, 445. [Google Scholar] [CrossRef]
  23. Ng, A.H.; Ge, L.; Li, X.; Zhang, K. Monitoring ground deformation in Beijing, China with persistent scatterer SAR interferometry. J. Geod. 2012, 86, 375–392. [Google Scholar] [CrossRef]
  24. Ferretti, A.; Prati, C.; Rocca, F. Nonlinear subsidence rate estimation using permanent scatterers in differential SAR interferometry. IEEE Trans. Geosci. Remote Sens. 2000, 38, 2202–2212. [Google Scholar] [CrossRef]
  25. Ferretti, A.; Prati, C.; Rocca, F. Permanent scatterers in SAR interferometry. IEEE Trans. Geosci. Remote Sens. 2001, 39, 8–20. [Google Scholar] [CrossRef]
  26. Jiang, H.; Balz, T.; Li, J. Land Subsidence in Wuhan Revealed Using a Multi-Sensor InSAR Time Series Fusion Approach. Int. Arch. Photogramm. Remote Sens. Spat. Inf. Sci. 2023, 48, 1399–1404. [Google Scholar] [CrossRef]
  27. Lyu, M.; Li, X.; Ke, Y.; Jiang, J.; Zhu, L.; Guo, L.; Gong, H.; Chen, B.; Xu, Z.; Zhang, K.; et al. Reconstruction of spatially continuous time-series land subsidence based on PS-InSAR and improved MLS-SVR in Beijing Plain area. GISci. Remote Sens. 2023, 60, 2230689. [Google Scholar] [CrossRef]
  28. Zuo, J.; Gong, H.; Chen, B.; Liu, K.; Zhou, C.; Ke, Y. Time-series evolution patterns of land subsidence in the eastern Beijing plain, China. Remote Sens. 2019, 11, 539. [Google Scholar] [CrossRef]
  29. Ikuemonisan, F.E.; Ozebo, V.C.; Olatinsu, O.B. Investigation of Sentinel-1-derived land subsidence using wavelet tools and triple exponential smoothing algorithm in Lagos, Nigeria. Environ. Earth Sci. 2021, 80, 722. [Google Scholar] [CrossRef]
  30. Lyu, M.; Ke, Y.; Li, X.; Zhu, L.; Guo, L.; Gong, H. Detection of Seasonal Deformation of Highway Overpasses Using the PS-InSAR Technique: A Case Study in Beijing Urban Area. Remote Sens. 2020, 12, 3071. [Google Scholar] [CrossRef]
  31. Zhu, L.; Gong, H.; Li, X.; Wang, R.; Chen, B.; Zhenxue, D.; Pietro, T. Land subsidence due to groundwater withdrawal in the northern Beijing Plain, China. Eng. Geol. 2015, 193, 243–255. [Google Scholar] [CrossRef]
  32. Shi, M.; Chen, B.; Gong, H.; Li, X.; Chen, W.; Gao, M.; Zhou, C.; Lei, K. Monitoring Differential Subsidence along the Beijing-Tianjin Intercity Railway with Multiband SAR Data. Int. J. Environ. Res. Public Health 2019, 16, 4453. [Google Scholar] [CrossRef] [PubMed]
  33. Chen, B.; Gong, H.; Chen, Y.; Lei, K.; Zhou, C.; Si, Y.; Li, X.; Pan, Y.; Gao, M. Investigating land subsidence and its causes along Beijing high-speed railway using multi-platform InSAR and a maximum entropy model. Int. J. Appl. Earth Obs. 2021, 96, 102284. [Google Scholar] [CrossRef]
  34. Li, M.; Ge, D.; Zhang, L.; Guo, X.; Liu, B.; Wang, Y.; Wu, Q. Assessment of the temporal-spatial evolution of subsidence and its driving mechanism in the Beijing Plain (China) by using SAR interferometry and geological data. Geomat. Nat. Hazards Risk 2021, 12, 2708–2735. [Google Scholar] [CrossRef]
  35. Park, S.; Hong, S. Nonlinear modeling of subsidence from a decade of InSAR time series. Geophys. Res. Lett. 2021, 48, e2020GL090970. [Google Scholar] [CrossRef]
  36. Chen, M.; Tomas, R.; Li, Z.; Motagh, M.; Li, T.; Hu, L.; Huili, G.; Xiaojuan, L.; Jun, Y.; Xulong, G. Imaging land subsidence induced by groundwater extraction in Beijing (China) using satellite radar interferometry. Remote Sens. 2016, 8, 468. [Google Scholar] [CrossRef]
  37. Li, Y.; Gong, H.; Zhu, L.; Li, X. Measuring Spatiotemporal Features of Land Subsidence, Groundwater Drawdown, and Compressible Layer Thickness in Beijing Plain, China. Water 2017, 9, 64. [Google Scholar] [CrossRef]
  38. Chen, B.; Gong, H.; Chen, Y.; Li, X.; Zhou, C.; Lei, K.; Zhu, L.; Duan, L.; Zhao, X. Land subsidence and its relation with groundwater aquifers in Beijing. Sci. Total Environ. 2020, 735, 139111. [Google Scholar] [CrossRef] [PubMed]
  39. Zheng, Y.; Peng, J.; Chen, X.; Huang, C.; Chen, P.; Li, S.; Su, Y. Spatial and Temporal Evolution of Ground Subsidence in the Beijing Plain Area Using Long Time Series Interferometry. IEEE Trans. Geosci. Remote Sens. 2023, 16, 153–165. [Google Scholar] [CrossRef]
  40. Du, Z.; Ge, L.; Ng, A.H.; Garthwaite, M.C.; Zhu, Q.; Horgan, F.G.; Zhang, Q. Analysis of the impact of the South-to-North Water Diversion Project on water balance and land subsidence in Beijing, China between 2007 and 2020. J. Hydrol. 2021, 603, 126990. [Google Scholar] [CrossRef]
  41. Lyu, M.; Ke, Y.; Guo, L.; Li, X.; Zhu, L.; Gong, H.; Constantinos, C. Change in regional land subsidence in Beijing after south-to-north water diversion project observed using satellite radar interferometry. GISci. Remote Sens. 2020, 57, 140–156. [Google Scholar] [CrossRef]
  42. Bahrami, M.; Mahmoudi, M.R. Long-term temporal trend analysis of climatic parameters using polynomial regression analysis over the Fasa Plain, southern Iran. Meteorol. Atmos. Phys. 2022, 134, 42. [Google Scholar] [CrossRef]
  43. Jamali, S.; Seaquist, J.; Eklundh, L.; Ardö, J. Automated mapping of vegetation trends with polynomials using NDVI imagery over the Sahel. Remote Sens. Environ. 2014, 141, 79–89. [Google Scholar] [CrossRef]
  44. Wilson, A.G. Covariance Kernels for Fast Automatic Pattern Discovery and Extrapolation with Gaussian Processes. Ph.D. Thesis, University of Cambridge, Cambridge, UK, 2014. [Google Scholar]
  45. Jiao, S.; Li, X.; Yu, J.; Lyu, M.; Zhang, K.; Li, Y.; Shi, P. Multi-Scale Analysis of Surface Building Density and Land Subsidence Using a Combination of Wavelet Transform and Spatial Autocorrelation in the Plains of Beijing. Sustainability 2024, 16, 2801. [Google Scholar] [CrossRef]
  46. Guo, L.; Gong, H.; Zhu, F.; Zhu, L.; Zhang, Z.; Zhou, C.; Gao, M.; Sun, Y. Analysis of the spatiotemporal variation in land subsidence on the Beijing Plain, China. Remote Sens. 2019, 11, 1170. [Google Scholar] [CrossRef]
  47. Zhang, Y.; Gong, H.; Gu, Z.; Wang, R.; Li, X.; Zhao, W. Characterization of land subsidence induced by groundwater withdrawals in the plain of Beijing City, China. Hydrogeol. J. 2014, 22, 397–409. [Google Scholar] [CrossRef]
  48. Chen, B.; Gong, H.; Li, X.; Lei, K.; Zhu, L.; Gao, M.; Zhou, C. Characterization and causes of land subsidence in Beijing, China. Int. J. Remote Sens. 2017, 38, 808–826. [Google Scholar] [CrossRef]
  49. Gao, M.; Gong, H.; Chen, B.; Li, X.; Zhou, C.; Shi, M.; Si, Y.; Chen, Z.; Duan, G. Regional Land Subsidence Analysis in Eastern Beijing Plain by InSAR Time Series and Wavelet Transforms. Remote Sens. 2018, 10, 365. [Google Scholar] [CrossRef]
  50. Chen, B.; Gong, H.; Lei, K.; Li, J.; Zhou, C.; Gao, M.; Guan, H.; Lv, W. Land subsidence lagging quantification in the main exploration aquifer layers in Beijing plain, China. Int. J. Appl. Earth Obs. 2019, 75, 54–67. [Google Scholar] [CrossRef]
  51. Shi, M.; Gao, M.; Chen, Z.; Lyu, M.; Gong, H.; Zhai, Y.; Pan, Y. Land subsidence in Beijing: Response to the joint influence of the South-to-North Water Diversion Project and ecological water replenishment, observed by satellite radar interferometry. GISci. Remote Sens. 2024, 61, 2315708. [Google Scholar] [CrossRef]
  52. Zheng, L.; Zhang, Y.; Ruitao, J.; Pengbo, Z. GMS-based numerical simulation and prediction analysis of groundwater environment in Chaoyang District of Beijing. Water Resour. Hydropower Eng. 2022, 53, 124–134. [Google Scholar]
  53. Wu, Y.; Xu, J.; Qiu, W.; Wang, M.; Li, S.; Shi, Y.; Wei, J. Study on ecological water replenishment scheduling scheme of Chaobai River in Beijing section. Water Resour. Hydropower Eng. 2023, 54, 180–189. [Google Scholar]
  54. Long, D.; Yang, W.; Scanlon, B.R.; Zhao, J.; Liu, D.; Burek, P.; Pan, Y.; You, L.; Wada, Y. South-to-North Water Diversion stabilizing Beijing’s groundwater levels. Nat. Commun. 2020, 11, 3665. [Google Scholar] [CrossRef]
  55. Guo, L.; Gong, H.; Ke, Y.; Zhu, L.; Li, X.; Lyu, M.; Zhang, K. Mechanism of land subsidence mutation in Beijing Plain under the background of urban expansion. Remote Sens. 2021, 13, 3086. [Google Scholar] [CrossRef]
  56. Du, D.; Liu, H.; Zhou, J.; Zhang, J.; Miao, J.; Li, Y.; Cao, X.; Ye, M. Study of the characteristics and influencing factors of land subsidence in the Tongzhou District of Beijing. Acta Geol. Sin. 2022, 96, 712–725. [Google Scholar]
  57. Zhang, G.; Weng, N.; Wang, L.; Zhang, Q.; Jiao, Z. Analysis on variation characteristics of groundwater level in Changping District. Beijing Water 2021, 25–29. [Google Scholar] [CrossRef]
  58. Mesri, B.G.; ASCE, M.; Choi, Y.K.; ASCE, A.M. Settlement Analysis of Embankments on Soft Clays. J. Geotech. Eng. 1985, 111, 441–464. [Google Scholar] [CrossRef]
  59. Zhang, L.; Bai, L.; Zhao, Y.; Zhang, X.; Yang, T.; Cai, X.; He, F. The difference of deposition rate in the boreholes at the junction between Nankou-Sunhe fault and Huangzhuang-Gaoliying fault and its response to fault activity in the Beijing area. Seismol. Geol. 2017, 39, 1048–1065. [Google Scholar]
  60. Wu, W.; Yun, Y.; Sun, Y.; Zhang, G. Tunnelling and Underground Space Technology incorporating Trenchless Technology Research. Tunn. Undergr. Sp. Tech. 2023, 133, 104941. [Google Scholar] [CrossRef]
  61. Shi, J.; Wu, B.; Liu, Y.; Xu, S.; Hou, J.; Wang, Y.; Sun, Q.; Meng, G.; Nong, Z.; Qiu, H.; et al. Analysis of the influence of groundwater seepage on the deformation of deep foundation pit with suspended impervious curtain. Adv. Mech. Eng. 2022, 14, 1992379939. [Google Scholar] [CrossRef]
  62. Xue, T.; Xue, X.; Long, S.; Chen, Q.; Lu, S.; Zeng, C. Effect of Pre-Existing Underground Structures on Groundwater Flow and Strata Movement Induced by Dewatering and Excavation. Water 2023, 15, 814. [Google Scholar] [CrossRef]
  63. Cao, J.; Gong, H.; Chen, B.; Shi, M.; Zhou, C.; Lei, K.; Yu, H.; Sun, Y. Land Subsidence in Beijing’s Sub-Administrative Center and Its Relationship with Urban Expansion Inferred from Sentinel-1/2. Can. J. Remote Sens. 2021, 47, 802–817. [Google Scholar] [CrossRef]
Figure 1. Location of the study area.
Remotesensing 16 02829 g001
Figure 2. (a) Deformation rate from 2003 to 2020 in the Beijing Plain. (b) Correlation between the results of Envisat ASAR (2003−2010) and Radarsat-2 (2010−2016). (c) Correlation between the results of Radarsat-2 (2010−2016) and Radarsat-2 (2017−2020).
Remotesensing 16 02829 g002
Figure 3. Comparison of PS-InSAR monitoring results and leveling monitoring results from (a) 2005 to 2013, (b) 2015 to 2016, and (c) 2013 to 2018.
Remotesensing 16 02829 g003
Figure 4. Polynomial curve fitting results. Fitting curves of different polynomials to (a) P1 and (b) P2. (c) R2 and (d) RMSE ranges for different polynomial fitting.
Remotesensing 16 02829 g004
Figure 5. Spatial distribution of date of (a) maximum subsidence t m a x and (b) date of inflection point K .
Remotesensing 16 02829 g005
Figure 6. Statistical histogram of date of (a) maximum settlement value t m a x and (b) inflection point K during the period of 2003 to 2020.
Remotesensing 16 02829 g006
Figure 7. (a) Spatial distribution of land subsidence of the different evolution patterns. The time-series evolution of the land subsidence of (b) evolution pattern A (Vs−, S+-), (c) evolution pattern B (Vs+-, S+-), (d) evolution pattern C (Vs−, S+), (e) evolution pattern D (Vs+-, S+), and (f) evolution pattern E (Vs+, S+) from five feature points and (g,h) two leveling points (2005–2016).
Remotesensing 16 02829 g007
Figure 8. Relationship between land subsidence evolution patterns and groundwater level in (a) Chaoyang monitoring station, (b) Tongzhou monitoring station, (c) Changping monitoring station, and (d) Shunyi monitoring station.
Remotesensing 16 02829 g008
Figure 9. Annual precipitation, groundwater depth, and pumping in Beijing from 2003 to 2020.
Remotesensing 16 02829 g009
Figure 10. Relationship between land subsidence evolution patterns and geological background including (a) the thickness of the compressible soil layer and (b) faults.
Remotesensing 16 02829 g010
Figure 11. (a) The relationship between the subsidence evolution pattern and land use. The land use near the Universal Resort Station in (b) November 2003, (c) September 2012, (d) September 2018, and (e) September 2020.
Remotesensing 16 02829 g011
Table 1. Main information of the Envisat ASAR and Radarsat-2.
SAR SensorEnvisat ASARRadarsat-2Radarsat-2
Orbit directionDescendingDescendingDescending
PolarizationVVVVVV
BandCCC
Wavelength (cm)5.65.65.6
Incidence Angle22.833.922.56
Image modeImageStandardExtra-Fine
No. images553743
Date range18 June 2003–19 September 201022 November 2010–21 October 201625 January 2017–10 January 2020
Table 2. Classification of land subsidence evolution pattern.
Evolution PatternRecognition RuleCharacteristic
A ( V s , S+-)K ≤ 2003, t m a x   < 2020The settlement rate continues to decrease, and the cumulative settlement first increases and then decreases
B ( V s +-, S+-)2003 < K < 2020, t m a x   < 2020The settlement rate first increases and then decreases, and the cumulative settlement first increases and then decreases
C ( V s , S+)K ≤ 2003, t m a x   ≥ 2020The settlement rate continues to decrease, and the cumulative settlement continues to increase
D ( V s +-, S+)2003 < K < 2020, t m a x   ≥ 2020The settlement rate first increases and then decreases, and the cumulative settlement continues to increase
E ( V s +, S+)K ≥ 2020, t m a x   ≥ 2020The settlement rate continues to increase, and the cumulative settlement continues to increase
Disclaimer/Publisher’s Note: The statements, opinions and data contained in all publications are solely those of the individual author(s) and contributor(s) and not of MDPI and/or the editor(s). MDPI and/or the editor(s) disclaim responsibility for any injury to people or property resulting from any ideas, methods, instructions or products referred to in the content.

