Article

Spatio-Temporal Dynamics of Vegetation and Its Driving Mechanisms on the Qinghai-Tibet Plateau from 2000 to 2020

1
State Key Laboratory of Efficient Utilization of Arid and Semi-Arid Arable Land in Northern China, Institute of Agricultural Resources and Regional Planning, Chinese Academy of Agricultural Sciences, Beijing 100081, China
2
College of Earth and Environmental Sciences, Lanzhou University, Lanzhou 730000, China
3
Ministry of Natural Resources of the People’s Republic of China, The Fourth Topographic Surveying Team, Harbin 150000, China
*
Author to whom correspondence should be addressed.
Remote Sens. 2024, 16(15), 2839; https://doi.org/10.3390/rs16152839
Submission received: 27 June 2024 / Revised: 26 July 2024 / Accepted: 28 July 2024 / Published: 2 August 2024

Abstract

:
Revealing the response of vegetation on the Qinghai-Tibet Plateau (QTP) to climate change and human activities is crucial for ensuring East Asian ecological security and regulating the global climate. However, the current research rarely explores the time-lag effects of climate on vegetation growth, leading to considerable uncertainty in analyzing the driving mechanisms of vegetation changes. This study identified the main driving factors of vegetation greenness (vegetation index, EVI) changes after investigating the lag effects of climate. By analyzing the trends of interannual variation in vegetation and climate, the study explored the driving mechanisms behind vegetation changes on the QTP from 2000 to 2020. The results indicate that temperature and precipitation have significant time-lag effects on vegetation growth. When considering the lag effects, the explanatory power of climate on vegetation changes is significantly enhanced for 29% of the vegetated areas. About 31% of the vegetation on the QTP exhibited significant “greening”, primarily in the northern plateau. This greening was attributed not only to improvements in climate-induced hydrothermal conditions but also to the effective implementation of ecological projects, which account for roughly half of the significant greening. Only 2% of the vegetation on the QTP showed significant “browning”, sporadically distributed in the southern plateau and the Sanjiangyuan region. In these areas, besides climate-induced drought intensification, approximately 78% of the significant browning was due to unreasonable grassland utilization and intense human activities. The area where precipitation dominates vegetation improvement was larger than the area dominated by temperature, whereas the area where precipitation dominates vegetation degradation is smaller than that where temperature dominates degradation. The implementation of a series of ecological projects has resulted in a much larger area where human activities positively promoted vegetation compared to the area where they negatively inhibited it.

1. Introduction

As an important pastoral region in China, the vegetation of the Qinghai-Tibet Plateau (QTP) is an essential resource for the survival of the local population [1]. The QTP, known as the “Third Pole of the Earth”, is a key initiation area and amplifier of climate change in the Northern Hemisphere. Its vegetation ecosystem serves as an indicator of climate change both regionally and globally [2,3]. As the “Water Tower of Asia”, the vegetation of the QTP plays a crucial ecological role in windbreak, sand fixation, water conservation, soil retention, and water preservation [4,5]. Against the backdrop of “global warming” and increased human activity intensity, the combined impact of climate change and human activities significantly affects and threatens the sensitive and fragile vegetation ecosystem of the QTP [6]. On the other hand, vegetation changes also exert feedback on climate change by regulating carbon, hydrological, and energy cycles [7,8,9]. Hence, monitoring vegetation dynamics and investigating the driving factors of these changes through quantitative analysis contribute to comprehending the behavioral mechanisms of vegetation ecosystems [10,11]. Ultimately, this holds substantial practical significance for ensuring the normal functioning of ecological security barriers and ecosystem service functions in the QTP.
Numerous studies have examined the spatio-temporal characteristics of vegetation in the QTP region using remote sensing vegetation indices from satellites such as MODIS, LANDSAT, and GIMMS. These studies have identified the drivers of vegetation change by quantifying the impacts of climatic factors and human activities [12,13,14,15]. However, quantifying human activities with spatial precision poses challenges, making it difficult to incorporate it into statistical models as independent variables alongside climate, with the vegetation index as the dependent variable. To address this challenge, the residual trend analysis (RESTREND) method has emerged as a practical and effective solution [16]. This method constructs a linear response function of vegetation to climate, enabling the disentanglement of the effects of human activities and climate from the interannual variation of vegetation. Consequently, it facilitates the identification of drivers of vegetation change even in the absence of detailed human activity data. The RESTREND method has been widely adopted in numerous studies [17,18,19,20]. The key to employing the RESTREND method lies in fully revealing the influence of climate on vegetation growth. It has been noted that the dynamic influence of climate on vegetation exhibits asymmetry over time, often characterized by a time-lag effect between them [21,22]. In essence, vegetation growth is not solely governed by current climate conditions but also influenced by preceding ones [23,24,25,26]. However, many studies employing the RESTREND method have primarily focused on utilizing climate data within the growing season and vegetation indices for modeling, neglecting the time-lag effect of climate in the non-growing season on interannual vegetation growth [19,27,28,29,30]. Consequently, this approach has resulted in the development of models that inadequately capture the response mechanisms of vegetation to climate, leading to heightened uncertainty in identifying drivers of vegetation change.
This study aims to elucidate the spatiotemporal dynamics of vegetation in the QTP from 2000 to 2020 and accurately reveal its response to climate change and human activities. To achieve this, the study will undertake the following research: (1) Investigate the spatio-temporal variation characteristics of the EVI during the growing season; (2) Explore the time-lag effects of climatic factors on vegetation growth; (3) Based on the determination of time-lag effects, quantitatively analyze the impacts of climate and human activities on vegetation growth and identify the main driving factors of vegetation change.

2. Study Area and Data

2.1. Study Area

The QTP predominantly encompasses Qinghai Province and the Tibet Autonomous Region, extending into portions of Xinjiang Autonomous Region, Sichuan Province, Yunnan Province, and Gansu Province (Figure 1). It is situated between 26°00′–39°47′N and 73°19′–104°47′E and has an average altitude exceeding 4000 m (Figure 1). It is the largest plateau in China and the highest in the world, earning the nickname “Third Pole of the Earth. The topography of the QTP is varied, with higher terrain in the northwest and lower terrain in the southeast (Figure 1). It can be classified into six distinct categories: the Qinghai Plateau, the Qilian Mountains, the Qaidam Basin, the Northern Tibet Plateau, the Southern Tibet Valley, and the Sichuan-Tibet Alpine Canyon. Characterized by diverse climates, the QTP delineates five temperature zones: tropical, subtropical, plateau temperate, plateau subfrigid, and plateau frigid. Additionally, it is divided into four wet/dry zones, transitioning from humid to semi-humid, semi-arid, and arid as one moves from the southeast to the northwest. Both the annual average temperature and precipitation exhibit a decreasing trend from southeast to northwest. The distinctive climatic attributes, coupled with its intricate topography, foster a plethora of vegetation types across the QTP, manifesting specific horizontal and vertical zonal distribution patterns (Figure 1). Generally, desert and semi-desert vegetation prevails in the northwestern expanse, while alpine meadows and alpine steppes dominate the plateau’s interior. Towards the southeast, mountainous forests intermix with coniferous and broad-leaved forests, imparting richness to the region’s biodiversity. The growing season of vegetation on the QTP generally ranges from May to September [31].

2.2. Data and Preprocessing

The remote sensing vegetation index offers the advantage of objectivity, accuracy, and rapid accessibility in characterizing vegetation coverage and growth status. Specifically, the Enhanced Vegetation Index (EVI), utilized in this study, is particularly well-suited for monitoring vegetation information in the QTP [32]. Derived from the vegetation index product (MOD13A2) of the Moderate Resolution Imaging Spectroradiometer (MODIS) satellite, the EVI boasts a temporal resolution of 16 days and a spatial resolution of 1 km. The average EVI within the vegetation’s growing season (GEVI) was employed to represent interannual vegetation coverage. To mitigate noise interference from clouds and atmospheric contamination in EVI images, the EVI spatio-temporal data of the QTP spanning from 2000 to 2020 underwent reconstruction. This was achieved through the iterative Savitzky–Golay (SG) filtering algorithm [32,33]. The following operations were performed to ensure the objectivity of the observations: (1) EVI pixels affected by cloud, ice, and snow noise were identified using quality control data from the MOD13A2 product; and (2) the reconstructed EVI values were used to replace the corresponding noisy pixel values, while the un-noisy pixels retained their original values.
Temperature and precipitation serve as the fundamental energy inputs for terrestrial ecosystems and are the primary drivers of vegetation dynamics. In this study, the average air temperature and cumulative precipitation during the period critical for vegetation growth were employed as drivers for interannual variations in vegetation coverage. These air temperature and precipitation data were sourced from the “1 km resolution monthly climate dataset of China” [34].
In this study, land-use data spanning the years 2000, 2005, 2010, 2015, and 2020 were employed to identify vegetated pixels persisting over the two-decade period on the QTP. This dataset was sourced from the “Chinese multi-period land use dataset” (CNLUCC), boasting a spatial resolution of 1 km [35]. Land use is categorized into six classes, with particular focus on three vegetation types: cropland, forest, and grassland.
The spatial zoning of vegetation types across the QTP was derived from the “1:1,000,000 vegetation types of China” dataset (https://www.resdc.cn accessed on 1 January 2022). This dataset categorizes QTP vegetation into alpine vegetation, cultivated vegetation, coniferous forest, broad-leaved forest, coniferous and broad-leaved mixed forest, shrub, tussock, alpine steppe, and alpine meadow, offering a detailed classification. In this study, the dataset was utilized to analyze interannual variations in vegetation coverage by type.
Temperature zones and wet/dry zones of the QTP were extracted from the “climate zoning data of China” dataset (https://www.resdc.cn accessed on 1 January 2022). Following the overlay of temperature zones and wet/dry zones, they were employed to ascertain the primary climatic factor influencing vegetation changes within each zone.

3. Methods

3.1. Time-Lag Effects of Climate on Vegetation Growth

Vegetation growth is influenced not only by the climate during the growing season but also by the climate prior to the growing season (from October of the previous year through April of the current year). If the climate in October of the previous year affects vegetation growth in the current year, the lag duration would be 7 months. If the climate prior to the growing season has no effect on vegetation, the lag duration would be 0 months. To investigate the lag duration for precipitation and temperature in the QTP, this study employed the method proposed by [36], which has proven effective in scrutinizing lag effects of temperature on phenology. Cumulative precipitation and mean temperature during the combined period of the lag duration and the growing season were analyzed as independent variables, while the GEVI served as the dependent variable. To pinpoint the optimal lag duration maximizing precipitation’s impact on the GEVI, partial correlation coefficients between precipitation and the GEVI were computed for lag periods ranging from 0 to 7 months before the growing season, with temperature as a controlled variable. Subsequently, the preceding months exhibiting the highest absolute value of partial correlation coefficients were identified as the optimal lag duration. Similarly, by substituting precipitation with temperature, lag durations for temperature could be determined.
The partial correlation coefficient was calculated using Equation (1). R x y , z is the partial correlation coefficient between variables x and y after fixing the variable z . R x y , R x z , and R y z all denote the Pearson correlation coefficient between two variables.
R x y , z = R x y R x z R y z ( 1 R x z 2 ) + ( 1 R y z 2 )

3.2. Framework for Identification of Drivers in Interannual Vegetation Variability

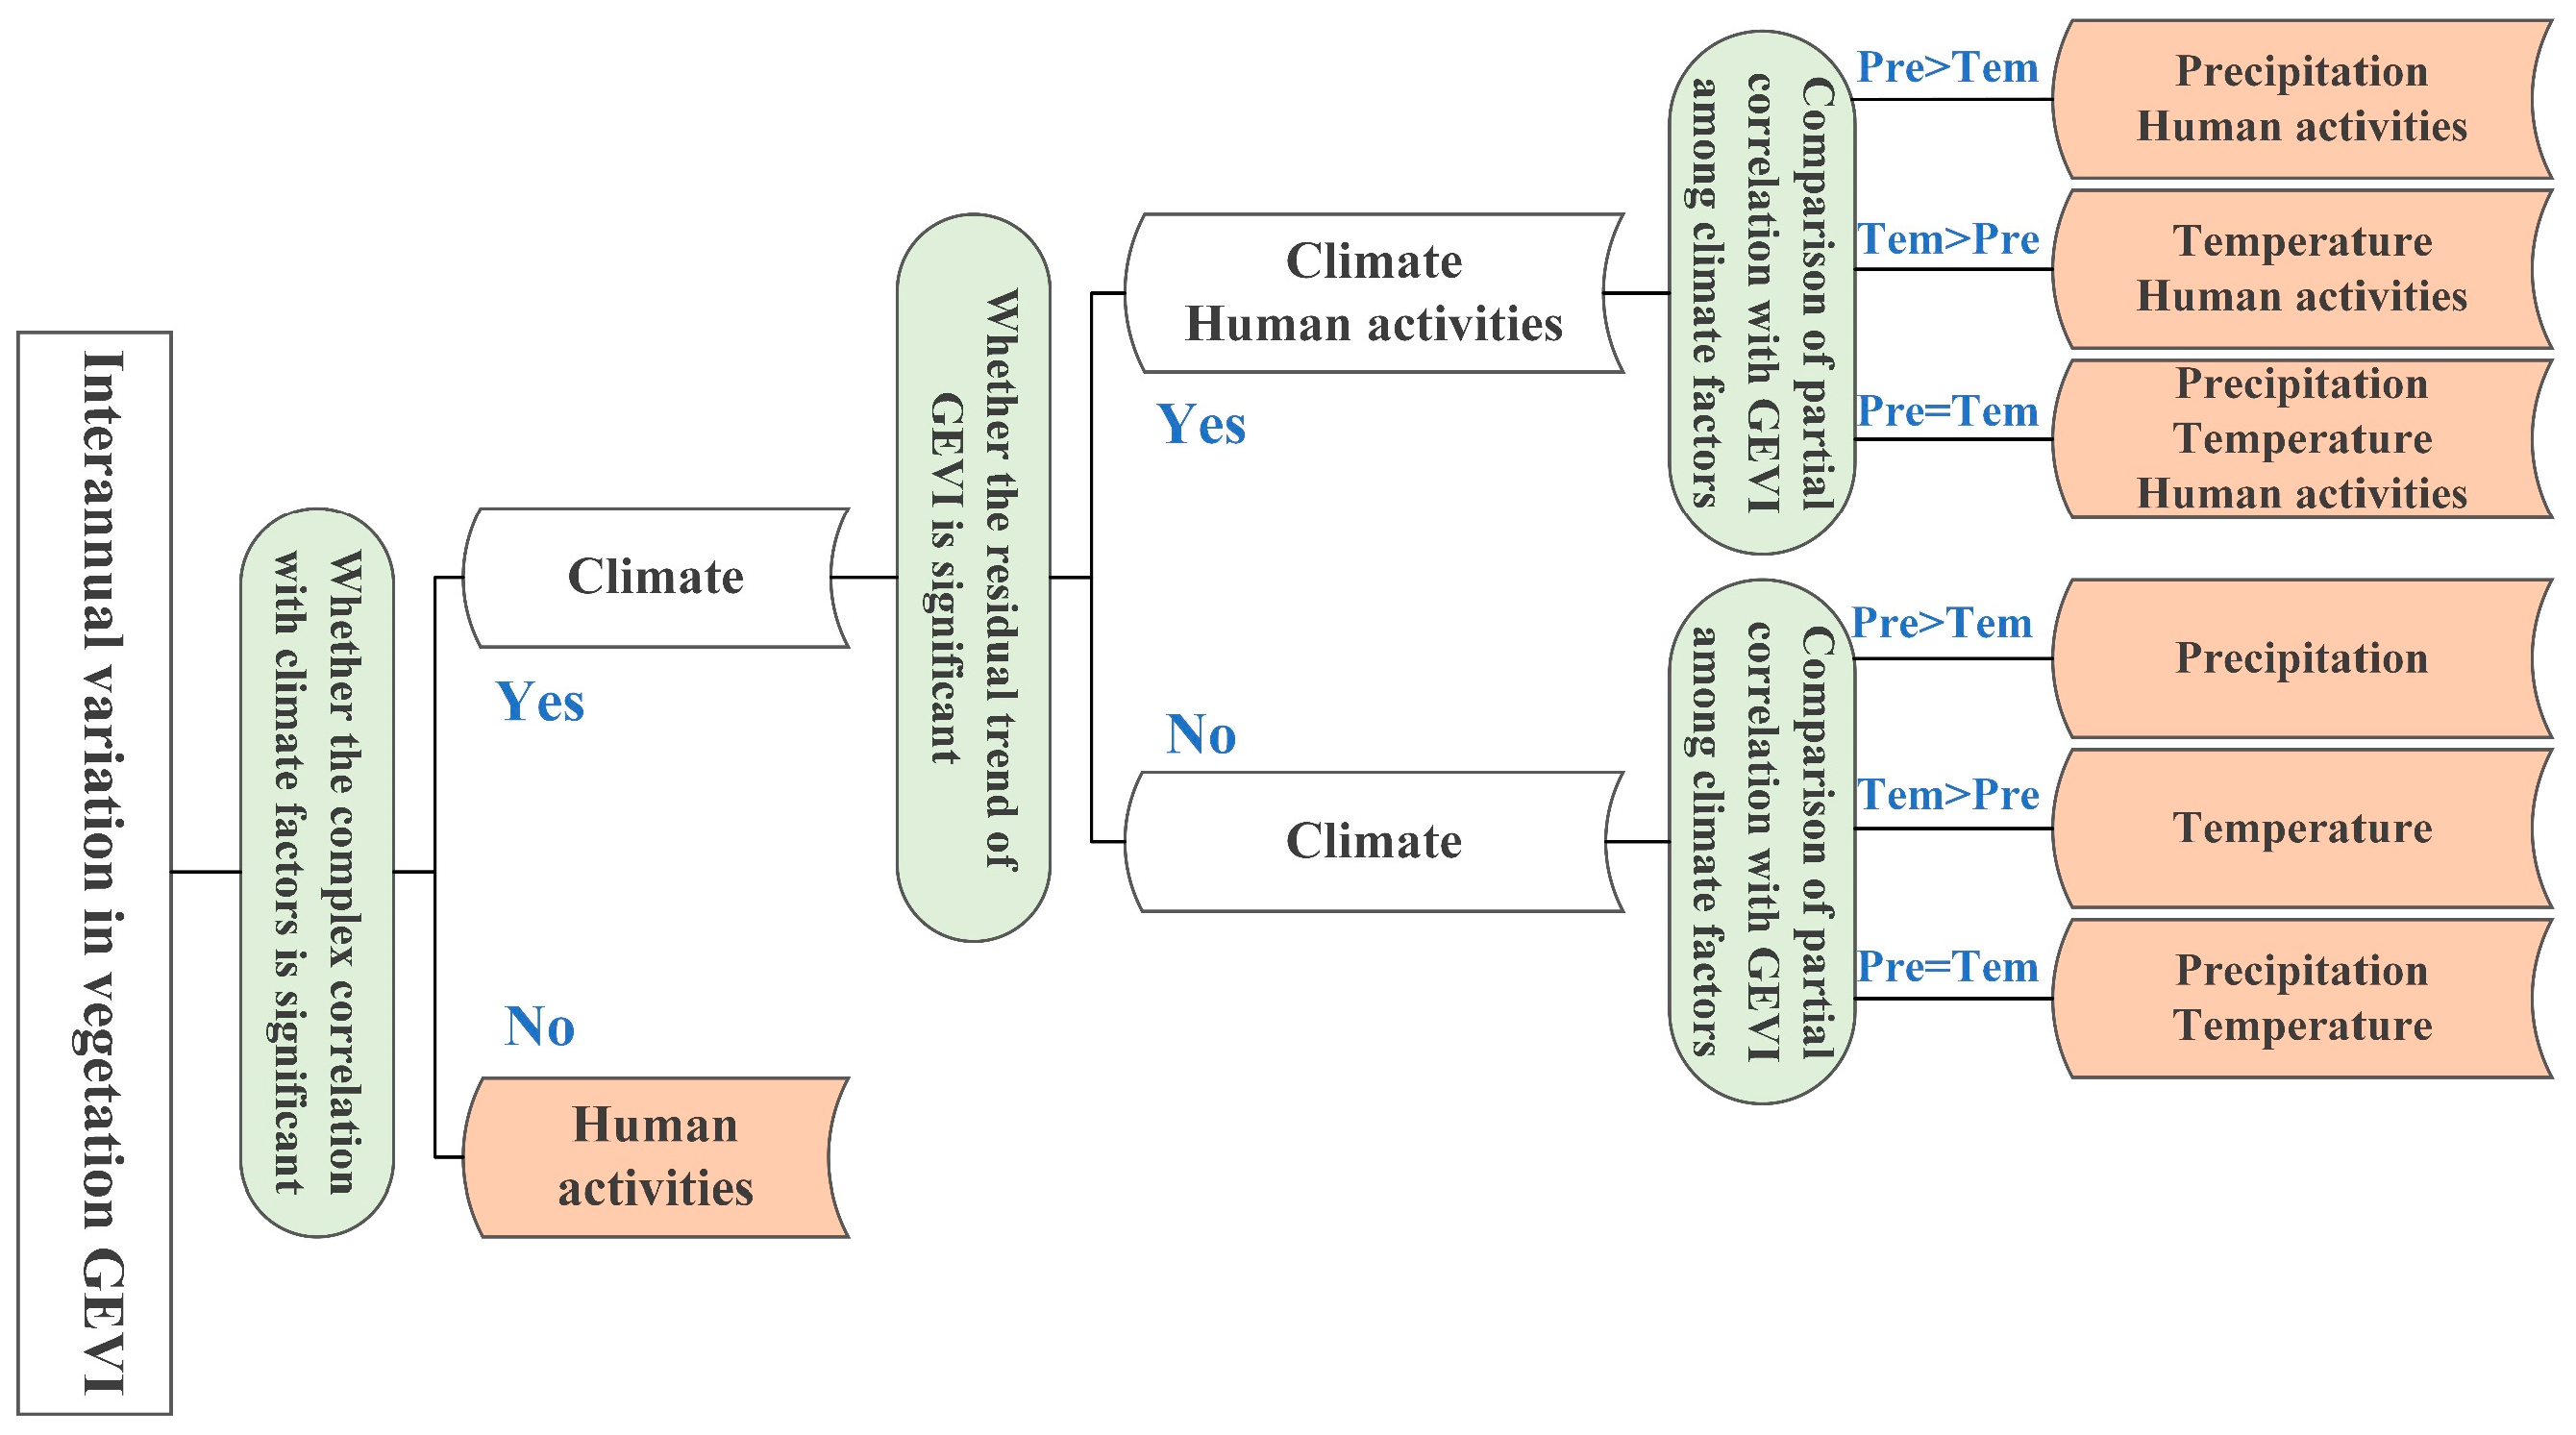
The RESTREND method is commonly employed to disentangle the influence of human activities from the interannual variability of vegetation productivity, thereby facilitating the detection of drivers of vegetation change. In this study, the RESTREND method was applied to discern the drivers of the interannual vegetation GEVI change on the QTP, accounting for time-lagged effects of temperature and precipitation. The specific description of the driver identification framework is provided below, with its general flow illustrated in Figure 2.
(1) The multiple linear regression model was formulated, with precipitation and temperature, considering lag effects, as independent variables and the vegetation GEVI as the dependent variable. The significance of the model R2 was evaluated using an F-test. If the correlation between climate and the GEVI on interannual variation proves significant ( p < 0.05 ), it suggests that vegetation change is primarily driven by climate. Conversely, if the correlation is insignificant ( p 0.05 ), it indicates that human activities have disrupted the climate–GEVI relationship, with human activities being the sole driving factor. The multiple linear regression model is represented as Equation (2), where G E V I p denotes the simulated GEVI value; P R E and T M P denote cumulative precipitation and mean temperature, respectively, considering lag effects; a and b represent regression coefficients; and c denotes the intercept.
(2) The residuals of the linear model were calculated pixel by pixel for regions exhibiting a significant correlation between climate and the GEVI (Equation (3), where G E V I res represents the residuals and G E V I o b denotes the observed GEVI). Subsequently, Theil–Sen Median trend analysis and the Mann–Kendall test were concurrently used on a pixel-by-pixel basis to determine the interannual rate of residual change and its corresponding significance. A significant residual trend indicates that vegetation change is influenced not only by climate but also by human activities. In such instances, a positive growth rate of the residuals suggests a positive contribution of human activities to vegetation at the respective location, while a negative growth rate signifies a negative inhibitory effect of human activities on vegetation. Conversely, if the residual trend is deemed insignificant, it implies that vegetation change is solely driven by climate.
(3) In regions with insignificant residual trends, indicating climate-driven changes, the primary climate driver was identified by comparing the magnitude of partial correlation coefficients between precipitation, temperature, and the GEVI.
G E V I p = a × P R E + b × T M P + c
G E V I r e s = G E V I o b G E V I p
The multiple correlation coefficient assesses the linear relationship between a dependent variable and multiple independent variables. Equation (4) presents its calculation formula. Here, R z , x y represents the multiple correlation coefficient of the dependent variable z with independent variables x and y , R z x denotes the Pearson correlation coefficient of z with x , and R z y , x signifies the partial correlation coefficient of z with y after controlling for x . Furthermore, the significance of the multiple correlation coefficient was assessed in this study using the F-test, calculated as demonstrated in Equation (5). Here, F denotes the test statistic for the multiple correlation coefficient, n represents the number of samples, and k stands for the number of independent variables.
R z , x y = 1 ( 1 R z x 2 ) ( 1 R z y , x 2 )
F = R z , x y 2 1 R z , x y 2 × n k 1 k
The Theil–Sen median trend analysis, in conjunction with the Mann–Kendall test, is frequently employed to discern trends in time-series data. The Theil–Sen median method is computed as per Equation (6). Here, T rend is derived by calculating the slopes of n ( n 1 ) / 2 combinations of data points and then determining the median of these slopes, which quantifies the monotonic trends in the time-series data. The function m e d i a n ( ) is employed to compute the median, while X i and X j denote the data at moments i and j , respectively. The Mann–Kendall test is a non-parametric method for assessing the significance of trends, with its calculations shown in Equations (7)–(9). Given a significance level α , if Z > U 1 a / 2 , it indicates a significant trend in the time series at the α level. This study tested the significance of the annual GEVI trend at two confidence levels ( α = 0.01 ; α = 0.05 ), and the significance of the residual trend was tested at the 0.05 confidence level.
T rend = m e d i a n ( X i X j i j , i < j )
Z = S 1 var ( S )       S > 0 0       S = 0 S + 1 var ( S )       S < 0
S = i = 1 n 1 j = i + 1 n sgn ( X j X i )
var ( S ) = n ( n 1 ) ( 2 n + 5 ) 18
sgn ( X j X i ) = 1 0 1       X j X i > 0       X j X i = 0       X j X i < 0

4. Result

4.1. Spatio-Temporal Pattern of GEVI

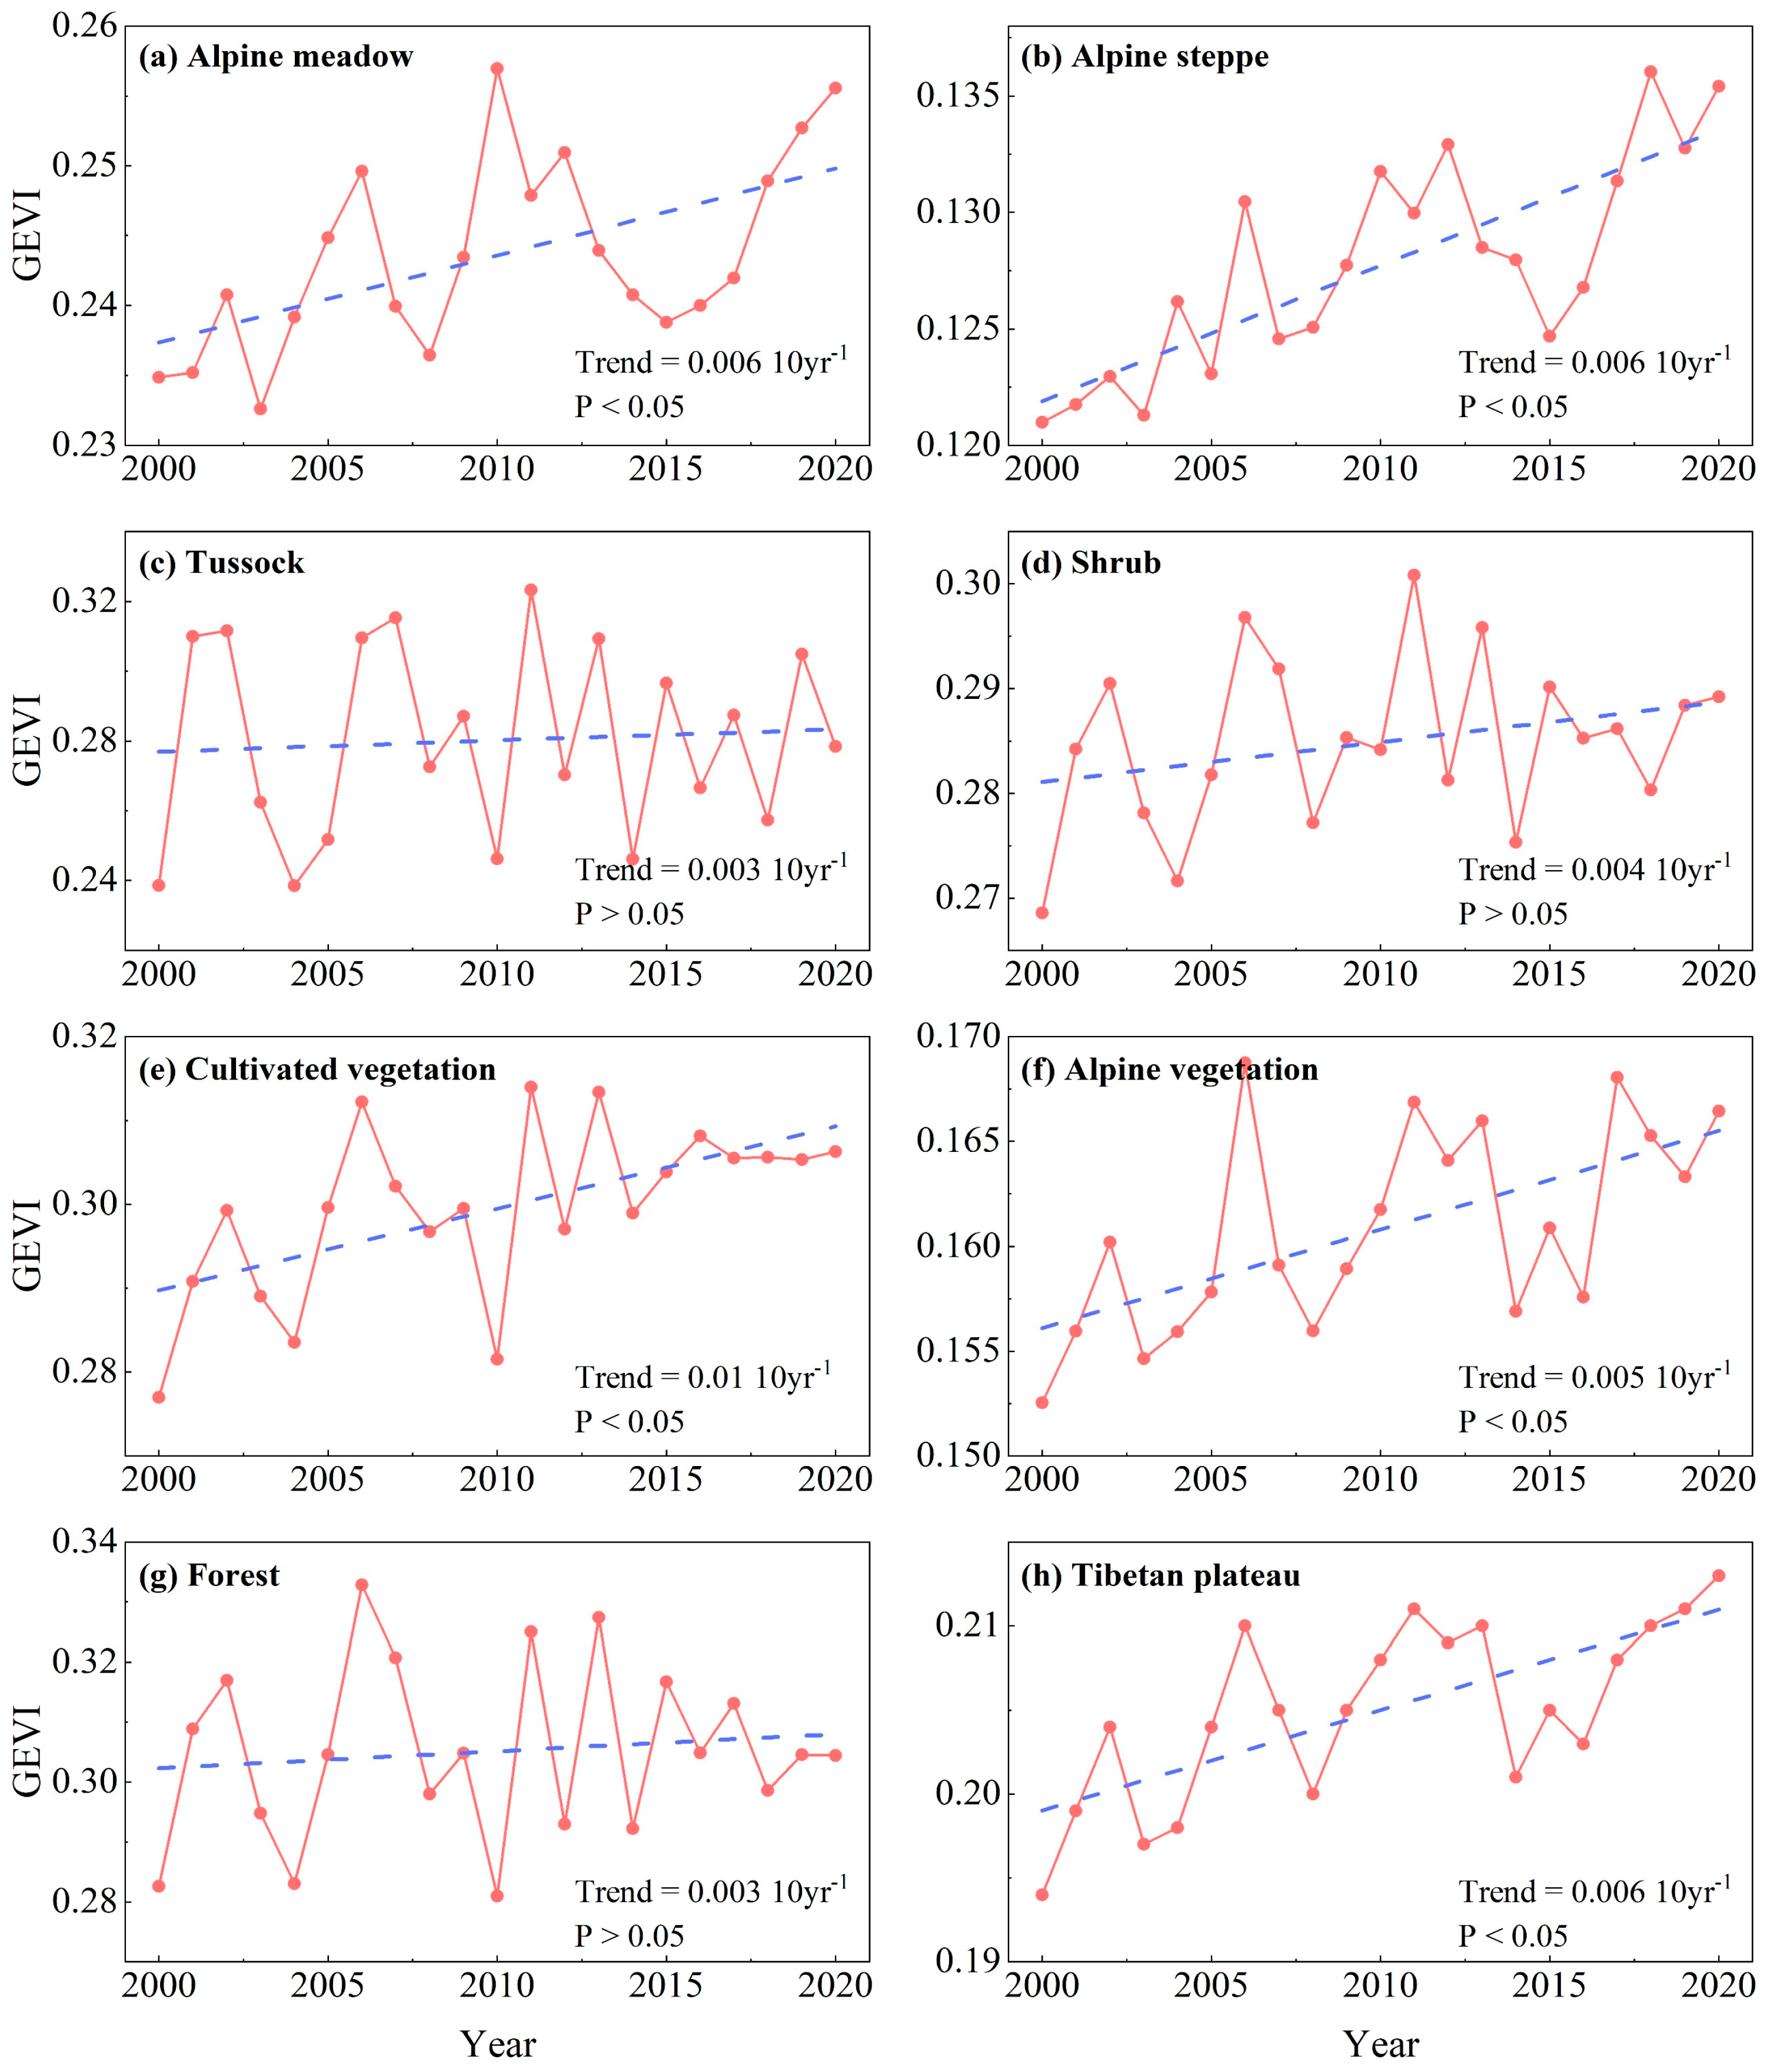
To analyze the spatio-temporal variations of vegetation on the QTP from 2000 to 2020 by vegetation type, the spatial distribution of the multi-year average vegetation GEVI and the interannual variations of the GEVI by vegetation type were extracted based on the 1:1,000,000 vegetation types of China. The GEVI across the QTP exhibited a distribution pattern characterized by low values in the northwest and high values in the southeast (Figure 3). The vast majority of the area displayed a vegetation GEVI of less than 0.25, encompassing approximately 80% of the total vegetation zone area. Across the entirety of the QTP, the interannual variation in the GEVI displayed a significant increasing trend (slope = 0.006 10 yr−1, p < 0.01). Although all types of vegetation on the QTP showed an increasing trend in the interannual variation of the GEVI, only alpine steppe, alpine meadow, alpine vegetation, and cultivated vegetation showed significant increases (Figure 4). The most substantial increase in the GEVI, amounting to 0.01 10 yr−1, was noted in cultivated vegetation (Figure 4). The trends of the vegetation GEVI at different altitudes were inconsistent. In low-altitude regions (< 1000   m ), the vegetation GEVI exhibited a non-significant decrease (Figure 5). Conversely, at middle ( 1000   m ~ 3500   m ), high ( 3500   m ~ 5000   m ), and extremely high altitudes (> 5000   m ), the vegetation GEVI displayed a significant increasing trend, with the most substantial increase of 0.012 10 yr−1 observed at middle altitudes (Figure 5).
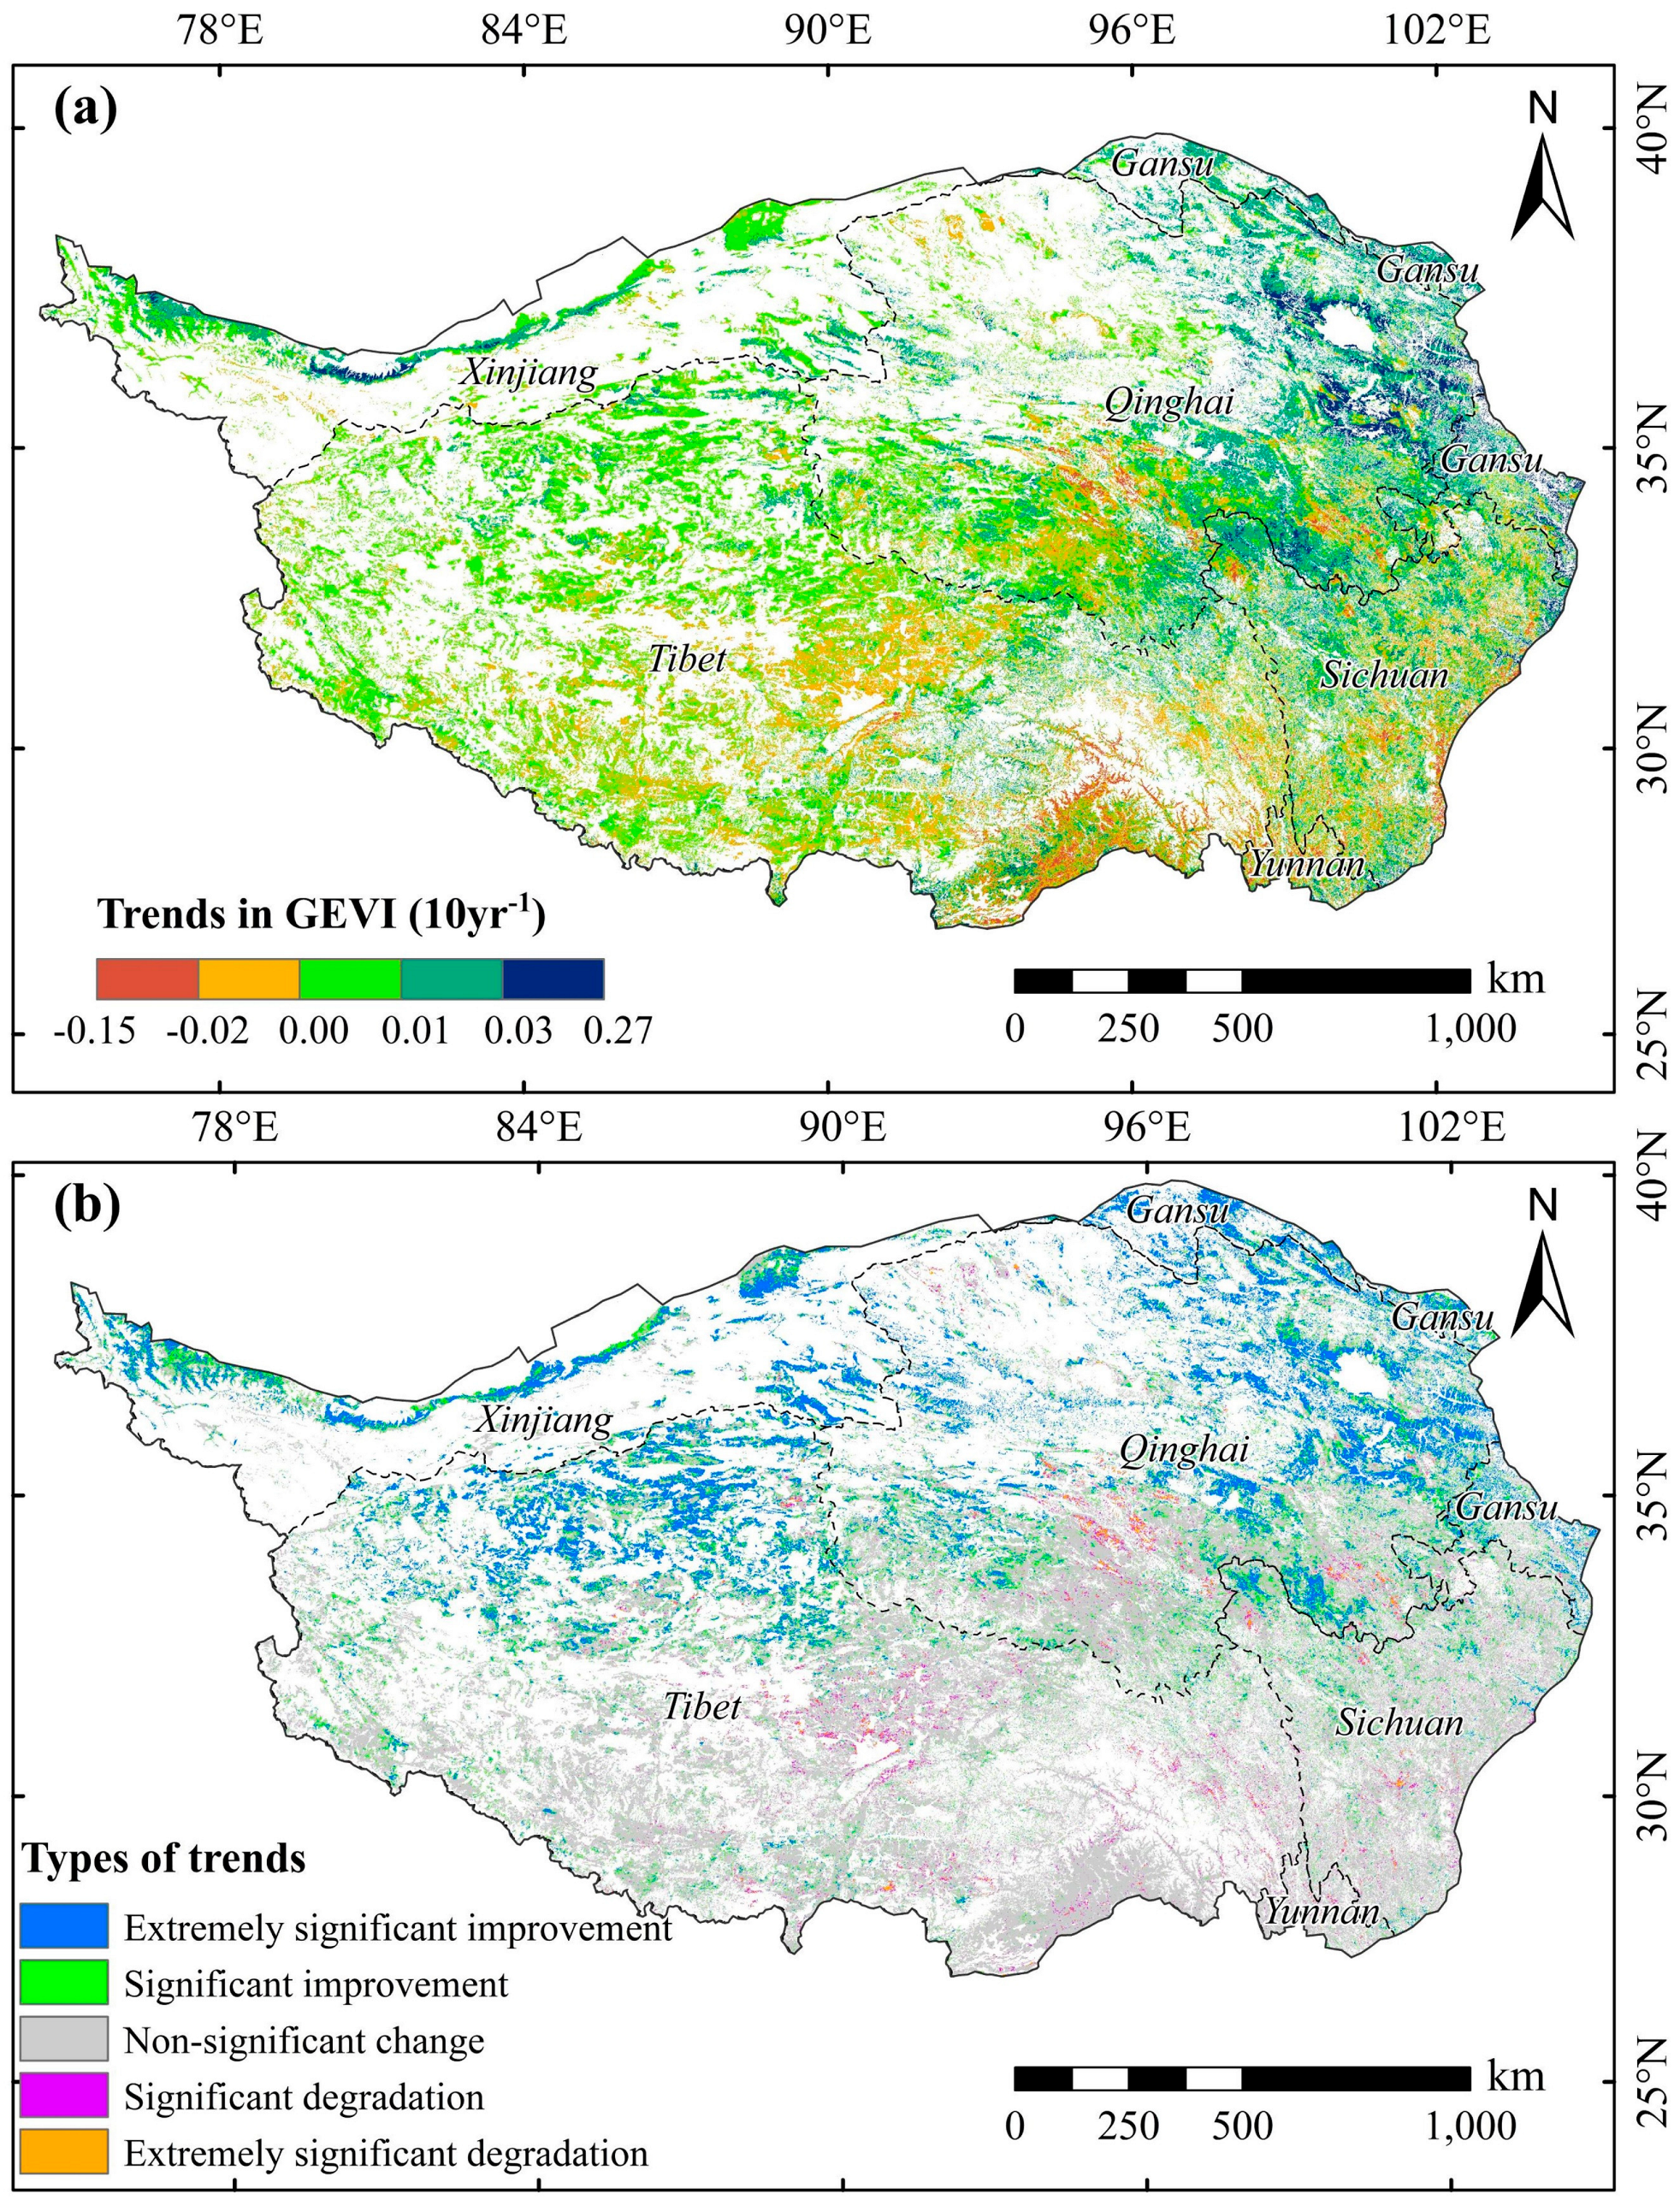
Clarifying the trend of interannual vegetation change is a prerequisite for investigating the driving mechanisms of vegetation change on the QTP. Therefore, GEVI trends were extracted for the vegetation pixels using the multi-period land-use dataset on a pixel-by-pixel basis. During the period 2000~2020, approximately 75% of vegetation areas across the QTP exhibited an increasing trend in the GEVI, primarily observed in the northern part of the plateau. Conversely, areas with a decreasing GEVI constituted around 25% of the total vegetation area, predominantly located in the central and southern parts of the plateau (Figure 6a, Table 1). The interannual variation of the GEVI exhibited an extremely significant increase in approximately 19% of vegetation areas, primarily concentrated in the northeast and northwest regions (Figure 6b, Table 1). Additionally, around 12% of vegetation areas showed a significant increase, dispersed throughout the areas with extremely significant increases (Figure 6b, Table 1). Areas with non-significant variation were widespread, encompassing approximately 67% of the total vegetation area (Figure 6b, Table 1). In contrast, areas exhibiting significant and extremely significant decreases in the GEVI comprised only about 2% of the total vegetation area, mainly situated in the central and southern regions of the plateau (Figure 6b, Table 1).

4.2. Time-Lag Response of Vegetation GEVI to Climate

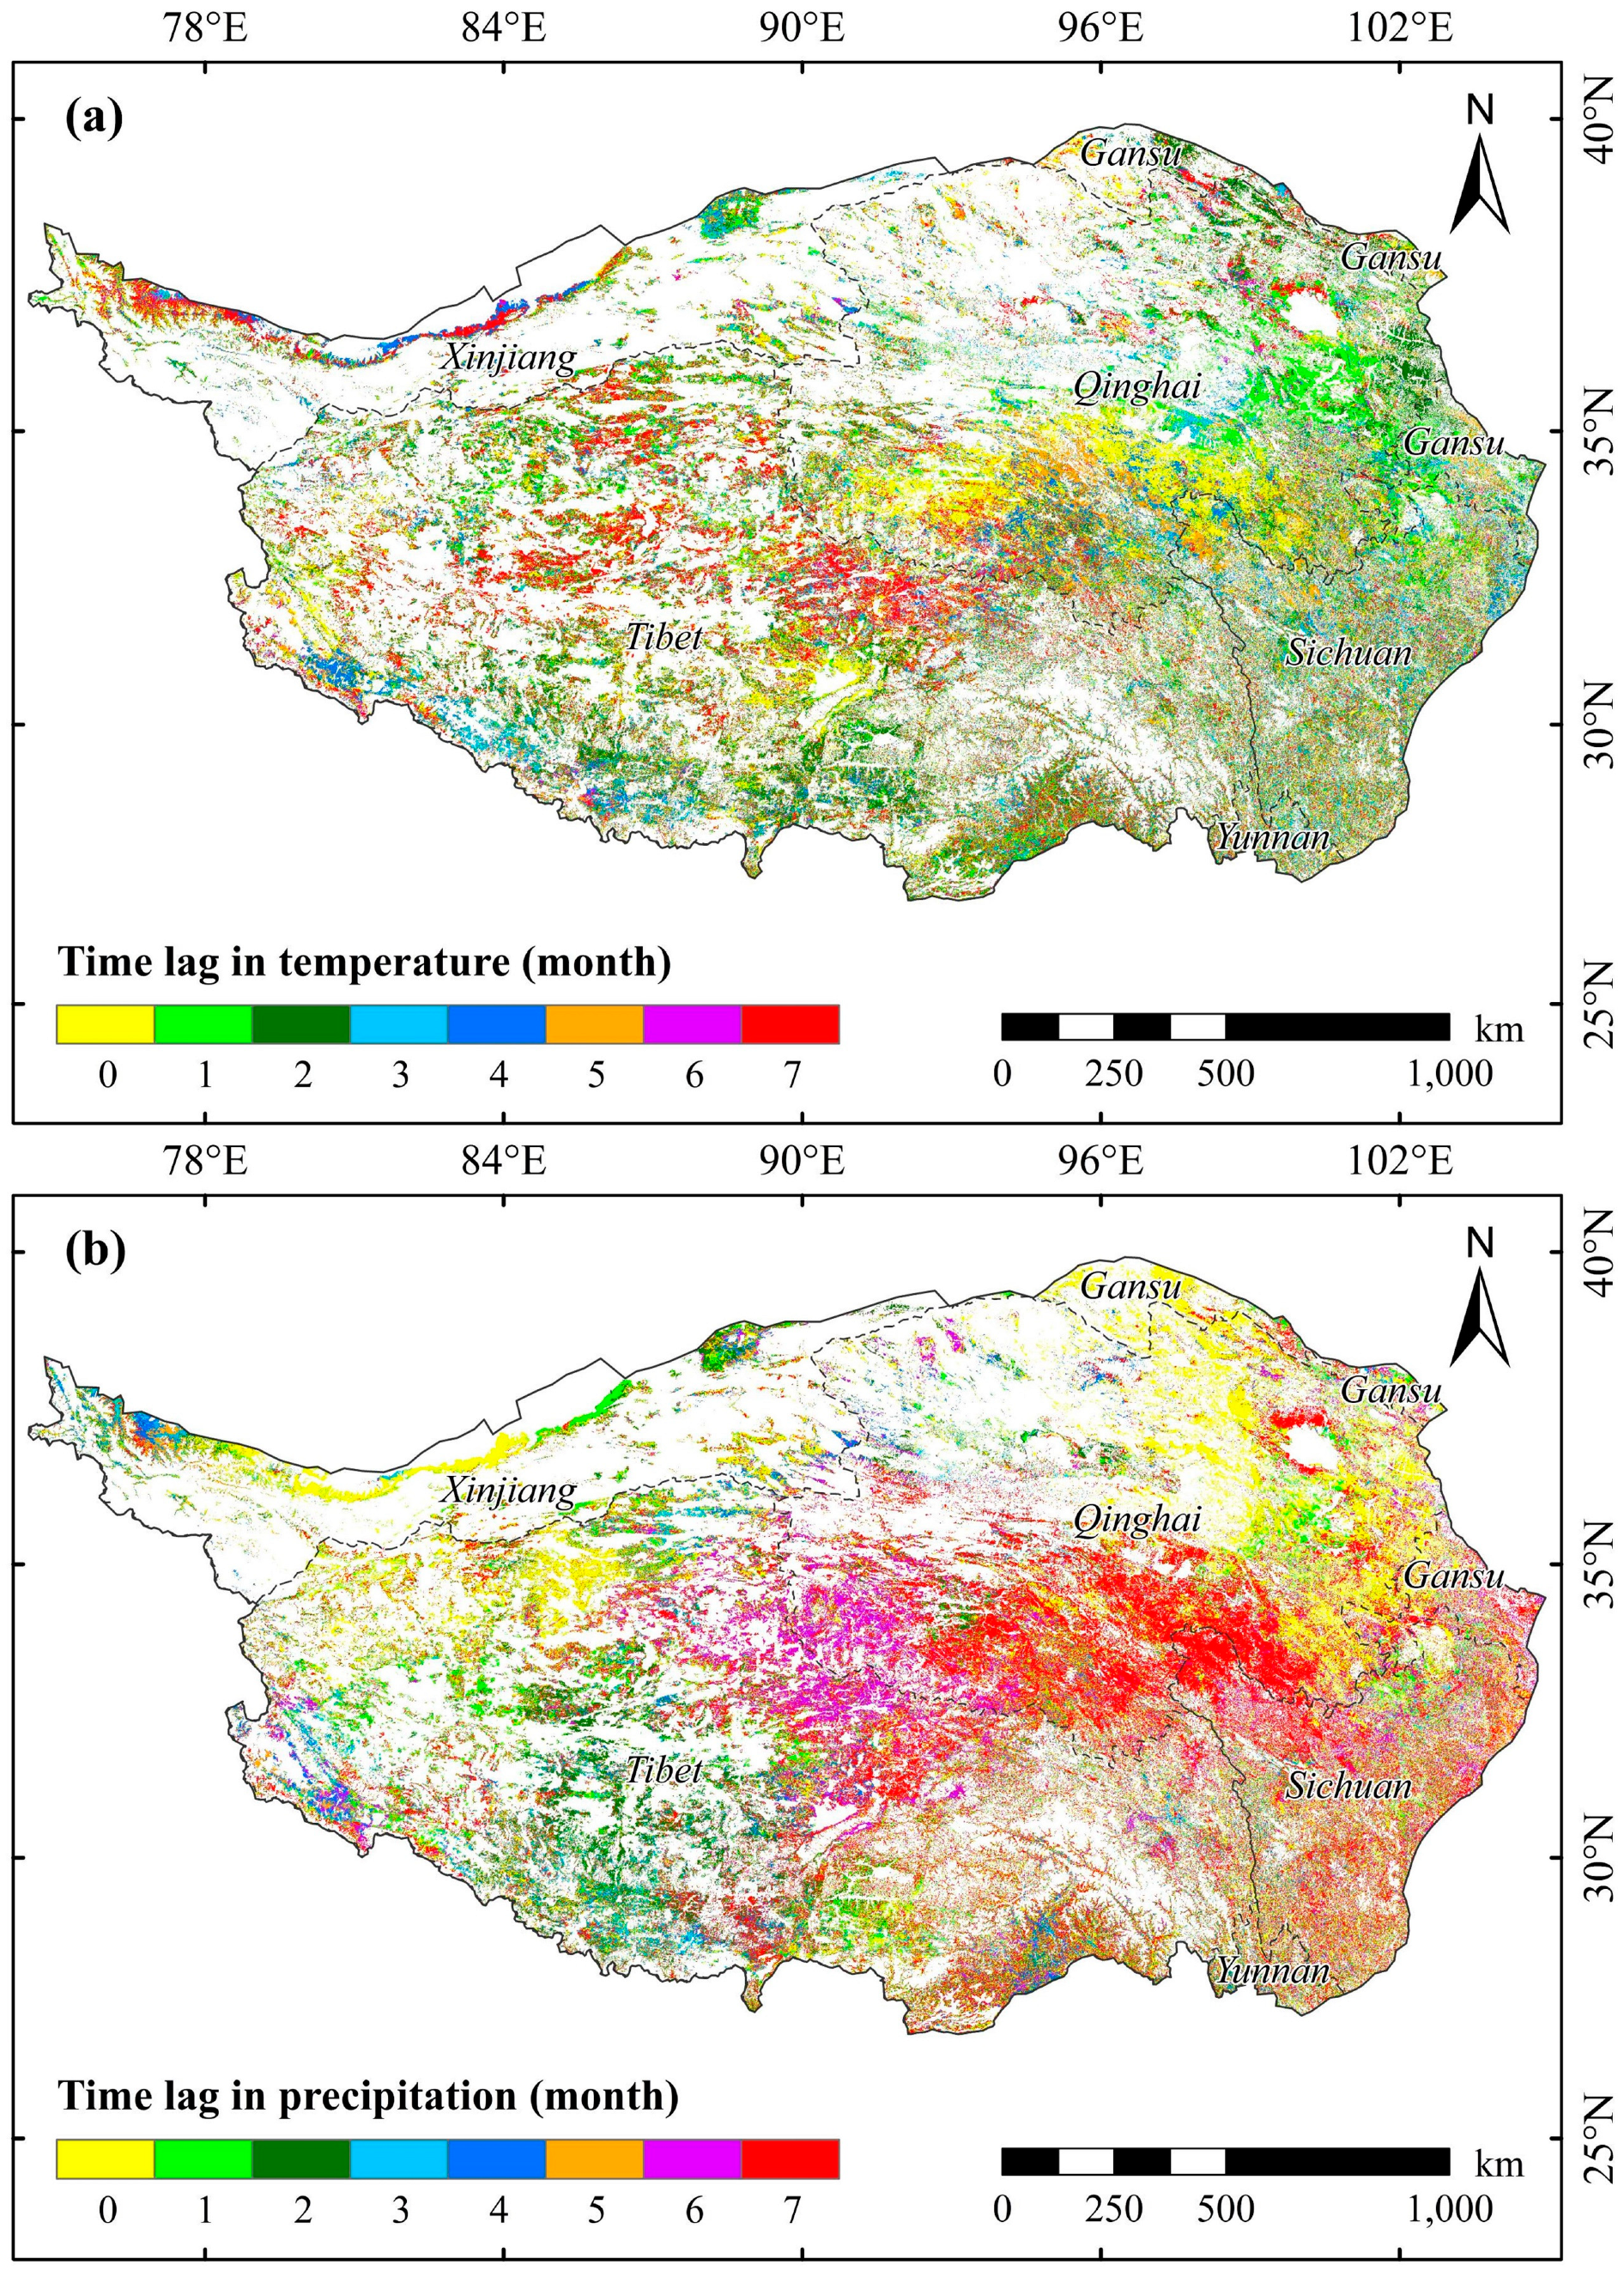
This study conducted an analysis of the lagged response of the vegetation GEVI to temperature and precipitation on a pixel-by-pixel basis. The number of lagged months for both climate factors were determined through calculation. Over the past two decades, the time-lag effect of temperature on the vegetation GEVI across the QTP exhibited notable spatial differentiation without significant spatial aggregation (Figure 7a). In the Sanjiangyuan region, characterized by widespread alpine meadows, the lag time of temperature was recorded as 0, indicating that temperature during the growing season singularly influenced vegetation growth (Figure 7a). Conversely, in the northern part of Tibet, characterized by extensive alpine steppes, the dominant lag time of temperature was 7 months, suggesting that vegetation growth was influenced not only by temperature during the growing season but also by temperature during the non-growing season (Figure 7a). In other regions, the predominant lag time of temperature ranged from 1 to 2 months (Figure 7a). Spatial analysis revealed that in the QTP, the lag time of temperature was predominantly 0 and 7 months, accounting for about 39% of the vegetation pixels. Pixels with a lag time of 1–2 months accounted for 30.8% of the vegetation pixels. Additionally, a similar proportion of pixels exhibited lag times of 3, 4, and 5 months, accounting for a total of 30.2% of all pixels. A small fraction of pixels exhibited a 6-month lag, comprising only 2.5% of the total (Figure 7a).
The lag effect of precipitation on the vegetation GEVI exhibited considerable spatial heterogeneity, accompanied by significant spatial aggregation (Figure 7b). In the eastern part of Qinghai Province, precipitation did not demonstrate a lag effect on vegetation growth (Figure 7b). However, in the Sanjiangyuan region, the lagged response of vegetation to precipitation was pronounced, with a dominant lag length of 7 months (Figure 7b). Along the border between the Sanjiangyuan region and the northern part of Tibet, the lag length of precipitation was primarily 6 months (Figure 7b). In the southwestern part of the QTP, the lag length of precipitation was predominantly 2 months (Figure 7b). Spatial analysis of precipitation lag time revealed that approximately 57% of total vegetation pixels exhibited either no lag or a 7-month lag. Pixels with lag times of 1, 2, and 6 months comprised roughly 31% of the total, while approximately 12% of vegetation exhibited lag times ranging from 3 to 5 months (Figure 7b).
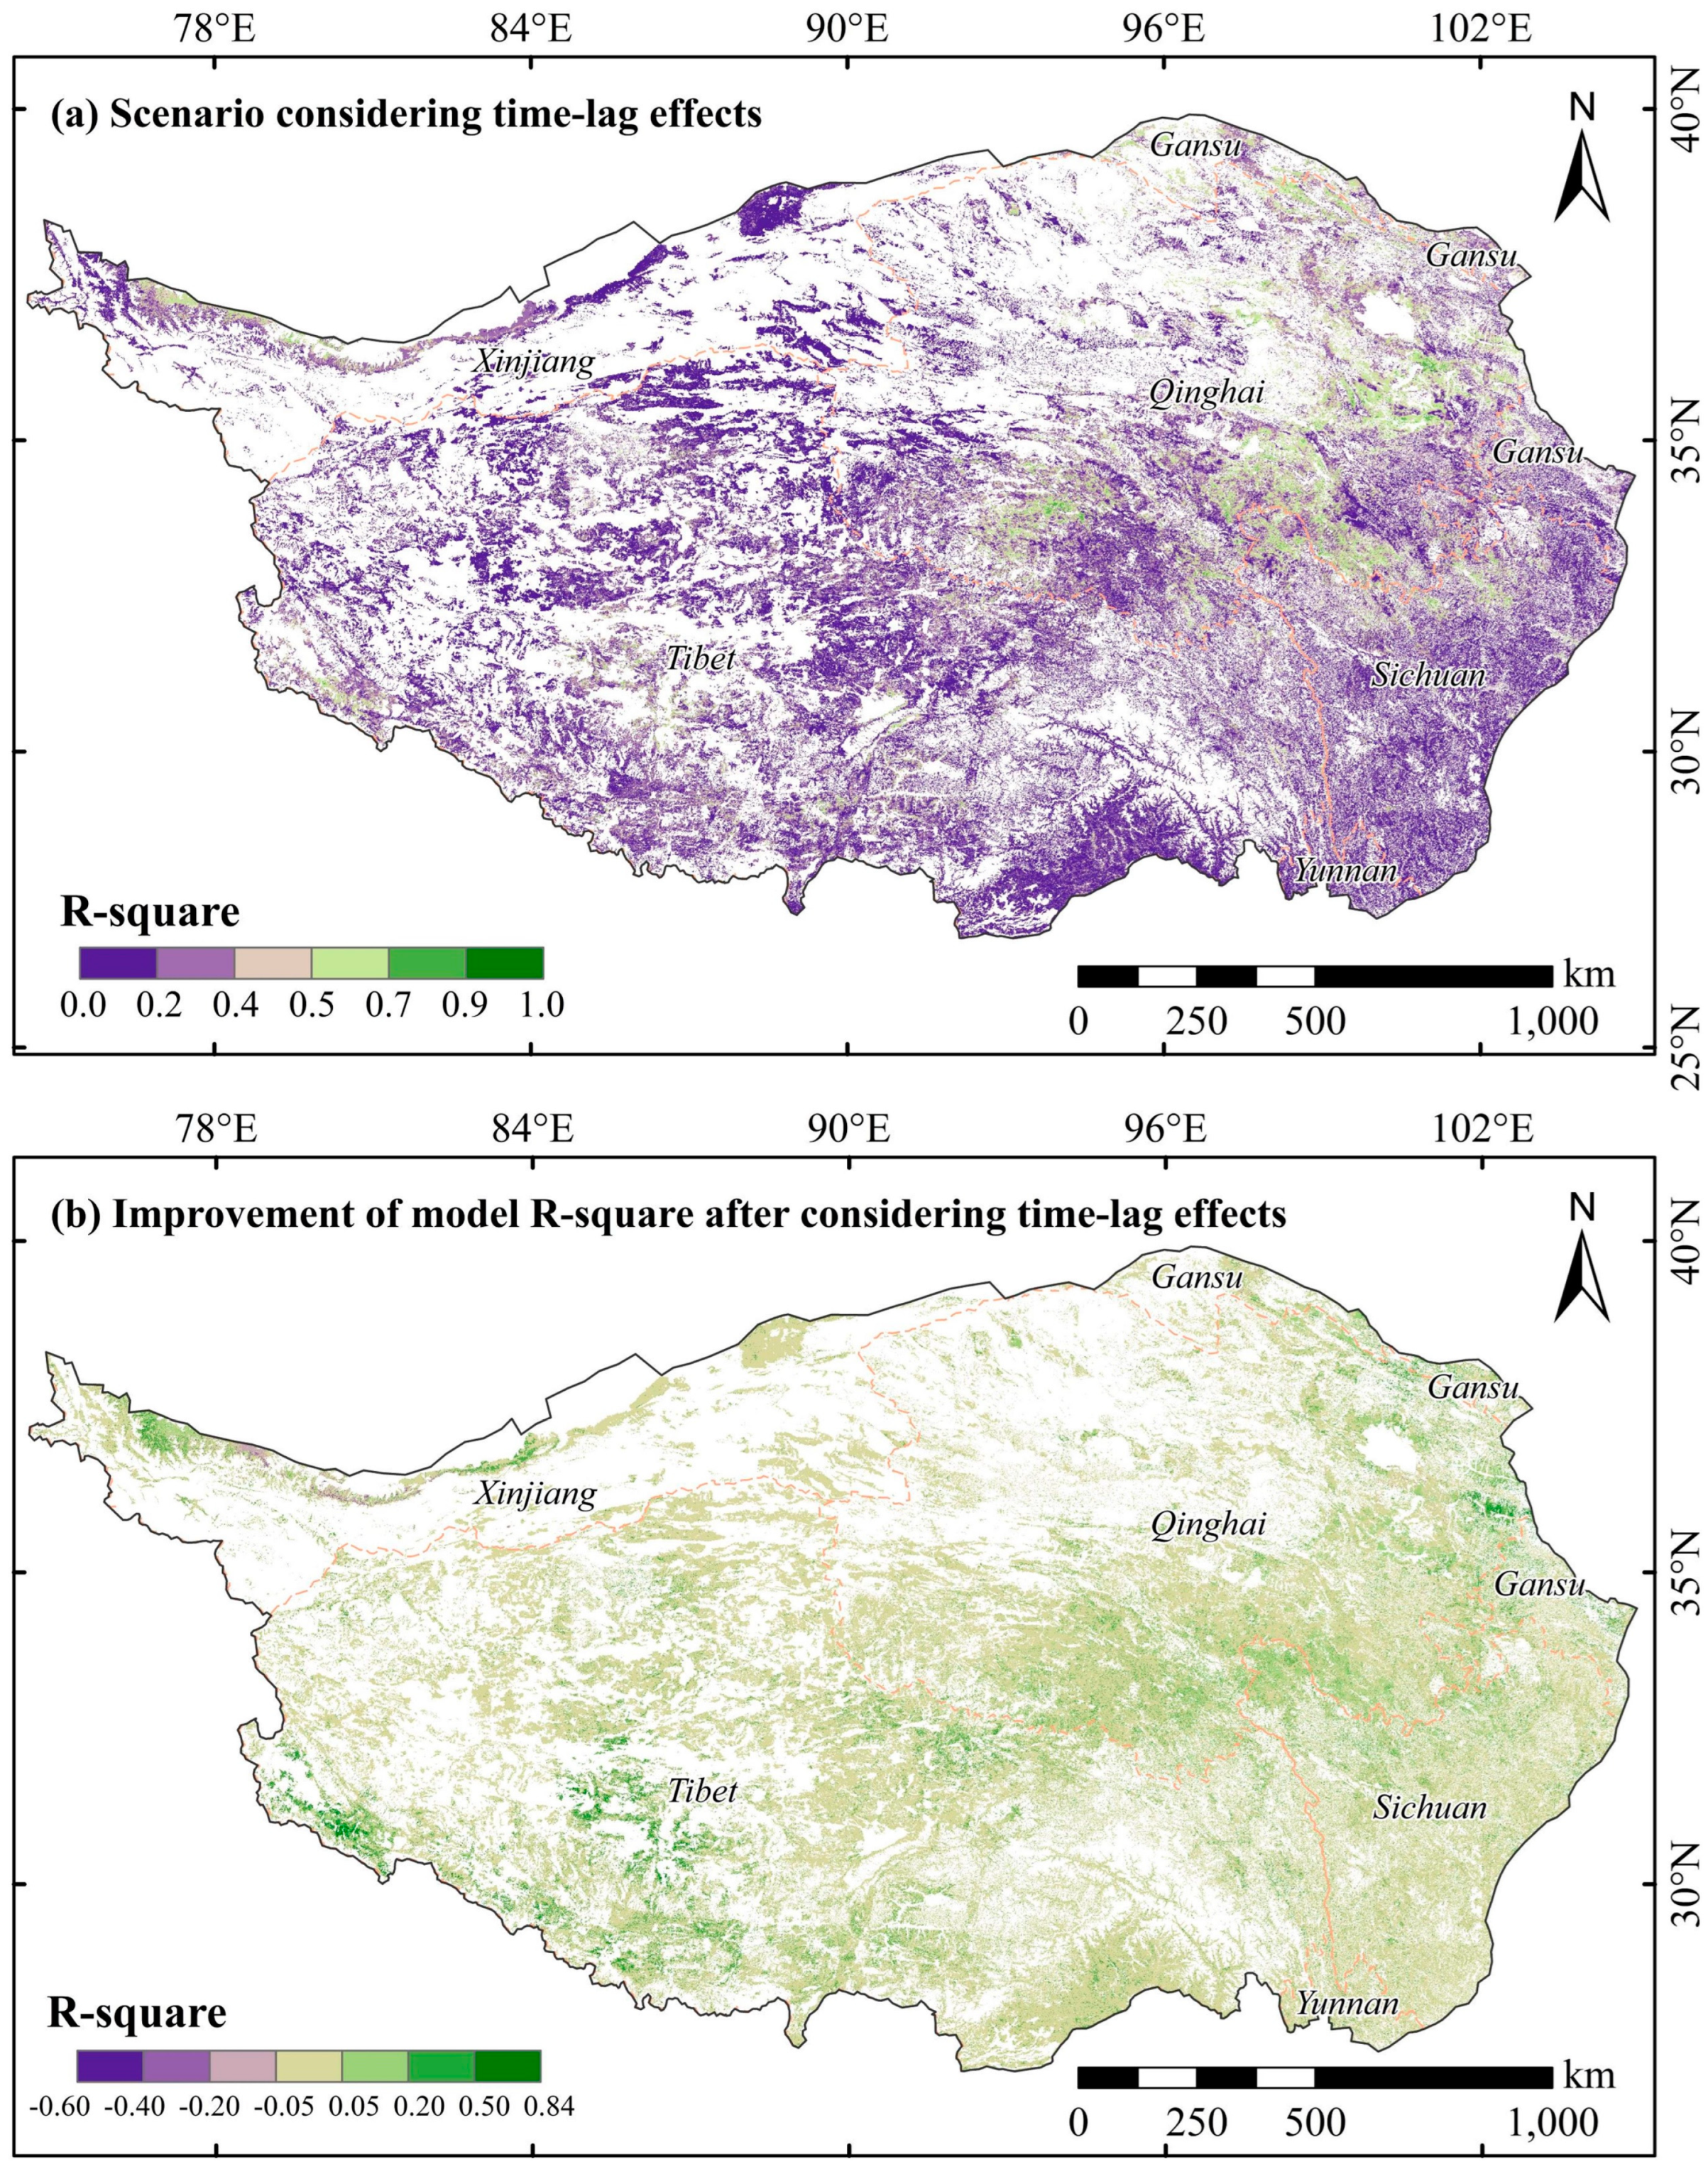
When not accounting for lag effects, the explanatory power (R2) of climate on interannual variations in the GEVI ranged from 0 to 0.91, with a mean value of merely 0.19. Areas with R2 exceeding 0.5 constituted only approximately 5.8% of the total vegetation area. However, upon considering lag effects, the explanatory power of climate significantly improved, with the mean R2 value increasing to 0.25. Moreover, areas with R2 greater than 0.5 accounted for approximately 9.7% of the total vegetation area, marking a 3.9% increase compared to scenarios where lag effects were not considered (Figure 8a). The enhancement in R2 of the linear model after considering the lag effects was calculated pixel by pixel, with its spatial distribution depicted in Figure 8b. Notably, after considering lag effects, instances of the decreasing explanatory power of climate were minimal. Conversely, approximately 29% of the total vegetation area exhibited phenomena of increasing explanatory power, primarily situated in the southern and eastern regions of Qinghai Province, as well as in the central and eastern parts of Tibet (Figure 8b). However, for pixels encompassing roughly 69% of the total vegetation area on the QTP, there was no significant change in model R2 after considering lag effects. This observation could be attributed to intense human activities disrupting the correlation between climate and vegetation productivity, thereby overshadowing the climate’s control of vegetation productivity.

4.3. Identification of Drivers for Vegetation Change

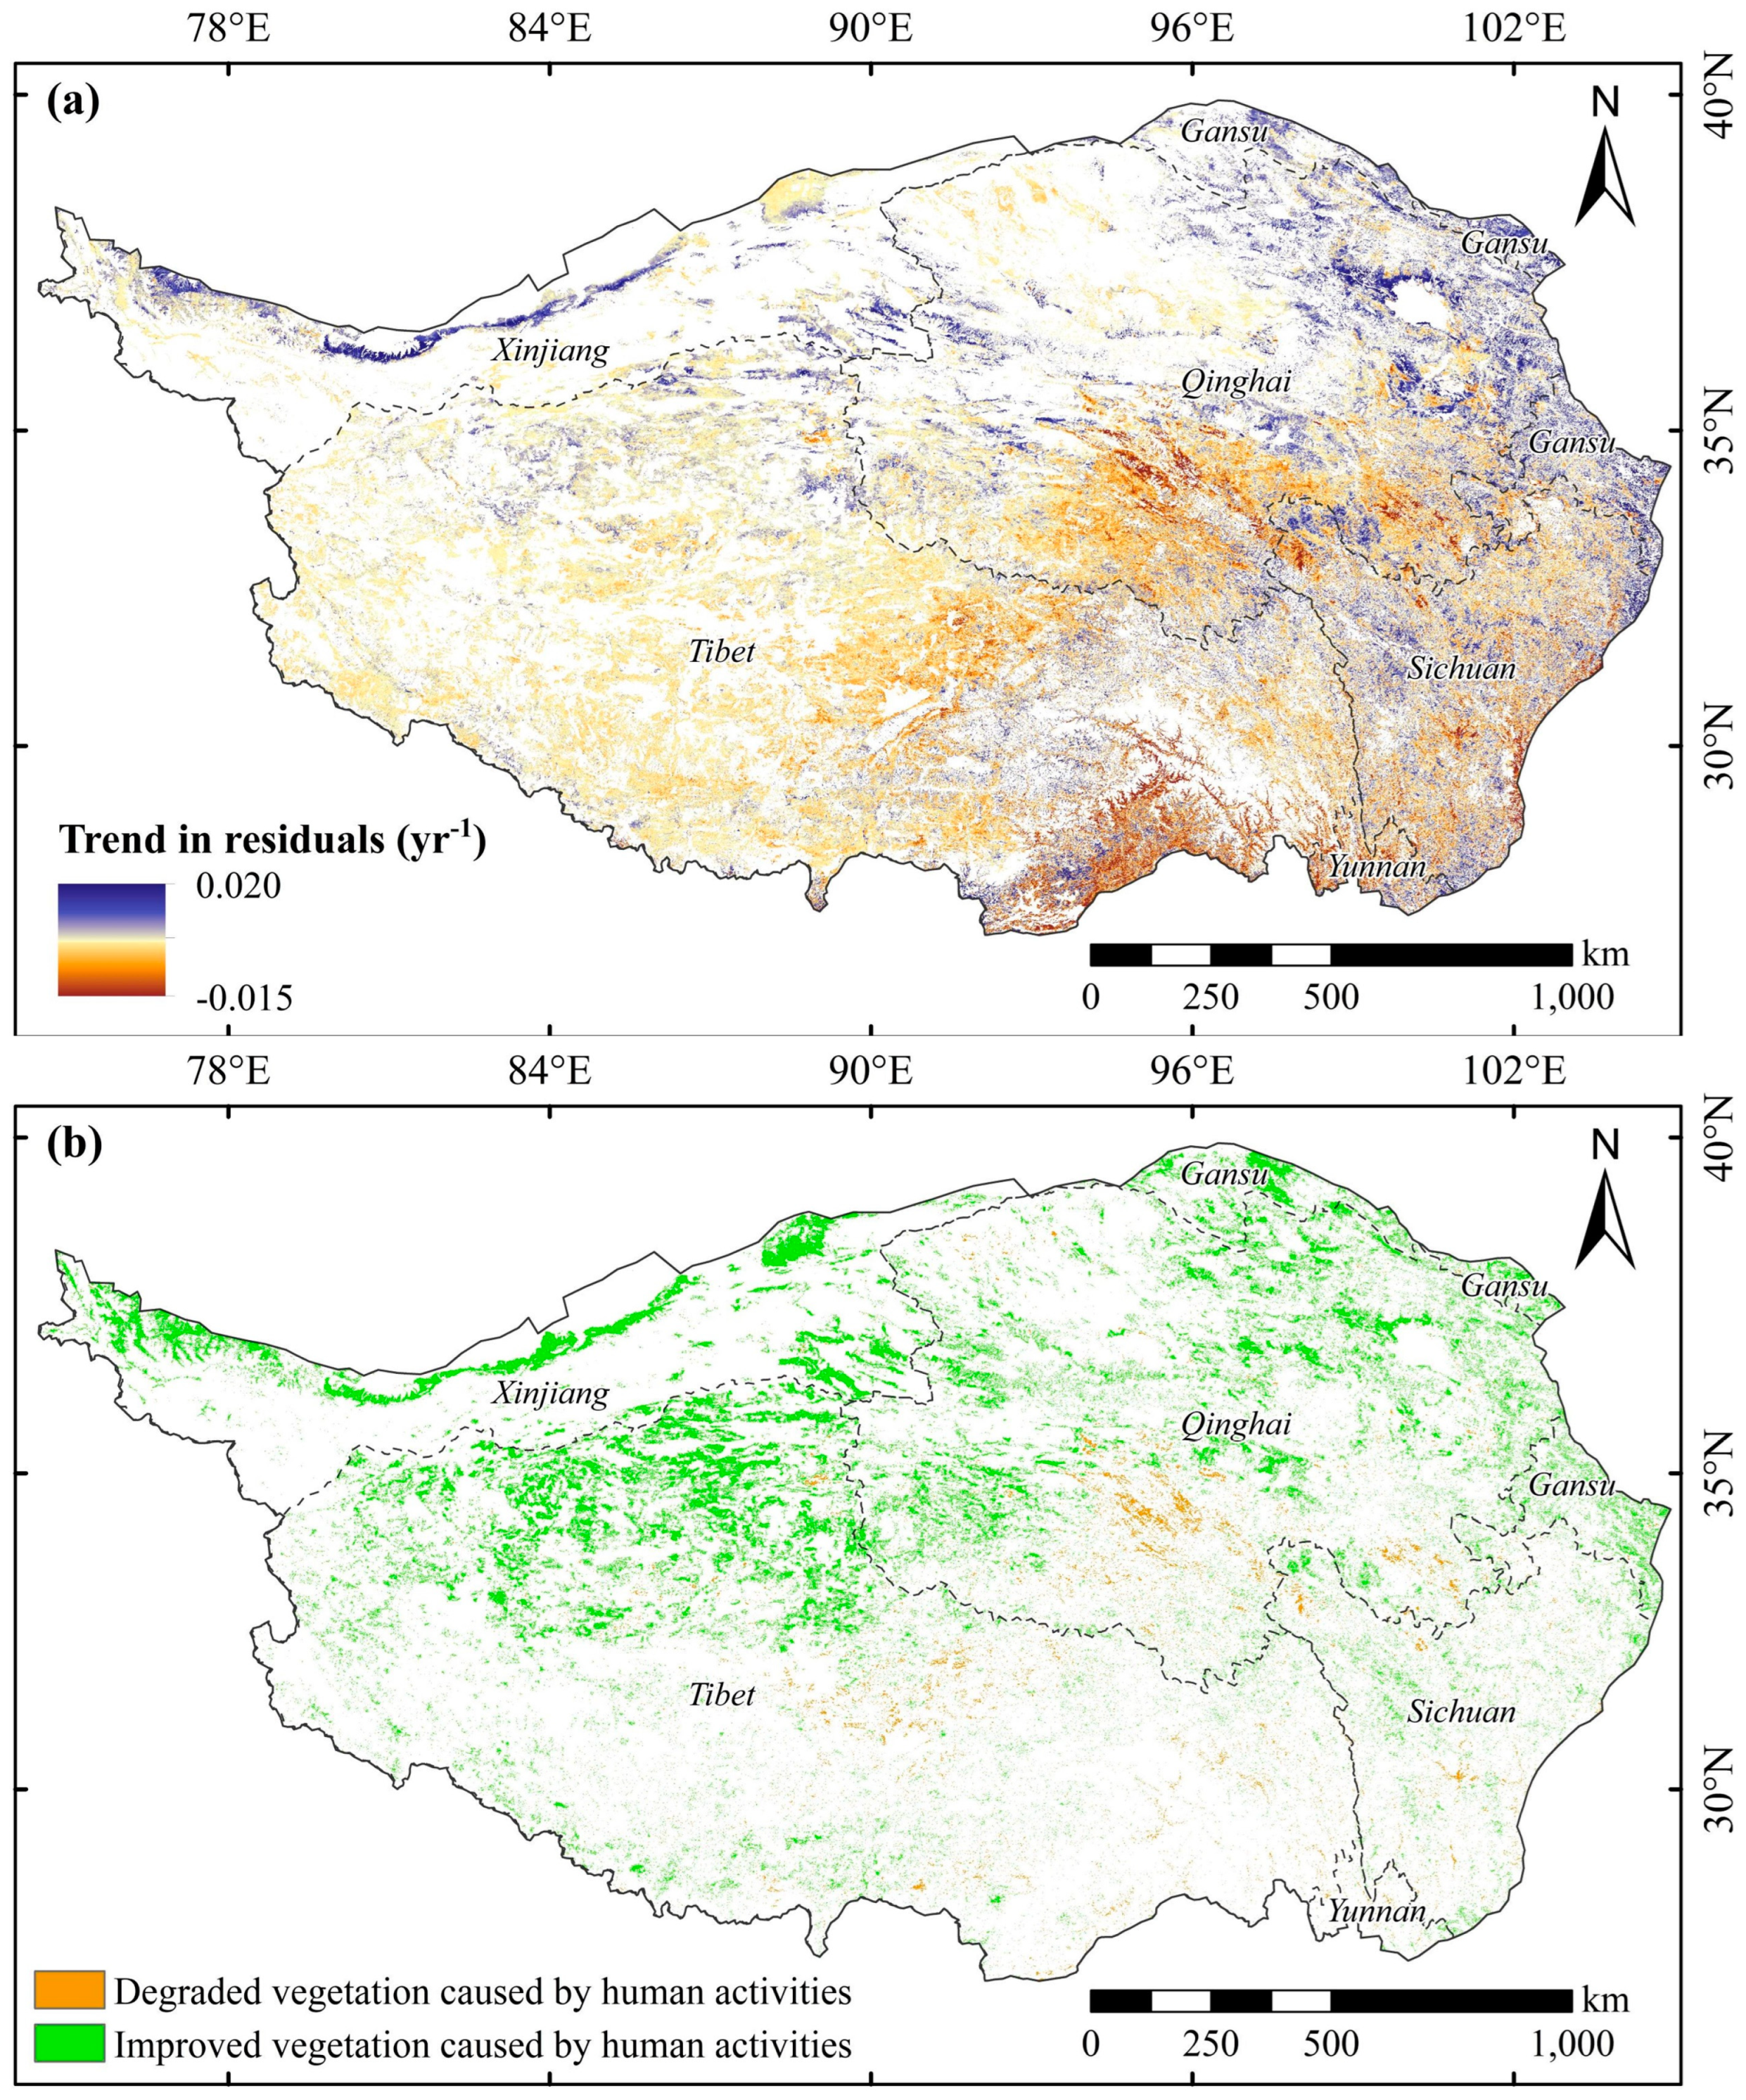
Based on the driver identification framework in Section 3.2, this study calculated the residual series of the GEVI on a pixel-by-pixel basis by constructing a linear response model of the vegetation GEVI to climate factors, considering time-lag effects. Spatial statistics of the residual trends (Figure 9a) unveiled several key findings: Approximately 26% of the total vegetation area exhibited significant residual trends, indicating that interannual variation in vegetation within these regions were not solely driven by climate but also influenced by human activities (Figure 9b). Specifically, areas where human activities positively impacted vegetation growth constituted about 23% of the total vegetation area, primarily concentrated in the northern and central-western regions of the QTP (Figure 9b). Conversely, regions where human activities negatively affected vegetation growth accounted for a relatively small proportion, approximately 3%, primarily distributed in parts of the Sanjiangyuan region and central part of Tibet (Figure 9b). These areas are located in typical pastoral regions of the QTP, where high-intensity grazing and infestations of rodent and insect pests may lead to vegetation degradation [37,38]. However, it is noteworthy that the areas where vegetation growth has been positively influenced by human activities over the past two decades are significantly larger than those where it has been inhibited. This phenomenon can be attributed to extensive ecological restoration and environmental protection initiatives implemented by the Chinese Government across the QTP over an extended period [39]. These efforts have effectively restored and enhanced the local vegetation ecosystem.
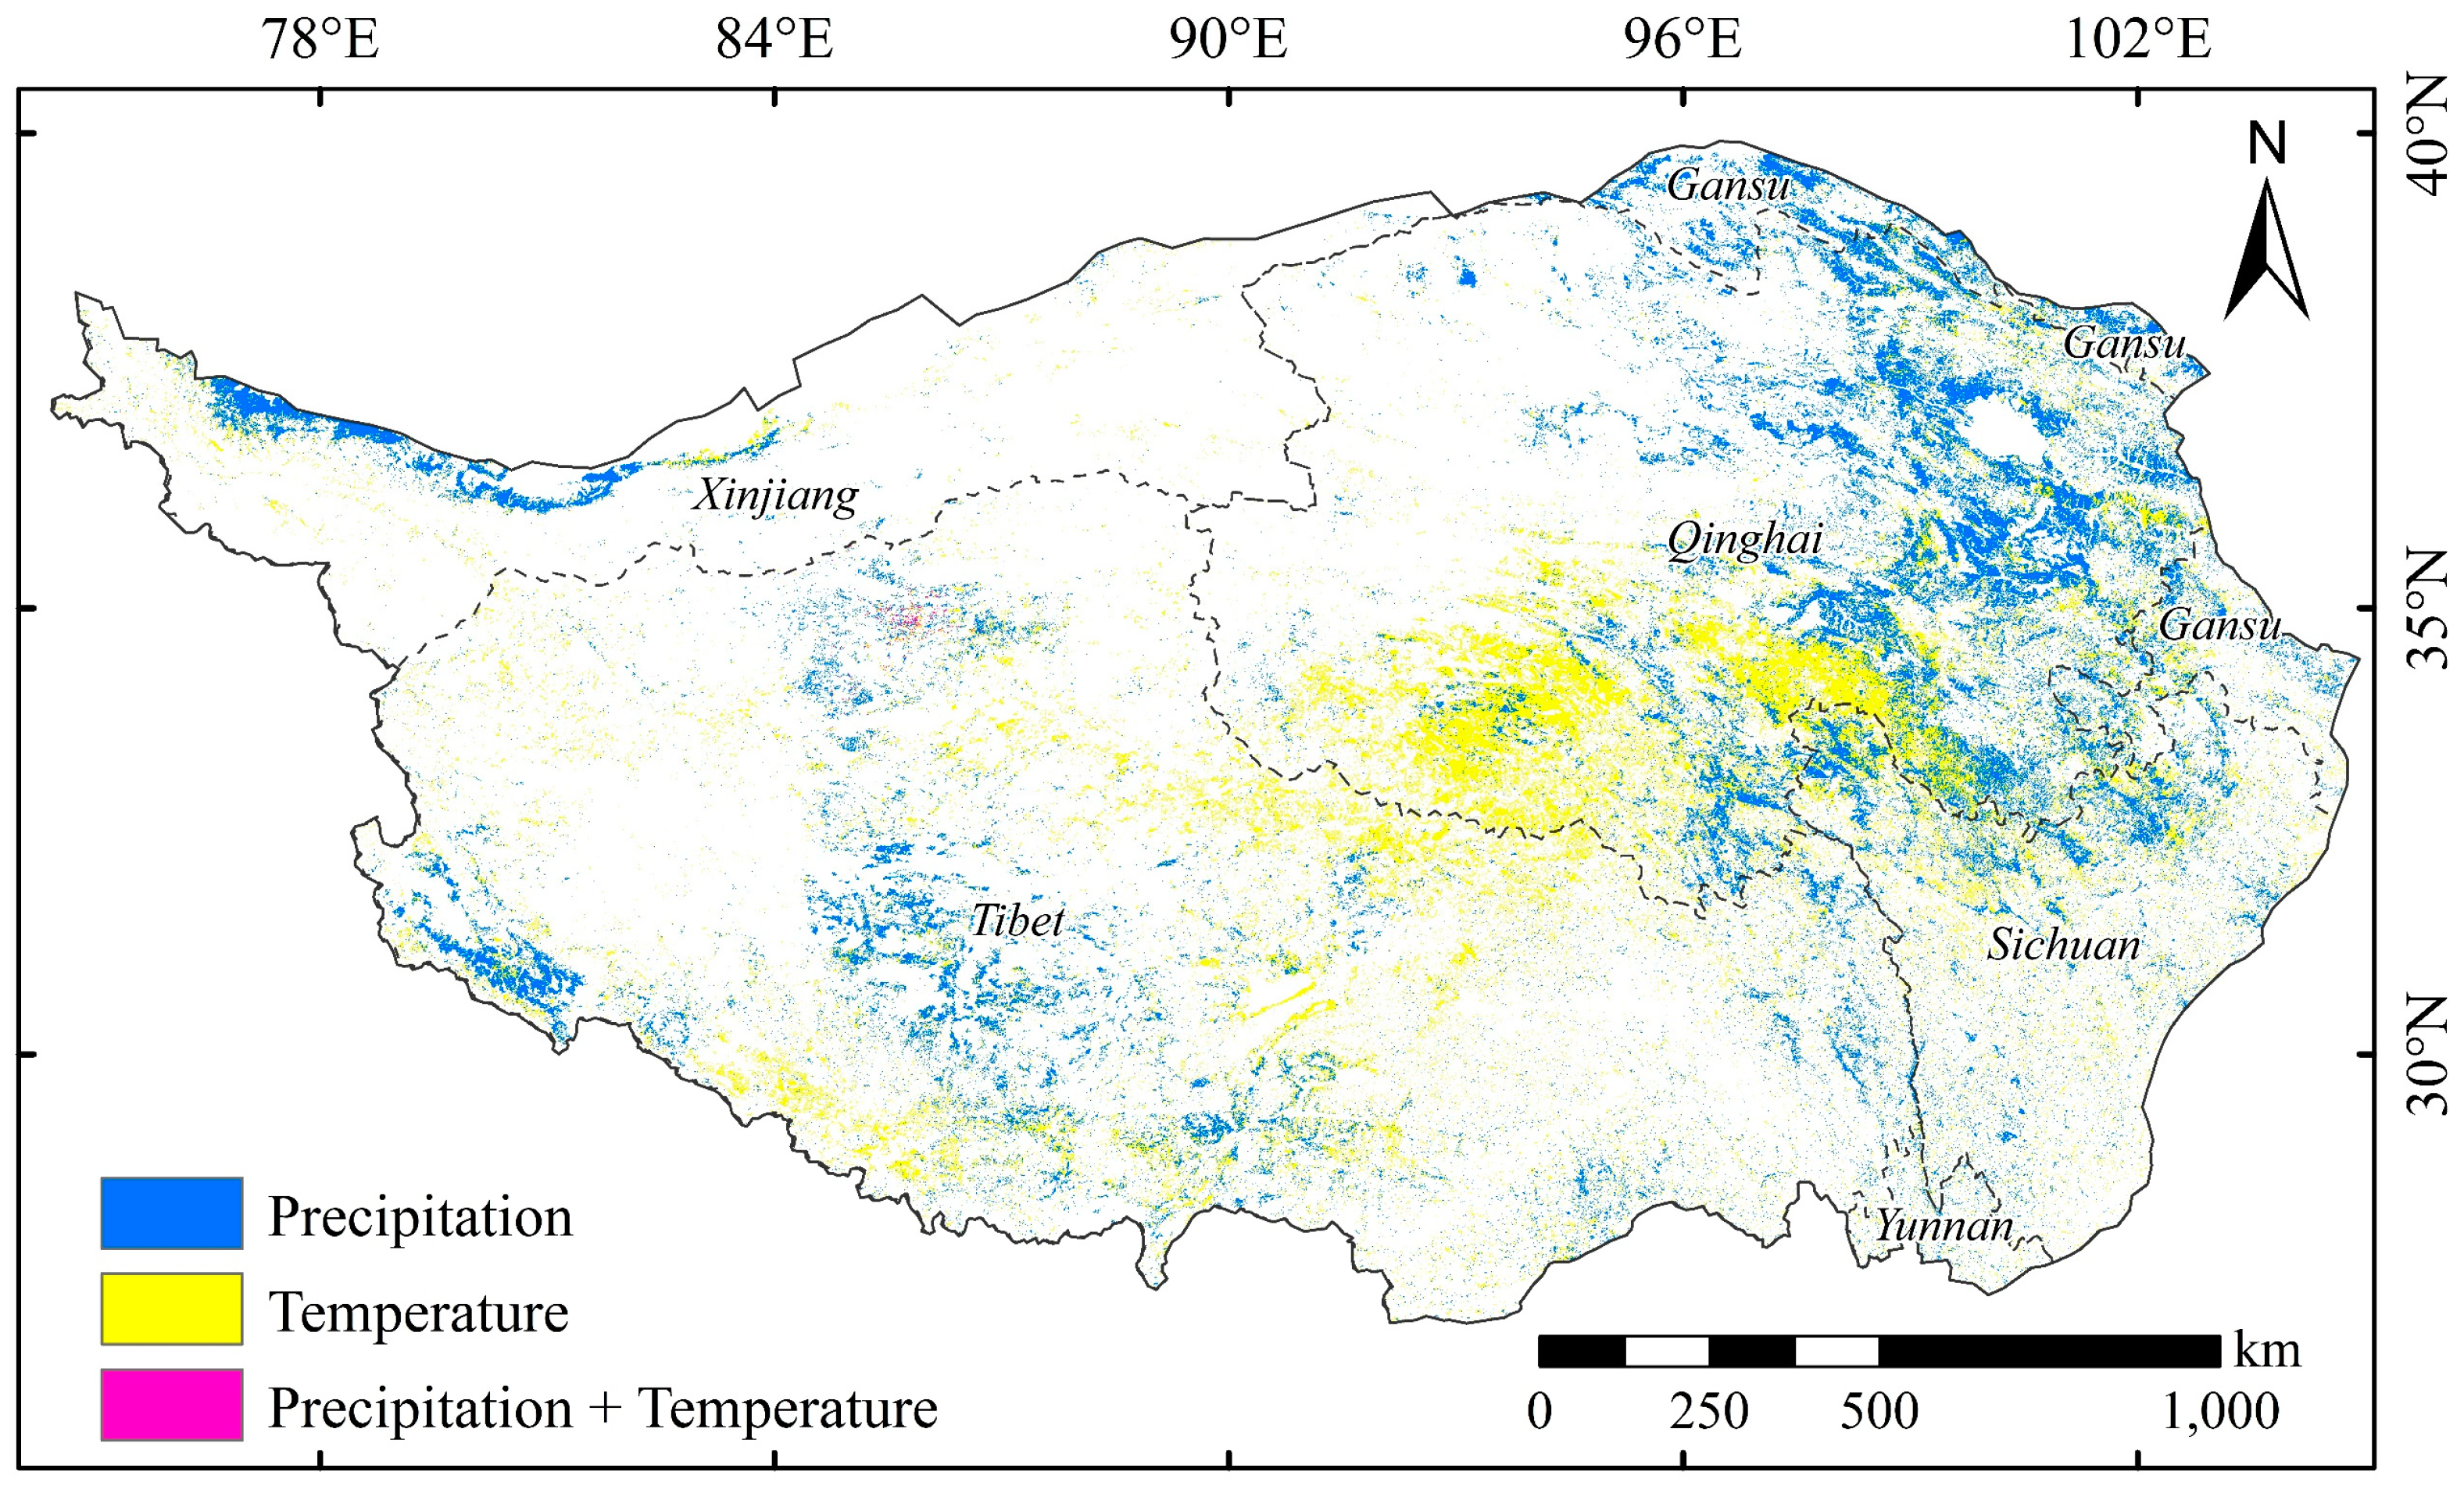
In this study, areas where vegetation change is solely driven by climate were examined to identify the primary climatic factor influencing this change. This identification was achieved by comparing the bias correlation of temperature and precipitation, respectively, with the GEVI. Through spatial statistics, several notable findings emerged: The spatial distribution of the driving factor exhibited a distinct clustering phenomenon (Figure 10). The areas where temperature dominated vegetation change accounted for 47% of the total area affected solely by climate. The areas are primarily located in the Sanjiangyuan region, the central region and the southern edge of Tibet (Figure 10). Precipitation-dominated areas accounted for about 53% of the total area affected solely by climate and are primarily situated in the northeastern and western parts of the QTP (Figure 10). Conversely, the proportion of areas jointly dominated by precipitation and temperature was minimal, comprising only 0.12% of the total area, with no significant spatial aggregation (Figure 10). The strict determination criterion, which required the bias correlation of temperature with the GEVI to be equal to that of precipitation with the GEVI, resulted in a much smaller proportion of this driver type than is observed in reality.
In this study, the QTP was divided into 12 climate zones by superimposing temperature and wet/dry zones. By examining the types of climate driver within each climate zone, several significant observations were made: Across warm temperate semi-arid, mid-temperate arid, plateau temperate arid, plateau subfrigid arid, warm temperate semi-arid, plateau temperate semi-arid, and warm temperate semi-humid zones, the percentage of pixels where precipitation was identified as the dominant factor exceeded that of temperature by at least 10% (Figure 11). This supports the general conclusion that vegetation in arid regions, limited by water, is particularly sensitive to precipitation. In the plateau subfrigid semi-arid and plateau subfrigid semi-humid regions, the percentage of pixels with temperature as the dominant factor exceeded those with precipitation as the dominant factor (Figure 11). This discrepancy arises from the predominant limitation of vegetation in these regions by temperature, leading to a greater sensitivity of the vegetation’s interannual variation due to temperature. Within north subtropical humid, plateau temperate humid/semi-humid, and subtropical humid regions, where hydrothermal conditions are balanced, vegetation growth is not subjected to specific climatic stresses. Consequently, the areas dominated by precipitation are similar in proportion to those dominated by temperature (Figure 11). In low-temperature regions, rising temperatures initially alleviate temperature stress on vegetation. However, continued temperature increases exacerbate drought by enhancing evapotranspiration, negatively impacting vegetation growth. Consequently, the roles of temperature and precipitation become interchangeable, with precipitation emerging as the primary driver of vegetation change as temperatures rise. In arid regions, as more precipitation occurs, the dominant factor in vegetation change shifts from precipitation to temperature. Overall, the main climatic factors driving vegetation change within the same region vary with climate conditions. This variability explains the presence of temperature-dominated and precipitation-dominated areas within arid and cold regions, respectively.
To uncover the driving mechanisms behind the significant vegetation changes on the QTP over the past two decades, this study identified specific drivers on a pixel-by-pixel basis for vegetation areas with significant trend in the GEVI, using the constructed driver identification framework. The following results were obtained by spatial statistics:
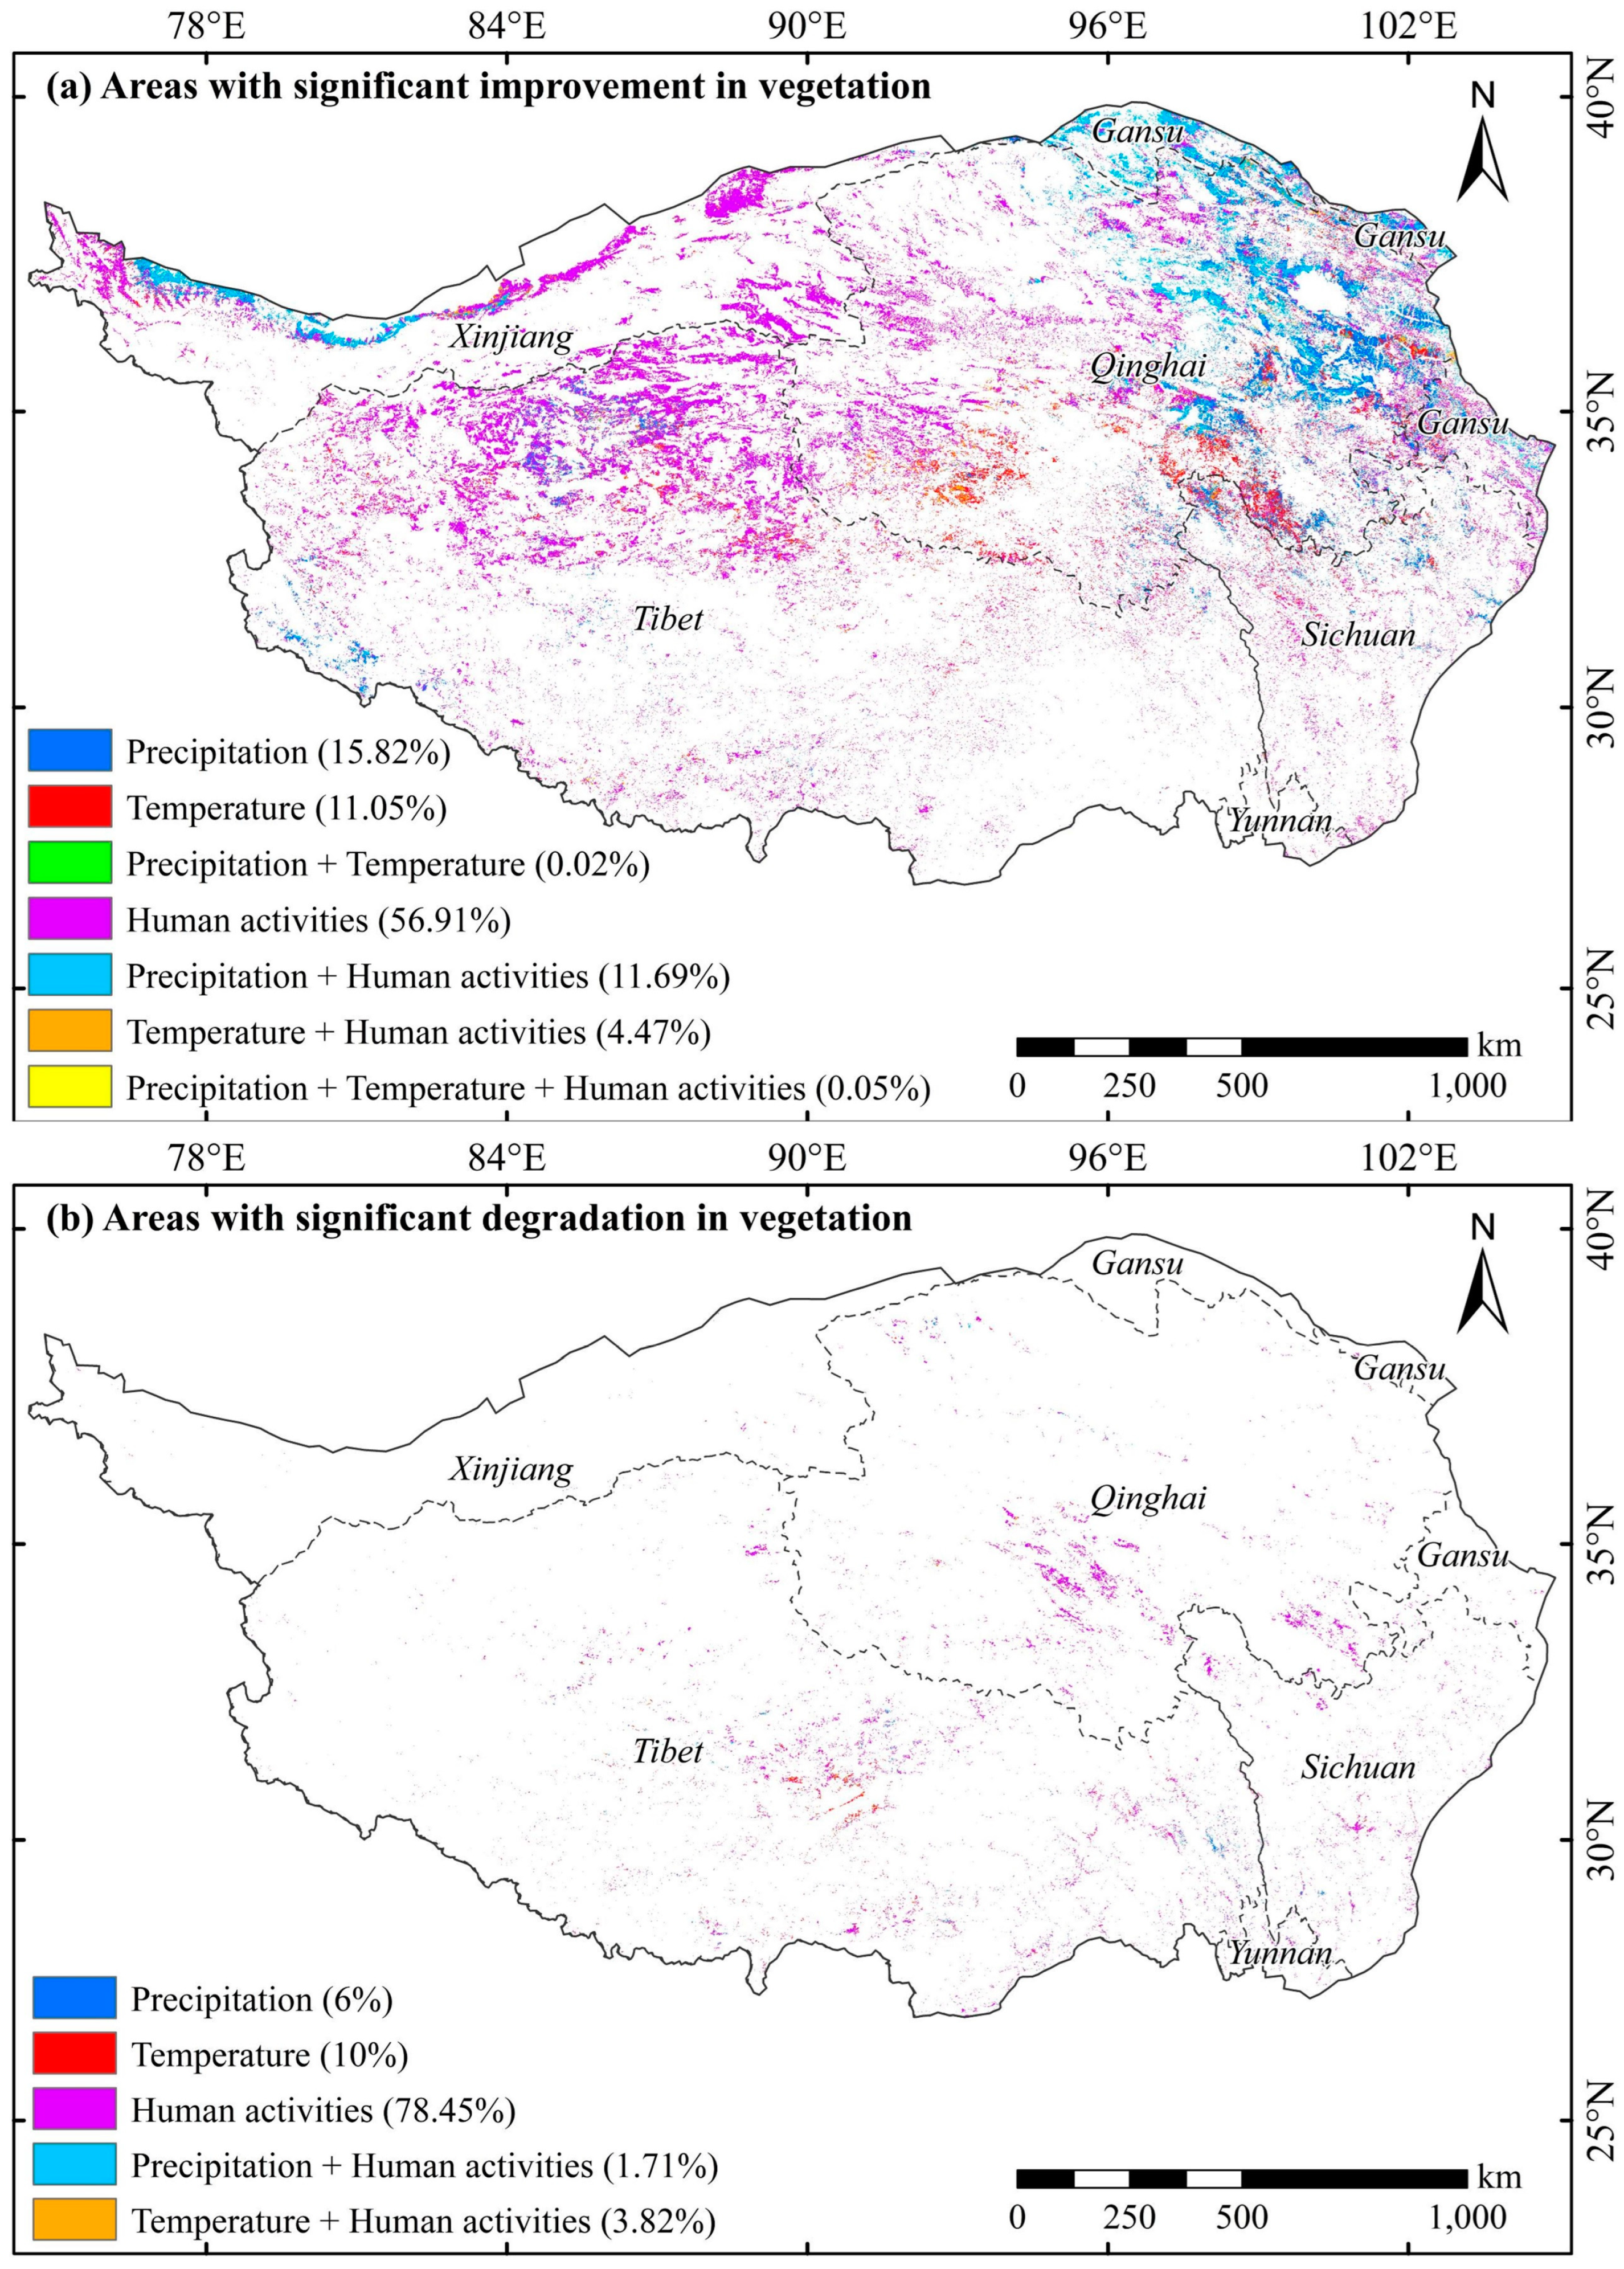
(1) In the QTP, the drivers that dominated the significant improvement of vegetation were identified as precipitation, temperature, precipitation combined with temperature, human activities, precipitation combined with human activities, temperature combined with human activities, and precipitation combined with temperature and human activities. These drivers accounted for approximately 15.82%, 11.05%, 0.02%, 56.01%, 11.69%, 4.47%, and 0.05% of the total area where vegetation improved, respectively (Figure 12a). Human activity-driven vegetation improvement accounted for the largest proportion (approximately 56%), mainly distributed in the northwestern and central-northern parts of the QTP (Figure 12a). Precipitation dominated vegetation improvement in approximately 16% of the area, primarily in the northeastern part of the QTP (Figure 12a). Temperature-driven vegetation improvement accounted for about 11% of the area, primarily in the Sanjiangyuan region (Figure 12a). Vegetation improvement dominated by both precipitation and human activities was observed in approximately 12% of the area, mainly distributed around regions where precipitation dominates (Figure 12a). Similarly, areas where temperature and human activities jointly drive vegetation improvement constituted about 4% of the total area, primarily clustered around temperature-dominated areas (Figure 12a).
(2) Within the QTP, the extent of significant vegetation degradation was relatively limited. The drivers of vegetation degradation were identified as precipitation, temperature, human activities, precipitation combined with human activities, and temperature combined with human activities. These drivers accounted for approximately 6%, 10%, 78%, 2%, and 4% of the total area experiencing vegetation degradation, respectively (Figure 12b). Areas where human activities dominated vegetation degradation constituted four-fifths of the total vegetation degradation across the QTP. These areas were primarily concentrated in the Sanjiangyuan region, central Tibet, and southeastern Tibet region (Figure 12b). The remaining areas experiencing vegetation degradation were predominantly influenced by either precipitation or temperature, accounting for approximately 16% of the total area of vegetation degradation (Figure 12b).

5. Discussion

5.1. Time-Lag Effects of Climate on Vegetation Growth

Global vegetation dynamics research has concluded that vegetation responds instantaneously to temperature changes [23,40]. However, this study found that temperature has a significant lag effect on vegetation in most parts of the QTP. This finding aligns with research by Kong et al. [41] on the Loess Plateau, which noted that grassland exhibits a more pronounced lagged response to temperature compared to other vegetation types. Grassland is the predominant vegetation ecosystem on the QTP (Figure 1). Due to the cold climate, vegetation requires a long period to accumulate heat. This temperature accumulation is crucial for storing the energy needed to support vegetation growth in the cold ecosystem [42]. Furthermore, glaciers and snowpacks are widely distributed across the QTP [43]. The rate of warming on the QTP during winter is much higher than in other seasons [44]. Winter warming can stimulate the melting of snow and glaciers, enabling the soil to store more water for subsequent vegetation growth.
This study also found that precipitation has a significant lag effect on vegetation growth, consistent with conclusions from many global-scale studies. Vegetation growth responds more directly to soil moisture than to precipitation [45]. Soil can store precipitation that remains after being used by vegetation, allowing this water to support vegetation growth later [20]. Additionally, it takes time for deep soil moisture to transfer to the surface and be absorbed by vegetation [46,47]. If there is a severe lack of precipitation early in the season, vegetation requires time to repair drought-damaged root systems and eventually return to its pre-drought growth capacity [48].
For 29% of the vegetation area on the QTP, accounting for time-lag effects significantly improved the capacity of climate variables to explain interannual changes in vegetation. Thus, it can be concluded that quantifying the impacts of various climatic factors and human activities on vegetation, and identifying the main drivers of vegetation change, is likely to be problematic in these areas if time-lag effects are not considered.

5.2. Drivers of Vegetation Change

During 2000–2020, the vegetation GEVI of the QTP exhibited a significant increasing trend overall, indicating continuous greening across the plateau, consistent with the findings of many studies [49,50,51,52]. The overall climate of the QTP has been analyzed and found to show a significant “warming and humidification” trend during the period from 2000 to 2020, which is consistent with the conclusions of many research papers [53,54]. Most vegetation on the QTP exists in arid or frigid ecosystems. Warming and humidification have alleviated temperature stress on vegetation growth in alpine regions and water stress on vegetation growth in arid regions, ultimately contributing to the greening of the vegetation. However, spatial differences in climate variation, human activities, and vegetation response mechanisms have led to significant spatial heterogeneity in the interannual variation of the vegetation GEVI [55,56,57].
There are four main drivers behind the significant “greening” of vegetation on the QTP from 2000 to 2020: precipitation, temperature, human activities, and the combination of precipitation and human activities (Figure 12a). In the Qilian Mountains and the Qinghai Lake watershed in the northeastern part of the QTP, the “greening” of vegetation was primarily driven by precipitation or a combination of precipitation and human activities (Figure 12a). This can be explained as follows: The region is arid and semi-arid (Figure 1), and vegetation growth is limited by water availability. The significant increase in precipitation over the past two decades (Figure S1b) has effectively alleviated water limitations on vegetation growth in the region. Additionally, the implementation of ecological protection projects, such as “Grain for Green” and “Pastureland Rehabilitation”, has further enhanced vegetation growth in some areas. In parts of southern Qinghai Province, the “greening” of vegetation was primarily driven by temperature (Figure 12a). This can be explained as follows: This region is in the plateau subfrigid zone (Figure 1) but is part of the well-watered Sanjiangyuan region. Consequently, vegetation growth is limited by low temperatures. Over the past two decades, there has been a significant increase in temperature in the region (Figure S1a), effectively alleviating this temperature limitation on vegetation growth. This temperature rise has increased vegetation carbon accumulation by promoting the photosynthetic rate and extending the growing season [58]. In the western part of Qinghai Province and the northern part of Tibet, the “greening” of vegetation was primarily driven by human activities (Figure 12a). This can be explained as follows: The region contains the Qiangtang National Nature Reserve and the Sanjiangyuan National Nature Reserve, which serve as crucial ecological security barriers and water conservation areas. To ensure ecological security in the region, a series of ecological restoration and environmental protection projects have been implemented over the past two decades [39]. These projects include “Grain for Green”, “Pastureland Rehabilitation”, “Grassland-livestock balance”, “Artificial grass planting”, and “fertilization”. These measures have effectively restored damaged ecosystems and enhanced vegetation productivity in the region [59].
There are three main drivers behind the significant “browning” of vegetation on the QTP: precipitation, temperature, and human activities (Figure 12b). The “browning” of vegetation in southeastern Tibet was primarily driven by precipitation (Figure 12b). Over the past two decades, this region has experienced significant warming accompanied by a declining trend in precipitation (Figure S1). The relatively low altitude of the region results in relatively high temperatures throughout the year, and the vegetation is predominantly forested (Figure 1), not stressed by low temperatures. Decreased precipitation, alongside warming, can exacerbate drought conditions, inhibiting vegetation growth. Forests depend primarily on deep soil roots to absorb water [60]. Warming reduces water in the topsoil through evapotranspiration, which does not directly affect vegetation growth. Instead, reduced precipitation directly inhibits vegetation growth by reducing deep soil moisture. Vegetation “browning” in central Tibet was primarily driven by temperature (Figure 12b). Similar to southeastern Tibet, this region has experienced significant “warming and drying” (Figure S1), leading to vegetation degradation due to increased drought. However, unlike the forested areas of southeastern Tibet, central Tibet is characterized by typical alpine steppes (Figure 1). Grasslands in this area support their physiological functions primarily by absorbing surface soil water. Significant warming has led to a considerable loss of surface water through evapotranspiration, which has severely inhibited vegetation growth. On the QTP, 78% of the significant vegetation degradation was primarily driven by human activities (Figure 12b). These areas were mainly distributed in the typical pastoral regions, the Sanjiangyuan region, central Tibet, and the densely populated southeastern Tibet. Numerous studies have pointed out that serious vegetation degradation in these areas is due to overgrazing, urbanization, infrastructure construction, and other human activities [32,61,62,63].

5.3. Limitations of the Current Study

Numerous studies have demonstrated that vegetation degradation and improvement, primarily driven by human activities, were widespread on the QTP. However, this study argues that the area of regions where significant change of vegetation was driven by human activities may be overestimated. Accurately distinguishing the impacts of human activities from interannual vegetation change is essential for determining whether human activities truly drive vegetation change. Thus, it is crucial to reveal the influence of climate on vegetation and accurately model the vegetation’s response to climatic factors. To address this, this study investigated the time-lag effects of climate on vegetation growth. However, certain issues were neglected, leading to uncertainty in identifying the driving factors.
(1) In addition to precipitation and temperature, climate factors, such as photosynthetically active radiation, saturated water-vapor pressure difference, CO2 concentration, and extreme climate along with their interactions, also influence the interannual variation of vegetation greenness [59]. However, due to the need to ensure the validity of statistical modeling with a limited sample size, these climate factors were disregarded in this study. Consequently, many regions where vegetation variation could not be well explained by climate were ultimately attributed to human activities.
(2) In addition to its direct impact on vegetation, warming may promote the melting of snow and glaciers, thereby stimulating vegetation growth by indirectly increasing the water available to plants. Warming may induce the thawing of permafrost, which is widely distributed across the QTP. This may lower the water table, subsequently reducing vegetation productivity by indirectly decreasing soil moisture. Overall, in the QTP, climate affects vegetation through a variety of ecological processes. However, these indirect ecological processes were overlooked, leading to the misclassification of pixels as human activity-driven rather than climate-driven.
(3) The response of vegetation to climate is inherently non-linear. Consequently, in many regions, vegetation changes that should be driven by climate were attributed to human activities, as they cannot be explained by linear climate models.
(4) In the QTP, meteorological observation stations are unevenly distributed, with some areas having sparse coverage. As a result, climate products for this region have lower accuracy compared to other regions. This discrepancy contributed to uncertainty in identifying the driving factors.
(5) Even when the influence of climate is thoroughly accounted for, the impact of human activities separate from vegetation change may also stem from unnatural factors such as wildlife, rodents, and pests. Therefore, detecting anthropogenic impacts on the QTP remains a scientific challenge that necessitates in-depth research.

6. Conclusions

This study investigates the time-lag effects of climate on vegetation growth to determine the drivers of vegetation change on the QTP from 2000 to 2020, utilizing a framework derived from the RESTREND. By analyzing the trend of interannual variation in the vegetation GEVI and climate, the study explores the mechanisms driving vegetation change on the QTP. The main conclusions are as follows:
(1) Considering the time-lag effects of climate significantly enhances the explanatory power of climate on the interannual variation of vegetation.
(2) Increased precipitation in water-limited areas, significant warming in temperature-limited areas, and the implementation of ecological restoration and environmental protection projects resulted in 31% of the vegetation on the QTP exhibiting “greening”.
(3) Drought caused by reduced precipitation and warming, unsustainable grassland utilization, and intense human activities resulted in 2% of the vegetation on the QTP exhibiting “browning”. The vast majority of the “browning” was primarily driven by human activities.
(4) For areas with significantly improved vegetation, the area dominated by precipitation was greater than that dominated by temperature. Conversely, for areas with significantly degraded vegetation, the area dominated by temperature was greater than that dominated by precipitation.

Supplementary Materials

The following supporting information can be downloaded at: https://www.mdpi.com/article/10.3390/rs16152839/s1, Figure S1: Spatial distributions of trends in average temperature (a) and cumulative precipitation (b) during the growing season on the Qinghai-Tibet Plateau, from 2000 to 2020.

Author Contributions

C.M.: Conceptualization, Investigation, Writing—Original Draft. S.-B.D.: Investigation, Validation, Writing—Review and Editing. W.Q.: Writing—Review and Editing. F.W.: Writing—Review and Editing. L.H.: Writing—Review and Editing. All authors have read and agreed to the published version of the manuscript.

Funding

This research was funded by the Agricultural Science and Technology Innovation Program (No. GJ2024-20-2).

Data Availability Statement

The data for this study are available within the article or its supplementary material. Data used in this study were derived from the following resources that are available in the public domain: [NASA data system: https://earthdata.nasa.gov/ (accessed on 1 January 2022)] [Data Center for Resources and Environmental Sciences, Chinese Academy of Sciences: https://www.resdc.cn/ (accessed on 1 January 2022)] [National Tibetan Plateau Data Center: https://data.tpdc.ac.cn/ (accessed on 1 January 2022)].

Conflicts of Interest

The authors declare that they have no known competing financial interests or personal relationships that could have appeared to influence the work reported in this paper.

References

  1. Mo, X.G.; Liu, W.; Meng, C.C.; Hu, S.; Liu, S.X.; Lin, Z.H. Variations of forage yield and forage-livestock balance in grasslands over the Tibetan Plateau, China. Chin. J. Appl. Ecol. 2021, 32, 2415–2425. [Google Scholar]
  2. Feng, S.; Tang, M.; Wang, D. New evidence for the Qinghai-Xizang (Tibet) Plateau as a pilot region of climatic fluctuation in China. Chin. Sci. Bull. 1998, 43, 1745–1749. [Google Scholar] [CrossRef]
  3. Liu, X.Y.; Long, R.J. Mechanism and scheme of ecological compensation for alpine rangeland in the northern Tibet. Acta Ecol. Sin. 2013, 33, 3404–3414. [Google Scholar]
  4. Zhang, Q.; Ma, L.; Zhang, Z.H.; Xu, W.H.; Zhou, B.R.; Song, M.H.; Qiao, A.H.; Wang, F.; She, Y.D.; Yang, X.Y.; et al. Ecological restoration of degraded grassland in Qinghai-Tibet alpine region: Degradation status, restoration measures, effects and prospects. Acta Ecol. Sin. 2019, 39, 7441–7451. [Google Scholar]
  5. Liu, B.; Tang, Q.; Zhou, Y.; Zeng, T.; Zhou, T. The Sensitivity of Vegetation Dynamics to Climate Change across the Tibetan Plateau. Atmosphere 2022, 13, 1112. [Google Scholar] [CrossRef]
  6. He, M.; Ju, W.; Zhou, Y.; Chen, J.; He, H.; Wang, S.; Wang, H.; Guan, D.; Yan, J.; Li, Y.; et al. Development of a two-leaf light use efficiency model for improving the calculation of terrestrial gross primary productivity. Agric. For. Meteorol. 2013, 173, 28–39. [Google Scholar] [CrossRef]
  7. Gordon, B.B. Forests and climate change: Forcings, feedbacks, and the climate benefits of forests. Science 2008, 320, 1444–1449. [Google Scholar]
  8. Wang, X.; Piao, S.; Ciais, P.; Li, J.; Friedlingstein, P.; Koven, C.; Chen, A. Spring temperature change and its implication in the change of vegetation growth in North America from 1982 to 2006. Proc. Natl. Acad. Sci. USA 2011, 108, 1240–1245. [Google Scholar] [CrossRef] [PubMed]
  9. He, L.; Wang, J.; Ciais, P.; Ballantyne, A.; Yu, K.; Zhang, W.; Xiao, J.; Ritter, F.; Liu, Z.; Wang, X.; et al. Non-symmetric responses of leaf onset date to natural warming and cooling in northern ecosystems. PNAS Nexus 2023, 2, pgad308. [Google Scholar] [CrossRef]
  10. Zhou, Q.; Luo, Y.; Zhou, X.; Cai, M.; Zhao, C. Response of vegetation to water balance conditions at different time scales across the karst area of southwestern China—A remote sensing approach. Sci. Total Environ. 2018, 645, 460–470. [Google Scholar] [CrossRef]
  11. Piao, S.; Wang, X.; Park, T.; Chen, C.; Lian, X.; He, Y.; Bjerke, J.W.; Chen, A.; Ciais, P.; Tømmervik, H.; et al. Characteristics, drivers and feedbacks of global greening. Nat. Rev. Earth Environ. 2020, 1, 14–27. [Google Scholar] [CrossRef]
  12. Li, Q.; Zhang, C.; Shen, Y.; Jia, W.; Li, J. Quantitative assessment of the relative roles of climate change and human activities in desertification processes on the Qinghai-Tibet Plateau based on net primary productivity. CATENA 2016, 147, 789–796. [Google Scholar] [CrossRef]
  13. Chen, C.; Li, T.; Sivakumar, B.; Sharma, A.; Albertson, J.D.; Zhang, L.; Wang, G. Combined Effects of Warming and Grazing on Rangeland Vegetation on the Qinghai-Tibet Plateau. Front. Environ. Sci. 2021, 9, 797971. [Google Scholar] [CrossRef]
  14. Zhang, X.; Jin, X. Vegetation dynamics and responses to climate change and anthropogenic activities in the Three-River Headwaters Region, China. Ecol. Indic. 2021, 131, 108223. [Google Scholar] [CrossRef]
  15. Han, H.; Yin, Y.; Zhao, Y.; Qin, F. Spatiotemporal Variations in Fractional Vegetation Cover and Their Responses to Climatic Changes on the Qinghai–Tibet Plateau. Remote Sens. 2023, 15, 2662. [Google Scholar] [CrossRef]
  16. Evans, J.; Geerken, R. Discrimination between climate and human-induced dryland degradation. J. Arid Environ. 2004, 57, 535–554. [Google Scholar] [CrossRef]
  17. Zhao, A.; Zhang, A.; Liu, J.; Feng, L.; Zhao, Y. Assessing the effects of drought and “Grain for Green” Program on vegetation dynamics in China’s Loess Plateau from 2000 to 2014. CATENA 2019, 175, 446–455. [Google Scholar] [CrossRef]
  18. Ruan, Z.; Kuang, Y.; He, Y.; Zhen, W.; Ding, S. Detecting Vegetation Change in the Pearl River Delta Region Based on Time Series Segmentation and Residual Trend Analysis (TSS-RESTREND) and MODIS NDVI. Remote Sens. 2020, 12, 4049. [Google Scholar] [CrossRef]
  19. Wang, J.; Xie, Y.; Wang, X.; Guo, K. Driving Factors of Recent Vegetation Changes in Hexi Region, Northwest China Based on a New Classification Framework. Remote Sens. 2020, 12, 1758. [Google Scholar] [CrossRef]
  20. Ma, Y.; Guan, Q.; Sun, Y.; Zhang, J.; Yang, L.; Yang, E.; Li, H.; Du, Q. Three-dimensional dynamic characteristics of vegetation and its response to climatic factors in the Qilian Mountains. CATENA 2022, 208, 105694. [Google Scholar] [CrossRef]
  21. De, J.R.; Schaepman, M.E.; Furrer, R.; De, B.S.; Verburg, P.H. Spatial relationship between climatologies and changes in global vegetation activity. Glob. Change Biol. 2013, 19, 1953–1964. [Google Scholar]
  22. Wen, Y.; Liu, X.; Pei, F.; Li, X.; Du, G. Non-uniform time-lag effects of terrestrial vegetation responses to asymmetric warming. Agric. For. Meteorol. 2018, 252, 130–143. [Google Scholar] [CrossRef]
  23. Ding, Y.; Li, Z.; Peng, S. Global analysis of time-lag and -accumulation effects of climate on vegetation growth. Int. J. Appl. Earth Obs. Geoinf. 2020, 92, 102179. [Google Scholar] [CrossRef]
  24. He, L.; Li, Z.-L.; Wang, X.; Xie, Y.; Ye, J.-S. Lagged precipitation effect on plant productivity is influenced collectively by climate and edaphic factors in drylands. Sci. Total Environ. 2021, 755, 142506. [Google Scholar] [CrossRef]
  25. Ji, Y.; Li, Y.; Yao, N.; Biswas, A.; Zou, Y.; Meng, Q.; Liu, F. The lagged effect and impact of soil moisture drought on terrestrial ecosystem water use efficiency. Ecol. Indic. 2021, 133, 108349. [Google Scholar] [CrossRef]
  26. He, L.; Xie, Y.; Wang, J.; Zhang, J.; Si, M.; Guo, Z.; Ma, C.; Bie, Q.; Li, Z.-L.; Ye, J.-S. Precipitation regimes primarily drive the carbon uptake in the Tibetan Plateau. Ecol. Indic. 2023, 154, 110694. [Google Scholar] [CrossRef]
  27. Duan, H.; Xue, X.; Wang, T.; Kang, W.; Liao, J.; Liu, S. Spatial and Temporal Differences in Alpine Meadow, Alpine Steppe and All Vegetation of the Qinghai-Tibetan Plateau and Their Responses to Climate Change. Remote Sens. 2021, 13, 669. [Google Scholar] [CrossRef]
  28. Li, Y.; Gong, J.; Zhang, Y.; Gao, B. NDVI-Based Greening of Alpine Steppe and Its Relationships with Climatic Change and Grazing Intensity in the Southwestern Tibetan Plateau. Land 2022, 11, 975. [Google Scholar] [CrossRef]
  29. Liang, Y.; Zhang, Z.; Lu, L.; Cui, X.; Qian, J.; Zou, S.; Ma, X. Trend in Satellite-Observed Vegetation Cover and Its Drivers in the Gannan Plateau, Upper Reaches of the Yellow River, from 2000 to 2020. Remote Sens. 2022, 14, 3849. [Google Scholar] [CrossRef]
  30. Guo, J.; Zhai, L.; Sang, H.; Cheng, S.; Li, H. Effects of hydrothermal factors and human activities on the vegetation coverage of the Qinghai-Tibet Plateau. Sci. Rep. 2023, 13, 12488. [Google Scholar] [CrossRef]
  31. Zheng, L.; Qi, Y.; Qin, Z.; Xu, X.; Dong, J. Assessing albedo dynamics and its environmental controls of grasslands over the Tibetan Plateau. Agric. For. Meteorol. 2021, 307, 108479. [Google Scholar] [CrossRef]
  32. Ma, C.; Xie, Y.; Duan, H.; Wang, X.; Bie, Q.; Guo, Z.; He, L.; Qin, W. Spatial quantification method of grassland utilization intensity on the Qinghai-Tibetan Plateau: A case study on the Selinco basin. J. Environ. Manag. 2022, 302, 114073. [Google Scholar] [CrossRef] [PubMed]
  33. Chen, J.; Jönsson, P.; Tamura, M.; Gu, Z.; Matsushita, B.; Eklundh, L. A simple method for reconstructing a high-quality NDVI time-series data set based on the Savitzky–Golay filter. Remote Sens. Environ. 2004, 91, 332–344. [Google Scholar] [CrossRef]
  34. Peng, S.; Ding, Y.; Liu, W.; Li, Z. 1 km monthly temperature and precipitation dataset for China from 1901 to 2017. Earth Syst. Sci. Data 2019, 11, 1931–1946. [Google Scholar] [CrossRef]
  35. Liu, J.; Kuang, W.; Zhang, Z.; Xu, X.; Qin, Y.; Ning, J.; Zhou, W.; Zhang, S.; Li, R.; Yan, C.; et al. Spatiotemporal characteristics, patterns and causes of land use changes in China since the late 1980s. Acta Geogr. Sin. 2014, 69, 3–14. [Google Scholar] [CrossRef]
  36. Piao, S.; Tan, J.; Chen, A.; Fu, Y.H.; Ciais, P.; Liu, Q.; Janssens, I.A.; Vicca, S.; Zeng, Z.; Jeong, S.-J.; et al. Leaf onset in the northern hemisphere triggered by daytime temperature. Nat. Commun. 2015, 6, 6911. [Google Scholar] [CrossRef] [PubMed]
  37. Li, X.; Perry, G.L.W.; Brierley, G.; Gao, J.; Zhang, J.; Yang, Y. Restoration prospects for Heitutan degraded grassland in the Sanjiangyuan. J. Mt. Sci. 2013, 10, 687–698. [Google Scholar] [CrossRef]
  38. Yu, R.; Evans, A.J.; Malleson, N. Quantifying grazing patterns using a new growth function based on MODIS Leaf Area Index. Remote Sens. Environ. 2018, 209, 181–194. [Google Scholar] [CrossRef]
  39. Sun, H.L.; Zheng, D.; Yao, T.D.; Zhang, Y.L. Protection and Construction of the National Ecological Security Shelter Zone on Tibetan Plateau. Acta Geogr. Sin. 2012, 67, 3–12. [Google Scholar]
  40. Wu, D.; Zhao, X.; Liang, S.; Zhou, T.; Huang, K.; Tang, B.; Zhao, W. Time-lag effects of global vegetation responses to climate change. Glob. Change Biol. 2015, 21, 3520–3531. [Google Scholar] [CrossRef]
  41. Kong, D.; Miao, C.; Wu, J.; Zheng, H.; Wu, S. Time lag of vegetation growth on the Loess Plateau in response to climate factors: Estimation, distribution, and influence. Sci. Total Environ. 2020, 744, 140726. [Google Scholar] [CrossRef] [PubMed]
  42. Wan, S.; Xia, J.; Liu, W.; Niu, S. Photosynthetic overcompensation under nocturnal warming enhances grassland carbon sequestration. Ecology 2009, 90, 2700–2710. [Google Scholar] [CrossRef] [PubMed]
  43. Wang, X.; Gong, P.; Zhao, Y.; Xu, Y.; Cheng, X.; Niu, Z.; Luo, Z.; Huang, H.; Sun, F.; Li, X. Water-level changes in China’s large lakes determined from ICESat/GLAS data. Remote Sens. Environ. 2013, 132, 131–144. [Google Scholar] [CrossRef]
  44. Song, M.; Wang, R.; Ljungqvist, F.C.; Wang, X.; Yang, T. Winter vs. summer temperature variations on the southeastern Tibetan Plateau, 1718–2005 CE. Atmos. Res. 2021, 261, 105739. [Google Scholar] [CrossRef]
  45. Paudel, K.P.; Andersen, P. Response of rangeland vegetation to snow cover dynamics in Nepal Trans Himalaya. Clim. Chang. 2013, 117, 149–162. [Google Scholar] [CrossRef]
  46. Vicente-Serrano, S.M.; Camarero, J.J.; Azorin-Molina, C. Diverse responses of forest growth to drought time-scales in the Northern Hemisphere. Glob. Ecol. Biogeogr. 2014, 23, 1019–1030. [Google Scholar] [CrossRef]
  47. Zhang, T.; Yang, S.; Guo, R.; Guo, J. Warming and Nitrogen Addition Alter Photosynthetic Pigments, Sugars and Nutrients in a Temperate Meadow Ecosystem. PLoS ONE 2016, 11, e0155375. [Google Scholar]
  48. Anderegg, W.R.L.; Berry, J.A.; Field, C.B. Linking definitions, mechanisms, and modeling of drought-induced tree death. Trends Plant Sci. 2012, 17, 693–700. [Google Scholar] [CrossRef] [PubMed]
  49. Zhang, Y.; Qi, W.; Zhou, C.; Ding, M.; Liu, L.; Gao, J.; Bai, W.; Wang, Z.; Zheng, D. Spatial and temporal variability in the net primary production of alpine grassland on the Tibetan Plateau since 1982. J. Geogr. Sci. 2014, 24, 269–287. [Google Scholar] [CrossRef]
  50. Li, L.; Zhang, Y.; Liu, L.; Wu, J.; Wang, Z.; Li, S.; Zhang, H.; Zu, J.; Ding, M.; Paudel, B. Spatiotemporal Patterns of Vegetation Greenness Change and Associated Climatic and Anthropogenic Drivers on the Tibetan Plateau during 2000–2015. Remote Sens. 2018, 10, 1525. [Google Scholar] [CrossRef]
  51. Jiang, F.; Deng, M.; Long, Y.; Sun, H. Spatial Pattern and Dynamic Change of Vegetation Greenness From 2001 to 2020 in Tibet, China. Front. Plant Sci. 2022, 13, 892625. [Google Scholar] [CrossRef] [PubMed]
  52. Wu, R.; Hu, G.; Ganjurjav, H.; Gao, Q. Sensitivity of Grassland Coverage to Climate across Environmental Gradients on the Qinghai-Tibet Plateau. Remote Sens. 2023, 15, 3187. [Google Scholar] [CrossRef]
  53. Zhao, L.; Zou, D.; Hu, G.; Du, E.; Pang, Q.; Xiao, Y.; Li, R.; Sheng, Y.; Wu, X.; Sun, Z.; et al. Changing climate and the permafrost environment on the Qinghai–Tibet (Xizang) plateau. Permafr. Periglac. Process. 2020, 31, 396–405. [Google Scholar] [CrossRef]
  54. Zhang, G.; Nan, Z.; Zhao, L.; Liang, Y.; Cheng, G. Qinghai-Tibet Plateau wetting reduces permafrost thermal responses to climate warming. Earth Planet. Sci. Lett. 2021, 562, 116858. [Google Scholar] [CrossRef]
  55. Jing, P.; Wang, D.; Zhu, C.; Chen, J. Plant Physiological, Morphological and Yield-Related Responses to Night Temperature Changes across Different Species and Plant Functional Types. Front. Plant Sci. 2016, 7, 1774. [Google Scholar] [CrossRef]
  56. Cong, N.; Shen, M.; Yang, W.; Yang, Z.; Zhang, G.; Piao, S. Varying responses of vegetation activity to climate changes on the Tibetan Plateau grassland. Int. J. Biometeorol. 2017, 61, 1433–1444. [Google Scholar] [CrossRef] [PubMed]
  57. Wei, D.; Zhao, H.; Zhang, J.; Qi, Y.; Wang, X. Human activities alter response of alpine grasslands on Tibetan Plateau to climate change. J. Environ. Manag. 2020, 262, 110335. [Google Scholar] [CrossRef] [PubMed]
  58. Piao, S.; Fang, J.; Zhou, L.; Tan, K.; Tao, S. Changes in biomass carbon stocks in China’s grasslands between 1982 and 1999. Glob. Biogeochem. Cycles 2007, 21, GB2002. [Google Scholar] [CrossRef]
  59. Ma, C.; Xie, Y.; Duan, S.-B.; Qin, W.; Guo, Z.; Xi, G.; Zhang, X.; Bie, Q.; Duan, H.; He, L. Characterization of spatio-temporal patterns of grassland utilization intensity in the Selinco watershed of the Qinghai-Tibetan Plateau from 2001 to 2019 based on multisource remote sensing and artificial intelligence algorithms. GIScience Remote Sens. 2022, 59, 2217–2246. [Google Scholar] [CrossRef]
  60. Chen, P.; Yan, M.; Li, L.; He, J.; Zhou, S.; Li, Z.; Niu, C.; Bao, C.; Zhi, F.; Ma, F.; et al. The apple DNA-binding one zinc-finger protein MdDof54 promotes drought resistance. Hortic. Res. 2020, 7, 195. [Google Scholar] [CrossRef]
  61. Li, M.; Zhang, X.; Wu, J.; Ding, Q.; Niu, B.; He, Y. Declining human activity intensity on alpine grasslands of the Tibetan Plateau. J. Environ. Manag. 2021, 296, 113198. [Google Scholar] [CrossRef] [PubMed]
  62. Guo, B.; Wang, J.; Mantravadi, V.S.; Zhang, L.; Liu, G. Effect of climate and ecological restoration on vegetation changes in the “Three-River Headwaters” region based on remote sensing technology. Environ. Sci. Pollut. Res. 2022, 29, 16436–16448. [Google Scholar] [CrossRef] [PubMed]
  63. Wei, Y.; Lu, H.; Wang, J.; Wang, X.; Sun, J. Dual Influence of Climate Change and Anthropogenic Activities on the Spatiotemporal Vegetation Dynamics Over the Qinghai-Tibetan Plateau From 1981 to 2015. Earths Future 2022, 10, e2021EF002566. [Google Scholar] [CrossRef]
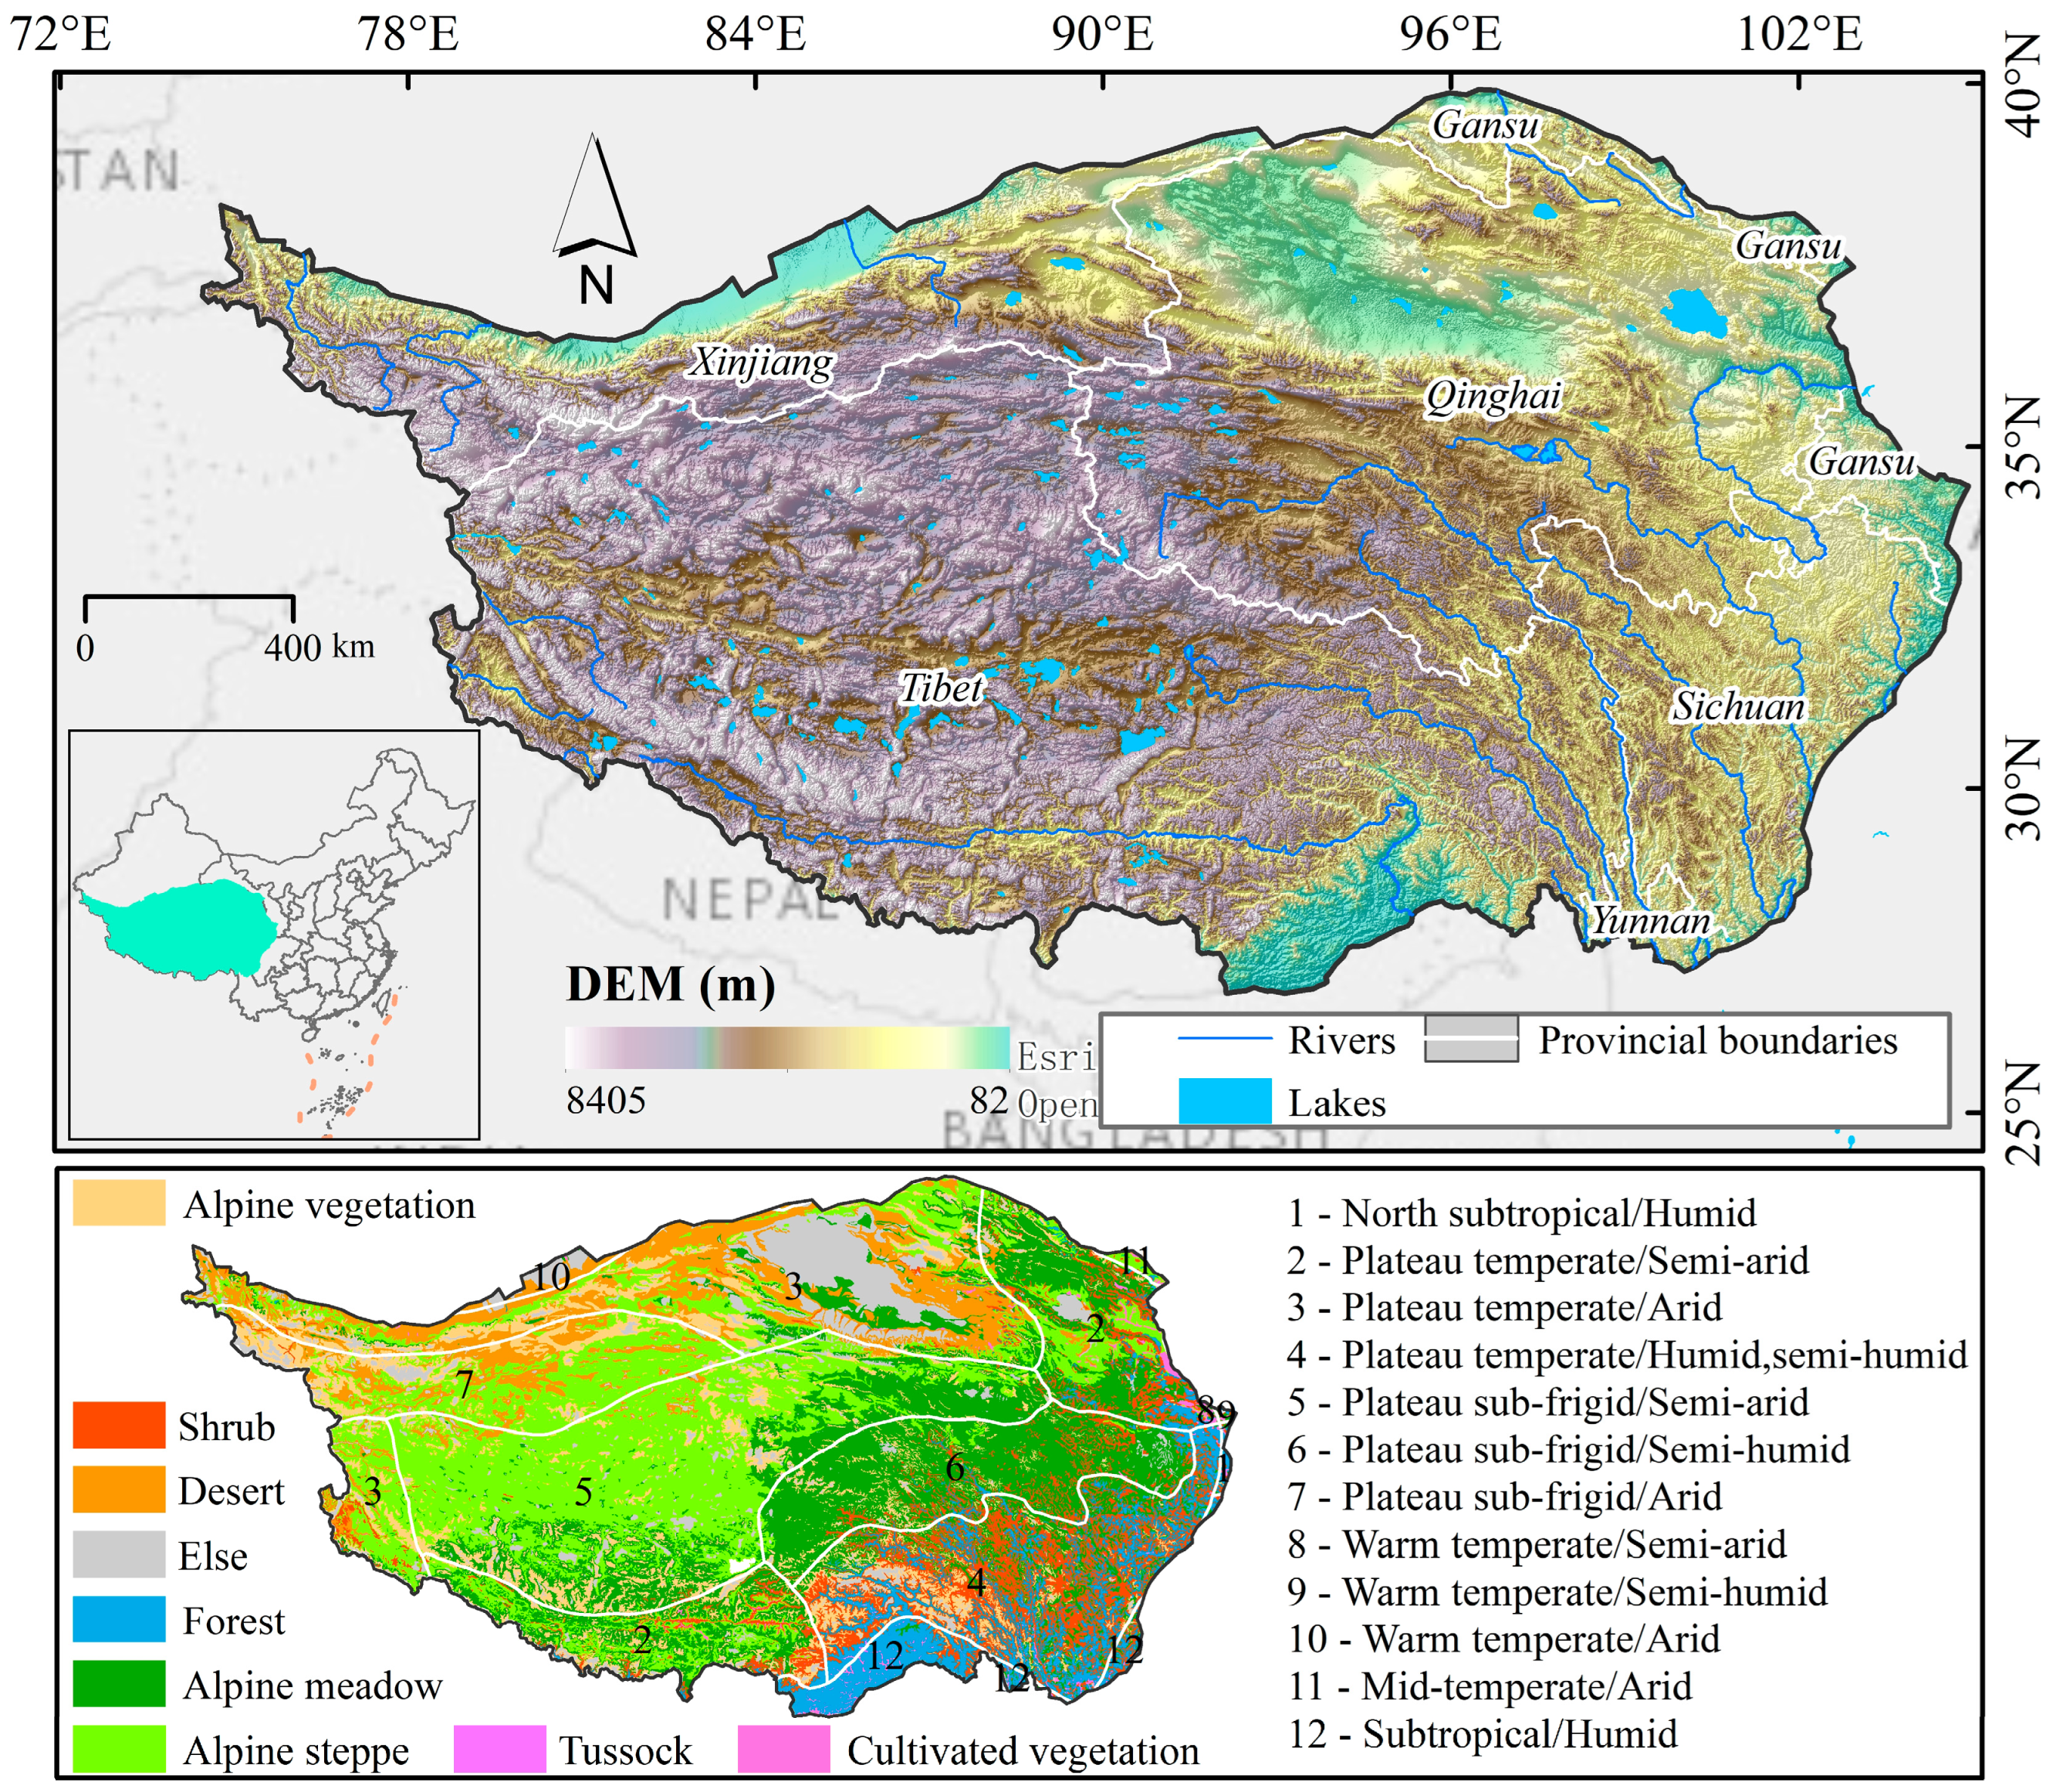
Figure 1. Overview of the study area.
Remotesensing 16 02839 g001
Figure 2. Flow of the driver identification framework (The orange color shows the finalized driver; Pre refers to precipitation; Tem refers to temperature).
Remotesensing 16 02839 g002
Figure 3. Spatial pattern of multi-year average GEVI on the QTP from 2000 to 2020.
Remotesensing 16 02839 g003
Figure 4. Interannual variations of GEVI for different vegetation types (The red line represents the interannual variation in GEVI, while the blue dashed line represents the linear trend of this variation).
Remotesensing 16 02839 g004
Figure 5. Interannual variations of GEVI within different altitude areas (The red line represents the interannual variation in GEVI, while the blue dashed line represents the linear trend of this variation).
Remotesensing 16 02839 g005
Figure 6. Spatial distributions of trends (a) and trend types (b) of vegetation GEVI on the QTP, from 2000 to 2020 (unshaded areas refer to non-vegetated areas).
Remotesensing 16 02839 g006
Figure 7. Spatial distributions of time lag of vegetation response to temperature (a) and precipitation (b) on the QTP (unshaded areas refer to non-vegetated areas).
Remotesensing 16 02839 g007
Figure 8. Correlation between climate and vegetation GEVI in interannual variability after considering the time-lag effects (a), and its improvement compared to the correlation in the scenario without the time-lag effects (b) (unshaded areas refer to non-vegetated areas).
Remotesensing 16 02839 g008
Figure 9. Spatial patterns of GEVI residual trend value and region with significant on the QTP during 2000–2020 (unshaded areas in (a) refer to non-vegetated areas; unshaded areas in (b) refer to non-vegetated and only climate-driven vegetated areas).
Remotesensing 16 02839 g009
Figure 10. Main drivers in regions affected only by climate (unshaded areas refer to non-vegetated areas and areas where vegetation is driven by human activities).
Remotesensing 16 02839 g010
Figure 11. Percentages of climate-driven types statistically by climate zone.
Remotesensing 16 02839 g011
Figure 12. Spatial distributions of drivers that contribute to significant improvement and degradation in vegetation cover (unshaded areas in (a) refer to non-vegetated areas and vegetated areas where the GEVI trend is not significantly increasing; unshaded areas in (b) refer to non-vegetated and only climate-driven vegetated areas).
Remotesensing 16 02839 g012
Table 1. Types of GEVI trend and their percentages relative to the total area of the vegetation zone on the QTP.
GEVI Trend (β)ZTrend CategoryPercentage of Area
β > 02.58 < ZExtremely significant improvement19.17%
β > 01.96 < Z ≤ 2.58Significant improvement11.58%
Z ≤ 1.96Non-significant change66.87%
β < 02.58 < ZExtremely significant degradation0.79%
β < 01.96 < Z ≤ 2.58Significant degradation1.59%
Disclaimer/Publisher’s Note: The statements, opinions and data contained in all publications are solely those of the individual author(s) and contributor(s) and not of MDPI and/or the editor(s). MDPI and/or the editor(s) disclaim responsibility for any injury to people or property resulting from any ideas, methods, instructions or products referred to in the content.